timber measurement manual - coford
TRANSCRIPT

TIMBER MEASUREMENT MANUAL
Standard Procedures for
the Measurement of Round Timber for Sale Purposes in Ireland
This manual is the result of work carried out with the assistance of a grant which is part-funded under an EU assisted scheme & which is paid by
the Forest Service in the Department of the Marine & Natural Resources, Republic of Ireland.
Significant support in kind has also been received from members of the Irish forest industry.
July 1999
i
TIMBER MEASUREMENT MANUAL
Standard Procedures for the Measurement of Round Timber for Sale Purposes in Ireland
ii
Acknowledgements The production of this Timber Measurement Manual was financed by The Forest Service of the Department of the Marine & Natural Resources. Under the same project, the Forest Service also funded a short study on Harvester Head Measurement and a background study on internationally used measurement methods and how they are administered. The work has been overseen by a steering group that was invaluable in providing direction, assistance and encouragement to the project co-ordinator. The steering group was made up of the following representatives from different sectors of the forest industry and to these people special acknowledgements are due for their considerable input into the production of the manual and the background studies that preceded it. There is no question that this simply would not have been possible without their assistance. Gerhardt Gallagher (Chairman) (Forest Service, Department of Marine & Natural Resources) Sean Campbell (Irish Timber Growers Association) Gerry Dolan (Irish Timber Council / Glennon Bros. Timber Ltd.) Donal Fitzpatrick (Irish Forestry Contractors Association) Brendan Friel (Irish Timber Council / Balcas) Eugene Hendrick (Council for Forest Research & Development) Jim Hurley (Irish Timber Council / Woodfab Timber Ltd.) Ted Lynch (Coillte) Gerard Murphy (Coillte) Liam Quinn (Coillte) Fionán Russell (Purser Tarleton Russell Ltd.) In no particular order the following people can take much credit for this manual and deserve special thanks:
Mark Tarleton and Fionán Russell, colleagues in Purser Tarleton Russell Ltd. who have read every draft, checked every table and offered endless useful advice. Conor Upton, who designed the cover and created the “timber measurement man” who appears throughout the manual. Simon Wilson of Trinity College Dublin, Statistics Department, who provided statistical advice whenever required.
Much correspondence has taken place with many timber measurement people around the globe and they all have influenced either the content or format of this manual – the list of names would be too long to reproduce here but they are all due special thanks. There are many others, not specifically named above, who at different stages influenced this manual. To them, deep gratitude is extended. Finally the involvement and part funding provided by COFORD, the Council for Forest Research and Development, for the publication of this manual is greatly acknowledged. Patrick Purser M.Agr.Sc. (Forestry) Purser Tarleton Russell Ltd. October 1999
iii
Table of Contents
Chapter 1: Introduction 1 1.1 Purpose of Manual 1 1.2 Measurement Personnel 1 1.3 Equipment Checks 1 1.4 Measurement Conventions 2 1.4.1 Diameter at Breast Height (DBH) 2 1.4.1.1 Callipers and Converted Diameter Tapes 3 1.4.2 Tree Height 4 1.4.2.1 Total Height 4 1.4.2.2 Timber Height 4 1.4.3 Log Diameter 5 1.4.4 Log Length 6 1.4.5 Log Volume 7 1.4.6 Weight of Truckloads 7 1.5 Stratification Principles 8 1.6 Sampling Principles 8 1.6.1 Random Sampling 8 1.6.2 Systematic Sampling 8 1.7 Selecting a Measurement Method 9 1.7.1 Available Resources 9 1.7.2 Value of Timber 9 1.7.3 Potential Cost of Measurement Method 9 1.7.4 Ownership of Timber 9 1.7.5 Quantity and Variability of Sale 9 1.7.6 Potential Precision of Measurement Method 9 1.7.7 Sale Type 9 1.7.8 Other 9
Chapter 2: Tariff Measurement 10 2.1 General Description 10 2.2 Advantages 10 2.3 Disadvantages 10 2.4 Normal Use 11 2.5 Procedure 11 2.5.1 Measurement Equipment Required 11 2.5.2 Key Points 12 2.5.2.1 Stratification 12 2.5.2.2 Selection of a Sampling Intensity 12 2.5.2.3 Adherence to Rounding Conventions 12 2.5.2.4 Measurement Checks 13 2.5.3 Procedure for Statistical Analysis of Result 13 Field Sheets 14
Chapter 3: Abbreviated Tariff Measurement 17 3.1 General Description 17 3.2 Advantages 17 3.3 Disadvantages 17 3.4 Normal Use 18 3.5 Procedure 18 3.5.1 Measurement Equipment Required 18 3.5.2 Stratification 18 3.5.3 Prescription of a Sampling Fraction 18 3.5.4 Stem Enumeration, Girth Sample Collection & Height Sample Marking 18 3.5.5 Calculations 19 3.5.6 Checks & Analysis 20 Field Sheets 22
iv
Chapter 4: Volume / Weight Measurement 24 4.1 General Description 24 4.2 Advantages 24 4.3 Disadvantages 24 4.4 Normal Use 24 4.5 Procedure 25 4.5.1 Measurement Equipment Required 25 4.5.2 Pre-Harvest Information Required 25 4.5.2.1 Administrative Details 25 4.5.2.2 Provisional Volume Estimates per Sampling Stratum 25 4.5.3 Prescription of a Sampling Fraction and Strata 25 4.5.4 Implementation of a Sampling Regime 26 4.5.5 Measurement of Selected Samples 27 4.5.5.1 Weight Measurement 27 4.5.5.2 Volume Measurement 27 4.5.5.3 Calculation of Sample Volume / Weight Factors 27 4.5.6 Compilation of Sampling Data and Measurement Result 28 Field Sheets 28
Chapter 5: Stack Measurement 31 5.1 General Description 31 5.1.1 Log Quality 31 5.1.2 Stacking Quality 31 5.2 Advantages 31 5.3 Disadvantages 31 5.4 Normal Use 31 5.5 Procedure 32 5.5.1 Measurement Equipment Required 32 5.5.2 Measurement of Stack (Gross) Volume 32 5.5.2.1 Stack Length 32 5.5.2.2 Stack Width 33 5.5.2.3 Average Stack Height 33 5.5.3 Measurement of Conversion Factor 33 5.5.4 Calculation of Net Stack Volume (Timber Volume) 34 Field Sheet 35
Chapter 6: Log Measurement 36 6.1 General Description 36 6.2 Advantages 36 6.3 Disadvantages 36 6.4 Normal Use 36 6.5 Procedure 36 6.5.1 Measurement Equipment Required 36 6.5.2 Stratification 37 6.5.3 Prescription of a Sampling Fraction 37 6.5.4 Measurement of Selected Samples 37 6.5.5 Calculation of Volume 38 6.5.6 Compilation of Sampling Data and Presentation of Measurement Result 38 Field Sheet 39
Chapter 7: Oven Dry Bark Free Tonne Measurement 40 7.1 General Description 40 7.2 Advantages 40 7.3 Disadvantages 40 7.4 Normal Use 40 7.5 Procedure 40 7.5.1 Measurement Equipment Required 40
v
7.5.2 Stratification 41 7.5.3 Measurement of Green Tonnage 41 7.5.4 Selecting a Sample Load 41 7.5.5 Sampling Procedure 41 7.5.6 Analysis of Moisture Content 42 7.5.7 Conversion of Green Tonne to Oven Dry Bark Free Tonne 43 Field Sheet 44
Chapter 8: Weight Measurement 45 8.1 General Description 45 8.2 Advantages 45 8.3 Disadvantages 45 8.4 Normal Use 45 8.5 Procedure 45 8.5.1 Measurement Equipment Required 45 8.5.2 Stratification 46 8.5.3 Measurement of Loads 46 8.5.4 Calculation of Total Weight 46 Field Sheet 47
Chapter 9: Volume/Weight Measurement With Reduced Stratification (VWRS Measurement) 48 9.1 General Description 48 9.2 Advantages 48 9.3 Disadvantages 48 9.4 Normal Use 48 9.5 Procedure 48 9.5.1 Measurement Equipment Required 48 9.5.2 Stratification 49 9.5.3 Measurement of Tonnage 49 9.5.4 Selecting a Sample Load 49 9.5.5 Sample Measurement 49 9.5.6 Calculation of Total Volume 50 Field Sheets 51
Glossary 53 Literature References 54
Appendices 56
Appendix 1 Pre-Harvest Measurement 57
Appendix 2 Tariff Measurement Field Sheets 59
Appendix 3 Abbreviated Tariff Measurement Field Sheets 62
Appendix 4 Volume / Weight Measurement Field Sheets 64
Appendix 5 Stack Measurement Field Sheets 67
Appendix 6 Log Measurement Field Sheet 68
Appendix 7 Oven Dry Bark Free Tonne Measurement Field Sheets 69
Appendix 8 Weight Measurement Field Sheet 70
Appendix 9 Volume/Weight Measurement with Reduced Stratification Field Sheets 71
Appendix 10 Guide To The Selection of A Measurement Option 73
Timber Measurement Manual
Page 1
CHAPTER 1: Introduction 1.1 Purpose of Manual This manual has been prepared following a two year study (1997-1999) funded by the Forest Service of the Department of the Marine and Natural Resources and with industry-wide support over that period. The purpose of the manual is to provide the Irish forest industry with standard procedures for selected timber measurement methods. These procedures should be used industry-wide for the quantification of timber for sale or timber sold. It is intended that this manual should become accepted by the National Standards Authority of Ireland (NSAI) as a national standard.
Much of the information contained in the manual has been available through various sources heretofore. This manual attempts to put all of this information together in one complete document for use by the Irish forest industry.
Although technical in its background, the manual has been designed as a procedural field book for frequent use. While addressing, in broad terms, the technical and statistical concepts that underpin each measurement method, it does not attempt to explain the more formal technical and statistical details that are their foundation. However, for those who wish to understand any particular measurement method in greater detail, further useful references are provided.
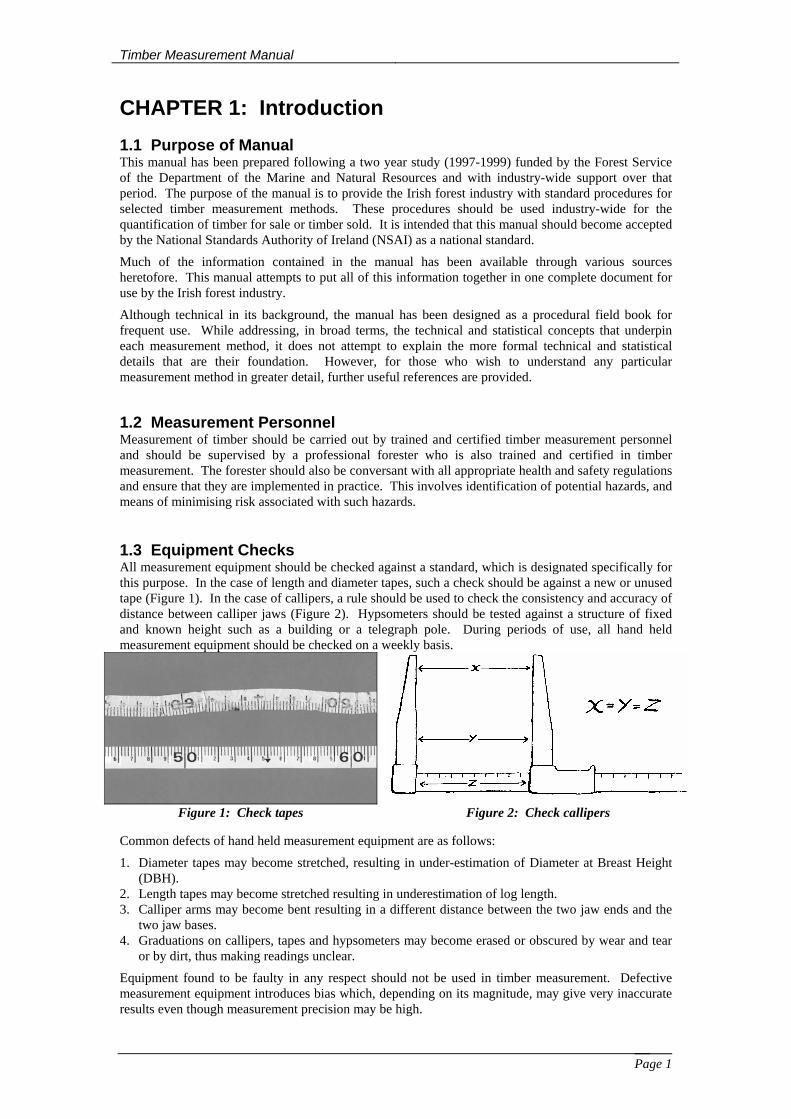
1.2 Measurement Personnel Measurement of timber should be carried out by trained and certified timber measurement personnel and should be supervised by a professional forester who is also trained and certified in timber measurement. The forester should also be conversant with all appropriate health and safety regulations and ensure that they are implemented in practice. This involves identification of potential hazards, and means of minimising risk associated with such hazards. 1.3 Equipment Checks All measurement equipment should be checked against a standard, which is designated specifically for this purpose. In the case of length and diameter tapes, such a check should be against a new or unused tape (Figure 1). In the case of callipers, a rule should be used to check the consistency and accuracy of distance between calliper jaws (Figure 2). Hypsometers should be tested against a structure of fixed and known height such as a building or a telegraph pole. During periods of use, all hand held measurement equipment should be checked on a weekly basis.
Figure 1: Check tapes Figure 2: Check callipers
Common defects of hand held measurement equipment are as follows:
1. Diameter tapes may become stretched, resulting in under-estimation of Diameter at Breast Height (DBH).
2. Length tapes may become stretched resulting in underestimation of log length. 3. Calliper arms may become bent resulting in a different distance between the two jaw ends and the
two jaw bases. 4. Graduations on callipers, tapes and hypsometers may become erased or obscured by wear and tear
or by dirt, thus making readings unclear.
Equipment found to be faulty in any respect should not be used in timber measurement. Defective measurement equipment introduces bias which, depending on its magnitude, may give very inaccurate results even though measurement precision may be high.
Timber Measurement Manual
Page 2
1.4 Measurement Conventions Timber measurement, whether it is carried out while the timber is standing in the wood, at forest roadside or at the processing facility, generally involves the quantification of large amounts of timber, a bulky and irregular commodity. This can therefore be both difficult and impractical without the use of some form of sampling and subsequent estimation of the total quantity. Estimates may be computed in a number of ways and their accuracy is dependent on appropriate stratification and sampling intensity. The precision of such estimates is greatly influenced by the combination of conventions and procedures used in the measurement of samples. Standard conventions and procedures for use by the Irish forest industry are presented.
The development of this Irish standard, which addresses both timber measurement conventions and methods, is meant as a positive step towards the aspiration of a wider, European standard. The adoption of these standards may also facilitate the objective comparison of cost efficiencies between measurement methods. In addition to this, the use of national standards, which are agreed and updated, will help to portray a professional image of timber measurement and marketing and of the forest industry as a whole.
All measurement work carried out for sale purposes should be clearly presented and identifiable on the ground.
All measurement procedures described in this manual refer to over-bark measurement i.e. it is assumed that deliberate removal of bark from round logs is carried out after the completion of round timber measurement.
The following is a description of common measurement parameters:
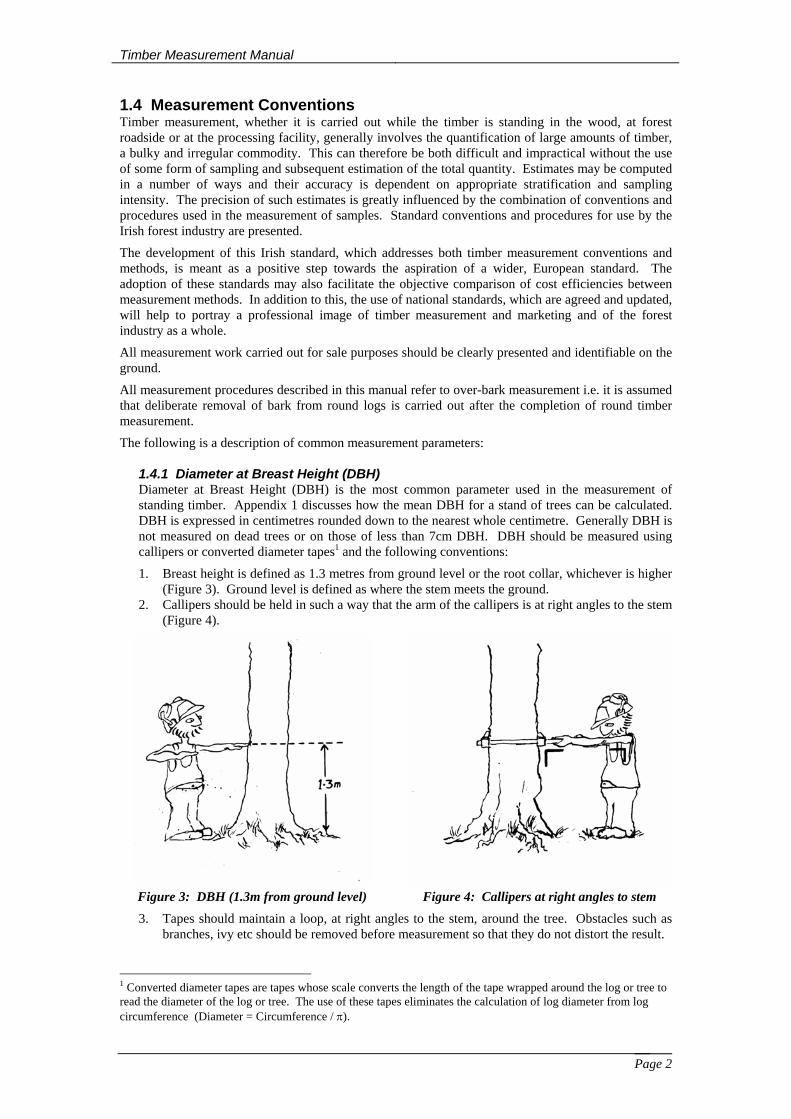
1.4.1 Diameter at Breast Height (DBH) Diameter at Breast Height (DBH) is the most common parameter used in the measurement of standing timber. Appendix 1 discusses how the mean DBH for a stand of trees can be calculated. DBH is expressed in centimetres rounded down to the nearest whole centimetre. Generally DBH is not measured on dead trees or on those of less than 7cm DBH. DBH should be measured using callipers or converted diameter tapes1 and the following conventions:
1. Breast height is defined as 1.3 metres from ground level or the root collar, whichever is higher (Figure 3). Ground level is defined as where the stem meets the ground.
2. Callipers should be held in such a way that the arm of the callipers is at right angles to the stem (Figure 4).
Figure 3: DBH (1.3m from ground level) Figure 4: Callipers at right angles to stem
3. Tapes should maintain a loop, at right angles to the stem, around the tree. Obstacles such as branches, ivy etc should be removed before measurement so that they do not distort the result.
1 Converted diameter tapes are tapes whose scale converts the length of the tape wrapped around the log or tree to read the diameter of the log or tree. The use of these tapes eliminates the calculation of log diameter from log circumference (Diameter = Circumference / π).
Timber Measurement Manual
Page 3
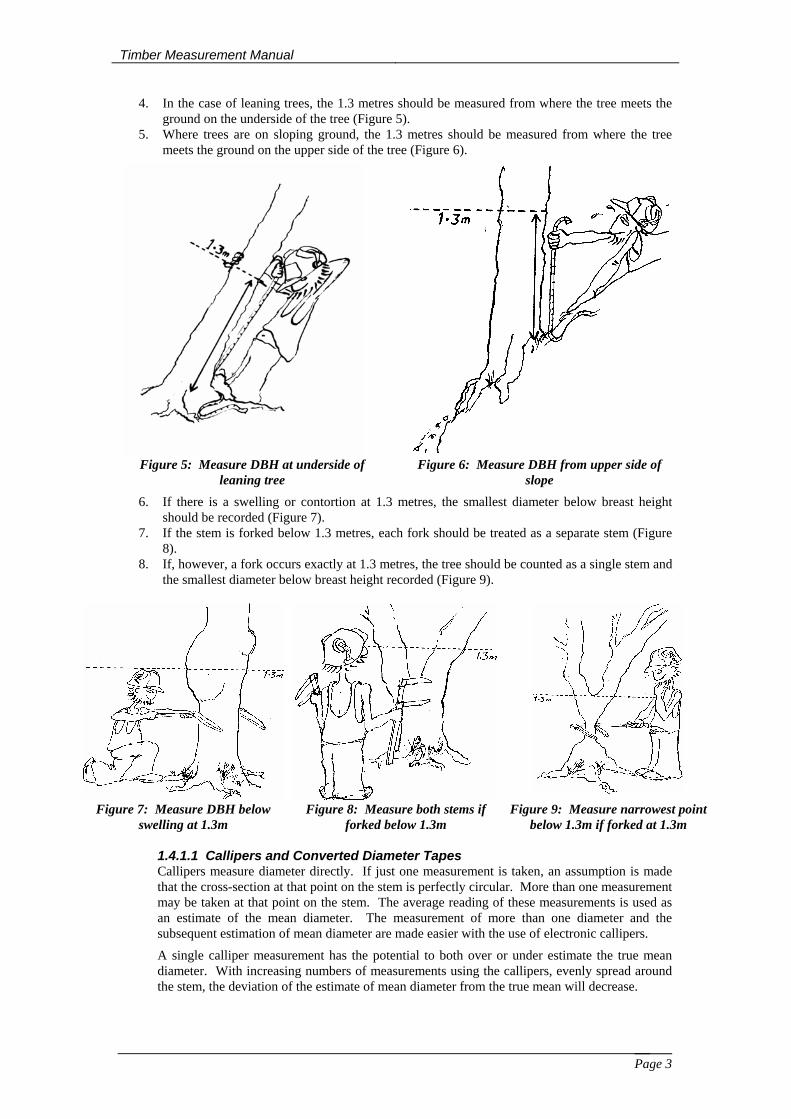
4. In the case of leaning trees, the 1.3 metres should be measured from where the tree meets the ground on the underside of the tree (Figure 5).
5. Where trees are on sloping ground, the 1.3 metres should be measured from where the tree meets the ground on the upper side of the tree (Figure 6).
Figure 5: Measure DBH at underside of leaning tree
Figure 6: Measure DBH from upper side of slope
6. If there is a swelling or contortion at 1.3 metres, the smallest diameter below breast height should be recorded (Figure 7).
7. If the stem is forked below 1.3 metres, each fork should be treated as a separate stem (Figure 8).
8. If, however, a fork occurs exactly at 1.3 metres, the tree should be counted as a single stem and the smallest diameter below breast height recorded (Figure 9).
Figure 7: Measure DBH below
swelling at 1.3m Figure 8: Measure both stems if
forked below 1.3m Figure 9: Measure narrowest point
below 1.3m if forked at 1.3m
1.4.1.1 Callipers and Converted Diameter Tapes Callipers measure diameter directly. If just one measurement is taken, an assumption is made that the cross-section at that point on the stem is perfectly circular. More than one measurement may be taken at that point on the stem. The average reading of these measurements is used as an estimate of the mean diameter. The measurement of more than one diameter and the subsequent estimation of mean diameter are made easier with the use of electronic callipers.
A single calliper measurement has the potential to both over or under estimate the true mean diameter. With increasing numbers of measurements using the callipers, evenly spread around the stem, the deviation of the estimate of mean diameter from the true mean will decrease.
Timber Measurement Manual
Page 4
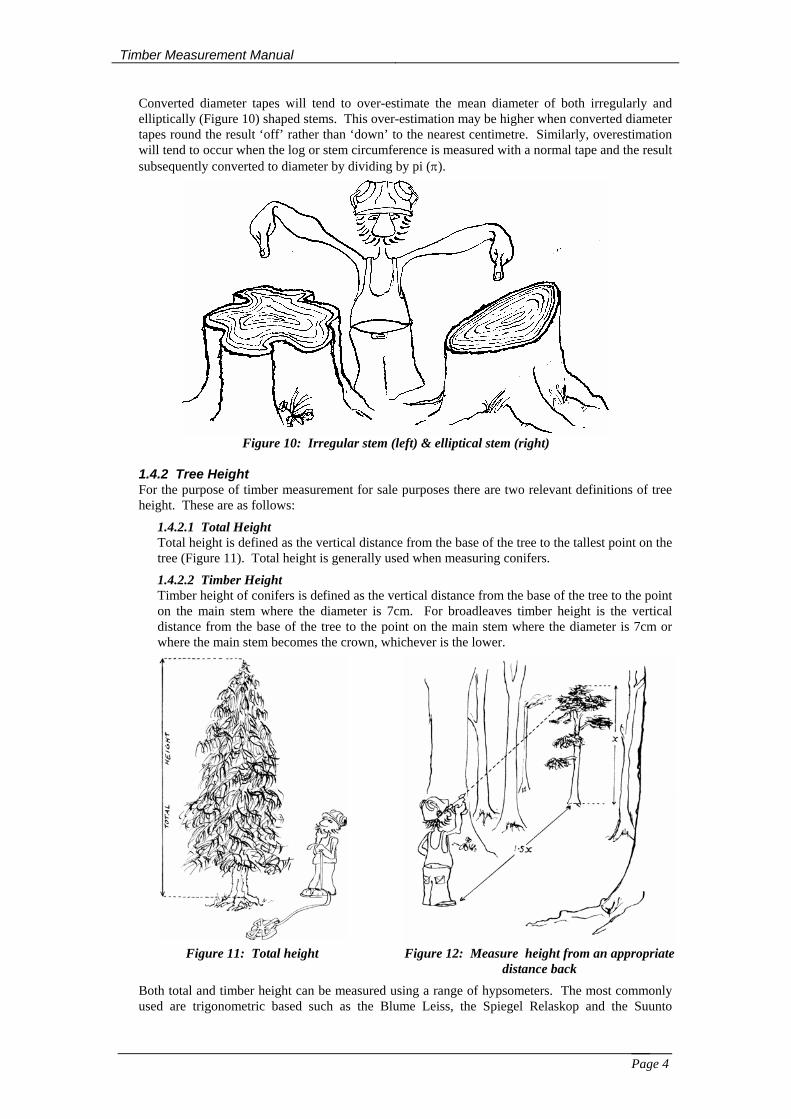
Converted diameter tapes will tend to over-estimate the mean diameter of both irregularly and elliptically (Figure 10) shaped stems. This over-estimation may be higher when converted diameter tapes round the result ‘off’ rather than ‘down’ to the nearest centimetre. Similarly, overestimation will tend to occur when the log or stem circumference is measured with a normal tape and the result subsequently converted to diameter by dividing by pi (π).
Figure 10: Irregular stem (left) & elliptical stem (right)
1.4.2 Tree Height For the purpose of timber measurement for sale purposes there are two relevant definitions of tree height. These are as follows:
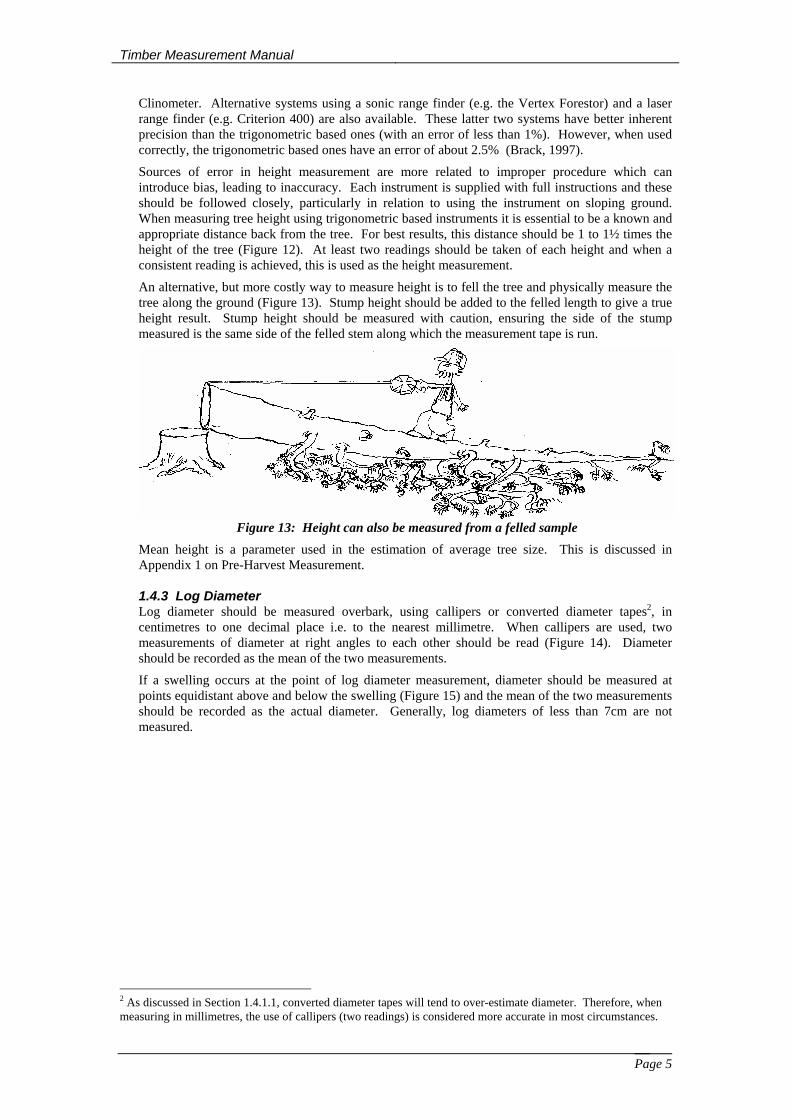
1.4.2.1 Total Height Total height is defined as the vertical distance from the base of the tree to the tallest point on the tree (Figure 11). Total height is generally used when measuring conifers.
1.4.2.2 Timber Height Timber height of conifers is defined as the vertical distance from the base of the tree to the point on the main stem where the diameter is 7cm. For broadleaves timber height is the vertical distance from the base of the tree to the point on the main stem where the diameter is 7cm or where the main stem becomes the crown, whichever is the lower.
Figure 11: Total height Figure 12: Measure height from an appropriate
distance back
Both total and timber height can be measured using a range of hypsometers. The most commonly used are trigonometric based such as the Blume Leiss, the Spiegel Relaskop and the Suunto
Timber Measurement Manual
Page 5
Clinometer. Alternative systems using a sonic range finder (e.g. the Vertex Forestor) and a laser range finder (e.g. Criterion 400) are also available. These latter two systems have better inherent precision than the trigonometric based ones (with an error of less than 1%). However, when used correctly, the trigonometric based ones have an error of about 2.5% (Brack, 1997).
Sources of error in height measurement are more related to improper procedure which can introduce bias, leading to inaccuracy. Each instrument is supplied with full instructions and these should be followed closely, particularly in relation to using the instrument on sloping ground. When measuring tree height using trigonometric based instruments it is essential to be a known and appropriate distance back from the tree. For best results, this distance should be 1 to 1½ times the height of the tree (Figure 12). At least two readings should be taken of each height and when a consistent reading is achieved, this is used as the height measurement.
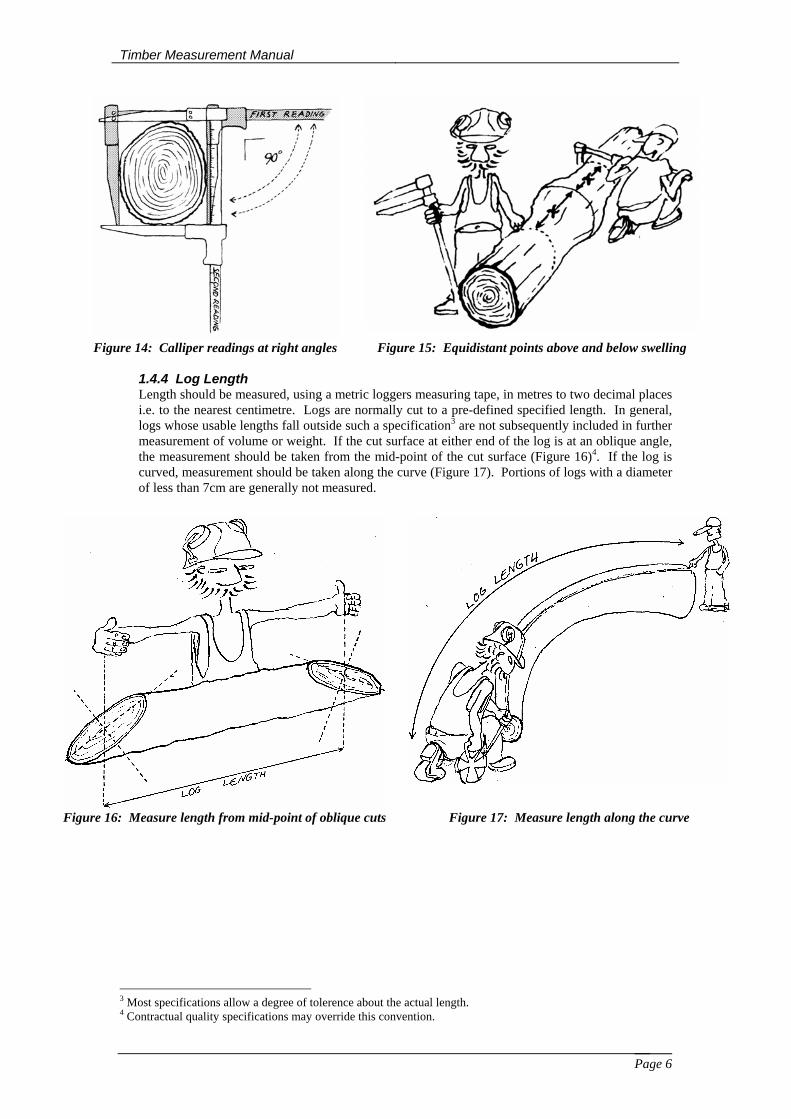
An alternative, but more costly way to measure height is to fell the tree and physically measure the tree along the ground (Figure 13). Stump height should be added to the felled length to give a true height result. Stump height should be measured with caution, ensuring the side of the stump measured is the same side of the felled stem along which the measurement tape is run.
Figure 13: Height can also be measured from a felled sample
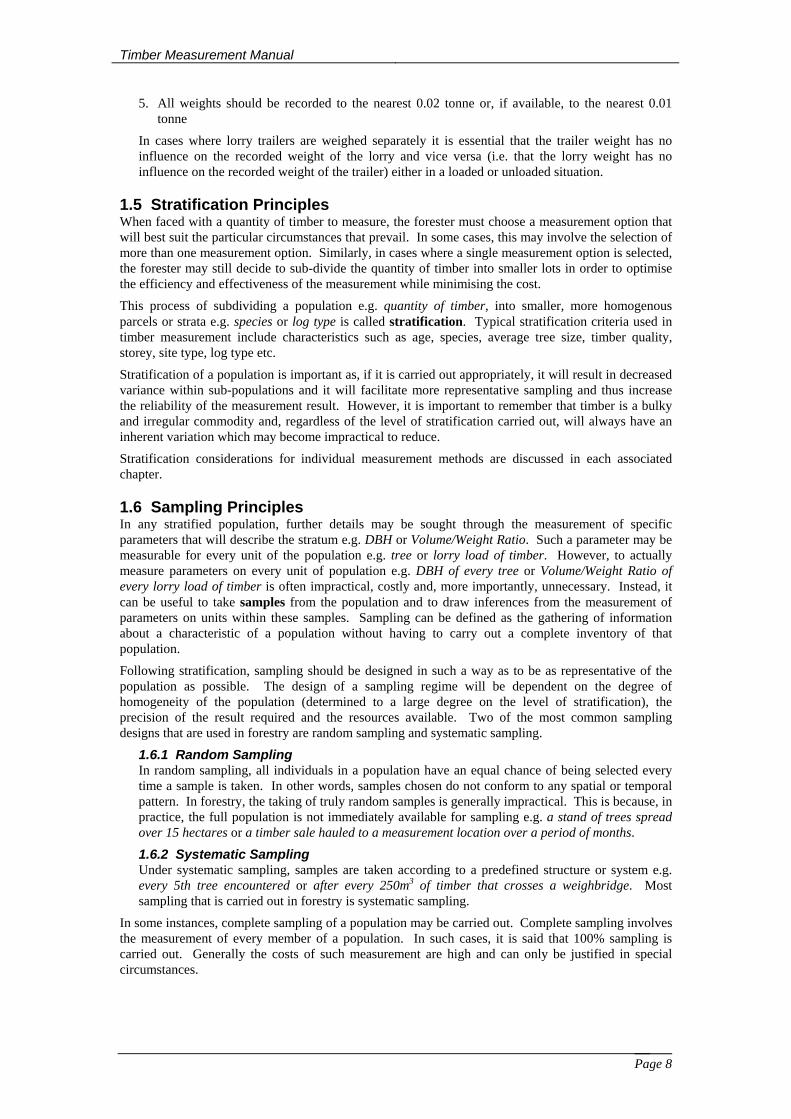
Mean height is a parameter used in the estimation of average tree size. This is discussed in Appendix 1 on Pre-Harvest Measurement. 1.4.3 Log Diameter Log diameter should be measured overbark, using callipers or converted diameter tapes2, in centimetres to one decimal place i.e. to the nearest millimetre. When callipers are used, two measurements of diameter at right angles to each other should be read (Figure 14). Diameter should be recorded as the mean of the two measurements.
If a swelling occurs at the point of log diameter measurement, diameter should be measured at points equidistant above and below the swelling (Figure 15) and the mean of the two measurements should be recorded as the actual diameter. Generally, log diameters of less than 7cm are not measured.
2 As discussed in Section 1.4.1.1, converted diameter tapes will tend to over-estimate diameter. Therefore, when measuring in millimetres, the use of callipers (two readings) is considered more accurate in most circumstances.
Timber Measurement Manual
Page 6
Figure 14: Calliper readings at right angles Figure 15: Equidistant points above and below swelling
1.4.4 Log Length Length should be measured, using a metric loggers measuring tape, in metres to two decimal places i.e. to the nearest centimetre. Logs are normally cut to a pre-defined specified length. In general, logs whose usable lengths fall outside such a specification3 are not subsequently included in further measurement of volume or weight. If the cut surface at either end of the log is at an oblique angle, the measurement should be taken from the mid-point of the cut surface (Figure 16)4. If the log is curved, measurement should be taken along the curve (Figure 17). Portions of logs with a diameter of less than 7cm are generally not measured.
Figure 16: Measure length from mid-point of oblique cuts Figure 17: Measure length along the curve
3 Most specifications allow a degree of tolerence about the actual length. 4 Contractual quality specifications may override this convention.

Timber Measurement Manual
Page 7
1.4.5 Log Volume Log volume is not measured directly but is calculated using log mid-diameter (Section 1.4.3 of this chapter) and log length (Section 1.4.4 of this chapter), using Huber’s formula:
Vd
Lm= ×π . 2
40000
where:
V = volume in cubic metres π = 3.1416 dm = mid-diameter (diameter of a log at exactly half its length) in centimetres L = length in metres
Log volume is measured overbark and is expressed in cubic metres to three decimal places.
In the case of logs whose length is greater than 20 metres, for example line poles, the full log should be notionally divided into two logs and the volume of each added to give the full log volume. The length of the first of these two logs measured (the butt length) should be half the length of the full log, rounded down to the nearest whole metre. The length of the second log measured (the top length) should be the length of the full log minus the length of the first log.
e.g. a 23 metre log should be measured as follows (Figure 18): 1. Calculate the volume of the butt section which is 11 metres in length and whose mid-
diameter falls at 5.5 metres along the length. 2. Calculate the volume of the second section which is 12 metres in length and whose mid-
diameter falls at 17 metres along the length. 3. Add the volumes of both sections to give the total log volume.
Figure 18: Measurement of logs longer than 20m
1.4.6 Weight of Truckloads Weighbridges used in the weighing of truckloads of timber should have a current calibration certificate issued by the National Legal Metrology Service and must have a facility to generate a printed weight docket.
Best practice at weighbridges is that: • The weight of the empty weighbridge platform should be zeroed at least four times a day • The weighbridge platform and pit should be kept clean and free of water • Trucks should be stationary while being weighed • Truck drivers and any passengers should be outside the cab and off the weighbridge platform
when all weights are recorded
The following procedure should be followed in the weighing of truckloads of timber: 1. The loaded lorry is weighed (Gross Weight) 2. All timber on the lorry is unloaded 3. The empty lorry is weighed (Tare Weight) 4. The net weight of timber is calculated by subtracting the tare weight from the gross weight
Timber Measurement Manual
Page 8
5. All weights should be recorded to the nearest 0.02 tonne or, if available, to the nearest 0.01 tonne
In cases where lorry trailers are weighed separately it is essential that the trailer weight has no influence on the recorded weight of the lorry and vice versa (i.e. that the lorry weight has no influence on the recorded weight of the trailer) either in a loaded or unloaded situation.
1.5 Stratification Principles When faced with a quantity of timber to measure, the forester must choose a measurement option that will best suit the particular circumstances that prevail. In some cases, this may involve the selection of more than one measurement option. Similarly, in cases where a single measurement option is selected, the forester may still decide to sub-divide the quantity of timber into smaller lots in order to optimise the efficiency and effectiveness of the measurement while minimising the cost.
This process of subdividing a population e.g. quantity of timber, into smaller, more homogenous parcels or strata e.g. species or log type is called stratification. Typical stratification criteria used in timber measurement include characteristics such as age, species, average tree size, timber quality, storey, site type, log type etc.
Stratification of a population is important as, if it is carried out appropriately, it will result in decreased variance within sub-populations and it will facilitate more representative sampling and thus increase the reliability of the measurement result. However, it is important to remember that timber is a bulky and irregular commodity and, regardless of the level of stratification carried out, will always have an inherent variation which may become impractical to reduce.
Stratification considerations for individual measurement methods are discussed in each associated chapter. 1.6 Sampling Principles In any stratified population, further details may be sought through the measurement of specific parameters that will describe the stratum e.g. DBH or Volume/Weight Ratio. Such a parameter may be measurable for every unit of the population e.g. tree or lorry load of timber. However, to actually measure parameters on every unit of population e.g. DBH of every tree or Volume/Weight Ratio of every lorry load of timber is often impractical, costly and, more importantly, unnecessary. Instead, it can be useful to take samples from the population and to draw inferences from the measurement of parameters on units within these samples. Sampling can be defined as the gathering of information about a characteristic of a population without having to carry out a complete inventory of that population.
Following stratification, sampling should be designed in such a way as to be as representative of the population as possible. The design of a sampling regime will be dependent on the degree of homogeneity of the population (determined to a large degree on the level of stratification), the precision of the result required and the resources available. Two of the most common sampling designs that are used in forestry are random sampling and systematic sampling.
1.6.1 Random Sampling In random sampling, all individuals in a population have an equal chance of being selected every time a sample is taken. In other words, samples chosen do not conform to any spatial or temporal pattern. In forestry, the taking of truly random samples is generally impractical. This is because, in practice, the full population is not immediately available for sampling e.g. a stand of trees spread over 15 hectares or a timber sale hauled to a measurement location over a period of months.
1.6.2 Systematic Sampling Under systematic sampling, samples are taken according to a predefined structure or system e.g. every 5th tree encountered or after every 250m3 of timber that crosses a weighbridge. Most sampling that is carried out in forestry is systematic sampling.
In some instances, complete sampling of a population may be carried out. Complete sampling involves the measurement of every member of a population. In such cases, it is said that 100% sampling is carried out. Generally the costs of such measurement are high and can only be justified in special circumstances.

Timber Measurement Manual
Page 9
1.7 Selecting a Measurement Method The timber measurement methods included in this manual are those currently used in the Irish forest industry. Other suitable measurement methods, such as Harvester Head Measurement, may be developed or may become more appropriate in the future. These may be added to this manual at such a time. The selection of an appropriate measurement method must be made by those responsible for the timber sale. The timber measurement methods or “measurement options” included are as follows:
1. Tariff Measurement 5. Log Measurement 2. Abbreviated Tariff Measurement 6. Oven Dry Bark Free Tonne Measurement (ODBFT) 3. Volume/Weight Measurement 7. Weight Measurement 4. Stack Measurement 8. Volume/Weight Measurement with Reduced Stratification
Each of these measurement methods has its own particular advantages and disadvantages. This manual describes these in detail and suggests typical situations in which each method might be used. Field Sheets for each measurement method are presented and these can be downloaded either as blank sheets or as interactive spreadsheets from the COFORD web site5. The choice of measurement method for a sale of timber is a matter of contract, to be agreed between the parties involved in the sale. However, the selection of a timber measurement method suitable for a particular situation should always be guided by the need for cost effectiveness. A flow-chart to assist in the selection of suitable measurement methods is presented in Appendix 9. The decision is normally based on a combination of the following considerations:
1.7.1 Available Resources The availability of resources such as skills, labour, equipment, time and money will have a large bearing on the choice of measurement method. Each measurement method has its own demands in terms of such resources and these are outlined, as far as is possible, in each case.
1.7.2 Value of Timber In general terms, timber of higher value will be sampled with greater intensity or using a more precise measurement method than timber of lower value. The greater the value of the timber, the greater the effect on the total price any discrepancies in timber measurement will have.
1.7.3 Potential Cost of Measurement Method Given the need for cost effectiveness in timber measurement, the potential cost of any timber measurement method will have a significant bearing on whether it is selected or not. In general terms, measurement methods offering greater precision are more costly than others and thus, a measurement method should be selected that optimises the net timber price (i.e. the timber value minus the cost of measurement) whilst giving required levels of precision.
1.7.4 Ownership of Timber The circumstances of forest ownership can influence the choice of measurement method, primarily through the availability of resources. However, in some cases, the decision to sell may be based on the measurement result and market trends instead of a planned silvicultural or financial rotation. In such cases, the owner requires a detailed measurement of standing timber. The relationships between owner, contractor and purchaser may also influence the choice of measurement method, primarily through availability of resources but also with regard to timber security issues.
1.7.5 Quantity and Variability of Sale Small lots of timber will require a different intensity of measurement, and potentially a different measurement method, than larger lots. However, this has as much to do with the variability of the timber in the lot as it does with the quantity of timber. The principles of stratification and sampling are discussed in Sections 1.5 and 1.6 of this chapter.
1.7.6 Potential Precision of Measurement Method Each measurement method has its own inherent potential precision and this should strongly influence the choice of method. As stated above, timber of higher value will generally warrant the use of a measurement method that has the potential to produce a more precise result.
1.7.7 Sale Type The sale type, i.e. Standing, Roadside or Delivered, may also influence the measurement method selected. This will particularly be the case when roadside or delivered material is sold as a particular product from more than one stand rather than as timber from a single stand.
5 http://www.coford.ie

Timber Measurement Manual
Page 10
1.7.8 Other From time to time there may be other factors that influence the choice of measurement method. These include harvest type, harvest system, management flexibility, species and timber security issues.
Timber Measurement Manual
Page 11
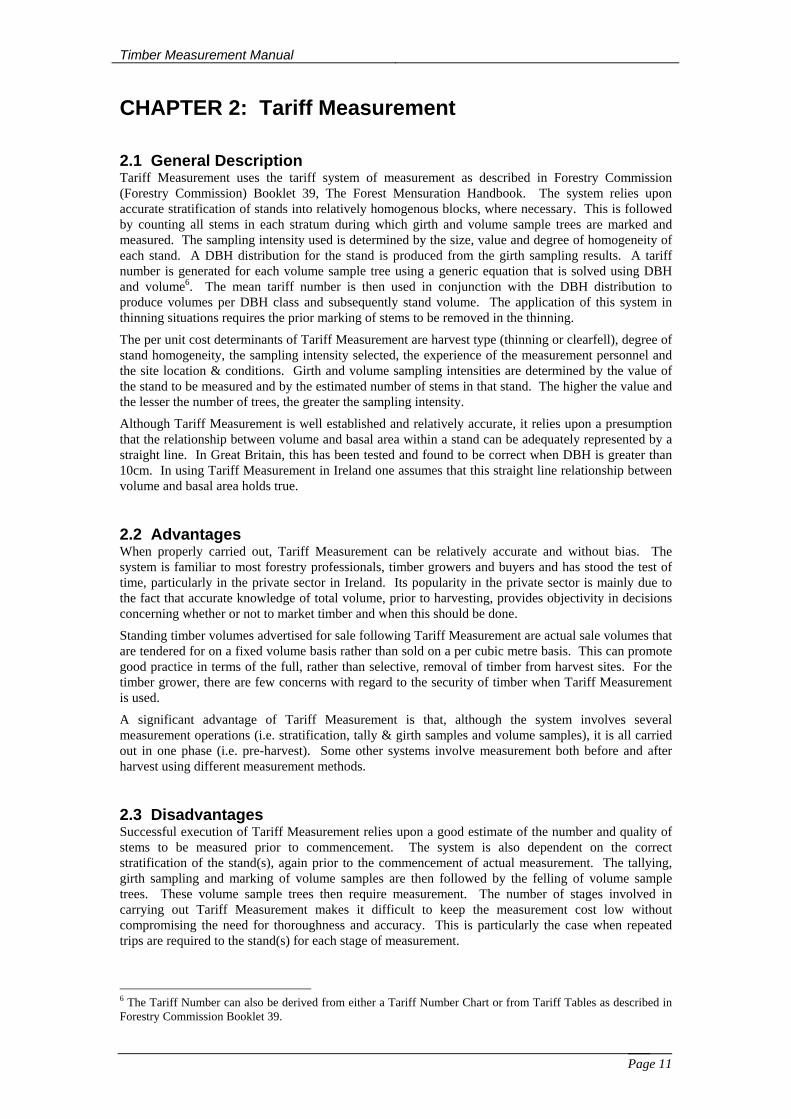
CHAPTER 2: Tariff Measurement 2.1 General Description Tariff Measurement uses the tariff system of measurement as described in Forestry Commission (Forestry Commission) Booklet 39, The Forest Mensuration Handbook. The system relies upon accurate stratification of stands into relatively homogenous blocks, where necessary. This is followed by counting all stems in each stratum during which girth and volume sample trees are marked and measured. The sampling intensity used is determined by the size, value and degree of homogeneity of each stand. A DBH distribution for the stand is produced from the girth sampling results. A tariff number is generated for each volume sample tree using a generic equation that is solved using DBH and volume6. The mean tariff number is then used in conjunction with the DBH distribution to produce volumes per DBH class and subsequently stand volume. The application of this system in thinning situations requires the prior marking of stems to be removed in the thinning.
The per unit cost determinants of Tariff Measurement are harvest type (thinning or clearfell), degree of stand homogeneity, the sampling intensity selected, the experience of the measurement personnel and the site location & conditions. Girth and volume sampling intensities are determined by the value of the stand to be measured and by the estimated number of stems in that stand. The higher the value and the lesser the number of trees, the greater the sampling intensity.
Although Tariff Measurement is well established and relatively accurate, it relies upon a presumption that the relationship between volume and basal area within a stand can be adequately represented by a straight line. In Great Britain, this has been tested and found to be correct when DBH is greater than 10cm. In using Tariff Measurement in Ireland one assumes that this straight line relationship between volume and basal area holds true. 2.2 Advantages When properly carried out, Tariff Measurement can be relatively accurate and without bias. The system is familiar to most forestry professionals, timber growers and buyers and has stood the test of time, particularly in the private sector in Ireland. Its popularity in the private sector is mainly due to the fact that accurate knowledge of total volume, prior to harvesting, provides objectivity in decisions concerning whether or not to market timber and when this should be done.
Standing timber volumes advertised for sale following Tariff Measurement are actual sale volumes that are tendered for on a fixed volume basis rather than sold on a per cubic metre basis. This can promote good practice in terms of the full, rather than selective, removal of timber from harvest sites. For the timber grower, there are few concerns with regard to the security of timber when Tariff Measurement is used.
A significant advantage of Tariff Measurement is that, although the system involves several measurement operations (i.e. stratification, tally & girth samples and volume samples), it is all carried out in one phase (i.e. pre-harvest). Some other systems involve measurement both before and after harvest using different measurement methods. 2.3 Disadvantages Successful execution of Tariff Measurement relies upon a good estimate of the number and quality of stems to be measured prior to commencement. The system is also dependent on the correct stratification of the stand(s), again prior to the commencement of actual measurement. The tallying, girth sampling and marking of volume samples are then followed by the felling of volume sample trees. These volume sample trees then require measurement. The number of stages involved in carrying out Tariff Measurement makes it difficult to keep the measurement cost low without compromising the need for thoroughness and accuracy. This is particularly the case when repeated trips are required to the stand(s) for each stage of measurement.
6 The Tariff Number can also be derived from either a Tariff Number Chart or from Tariff Tables as described in Forestry Commission Booklet 39.

Timber Measurement Manual
Page 12
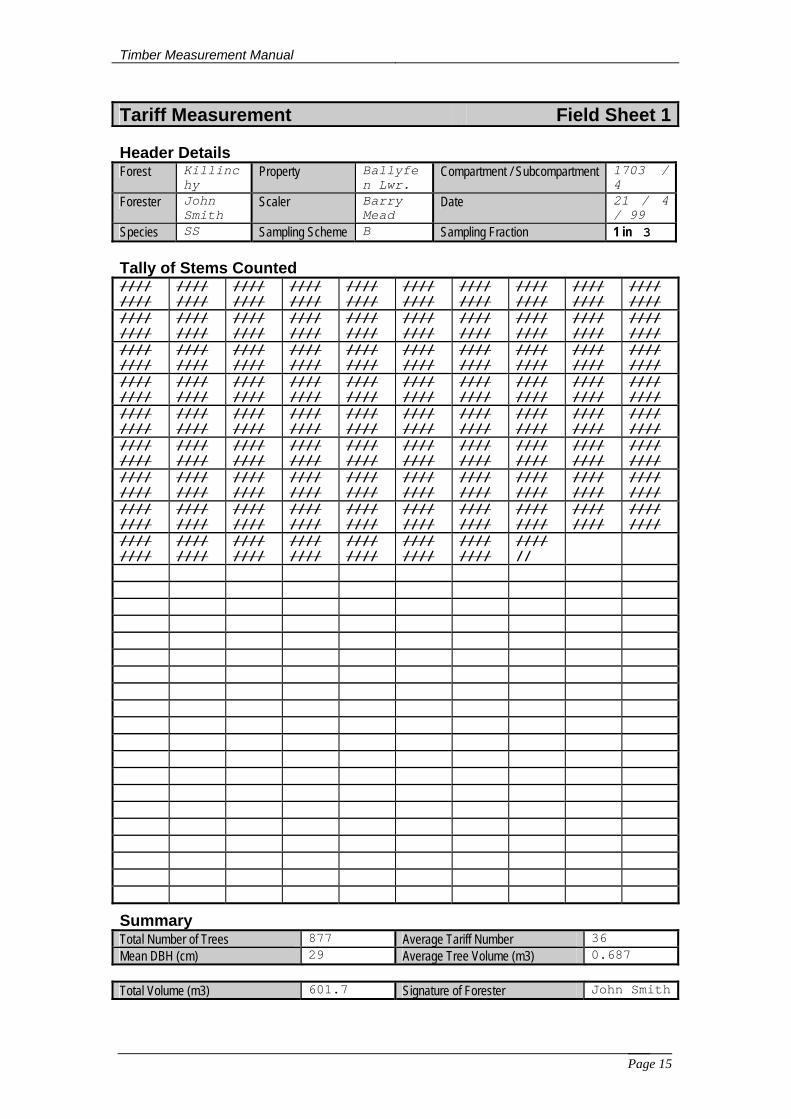
Although Tariff Measurement promotes good harvesting and site clearance practice, the fact that measurement is of standing timber rather than of timber entering the sawmill may be seen as a disadvantage to the processing sector. Awkward harvest areas or trees and material of low value within a sale, must be removed as payment for all material has been committed in advance. Because, in this instance, timber security is the responsibility of the timber purchaser, this may be regarded as a disadvantage by this sector. 2.4 Normal Use Tariff Measurement is normally used to definitively measure final crop stands or final thinnings of relatively high value. 2.5 Procedure The procedure for Tariff Measurement is documented in detail in Forestry Commission Booklet 39, The Forest Mensuration Handbook. An example showing completed Tariff Measurement field sheets is presented at the end of this chapter7: Blank sample Tariff Measurement field sheets are presented in Appendix 2. These field sheets are available on the COFORD web site (http://www.coford.ie) in the form of interactive spreadsheeets.
Figure 19: Refer to Forestry Commission Booklet 39, The Forest Mensuration Handbook
2.5.1 Measurement Equipment Required
• Rounded down calliper or rounded down converted diameter tape • Loggers tape • Field sheets • Scientific calculator • Marking paint and scribe • Stationery • Forestry Commission Booklet 39
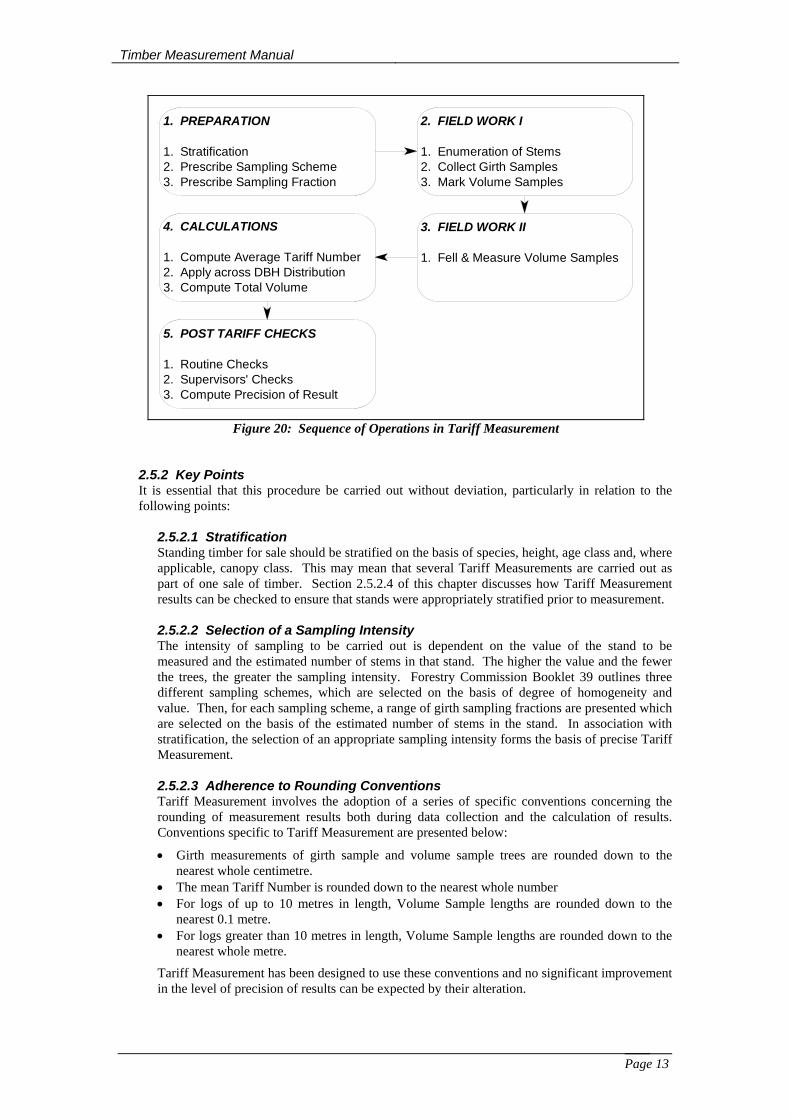
An outline of the sequence of steps involved in Tariff Measurement is presented in Figure 20. Full details of each of these steps are given in Forestry Commission Booklet 39.
7 This example uses the tariff equation rather than tariff tables.
Timber Measurement Manual
Page 13
1. PREPARATION
1. Stratification2. Prescribe Sampling Scheme3. Prescribe Sampling Fraction
2. FIELD WORK I
1. Enumeration of Stems2. Collect Girth Samples3. Mark Volume Samples
3. FIELD WORK II
1. Fell & Measure Volume Samples
4. CALCULATIONS
1. Compute Average Tariff Number2. Apply across DBH Distribution3. Compute Total Volume
5. POST TARIFF CHECKS
1. Routine Checks2. Supervisors' Checks3. Compute Precision of Result
Figure 20: Sequence of Operations in Tariff Measurement
2.5.2 Key Points It is essential that this procedure be carried out without deviation, particularly in relation to the following points:
2.5.2.1 Stratification Standing timber for sale should be stratified on the basis of species, height, age class and, where applicable, canopy class. This may mean that several Tariff Measurements are carried out as part of one sale of timber. Section 2.5.2.4 of this chapter discusses how Tariff Measurement results can be checked to ensure that stands were appropriately stratified prior to measurement. 2.5.2.2 Selection of a Sampling Intensity The intensity of sampling to be carried out is dependent on the value of the stand to be measured and the estimated number of stems in that stand. The higher the value and the fewer the trees, the greater the sampling intensity. Forestry Commission Booklet 39 outlines three different sampling schemes, which are selected on the basis of degree of homogeneity and value. Then, for each sampling scheme, a range of girth sampling fractions are presented which are selected on the basis of the estimated number of stems in the stand. In association with stratification, the selection of an appropriate sampling intensity forms the basis of precise Tariff Measurement. 2.5.2.3 Adherence to Rounding Conventions Tariff Measurement involves the adoption of a series of specific conventions concerning the rounding of measurement results both during data collection and the calculation of results. Conventions specific to Tariff Measurement are presented below:
• Girth measurements of girth sample and volume sample trees are rounded down to the nearest whole centimetre.
• The mean Tariff Number is rounded down to the nearest whole number • For logs of up to 10 metres in length, Volume Sample lengths are rounded down to the
nearest 0.1 metre. • For logs greater than 10 metres in length, Volume Sample lengths are rounded down to the
nearest whole metre.
Tariff Measurement has been designed to use these conventions and no significant improvement in the level of precision of results can be expected by their alteration.
Timber Measurement Manual
Page 14
2.5.2.4 Measurement Checks A series of checks on Tariff Measurement results are outlined in Forestry Commission Booklet 39 and should be followed for each stand measured. In addition to these checks, it is important that, once an initial total volume estimate has been calculated, a check is made on whether an appropriate girth sampling fraction was applied. This is done by comparing the actual number of stems recorded with the estimated number of stems used in determining the sampling fraction. If it transpires that an insufficient girth sampling fraction was used, due to an overestimation of the number of stems in the stand, further sampling should be carried out. A procedure for the collection of additional girth and volume samples is described in Forestry Commission Booklet 39.
2.5.3 Procedure for Statistical Analysis of Result As stated above, the precision of volume estimates produced by Tariff Measurement is a function of its correct application. It is possible to quantify the level of precision achieved through statistical analysis of the data collected. The procedure for such an analysis is described in Forestry Commission Booklet 39. However, the relevance of this procedure is dependent on non-biased data collection and the correct application of Tariff Measurement in terms of sampling scheme selection, stem enumeration and measurement conventions.
Timber Measurement Manual
Page 15
Tariff Measurement Field Sheet 1
Header Details Forest Killinc
hy Property Ballyfe
n Lwr. Compartment / Subcompartment 1703 /
4 Forester John
Smith Scaler Barry
Mead Date 21 / 4
/ 99 Species SS Sampling Scheme B Sampling Fraction 1 in 3 Tally of Stems Counted //// ////
//// ////
//// ////
//// ////
//// ////
//// ////
//// ////
//// ////
//// ////
//// ////
//// ////
//// ////
//// ////
//// ////
//// ////
//// ////
//// ////
//// ////
//// ////
//// ////
//// ////
//// ////
//// ////
//// ////
//// ////
//// ////
//// ////
//// ////
//// ////
//// ////
//// ////
//// ////
//// ////
//// ////
//// ////
//// ////
//// ////
//// ////
//// ////
//// ////
//// ////
//// ////
//// ////
//// ////
//// ////
//// ////
//// ////
//// ////
//// ////
//// ////
//// ////
//// ////
//// ////
//// ////
//// ////
//// ////
//// ////
//// ////
//// ////
//// ////
//// ////
//// ////
//// ////
//// ////
//// ////
//// ////
//// ////
//// ////
//// ////
//// ////
//// ////
//// ////
//// ////
//// ////
//// ////
//// ////
//// ////
//// ////
//// ////
//// ////
//// ////
//// ////
//// ////
//// ////
//// ////
//// ////
//// ////
//// //
Summary Total Number of Trees 877 Average Tariff Number 36 Mean DBH (cm) 29 Average Tree Volume (m3) 0.687 Total Volume (m3) 601.7 Signature of Forester John Smith
Timber Measurement Manual
Page 16
Tariff Measurement Field Sheet 2 Tally of Girth Sample Trees DBH (cm)
Girth Sample Trees (Tally)
Sample Total
Stand Total
Tree Vol. (m3)
Class Vol. (m3)
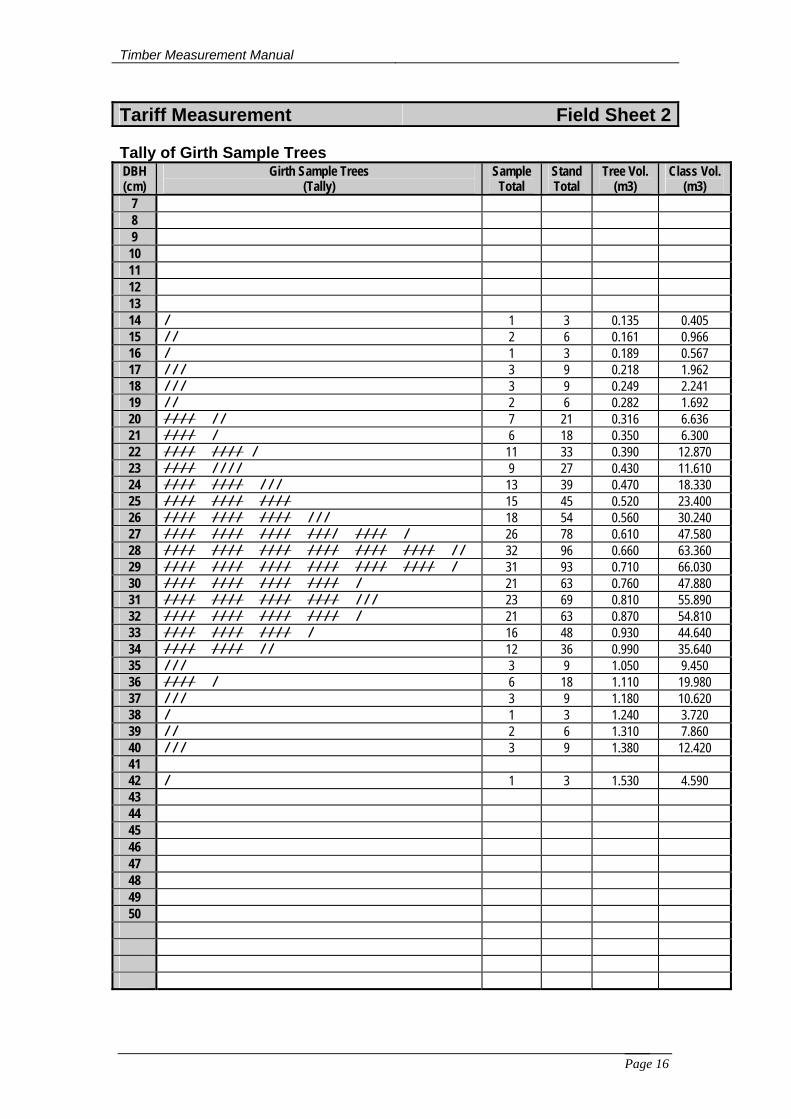
7 8 9 10 11 12 13 14 / 1 3 0.135 0.405 15 // 2 6 0.161 0.966 16 / 1 3 0.189 0.567 17 /// 3 9 0.218 1.962 18 /// 3 9 0.249 2.241 19 // 2 6 0.282 1.692 20 //// // 7 21 0.316 6.636 21 //// / 6 18 0.350 6.300 22 //// //// / 11 33 0.390 12.870 23 //// //// 9 27 0.430 11.610 24 //// //// /// 13 39 0.470 18.330 25 //// //// //// 15 45 0.520 23.400 26 //// //// //// /// 18 54 0.560 30.240 27 //// //// //// //// //// / 26 78 0.610 47.580 28 //// //// //// //// //// //// // 32 96 0.660 63.360 29 //// //// //// //// //// //// / 31 93 0.710 66.030 30 //// //// //// //// / 21 63 0.760 47.880 31 //// //// //// //// /// 23 69 0.810 55.890 32 //// //// //// //// / 21 63 0.870 54.810 33 //// //// //// / 16 48 0.930 44.640 34 //// //// // 12 36 0.990 35.640 35 /// 3 9 1.050 9.450 36 //// / 6 18 1.110 19.980 37 /// 3 9 1.180 10.620 38 / 1 3 1.240 3.720 39 // 2 6 1.310 7.860 40 /// 3 9 1.380 12.420 41 42 / 1 3 1.530 4.590 43 44 45 46 47 48 49 50
Timber Measurement Manual
Page 17
Tariff Measurement Field Sheet 3 Volume Sample Trees
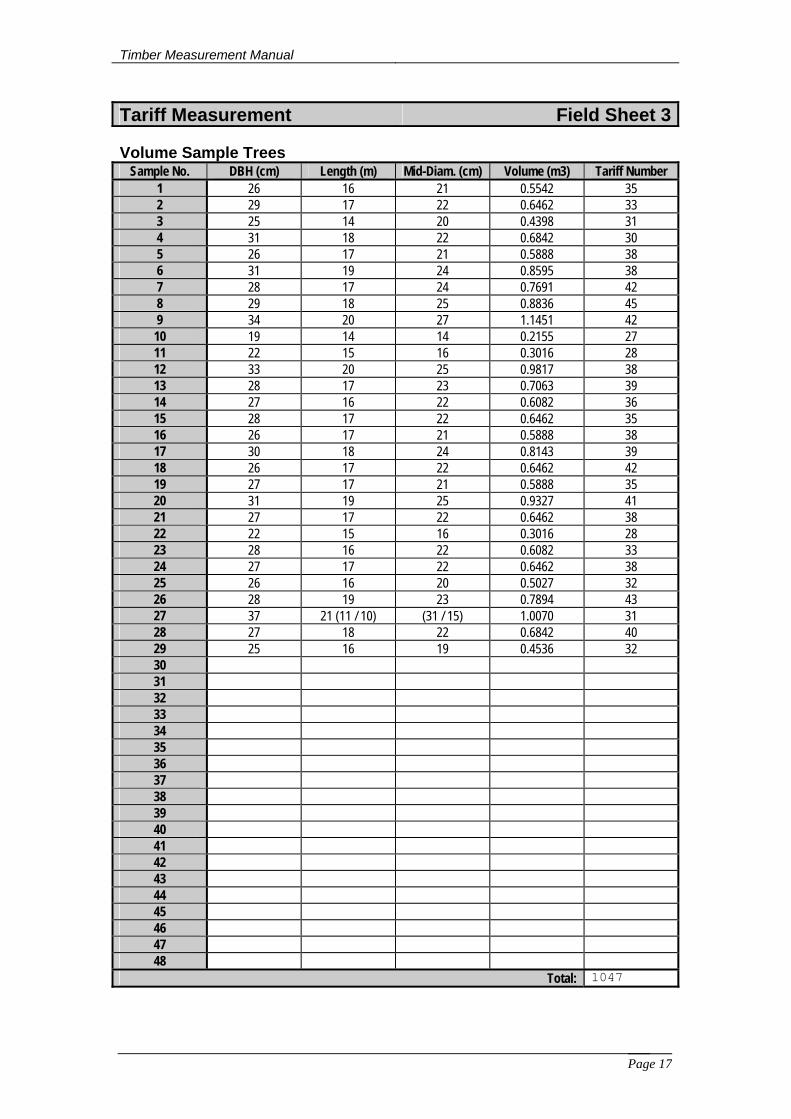
Sample No. DBH (cm) Length (m) Mid-Diam. (cm) Volume (m3) Tariff Number 1 26 16 21 0.5542 35 2 29 17 22 0.6462 33 3 25 14 20 0.4398 31 4 31 18 22 0.6842 30 5 26 17 21 0.5888 38 6 31 19 24 0.8595 38 7 28 17 24 0.7691 42 8 29 18 25 0.8836 45 9 34 20 27 1.1451 42 10 19 14 14 0.2155 27 11 22 15 16 0.3016 28 12 33 20 25 0.9817 38 13 28 17 23 0.7063 39 14 27 16 22 0.6082 36 15 28 17 22 0.6462 35 16 26 17 21 0.5888 38 17 30 18 24 0.8143 39 18 26 17 22 0.6462 42 19 27 17 21 0.5888 35 20 31 19 25 0.9327 41 21 27 17 22 0.6462 38 22 22 15 16 0.3016 28 23 28 16 22 0.6082 33 24 27 17 22 0.6462 38 25 26 16 20 0.5027 32 26 28 19 23 0.7894 43 27 37 21 (11 / 10) (31 / 15) 1.0070 31 28 27 18 22 0.6842 40 29 25 16 19 0.4536 32 30 31 32 33 34 35 36 37 38 39 40 41 42 43 44 45 46 47 48
Total: 1047
Timber Measurement Manual
Page 18
Chapter 3: Abbreviated Tariff Measurement 3.1 General Description Abbreviated Tariff Measurement is described fully in Forestry Commission (Forestry Commission) Booklet 49, Timber Measurement - A Field Guide. Abbreviated Tariff Measurement relies upon accurate stratification of stands into relatively homogenous blocks. This is followed by a complete enumeration of all stems in each stand during which girth and height sample trees are marked and measured. The sampling intensity used is determined by the size, value and degree of homogeneity of each stand. A DBH distribution for the stand is produced from the girth sampling results. A tariff number is generated for each height sample tree using a specific equation for the species in question that is solved using DBH and height8. The mean tariff number is then used in conjunction with the DBH distribution to produce volumes per DBH class and subsequently stand volume. Abbreviated Tariff Measurement in thinning situations requires the prior marking of stems to be removed in the thinning.
Abbreviated Tariff Measurement differs from Tariff Measurement in that the sampling for girth and height is less intensive and in that volume sample trees are not felled. Forestry Commission Booklet 49 outlines many different ways in which Abbreviated Tariff Measurement may be carried out depending on the nature of the timber to be measured, the reason for measuring and the resources available for measurement. However, for sale or payment purposes, Abbreviated Tariff Measurement should be restricted to the procedure described in Section 3.5 of this chapter. This particular procedure has been selected as the most intensive form of Abbreviated Tariff Measurement that does not involve the felling of volume sample trees.
The per unit cost determinants of Abbreviated Tariff Measurement are harvest type (thinning or clearfell), degree of stand homogeneity, the sampling intensity selected, the experience of the measurement personnel and the site location & conditions. Girth and height sampling intensities are determined firstly by the value of the stand to be measured and secondly by the estimated number of stems in that stand. The higher the value and the fewer the trees, the greater the sampling intensity.
Abbreviated Tariff Measurement uses Tariff Equations derived from stands in Great Britain which are known not to be fully representative of growth conditions and characteristics in this country (Gallagher, 1972; Kilpatrick & Savill, 1981; Omiyale & Joyce, 1982). 3.2 Advantages The principal advantage of Abbreviated Tariff Measurement is that it incurs a lower total cost than Tariff Measurement because volume sample trees are not felled. Thus, operations can be completed in one visit to the wood and results are quickly available.
Standing timber volumes advertised for sale following Abbreviated Tariff Measurement are actual sale volumes that are tendered for on a fixed volume basis rather than sold on a per cubic metre basis. This can promote good practice in terms of the full clearance of sites and means that the waste or leaving of material on site cannot have the effect of altering the value of extracted timber. For the timber grower, there are few concerns with regard to the security of timber when Abbreviated Tariff Measurement is used. 3.3 Disadvantages Abbreviated Tariff Measurement involves less intensive sampling than Tariff Measurement which adversely affects the precision of the total volume estimate. In addition to this, there is greater error associated with the measurement of heights than with felled lengths.
Although Abbreviated Tariff Measurement promotes good harvesting and site clearance practice, the fact that measurement is of standing timber rather than of timber entering the sawmill may be seen as a disadvantage to the processing sector.
8 The Tariff Number can also be derived from one of the Single Tree Tariff Charts presented in Forestry Commission Booklet 39.
Timber Measurement Manual
Page 19
3.4 Normal Use The following procedure for Abbreviated Tariff Measurement is normally used in low value stands where the cost of felling volume sample trees cannot be justified. Abbreviated Tariff Measurement is most often used as a measurement of a small component (e.g. groups of trees of different species, Yield Class, age etc.) of a larger sale which uses a more intensive measurement method, usually Tariff Measurement, for the quantification of the main component of the sale. For sale or payment purposes, Abbreviated Tariff Measurement should be restricted to the procedure described in Section 3.5 of this chapter. Because it involves the measurement of standing timber, Abbreviated Tariff Measurement can be used as a means of pre-determining total volume, thus assisting decisions such as whether to sell or not and the timing of marketing. 3.5 Procedure A number of different procedures for Abbreviated Tariff Measurement are described in Forestry Commission Booklet 49. Abbreviated Tariff Measurement for sale purposes should follow the following procedure only. An example is presented throughout the procedure and corresponds with the completed field sheets that follow. Blank field sheets for Abbreviated Tariff Measurement are presented in Appendix 3. These field sheets are available on the COFORD web site (http://www.coford.ie) in the form of interactive spreadsheeets.
3.5.1 Measurement Equipment Required • Rounded down calliper or rounded down converted diameter tape • Loggers tape • Height measurement instrument e.g. Blume Leiss / Spiegel Relaskope / Clinometer etc. • Field sheets • Scientific calculator • Marking paint and scribe • Stationery • Forestry Commission Booklets 39 & 49
3.5.2 Stratification Before commencing measurement it is imperative that the timber to be measured has been appropriately stratified into distinct stands. This stratification should be based on species, Yield Class, stem quality, average tree size, height class or any other significant distinguishing factors. For measurement purposes, each stand should be treated separately with associated measurement data being recorded on separate field sheets.
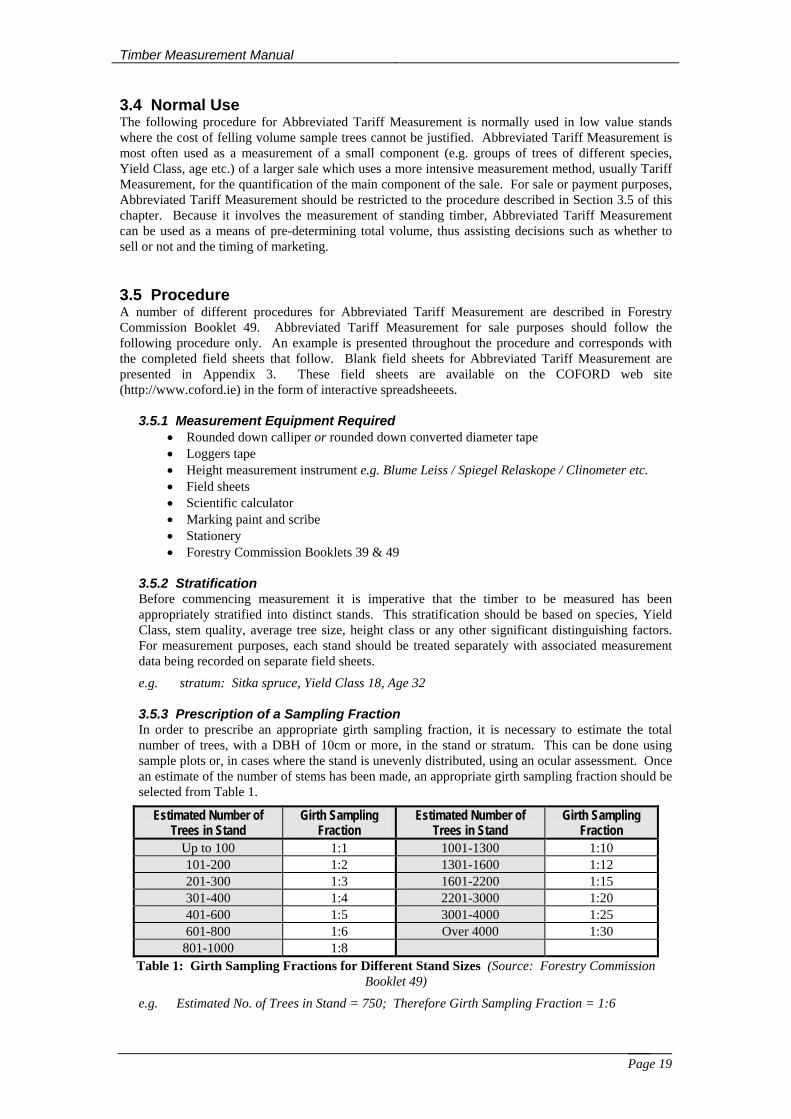
e.g. stratum: Sitka spruce, Yield Class 18, Age 32 3.5.3 Prescription of a Sampling Fraction In order to prescribe an appropriate girth sampling fraction, it is necessary to estimate the total number of trees, with a DBH of 10cm or more, in the stand or stratum. This can be done using sample plots or, in cases where the stand is unevenly distributed, using an ocular assessment. Once an estimate of the number of stems has been made, an appropriate girth sampling fraction should be selected from Table 1.
Estimated Number of Trees in Stand
Girth Sampling Fraction
Estimated Number of Trees in Stand
Girth Sampling Fraction
Up to 100 1:1 1001-1300 1:10 101-200 1:2 1301-1600 1:12 201-300 1:3 1601-2200 1:15 301-400 1:4 2201-3000 1:20 401-600 1:5 3001-4000 1:25 601-800 1:6 Over 4000 1:30
801-1000 1:8 Table 1: Girth Sampling Fractions for Different Stand Sizes (Source: Forestry Commission
Booklet 49)
e.g. Estimated No. of Trees in Stand = 750; Therefore Girth Sampling Fraction = 1:6

Timber Measurement Manual
Page 20
3.5.4 Stem Enumeration, Girth Sample Collection & Height Sample Marking The scaler should move through the stand, marking and tallying every tree that is included in the measurement.
The DBH of every ‘n’th tree, where n is the girth sampling fraction, should be measured and recorded. DBH should be measured according to the conventions described in Chapter 1, Section 1.4.1. Only live trees of DBH greater than or equal to 7cm should be included.
Every 10th DBH sample tree, that has a DBH greater than or equal to 10cm, is a height sample tree. These should be numbered in the order that they are encountered. The total heights of height sample trees should either be measured as they are encountered or separately following the completion of stem enumeration and girth sampling. Total heights should be measured according to conventions described in Chapter 1, Section 1.4.2. It is important that the DBH of each height tree is recorded alongside its total height. This is in addition to it being recorded as a girth sample.
Figure 21: All Trees Should be Tallied
All tally, DBH and total height data should be recorded on field sheets such as the ones presented in Appendix 3. 3.5.5 Calculations Results from all calculations should be filled in directly on field sheets such as the ones presented in Appendix 3. Users of Abbreviated Tariff Measurement should be familiar with Forestry Commission Booklet 39.
1. Using DBH, total height and either specific tariff equations (available from the Forestry Commission) or the Single Tree Tariff Charts9 presented in Forestry Commission Booklet 39, the Tariff Number of each of the height sample trees should be derived. e.g. Using field sheet 1 data for Sample Tree No. 1
DBH = 24; Total Height = 15; Tariff Number = 24 (using SS Equation or Chart)
9 Both specific tariff equations and Single Tree Tariff Charts are available for each of the major commercial species.
Timber Measurement Manual
Page 21
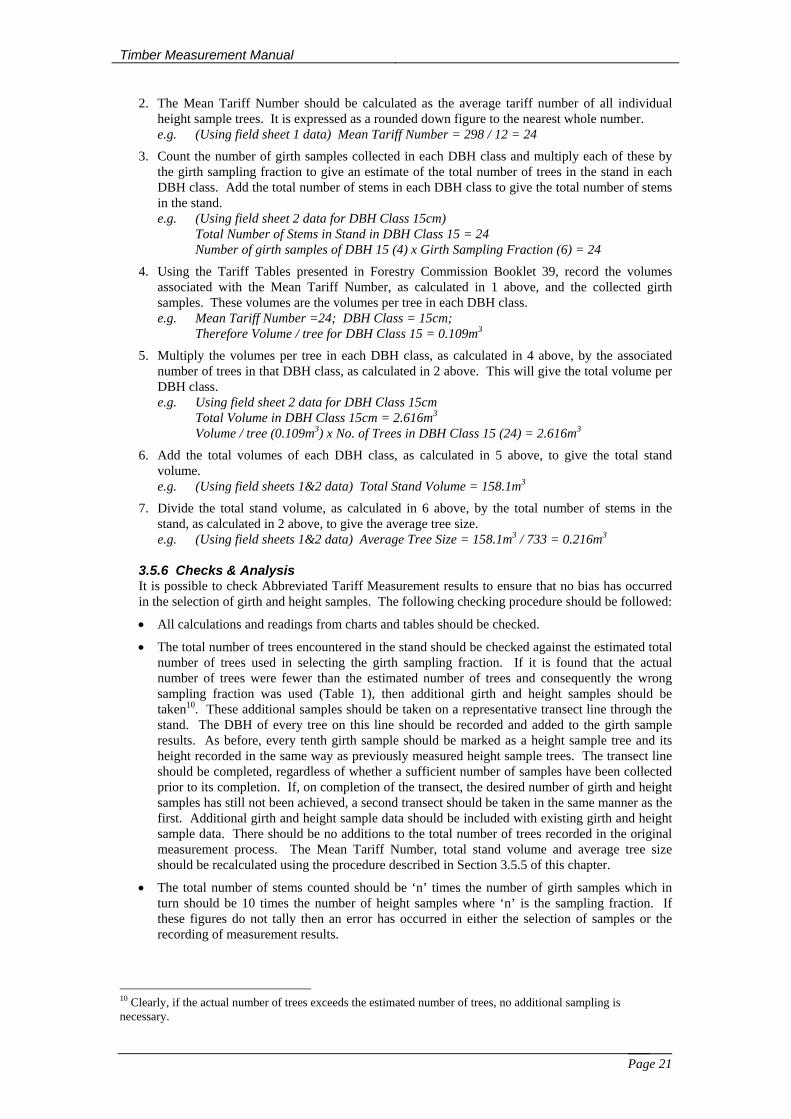
2. The Mean Tariff Number should be calculated as the average tariff number of all individual height sample trees. It is expressed as a rounded down figure to the nearest whole number. e.g. (Using field sheet 1 data) Mean Tariff Number = 298 / 12 = 24
3. Count the number of girth samples collected in each DBH class and multiply each of these by the girth sampling fraction to give an estimate of the total number of trees in the stand in each DBH class. Add the total number of stems in each DBH class to give the total number of stems in the stand. e.g. (Using field sheet 2 data for DBH Class 15cm) Total Number of Stems in Stand in DBH Class 15 = 24
Number of girth samples of DBH 15 (4) x Girth Sampling Fraction (6) = 24
4. Using the Tariff Tables presented in Forestry Commission Booklet 39, record the volumes associated with the Mean Tariff Number, as calculated in 1 above, and the collected girth samples. These volumes are the volumes per tree in each DBH class. e.g. Mean Tariff Number =24; DBH Class = 15cm;
Therefore Volume / tree for DBH Class 15 = 0.109m3
5. Multiply the volumes per tree in each DBH class, as calculated in 4 above, by the associated number of trees in that DBH class, as calculated in 2 above. This will give the total volume per DBH class. e.g. Using field sheet 2 data for DBH Class 15cm Total Volume in DBH Class 15cm = 2.616m3
Volume / tree (0.109m3) x No. of Trees in DBH Class 15 (24) = 2.616m3
6. Add the total volumes of each DBH class, as calculated in 5 above, to give the total stand volume. e.g. (Using field sheets 1&2 data) Total Stand Volume = 158.1m3
7. Divide the total stand volume, as calculated in 6 above, by the total number of stems in the stand, as calculated in 2 above, to give the average tree size. e.g. (Using field sheets 1&2 data) Average Tree Size = 158.1m3 / 733 = 0.216m3
3.5.6 Checks & Analysis It is possible to check Abbreviated Tariff Measurement results to ensure that no bias has occurred in the selection of girth and height samples. The following checking procedure should be followed:
• All calculations and readings from charts and tables should be checked.
• The total number of trees encountered in the stand should be checked against the estimated total number of trees used in selecting the girth sampling fraction. If it is found that the actual number of trees were fewer than the estimated number of trees and consequently the wrong sampling fraction was used (Table 1), then additional girth and height samples should be taken10. These additional samples should be taken on a representative transect line through the stand. The DBH of every tree on this line should be recorded and added to the girth sample results. As before, every tenth girth sample should be marked as a height sample tree and its height recorded in the same way as previously measured height sample trees. The transect line should be completed, regardless of whether a sufficient number of samples have been collected prior to its completion. If, on completion of the transect, the desired number of girth and height samples has still not been achieved, a second transect should be taken in the same manner as the first. Additional girth and height sample data should be included with existing girth and height sample data. There should be no additions to the total number of trees recorded in the original measurement process. The Mean Tariff Number, total stand volume and average tree size should be recalculated using the procedure described in Section 3.5.5 of this chapter.
• The total number of stems counted should be ‘n’ times the number of girth samples which in turn should be 10 times the number of height samples where ‘n’ is the sampling fraction. If these figures do not tally then an error has occurred in either the selection of samples or the recording of measurement results.
10 Clearly, if the actual number of trees exceeds the estimated number of trees, no additional sampling is necessary.
Timber Measurement Manual
Page 22
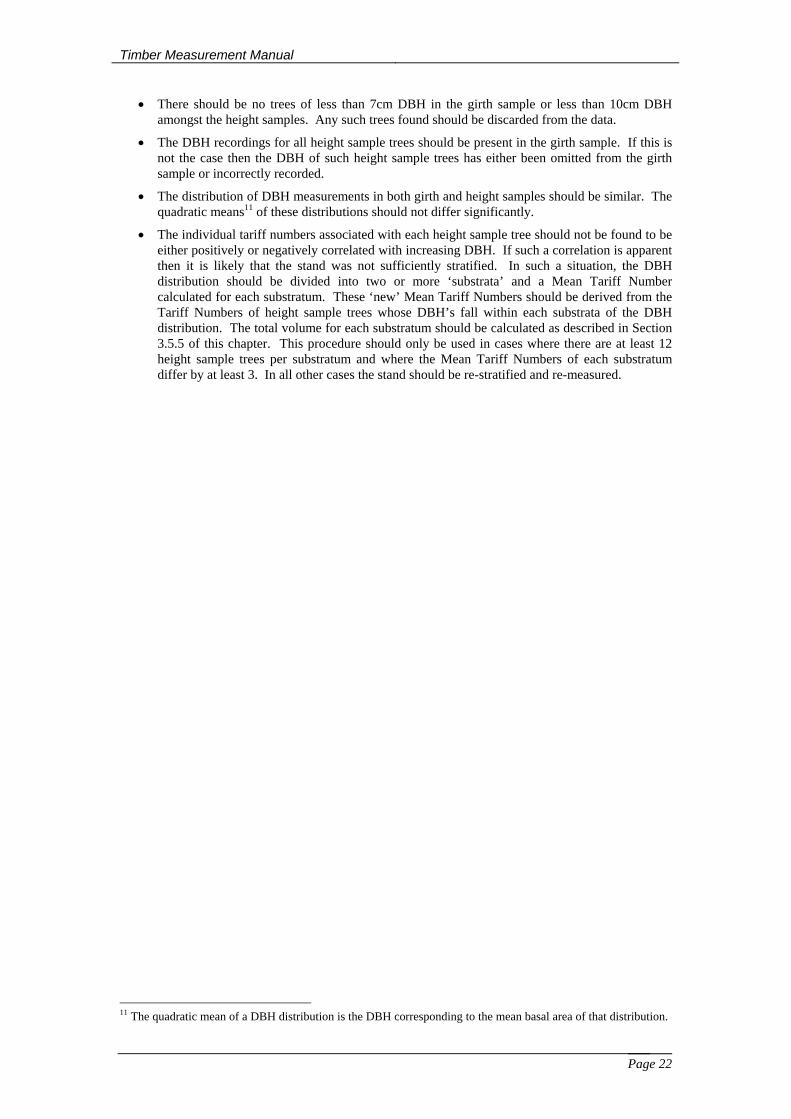
• There should be no trees of less than 7cm DBH in the girth sample or less than 10cm DBH amongst the height samples. Any such trees found should be discarded from the data.
• The DBH recordings for all height sample trees should be present in the girth sample. If this is not the case then the DBH of such height sample trees has either been omitted from the girth sample or incorrectly recorded.
• The distribution of DBH measurements in both girth and height samples should be similar. The quadratic means11 of these distributions should not differ significantly.
• The individual tariff numbers associated with each height sample tree should not be found to be either positively or negatively correlated with increasing DBH. If such a correlation is apparent then it is likely that the stand was not sufficiently stratified. In such a situation, the DBH distribution should be divided into two or more ‘substrata’ and a Mean Tariff Number calculated for each substratum. These ‘new’ Mean Tariff Numbers should be derived from the Tariff Numbers of height sample trees whose DBH’s fall within each substrata of the DBH distribution. The total volume for each substratum should be calculated as described in Section 3.5.5 of this chapter. This procedure should only be used in cases where there are at least 12 height sample trees per substratum and where the Mean Tariff Numbers of each substratum differ by at least 3. In all other cases the stand should be re-stratified and re-measured.
11 The quadratic mean of a DBH distribution is the DBH corresponding to the mean basal area of that distribution.
Timber Measurement Manual
Page 23
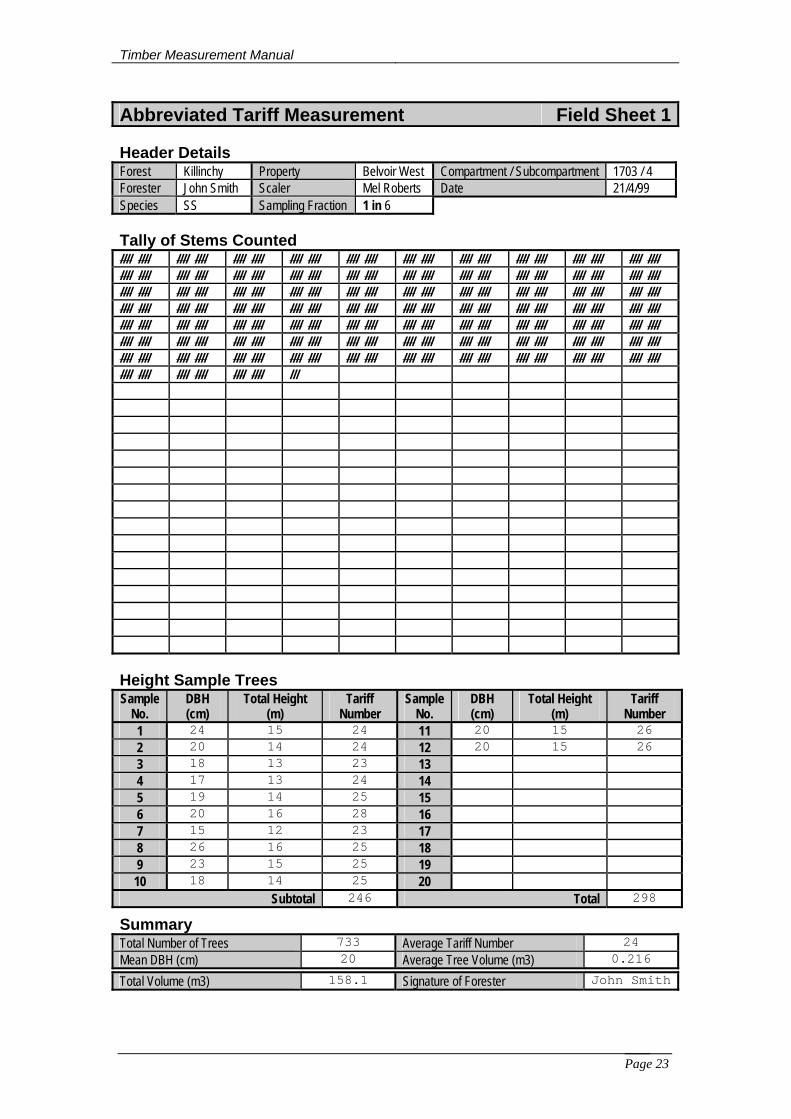
Abbreviated Tariff Measurement Field Sheet 1
Header Details Forest Killinchy Property Belvoir West Compartment / Subcompartment 1703 / 4 Forester John Smith Scaler Mel Roberts Date 21/4/99 Species SS Sampling Fraction 1 in 6 Tally of Stems Counted //// //// //// //// //// //// //// //// //// //// //// //// //// //// //// //// //// //// //// //// //// //// //// //// //// //// //// //// //// //// //// //// //// //// //// //// //// //// //// //// //// //// //// //// //// //// //// //// //// //// //// //// //// //// //// //// //// //// //// //// //// //// //// //// //// //// //// //// //// //// //// //// //// //// //// //// //// //// //// //// //// //// //// //// //// //// //// //// //// //// //// //// //// //// //// //// //// //// //// //// //// //// //// //// //// //// //// //// //// //// //// //// //// //// //// //// //// //// //// //// //// //// //// //// //// //// //// //// //// //// //// //// //// //// //// //// //// //// //// //// //// //// //// //// //// //// /// Height Sample Trees Sample
No. DBH (cm)
Total Height (m)
Tariff Number
Sample No.
DBH (cm)
Total Height (m)
Tariff Number
1 24 15 24 11 20 15 26 2 20 14 24 12 20 15 26 3 18 13 23 13 4 17 13 24 14 5 19 14 25 15 6 20 16 28 16 7 15 12 23 17 8 26 16 25 18 9 23 15 25 19 10 18 14 25 20
Subtotal 246 Total 298
Summary Total Number of Trees 733 Average Tariff Number 24 Mean DBH (cm) 20 Average Tree Volume (m3) 0.216
Total Volume (m3) 158.1 Signature of Forester John Smith
Timber Measurement Manual
Page 24
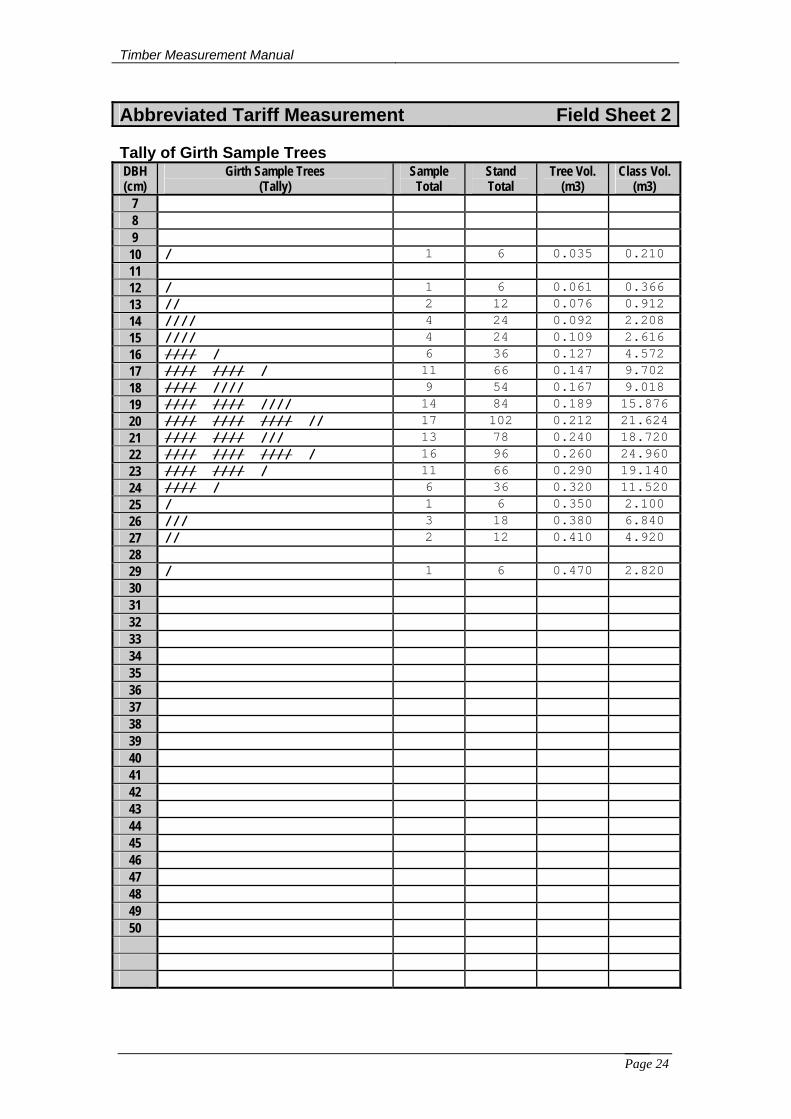
Abbreviated Tariff Measurement Field Sheet 2 Tally of Girth Sample Trees DBH (cm)
Girth Sample Trees (Tally)
Sample Total
Stand Total
Tree Vol. (m3)
Class Vol. (m3)
7 8 9 10 / 1 6 0.035 0.210 11 12 / 1 6 0.061 0.366 13 // 2 12 0.076 0.912 14 //// 4 24 0.092 2.208 15 //// 4 24 0.109 2.616 16 //// / 6 36 0.127 4.572 17 //// //// / 11 66 0.147 9.702 18 //// //// 9 54 0.167 9.018 19 //// //// //// 14 84 0.189 15.876 20 //// //// //// // 17 102 0.212 21.624 21 //// //// /// 13 78 0.240 18.720 22 //// //// //// / 16 96 0.260 24.960 23 //// //// / 11 66 0.290 19.140 24 //// / 6 36 0.320 11.520 25 / 1 6 0.350 2.100 26 /// 3 18 0.380 6.840 27 // 2 12 0.410 4.920 28 29 / 1 6 0.470 2.820 30 31 32 33 34 35 36 37 38 39 40 41 42 43 44 45 46 47 48 49 50
Timber Measurement Manual
Page 25
Chapter 4: Volume / Weight Measurement 4.1 General Description Volume/Weight Measurement involves the weighing of every load of timber from each sale. By applying a volume/weight conversion factor to timber weight (tonnes) a corresponding volume (cubic metres) can be calculated. Volume/weight conversion factors are generated through stratified sampling of loads entering the sawmill. Two forms of sampling are involved in Volume/Weight Measurement:
1. Systematic samples (lorry loads) are selected throughout the timber sale haulage period.
2. Representative log samples are selected from sample lorry loads which are measured for weight and volume to provide sample volume/weight conversion factors.
Sampling is carried out on different products and species within the same sale (different strata) and for each sample, both weight and volume are accurately measured and a conversion factor is calculated.
Volume/Weight Measurement provides a quantification of material sampled at a weighbridge from specific timber sales. Volume/Weight Measurement may require a previous estimation of timber volumes in order to determine a per unit price or rate for timber to be harvested. Pre-harvest measurement information is also used in the design of sampling regimes in Volume/Weight Measurement. Pre-harvest measurement is discussed briefly in Appendix 1. 4.2 Advantages Volume/Weight Measurement has the potential to produce highly acceptable levels of precision in timber sale volume measurement. When compared with alternative methods, Volume/Weight Measurement is extremely intensive, with every load of purchased timber being weighed.
Sampling for Volume/Weight factors is carried out when the timber lorry is entering the processing facility. This means that Volume/Weight factors used are directly representative of the status of the timber as it crosses the weighbridge. Volume/Weight sampling is carried out over the duration of a sale of timber. Thus, the representative nature of Volume/Weight factors is maintained over the duration of a sale.
A further advantage of this system, to sawmillers in particular, is the fact that only timber that actually enters the sawmill and crosses the weighbridge is measured and subsequently paid for. 4.3 Disadvantages One of the main disadvantages of Volume/Weight Measurement is that only timber that crosses a weighbridge is measured. This may not necessarily be the same quantity as that which was allocated standing to this sale or that which was harvested. Thus, careful supervision and follow up procedures are required to ensure that all available material is removed from the harvest site. The security of timber loads is also a potential problem in that the emphasis on monitoring timber loads is at the sawmill rather than the forest gate.
In order to avoid a build up of previously measured sample logs, volume/weight measurement locations require a facility for the prompt removal of sample logs following sample measurement.
Volume/Weight Measurement requires resources at a certified weighbridge over the period of a sale. This can represent a considerable cost although this can be significantly reduced if these resources are deployed over a number of sales proceeding concurrently.
Volume/Weight Measurement requires pre-harvest measurement information with which there is an associated cost. 4.4 Normal Use Volume/Weight Measurement is commonly used for both standing and roadside sales and is particularly suited to larger sales and in situations where a number of sales are simultaneously being sold by a single concern to a single processor. The intensity of sampling is dictated by the value of the produce and thus it is suitable for both high and low value sales.
Timber Measurement Manual
Page 26
4.5 Procedure The following procedure is used in the quantification of sale volumes using Volume/Weight Measurement. An example is presented throughout the procedure and corresponds with the completed field sheets that follow. Blank sample field sheets for Volume/Weight Measurement are presented in Appendix 4. These field sheets are available on the COFORD web site (http://www.coford.ie) in the form of interactive spreadsheeets.
4.5.1 Measurement Equipment Required • Weighbridge • Non-rounded down calliper • Logger’s tape • Field Sheets • Record Sheets • Scientific Calculator • Stationery
4.5.2 Pre-Harvest Information Required In order to carry out Volume/Weight Measurement in an objective and standardised manner, the following information is required prior to the commencement of haulage operations and the intake of timber into the processing facility:
4.5.2.1 Administrative Details • Identification of Forest Name and Forest Property • Identification of Forester Administering the Sale • Identification of Sale Type (Harvested or Standing) • Sale Period • Measurement Location 4.5.2.2 Provisional Volume Estimates per Sampling Stratum Different log types and different species have the potential to record different volume/weight factors. For this reason it is important to stratify material to be measured in order that a precise measurement result is achieved. The following information is thus required: 1. An estimate of expected total volume to be measured using Volume/Weight
Measurement. If pulpwood, for example, is to be measured differently then it should not be included in the total volume estimate
2. An estimate of the expected breakdown of volume per species and per log type i.e. an estimate of volume per stratum
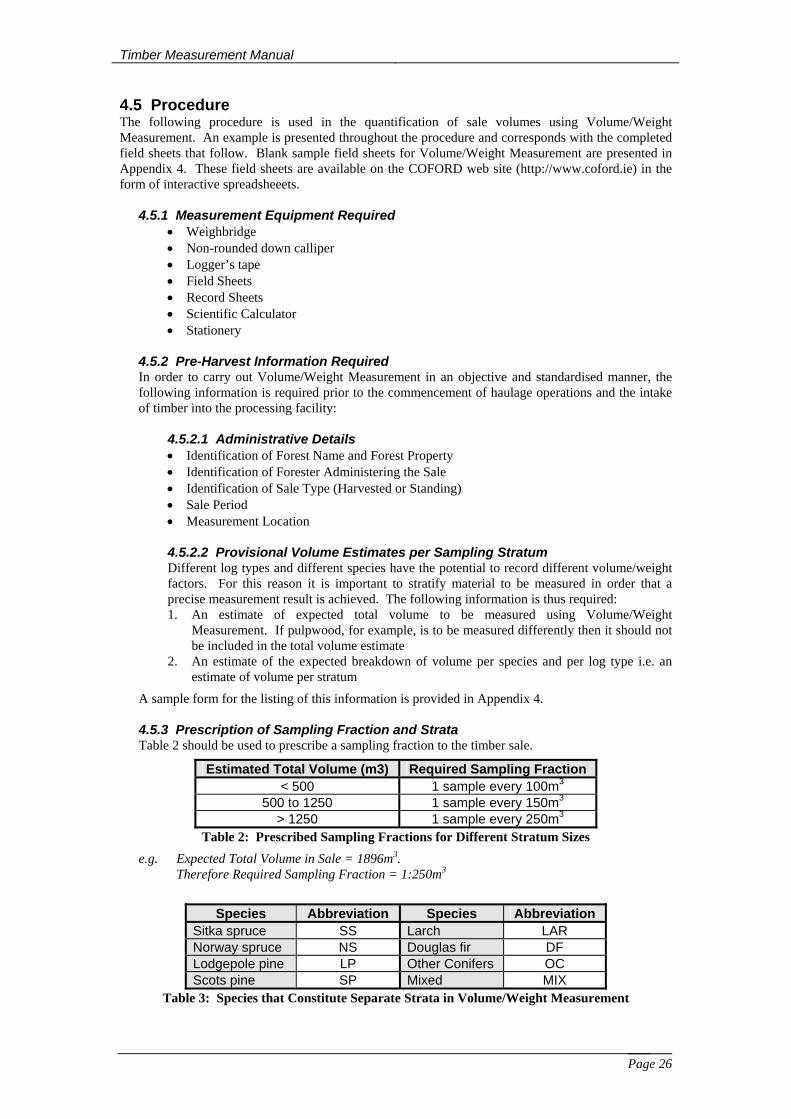
A sample form for the listing of this information is provided in Appendix 4. 4.5.3 Prescription of Sampling Fraction and Strata Table 2 should be used to prescribe a sampling fraction to the timber sale.
Estimated Total Volume (m3) Required Sampling Fraction < 500 1 sample every 100m3
500 to 1250 1 sample every 150m3 > 1250 1 sample every 250m3
Table 2: Prescribed Sampling Fractions for Different Stratum Sizes
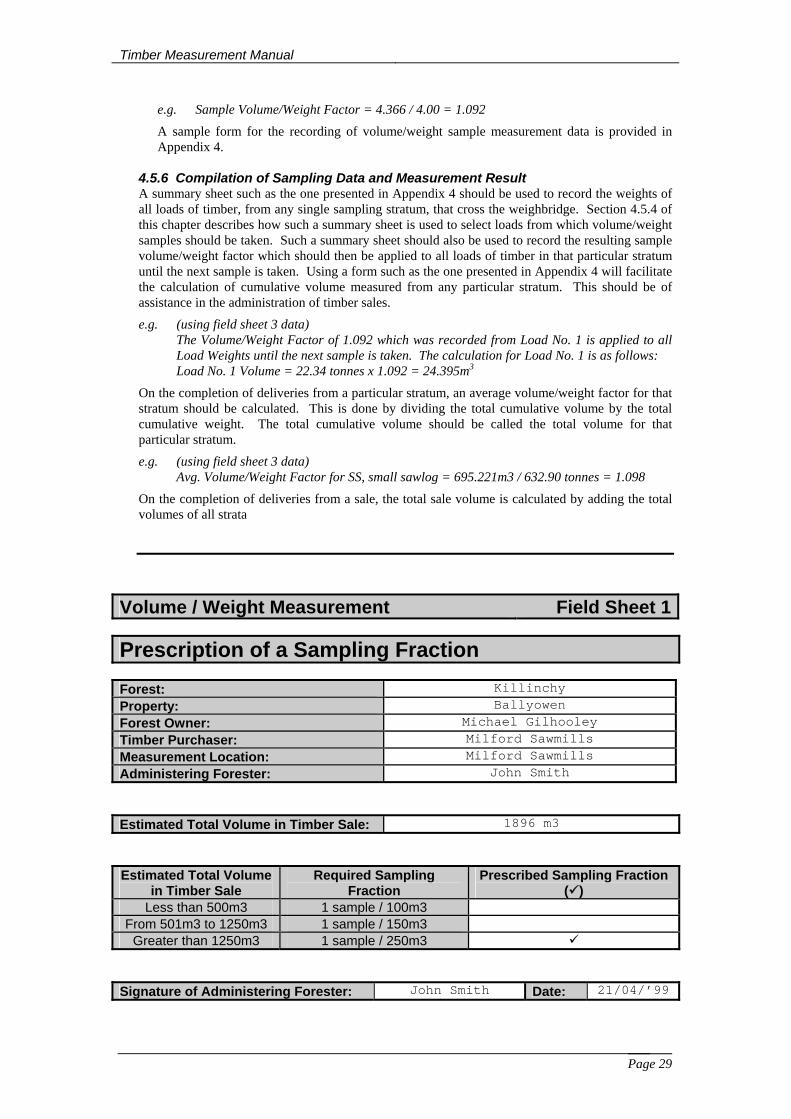
e.g. Expected Total Volume in Sale = 1896m3. Therefore Required Sampling Fraction = 1:250m3
Species Abbreviation Species Abbreviation Sitka spruce SS Larch LAR Norway spruce NS Douglas fir DF Lodgepole pine LP Other Conifers OC Scots pine SP Mixed MIX
Table 3: Species that Constitute Separate Strata in Volume/Weight Measurement
Timber Measurement Manual
Page 27
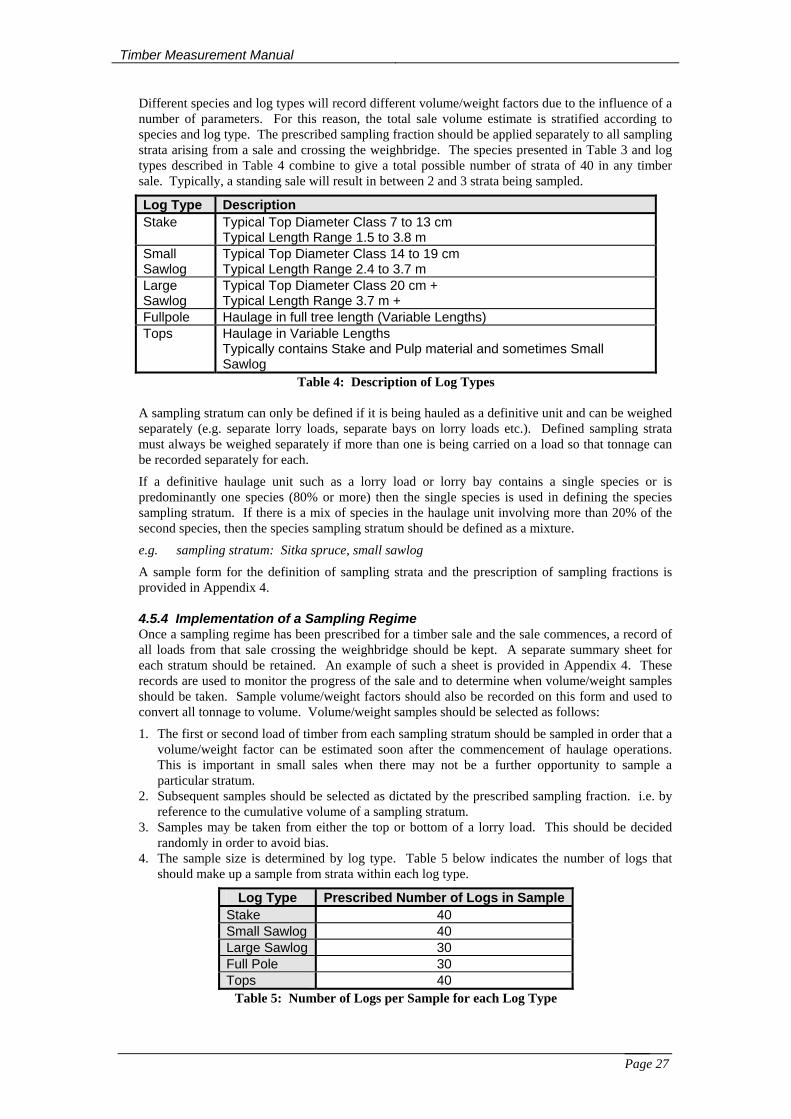
Different species and log types will record different volume/weight factors due to the influence of a number of parameters. For this reason, the total sale volume estimate is stratified according to species and log type. The prescribed sampling fraction should be applied separately to all sampling strata arising from a sale and crossing the weighbridge. The species presented in Table 3 and log types described in Table 4 combine to give a total possible number of strata of 40 in any timber sale. Typically, a standing sale will result in between 2 and 3 strata being sampled.
Log Type Description Stake Typical Top Diameter Class 7 to 13 cm
Typical Length Range 1.5 to 3.8 m Small Sawlog
Typical Top Diameter Class 14 to 19 cm Typical Length Range 2.4 to 3.7 m
Large Sawlog
Typical Top Diameter Class 20 cm + Typical Length Range 3.7 m +
Fullpole Haulage in full tree length (Variable Lengths) Tops Haulage in Variable Lengths
Typically contains Stake and Pulp material and sometimes Small Sawlog
Table 4: Description of Log Types
A sampling stratum can only be defined if it is being hauled as a definitive unit and can be weighed separately (e.g. separate lorry loads, separate bays on lorry loads etc.). Defined sampling strata must always be weighed separately if more than one is being carried on a load so that tonnage can be recorded separately for each.
If a definitive haulage unit such as a lorry load or lorry bay contains a single species or is predominantly one species (80% or more) then the single species is used in defining the species sampling stratum. If there is a mix of species in the haulage unit involving more than 20% of the second species, then the species sampling stratum should be defined as a mixture.
e.g. sampling stratum: Sitka spruce, small sawlog
A sample form for the definition of sampling strata and the prescription of sampling fractions is provided in Appendix 4.
4.5.4 Implementation of a Sampling Regime Once a sampling regime has been prescribed for a timber sale and the sale commences, a record of all loads from that sale crossing the weighbridge should be kept. A separate summary sheet for each stratum should be retained. An example of such a sheet is provided in Appendix 4. These records are used to monitor the progress of the sale and to determine when volume/weight samples should be taken. Sample volume/weight factors should also be recorded on this form and used to convert all tonnage to volume. Volume/weight samples should be selected as follows:
1. The first or second load of timber from each sampling stratum should be sampled in order that a volume/weight factor can be estimated soon after the commencement of haulage operations. This is important in small sales when there may not be a further opportunity to sample a particular stratum.
2. Subsequent samples should be selected as dictated by the prescribed sampling fraction. i.e. by reference to the cumulative volume of a sampling stratum.
3. Samples may be taken from either the top or bottom of a lorry load. This should be decided randomly in order to avoid bias.
4. The sample size is determined by log type. Table 5 below indicates the number of logs that should make up a sample from strata within each log type.
Log Type Prescribed Number of Logs in Sample Stake 40 Small Sawlog 40 Large Sawlog 30 Full Pole 30 Tops 40
Table 5: Number of Logs per Sample for each Log Type
Timber Measurement Manual
Page 28
e.g. Sample size for small sawlog = 40 logs
4.5.5 Measurement of Selected Samples
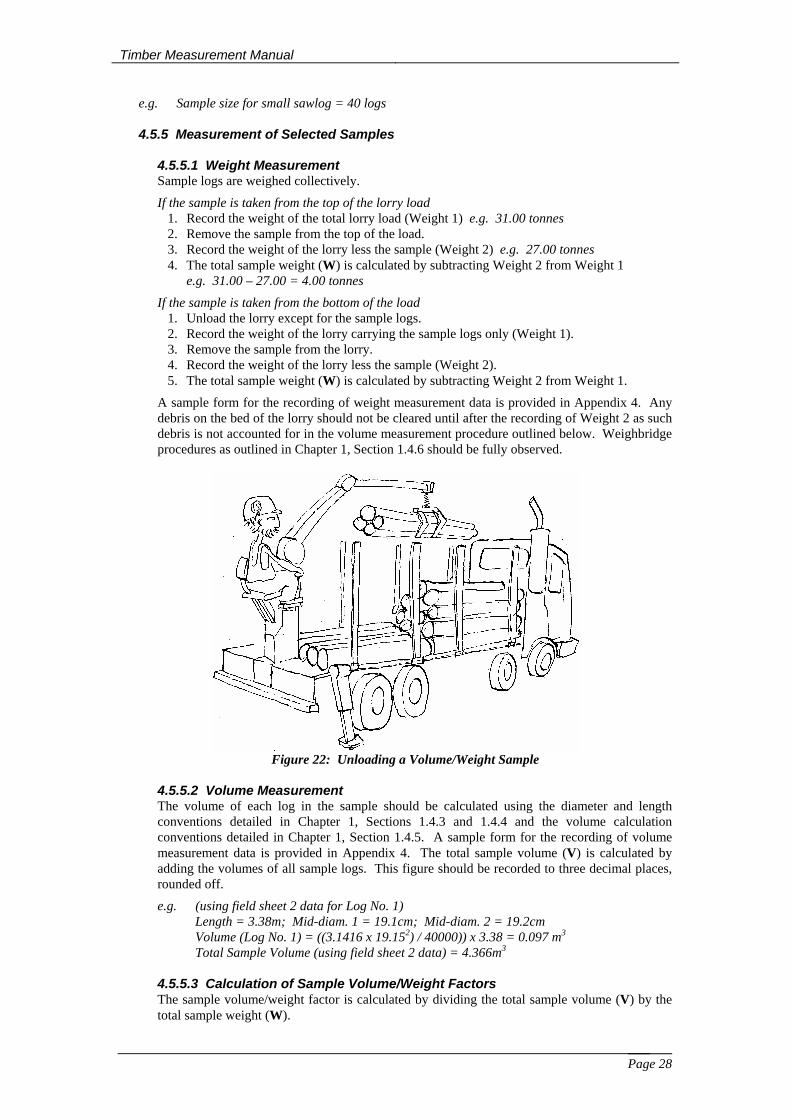
4.5.5.1 Weight Measurement Sample logs are weighed collectively.
If the sample is taken from the top of the lorry load 1. Record the weight of the total lorry load (Weight 1) e.g. 31.00 tonnes 2. Remove the sample from the top of the load. 3. Record the weight of the lorry less the sample (Weight 2) e.g. 27.00 tonnes 4. The total sample weight (W) is calculated by subtracting Weight 2 from Weight 1
e.g. 31.00 – 27.00 = 4.00 tonnes
If the sample is taken from the bottom of the load 1. Unload the lorry except for the sample logs. 2. Record the weight of the lorry carrying the sample logs only (Weight 1). 3. Remove the sample from the lorry. 4. Record the weight of the lorry less the sample (Weight 2). 5. The total sample weight (W) is calculated by subtracting Weight 2 from Weight 1.
A sample form for the recording of weight measurement data is provided in Appendix 4. Any debris on the bed of the lorry should not be cleared until after the recording of Weight 2 as such debris is not accounted for in the volume measurement procedure outlined below. Weighbridge procedures as outlined in Chapter 1, Section 1.4.6 should be fully observed.
Figure 22: Unloading a Volume/Weight Sample
4.5.5.2 Volume Measurement The volume of each log in the sample should be calculated using the diameter and length conventions detailed in Chapter 1, Sections 1.4.3 and 1.4.4 and the volume calculation conventions detailed in Chapter 1, Section 1.4.5. A sample form for the recording of volume measurement data is provided in Appendix 4. The total sample volume (V) is calculated by adding the volumes of all sample logs. This figure should be recorded to three decimal places, rounded off.
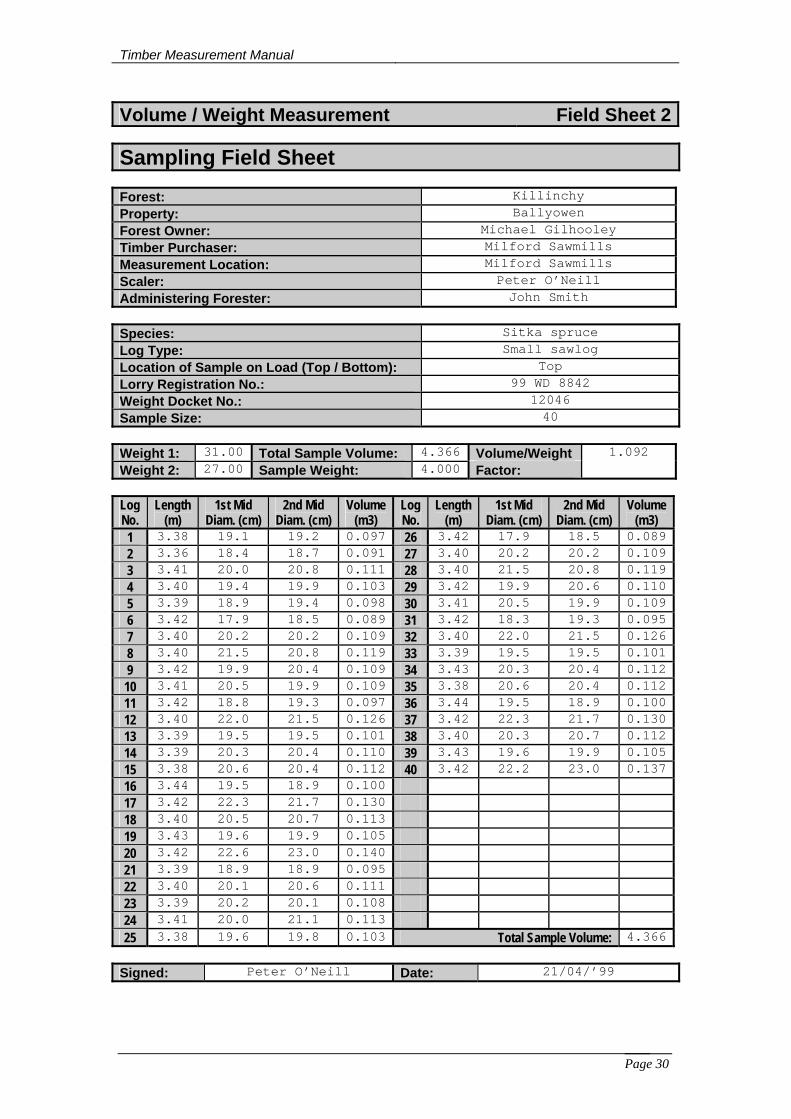
e.g. (using field sheet 2 data for Log No. 1) Length = 3.38m; Mid-diam. 1 = 19.1cm; Mid-diam. 2 = 19.2cm Volume (Log No. 1) = ((3.1416 x 19.152) / 40000)) x 3.38 = 0.097 m3
Total Sample Volume (using field sheet 2 data) = 4.366m3 4.5.5.3 Calculation of Sample Volume/Weight Factors The sample volume/weight factor is calculated by dividing the total sample volume (V) by the total sample weight (W).
Timber Measurement Manual
Page 29
e.g. Sample Volume/Weight Factor = 4.366 / 4.00 = 1.092
A sample form for the recording of volume/weight sample measurement data is provided in Appendix 4.
4.5.6 Compilation of Sampling Data and Measurement Result A summary sheet such as the one presented in Appendix 4 should be used to record the weights of all loads of timber, from any single sampling stratum, that cross the weighbridge. Section 4.5.4 of this chapter describes how such a summary sheet is used to select loads from which volume/weight samples should be taken. Such a summary sheet should also be used to record the resulting sample volume/weight factor which should then be applied to all loads of timber in that particular stratum until the next sample is taken. Using a form such as the one presented in Appendix 4 will facilitate the calculation of cumulative volume measured from any particular stratum. This should be of assistance in the administration of timber sales.
e.g. (using field sheet 3 data) The Volume/Weight Factor of 1.092 which was recorded from Load No. 1 is applied to all Load Weights until the next sample is taken. The calculation for Load No. 1 is as follows: Load No. 1 Volume = 22.34 tonnes x 1.092 = 24.395m3
On the completion of deliveries from a particular stratum, an average volume/weight factor for that stratum should be calculated. This is done by dividing the total cumulative volume by the total cumulative weight. The total cumulative volume should be called the total volume for that particular stratum.
e.g. (using field sheet 3 data) Avg. Volume/Weight Factor for SS, small sawlog = 695.221m3 / 632.90 tonnes = 1.098
On the completion of deliveries from a sale, the total sale volume is calculated by adding the total volumes of all strata
Volume / Weight Measurement Field Sheet 1
Prescription of a Sampling Fraction
Forest: Killinchy Property: Ballyowen Forest Owner: Michael Gilhooley Timber Purchaser: Milford Sawmills Measurement Location: Milford Sawmills Administering Forester: John Smith
Estimated Total Volume in Timber Sale: 1896 m3
Estimated Total Volume
in Timber Sale Required Sampling
Fraction Prescribed Sampling Fraction
( ) Less than 500m3 1 sample / 100m3
From 501m3 to 1250m3 1 sample / 150m3 Greater than 1250m3 1 sample / 250m3
Signature of Administering Forester: John Smith Date: 21/04/’99
Timber Measurement Manual
Page 30
Volume / Weight Measurement Field Sheet 2
Sampling Field Sheet
Forest: Killinchy Property: Ballyowen Forest Owner: Michael Gilhooley Timber Purchaser: Milford Sawmills Measurement Location: Milford Sawmills Scaler: Peter O’Neill Administering Forester: John Smith
Species: Sitka spruce Log Type: Small sawlog Location of Sample on Load (Top / Bottom): Top Lorry Registration No.: 99 WD 8842 Weight Docket No.: 12046 Sample Size: 40
Weight 1: 31.00 Total Sample Volume: 4.366 Volume/Weight 1.092 Weight 2: 27.00 Sample Weight: 4.000 Factor:
Log No.
Length (m)
1st Mid Diam. (cm)
2nd Mid Diam. (cm)
Volume (m3)
Log No.
Length (m)
1st Mid Diam. (cm)
2nd Mid Diam. (cm)
Volume (m3)
1 3.38 19.1 19.2 0.097 26 3.42 17.9 18.5 0.0892 3.36 18.4 18.7 0.091 27 3.40 20.2 20.2 0.1093 3.41 20.0 20.8 0.111 28 3.40 21.5 20.8 0.1194 3.40 19.4 19.9 0.103 29 3.42 19.9 20.6 0.1105 3.39 18.9 19.4 0.098 30 3.41 20.5 19.9 0.1096 3.42 17.9 18.5 0.089 31 3.42 18.3 19.3 0.0957 3.40 20.2 20.2 0.109 32 3.40 22.0 21.5 0.1268 3.40 21.5 20.8 0.119 33 3.39 19.5 19.5 0.1019 3.42 19.9 20.4 0.109 34 3.43 20.3 20.4 0.11210 3.41 20.5 19.9 0.109 35 3.38 20.6 20.4 0.11211 3.42 18.8 19.3 0.097 36 3.44 19.5 18.9 0.10012 3.40 22.0 21.5 0.126 37 3.42 22.3 21.7 0.13013 3.39 19.5 19.5 0.101 38 3.40 20.3 20.7 0.11214 3.39 20.3 20.4 0.110 39 3.43 19.6 19.9 0.10515 3.38 20.6 20.4 0.112 40 3.42 22.2 23.0 0.13716 3.44 19.5 18.9 0.100 17 3.42 22.3 21.7 0.130 18 3.40 20.5 20.7 0.113 19 3.43 19.6 19.9 0.105 20 3.42 22.6 23.0 0.140 21 3.39 18.9 18.9 0.095 22 3.40 20.1 20.6 0.111 23 3.39 20.2 20.1 0.108 24 3.41 20.0 21.1 0.113 25 3.38 19.6 19.8 0.103 Total Sample Volume: 4.366
Signed: Peter O’Neill Date: 21/04/’99
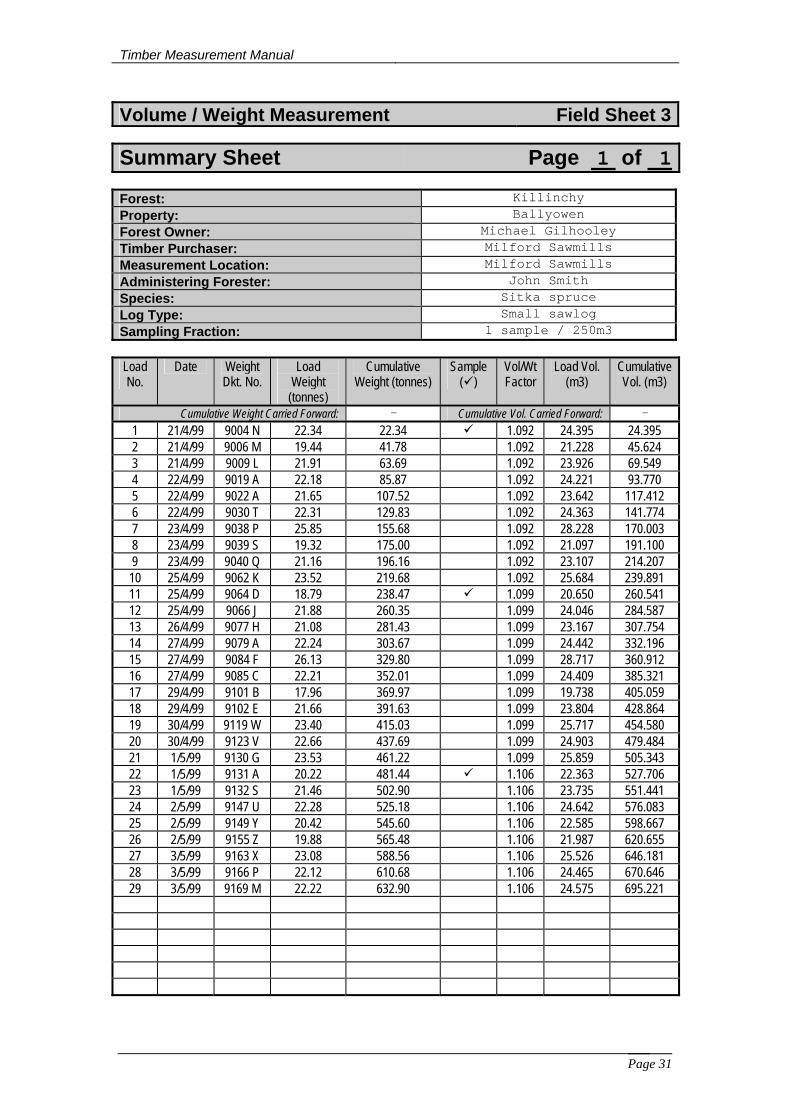
Timber Measurement Manual
Page 31
Volume / Weight Measurement Field Sheet 3
Summary Sheet Page 1 of 1
Forest: Killinchy Property: Ballyowen Forest Owner: Michael Gilhooley Timber Purchaser: Milford Sawmills Measurement Location: Milford Sawmills Administering Forester: John Smith Species: Sitka spruce Log Type: Small sawlog Sampling Fraction: 1 sample / 250m3
Load No.
Date Weight Dkt. No.
Load Weight
(tonnes)
Cumulative Weight (tonnes)
Sample ( )
Vol/Wt Factor
Load Vol. (m3)
Cumulative Vol. (m3)
Cumulative Weight Carried Forward: - Cumulative Vol. Carried Forward: -
1 21/4/99 9004 N 22.34 22.34 1.092 24.395 24.395 2 21/4/99 9006 M 19.44 41.78 1.092 21.228 45.624 3 21/4/99 9009 L 21.91 63.69 1.092 23.926 69.549 4 22/4/99 9019 A 22.18 85.87 1.092 24.221 93.770 5 22/4/99 9022 A 21.65 107.52 1.092 23.642 117.412 6 22/4/99 9030 T 22.31 129.83 1.092 24.363 141.774 7 23/4/99 9038 P 25.85 155.68 1.092 28.228 170.003 8 23/4/99 9039 S 19.32 175.00 1.092 21.097 191.100 9 23/4/99 9040 Q 21.16 196.16 1.092 23.107 214.207 10 25/4/99 9062 K 23.52 219.68 1.092 25.684 239.891 11 25/4/99 9064 D 18.79 238.47 1.099 20.650 260.541 12 25/4/99 9066 J 21.88 260.35 1.099 24.046 284.587 13 26/4/99 9077 H 21.08 281.43 1.099 23.167 307.754 14 27/4/99 9079 A 22.24 303.67 1.099 24.442 332.196 15 27/4/99 9084 F 26.13 329.80 1.099 28.717 360.912 16 27/4/99 9085 C 22.21 352.01 1.099 24.409 385.321 17 29/4/99 9101 B 17.96 369.97 1.099 19.738 405.059 18 29/4/99 9102 E 21.66 391.63 1.099 23.804 428.864 19 30/4/99 9119 W 23.40 415.03 1.099 25.717 454.580 20 30/4/99 9123 V 22.66 437.69 1.099 24.903 479.484 21 1/5/99 9130 G 23.53 461.22 1.099 25.859 505.343 22 1/5/99 9131 A 20.22 481.44 1.106 22.363 527.706 23 1/5/99 9132 S 21.46 502.90 1.106 23.735 551.441 24 2/5/99 9147 U 22.28 525.18 1.106 24.642 576.083 25 2/5/99 9149 Y 20.42 545.60 1.106 22.585 598.667 26 2/5/99 9155 Z 19.88 565.48 1.106 21.987 620.655 27 3/5/99 9163 X 23.08 588.56 1.106 25.526 646.181 28 3/5/99 9166 P 22.12 610.68 1.106 24.465 670.646 29 3/5/99 9169 M 22.22 632.90 1.106 24.575 695.221
Timber Measurement Manual
Page 32
Chapter 5: Stack Measurement 5.1 General Description Stack Measurement involves the quantification of timber volumes that are stacked at roadside, in a log yard or in log bays. There are two steps involved in Stack Measurement:
1. Measurement of the stack or gross volume i.e. the volume of the timber and gaps between it in the stack.
2. Estimation of a conversion factor to apply to the stack volume to give an estimate of solid or net volume (timber volume).
This conversion factor is variable and is influenced primarily by log quality and stacking quality: Stack Measurement is not suitable when logs are stacked in one direction only, i.e. all log butts forming one stack face and all log top ends forming the other.
5.1.1 Log Quality Curved or crooked logs occupy a greater volume of a stack than do straight logs. Logs with branch stubs protruding also result in uneven stacking and consequently a greater ratio of gaps to timber. In other words, the better the quality of product, the higher the conversion factor (net to gross volume ratio). 5.1.2 Stacking Quality The skill of the stack builder has a large influence on the resulting conversion factor. A skilled stack builder will produce stacks with higher conversion factors than those of an inexperienced stack builder. Because logs taper, it is important that stacks are built with an equal amount of logs placed in opposite directions i.e. butt to top and top to butt. Also, the more that logs are aligned together in a parallel fashion in a stack, the higher the conversion factor. The presence of debris such as branches, if not separated from logs during stack building, will tend to decrease conversion factors.
Other factors such as species, log diameter and bark will also affect the conversion factor but have little influence relative to the factors described above. 5.2 Advantages Stack Measurement is a useful means of quantifying timber stacked at roadside which has not been, or will not be, measured by another measurement system. It is thus useful for the measurement of harvested timber being sold to timber processors without a facility to measure using a mill based measurement method. Stack Measurement can be carried out quickly and is thus relatively inexpensive. Individual stacks can be measured separately which allows for the sale of different log categories to different customers from one harvest operation.
In addition to this, Stack Measurement normally involves the sale of timber on a “lump-sum” basis, i.e. all timber in the stack is paid for. This promotes the complete removal of all timber from forest roadsides.
Other than inspections by those involved in harvesting operations, there is no inherent requirement for pre-harvest measurement associated with the Stack Measurement System. 5.3 Disadvantages Stack Measurement involves the quantification of the volume of an irregularly shaped stack and the subsequent conversion of the volume of that stack into a solid timber volume. Both of these steps have associated sources of error, particularly the use of a stacked to solid volume conversion factor.
Stack Measurement requires that all logs in the stack be of the same length specification. If there are logs of different length specification in the one stack then another measurement method such as Log Measurement (Chapter 6) or Weight Measurement (Chapter 8) must be used.
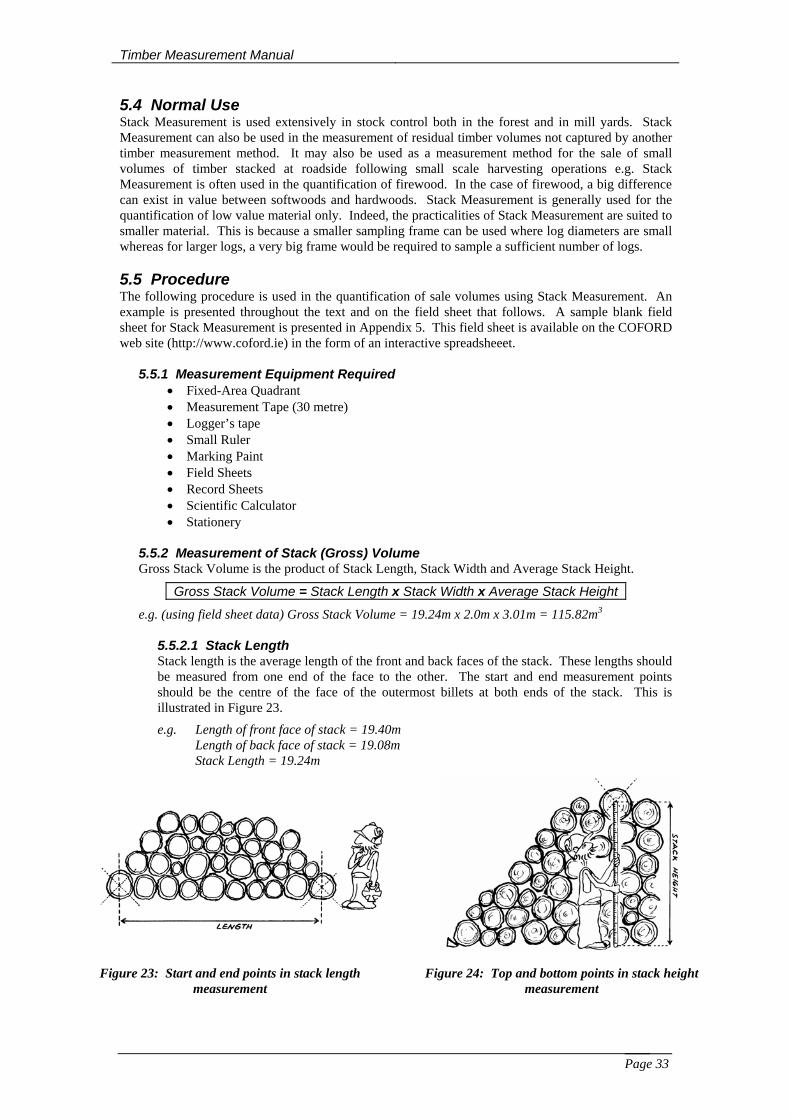
Timber Measurement Manual
Page 33
5.4 Normal Use Stack Measurement is used extensively in stock control both in the forest and in mill yards. Stack Measurement can also be used in the measurement of residual timber volumes not captured by another timber measurement method. It may also be used as a measurement method for the sale of small volumes of timber stacked at roadside following small scale harvesting operations e.g. Stack Measurement is often used in the quantification of firewood. In the case of firewood, a big difference can exist in value between softwoods and hardwoods. Stack Measurement is generally used for the quantification of low value material only. Indeed, the practicalities of Stack Measurement are suited to smaller material. This is because a smaller sampling frame can be used where log diameters are small whereas for larger logs, a very big frame would be required to sample a sufficient number of logs. 5.5 Procedure The following procedure is used in the quantification of sale volumes using Stack Measurement. An example is presented throughout the text and on the field sheet that follows. A sample blank field sheet for Stack Measurement is presented in Appendix 5. This field sheet is available on the COFORD web site (http://www.coford.ie) in the form of an interactive spreadsheeet.
5.5.1 Measurement Equipment Required • Fixed-Area Quadrant • Measurement Tape (30 metre) • Logger’s tape • Small Ruler • Marking Paint • Field Sheets • Record Sheets • Scientific Calculator • Stationery
5.5.2 Measurement of Stack (Gross) Volume Gross Stack Volume is the product of Stack Length, Stack Width and Average Stack Height.
Gross Stack Volume = Stack Length x Stack Width x Average Stack Height
e.g. (using field sheet data) Gross Stack Volume = 19.24m x 2.0m x 3.01m = 115.82m3
5.5.2.1 Stack Length Stack length is the average length of the front and back faces of the stack. These lengths should be measured from one end of the face to the other. The start and end measurement points should be the centre of the face of the outermost billets at both ends of the stack. This is illustrated in Figure 23.
e.g. Length of front face of stack = 19.40m Length of back face of stack = 19.08m Stack Length = 19.24m
Figure 23: Start and end points in stack length measurement
Figure 24: Top and bottom points in stack height measurement
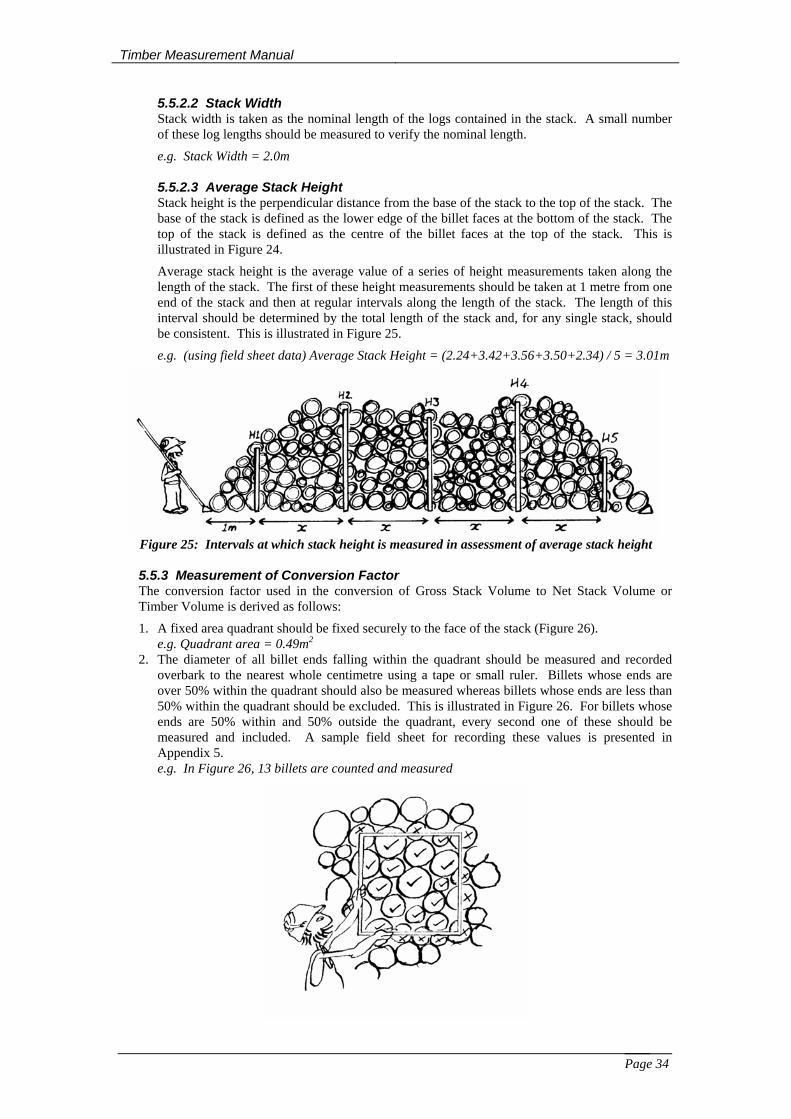
Timber Measurement Manual
Page 34
5.5.2.2 Stack Width Stack width is taken as the nominal length of the logs contained in the stack. A small number of these log lengths should be measured to verify the nominal length.
e.g. Stack Width = 2.0m 5.5.2.3 Average Stack Height Stack height is the perpendicular distance from the base of the stack to the top of the stack. The base of the stack is defined as the lower edge of the billet faces at the bottom of the stack. The top of the stack is defined as the centre of the billet faces at the top of the stack. This is illustrated in Figure 24.
Average stack height is the average value of a series of height measurements taken along the length of the stack. The first of these height measurements should be taken at 1 metre from one end of the stack and then at regular intervals along the length of the stack. The length of this interval should be determined by the total length of the stack and, for any single stack, should be consistent. This is illustrated in Figure 25.
e.g. (using field sheet data) Average Stack Height = (2.24+3.42+3.56+3.50+2.34) / 5 = 3.01m
Figure 25: Intervals at which stack height is measured in assessment of average stack height
5.5.3 Measurement of Conversion Factor The conversion factor used in the conversion of Gross Stack Volume to Net Stack Volume or Timber Volume is derived as follows:
1. A fixed area quadrant should be fixed securely to the face of the stack (Figure 26). e.g. Quadrant area = 0.49m2
2. The diameter of all billet ends falling within the quadrant should be measured and recorded overbark to the nearest whole centimetre using a tape or small ruler. Billets whose ends are over 50% within the quadrant should also be measured whereas billets whose ends are less than 50% within the quadrant should be excluded. This is illustrated in Figure 26. For billets whose ends are 50% within and 50% outside the quadrant, every second one of these should be measured and included. A sample field sheet for recording these values is presented in Appendix 5. e.g. In Figure 26, 13 billets are counted and measured

Timber Measurement Manual
Page 35
Figure 26: Billet ends to be included in quadrant
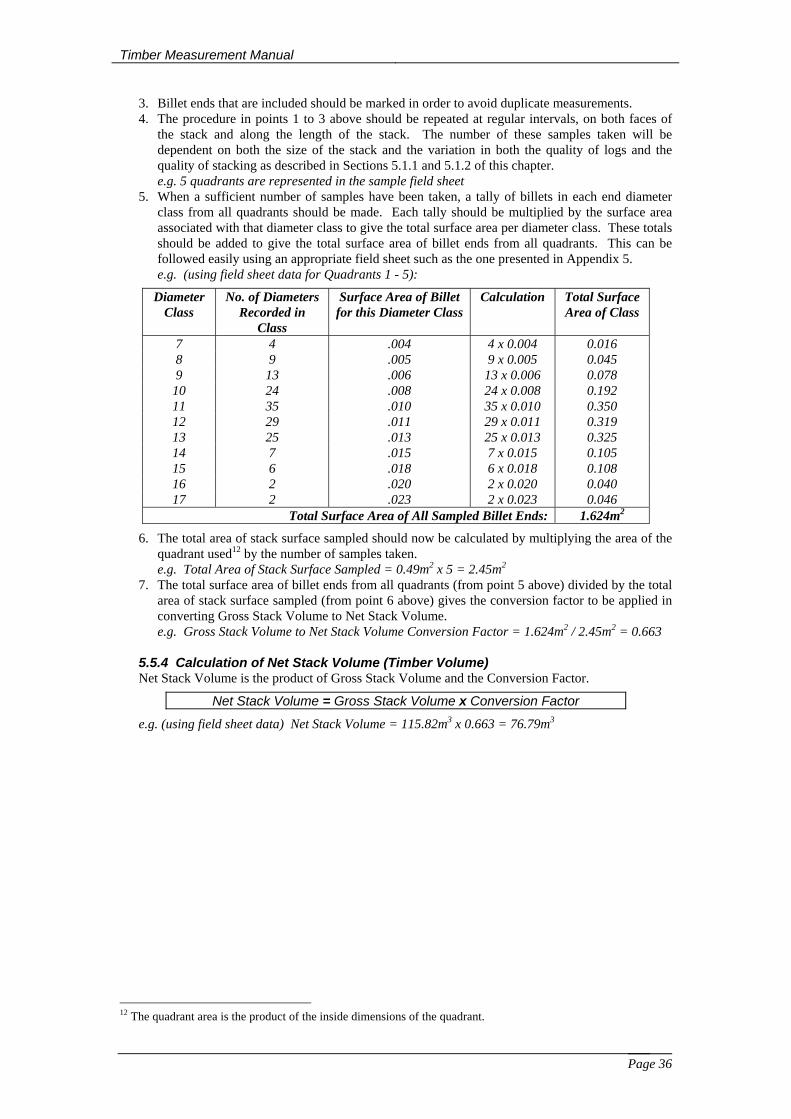
Timber Measurement Manual
Page 36
3. Billet ends that are included should be marked in order to avoid duplicate measurements. 4. The procedure in points 1 to 3 above should be repeated at regular intervals, on both faces of
the stack and along the length of the stack. The number of these samples taken will be dependent on both the size of the stack and the variation in both the quality of logs and the quality of stacking as described in Sections 5.1.1 and 5.1.2 of this chapter. e.g. 5 quadrants are represented in the sample field sheet
5. When a sufficient number of samples have been taken, a tally of billets in each end diameter class from all quadrants should be made. Each tally should be multiplied by the surface area associated with that diameter class to give the total surface area per diameter class. These totals should be added to give the total surface area of billet ends from all quadrants. This can be followed easily using an appropriate field sheet such as the one presented in Appendix 5. e.g. (using field sheet data for Quadrants 1 - 5):
Diameter Class
No. of Diameters Recorded in
Class
Surface Area of Billet for this Diameter Class
Calculation Total Surface Area of Class
7 4 .004 4 x 0.004 0.016 8 9 .005 9 x 0.005 0.045 9 13 .006 13 x 0.006 0.078
10 24 .008 24 x 0.008 0.192 11 35 .010 35 x 0.010 0.350 12 29 .011 29 x 0.011 0.319 13 25 .013 25 x 0.013 0.325 14 7 .015 7 x 0.015 0.105 15 6 .018 6 x 0.018 0.108 16 2 .020 2 x 0.020 0.040 17 2 .023 2 x 0.023 0.046
Total Surface Area of All Sampled Billet Ends: 1.624m2
6. The total area of stack surface sampled should now be calculated by multiplying the area of the quadrant used12 by the number of samples taken. e.g. Total Area of Stack Surface Sampled = 0.49m2 x 5 = 2.45m2
7. The total surface area of billet ends from all quadrants (from point 5 above) divided by the total area of stack surface sampled (from point 6 above) gives the conversion factor to be applied in converting Gross Stack Volume to Net Stack Volume. e.g. Gross Stack Volume to Net Stack Volume Conversion Factor = 1.624m2 / 2.45m2 = 0.663
5.5.4 Calculation of Net Stack Volume (Timber Volume) Net Stack Volume is the product of Gross Stack Volume and the Conversion Factor.
Net Stack Volume = Gross Stack Volume x Conversion Factor
e.g. (using field sheet data) Net Stack Volume = 115.82m3 x 0.663 = 76.79m3
12 The quadrant area is the product of the inside dimensions of the quadrant.
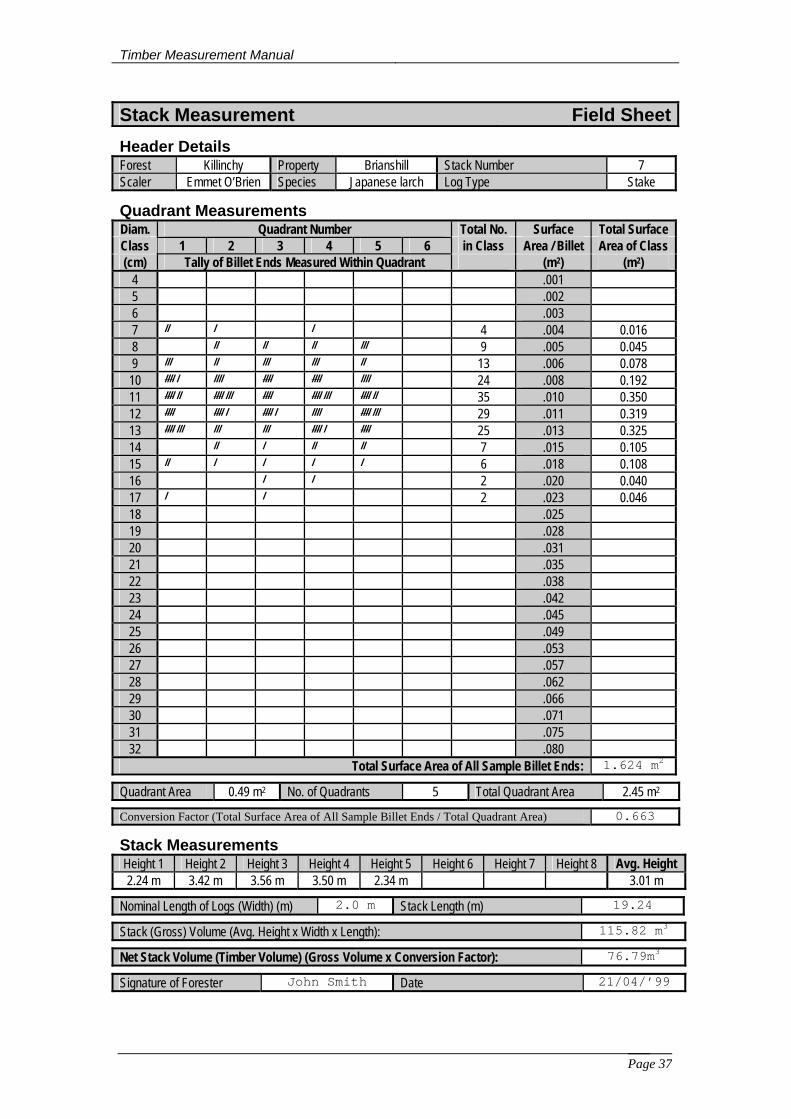
Timber Measurement Manual
Page 37
Stack Measurement Field Sheet
Header Details Forest Killinchy Property Brianshill Stack Number 7 Scaler Emmet O’Brien Species Japanese larch Log Type Stake
Quadrant Measurements Diam. Quadrant Number Total No. Surface Total Surface Class 1 2 3 4 5 6 in Class Area / Billet Area of Class (cm) Tally of Billet Ends Measured Within Quadrant (m2) (m2)
4 .001 5 .002 6 .003 7 // / / 4 .004 0.016 8 // // // /// 9 .005 0.045 9 /// // /// /// // 13 .006 0.078 10 //// / //// //// //// //// 24 .008 0.192 11 //// // //// /// //// //// /// //// // 35 .010 0.350 12 //// //// / //// / //// //// /// 29 .011 0.319 13 //// /// /// /// //// / //// 25 .013 0.325 14 // / // // 7 .015 0.105 15 // / / / / 6 .018 0.108 16 / / 2 .020 0.040 17 / / 2 .023 0.046 18 .025 19 .028 20 .031 21 .035 22 .038 23 .042 24 .045 25 .049 26 .053 27 .057 28 .062 29 .066 30 .071 31 .075 32 .080
Total Surface Area of All Sample Billet Ends: 1.624 m2
Quadrant Area 0.49 m2 No. of Quadrants 5 Total Quadrant Area 2.45 m2
Conversion Factor (Total Surface Area of All Sample Billet Ends / Total Quadrant Area) 0.663
Stack Measurements Height 1 Height 2 Height 3 Height 4 Height 5 Height 6 Height 7 Height 8 Avg. Height 2.24 m 3.42 m 3.56 m 3.50 m 2.34 m 3.01 m
Nominal Length of Logs (Width) (m) 2.0 m Stack Length (m) 19.24
Stack (Gross) Volume (Avg. Height x Width x Length): 115.82 m3
Net Stack Volume (Timber Volume) (Gross Volume x Conversion Factor): 76.79m3
Signature of Forester John Smith Date 21/04/’99
Timber Measurement Manual
Page 38
Chapter 6: Log Measurement 6.1 General Description Log Measurement involves the counting of every log and the volume measurement of a representative sample of those logs. In some cases, where the logs are of particularly high value or where the number of logs is small, sampling may not be appropriate and every log may be measured individually. 6.2 Advantages In Log Measurement, every log is counted. This means that, apart from inherent error associated with Huber’s formula (Chapter 1, Section 1.4.5), errors will normally only arise through unrepresentative sampling or through incorrect use of measurement equipment. Error is further minimised in cases where every log is measured. Sampling intensity may be increased relative to the value of the material being measured. In general, the resources required for Log Measurement are minimal. 6.3 Disadvantages Log Measurement becomes impractical when there are very large numbers of logs to be counted and measured.
The precision of Log Measurement is very much dependent on whether sampling is involved. If sampling is involved, its intensity should reflect the value of the timber being measured and the sample should also be representative of all logs in the lot. Failure to take these actions into account may reduce the precision of the total volume estimate.
Practical difficulties in this measurement system arise in cases where the timber is stacked. Firstly, the counting of logs that are stacked out of reach is difficult and secondly, the measurement of a representative sample is dependent on representative logs being available on the outer layer of the stack. The climbing of stacks for sample measurement, or for any other purpose, is potentially dangerous. 6.4 Normal Use Log Measurement is useful for the measurement of very small volumes of timber being sold to “once-off” or “occasional” buyers. It is also useful in the sale of individual logs or stems, particularly those of very high value such as hardwoods, line poles etc. Log Measurement often follows specialist harvest operations generally carried out on behalf of the timber grower. Log Measurement, like Stack Measurement, is usually carried out at roadside. Whereas Stack Measurement is generally associated with small diameter, low value material, Log Measurement is generally associated with larger material of higher value. 6.5 Procedure The following procedure is used in quantifying sale volumes using Log Measurement. An example is presented throughout the procedure and corresponds with the completed field sheet that follows. A blank sample field sheet for Log Measurement is presented in Appendix 6. This field sheet is available on the COFORD web site (http://www.coford.ie) in the form of an interactive spreadsheeet.
6.5.1 Measurement Equipment Required • Non-rounded down Calliper • Loggers Tape • Field Sheets • Scientific Calculator • Marking Paint • Stationery
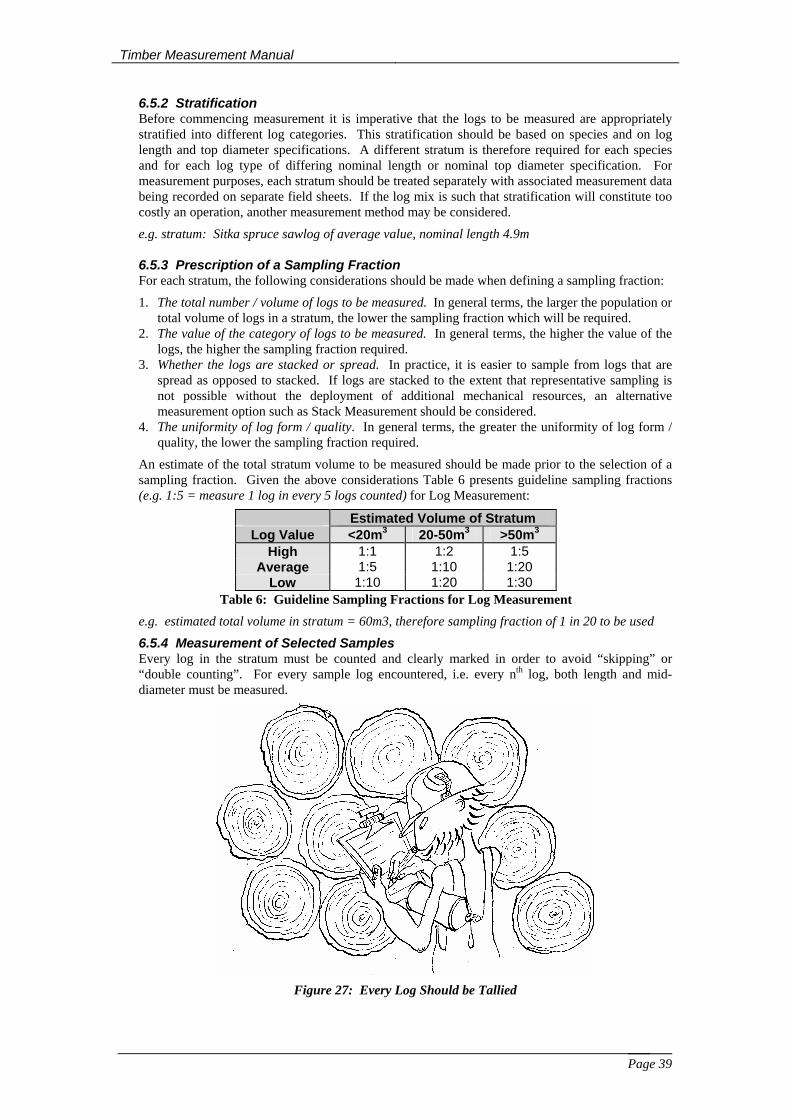
Timber Measurement Manual
Page 39
6.5.2 Stratification Before commencing measurement it is imperative that the logs to be measured are appropriately stratified into different log categories. This stratification should be based on species and on log length and top diameter specifications. A different stratum is therefore required for each species and for each log type of differing nominal length or nominal top diameter specification. For measurement purposes, each stratum should be treated separately with associated measurement data being recorded on separate field sheets. If the log mix is such that stratification will constitute too costly an operation, another measurement method may be considered.
e.g. stratum: Sitka spruce sawlog of average value, nominal length 4.9m 6.5.3 Prescription of a Sampling Fraction For each stratum, the following considerations should be made when defining a sampling fraction:
1. The total number / volume of logs to be measured. In general terms, the larger the population or total volume of logs in a stratum, the lower the sampling fraction which will be required.
2. The value of the category of logs to be measured. In general terms, the higher the value of the logs, the higher the sampling fraction required.
3. Whether the logs are stacked or spread. In practice, it is easier to sample from logs that are spread as opposed to stacked. If logs are stacked to the extent that representative sampling is not possible without the deployment of additional mechanical resources, an alternative measurement option such as Stack Measurement should be considered.
4. The uniformity of log form / quality. In general terms, the greater the uniformity of log form / quality, the lower the sampling fraction required.
An estimate of the total stratum volume to be measured should be made prior to the selection of a sampling fraction. Given the above considerations Table 6 presents guideline sampling fractions (e.g. 1:5 = measure 1 log in every 5 logs counted) for Log Measurement:
Estimated Volume of Stratum Log Value <20m3 20-50m3 >50m3
High 1:1 1:2 1:5 Average 1:5 1:10 1:20
Low 1:10 1:20 1:30 Table 6: Guideline Sampling Fractions for Log Measurement
e.g. estimated total volume in stratum = 60m3, therefore sampling fraction of 1 in 20 to be used
6.5.4 Measurement of Selected Samples Every log in the stratum must be counted and clearly marked in order to avoid “skipping” or “double counting”. For every sample log encountered, i.e. every nth log, both length and mid-diameter must be measured.
Figure 27: Every Log Should be Tallied
Timber Measurement Manual
Page 40
Length is measured as described in Chapter 1, Section 1.4.4.
Mid-diameter is measured as described in Chapter 1, Section 1.4.3.13
All measurement data should be recorded on an appropriate field sheet, such as the one presented in Appendix 6, or, if using an electronic device, saved for subsequent reporting.
e.g. All logs counted (288 in total) and sample logs measured as per field sheet Sample log No. 1: Length: 4.90m, Mid-diameter 1: 22.1cm, Mid-diameter 2: 22.3cm
6.5.5 Calculation of Volume The volume of each log sampled is calculated using Huber’s formula (Chapter 1, Section 1.4.5). The result of this calculation should also be recorded alongside the measurement data on an appropriate field sheet such as the one presented in Appendix 6.
e.g. Sample Log No. 1: Volume = ((3.1416 x 22.22) / 40000)) x 4.9 = 0.190 m3
In order to calculate the total stratum volume, the total volume of sample logs should be divided by the number of sample logs. This figure is the mean log volume and should be multiplied by the total number of logs counted to give the total volume for the stratum.
e.g. (using field sheet data) Stratum Volume = (2.440 / 14) x 288 = 50.20 m3 6.5.6 Compilation of Sampling Data and Presentation of Measurement Result In order to calculate the total sale volume, all volumes of the different strata, whether measured using Log Measurement or any of the other measurement options, should be added and presented together.
13 In some instances it may not be possible to measure two log diameters at right angles and in these cases one measurement must suffice.
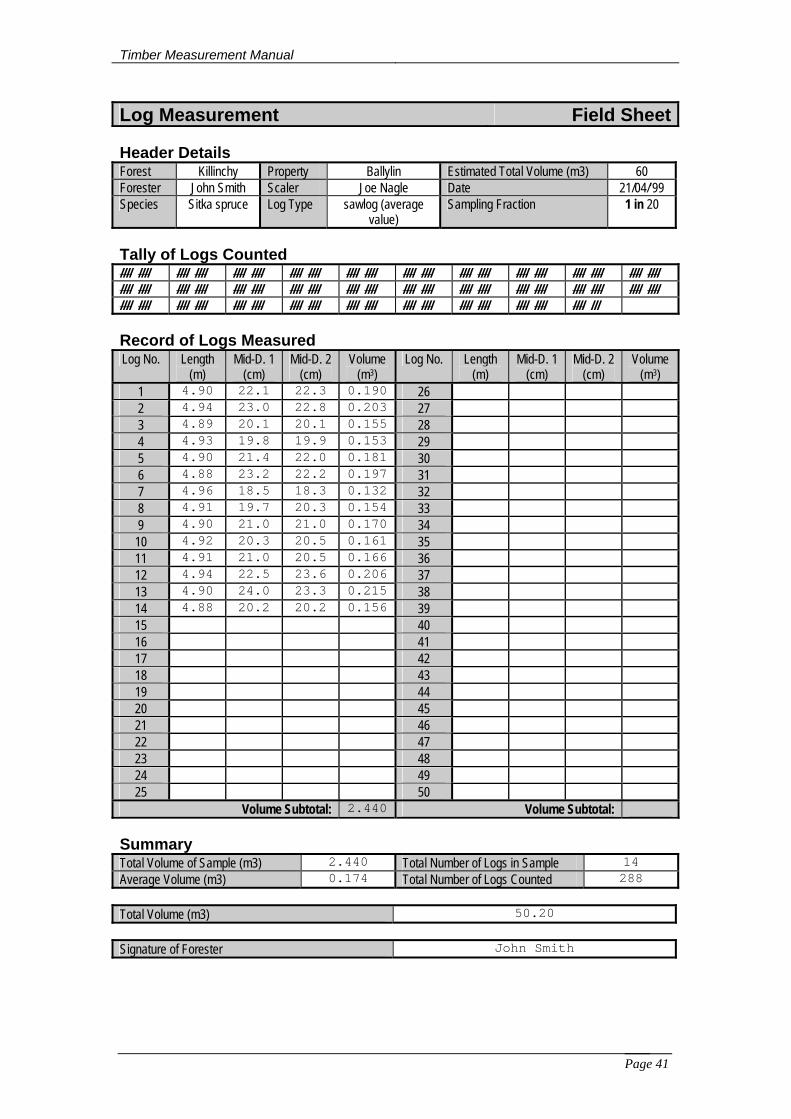
Timber Measurement Manual
Page 41
Log Measurement Field Sheet
Header Details Forest Killinchy Property Ballylin Estimated Total Volume (m3) 60 Forester John Smith Scaler Joe Nagle Date 21/04/’99 Species Sitka spruce Log Type sawlog (average
value) Sampling Fraction 1 in 20
Tally of Logs Counted //// //// //// //// //// //// //// //// //// //// //// //// //// //// //// //// //// //// //// //// //// //// //// //// //// //// //// //// //// //// //// //// //// //// //// //// //// //// //// //// //// //// //// //// //// //// //// //// //// //// //// //// //// //// //// //// //// /// Record of Logs Measured Log No. Length
(m) Mid-D. 1
(cm) Mid-D. 2
(cm) Volume
(m3) Log No. Length
(m) Mid-D. 1
(cm) Mid-D. 2
(cm) Volume
(m3) 1 4.90 22.1 22.3 0.190 26 2 4.94 23.0 22.8 0.203 27 3 4.89 20.1 20.1 0.155 28 4 4.93 19.8 19.9 0.153 29 5 4.90 21.4 22.0 0.181 30 6 4.88 23.2 22.2 0.197 31 7 4.96 18.5 18.3 0.132 32 8 4.91 19.7 20.3 0.154 33 9 4.90 21.0 21.0 0.170 34 10 4.92 20.3 20.5 0.161 35 11 4.91 21.0 20.5 0.166 36 12 4.94 22.5 23.6 0.206 37 13 4.90 24.0 23.3 0.215 38 14 4.88 20.2 20.2 0.156 39 15 40 16 41 17 42 18 43 19 44 20 45 21 46 22 47 23 48 24 49 25 50
Volume Subtotal: 2.440 Volume Subtotal:
Summary Total Volume of Sample (m3) 2.440 Total Number of Logs in Sample 14 Average Volume (m3) 0.174 Total Number of Logs Counted 288 Total Volume (m3) 50.20 Signature of Forester John Smith
Timber Measurement Manual
Page 42
Chapter 7: Oven Dry Bark Free Tonne Measurement 7.1 General Description Oven Dry Bark Free Tonne (ODBFT) Measurement involves weighing every load of timber from each sale. By applying an oven dry weight conversion factor and a bark percentage adjustment factor to green timber weight (tonnes) a corresponding ODBFT can be calculated. Oven dry weight conversion factors are generated through sampling of loads entering the mill. Bark percentage adjustment factors are agreed according to species and are based on the result of research on the bark content of pulp logs in Ireland. 7.2 Advantages The main advantage of Oven Dry Bark Free Tonne Measurement is that it is inexpensive to carry out and is efficient for the quantification of large volumes of material entering a mill on a continuous basis. This is particularly the case for low value material (pulpwood) which is generally demanded and processed in large quantities in any particular location. In addition to this, the ODBFT system provides an objective, auditable measurement which is simple yet effective. 7.3 Disadvantages Sampling within ODBFT Measurement may not be sale specific but is carried out across sales of timber from a wide range of sites. Although this has advantages in terms of ease of administration and cost saving, it means that variance about the mean conversion factor can potentially be quite high.
Another disadvantage in relation to sampling is that representative sampling is constrained by the fact that samples can only be taken from logs at the edge or top of a timber load and not from the middle of the load. Thus, there is an assumption that the edge logs are representative of the full load. However, because of the generally low value of material being purchased, the need for cost-efficiency in measurement is particularly pronounced and detailed stratification and sampling methodologies are not justifiable.
ODBFT Measurement only quantifies timber that is carried across a weighbridge. This means that unwanted timber can be left either standing, on the ground or at roadside resulting in lost revenue to the timber grower and harvesting contractor and, in the case of clearfelling, leading to reforestation difficulties. 7.4 Normal Use The ODBFT system is used to measure low value material where stand specific sampling is unsuitable. ODBFT Measurement is currently used in one large timber processing facility in Ireland. 7.5 Procedure The following procedure has been agreed for the use of this method in Ireland and should be followed without deviation. An example is presented throughout the procedure and corresponds with the data presented in the completed field sheet that follows. A blank sample field sheet for Oven Dry Bark Free Tonne Measurement is presented in Appendix 7. This field sheet is available on the COFORD web site (http://www.coford.ie) in the form of an interactive spreadsheeet.
7.5.1 Measurement Equipment Required
• Weighbridge • Chain Sampler • Plastic Bags for Sample Collection • Laboratory Oven • Electronic Balance • Aluminium Foil Trays • Field Sheets • Scientific Calculator • Stationery
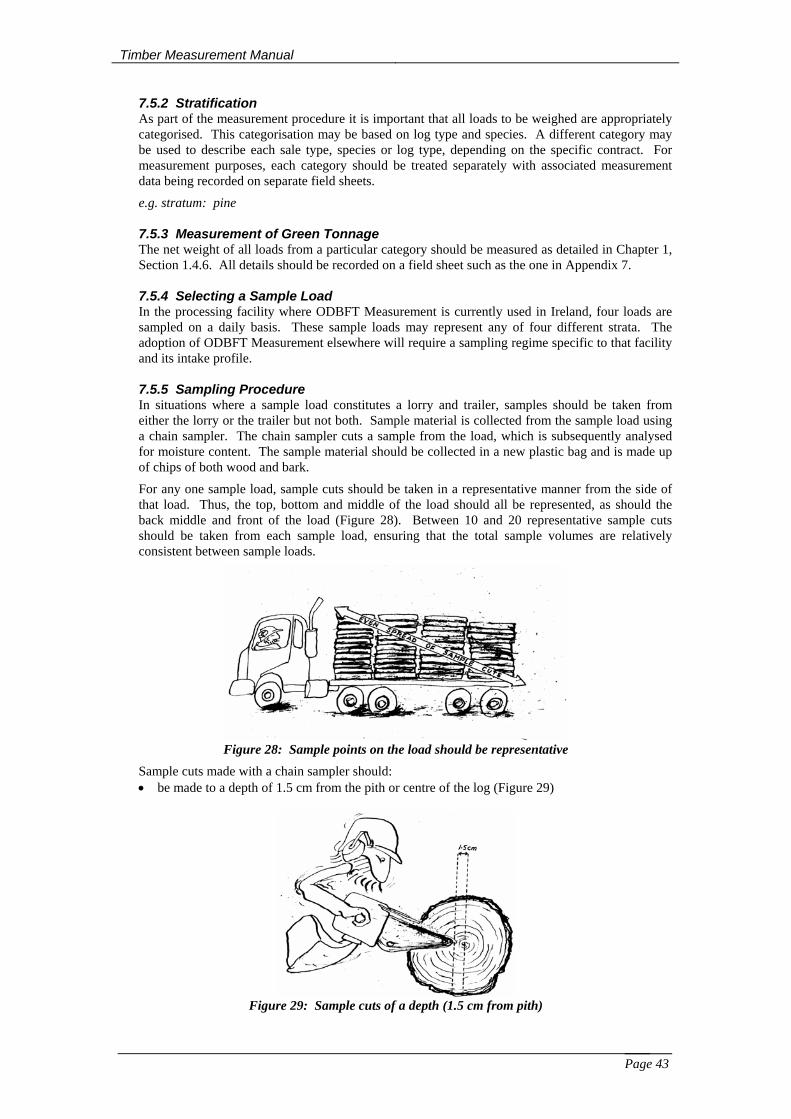
Timber Measurement Manual
Page 43
7.5.2 Stratification As part of the measurement procedure it is important that all loads to be weighed are appropriately categorised. This categorisation may be based on log type and species. A different category may be used to describe each sale type, species or log type, depending on the specific contract. For measurement purposes, each category should be treated separately with associated measurement data being recorded on separate field sheets.
e.g. stratum: pine 7.5.3 Measurement of Green Tonnage The net weight of all loads from a particular category should be measured as detailed in Chapter 1, Section 1.4.6. All details should be recorded on a field sheet such as the one in Appendix 7. 7.5.4 Selecting a Sample Load In the processing facility where ODBFT Measurement is currently used in Ireland, four loads are sampled on a daily basis. These sample loads may represent any of four different strata. The adoption of ODBFT Measurement elsewhere will require a sampling regime specific to that facility and its intake profile. 7.5.5 Sampling Procedure In situations where a sample load constitutes a lorry and trailer, samples should be taken from either the lorry or the trailer but not both. Sample material is collected from the sample load using a chain sampler. The chain sampler cuts a sample from the load, which is subsequently analysed for moisture content. The sample material should be collected in a new plastic bag and is made up of chips of both wood and bark.
For any one sample load, sample cuts should be taken in a representative manner from the side of that load. Thus, the top, bottom and middle of the load should all be represented, as should the back middle and front of the load (Figure 28). Between 10 and 20 representative sample cuts should be taken from each sample load, ensuring that the total sample volumes are relatively consistent between sample loads.
Figure 28: Sample points on the load should be representative
Sample cuts made with a chain sampler should: • be made to a depth of 1.5 cm from the pith or centre of the log (Figure 29)
Figure 29: Sample cuts of a depth (1.5 cm from pith)

Timber Measurement Manual
Page 44
• be distributed systematically along all sections of logs i.e. top, middle and bottom (Figure 30) • not be concentrated at either the ends or the middle of logs (Figure 31)
Figure 30: Sample cuts should be well distributed on sample
logs Figure 31: Sample cuts should not be concentrated on one
part of log When sampling is finished, the plastic bag should be immediately sealed in order to prevent drying out of the sample. 7.5.6 Analysis of Moisture Content Immediately following the collection of the sample, the analysis of moisture content should take place. This involves the use of an electronic balance and a laboratory oven. Both of these pieces of equipment must be operated, maintained and calibrated as per the manufacturer’s specifications. Analysis of moisture content involves the following steps: 1. A clean, dry aluminium foil tray should be placed on the electronic balance and its weight
determined and recorded in grams to two decimal places. e.g. weight of tray: 24.30 grams
2. The electronic balance should then be zeroed.
3. The recently collected sample material should be transferred from the plastic bag to the tray and the empty plastic bag discarded.
4. The wet weight of the sample material should be determined and recorded in grams to two
decimal places. Care must be taken that no sample material is lost from the aluminium tray at any time. e.g. wet weight of sample material: 347.55 grams
5. The tray containing the sample material should then be placed in the oven where the
temperature is maintained at 105°C until the sample achieves constant weight (normally 24 hours). The tray should be suitably identified in the oven with details of both the time of entry to the oven and the stratum and source of the sample material.
6. After 24 hours at 105°C, the tray of sample material should be removed from the oven and
immediately weighed on the electronic balance. This weight should be recorded in grams to two decimal places. e.g. dry weight of sample material + tray: 155.55 grams
7. The previously measured weight of the aluminium tray should be subtracted from the weight of
the tray and dried sample material to give the oven dry weight of the sample material. Again, no sample material should be lost from the tray. e.g. oven dry weight of sample: 131.25 grams
8. The Moisture Content of the sample is then calculated using the following formula:
Moisture Content = (Wet Weight - Oven Dry Weight) / (Oven Dry Weight) x 100
e.g. moisture content of sample = (347.55 – 131.25) / (131.25) x 100 = 164.80
9. All data should be recorded on a field sheet such as the one presented in Appendix 7.
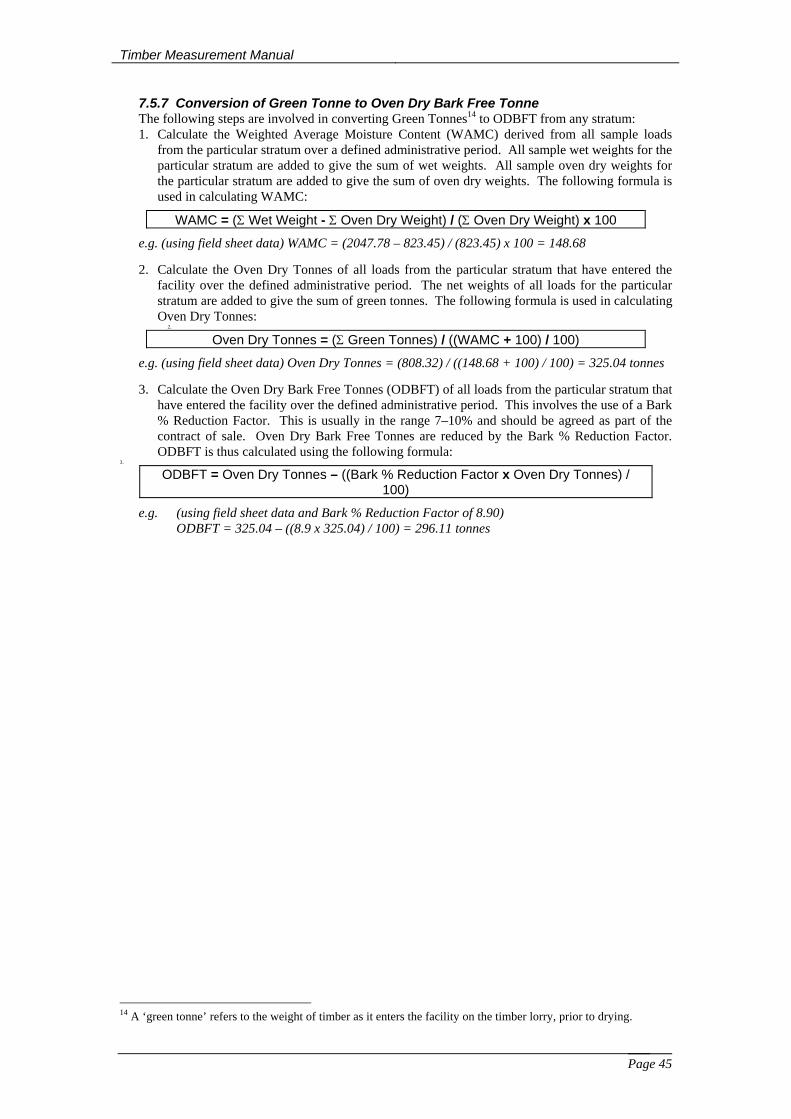
Timber Measurement Manual
Page 45
7.5.7 Conversion of Green Tonne to Oven Dry Bark Free Tonne The following steps are involved in converting Green Tonnes14 to ODBFT from any stratum: 1. Calculate the Weighted Average Moisture Content (WAMC) derived from all sample loads
from the particular stratum over a defined administrative period. All sample wet weights for the particular stratum are added to give the sum of wet weights. All sample oven dry weights for the particular stratum are added to give the sum of oven dry weights. The following formula is used in calculating WAMC:
WAMC = (Σ Wet Weight - Σ Oven Dry Weight) / (Σ Oven Dry Weight) x 100
e.g. (using field sheet data) WAMC = (2047.78 – 823.45) / (823.45) x 100 = 148.68
2. Calculate the Oven Dry Tonnes of all loads from the particular stratum that have entered the facility over the defined administrative period. The net weights of all loads for the particular stratum are added to give the sum of green tonnes. The following formula is used in calculating Oven Dry Tonnes:
2.
Oven Dry Tonnes = (Σ Green Tonnes) / ((WAMC + 100) / 100)
e.g. (using field sheet data) Oven Dry Tonnes = (808.32) / ((148.68 + 100) / 100) = 325.04 tonnes
3. Calculate the Oven Dry Bark Free Tonnes (ODBFT) of all loads from the particular stratum that have entered the facility over the defined administrative period. This involves the use of a Bark % Reduction Factor. This is usually in the range 7–10% and should be agreed as part of the contract of sale. Oven Dry Bark Free Tonnes are reduced by the Bark % Reduction Factor. ODBFT is thus calculated using the following formula:
3.
ODBFT = Oven Dry Tonnes – ((Bark % Reduction Factor x Oven Dry Tonnes) / 100)
e.g. (using field sheet data and Bark % Reduction Factor of 8.90) ODBFT = 325.04 – ((8.9 x 325.04) / 100) = 296.11 tonnes
14 A ‘green tonne’ refers to the weight of timber as it enters the facility on the timber lorry, prior to drying.
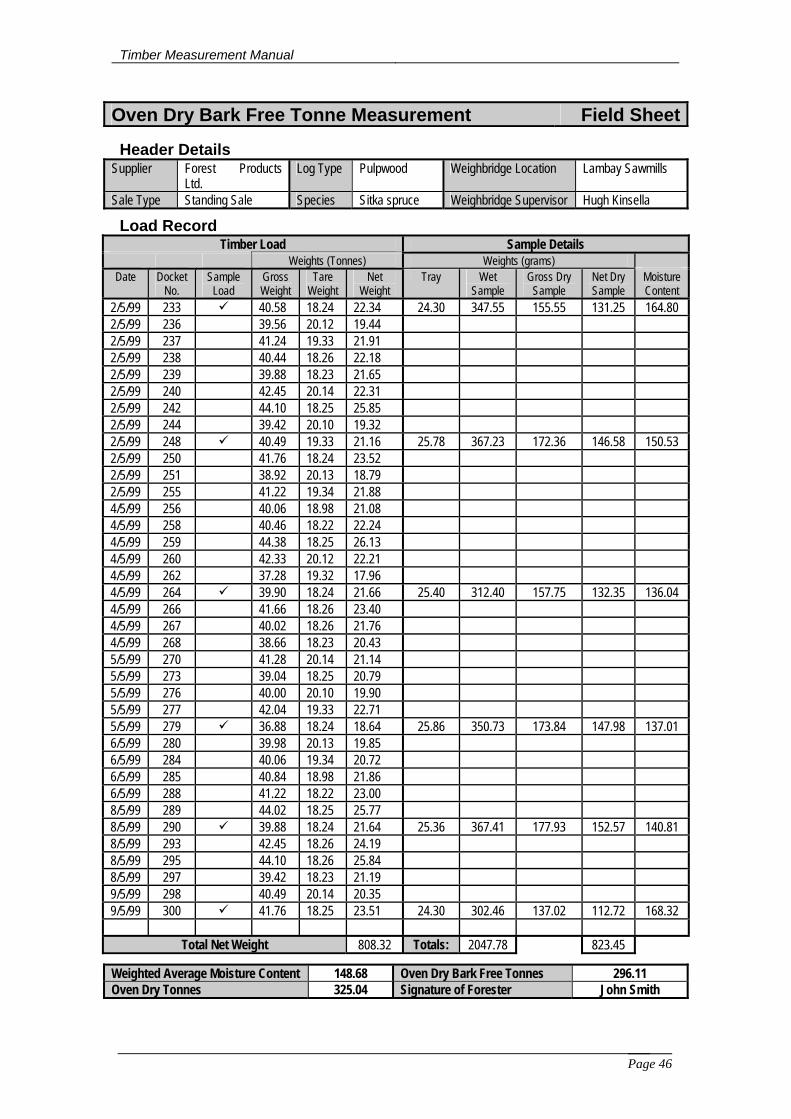
Timber Measurement Manual
Page 46
Oven Dry Bark Free Tonne Measurement Field Sheet
Header Details Supplier Forest Products
Ltd. Log Type Pulpwood Weighbridge Location Lambay Sawmills
Sale Type Standing Sale Species Sitka spruce Weighbridge Supervisor Hugh Kinsella
Load Record Timber Load Sample Details
Weights (Tonnes) Weights (grams) Date Docket
No. Sample
Load Gross Weight
Tare Weight
Net Weight
Tray Wet Sample
Gross Dry Sample
Net Dry Sample
Moisture Content
2/5/99 233 40.58 18.24 22.34 24.30 347.55 155.55 131.25 164.80 2/5/99 236 39.56 20.12 19.44 2/5/99 237 41.24 19.33 21.91 2/5/99 238 40.44 18.26 22.18 2/5/99 239 39.88 18.23 21.65 2/5/99 240 42.45 20.14 22.31 2/5/99 242 44.10 18.25 25.85 2/5/99 244 39.42 20.10 19.32 2/5/99 248 40.49 19.33 21.16 25.78 367.23 172.36 146.58 150.53 2/5/99 250 41.76 18.24 23.52 2/5/99 251 38.92 20.13 18.79 2/5/99 255 41.22 19.34 21.88 4/5/99 256 40.06 18.98 21.08 4/5/99 258 40.46 18.22 22.24 4/5/99 259 44.38 18.25 26.13 4/5/99 260 42.33 20.12 22.21 4/5/99 262 37.28 19.32 17.96 4/5/99 264 39.90 18.24 21.66 25.40 312.40 157.75 132.35 136.04 4/5/99 266 41.66 18.26 23.40 4/5/99 267 40.02 18.26 21.76 4/5/99 268 38.66 18.23 20.43 5/5/99 270 41.28 20.14 21.14 5/5/99 273 39.04 18.25 20.79 5/5/99 276 40.00 20.10 19.90 5/5/99 277 42.04 19.33 22.71 5/5/99 279 36.88 18.24 18.64 25.86 350.73 173.84 147.98 137.01 6/5/99 280 39.98 20.13 19.85 6/5/99 284 40.06 19.34 20.72 6/5/99 285 40.84 18.98 21.86 6/5/99 288 41.22 18.22 23.00 8/5/99 289 44.02 18.25 25.77 8/5/99 290 39.88 18.24 21.64 25.36 367.41 177.93 152.57 140.81 8/5/99 293 42.45 18.26 24.19 8/5/99 295 44.10 18.26 25.84 8/5/99 297 39.42 18.23 21.19 9/5/99 298 40.49 20.14 20.35 9/5/99 300 41.76 18.25 23.51 24.30 302.46 137.02 112.72 168.32
Total Net Weight 808.32 Totals: 2047.78 823.45
Weighted Average Moisture Content 148.68 Oven Dry Bark Free Tonnes 296.11 Oven Dry Tonnes 325.04 Signature of Forester John Smith
Timber Measurement Manual
Page 47
Chapter 8: Weight Measurement 8.1 General Description Weight Measurement involves the weighing of every load of timber from each sale. Quantities of timber are then expressed in tonnes or, in some cases, in cubic metres15. There are many variables, which affect the weight of timber and are a feature of Weight Measurement:
a) Time since felling e) Log type b) Species f) Season c) Site type h) Forest management d) Climate i) Log handling
These variables must be considered by those involved in timber sales using Weight Measurement. 8.2 Advantages The main advantage of Weight Measurement is that it is inexpensive to carry out. Weight Measurement requires minimal professional input and facilitates the quantification of large volumes of material entering a mill on a continuous basis. This is particularly the case for low value material (pulpwood) which is generally delivered to and processed in large quantities at a single location. 8.3 Disadvantages Following an agreement to sell timber using Weight Measurement, timber weight, for any fixed volume, may change. In general terms, the longer the delay between the felling and the weighing of timber, the greater the change in weight. Thus, the use of a unit other than volume in the quantification of timber, may be seen by some parties as a disadvantage. The variability of weight makes comparisons with volume difficult. Weight Measurement only quantifies timber that is carried across a weighbridge. This may not necessarily be the same quantity as that which was allocated standing to this sale or that which was harvested. Thus, careful supervision and follow up procedures are required to ensure that as much available material as is possible is removed from the harvest site. 8.4 Normal Use Weight Measurement is used to measure low value material in situations where either resources for other measurement methods are unavailable or where their use is not considered cost-effective. In general terms, Weight Measurement is used simply to quantify the amount of timber sold. The unit value of this timber should have been previously agreed. This valuation may have been based on some form of pre-harvest measurement. Such pre-harvest measurement usually includes an estimate of mean DBH (Appendix 1). 8.5 Procedure The following procedure is used in quantifying timber using Weight Measurement. An example is presented throughout the procedure and in the following completed field sheet. A blank Weight Measurement field sheet is presented in Appendix 8. This field sheet is available on the COFORD web site (http://www.coford.ie) in the form of an interactive spreadsheeet.
8.5.1 Measurement Equipment Required • Weighbridge • Field Sheets • Scientific Calculator • Stationery
15 In such cases a fixed or agreed conversion factor is used in converting weight to volume.
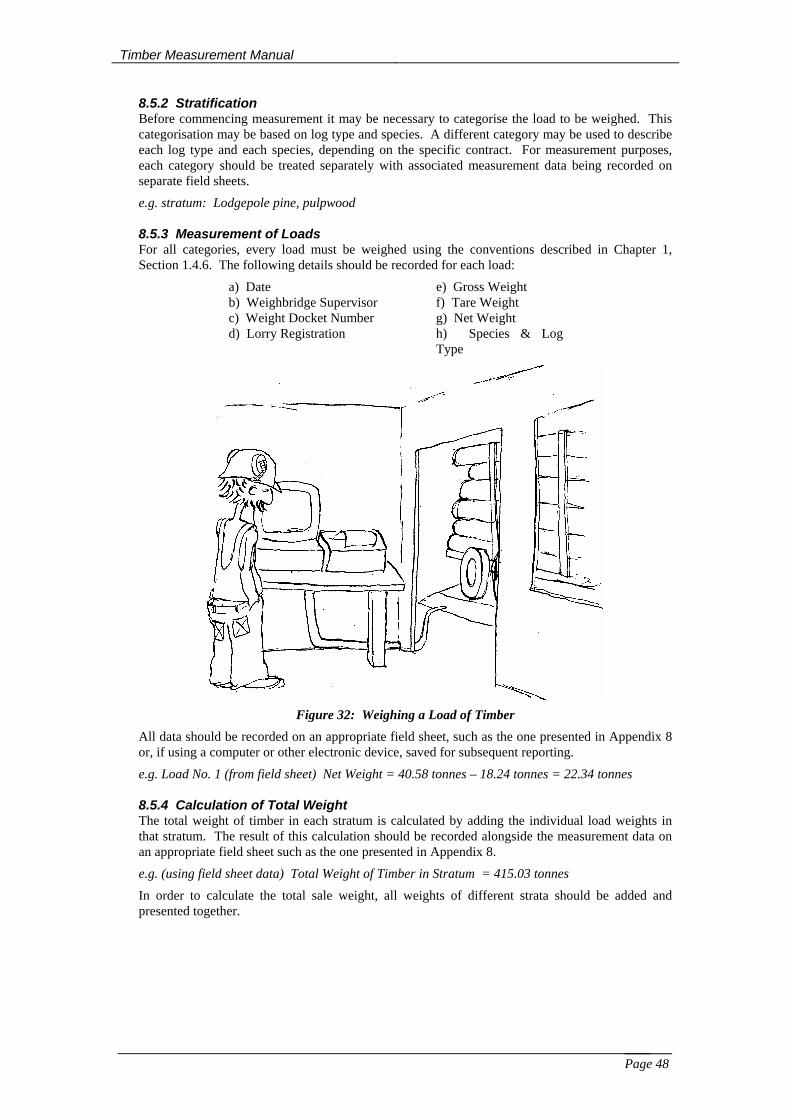
Timber Measurement Manual
Page 48
8.5.2 Stratification Before commencing measurement it may be necessary to categorise the load to be weighed. This categorisation may be based on log type and species. A different category may be used to describe each log type and each species, depending on the specific contract. For measurement purposes, each category should be treated separately with associated measurement data being recorded on separate field sheets.
e.g. stratum: Lodgepole pine, pulpwood 8.5.3 Measurement of Loads For all categories, every load must be weighed using the conventions described in Chapter 1, Section 1.4.6. The following details should be recorded for each load:
a) Date e) Gross Weight b) Weighbridge Supervisor f) Tare Weight c) Weight Docket Number g) Net Weight d) Lorry Registration h) Species & Log
Type
Figure 32: Weighing a Load of Timber
All data should be recorded on an appropriate field sheet, such as the one presented in Appendix 8 or, if using a computer or other electronic device, saved for subsequent reporting.
e.g. Load No. 1 (from field sheet) Net Weight = 40.58 tonnes – 18.24 tonnes = 22.34 tonnes 8.5.4 Calculation of Total Weight The total weight of timber in each stratum is calculated by adding the individual load weights in that stratum. The result of this calculation should be recorded alongside the measurement data on an appropriate field sheet such as the one presented in Appendix 8.
e.g. (using field sheet data) Total Weight of Timber in Stratum = 415.03 tonnes
In order to calculate the total sale weight, all weights of different strata should be added and presented together.
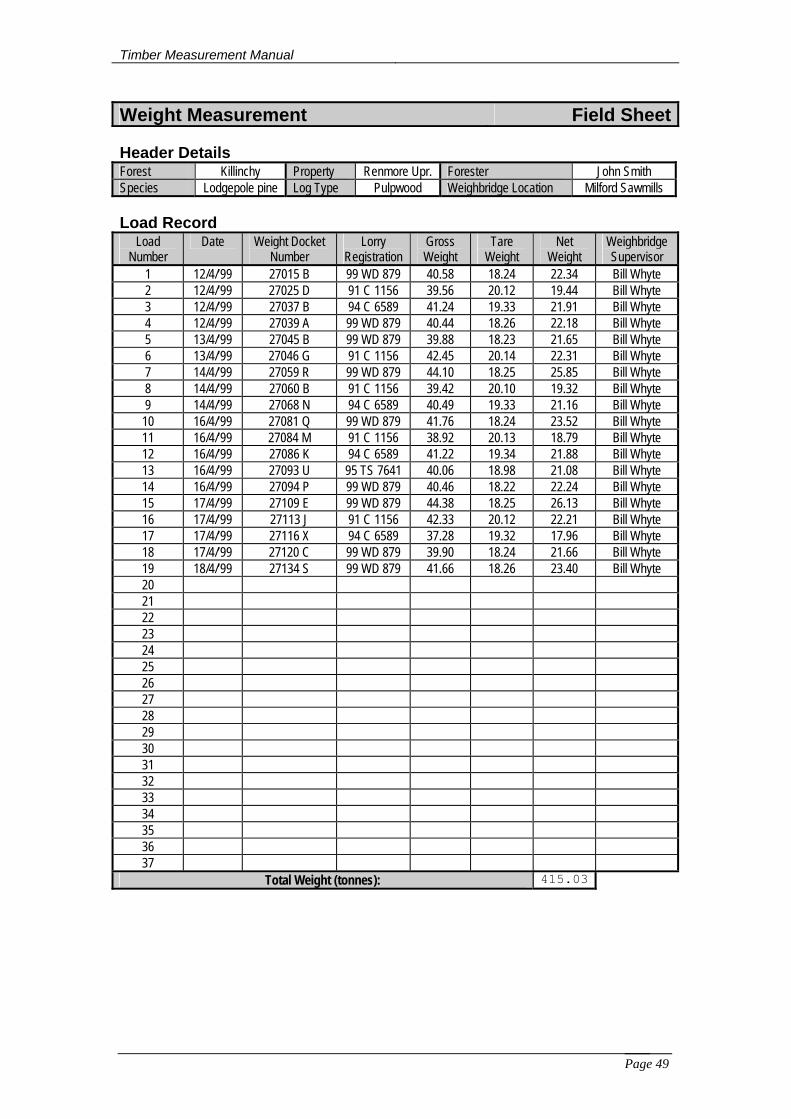
Timber Measurement Manual
Page 49
Weight Measurement Field Sheet
Header Details Forest Killinchy Property Renmore Upr. Forester John Smith Species Lodgepole pine Log Type Pulpwood Weighbridge Location Milford Sawmills Load Record
Load Number
Date Weight Docket Number
Lorry Registration
Gross Weight
Tare Weight
Net Weight
Weighbridge Supervisor
1 12/4/’99 27015 B 99 WD 879 40.58 18.24 22.34 Bill Whyte 2 12/4/’99 27025 D 91 C 1156 39.56 20.12 19.44 Bill Whyte 3 12/4/’99 27037 B 94 C 6589 41.24 19.33 21.91 Bill Whyte 4 12/4/’99 27039 A 99 WD 879 40.44 18.26 22.18 Bill Whyte 5 13/4/’99 27045 B 99 WD 879 39.88 18.23 21.65 Bill Whyte 6 13/4/’99 27046 G 91 C 1156 42.45 20.14 22.31 Bill Whyte 7 14/4/’99 27059 R 99 WD 879 44.10 18.25 25.85 Bill Whyte 8 14/4/’99 27060 B 91 C 1156 39.42 20.10 19.32 Bill Whyte 9 14/4/’99 27068 N 94 C 6589 40.49 19.33 21.16 Bill Whyte 10 16/4/’99 27081 Q 99 WD 879 41.76 18.24 23.52 Bill Whyte 11 16/4/’99 27084 M 91 C 1156 38.92 20.13 18.79 Bill Whyte 12 16/4/’99 27086 K 94 C 6589 41.22 19.34 21.88 Bill Whyte 13 16/4/’99 27093 U 95 TS 7641 40.06 18.98 21.08 Bill Whyte 14 16/4/’99 27094 P 99 WD 879 40.46 18.22 22.24 Bill Whyte 15 17/4/’99 27109 E 99 WD 879 44.38 18.25 26.13 Bill Whyte 16 17/4/’99 27113 J 91 C 1156 42.33 20.12 22.21 Bill Whyte 17 17/4/’99 27116 X 94 C 6589 37.28 19.32 17.96 Bill Whyte 18 17/4/’99 27120 C 99 WD 879 39.90 18.24 21.66 Bill Whyte 19 18/4/’99 27134 S 99 WD 879 41.66 18.26 23.40 Bill Whyte 20 21 22 23 24 25 26 27 28 29 30 31 32 33 34 35 36 37
Total Weight (tonnes): 415.03
Timber Measurement Manual
Page 50
Chapter 9: Volume/Weight Measurement With Reduced Stratification (VWRS Measurement) 9.1 General Description Like Volume/Weight Measurement and Weight Measurement, Volume/Weight Measurement with Reduced Stratification (VWRS Measurement) involves the weighing of every load of timber from each sale. However, it differs from Volume/Weight Measurement in the following ways:
1. No prior stratification of timber to be measured is carried out. However, the nature of the facilities that use VWRS Measurement means that all material is generally of one log category. Also, species are often carried separately as this is generally how they are produced in the wood.
2. Sample sizes are smaller. 3. Logs are weighed separately on a single log scales as opposed to collectively on a weighbridge.
VWRS Measurement differs from Weight Measurement in that a conversion factor converting tonnage to volume is calculated and applied. 9.2 Advantages The main advantage of VWRS Measurement is that it is relatively inexpensive to carry out. Because of the extensive system of sampling employed, VWRS Measurement facilitates the quantification of large volumes of material entering a processing facility on a continuous basis. This is particularly the case for low value material (pulpwood) which is generally demanded and processed in large quantities in any particular location. 9.3 Disadvantages VWRS Measurement only quantifies timber that is carried across a weighbridge. This means that unwanted timber can be left either standing, on the ground or at roadside resulting in lost revenue to the timber grower and harvesting contractor and, in the case of clearfelling, leading to reforestation difficulties.
Sampling within VWRS measurement may not be sale specific but is carried out across sales of timber from a wide range of sites. Although this has advantages in terms of ease of administration and cost saving, it means that variance about the mean conversion factor can potentially be quite high.
In order to avoid a build up of previously measured sample logs, VWRS Measurement locations require a facility for the prompt removal of sample logs following sample measurement. 9.4 Normal Use VWRS Measurement is used to measure low value material where stand specific sampling is unsuitable. VWRS Measurement is currently used in two large timber processing facilities in Ireland. 9.5 Procedure The following procedure is used in quantifying timber using VWRS Measurement. An example is presented throughout the procedure and corresponds with the completed field sheets that follow. Blank sample field sheets for VWRS Measurement are presented in Appendix 9. These field sheets are available on the COFORD web site (http://www.coford.ie) in the form of interactive spreadsheeets.
9.5.1 Measurement Equipment Required • Weighbridge • Single Log Scales • Callipers • Field Sheets • Scientific Calculator • Logger’s Tape • Stationery
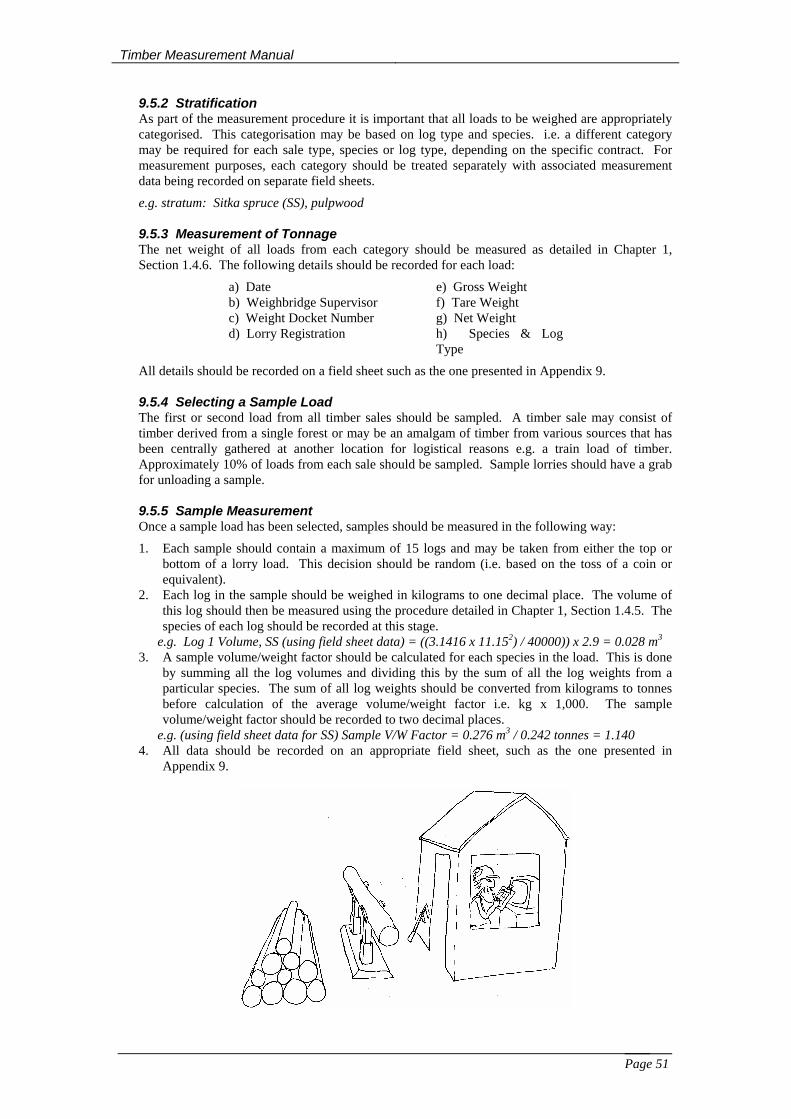
Timber Measurement Manual
Page 51
9.5.2 Stratification As part of the measurement procedure it is important that all loads to be weighed are appropriately categorised. This categorisation may be based on log type and species. i.e. a different category may be required for each sale type, species or log type, depending on the specific contract. For measurement purposes, each category should be treated separately with associated measurement data being recorded on separate field sheets.
e.g. stratum: Sitka spruce (SS), pulpwood 9.5.3 Measurement of Tonnage The net weight of all loads from each category should be measured as detailed in Chapter 1, Section 1.4.6. The following details should be recorded for each load:
a) Date e) Gross Weight b) Weighbridge Supervisor f) Tare Weight c) Weight Docket Number g) Net Weight d) Lorry Registration h) Species & Log
Type
All details should be recorded on a field sheet such as the one presented in Appendix 9. 9.5.4 Selecting a Sample Load The first or second load from all timber sales should be sampled. A timber sale may consist of timber derived from a single forest or may be an amalgam of timber from various sources that has been centrally gathered at another location for logistical reasons e.g. a train load of timber. Approximately 10% of loads from each sale should be sampled. Sample lorries should have a grab for unloading a sample. 9.5.5 Sample Measurement Once a sample load has been selected, samples should be measured in the following way:
1. Each sample should contain a maximum of 15 logs and may be taken from either the top or bottom of a lorry load. This decision should be random (i.e. based on the toss of a coin or equivalent).
2. Each log in the sample should be weighed in kilograms to one decimal place. The volume of this log should then be measured using the procedure detailed in Chapter 1, Section 1.4.5. The species of each log should be recorded at this stage.
e.g. Log 1 Volume, SS (using field sheet data) = ((3.1416 x 11.152) / 40000)) x 2.9 = 0.028 m3 3. A sample volume/weight factor should be calculated for each species in the load. This is done
by summing all the log volumes and dividing this by the sum of all the log weights from a particular species. The sum of all log weights should be converted from kilograms to tonnes before calculation of the average volume/weight factor i.e. kg x 1,000. The sample volume/weight factor should be recorded to two decimal places.
e.g. (using field sheet data for SS) Sample V/W Factor = 0.276 m3 / 0.242 tonnes = 1.140 4. All data should be recorded on an appropriate field sheet, such as the one presented in
Appendix 9.

Timber Measurement Manual
Page 52
Figure 33: Operating a Single Log Scales

Timber Measurement Manual
Page 53
9.5.6 Calculation of Total Volume At the end of the sale period, an average volume/weight factor is calculated for each species sampled in that period. The average volume/weight factor is calculated by dividing the sum of all sample volumes by the sum of all sample weights collected for that species during that period. These factors are applied to all tonnage from respective species for that period. The total tonnage of timber from each species is calculated by summing the individual load weights for that species. The total volume of timber from each species is calculated by multiplying the total tonnage by the average volume/weight factor for that species. The results of these calculations should be recorded alongside the measurement data on an appropriate field sheet such as the one presented in Appendix 9.
e.g. (using field sheet data) Average SS Volume / Weight Factor = 1.121 Total SS Volume in Sale Period = 764.46 tonnes x 1.121 = 857 m3
In order to calculate the total sale volume, all volumes from different species should be added and presented together.
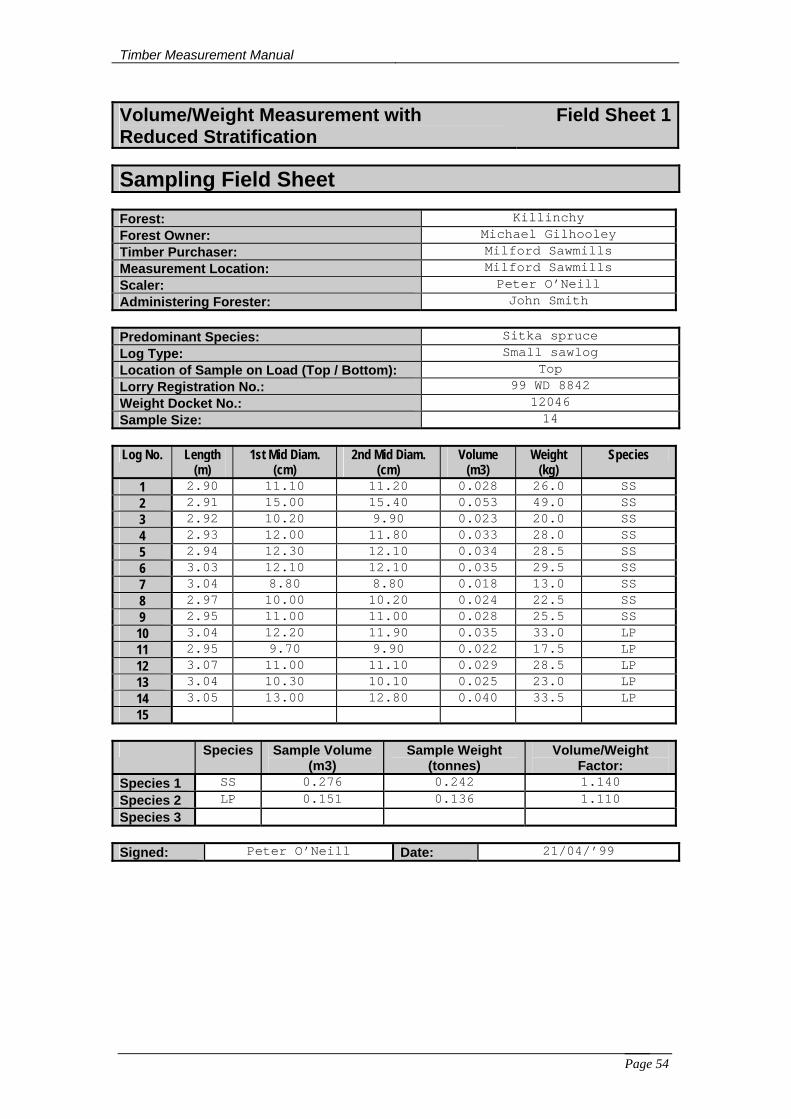
Timber Measurement Manual
Page 54
Volume/Weight Measurement with Reduced Stratification
Field Sheet 1
Sampling Field Sheet
Forest: Killinchy Forest Owner: Michael Gilhooley Timber Purchaser: Milford Sawmills Measurement Location: Milford Sawmills Scaler: Peter O’Neill Administering Forester: John Smith
Predominant Species: Sitka spruce Log Type: Small sawlog Location of Sample on Load (Top / Bottom): Top Lorry Registration No.: 99 WD 8842 Weight Docket No.: 12046 Sample Size: 14
Log No. Length
(m) 1st Mid Diam.
(cm) 2nd Mid Diam.
(cm) Volume
(m3) Weight
(kg) Species
1 2.90 11.10 11.20 0.028 26.0 SS 2 2.91 15.00 15.40 0.053 49.0 SS 3 2.92 10.20 9.90 0.023 20.0 SS 4 2.93 12.00 11.80 0.033 28.0 SS 5 2.94 12.30 12.10 0.034 28.5 SS 6 3.03 12.10 12.10 0.035 29.5 SS 7 3.04 8.80 8.80 0.018 13.0 SS 8 2.97 10.00 10.20 0.024 22.5 SS 9 2.95 11.00 11.00 0.028 25.5 SS 10 3.04 12.20 11.90 0.035 33.0 LP 11 2.95 9.70 9.90 0.022 17.5 LP 12 3.07 11.00 11.10 0.029 28.5 LP 13 3.04 10.30 10.10 0.025 23.0 LP 14 3.05 13.00 12.80 0.040 33.5 LP 15
Species Sample Volume
(m3) Sample Weight
(tonnes) Volume/Weight
Factor: Species 1 SS 0.276 0.242 1.140 Species 2 LP 0.151 0.136 1.110 Species 3 Signed: Peter O’Neill Date: 21/04/’99
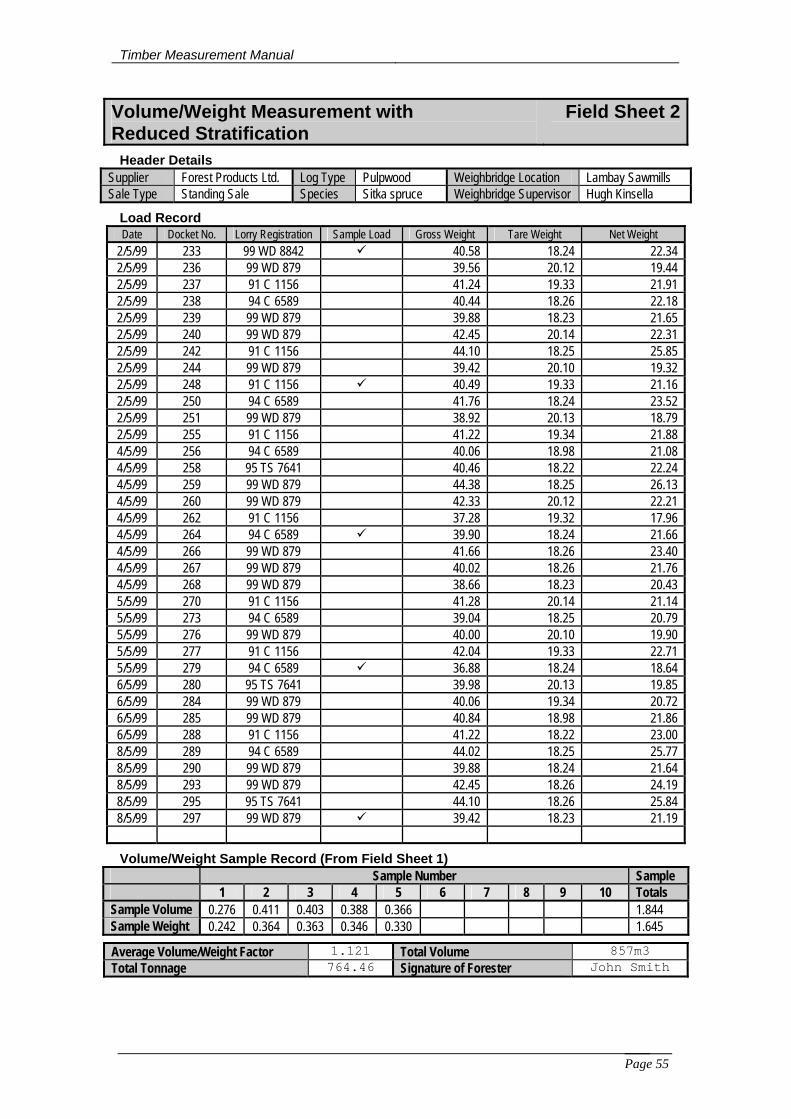
Timber Measurement Manual
Page 55
Volume/Weight Measurement with Reduced Stratification
Field Sheet 2
Header Details Supplier Forest Products Ltd. Log Type Pulpwood Weighbridge Location Lambay Sawmills Sale Type Standing Sale Species Sitka spruce Weighbridge Supervisor Hugh Kinsella
Load Record Date Docket No. Lorry Registration Sample Load Gross Weight Tare Weight Net Weight
2/5/99 233 99 WD 8842 40.58 18.24 22.34 2/5/99 236 99 WD 879 39.56 20.12 19.44 2/5/99 237 91 C 1156 41.24 19.33 21.91 2/5/99 238 94 C 6589 40.44 18.26 22.18 2/5/99 239 99 WD 879 39.88 18.23 21.65 2/5/99 240 99 WD 879 42.45 20.14 22.31 2/5/99 242 91 C 1156 44.10 18.25 25.85 2/5/99 244 99 WD 879 39.42 20.10 19.32 2/5/99 248 91 C 1156 40.49 19.33 21.16 2/5/99 250 94 C 6589 41.76 18.24 23.52 2/5/99 251 99 WD 879 38.92 20.13 18.79 2/5/99 255 91 C 1156 41.22 19.34 21.88 4/5/99 256 94 C 6589 40.06 18.98 21.08 4/5/99 258 95 TS 7641 40.46 18.22 22.24 4/5/99 259 99 WD 879 44.38 18.25 26.13 4/5/99 260 99 WD 879 42.33 20.12 22.21 4/5/99 262 91 C 1156 37.28 19.32 17.96 4/5/99 264 94 C 6589 39.90 18.24 21.66 4/5/99 266 99 WD 879 41.66 18.26 23.40 4/5/99 267 99 WD 879 40.02 18.26 21.76 4/5/99 268 99 WD 879 38.66 18.23 20.43 5/5/99 270 91 C 1156 41.28 20.14 21.14 5/5/99 273 94 C 6589 39.04 18.25 20.79 5/5/99 276 99 WD 879 40.00 20.10 19.90 5/5/99 277 91 C 1156 42.04 19.33 22.71 5/5/99 279 94 C 6589 36.88 18.24 18.64 6/5/99 280 95 TS 7641 39.98 20.13 19.85 6/5/99 284 99 WD 879 40.06 19.34 20.72 6/5/99 285 99 WD 879 40.84 18.98 21.86 6/5/99 288 91 C 1156 41.22 18.22 23.00 8/5/99 289 94 C 6589 44.02 18.25 25.77 8/5/99 290 99 WD 879 39.88 18.24 21.64 8/5/99 293 99 WD 879 42.45 18.26 24.19 8/5/99 295 95 TS 7641 44.10 18.26 25.84 8/5/99 297 99 WD 879 39.42 18.23 21.19
Volume/Weight Sample Record (From Field Sheet 1) Sample Number Sample 1 2 3 4 5 6 7 8 9 10 Totals Sample Volume 0.276 0.411 0.403 0.388 0.366 1.844 Sample Weight 0.242 0.364 0.363 0.346 0.330 1.645
Average Volume/Weight Factor 1.121 Total Volume 857m3 Total Tonnage 764.46 Signature of Forester John Smith
Timber Measurement Manual
Page 56
Glossary This glossary is included in order to define terms not already defined in the text. Accuracy The accuracy of a result refers to the closeness of that result to the
true value being sought. Accuracy can, amongst other things, be affected by conventions, defective equipment and bad practice.
Basal Area Basal Area of an individual tree is the overbark cross-sectional area of the stem at breast height (1.3m). Basal Area per hectare is the sum of the basal areas of all trees in one hectare
Bias Bias is a systematic distortion in a measurement i.e. it is a non-compensating error. Common sources of bias are defective equipment, inappropriate sample selection, inappropriate conventions and subjectivity amongst measurement personnel.
Clearfell The harvesting of all merchantable trees in a stand concurrently at the end of the rotation.
DBH Distribution The DBH Distribution of a stand of trees refers to the amount of trees in each DBH category e.g. 24 trees of DBH 15, 27 trees of DBH 16, 31 trees of DBH 17 etc.
Delivered Sale The sale of timber which incorporates delivery in addition to harvesting.
Harvester Head Measurement Harvester Head Measurement is carried out by electronic measurement systems fitted as part of the harvesting head and control system on mechanical harvesters. Sensors are used in measuring girth and a measurement wheel is used in length measurement. Using these measurements, an in-cab computer calculates volume.
Harvest Type The type of harvest operation – In Ireland this is normally either 1st Thinning, 2nd Thinning, Subsequent Thinning or Clearfell.
Nominal Length Refers to a pre-specified log length for a particular product. e.g. 4.9m sawlog or 2.0m stakewood. In practice, individual log lengths for a product may vary very slightly above or below nominal length.
Over-Bark Measurement Over-Bark Measurement is the measurement of log parameters assuming all bark still to be present on the log. i.e. over-bark log volumes are inclusive of bark volume.
Precision Precision refers to the degree of agreement in a series of measurements. In general, the smaller the sample, the less precise the estimate of the whole.
Reforestation
Natural or artificial restocking / regeneration. In Ireland reforestation usually means artificial restocking following clearfell of the previous crop.
Roadside Sale The sale of harvested timber presented at the roadside.
Degree of Stand Homogeneity Degree of stand homogeneity refers to the level of uniformity of a stand of trees across a range of parameters such as species, age, productivity, size etc.
Standing Sale The sale of timber still standing as a wood or forest, yet to be harvested.
Thinning The removal of a proportion of the trees in a stand. The practice is undertaken periodically throughout the course of the rotation to improve growing conditions for the remaining trees and to provide intermediate yields of timber.
Yield Class The actual or potential yield of a forest. Yield Class is expressed in cubic metres per hectare per year and is calculated as the total volume of wood produced, divided by the age at which maximum mean annual increment is achieved.

Timber Measurement Manual
Page 57
Literature References 1. Assman, E., (1970). The Principles of Forest Yield Studies. Pergamon Press. 2. Bergmann, A. (1995). “Adaptation of the Swedish System of Computerized Bucking (Bucking to
Order) to Central European Conditions.” SkogForsk Project financed by the Commission of the European Communities.
3. Brack, C.L. & Wood, G.B. (1998). Forest Mensuration: Measuring trees, stands and forests for effective forest management. Published by the Dpt. of Forestry, Australian National University at http://www.anu.edu.au/Forestry/mensuration/MENSHOME.HTM ISBN 0 7315 2413 6
4. Forestry Commission. Technical Development Branch, Report Nos. 2/95, 7/95, 9/95, 16/94, 7/93,
22/93 & Borders Team Report No. 148. 5. CEN, (1996). prEN 1309-2 (Draft), Round and Sawn Timber - Method of Measurement of
Dimensions; Part 2: Round Timber. CEN (European Committee for Standardisation), Central Secretariat, Rue de Stassart 36, B-1050 Brussels.
6. Coillte, (1991). Aspects of Timber Measurement and Control of Removals. I.M.I. Project Report. 7. Coillte (1998). “Code of Practice For Pre-sale Measurement - Module 2 – Standardised Pre-Sale
Timber Measurement.” 8. Coillte (1998). “Measurement of Coillte Roundwood for Sale Purposes – Standard Industry
Operating Procedures (Draft).” 9. Deadman, M. W. & Goulding, C. J., (1979). “A Method for the Assessment of Recoverable Volume
by Log Types.” New Zealand Journal of Forestry Science. Vol. 9 (2). p. 225-239. 10. Department of Agriculture, Food & Forestry, (1996). “Growing for the Future - A Strategic Plan
for the Development of the Forestry Sector in Ireland.” 11. Dilworth, J.R., (1974). Log Scaling and Timber Cruising. O.S.U. Bookstores Inc., Corvallis,
Oregon 97330.
12. Edwards, P. N., (1988). “Timber Measurement - A Field Guide, Forestry Commission Booklet 49.” Her Majesty’s Stationery Office.
13. Ellis, J. C. (1993). “Measurement of Roundwood in New Zealand.” New Zealand Forestry.
February, 1993. p.16-20. 14. Ellis, J. C. (1994). “Procedures for the Measurement of Roundwood” New Zealand Forest
Research Institute, in Association with New Zealand Ministry of Forestry – second edition.
15. Gallagher, G. (1972). “Some Patterns in Crop Structure and Productivity for Unthinned Sitka Spruce.” Irish Forestry, Vol. 29, pp 33-52.
16. Garcia, O. (1988). “Growth Modelling - a (Re)view.” New Zealand Forestry. Vol. 33 (3). p.14-17. 17. Gingras, J-F. (1995). “Recent Developments in Chip Cleaning and Cut-To-Length Harvesting
Technologies in Finland.” Forest Engineering Research Institute of Canada (FERIC) Eastern Division, Internal Report: IR-1995-06-01.
18. Hamilton, G.J., (1988). “Forest Mensuration Handbook, Forestry Commission Booklet 39.” Her Majesty’s Stationery Office.
19. Husch, B., (1982). Forest Mensuration (3rd Edition). John Wiley and Sons.
Timber Measurement Manual
Page 58
20. Kilpatrick, D.J. & Savill, P.S. (1981). “Top Height Growth Curves for Sitka Spruce in Northern Ireland.” Forestry, Vol. 54, No. 1, pp 31-39.
21. Lyons, J. (1992). Report on EUROFORTEC UETP Strand Bc of COMETT Programme.
(Exchange Programme - Helsinki University). 22. Metsäteho (1993). “Solid Volume Measurement of Logs” Directive Approved by Finnish Timber
Measurement Council. 23. Murphy, G. & Cossens, P. (1995). “New tools for maximising value recovery from plantation
forests.” Institute of Foresters of Australia, 16th Biennial Conference, 1995 - Proceedings. 24. Nordlund, S. (1996). “Logging technology and methods: trends in large-scale forestry.”
SkogForsk Results No. 2.
25. Omiyale, O. & Joyce, P.M. (1982). “A Yield Model for Unthinned Sitka Spruce Plantations in Ireland.” Irish Forestry, Vol. 39, No. 2, pp 75-93.
26. Ontario Ministry of Natural Resources (1995). “Scaling Manual.” First Edition, February, 1995. 27. Philip, M.S., (1983). Measuring Trees and Forests. Division of Forestry, University of Dar Es
Salaam. 28. Rieppo, K. (1993). “Finnish Forest Machinery and Harvester Control Measurement.”
Conference proceedings: “Forest Harvesting and Mensuration Technology” - Institute of Engineers of Ireland, September 13th, 1993.
29. Sairanen, P. (1992). “Timber Scaling in Finland.” The Finnish Forest Research Institute. 30. Sondell, J. (1993). “Potential and Obstacles in the Merchandising of Roundwood in Sweden.”
SkogForsk Results No. 3. 31. Young, H.E., W.L. Robbins and S. Wilson, (1967). Errors in Volume Estimation of Primary
Forest Products. School of Forestry, University of Maine.

Appendices
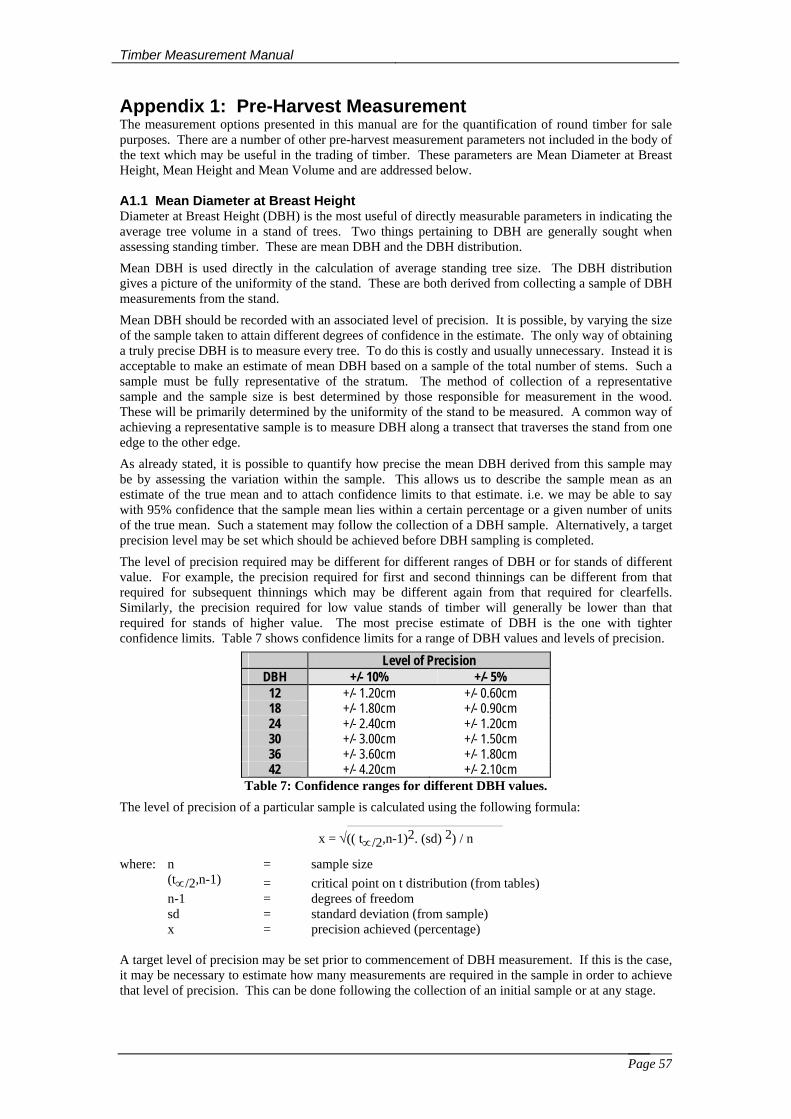
Timber Measurement Manual
Page 57
Appendix 1: Pre-Harvest Measurement The measurement options presented in this manual are for the quantification of round timber for sale purposes. There are a number of other pre-harvest measurement parameters not included in the body of the text which may be useful in the trading of timber. These parameters are Mean Diameter at Breast Height, Mean Height and Mean Volume and are addressed below. A1.1 Mean Diameter at Breast Height Diameter at Breast Height (DBH) is the most useful of directly measurable parameters in indicating the average tree volume in a stand of trees. Two things pertaining to DBH are generally sought when assessing standing timber. These are mean DBH and the DBH distribution.
Mean DBH is used directly in the calculation of average standing tree size. The DBH distribution gives a picture of the uniformity of the stand. These are both derived from collecting a sample of DBH measurements from the stand.
Mean DBH should be recorded with an associated level of precision. It is possible, by varying the size of the sample taken to attain different degrees of confidence in the estimate. The only way of obtaining a truly precise DBH is to measure every tree. To do this is costly and usually unnecessary. Instead it is acceptable to make an estimate of mean DBH based on a sample of the total number of stems. Such a sample must be fully representative of the stratum. The method of collection of a representative sample and the sample size is best determined by those responsible for measurement in the wood. These will be primarily determined by the uniformity of the stand to be measured. A common way of achieving a representative sample is to measure DBH along a transect that traverses the stand from one edge to the other edge.
As already stated, it is possible to quantify how precise the mean DBH derived from this sample may be by assessing the variation within the sample. This allows us to describe the sample mean as an estimate of the true mean and to attach confidence limits to that estimate. i.e. we may be able to say with 95% confidence that the sample mean lies within a certain percentage or a given number of units of the true mean. Such a statement may follow the collection of a DBH sample. Alternatively, a target precision level may be set which should be achieved before DBH sampling is completed.
The level of precision required may be different for different ranges of DBH or for stands of different value. For example, the precision required for first and second thinnings can be different from that required for subsequent thinnings which may be different again from that required for clearfells. Similarly, the precision required for low value stands of timber will generally be lower than that required for stands of higher value. The most precise estimate of DBH is the one with tighter confidence limits. Table 7 shows confidence limits for a range of DBH values and levels of precision.
Level of Precision DBH +/- 10% +/- 5% 12 +/- 1.20cm +/- 0.60cm 18 +/- 1.80cm +/- 0.90cm 24 +/- 2.40cm +/- 1.20cm 30 +/- 3.00cm +/- 1.50cm 36 +/- 3.60cm +/- 1.80cm 42 +/- 4.20cm +/- 2.10cm
Table 7: Confidence ranges for different DBH values.
The level of precision of a particular sample is calculated using the following formula:
x = √(( t∝/2,n-1)2. (sd) 2) / n
where: n = sample size (t∝/2,n-1) = critical point on t distribution (from tables) n-1 = degrees of freedom sd = standard deviation (from sample) x = precision achieved (percentage) A target level of precision may be set prior to commencement of DBH measurement. If this is the case, it may be necessary to estimate how many measurements are required in the sample in order to achieve that level of precision. This can be done following the collection of an initial sample or at any stage.
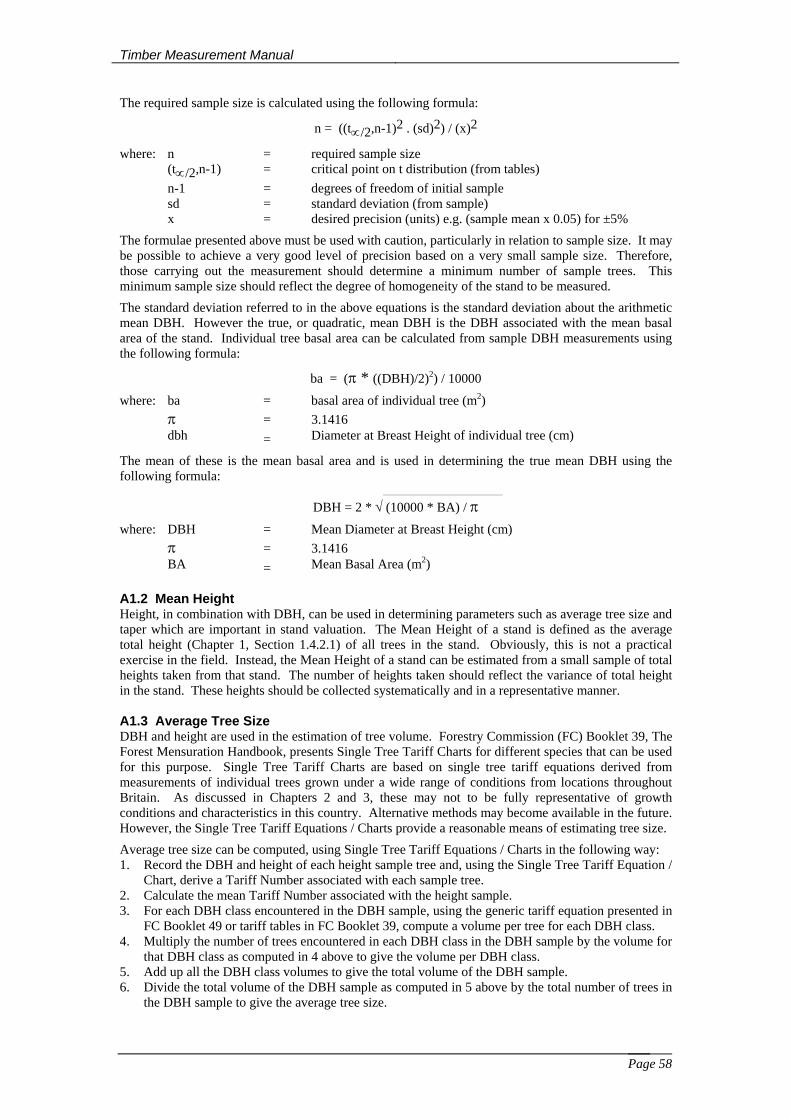
Timber Measurement Manual
Page 58
The required sample size is calculated using the following formula:
n = ((t∝/2,n-1)2 . (sd)2) / (x)2
where: n = required sample size (t∝/2,n-1) = critical point on t distribution (from tables) n-1 = degrees of freedom of initial sample sd = standard deviation (from sample) x = desired precision (units) e.g. (sample mean x 0.05) for ±5%
The formulae presented above must be used with caution, particularly in relation to sample size. It may be possible to achieve a very good level of precision based on a very small sample size. Therefore, those carrying out the measurement should determine a minimum number of sample trees. This minimum sample size should reflect the degree of homogeneity of the stand to be measured.
The standard deviation referred to in the above equations is the standard deviation about the arithmetic mean DBH. However the true, or quadratic, mean DBH is the DBH associated with the mean basal area of the stand. Individual tree basal area can be calculated from sample DBH measurements using the following formula:
ba = (π * ((DBH)/2)2) / 10000
where: ba = basal area of individual tree (m2) π = 3.1416 dbh = Diameter at Breast Height of individual tree (cm)
The mean of these is the mean basal area and is used in determining the true mean DBH using the following formula:
DBH = 2 * √ (10000 * BA) / π
where: DBH = Mean Diameter at Breast Height (cm) π = 3.1416 BA = Mean Basal Area (m2) A1.2 Mean Height Height, in combination with DBH, can be used in determining parameters such as average tree size and taper which are important in stand valuation. The Mean Height of a stand is defined as the average total height (Chapter 1, Section 1.4.2.1) of all trees in the stand. Obviously, this is not a practical exercise in the field. Instead, the Mean Height of a stand can be estimated from a small sample of total heights taken from that stand. The number of heights taken should reflect the variance of total height in the stand. These heights should be collected systematically and in a representative manner. A1.3 Average Tree Size DBH and height are used in the estimation of tree volume. Forestry Commission (FC) Booklet 39, The Forest Mensuration Handbook, presents Single Tree Tariff Charts for different species that can be used for this purpose. Single Tree Tariff Charts are based on single tree tariff equations derived from measurements of individual trees grown under a wide range of conditions from locations throughout Britain. As discussed in Chapters 2 and 3, these may not to be fully representative of growth conditions and characteristics in this country. Alternative methods may become available in the future. However, the Single Tree Tariff Equations / Charts provide a reasonable means of estimating tree size.
Average tree size can be computed, using Single Tree Tariff Equations / Charts in the following way: 1. Record the DBH and height of each height sample tree and, using the Single Tree Tariff Equation /
Chart, derive a Tariff Number associated with each sample tree. 2. Calculate the mean Tariff Number associated with the height sample. 3. For each DBH class encountered in the DBH sample, using the generic tariff equation presented in
FC Booklet 49 or tariff tables in FC Booklet 39, compute a volume per tree for each DBH class. 4. Multiply the number of trees encountered in each DBH class in the DBH sample by the volume for
that DBH class as computed in 4 above to give the volume per DBH class. 5. Add up all the DBH class volumes to give the total volume of the DBH sample. 6. Divide the total volume of the DBH sample as computed in 5 above by the total number of trees in
the DBH sample to give the average tree size.

Timber Measurement Manual
Page 59
Appendix 2: Tariff Measurement Field Sheet 1
Header Details Forest Property Compartment / Subcompartment Forester Scaler Date Species Sampling Scheme Sampling Fraction 1 in Tally of Stems Counted Summary Total Number of Trees Average Tariff Number Mean DBH (cm) Average Tree Volume (m3) Total Volume (m3) Signature of Forester

Timber Measurement Manual
Page 60
Tariff Measurement Field Sheet 2 Tally of Girth Sample Trees DBH (cm)
Girth Sample Trees (Tally)
Sample Total
Stand Total
Tree Vol. (m3)
Class Vol. (m3)
7 8 9 10 11 12 13 14 15 16 17 18 19 20 21 22 23 24 25 26 27 28 29 30 31 32 33 34 35 36 37 38 39 40 41 42 43 44 45 46 47 48 49 50

Timber Measurement Manual
Page 61
Tariff Measurement Field Sheet 3 Volume Sample Trees
Sample No. DBH (cm) Length (m) Mid-Diam. (cm) Volume (m3) Tariff Number 1 2 3 4 5 6 7 8 9 10 11 12 13 14 15 16 17 18 19 20 21 22 23 24 25 26 27 28 29 30 31 32 33 34 35 36 37 38 39 40 41 42 43 44 45 46 47 48
Total:

Timber Measurement Manual
Page 62
Appendix 3: Abbreviated Tariff Measurement Field Sheet 1
Header Details Forest Property Compartment / Subcompartment Forester Scaler Date Species Sampling Fraction 1 in Tally of Stems Counted Height Sample Trees Sample
No. DBH (cm)
Total Height (m)
Tariff Number
Sample No.
DBH (cm)
Total Height (m)
Tariff Number
1 11 2 12 3 13 4 14 5 15 6 16 7 17 8 18 9 19 10 20
Subtotal Total Summary Total Number of Trees Average Tariff Number Mean DBH (cm) Average Tree Volume (m3) Total Volume (m3) Signature of Forester

Timber Measurement Manual
Page 63
Abbreviated Tariff Measurement Field Sheet 2 Tally of Girth Sample Trees DBH (cm)
Girth Sample Trees (Tally)
Sample Total
Stand Total
Tree Vol. (m3)
Class Vol. (m3)
7 8 9 10 11 12 13 14 15 16 17 18 19 20 21 22 23 24 25 26 27 28 29 30 31 32 33 34 35 36 37 38 39 40 41 42 43 44 45 46 47 48 49 50
Timber Measurement Manual
Page 64
Appendix 4: Volume / Weight Measurement Field Sheet 1
Prescription of a Sampling Fraction
Forest: Property: Forest Owner: Timber Purchaser: Measurement Location: Administering Forester: Estimated Total Volume in Timber Sale: Estimated Total Volume
in Timber Sale Required Sampling
Fraction Prescribed Sampling Fraction
( ) Less than 500m3 1 sample / 100m3
From 501m3 to 1250m3 1 sample / 150m3 Greater than 1250m3 1 sample / 250m3
Signature of Administering Forester: Date:
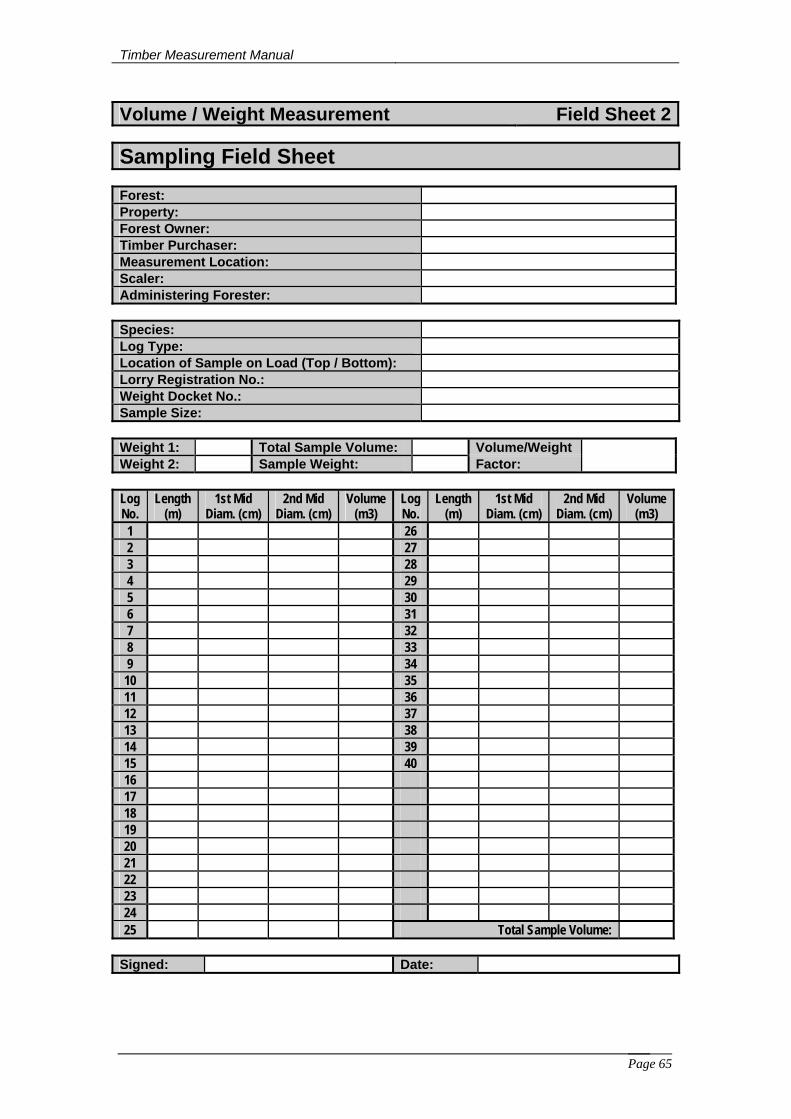
Timber Measurement Manual
Page 65
Volume / Weight Measurement Field Sheet 2
Sampling Field Sheet
Forest: Property: Forest Owner: Timber Purchaser: Measurement Location: Scaler: Administering Forester: Species: Log Type: Location of Sample on Load (Top / Bottom): Lorry Registration No.: Weight Docket No.: Sample Size: Weight 1: Total Sample Volume: Volume/Weight Weight 2: Sample Weight: Factor: Log No.
Length (m)
1st Mid Diam. (cm)
2nd Mid Diam. (cm)
Volume (m3)
Log No.
Length (m)
1st Mid Diam. (cm)
2nd Mid Diam. (cm)
Volume (m3)
1 26 2 27 3 28 4 29 5 30 6 31 7 32 8 33 9 34 10 35 11 36 12 37 13 38 14 39 15 40 16 17 18 19 20 21 22 23 24 25 Total Sample Volume:
Signed: Date:
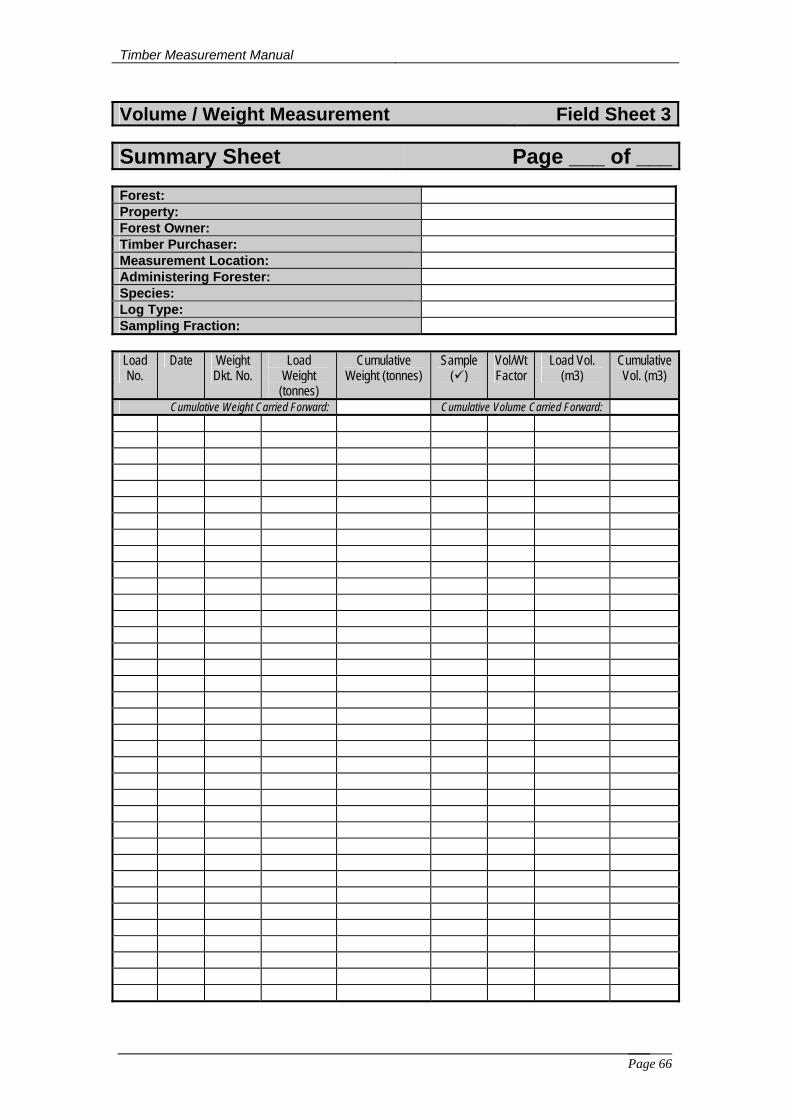
Timber Measurement Manual
Page 66
Volume / Weight Measurement Field Sheet 3
Summary Sheet Page ___ of ___
Forest: Property: Forest Owner: Timber Purchaser: Measurement Location: Administering Forester: Species: Log Type: Sampling Fraction: Load No.
Date Weight Dkt. No.
Load Weight
(tonnes)
Cumulative Weight (tonnes)
Sample ( )
Vol/Wt Factor
Load Vol. (m3)
Cumulative Vol. (m3)
Cumulative Weight Carried Forward: Cumulative Volume Carried Forward:
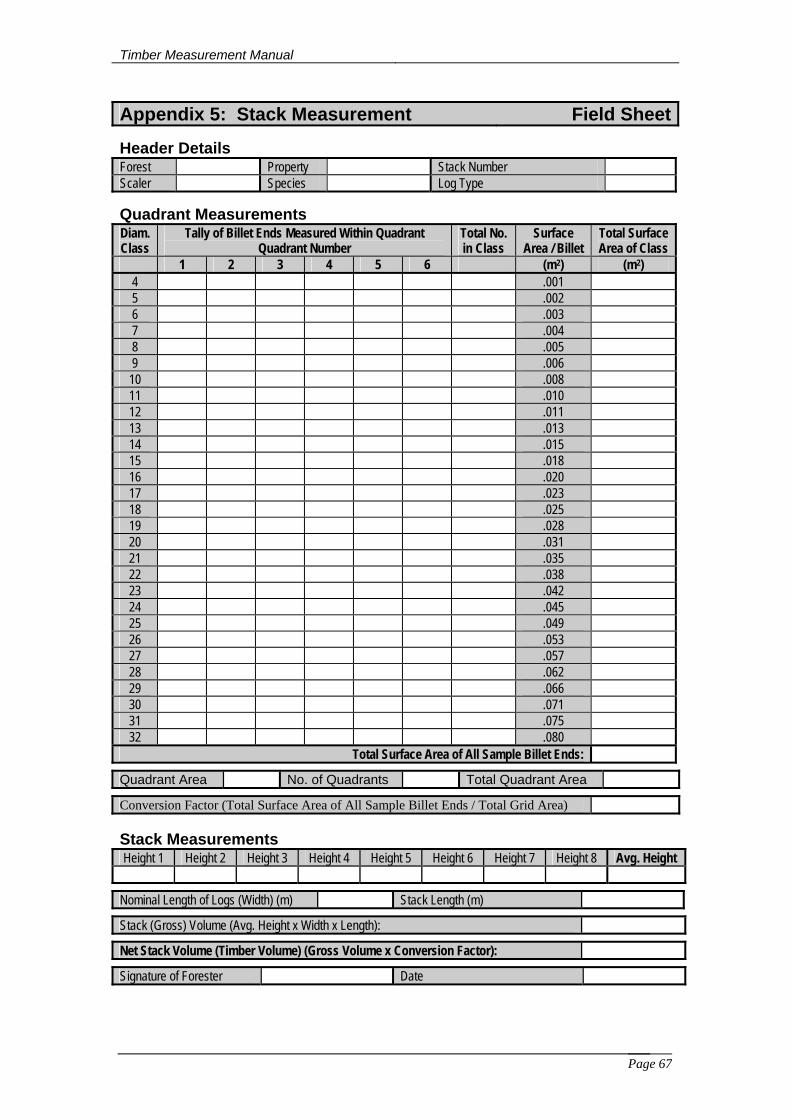
Timber Measurement Manual
Page 67
Appendix 5: Stack Measurement Field Sheet
Header Details Forest Property Stack Number Scaler Species Log Type
Quadrant Measurements Diam. Class
Tally of Billet Ends Measured Within Quadrant Quadrant Number
Total No. in Class
Surface Area / Billet
Total Surface Area of Class
1 2 3 4 5 6 (m2) (m2) 4 .001 5 .002 6 .003 7 .004 8 .005 9 .006 10 .008 11 .010 12 .011 13 .013 14 .015 15 .018 16 .020 17 .023 18 .025 19 .028 20 .031 21 .035 22 .038 23 .042 24 .045 25 .049 26 .053 27 .057 28 .062 29 .066 30 .071 31 .075 32 .080
Total Surface Area of All Sample Billet Ends:
Quadrant Area No. of Quadrants Total Quadrant Area
Conversion Factor (Total Surface Area of All Sample Billet Ends / Total Grid Area) Stack Measurements Height 1 Height 2 Height 3 Height 4 Height 5 Height 6 Height 7 Height 8 Avg. Height
Nominal Length of Logs (Width) (m) Stack Length (m)
Stack (Gross) Volume (Avg. Height x Width x Length):
Net Stack Volume (Timber Volume) (Gross Volume x Conversion Factor):
Signature of Forester Date
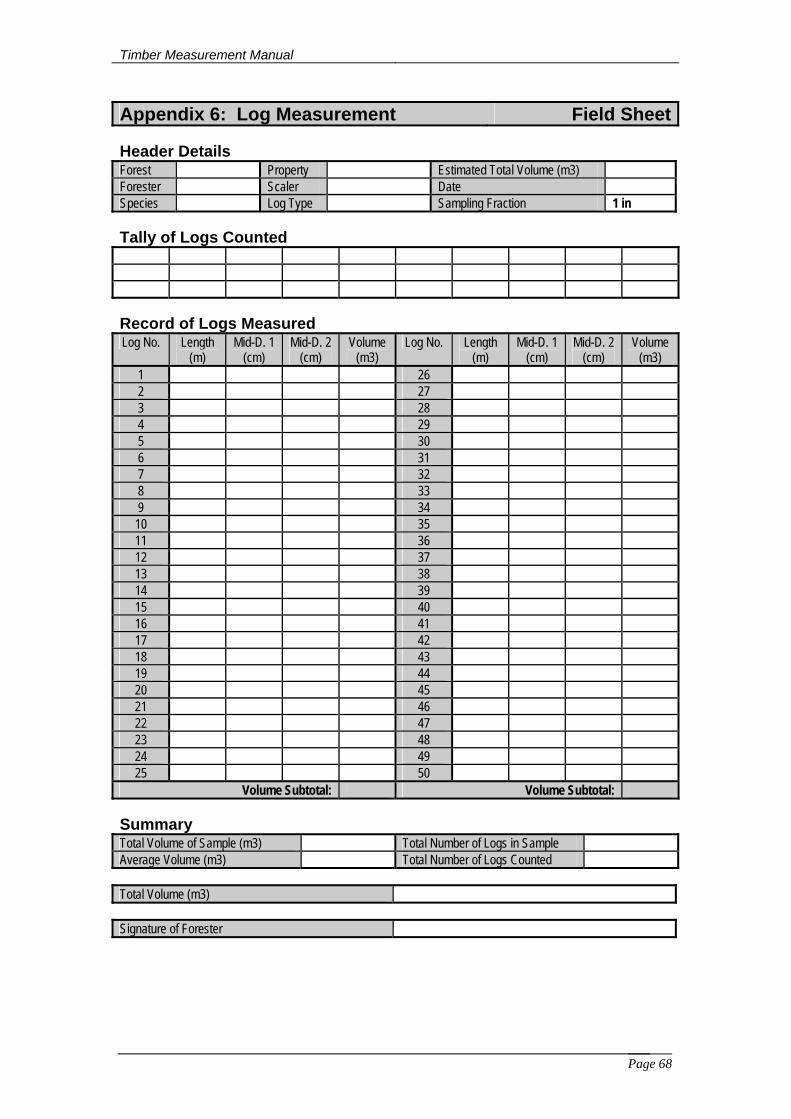
Timber Measurement Manual
Page 68
Appendix 6: Log Measurement Field Sheet
Header Details Forest Property Estimated Total Volume (m3) Forester Scaler Date Species Log Type Sampling Fraction 1 in Tally of Logs Counted Record of Logs Measured Log No. Length
(m) Mid-D. 1
(cm) Mid-D. 2
(cm) Volume
(m3) Log No. Length
(m) Mid-D. 1
(cm) Mid-D. 2
(cm) Volume
(m3) 1 26 2 27 3 28 4 29 5 30 6 31 7 32 8 33 9 34 10 35 11 36 12 37 13 38 14 39 15 40 16 41 17 42 18 43 19 44 20 45 21 46 22 47 23 48 24 49 25 50
Volume Subtotal: Volume Subtotal:
Summary Total Volume of Sample (m3) Total Number of Logs in Sample Average Volume (m3) Total Number of Logs Counted Total Volume (m3) Signature of Forester

Timber Measurement Manual
Page 69
Appendix 7: Oven Dry Bark Free Tonne Measurement Field Sheet
Header Details Supplier Log Type Weighbridge Location Sale Type Species Weighbridge Supervisor
Load Record
Timber Load Sample Details Weights (Tonnes) Weights (grams)
Date Docket No.
Sample Load
Gross Weight
Tare Weight
Net Weight
Tray Wet Sample
Gross Dry Sample
Net Dry Sample
Moisture Content
Total Net Weight Totals:
Weighted Average Moisture Content Oven Dry Bark Free Tonnes Oven Dry Tonnes Signature of Forester

Timber Measurement Manual
Page 70
Appendix 8: Weight Measurement Field Sheet
Header Details Forest Property Forester Species Log Type Weighbridge Location Load Record
Load Number
Date Weight Docket Number
Lorry Registration
Gross Weight
Tare Weight
Net Weight
Weighbridge Supervisor
1 2 3 4 5 6 7 8 9 10 11 12 13 14 15 16 17 18 19 20 21 22 23 24 25 26 27 28 29 30 31 32 33 34 35 36 37
Total Weight (tonnes):
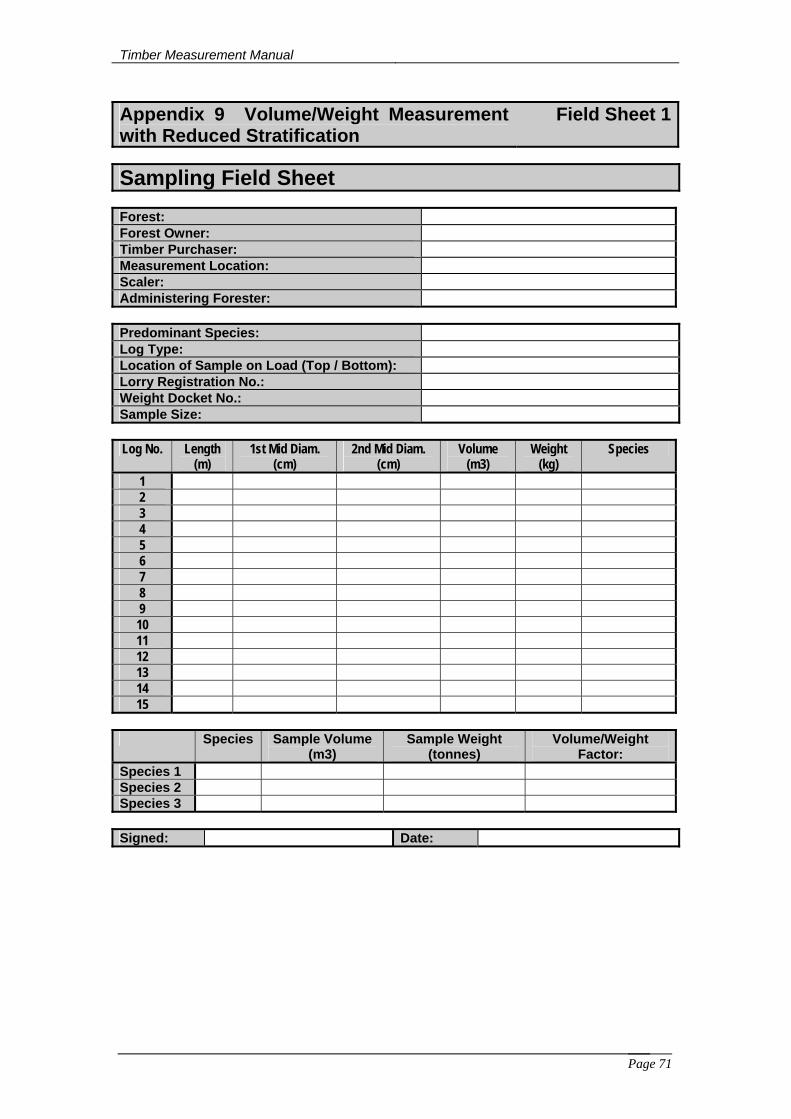
Timber Measurement Manual
Page 71
Appendix 9 Volume/Weight Measurement with Reduced Stratification
Field Sheet 1
Sampling Field Sheet
Forest: Forest Owner: Timber Purchaser: Measurement Location: Scaler: Administering Forester: Predominant Species: Log Type: Location of Sample on Load (Top / Bottom): Lorry Registration No.: Weight Docket No.: Sample Size: Log No. Length
(m) 1st Mid Diam.
(cm) 2nd Mid Diam.
(cm) Volume
(m3) Weight
(kg) Species
1 2 3 4 5 6 7 8 9 10 11 12 13 14 15
Species Sample Volume
(m3) Sample Weight
(tonnes) Volume/Weight
Factor: Species 1 Species 2 Species 3 Signed: Date:

Timber Measurement Manual
Page 72
Volume/Weight Measurement with Reduced Stratification
Field Sheet 2
Header Details Supplier Log Type Weighbridge Location Sale Type Species Weighbridge Supervisor
Load Record Date Docket No. Lorry Registration Sample Load Gross Weight Tare Weight Net Weight
Volume/Weight Sample Record (From Field Sheet 1) Sample Number Sample 1 2 3 4 5 6 7 8 9 10 Totals Sample Volume Sample Weight
Average Volume/Weight Factor Total Volume Total Tonnage Signature of Forester
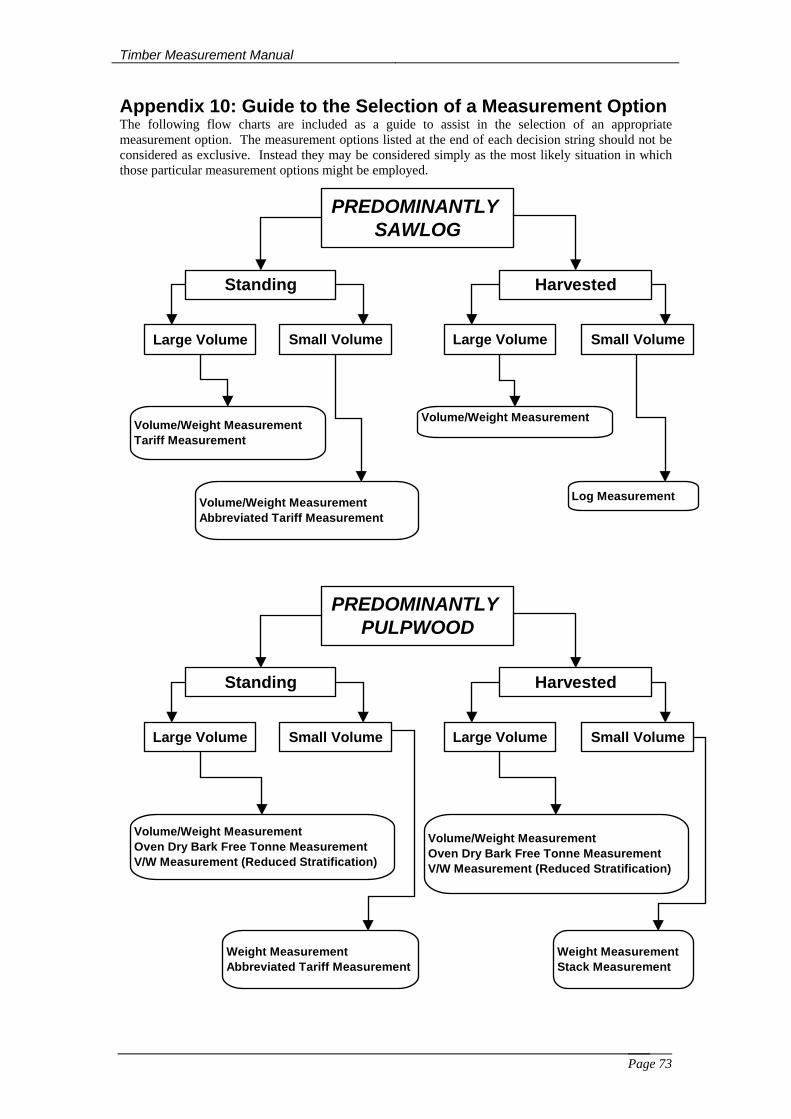
Timber Measurement Manual
Page 73
Appendix 10: Guide to the Selection of a Measurement Option The following flow charts are included as a guide to assist in the selection of an appropriate measurement option. The measurement options listed at the end of each decision string should not be considered as exclusive. Instead they may be considered simply as the most likely situation in which those particular measurement options might be employed.
PREDOMINANTLY SAWLOG
Standing Harvested
Large Volume
Volume/Weight MeasurementTariff Measurement
Log MeasurementVolume/Weight MeasurementAbbreviated Tariff Measurement
Volume/Weight Measurement
Large Volume Small VolumeSmall Volume
PREDOMINANTLY PULPWOOD
Standing Harvested
Large Volume
Volume/Weight MeasurementOven Dry Bark Free Tonne MeasurementV/W Measurement (Reduced Stratification)
Weight MeasurementAbbreviated Tariff Measurement
Volume/Weight MeasurementOven Dry Bark Free Tonne MeasurementV/W Measurement (Reduced Stratification)
Large Volume Small VolumeSmall Volume
Weight MeasurementStack Measurement