time and place: putting individual health into context. a multilevel analysis of the british...
TRANSCRIPT

ARTICLE IN PRESS
1353-8292/$ - se
doi:10.1016/j.he
�Correspond+44 0 207 813 0
E-mail addr
(A. Sacker).
Health & Place 12 (2006) 279–290
www.elsevier.com/locate/healthplace
Time and place: putting individual health into context.A multilevel analysis of the British household
panel survey, 1991–2001
Amanda Sackera,�, Richard D. Wigginsb, Mel Bartleya
aDepartment of Epidemiology and Public Health, Royal Free and University College London Medical School,
1-19 Torrington Place, London WC1E 6BT, UKbDepartment of Sociology, City University London, Northampton Square, London EC1V 0HB, UK
Accepted 1 August 2004
Abstract
Examination of the extent to which time and place affect people’s health has been constrained by the resources
available to answer this question. A British longitudinal, nationally representative survey of 8301 adults aged 16 years
and older living in private households was used to consider the influence of household membership, area of residence
and time using multilevel logistic regression. Self-rated health was assessed by general health and limiting illness during
periods characterized by economic decline (1992), economic improvement (1996) and prosperity (2000). There was
modest evidence of clustering of poor general health within areas and stronger support for within household similarities
in general health which increased over time. Individual, household and area level deprivation accounted for almost all
the area-level variability but had little effect on household variance. There was greater evidence of clustering of limiting
illness within areas: deprivation did not account for this to any great extent. Area differences in general health reduced
as the economy improved but time trends in differences in limiting illness lagged behind the timing of economic
recovery. Both time and place are shown to affect self-rated health although the processes may differ depending on the
health outcome.
r 2005 Elsevier Ltd. All rights reserved.
Keywords: Contextual differences; Multilevel models; Self-rated health; Deprivation; BHPS
Introduction
Existing research on the health damaging effects of
living in a deprived area has generally built on the idea
that there are both contextual and compositional
components adversely affecting self reports of health.
e front matter r 2005 Elsevier Ltd. All rights reserve
althplace.2004.08.011
ing author. Tel.: +44 0 207 679 1820; fax:
242.
ess: [email protected]
That is, the health of an individual depends partly on the
social and physical environment of the area in which
they live (a contextual effect) and partly on their own
health related characteristics (a compositional effect)
(Curtis and Jones, 1998). Typically, the contextual effect
size is modest (Pickett and Pearl, 2001). However, much
of the evidence is based upon cross-sectional studies and
consequently lacks the inferential potential inherent in
longitudinal multilevel analyses (Veugelers et al., 2001).
A longitudinal multilevel analysis of contextual and
compositional influences on health has the ability to
d.

ARTICLE IN PRESSA. Sacker et al. / Health & Place 12 (2006) 279–290280
consider the temporal ordering of effects with a suitable
means of capturing spatial and residential clustering in
the data. For a recent illustration of work on the
relationship between general health and area see
Stafford et al. (2001). Their study was based on a
population of British civil servants and could usefully be
extended to a general population sample. Many other
studies that have reported area effects on general health
perception have either employed multilevel cross-sec-
tional analyses (Humphreys and Carr-Hill, 1991; Pam-
palon et al., 1999; Marsh et al., 2000; Reijneveld et al.,
2000; Jones and Duncan, 1995) or nonhierarchical
longitudinal (Marsh et al., 2000) or cross-section
methods (Robert, 1998). Research on geography and
self-reports of limiting illness has produced mixed
findings. Some multilevel cross-sectional designs found
evidence for area effects (Malmstrom et al., 2001; Shouls
et al., 1996; Barnett et al., 2001) although others did not
(Ecob, 1996; Humphreys and Carr-Hill, 1991). Both the
nonhierarchical longitudinal regression studies reported
area effects (Sloggett and Joshi, 1998; Boyle et al., 2002)
as did the longitudinal multilevel studies of Wiggins and
colleagues (Wiggins et al., 1998, 2002).
There are several discussion papers which have argued
for a more rigorous analysis of contextual and
compositional effects on health (Jones and Duncan,
1995; Rice et al., 1998; Pickett and Pearl, 2001;
O’Campo, 2003; Merlo, 2003; Diez Roux, 2001, 2002;
Blakely and Woodward, 2000). Chandola et al. (2003)
have expressed concerns about the application of
hierarchical models which do not take full account of
the clustering of individuals within households found in
many national surveys like the British Household Panel
Survey (BHPS). They argue that it is possible that
variation in health at the area level may be due to the
clustering of individuals within households. In their
study of the common mental disorders, Weich et al.
(2003) found little evidence for area effects on common
mental disorders in a model which included household
clustering. By contrast, Pampalon et al. (1999) did find
evidence for regional variation in self-reported general
health in a sophisticated four-level analysis. However,
both these studies were cross-sectional in nature. There
is a need to re-appraise these results in the light of
longitudinal analyses. Thus the first step in this analysis
will examine the evidence for geographic clustering of
poor self-rated health after accounting for clustering of
health within households before undertaking a long-
itudinal analysis of the relationship between area
deprivation and health.
Longitudinal analyses not only allow for the direction
of effects between independent variables and health
outcomes to be clarified but also may enable us to
examine context in terms of temporal and residential
change (Blakely and Woodward, 2000). Geographic
mobility may influence findings if deprived areas have
more fluid populations, for example. Boyle et al. (2002)
found that migrants tend to be healthier than non-
migrants and that sicker people are less likely to be
mobile. Migration may therefore affect the relationship
between health and place in an inconsistent way. Studies
should seek to ensure that individuals are exposed to
their local environment for a sufficient amount of time
to avoid area misclassification and include length of
residence as an adjustment factor in statistical models
(O’Campo, 2003).
This study addresses the concerns outlined above. It
examines whether area deprivation has an adverse effect
on self-rated health once individual deprivation is
accounted for. It is based on data from the BHPS and
uses multilevel models which acknowledge the survey
design: individuals are clustered within households.
Thus a multilevel model with three levels of aggregation
is employed, partitioning the variance into area, house-
hold and individual components. Two health outcomes
are examined: general health and self-reported limiting
illness. The measures of deprivation are all assessed
1 year prior to the ratings of health to ensure temporal
sequencing of effects. The measure of area deprivation is
a composite score derived from census data and
matched to the BHPS members’ data, avoiding possible
same-source bias from the use of aggregated individual
level data as measures of area level effects (O’Campo,
2003). Individual measures of deprivation are taken
from the responses to the BHPS surveys and cover the
components of the composite score. This allows for an
unambiguous control for compositional characteristics
of areas when examining area deprivation as a
contextual effect (Diez Roux, 2002; Pickett and Pearl,
2001). Respondents are only included in the analysis if
they have remained at the same address for at least
1 year so that their assessments of health and depriva-
tion are completed while living in the same area. In
addition, the length of time living in the area is entered
into the models to control for area differences in
migration patterns. We repeat the analysis for health
measured on three occasions, in 1992, 1996 and 2000.
Britain experienced an economic recession from 1991 to
1994, followed by a steady growth in prosperity
(Matheson and Summerfield, 2001). The analysis is
therefore replicated for a period of economic decline
(1992), a period just emerging from recession (1996) and
a period of economic stability and prosperity (2000).
Finally, we follow the advice of Merlo (2003) and exploit
the multilevel framework by examining both regression
parameters and residual variation at different levels of
the model.
In summary, the aims of this study are threefold: to
ascertain whether there is evidence of geographic
clustering of poor self-rated health after accounting for
clustering of self-rated health within households; to
examine whether this clustering of individual self-rated

ARTICLE IN PRESSA. Sacker et al. / Health & Place 12 (2006) 279–290 281
health is stable over time, and to determine the extent to
which this can be understood in terms of area
deprivation.
Material and methods
The BHPS is a longitudinal survey of private house-
holds containing approximately 5500 households and
9000 men and women. The initial sample was a two-
stage stratified cluster design, using postcode sectors as
the first-stage units and individual addresses as the
second stage. The first wave of fieldwork took place
between September and December 1991. Households
have been re-visited each year. All eligible household
members (those aged 16 and over at the time of
interview) are surveyed in the selected households at
each wave. Individuals who took part in the survey in
1991, 1995 and 1999 and completed the health questions
outlined below in the years 1992, 1996 and 2000 were
included in this analysis if they also resided at the same
address at the time of the two consecutive surveys of
interest. Thus, at a minimum, the selected respondents
had spent at least 1 year in the area. The BHPS
investigators matched respondents to their electoral
ward of residence in each year without disclosing
information that could identify individuals.
Assessment of health
Poor general health. Respondents were asked ‘‘Please
think back over the last 12months about how your
health has been. Compared to people of your own age,
would you say that your health has on the whole been
excellent, good, fair, poor, very poor, don’t know?’’.
Answers were taken as an indication of general health
and coded 0 (excellent/good) or 1 (fair/poor/very poor).
Limiting illness. The survey members were identified
with a limiting illness if they responded affirmatively to
‘‘Do you have any of the health problems or disabilities
listed on this card? EXCLUDE TEMPORARY CON-
DITIONS’’ and to ‘‘Does your health limit the type of
work or the amount of work you can do?’’.
Contextual risk factors
Townsend index. This is a composite score designed to
measure small area deprivation (Townsend et al., 1988).
It is based on the following four component variables
for each electoral ward: the number of unemployed
residents over 16 as a percentage of all economically
active residents aged over 16; the number of households
with one person per room and over as a percentage of all
households; the number of households with no car as a
percentage of all households; the number of households
not owning their own home as a percentage of all
households. The index uses Z scores to standardize the
four component variables after first log transforming the
unemployment and overcrowding variables. Scores are
rounded to the nearest 0.5 and truncated at �8.0 and
+12.5, with negative values reflecting less deprived
areas and positive values reflecting more deprived areas.
The data for the index are taken from the 1991 census.
At the time of writing, the index has not been updated to
reflect deprivation in 2001, the year of the most recent
census.
Compositional risk factors
Unemployment. Current labour force status is used to
determine if respondents were unemployed or not.
Those in full-time or part-time work and those not in
employment but not seeking work are included in the
reference category.
Car usage. Survey members were asked ‘‘Is there a car
or van normally available for private use by you or any
members of your household?’’. Responses were coded as
0 for Yes and 1 for No.
Housing tenure. Respondents were asked about their
housing ownership status and tenure. From these
questions, housing tenure was categorized as 0. Outright
owner or owner with a mortgage; 1. Any form of rented
accommodation.
Overcrowding. The number of persons living in the
household and the number of rooms in the accommoda-
tion were used to assess overcrowding. A household is
defined as overcrowded if the household comprises one
or more persons per room.
Confounding variables
Age, gender and number of years resident at address
are entered into the models as control variables because
of their strong associations with both health and
deprivation. The measure for age is age in years on 12
December 1991. Respondents were aged between 9 and
97 years in 1991 (although over 16 when surveyed).
Gender is entered in the models as a dummy variable
coded 0 for male and 1 for female. Years living at the
same address ranges from 1 to 95 years with median
9 year.
Statistical analyses
All modelling is carried out using the software
package MLwiN (Rasbash et al., 2000). The preliminary
analyses consist of two multilevel logistic regression
models (Goldstein, 1995) for each of the health out-
comes. The first model is a 2-level logistic regression
model with individuals at level 1 nested within areas at

ARTICLE IN PRESSA. Sacker et al. / Health & Place 12 (2006) 279–290282
level 2. The second model is a 3-level model with
individuals at level 1 nested within households at level 2
nested within areas at level 3. The models are ‘‘null’’
models in respect of having no predictor variables except
a constant term. Variance in self-rated health is
partitioned by the levels of the model. Thus we are able
to address one of the criticisms of spatial analyses:
whether there is evidence for clustering of poor self-rated
health by area in a model which accounts for household
clustering.
The substantive analyses comprise a nested series of 3-
level logistic regression models for the two health
outcomes. Model 1, a baseline model, is first estimated
which does not contain any explanatory variables except
potentially confounding variables: age, gender and years
living at the same address. The compositional effects
model (Model 2) also includes fixed effects for un-
employment, car usage, housing tenure and overcrowd-
ing. Model 3, the contextual plus compositional effects
model, adds the Townsend index to the set of predictors.
The hierarchy used in our analysis clusters individuals
within households within electoral wards. Following
Rice et al. (1998) we do not ‘view hypotheses about area
or household effect as contradictory but as effects
located along a spectrum’. Because the household is a
more immediate environment than the area, household
effects may be expected to have a stronger relationship
to individual health than area effects. The Townsend
index constructed by electoral wards is added to the
multilevel analysis at the area level. Adopting wards as
place of residence presents some problems for the
analysis. Geographic mobility of sample members
throughout the decade meant that by 1999 there were
2.5 times as many wards containing BHPS members as
in 1991. Thus we are unable to compare the impact of
area deprivation at different times. However, it is
possible to add a temporal to a spatial perspective in a
comparison of the proportion of variance at the
different levels of the model at the three time points.
To our knowledge, this is the first time that such an
analysis has been undertaken.
The models are estimated using second-order pena-
lized quasi-likelihood estimation with individual sample
weighting and are repeated for the two measures of poor
health (poor self-rated health and limiting illness). Age is
centred at 45 years in all models. Poor health is assessed
in 1992, 1996 and 2000. The predictors of poor health
are all assessed 1 year prior to the assessment of poor
health to minimize confounding of effects between
health and deprivation.
The results of the modelling provide insights on two
different aspects of the analysis. First, on the interpreta-
tion of the fixed effects and their ability to predict poor
health. Odds ratios and 95% confidence intervals are
obtained from the beta coefficients and their standard
errors in the fixed part of the model. Second, on their
ability to explain differences between areas (based on the
magnitude of the variance component at each level of
the model). Because the outcome variables are binary,
the unexplained variation between areas is calculated
using the ‘‘latent variable approach’’ (Snijders and
Bosker, 1999; Goldstein et al., 2002). It is assumed that
there is a continuous latent variable with a standard
logistic distribution underlying each binary health out-
come, with a single threshold determining the values on
the observed health variable. Level 1 variance on such
an underlying unobserved variable is standardized to
3.29 (the standard logistic variance, p2=3). The propor-
tion of the total variation occurring at each level is
estimated using the standardized value for the level 1
variation and the model estimates for the unobserved
variation at level 2 and level 3.
Results
Of the 9374 BHPS members who completed the
survey in 1992, 92 per cent had also participated in the
first wave of the survey. This resulted in a sample of
8301 individuals aged 16–97 years, resident in 4999
households within 653 electoral wards with complete
data on the variables of interest. The respondents
completing the survey in 1995 and 1996 numbered
8333, providing a sample of 7536 people aged 16–96
years living in 4679 households in 1312 wards who
completed the questions of relevance to this study. In
2000, there were 8582 respondents of whom 94 per cent
had also participated in the 1999 survey, resulting in a
sample of 7247 individuals aged 16–99, resident in 4571
households within 1645 wards with complete data for
the health, contextual and compositional variables.
Table 1 shows the prevalence of poor health over time
in the BHPS. Privileged areas (12.5 per cent) are defined
as those with a Townsend score of 1 standard deviation
below zero and deprived areas (25 per cent) as those with
a score 1 standard deviation above zero. Both poor
general health and limiting illness rates increased during
1992–2000. The table also shows that compared with
more privileged areas, those living in deprived areas had
poorer health on average and were more likely to be
socio-economically disadvantaged. The current state of
the British economy clearly affected the prevalence rates
for the four indicators of deprivation, especially the rate
of unemployment.
Partitioning of variance in poor self-rated health
Figs. 1 and 2 show the partitioning of variance at the
different levels of the models for poor general health and
limiting illness, respectively. In the 2-level model for
poor general health in 1992, a small but significant

ARTICLE IN PRESS
Table
1
Percentageofindividualsin
poorhealthin
1992,1996and2000andtheproportionaffectedbythecomponentsoftheTownsendindex
in1991,1995and1999,respectively,bylevel
ofareadeprivation
1992
1996
2000
Deprived
areasa
Privileged
areasb
Allareas
Deprived
areasa
Privileged
areasb
Allareas
Deprived
areasa
Privileged
areasb
Allareas
Poorgeneralhealth
34.22
19.46
27.99
39.46
24.43
31.74
38.68
25.41
33.02
Lim
itingillness
22.45
14.45
18.23
26.77
17.70
21.13
26.19
17.85
21.76
Over
45year
46.33
56.30
48.89
51.62
57.52
53.90
53.13
60.13
56.28
Fem
ale
54.38
52.30
53.55
54.75
51.87
53.68
55.07
51.45
53.82
Unem
ployed
8.07
2.63
5.23
5.94
2.81
4.03
3.53
1.11
2.27
Nocar
42.26
9.83
25.67
40.09
9.68
23.23
36.50
10.87
20.78
Nonhomeowner
48.75
11.30
29.12
44.28
13.16
27.00
44.38
13.69
25.61
Overcrowded
9.97
3.55
6.59
8.19
2.74
5.41
9.37
1.69
4.44
aTownsendindex
X3.
bTownsendindex
p�3.
Fig. 1. Proportion of variance at each level of a 2-level
(individuals within areas) and 3-level (individuals within
households within areas) baseline model of poor general health
in the British Household Panel Study.
Fig. 2. Proportion of variance at each level of a 2-level
(individuals within areas) and 3-level (individuals within
households within areas) baseline model of limiting illness in
the British Household Panel Study.
A. Sacker et al. / Health & Place 12 (2006) 279–290 283
proportion of the variance (6.67 per cent; 95% C.I.
4.72–8.61 per cent) is estimated to be at the area level. In
the three level model, some of this is re-allocated to the
middle layer, the household level. Nevertheless, a
significant area effect is still observed (level-3 variance
4.99 per cent; 95% C.I. 2.81–7.16 per cent). The
partitioning of the variance in poor general health in
2000 shows a further reduction in variation at the area
level (level-3 variance 2.53 per cent; 95% C.I. 0.13–4.93
per cent). T-tests for differences in the estimates of the
proportion of level-3 variance at the three time-points
were all significant at the 5 per cent level.
There is evidence of more clustering of limiting illness
by area than clustering of poor general health by area
(see Fig. 2). The pattern over time differs from that for
poor general health too. For the latter measure of poor
self-rated health, area level clustering reduced over time.
For limiting illness, estimates of area-level variance
increased in 1996 compared with 1992 and then reduced
again in 2000, although still not returning to the 1992

ARTICLE IN PRESS
Fig. 3. Percentage variance (95% C.I. error bars) at the area
level in the prevalence of poor general health and limiting illness
in the British Household Panel Study.
A. Sacker et al. / Health & Place 12 (2006) 279–290284
level. Taking account of possible household level
clustering did not alter the finding of significant area-
level variance in each of the 3 years studied. This ranged
from 5.12 per cent (95% C.I. 2.05 –8.20 per cent) in 1992
to 12.64 per cent (95% C.I. 7.45–17.53 per cent) in 1996.
The area-level variability in 1992 was significantly lower
than at the later time-points. The comparison between
1992 and 1996 yielded a t statistic ¼ 3.77, p ¼ 0:0002;and for 1992 vs. 2000 t ¼ 2:45; p ¼ 0:015:Figs. 1 and 2 show that a 2-level model, which does
not consider household-level variation in poor health,
places too great an emphasis on individual variability in
health. Most of the household variance in the 3-level
models appears to re-apportion the individual level
variance identified in 2-level models to household-level
variance. This is particularly true in the case of limiting
illness. The next stage in the analysis is to investigate
how far the geographic differences are due to differences
in area deprivation.
Area level differences in self-rated health
In the baseline model for general health (Model 1), the
confounding variables did not alter the proportion of
variance at the area level reported above. The area-level
variance left unexplained after controlling for age,
gender and years at address was around 5 per cent of
the total in 1992 reducing to 3 per cent in the year 2000.
Model 2, which includes the individual characteristics
which match the components of the Townsend scale,
reduced the area variance to 3 per cent of the total in
1992 and 1996, but halved the unexplained variance in
2000 to 1.5 per cent. Compositional factors or char-
acteristics of individuals and their households, ac-
counted for some of the clustering of poor general
health by area. In Model 3, the area-level variance is
reduced further to 2.4 and 2.0 per cent of the total in the
years 1992 and 1996, respectively, and to just under one
per cent of the total variance in the year 2000. Although
much of the area variance could be understood in terms
of the contextual and compositional indicators of
deprivation, a small significant amount remained
unexplained in 1992. Fig. 3 shows the changes in the
amount of area-level variance that is not accounted for
in the models over the period 1992–2000 and how the
addition of both the contextual and compositional
variables explains most of this variance in general
health. Neither the contextual nor the compositional
indicators accounted for much of the household-level
variance.
The partitioning of the variance in the baseline models
for limiting illness showed a pattern different from that
for general health. Individual-level variance accounted
for 59% of the total in 1992, dropping to 28 per cent in
2000. This was counterbalanced by an increase in the
proportion of variance at the household level over time,
from 36 to 64 per cent of the total. After controlling for
age, gender and years living at address, area-level
variance for limiting illness ranged from 5 per cent in
1992 and 2000 to 11 per cent of the total in 1996.
Compositional factors reduced the area variance to 3.5
per cent in 1992 and 2000, and to 10 per cent of the total
in the year 1996. The combined effects of contextual and
compositional factors reduced the area variance further.
Nevertheless, significant differences between areas re-
mained in 1992 and 1996, amounting to 3 per cent of the
total variance in 1992 and rising to 9 per cent in 1996.
However, the residual 3 per cent of variance at the area
level in 2000 was not significantly different from zero.
The difference between the area-level variation in
general health and limiting illness is clear from Fig. 3.
Neither individual nor area deprivation is sufficient for
understanding the spatial variation in limiting illness in
1996, in contrast to their ability to account for the area-
level variation in general health in the same year.
Individual and area deprivation accounted for most of
the spatial variability in self-rated health in 1992 and all
of the variation in 2000.
The prediction of individual poor self-rated health
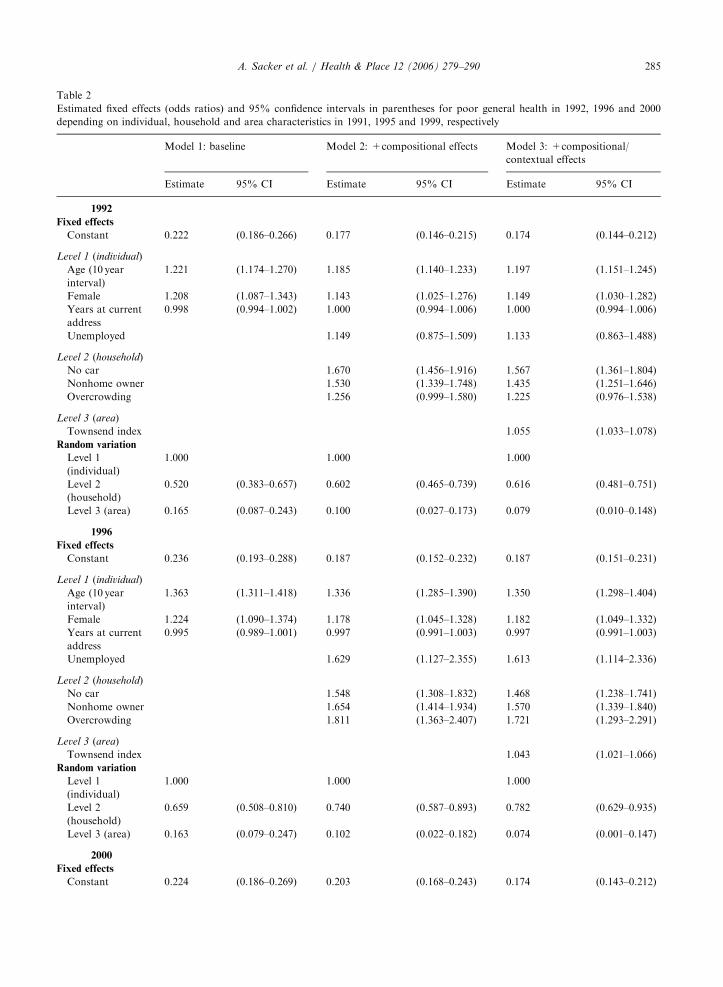
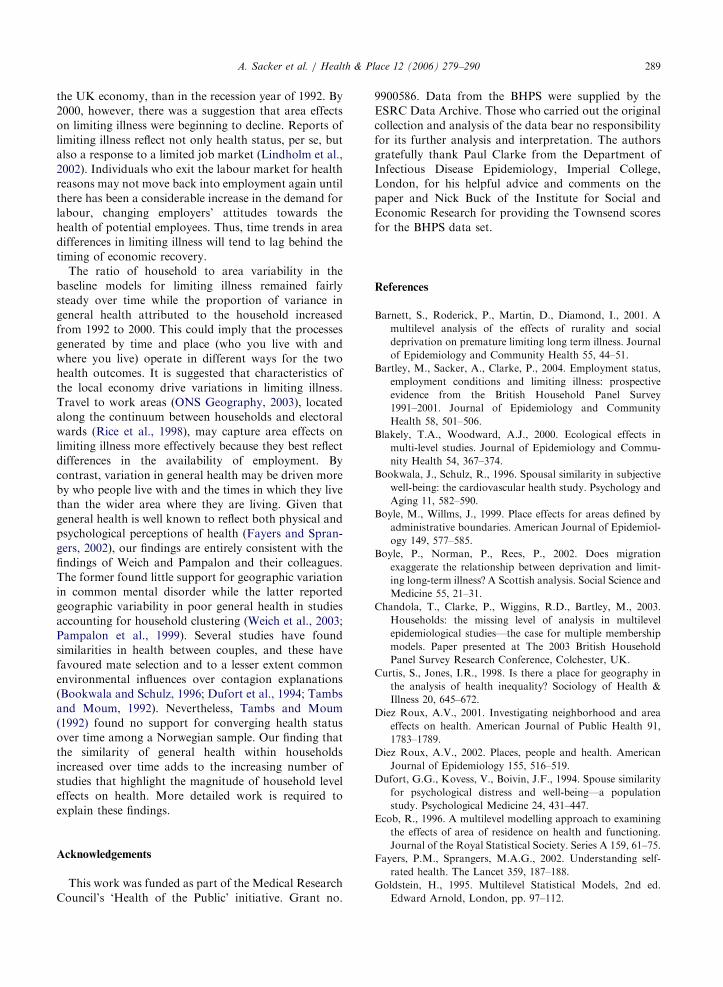
Table 2 shows the results from the nested series of
compositional and contextual models for poor general
health. Although all four compositional variables
predict poor general health 1 year later in univariate
models (results not shown), unemployment had no
independent effect in the multivariate compositional
model for 1992 and 1996. The relationships of home
ownership and overcrowding with poor general health
became stronger over time. The addition of the
contextual variable in Model 3 demonstrates that both
area deprivation and individual characteristics contri-
bute to the prediction of poor general health. The
Townsend index significantly predicts poor general
ARTICLE IN PRESS
Table 2
Estimated fixed effects (odds ratios) and 95% confidence intervals in parentheses for poor general health in 1992, 1996 and 2000
depending on individual, household and area characteristics in 1991, 1995 and 1999, respectively
Model 1: baseline Model 2: +compositional effects Model 3: +compositional/
contextual effects
Estimate 95% CI Estimate 95% CI Estimate 95% CI
1992
Fixed effects
Constant 0.222 (0.186–0.266) 0.177 (0.146–0.215) 0.174 (0.144–0.212)
Level 1 (individual)
Age (10 year
interval)
1.221 (1.174–1.270) 1.185 (1.140–1.233) 1.197 (1.151–1.245)
Female 1.208 (1.087–1.343) 1.143 (1.025–1.276) 1.149 (1.030–1.282)
Years at current
address
0.998 (0.994–1.002) 1.000 (0.994–1.006) 1.000 (0.994–1.006)
Unemployed 1.149 (0.875–1.509) 1.133 (0.863–1.488)
Level 2 (household)
No car 1.670 (1.456–1.916) 1.567 (1.361–1.804)
Nonhome owner 1.530 (1.339–1.748) 1.435 (1.251–1.646)
Overcrowding 1.256 (0.999–1.580) 1.225 (0.976–1.538)
Level 3 (area)
Townsend index 1.055 (1.033–1.078)
Random variation
Level 1
(individual)
1.000 1.000 1.000
Level 2
(household)
0.520 (0.383–0.657) 0.602 (0.465–0.739) 0.616 (0.481–0.751)
Level 3 (area) 0.165 (0.087–0.243) 0.100 (0.027–0.173) 0.079 (0.010–0.148)
1996
Fixed effects
Constant 0.236 (0.193–0.288) 0.187 (0.152–0.232) 0.187 (0.151–0.231)
Level 1 (individual)
Age (10 year
interval)
1.363 (1.311–1.418) 1.336 (1.285–1.390) 1.350 (1.298–1.404)
Female 1.224 (1.090–1.374) 1.178 (1.045–1.328) 1.182 (1.049–1.332)
Years at current
address
0.995 (0.989–1.001) 0.997 (0.991–1.003) 0.997 (0.991–1.003)
Unemployed 1.629 (1.127–2.355) 1.613 (1.114–2.336)
Level 2 (household)
No car 1.548 (1.308–1.832) 1.468 (1.238–1.741)
Nonhome owner 1.654 (1.414–1.934) 1.570 (1.339–1.840)
Overcrowding 1.811 (1.363–2.407) 1.721 (1.293–2.291)
Level 3 (area)
Townsend index 1.043 (1.021–1.066)
Random variation
Level 1
(individual)
1.000 1.000 1.000
Level 2
(household)
0.659 (0.508–0.810) 0.740 (0.587–0.893) 0.782 (0.629–0.935)
Level 3 (area) 0.163 (0.079–0.247) 0.102 (0.022–0.182) 0.074 (0.001–0.147)
2000
Fixed effects
Constant 0.224 (0.186–0.269) 0.203 (0.168–0.243) 0.174 (0.143–0.212)
A. Sacker et al. / Health & Place 12 (2006) 279–290 285

ARTICLE IN PRESS
Table 2 (continued )
Model 1: baseline Model 2: +compositional effects Model 3: +compositional/
contextual effects
Estimate 95% CI Estimate 95% CI Estimate 95% CI
Level 1 (individual)
Age (10 year
interval)
1.221 (1.174–1.270) 1.234 (1.186–1.283) 1.197 (1.151–1.245)
Female 1.208 (1.085–1.346) 1.206 (1.080–1.345) 1.148 (1.027–1.284)
Years at current
address
0.998 (0.994–1.002) 0.998 (0.994–1.002) 1.000 (0.994–1.006)
Unemployed 1.097 (1.076–1.119) 1.126 (0.853–1.488)
Level 2 (household)
No car 1.097 (1.076–1.119) 1.570 (1.361–1.811)
Nonhome owner 1.097 (1.076–1.119) 1.439 (1.247–1.660)
Overcrowding 1.097 (1.076–1.119) 1.225 (0.976–1.538)
Level 3 (area)
Townsend index 1.057 (1.034–1.080)
Random variation
Level 1
(individual)
1.000 1.000 1.000
Level 2
(household)
0.895 (0.738–1.052) 0.949 (0.857–1.041) 0.982 (0.819–1.145)
Level 3 (area) 0.094 (0.000–0.188) 0.051 (0.000–0.143) 0.032 (0.000–0.120)
A. Sacker et al. / Health & Place 12 (2006) 279–290286
health net of compositional effects. The effect of the four
compositional variables is attenuated, but the reduction
in effect size is slight.
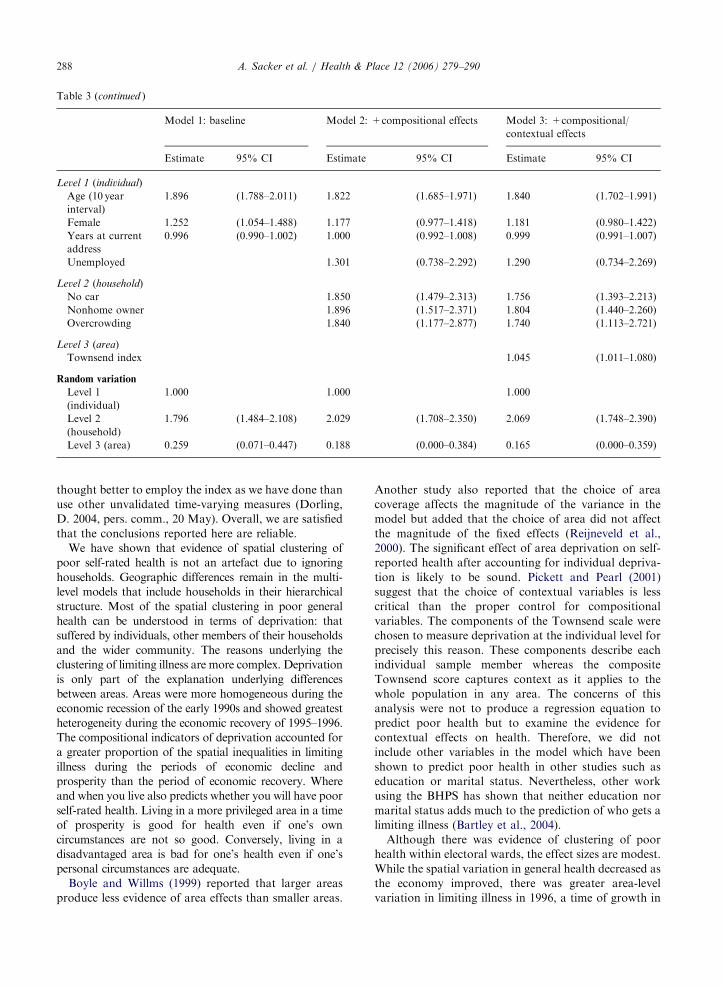
The model estimates for limiting illness are shown in
Table 3. Again, although all four compositional vari-
ables predict limiting illness in univariate analyses, not
all have independent effects in the multivariate composi-
tional model (Model 2). Unemployment was not
independently related to limiting illness in 1992. The
effect of car usage, housing tenure and overcrowding
tended to increase in magnitude over time in contrast to
the effect of unemployment. Table 3 also shows that
after adjustment for compositional effects, the contex-
tual deprivation variable, the Townsend index, was
significantly associated with limiting illness in 1992, 1996
and 2000 (Model 3). Those resident in a deprived area
(one standard deviation above the mean) in 1992 or 2000
were around 40% more likely to have a limiting illness
than those living in a privileged area (one standard
deviation below the mean) after taking their individual
circumstances into account. In 1996, the excess risk
amounted to a 50 per cent increase.
Discussion
In this paper we have carried out a rigorous analysis
of contextual effects on self-reported health which has
taken account of the possibility that these effects could
be a compositional artefact (Subramanian et al., 2003).
Acknowledging recommendations by O’Campo (2003)
before attribution of area effects, the study sample was
confined to those resident in the area for at least 1 year,
and the models included a variable measuring the length
of stay at an address. Boyle et al. (2002) found that the
relationship between area deprivation and limiting
illness was not affected by migration despite migrants
being healthier than nonmigrants. Here, the relationship
between the Townsend scale, an index of area depriva-
tion, and self-reported health was unaffected by length
of stay. Moreover, there was no relationship between
health and length of stay beyond the mandatory 1 year
period. Nevertheless, some further sensitivity analyses
were carried out although they are not been reported in
detail here. Based on the health data for 1996 only, they
showed that a 2 year lag on the predictor variables had
no effect on the substantive results. Neither did treating
general health as a continuous measure alter the
findings. Models which defined general health as an
ordinal outcome were also tested. However, 3-level
applications failed to converge. Since the Townsend
index was based on data from the 1991 census, it is
possible that the contextual influences on self-rated
health are less reliably estimated for the two later time
points. However, unemployment rates during the 1990s
do not correlate well with levels of deprivation and it is

ARTICLE IN PRESS
Table 3
Estimated fixed effects (odds ratios) and 95% confidence intervals in parentheses for limiting illness in 1992, 1996 and 2000 depending
on individual, household and area characteristics in 1991, 1995 and 1999, respectively
Model 1: baseline Model 2: +compositional effects Model 3: +compositional/
contextual effects
Estimate 95% CI Estimate 95% CI Estimate 95% CI
1992
Fixed effects
Constant 0.082 (0.064–0.107) 0.063 (0.047–0.083) 0.061 (0.046–0.081)
Level 1 (individual)
Age (10 year
interval)
1.665 (1.601–1.732) 1.616 (1.524–1.714) 1.632 (1.539–1.731)
Female 1.158 (1.000–1.342) 1.093 (0.933–1.281) 1.100 (0.938–1.289)
Years at current
address
0.992 (0.986–0.998) 0.994 (0.988–1.000) 0.993 (0.987–0.999)
Unemployed 1.385 (0.951–2.018) 1.363 (0.936–1.986)
Level 2 (household)
No car 1.802 (1.505–2.158) 1.690 (1.403–2.036)
Nonhome owner 1.420 (1.175–1.718) 1.331 (1.096–1.616)
Overcrowding 1.448 (1.037–2.020) 1.409 (1.010–1.966)
Level 3 (area)
Townsend index 1.057 (1.026–1.088)
Random variation
Level 1
(individual)
1.000 1.000 1.000
Level 2
(household)
1.070 (0.807–1.333) 1.203 (0.942–1.464) 1.222 (0.963–1.481)
Level 3 (area) 0.267 (0.126–0.408) 0.195 (0.066–0.324) 0.177 (0.054–0.300)
1996
Fixed effects
Constant 0.093 (0.073–0.119) 0.072 (0.055–0.093) 0.069 (0.053–0.090)
Level 1 (individual)
Age (10 year
interval)
1.665 (1.570–1.766) 1.632 (1.539–1.731) 1.665 (1.570–1.766)
Female 1.157 (1.005–1.333) 1.094 (0.943–1.270) 1.099 (0.945–1.278)
Years at current
address
0.993 (0.987–0.999) 0.995 (0.989–1.001) 0.995 (0.989–1.001)
Unemployed 1.347 (0.909–1.998) 1.336 (0.896–1.993)
Level 2 (household)
No car 1.567 (1.288–1.906) 1.480 (1.207–1.815)
Nonhome owner 1.647 (1.367–1.984) 1.582 (1.308–1.914)
Overcrowding 1.726 (1.216–2.452) 1.670 (1.169–2.386)
Level 3 (area)
Townsend index 1.057 (1.034–1.080)
Random variation
Level 1
(individual)
1.000 1.000 1.000
Level 2
(household)
0.952 (0.674–1.230) 1.030 (0.754–1.306) 1.102 (0.826–1.378)
Level 3 (area) 0.408 (0.249–0.567) 0.346 (0.193–0.499) 0.309 (0.162–0.456)
2000
Fixed effects
Constant 0.054 (0.040–0.074) 0.040 (0.029–0.056) 0.040 (0.028–0.055)
A. Sacker et al. / Health & Place 12 (2006) 279–290 287
ARTICLE IN PRESS
Table 3 (continued )
Model 1: baseline Model 2: +compositional effects Model 3: +compositional/
contextual effects
Estimate 95% CI Estimate 95% CI Estimate 95% CI
Level 1 (individual)
Age (10 year
interval)
1.896 (1.788–2.011) 1.822 (1.685–1.971) 1.840 (1.702–1.991)
Female 1.252 (1.054–1.488) 1.177 (0.977–1.418) 1.181 (0.980–1.422)
Years at current
address
0.996 (0.990–1.002) 1.000 (0.992–1.008) 0.999 (0.991–1.007)
Unemployed 1.301 (0.738–2.292) 1.290 (0.734–2.269)
Level 2 (household)
No car 1.850 (1.479–2.313) 1.756 (1.393–2.213)
Nonhome owner 1.896 (1.517–2.371) 1.804 (1.440–2.260)
Overcrowding 1.840 (1.177–2.877) 1.740 (1.113–2.721)
Level 3 (area)
Townsend index 1.045 (1.011–1.080)
Random variation
Level 1
(individual)
1.000 1.000 1.000
Level 2
(household)
1.796 (1.484–2.108) 2.029 (1.708–2.350) 2.069 (1.748–2.390)
Level 3 (area) 0.259 (0.071–0.447) 0.188 (0.000–0.384) 0.165 (0.000–0.359)
A. Sacker et al. / Health & Place 12 (2006) 279–290288
thought better to employ the index as we have done than
use other unvalidated time-varying measures (Dorling,
D. 2004, pers. comm., 20 May). Overall, we are satisfied
that the conclusions reported here are reliable.
We have shown that evidence of spatial clustering of
poor self-rated health is not an artefact due to ignoring
households. Geographic differences remain in the multi-
level models that include households in their hierarchical
structure. Most of the spatial clustering in poor general
health can be understood in terms of deprivation: that
suffered by individuals, other members of their households
and the wider community. The reasons underlying the
clustering of limiting illness are more complex. Deprivation
is only part of the explanation underlying differences
between areas. Areas were more homogeneous during the
economic recession of the early 1990s and showed greatest
heterogeneity during the economic recovery of 1995–1996.
The compositional indicators of deprivation accounted for
a greater proportion of the spatial inequalities in limiting
illness during the periods of economic decline and
prosperity than the period of economic recovery. Where
and when you live also predicts whether you will have poor
self-rated health. Living in a more privileged area in a time
of prosperity is good for health even if one’s own
circumstances are not so good. Conversely, living in a
disadvantaged area is bad for one’s health even if one’s
personal circumstances are adequate.
Boyle and Willms (1999) reported that larger areas
produce less evidence of area effects than smaller areas.
Another study also reported that the choice of area
coverage affects the magnitude of the variance in the
model but added that the choice of area did not affect
the magnitude of the fixed effects (Reijneveld et al.,
2000). The significant effect of area deprivation on self-
reported health after accounting for individual depriva-
tion is likely to be sound. Pickett and Pearl (2001)
suggest that the choice of contextual variables is less
critical than the proper control for compositional
variables. The components of the Townsend scale were
chosen to measure deprivation at the individual level for
precisely this reason. These components describe each
individual sample member whereas the composite
Townsend score captures context as it applies to the
whole population in any area. The concerns of this
analysis were not to produce a regression equation to
predict poor health but to examine the evidence for
contextual effects on health. Therefore, we did not
include other variables in the model which have been
shown to predict poor health in other studies such as
education or marital status. Nevertheless, other work
using the BHPS has shown that neither education nor
marital status adds much to the prediction of who gets a
limiting illness (Bartley et al., 2004).
Although there was evidence of clustering of poor
health within electoral wards, the effect sizes are modest.
While the spatial variation in general health decreased as
the economy improved, there was greater area-level
variation in limiting illness in 1996, a time of growth in
ARTICLE IN PRESSA. Sacker et al. / Health & Place 12 (2006) 279–290 289
the UK economy, than in the recession year of 1992. By
2000, however, there was a suggestion that area effects
on limiting illness were beginning to decline. Reports of
limiting illness reflect not only health status, per se, but
also a response to a limited job market (Lindholm et al.,
2002). Individuals who exit the labour market for health
reasons may not move back into employment again until
there has been a considerable increase in the demand for
labour, changing employers’ attitudes towards the
health of potential employees. Thus, time trends in area
differences in limiting illness will tend to lag behind the
timing of economic recovery.
The ratio of household to area variability in the
baseline models for limiting illness remained fairly
steady over time while the proportion of variance in
general health attributed to the household increased
from 1992 to 2000. This could imply that the processes
generated by time and place (who you live with and
where you live) operate in different ways for the two
health outcomes. It is suggested that characteristics of
the local economy drive variations in limiting illness.
Travel to work areas (ONS Geography, 2003), located
along the continuum between households and electoral
wards (Rice et al., 1998), may capture area effects on
limiting illness more effectively because they best reflect
differences in the availability of employment. By
contrast, variation in general health may be driven more
by who people live with and the times in which they live
than the wider area where they are living. Given that
general health is well known to reflect both physical and
psychological perceptions of health (Fayers and Spran-
gers, 2002), our findings are entirely consistent with the
findings of Weich and Pampalon and their colleagues.
The former found little support for geographic variation
in common mental disorder while the latter reported
geographic variability in poor general health in studies
accounting for household clustering (Weich et al., 2003;
Pampalon et al., 1999). Several studies have found
similarities in health between couples, and these have
favoured mate selection and to a lesser extent common
environmental influences over contagion explanations
(Bookwala and Schulz, 1996; Dufort et al., 1994; Tambs
and Moum, 1992). Nevertheless, Tambs and Moum
(1992) found no support for converging health status
over time among a Norwegian sample. Our finding that
the similarity of general health within households
increased over time adds to the increasing number of
studies that highlight the magnitude of household level
effects on health. More detailed work is required to
explain these findings.
Acknowledgements
This work was funded as part of the Medical Research
Council’s ‘Health of the Public’ initiative. Grant no.
9900586. Data from the BHPS were supplied by the
ESRC Data Archive. Those who carried out the original
collection and analysis of the data bear no responsibility
for its further analysis and interpretation. The authors
gratefully thank Paul Clarke from the Department of
Infectious Disease Epidemiology, Imperial College,
London, for his helpful advice and comments on the
paper and Nick Buck of the Institute for Social and
Economic Research for providing the Townsend scores
for the BHPS data set.
References
Barnett, S., Roderick, P., Martin, D., Diamond, I., 2001. A
multilevel analysis of the effects of rurality and social
deprivation on premature limiting long term illness. Journal
of Epidemiology and Community Health 55, 44–51.
Bartley, M., Sacker, A., Clarke, P., 2004. Employment status,
employment conditions and limiting illness: prospective
evidence from the British Household Panel Survey
1991–2001. Journal of Epidemiology and Community
Health 58, 501–506.
Blakely, T.A., Woodward, A.J., 2000. Ecological effects in
multi-level studies. Journal of Epidemiology and Commu-
nity Health 54, 367–374.
Bookwala, J., Schulz, R., 1996. Spousal similarity in subjective
well-being: the cardiovascular health study. Psychology and
Aging 11, 582–590.
Boyle, M., Willms, J., 1999. Place effects for areas defined by
administrative boundaries. American Journal of Epidemiol-
ogy 149, 577–585.
Boyle, P., Norman, P., Rees, P., 2002. Does migration
exaggerate the relationship between deprivation and limit-
ing long-term illness? A Scottish analysis. Social Science and
Medicine 55, 21–31.
Chandola, T., Clarke, P., Wiggins, R.D., Bartley, M., 2003.
Households: the missing level of analysis in multilevel
epidemiological studies—the case for multiple membership
models. Paper presented at The 2003 British Household
Panel Survey Research Conference, Colchester, UK.
Curtis, S., Jones, I.R., 1998. Is there a place for geography in
the analysis of health inequality? Sociology of Health &
Illness 20, 645–672.
Diez Roux, A.V., 2001. Investigating neighborhood and area
effects on health. American Journal of Public Health 91,
1783–1789.
Diez Roux, A.V., 2002. Places, people and health. American
Journal of Epidemiology 155, 516–519.
Dufort, G.G., Kovess, V., Boivin, J.F., 1994. Spouse similarity
for psychological distress and well-being—a population
study. Psychological Medicine 24, 431–447.
Ecob, R., 1996. A multilevel modelling approach to examining
the effects of area of residence on health and functioning.
Journal of the Royal Statistical Society. Series A 159, 61–75.
Fayers, P.M., Sprangers, M.A.G., 2002. Understanding self-
rated health. The Lancet 359, 187–188.
Goldstein, H., 1995. Multilevel Statistical Models, 2nd ed.
Edward Arnold, London, pp. 97–112.

ARTICLE IN PRESSA. Sacker et al. / Health & Place 12 (2006) 279–290290
Goldstein, H., Browne, W., Rasbash, J., 2002. Partitioning
variation in multilevel models. Understanding Statistics 1,
223–231.
Humphreys, K., Carr-Hill, R., 1991. Area variations in health
outcomes: artefact or ecology. International Journal of
Epidemiology 20, 251–258.
Jones, K., Duncan, C., 1995. Individuals and their ecologies:
analysing the geography of chronic illness within a multi-
level modelling framework. Health & Place 1, 27–40.
Lindholm, C., Burstrom, B., Diderichsen, F., 2002. Class
differences in the social consequences of illness? Journal of
Epidemiology and Community Health 56, 188–192.
Malmstrom, M., Johansson, S., Sundquist, J., 2001. A
hierarchical analysis of long-term illness and mortality in
socially deprived areas. Social Science and Medicine 53,
265–275.
Marsh, P., Carlisle, R., Avery, A.J., 2000. How much does self-
reported health status, measured by the SF-36, vary between
electoral wards with different Jarman and Townsend scores?
British Journal of General Practice 50, 630–634.
Matheson, J., Summerfield, C. (Eds.), 2001, Social Trends No.
31. The Stationery Office, London.
Merlo, J., 2003. Multilevel analytical approaches in social
epidemiology: measures of health variation compared with
traditional measures of association. Journal of Epidemiol-
ogy and Community Health 57, 550–552.
O’Campo, P., 2003. Advancing theory and methods for
multilevel models of residential neighborhoods and health.
American Journal of Epidemiology 157, 9–13.
ONS Geography, 2003. National Statistics Geographic Glos-
sary. National Statistics, London.
Pampalon, R., Duncan, C., Subramanian, S.V., Jones, K.,
1999. Geographies of health perception in Quebec: a
multilevel perspective. Social Science and Medicine 48,
1483–1490.
Pickett, K.E., Pearl, M., 2001. Multilevel analyses of neigh-
bourhood socioeconomic context and health outcomes: a
critical review. Journal of Epidemiology and Community
Health 55, 111–122.
Rasbash, J., Browne, W., Goldstein, H., Yang, M., Plewis, I.,
Healy, M., Woodhouse, G., Draper, D., Langford, I.,
Lewis, T., 2000. A User’s Guide to MlwiN. Institute of
Education, University of London, London.
Reijneveld, S.A., Verheij, R.A., de Bakker, D.H., 2000. The
impact of area deprivation on differences in health: does
the choice of the geographical classification matter?
Journal of Epidemiology and Community Health 54,
306–313.
Rice, N., Carr-Hill, R., Dixon, P., Sutton, M., 1998. The
influence of households on drinking behaviour: a multilevel
analysis. Social Science and Medicine 46, 971–979.
Robert, S., 1998. Community-level socioeconomic status effects
on adult health. Journal of Health and Social Behavior 39,
18–37.
Shouls, S., Congdon, P., Curtis, S., 1996. Modelling inequality
in reported long term illness in the UK: combining
individual and area characteristics. Journal of Epidemiology
and Community Health 50, 366–376.
Sloggett, A., Joshi, H., 1998. Deprivation indicators as
predictors of life events 1981–1992 based on the UK ONS
Longitudinal Study. Journal of Epidemiology and Commu-
nity Health 52, 228–233.
Snijders, T.A.B., Bosker, R.J., 1999. Multilevel Analysis—An
Introduction to Basic and Advanced Multilevel Modeling.
Sage Publications, Thousand Oaks, CA.
Stafford, M., Bartley, M., Mitchell, R., Marmot, M., 2001.
Characteristics of individuals and characteristics of areas:
investigating their influence on health in the Whitehall II
study. Health & Place 7, 117–129.
Subramanian, S.V., Lochner, K.A., Kawachi, I., 2003. Neigh-
borhood differences in social capital: a compositional
artefact or a contextual construct? Health & Place 9, 33–44.
Tambs, K., Moum, T., 1992. No large convergence during
marriage for health, life-style, and personality in a large
sample of Norwegian spouses. Journal of Marriage and the
Family 54, 957–971.
Townsend, P., Phillimore, P., Beattie, A., 1988. Health and
Deprivation: Inequality and the North. Croom Helm,
London.
Veugelers, P., Yip, A.M., Kephart, G., 2001. Proximate and
contextual socioeconomic determinants of mortality: multi-
level approaches in a setting with universal health care
coverage. American Journal of Epidemiology 154, 725–732.
Weich, S., Holt, G., Twigg, L., Jones, K., Lewis, G., 2003.
Geographic variation in the prevalence of common mental
disorders in Britain: a multilevel investigation. American
Journal of Epidemiology 157, 730–737.
Wiggins, R.D., Bartley, M., Gleave, S., Joshi, H., Lynch, K.,
Mitchell, R., 1998. Limiting long-term illness: a question of
where you live or who you are? A multilevel analysis of the
1971–1991 ONS longitudinal study. Risk Decision and
Policy 3, 181–198.
Wiggins, R.D., Joshi, H., Bartley, M., Gleave, S., Lynch, K.,
Cullis, A., 2002. Place and personal circumstances in a
multilevel account of women’s long-term illness. Social
Science and Medicine 54, 827–838.