time to de-globalise south africa & durban?ccs.ukzn.ac.za/files/bond_durban_chamber_of... · of...
TRANSCRIPT

Rand volatility:
Centre for Civil Society
South Africa
presentation to: Women in Business Forum,
Durban Chamber of Commerce and Industry
26 April 2016
Patrick Bond, Director, University of KwaZulu-Natal Centre for Civil Society and
Professor of Political Economy, University of the Witwatersrand School of Governance
time to de-globalise
& Durban?


“the patterns of modern trade and global growth are not behaving in 2016 as western and emerging market financiers might have expected, or as they did during earlier booms.”

South Durban’s dig-out port
old airport site today new dig-out port, 2020 (?!)

why a de-globalised
Centre for Civil Society
Durban? • rejigging GDP for women and nature
• global economic crisis • financial volatility
• shipping overcapacity • global mega-project corruption
• local deindustrialisation • global climate change
• unfulfilled local economic linkages • meet unmet demands: Freedom Charter,
Reconstruction and Development Programme and Constitution
• model: access to AIDS medicines
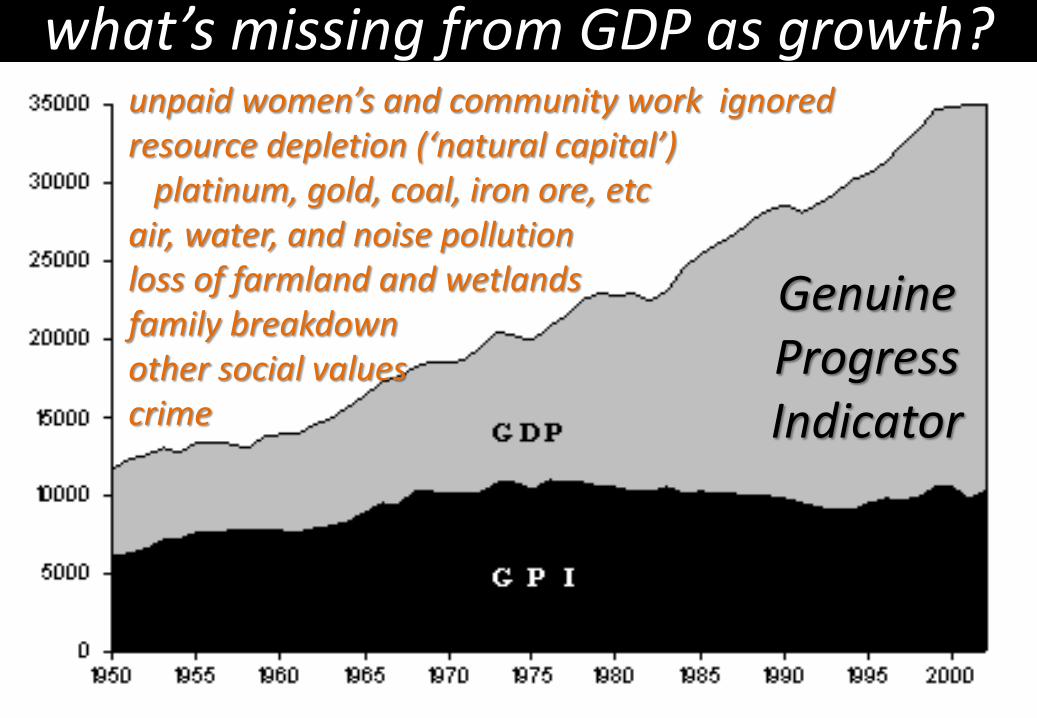
what’s missing from GDP as growth? unpaid women’s and community work ignored resource depletion (‘natural capital’) platinum, gold, coal, iron ore, etc air, water, and noise pollution loss of farmland and wetlands family breakdown other social values crime
Genuine Progress Indicator

world economic crisis
• GDP growth stagnating • overinvestment • commodities
• trade • ‘emerging’ (submerging) markets
• BRICS crumble • financial chaos

Source: Michael Roberts
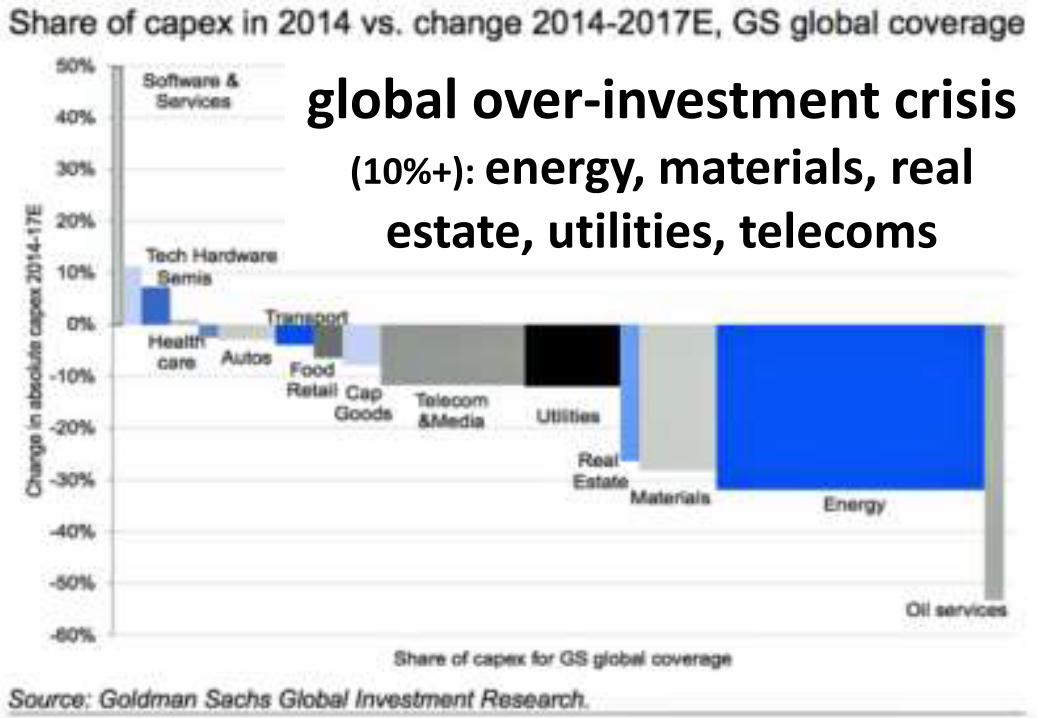
global over-investment crisis (10%+): energy, materials, real
estate, utilities, telecoms
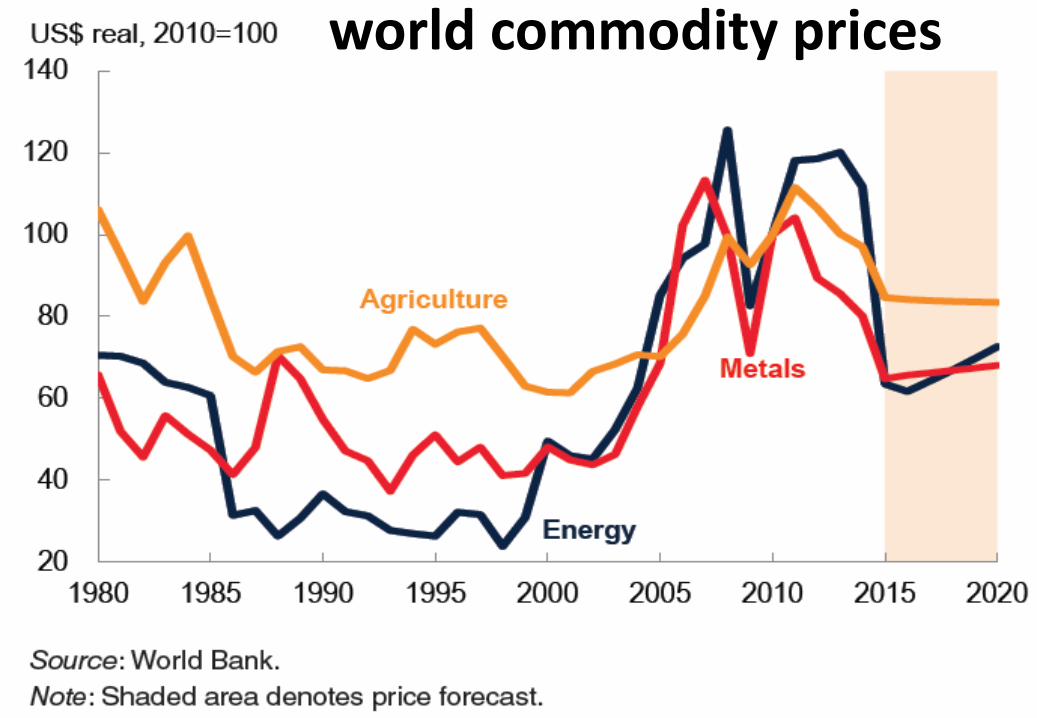
world commodity prices


Commodity price changes, 1900-2011 “global commodity prices, 1900-2011

Commodity price changes, 1900-2015 Aafter 2011 peak, 50%+ crash

commodity futures index

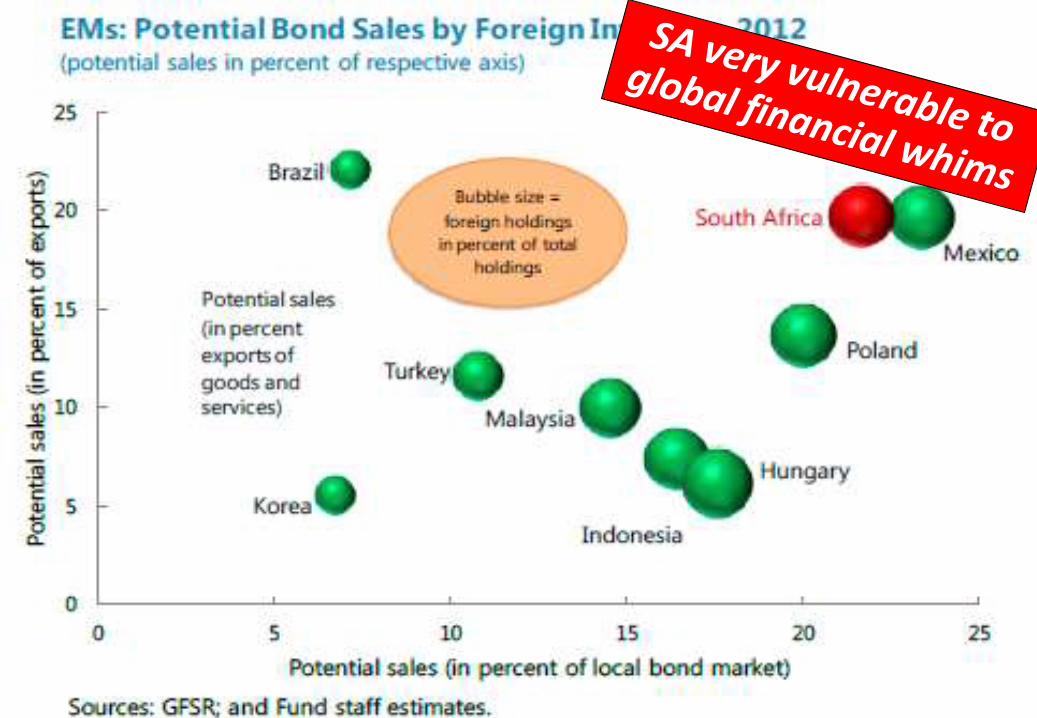
volatile exchange rates

financiers delinking from global ‘real’ economy
16
fin.assets
GDP
market value of financial assets and aggregate global GDP at
current prices (billion US dollars) Source : Leda Paulani, USP with
McKinsey Global Report data
dangerous context!

dangerous
Source: McKinsey Global Report – « Debt and (not much) deleveraging »
even more 2007-09 crash,
$57 trillion debt increase
notwithstanding
global finance is now


Trade growth flat emerging market
GDP growth rates

SOUTH AFRICA, 2010
why BRICs? answer from New York/London: building-block ‘bricks’ of 21st century world capitalism
Jim O’Neil, Goldman Sachs


SOUTH AFRICA (added in 2010)
Jim O’Neil, Goldman Sachs
update: with BRICS crumbling,
in 2013 O’Neil chose ‘MINT’ Mexico, Indonesia, Nigeria, Turkey


moments of the ‘Faustian Pact’ (as Ronnie Kasrils has described concessions)
that during 1990s, cemented inequality
10 decisions taken by Presidency, Finance Ministers and Reserve Bank Governors: · repay $25 billion of inherited apartheid-era foreign debt (October 1993) · give SA Reserve Bank ‘independence’ in interim constitution (November 1993) · borrow $850 million from the IMF with tough conditions (December 1993) · reappoint finance minister Derek Keys and SARB governor Chris Stals (May 1994) · join General Agreement on Tariffs and Trade (‘WTO’) on bad terms (August 1994) · lower primary corporate taxes from 48% to 29% and maintain countless white people’s and corporate privileges (1994-99) · privatise peripheral parts of the state, demutualise mega-insurers (1995-99) · relax exchange controls (the ‘finrand’) and raise interest rates (March 1995) · adopt neoliberal Growth, Employment and Redistribution (‘Gear’) (June 1996) · grant permission to South Africa’s biggest companies to move their financial headquarters and primary stock market listings to London (1999)

Source: SARB Quarterly Bulletin 1/2014
rand crash rand crash


SA interest rates have been too high since 1994,
compared to prior era
real (after-inflation)
SA Reserve Bank interest rate

the SA Reserve Bank raised rates four times in 2015 & 2016… even
though our economy slows

…even though the inflation rate has been well within
the 3-6% target range, just hitting 7% in February

…even though business confidence
is crashing to new post-1994 lows

The PMI index is based on five major indicators:
new orders, inventory levels, production, supplier
deliveries and the employment environment.
…even though manufacturing
output is falling
Purchasing Managers Index - Manufacturing
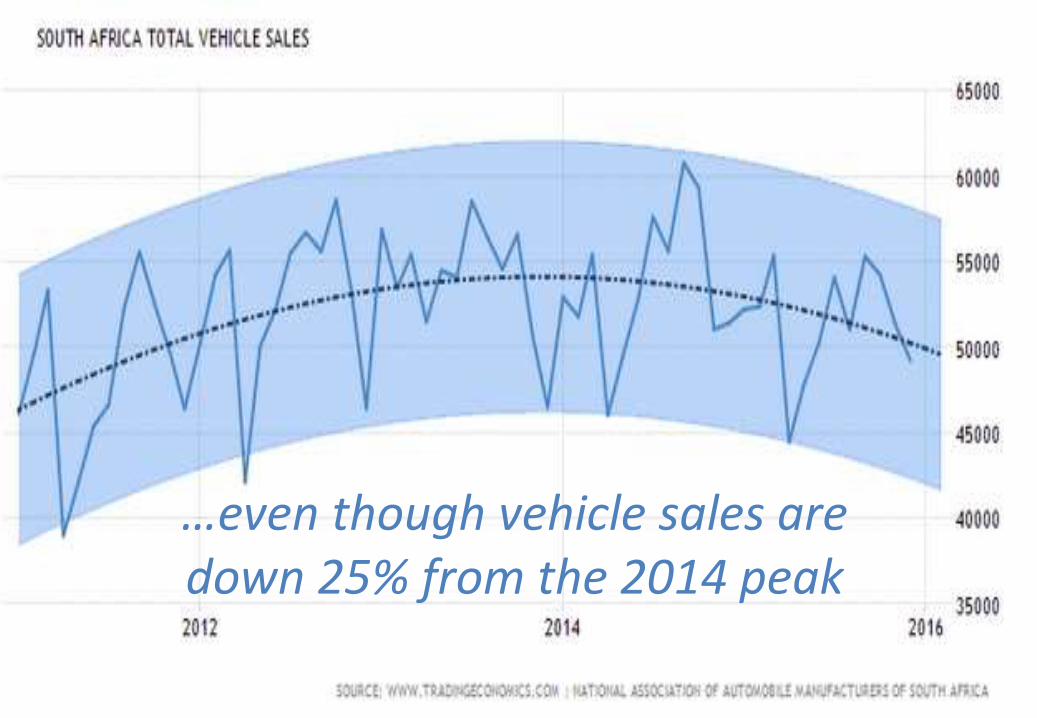
…even though vehicle sales are down 25% from the 2014 peak

…even though in spite of the falling rand since 2011,
there is a longer-term, persistent trade deficit,

…and even though with a trade surplus,
huge outflows of corporate profits flow to London, leaving the current account with a worsening deficit

…even though SA corporations are on an investment strike

even though SA consumers are hurting
(especially in late 2015)

The PMI index is based on five major indicators: new
orders, inventory levels, production, supplier
deliveries and the employment environment.
even though manufacturers are crashing

…even though households are still severely over-indebted and many won’t survive another rate hike

…even though economic growth is in a tailspin


KwaZulu-Natal Provincial Growth and Development Strategy: 2015 infrastructure update
Several key strategic infrastructure projects that are changing the spatial patterns of the Province have a high demand for co-ordinated implementation of infrastructure. These projects are: • Aerotropolis, which stretches from King Shaka International Airport the 30km radius
stretches from Stanger in the north to the City Centre in the south and the 15km radius from Ballito in the north to Umhlanga in the south;
• SEZ: Dube Trade Port will require land incrementally to be available over the next 10 to 15 years to meet the growing demand for housing, business parks and offices, logistics, education and training facilities among other support services;
• Strategic Infrastructure Projects (SIP 1 and 2) has the potential to integrate the marginalised rural production centres surrounding the respective corridors that are currently isolated from the main logistic 15 systems. They are central to the enhance connectivity provincially as well as nationally to improve road and rail connectivity from respective harbours and ports;
• Industrial Development Zones, feasibility studies are finalised and several of these are considered feasible. The Department of Economic development and Tourism has also initiated several projects that will see the development of these within the next few years;

KwaZulu-Natal Provincial Growth and Development Strategy: 2015 infrastructure update: Durban export/import projections

South Durban’s dig-out port
old airport site today new dig-out port, 2020 (?!)

Transnet’s South Durban Dig-Out Port: ubiquitous image of what we can expect

R250 billion shipping-petrochem makeover: 1) 1-3) deepening/widening of old port
2) 4) new roads & dug-out port (old airport) 3) 5-6) major expansion of old port
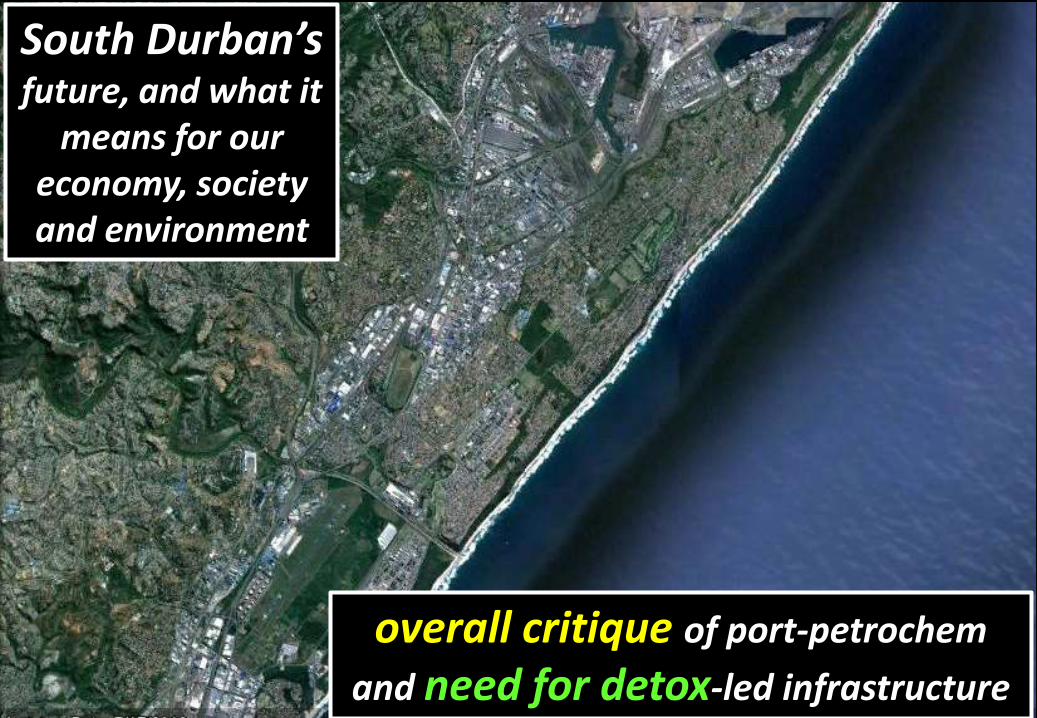
South Durban’s future, and what it
means for our economy, society and environment
overall critique of port-petrochem
and need for detox-led infrastructure

single buoy mooring:
80% of SA’s intake
Sapref: BP/Shell
Engen: 80% Petronas
(Malaysia)
hypertoxic South Durban,
‘Africa’s armpit’
Toyota car assembly
Mondi paper mill
hazardous petro-chemical plants
Africa’s biggest port
Island View tank farm
Africa’s largest oil refining complex
container terminals
freight traffic
(often illegal)
new capacity: $25 billion plan


the world’s filthiest transport energy


‘usual suspects’ won contracts: • Ibhola Lethu beneficiaries include Craig Simmer (official of crashed bus privatizer Remant Alton and Point development flop Dolphin Whispers) • Broederbonder firm Bruinette Kruger Stoffberg • Group 5/WBHO with Tokyo Sexwale’s and Bulelani Ngcuka’s Mvelaphanda group, • electricity deal: Vivian Reddy’s Edison Power
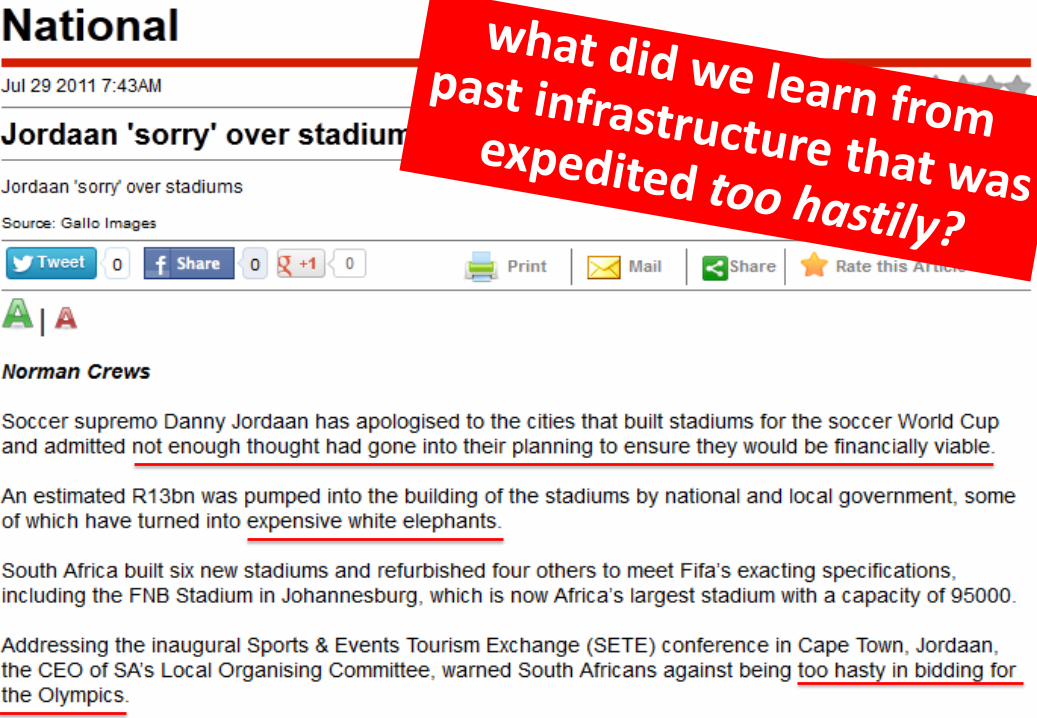
Durban citizens ask: a sensible investment? vast cost escalation: began as R2 billion in 2006,
then came corruption collusion
next door to Mabhida: perfectly functional 52,000-seater Absa Stadium hosting rugby

who wins from new
infrastructure spending? • Johan van Zyl, Toyota SA CEO: ‘Durban as a
brand is not strong enough to simply say “come and invest in Durban”. What it needs to attract investors are big projects. Durban needs to keep ahead of the competition. China is building ports they don’t even know when they will use. If return on investment is the line of thinking we may never see
the infrastructure.’ – 6 February 2012

December 2015 announcement: a ‘couple of years’ delay but
competitive-port rationale continues
what next for Durban Dig Out Port?

global rate of trade (% y-o-y)

overbuilding of ships

“the patterns of modern trade and global growth are not behaving in 2016 as western and emerging market financiers might have expected, or as they did during earlier booms.”

“the patterns of modern trade and global growth are not behaving in 2016 as western and emerging market financiers might have expected, or as they did during earlier booms.”

old ships: 5000 TEUs (20ft containers)
anything bigger: ‘post-Panamax’

can Durban harbour go post-Panamax? will overcapacity wreck North-South shipping?

new hub-spoke model for container ports

now there’s a Pandora’s Box opening up for mega-shipping: the route across the North Pole

and there’s deep-sea oil to be drilled down there, too


thanks in part (4%) to bunker fuels

can we use climate change arguments in
Environmental Impact
Assessments, to question the logic of hyper-
competitive port-petrochem
expansion?

our complaint: Transnet hires eco-
consultants who are climate denialists


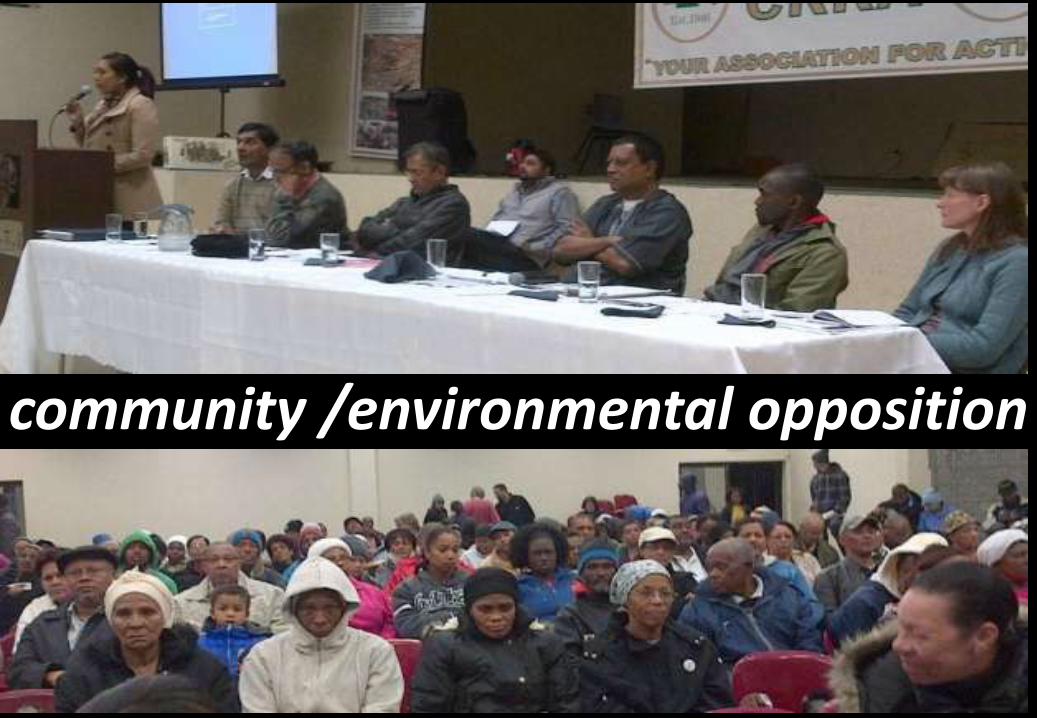
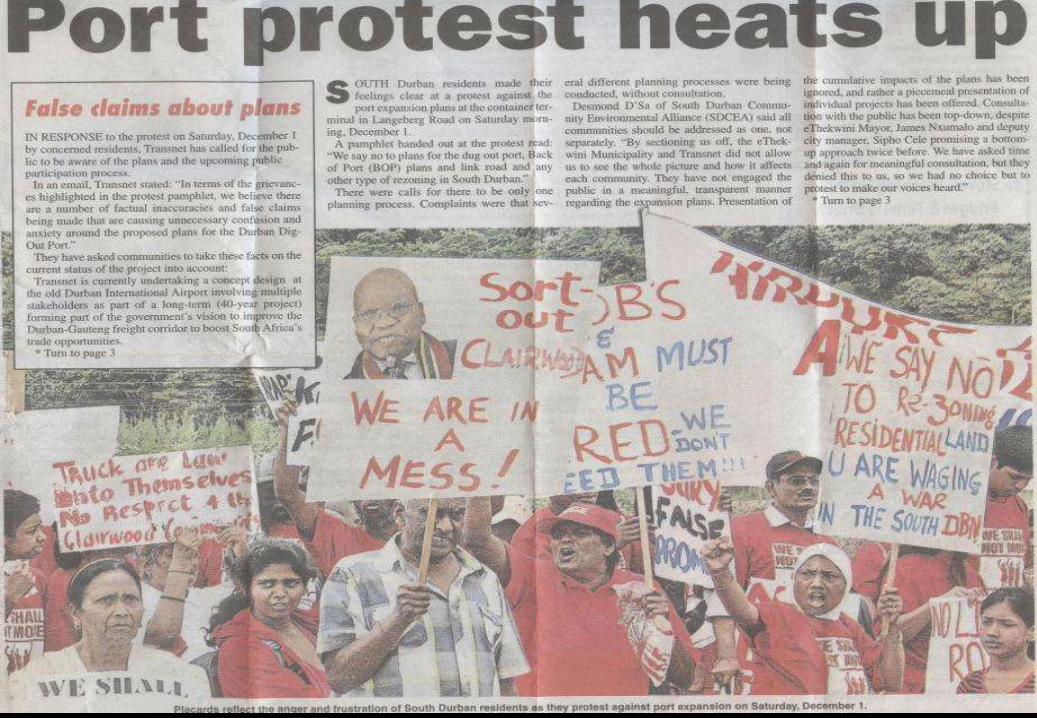
community /environmental opposition

in meeting after meeting: unanimous opposition to port-petrochem expansion


October 10, 2011
October 11, 2011: war on Engen
Settlers Primary School: 52% asthma rate, highest in world

will state/capital’s incremental strategy plus community co-optation work?


Poverty line
rebasing by StatsSA means a substantial increase in the estimates for overall poverty (from 45.5% to 53.8%) when a switch is made from the existing upper-bound poverty line of R620 per-person-per-month to the revised level of R779 per-person-per-month. 29 million South
Africans in poverty
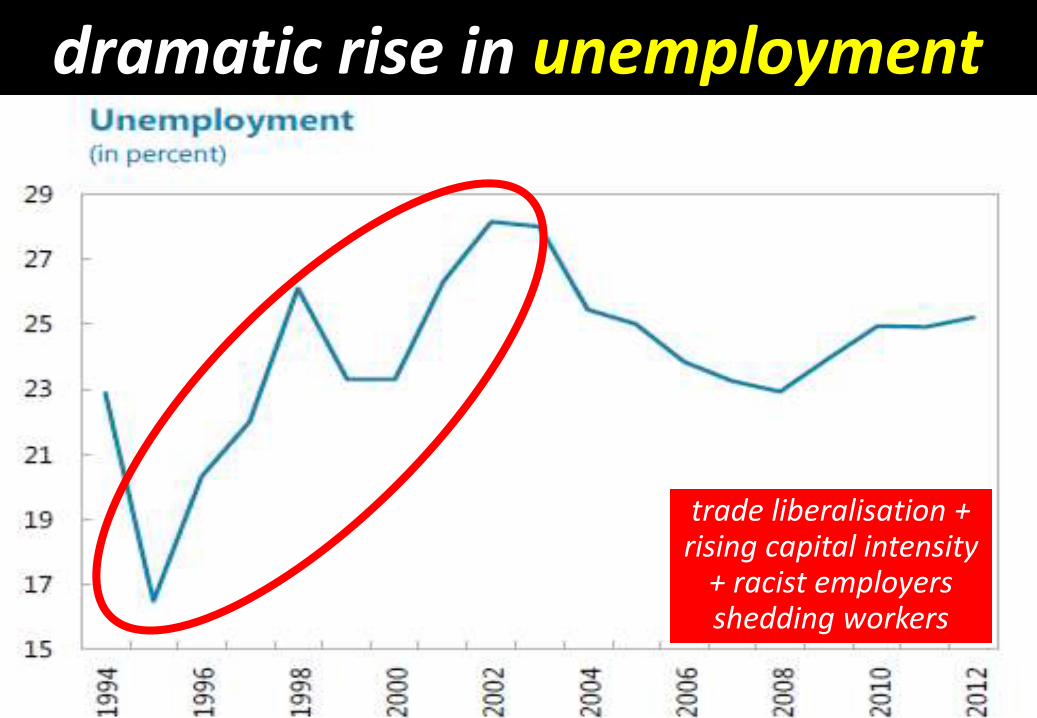
dramatic rise in unemployment Source: IMF Article IV on SA, July 2013
trade liberalisation + rising capital intensity
+ racist employers shedding workers

inequality in 2011 SA is worst amongst large societies
by all measures, far worse than in 1994

SA has a far lower public domestic debt than peer economies
Malaysia, Brazil, Argentina, Thailand
could SA’s Treasury spend more?


very modest post-apartheid increase in social spending


grant spending burden to shrink

Source: IMF Article IV on SA, July 2013
SA corporate profits: world’s 3rd highest

artificially high?

De Beers
hurts the
SA Treasury

trade mispricing by just one firm, 2004-12
US$2.83 bn http://thestudyofvalue.org/2014/05/15/new-
lcsv-working-paper-explores/

debt due to “current account deficit” - mainly dividend/profit/interest outflows
trade deficit
SA’s capital outflow Source: SARB Quarterly Bulletin 1/2009
relisting of Anglo American, De Beers, SAB Miller, Investec, Old Mutual,
Didata, Mondi (after Liberty Life, BHP Billiton, etc)

BRICS countries having a very hard time retaining surpluses

Moeletsi Mbeki:
“Big companies taking their capital out of South Africa are a bigger
threat to economic freedom than… Julius Malema.”

threat is rising!

$32 billion
$135 billion
South Africa’s soaring foreign debt

SA borrows hard currency to pay profits, dividends and interest
PW Botha ‘Rubicon’
Speech
Source: SARB Quarterly Bulletin 1/2014


world’s highest property bubble 389% rise, 1997-2008
responsible for explosion of construction, finance
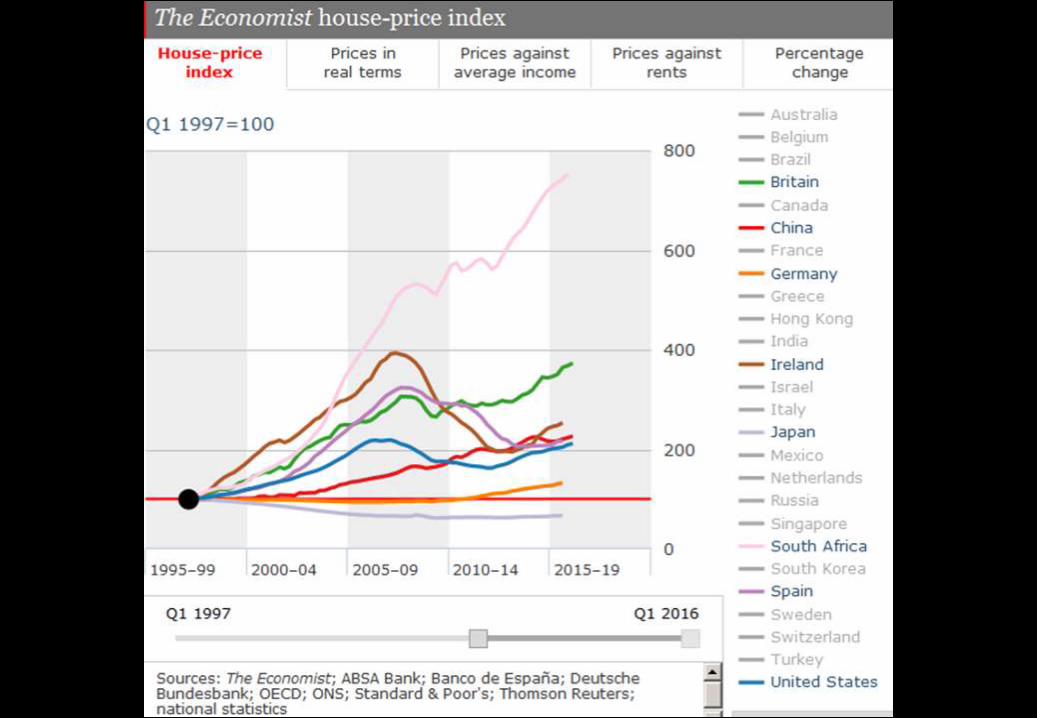

Source: SARB Quarterly Bulletin 1/2014 SA: stock market was the world’s most bubbly, 2008-14

Source: IMF Article IV on SA, July 2013

SA: for households,
amongst world’s worst
ratios of ‘wealth’
composed of speculative
financial assets

20th c. South African growth/decline
deglobalisation
globalisation and world stagnation
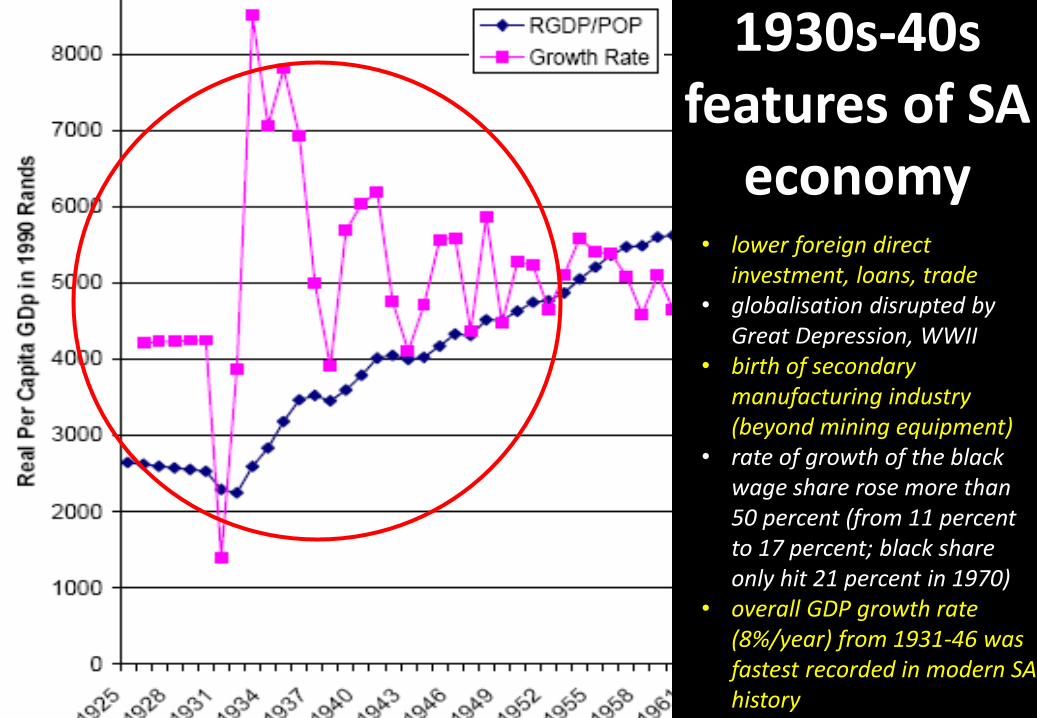
1930s-40s features of SA
economy • lower foreign direct
investment, loans, trade • globalisation disrupted by
Great Depression, WWII • birth of secondary
manufacturing industry (beyond mining equipment)
• rate of growth of the black wage share rose more than 50 percent (from 11 percent to 17 percent; black share only hit 21 percent in 1970)
• overall GDP growth rate (8%/year) from 1931-46 was fastest recorded in modern SA history

what economic policies are needed to reverse banker power over South Africa?
• reimpose exchange controls, lower interest rates, audit SA’s ‘Odious Debt’, control illicit capital flows & trade
• adopt industrial policy aimed at import substitution, sectoral re-balancing, social needs, eco-sustainability
• increase state social spending (e.g. for National Health Insurance, higher education, larger welfare grants and comprehensive social security), paid for by higher corporate taxes, cross-subsidisation and more domestic borrowing (and loose-money ‘Quantitative Easing’)
• reorient infrastructure to meet unmet basic needs, and expand/maintain/improve energy grid, sanitation, public transport, clinics, schools, recreational facilities, internet
• adopt ‘Million Climate Jobs’ strategies to generate employment for a genuinely green ‘Just Transition,’ with generous minimum wage
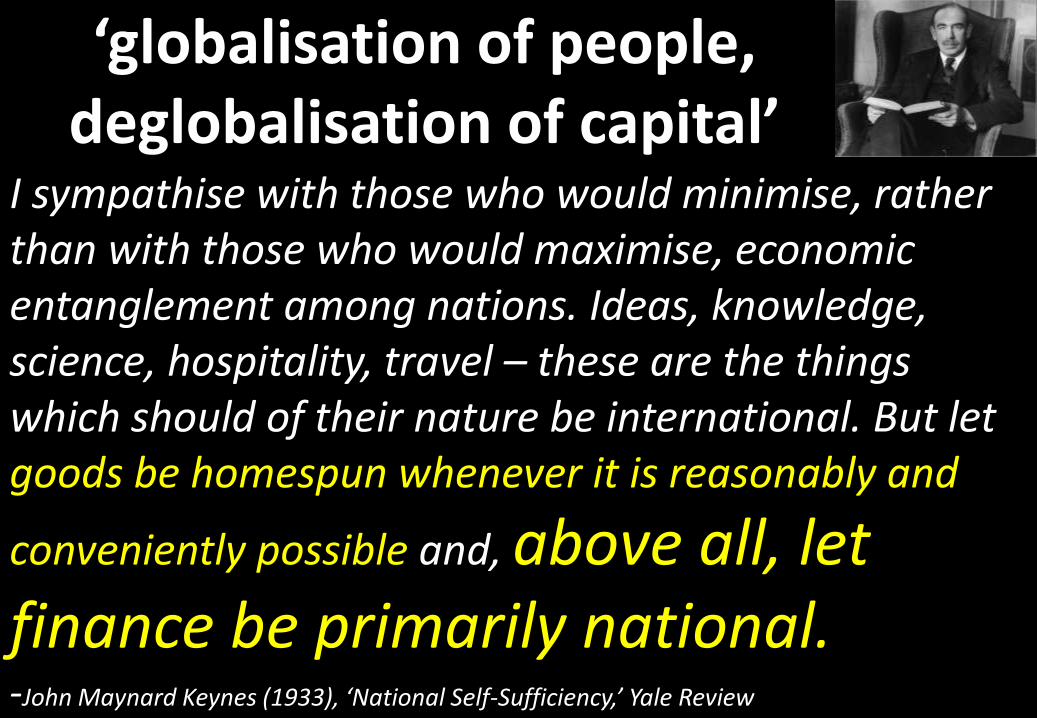
‘globalisation of people, deglobalisation of capital’
I sympathise with those who would minimise, rather than with those who would maximise, economic entanglement among nations. Ideas, knowledge, science, hospitality, travel – these are the things which should of their nature be international. But let goods be homespun whenever it is reasonably and
conveniently possible and, above all, let finance be primarily national. -John Maynard Keynes (1933), ‘National Self-Sufficiency,’ Yale Review.


deglobalisation of capital applied to AIDS medicines campaigning


case study of successful SA-internationalist social movement advocacy for
AIDS policy and solidarity: access to Anti-RetroVirals
Gugu Dlamini
• 1990s – US promotes Intellectual Property above all, so monopoly-patented ARVs cost $10-15,000/person/year – way too expensive!
• 1997 – SA’s Medicines Act allows ‘compulsory licensing’ to break patent for generic producers – i.e., deglobalisation of medicines;
• 1998 – US State Dept counters Medicines Act with ‘full court press’, Treatment Action Campaign (TAC) formed, stoning death of AIDS activist Gugu Dlamini in her Durban township due to stigmatisation
• 1999 – Al Gore for president, ACTUP! opposition to Gore, Seattle WTO protest, Bill Clinton surrender, ‘AIDS dissidents’ emerge
• 2000 – AIDS conference in Durban, rise of Thabo Mbeki’s denialism • 2001 – ‘PMA-SA v Mandela’ lawsuit w Medicines sans Frontiers &
Oxfam, while TAC imports Thai, Brazilian, Indian generics

TAC’s Anti-RetroVirals campaign:
Zackie Ahmat,
Nelson Mandela
• 2001 – Constitutional Court supports nevirapine, major World Trade Organisation (TRIPS) concession, Doha
• 2002 – critiques of Mbeki, Manto Tshabalala-Msimang • 2003 – ANC compels change in state policy • 2004 – generics produced in SA, global AIDS funds increase • 2013 – 4 million public sector recipients of ARVs • 2014-16 threats – fiscal conservatism, Obama’s Pepfar cuts
strategic successes: • dramatic rise in life expectancy • from 52 in 2005 to 62 in 2015
• ‘commoning’ of intellectual property • decommodification and destratification
• deglobalisation of capital • globalisation of solidarity
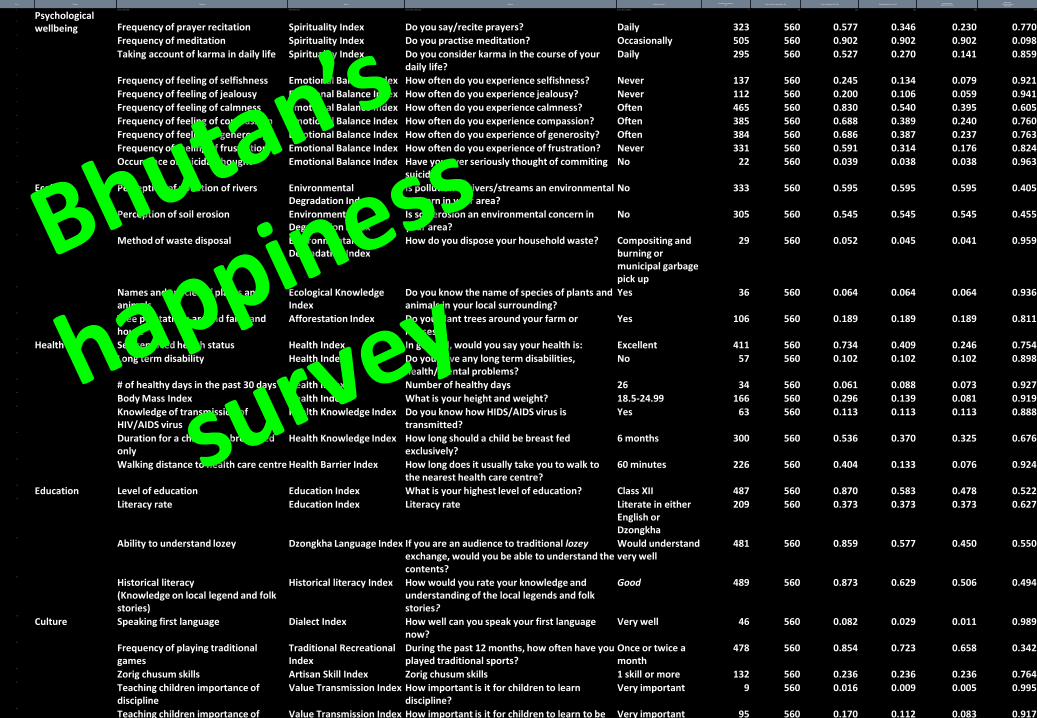
Sl no. Domain Indicators Indexes Question Sufficiency cut off Insufficiency Headcount
(H) Total number of respondents (N) Avg. Insufficiency (HI)= H/N Average distance from cutoff
Average squared
distance from cutoff
GNH Index=
1-Average distance
from cutoff
1
Psychological wellbeing
General mental health Mental Health Index General Health Questionnaire Normal mental wellbeing 74 560 0.132 0.026 0.010 0.990
2
Frequency of prayer recitation Spirituality Index Do you say/recite prayers? Daily 323 560 0.577 0.346 0.230 0.770 3
Frequency of meditation Spirituality Index Do you practise meditation? Occasionally 505 560 0.902 0.902 0.902 0.098 4
Taking account of karma in daily life Spirituality Index Do you consider karma in the course of your daily life?
Daily 295 560 0.527 0.270 0.141 0.859
5
Frequency of feeling of selfishness Emotional Balance Index How often do you experience selfishness? Never 137 560 0.245 0.134 0.079 0.921 6
Frequency of feeling of jealousy Emotional Balance Index How often do you experience jealousy? Never 112 560 0.200 0.106 0.059 0.941 7
Frequency of feeling of calmness Emotional Balance Index How often do you experience calmness? Often 465 560 0.830 0.540 0.395 0.605 8
Frequency of feeling of compassion Emotional Balance Index How often do you experience compassion? Often 385 560 0.688 0.389 0.240 0.760 9
Frequency of feeling of generosity Emotional Balance Index How often do you experience of generosity? Often 384 560 0.686 0.387 0.237 0.763 10
Frequency of feeling of frustration Emotional Balance Index How often do you experience of frustration? Never 331 560 0.591 0.314 0.176 0.824 11
Occurrence of suicidal thought Emotional Balance Index Have you ever seriously thought of commiting suicide?
No 22 560 0.039 0.038 0.038 0.963
12
Ecology Perception of pollution of rivers Enivronmental Degradation Index
Is pollution of rivers/streams an environmental concern in your area?
No 333 560 0.595 0.595 0.595 0.405
13
Perception of soil erosion Environmental Degradation Index
Is soil erosion an environmental concern in your area?
No 305 560 0.545 0.545 0.545 0.455
14
Method of waste disposal Environmental Degradation Index
How do you dispose your household waste? Compositing and burning or municipal garbage pick up
29 560 0.052 0.045 0.041 0.959
15
Names and species of plants and animals
Ecological Knowledge Index
Do you know the name of species of plants and animals in your local surrounding?
Yes 36 560 0.064 0.064 0.064 0.936
16
Tree plantations around farm and house
Afforestation Index Do you plant trees around your farm or houses?
Yes 106 560 0.189 0.189 0.189 0.811
17
Health Self reported health status Health Index In general, would you say your health is: Excellent 411 560 0.734 0.409 0.246 0.754 18
Long term disability Health Index Do you have any long term disabilities, health/mental problems?
No 57 560 0.102 0.102 0.102 0.898
19
# of healthy days in the past 30 days Health Index Number of healthy days 26 34 560 0.061 0.088 0.073 0.927 20
Body Mass Index Health Index What is your height and weight? 18.5-24.99 166 560 0.296 0.139 0.081 0.919 21
Knowledge of transmission of HIV/AIDS virus
Health Knowledge Index Do you know how HIDS/AIDS virus is transmitted?
Yes 63 560 0.113 0.113 0.113 0.888
22
Duration for a child to be breast fed only
Health Knowledge Index How long should a child be breast fed exclusively?
6 months 300 560 0.536 0.370 0.325 0.676
23
Walking distance to health care centre Health Barrier Index How long does it usually take you to walk to the nearest health care centre?
60 minutes 226 560 0.404 0.133 0.076 0.924
24
Education Level of education Education Index What is your highest level of education? Class XII 487 560 0.870 0.583 0.478 0.522 25
Literacy rate Education Index Literacy rate Literate in either English or Dzongkha
209 560 0.373 0.373 0.373 0.627
26
Ability to understand lozey Dzongkha Language Index If you are an audience to traditional lozey exchange, would you be able to understand the contents?
Would understand very well
481 560 0.859 0.577 0.450 0.550
27
Historical literacy (Knowledge on local legend and folk stories)
Historical literacy Index How would you rate your knowledge and understanding of the local legends and folk stories?
Good 489 560 0.873 0.629 0.506 0.494
28
Culture Speaking first language Dialect Index How well can you speak your first language now?
Very well 46 560 0.082 0.029 0.011 0.989
29
Frequency of playing traditional games
Traditional Recreational Index
During the past 12 months, how often have you played traditional sports?
Once or twice a month
478 560 0.854 0.723 0.658 0.342
30
Zorig chusum skills Artisan Skill Index Zorig chusum skills 1 skill or more 132 560 0.236 0.236 0.236 0.764 31
Teaching children importance of discipline
Value Transmission Index How important is it for children to learn discipline?
Very important 9 560 0.016 0.009 0.005 0.995
32
Teaching children importance of impartiality
Value Transmission Index How important is it for children to learn to be impartial towards rich, poor, different status, etc.
Very important 95 560 0.170 0.112 0.083 0.917
33
Knowledge of mask and other dances performed in tshechus
Community Festival Index How would you rate your knowledge and understanding of the mask and other dances performed during national/local tshechu?
Good 446 560 0.796 0.552 0.429 0.571
34
Importance of reciprocity as a life principle
Reciprocity Index Please indicate the importance that you assign to reciprocity in life
Very important 133 560 0.238 0.126 0.070 0.930
35
Attitude towards killing Basic Precept Index Is killing justifiable? Can never be justified
35 560 0.063 0.032 0.017 0.983
36
Attitude towards stealing Basic Precept Index Is stealing justifiable? Can never be justified
28 560 0.050 0.026 0.014 0.986
37
Attitude towards lying Basic Precept Index Is lying justifiable? Can never be justified
98 560 0.175 0.088 0.044 0.956
38
Attitude towards sexual misconduct Basic Precept Index Is sexual misconduct justifiable? Can never be justified
29 560 0.052 0.026 0.013 0.987
39
No. of days spent in a year attending community festivals
Community Festival Index On an average, how many days do you spend in a year attending social and cultural activities, such community festivals or chokus of neighbours?
6-12 days 352 560 0.629 0.339 0.195 0.805
40
Living standards Household income Living Standard Index What was the approximate total cash income for your household during the past 12 months?
70,597 438 560 0.782 0.533 0.405 0.595
41
Income sufficiency to meet everyday needs
Living Standard Index How well does your total household income meet your family's everyday needs for food, shelter and clothing?
Just enough 69 560 0.123 0.123 0.123 0.877
42
Food insecurity Living Standard Index In the past 12 months, did you cut the size of your meal or skip meals because there wasn't enough food and money for food?
No 12 560 0.021 0.021 0.021 0.979
43
House ownership Living Standard Index Is the dwelling in which you live, rented or owned?
Owned 73 560 0.130 0.130 0.130 0.870
44
Room ratio Living Standard Index Number of persons per room 2 persons/room 187 560 0.334 0.119 0.054 0.946 45
Purchase of second hand clothes Hardship Index In the past 12 months, did you buy second hand clothes instead of new ones to keep costs down?
No 161 560 0.288 0.288 0.288 0.713
46
Difficulty in contributing to community festivals
Hardship Index In the past 12 months, did you have difficulty in contributing to community festivals?
No 82 560 0.146 0.146 0.146 0.854
47
Postponement of urgent repairs and maintenance of house
Hardship Index In the past 12 months, did you postpone urgent repairs and maintenance of your household
No 180 560 0.321 0.321 0.321 0.679
48
Time use Total working hours Time Index Total working hours 7 hours 338 560 0.604 0.162 0.054 0.946 49
Sleep hours Time Index Sleeping hours 8 hours 125 560 0.223 0.030 0.007 0.993 50
Community vitality
Sense of trust in neighbours Community Trust Index How much do you trust your neighbours? Trust most of them
329 560 0.588 0.251 0.122 0.878
51
Neighbours helping each other in the community
Social Support Index Would you say this is a neighbourhood where neighbours help one another?
Always 280 560 0.500 0.181 0.072 0.928
52
Labour exchange with community members
Reciprocity Index Did you exchange labour with any community members during the past 12 months?
Yes 147 560 0.263 0.263 0.263 0.738
53
Socializing with friends Socialization Index In the last month, how often did you socialize with your friends?
Few times a week 279 560 0.498 0.245 0.152 0.848
54
Members of your family really care about each other
Family Index Do the members of your family really care about each other?
Agree 22 560 0.039 0.029 0.023 0.977
55
You wish you were not part of your family
Family Index Do you wish you were not part of your family Disagree 35 560 0.063 0.042 0.032 0.968
56
Members of your family argue too much
Family Index Do the members of your family argue too much Disagree 157 560 0.280 0.167 0.110 0.890
57
There is a lot of understanding in your family
Family Index Is there lot of understanding in your family? Agree 63 560 0.113 0.076 0.058 0.942
58
Your family is a real source of comfort to you
Family Index Is your family is a real source of comfort to you?
Agree 33 560 0.059 0.040 0.031 0.969
59
No. of relatives living in the same community
Kinship index Number of relatives living in the same community
Most 326 560 0.582 0.345 0.235 0.765
60
Victim of crime Safety Index Have you been a victim of crime in the last twelve months?
No 7 560 0.013 0.013 0.013 0.988
61
Feelings of safety from human harm Safety Index How safe do you feel when walking alone in your neighbourhood or village after dark from human harm?
Always safe 203 560 0.363 0.245 0.186 0.814
62
Sense of enmity in the community Safety Index Did enmity rise in the community during the last twelve months?
No 71 560 0.127 0.127 0.127 0.873
63
No. of days volunteered Reciprocity Index On an average how many days did you spend during the past 12 months doing voluntary activity on your own?
11 days 387 560 0.691 0.541 0.501 0.499
64
Amount of donation in cash value Reciprocity Index Total amount donate in the past 12 months 10% of your income
392 560 0.700 0.506 0.413 0.587
65
Availability of social support Social Support Index How often is someone there to help you when you have problems?
Most of the time 390 560 0.696 0.404 0.257 0.743
66
Good governance Performance of central government in reducing income gap
Government Performance Index
Rate the performance of central government in reducing gap between rich and poor
Excellent 331 560 0.591 0.359 0.243 0.757
67
Performance of central governmentt in fighting corruption
Government Performance Index
Rate the performance of central government in fighting corruption
Excellent 292 560 0.521 0.312 0.207 0.793
68
Right to freedom of speech and opinion
Freedom Index Do you feel that you have right to freedom of speech and opinion
Yes 43 560 0.077 0.077 0.077 0.923
69
Freedom from discrimination Freedom Index Do you feel that you are free from discrimination based on race, sex, religion, language, politics or other status
Yes 68 560 0.121 0.116 0.113 0.887
70
Trust in central ministries Institutional Trust Index To what extent do you trust central ministries? Trust 117 560 0.209 0.116 0.070 0.930 71
Trust in dzongkhag administration Institutional Trust Index To what extent do you trust dzongkhag administration?
Trust 118 560 0.211 0.115 0.067 0.933
72
Trust in media Institutional Trust Index To what extend do you trust media? Trust 118 560 0.211 0.114 0.066 0.934
0.360 0.240 0.188 0.812
GNH Index 0.640 0.760 0.812

3 measures: • life expectancy • life satisfaction • ecological footprint
New Economics Foundation
‘Happy Planet Index’
