tip-enhanced raman voltammetry: coverage dependence and ... · profound impact on our understanding...
TRANSCRIPT

Tip-Enhanced Raman Voltammetry: Coverage Dependence andQuantitative ModelingMichael Mattei,† Gyeongwon Kang,† Guillaume Goubert,† Dhabih V. Chulhai,§ George C. Schatz,†
Lasse Jensen,§ and Richard P. Van Duyne*,†,‡
†Department of Chemistry and ‡Applied Physics Program, Northwestern University, Evanston, Illinois 60208, United States§Department of Chemistry, The Pennsylvania State University, University Park, Pennsylvania 16802, United States
*S Supporting Information
ABSTRACT: Electrochemical atomic force microscopy tip-enhanced Ramanspectroscopy (EC-AFM-TERS) was employed for the first time to observenanoscale spatial variations in the formal potential, E0′, of a surface-bound redoxcouple. TERS cyclic voltammograms (TERS CVs) of single Nile Blue (NB)molecules were acquired at different locations spaced 5−10 nm apart on anindium tin oxide (ITO) electrode. Analysis of TERS CVs at different coverageswas used to verify the observation of single-molecule electrochemistry. Theresulting TERS CVs were fit to the Laviron model for surface-bound electroactivespecies to quantitatively extract the formal potential E0′ at each spatial location.Histograms of single-molecule E0′ at each coverage indicate that the electro-chemical behavior of the cationic oxidized species is less sensitive to local environment than the neutral reduced species. Thisinformation is not accessible using purely electrochemical methods or ensemble spectroelectrochemical measurements. Weanticipate that quantitative modeling and measurement of site-specific electrochemistry with EC-AFM-TERS will have aprofound impact on our understanding of the role of nanoscale electrode heterogeneity in applications such as electrocatalysis,biological electron transfer, and energy production and storage.
KEYWORDS: Tip-enhanced Raman spectroscopy (TERS), single-molecule electrochemistry, cyclic voltammetry, Laviron model
It has been recognized for a number of years thatmeasurements of single nanoparticles (NPs) and single
molecules would be extremely useful to understand the effectsof nanoscale electrode heterogeneity on electrochemicalbehavior.1,2 Detecting the transfer of one electron to onemolecule in one second would require measuring a current of10−19 amperes. This is not currently feasible. Consequently, anamplification scheme such as cycling a redox active speciesbetween two closely spaced (tens of nanometers) electrodeswith 106−107 redox cycles per second is required to generate ameasurable current.3−8 These methods necessarily average overthe effects of nanoscale electrode features, which are essential tounderstanding electrocatalysis,9−12 energy storage,13,14 andbiological electron transfer.15−17 To overcome this limitation,single-molecule optical techniques have been used to studyelectrochemical processes over the past decade. Single-moleculefluorescence17−29 and single-molecule surface-enhanced Ramanspectroscopy (SMSERS)30−35 have offered new insights intosingle-molecule electrochemical behavior by probing distribu-tions of formal potentials (E0′) and rate constants(k0),17,23,24,30,31,35 stochastic electrochemical events,20,24,25,28,29
single catalytic turnover events,26,27 and electrode structure-formal potential correlations.33,34
More recently, electrochemical tip-enhanced Raman spec-troscopy (EC-TERS) has emerged as a promising newnanoscale technique for selectively probing different locationson an electrode surface.36,37 TERS38−41 combines the rich
chemical information content and single-molecule sensitivity ofSERS with the nanoscale resolution of scanning probemicroscopy42−45 and has been demonstrated under bothaqueous36,37,46,47 and nonaqueous48 conditions. Kurouski etal. demonstrated the first TERS investigation of an electro-chemical reaction using an atomic force microscopy (EC-AFM-TERS) platform to study the reduction of Nile Blue (NB)spontaneously adsorbed to an indium tin oxide (ITO)electrode.36 By acquiring TERS spectra concurrently withsurface cyclic voltammetry (CV), the authors observed TERSintensity-potential curves with well-defined steps suggestive ofsingle-molecule and/or few-molecule behavior at differentlocations on the ITO surface. Because no quantitativedescription of TERS voltammetry exists, the information thatcould be extracted from these TERS CVs was limited. Hereinwe present a quantitative model of single- and multi-moleculeEC-TERS based on the Laviron model of cyclic voltammetryfor surface-bound species.49,50 Systematic analysis of TERS CVsat different surface coverages was used to verify the observationof single-molecule electrochemistry.All EC-AFM-TERS measurements were performed on the
home-built bottom-illumination apparatus described previ-
Received: November 22, 2016Revised: December 5, 2016Published: December 12, 2016
Letter
pubs.acs.org/NanoLett
© 2016 American Chemical Society 590 DOI: 10.1021/acs.nanolett.6b04868Nano Lett. 2017, 17, 590−596
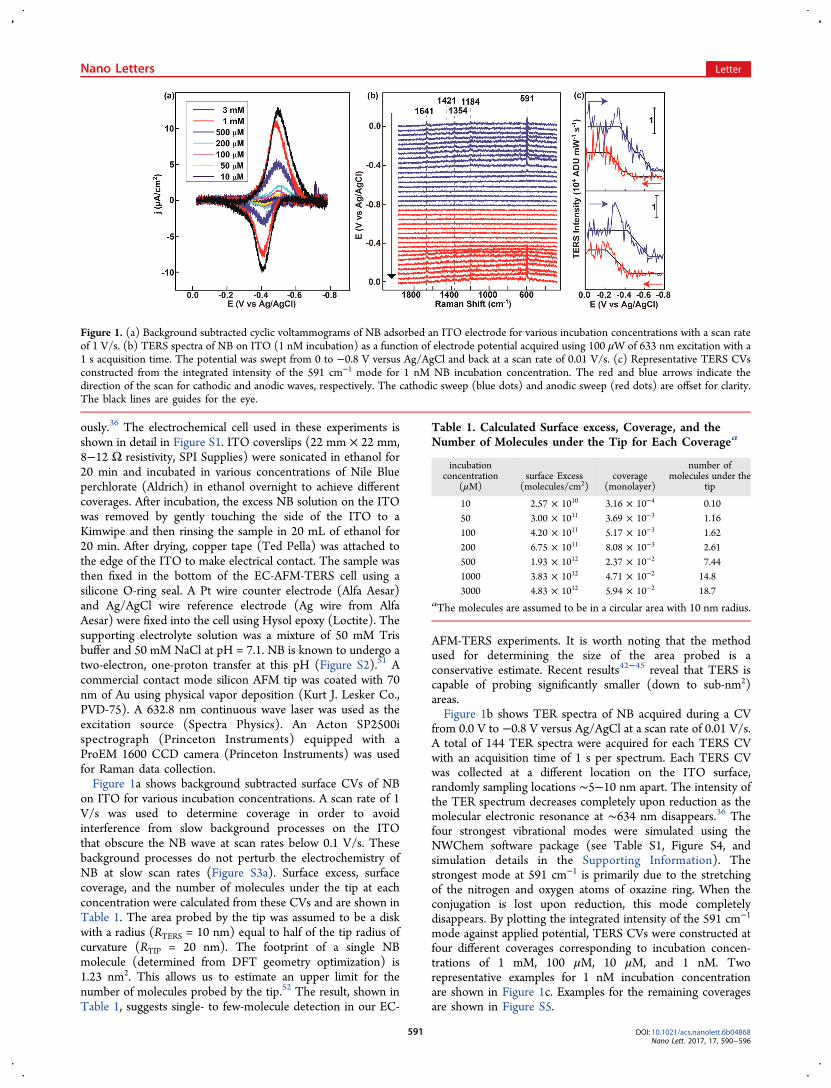
ously.36 The electrochemical cell used in these experiments isshown in detail in Figure S1. ITO coverslips (22 mm × 22 mm,8−12 Ω resistivity, SPI Supplies) were sonicated in ethanol for20 min and incubated in various concentrations of Nile Blueperchlorate (Aldrich) in ethanol overnight to achieve differentcoverages. After incubation, the excess NB solution on the ITOwas removed by gently touching the side of the ITO to aKimwipe and then rinsing the sample in 20 mL of ethanol for20 min. After drying, copper tape (Ted Pella) was attached tothe edge of the ITO to make electrical contact. The sample wasthen fixed in the bottom of the EC-AFM-TERS cell using asilicone O-ring seal. A Pt wire counter electrode (Alfa Aesar)and Ag/AgCl wire reference electrode (Ag wire from AlfaAesar) were fixed into the cell using Hysol epoxy (Loctite). Thesupporting electrolyte solution was a mixture of 50 mM Trisbuffer and 50 mM NaCl at pH = 7.1. NB is known to undergo atwo-electron, one-proton transfer at this pH (Figure S2).51 Acommercial contact mode silicon AFM tip was coated with 70nm of Au using physical vapor deposition (Kurt J. Lesker Co.,PVD-75). A 632.8 nm continuous wave laser was used as theexcitation source (Spectra Physics). An Acton SP2500ispectrograph (Princeton Instruments) equipped with aProEM 1600 CCD camera (Princeton Instruments) was usedfor Raman data collection.Figure 1a shows background subtracted surface CVs of NB
on ITO for various incubation concentrations. A scan rate of 1V/s was used to determine coverage in order to avoidinterference from slow background processes on the ITOthat obscure the NB wave at scan rates below 0.1 V/s. Thesebackground processes do not perturb the electrochemistry ofNB at slow scan rates (Figure S3a). Surface excess, surfacecoverage, and the number of molecules under the tip at eachconcentration were calculated from these CVs and are shown inTable 1. The area probed by the tip was assumed to be a diskwith a radius (RTERS = 10 nm) equal to half of the tip radius ofcurvature (RTIP = 20 nm). The footprint of a single NBmolecule (determined from DFT geometry optimization) is1.23 nm2. This allows us to estimate an upper limit for thenumber of molecules probed by the tip.52 The result, shown inTable 1, suggests single- to few-molecule detection in our EC-
AFM-TERS experiments. It is worth noting that the methodused for determining the size of the area probed is aconservative estimate. Recent results42−45 reveal that TERS iscapable of probing significantly smaller (down to sub-nm2)areas.Figure 1b shows TER spectra of NB acquired during a CV
from 0.0 V to −0.8 V versus Ag/AgCl at a scan rate of 0.01 V/s.A total of 144 TER spectra were acquired for each TERS CVwith an acquisition time of 1 s per spectrum. Each TERS CVwas collected at a different location on the ITO surface,randomly sampling locations ∼5−10 nm apart. The intensity ofthe TER spectrum decreases completely upon reduction as themolecular electronic resonance at ∼634 nm disappears.36 Thefour strongest vibrational modes were simulated using theNWChem software package (see Table S1, Figure S4, andsimulation details in the Supporting Information). Thestrongest mode at 591 cm−1 is primarily due to the stretchingof the nitrogen and oxygen atoms of oxazine ring. When theconjugation is lost upon reduction, this mode completelydisappears. By plotting the integrated intensity of the 591 cm−1
mode against applied potential, TERS CVs were constructed atfour different coverages corresponding to incubation concen-trations of 1 mM, 100 μM, 10 μM, and 1 nM. Tworepresentative examples for 1 nM incubation concentrationare shown in Figure 1c. Examples for the remaining coveragesare shown in Figure S5.
Figure 1. (a) Background subtracted cyclic voltammograms of NB adsorbed an ITO electrode for various incubation concentrations with a scan rateof 1 V/s. (b) TERS spectra of NB on ITO (1 nM incubation) as a function of electrode potential acquired using 100 μW of 633 nm excitation with a1 s acquisition time. The potential was swept from 0 to −0.8 V versus Ag/AgCl and back at a scan rate of 0.01 V/s. (c) Representative TERS CVsconstructed from the integrated intensity of the 591 cm−1 mode for 1 nM NB incubation concentration. The red and blue arrows indicate thedirection of the scan for cathodic and anodic waves, respectively. The cathodic sweep (blue dots) and anodic sweep (red dots) are offset for clarity.The black lines are guides for the eye.
Table 1. Calculated Surface excess, Coverage, and theNumber of Molecules under the Tip for Each Coveragea
incubationconcentration
(μM)surface Excess
(molecules/cm2)coverage
(monolayer)
number ofmolecules under the
tip
10 2.57 × 10¹⁰ 3.16 × 10⁻⁴ 0.1050 3.00 × 10¹¹ 3.69 × 10⁻³ 1.16100 4.20 × 10¹¹ 5.17 × 10⁻³ 1.62200 6.75 × 10¹¹ 8.08 × 10⁻³ 2.61500 1.93 × 10¹² 2.37 × 10⁻² 7.441000 3.83 × 10¹² 4.71 × 10⁻² 14.83000 4.83 × 10¹² 5.94 × 10⁻² 18.7
aThe molecules are assumed to be in a circular area with 10 nm radius.
Nano Letters Letter
DOI: 10.1021/acs.nanolett.6b04868Nano Lett. 2017, 17, 590−596
591

At each coverage, most of the TERS CVs show single-stepbehavior, while some appear to show multiple steps. Thefraction of double-step TERS CVs increases with coverage. Aquantitative approach for distinguishing between one- and two-step CVs is discussed below. The observation of two-step TERSCVs at extremely low coverage (1 nM incubation, <10−5
monolayer), which should be well into the single-moleculeregime, is striking. We hypothesize that at low coverage, NBpreferentially adsorbs to particular surface features, such as stepedges.53−57 Although NB is also known to form dimers at highcoverage,58 this is unlikely at the low coverages used in thiswork (<0.05 monolayer). In the TERS CVs at all fourcoverages, the potentials at which the redox steps occur varyfrom location to location on the electrode surface. For the firsttime, we have used EC-TERS voltammetry to probe thebehavior of single redox molecules as a function of location onthe surface. In order to extract new information about theelectrochemistry of NB on ITO, we have developed aquantitative model for single-molecule EC-TERS voltammetry.In order to quantitatively extract E0′ at each spatial location,
we fit the TERS CVs for each coverage to the Lavironmodel.49,50 First, we consider an n-electron redox reactiondescribed by eq 1
+ ⇄−O n Re (1)
where O and R are the oxidized and reduced species adsorbedon the surface, respectively. The applied potential (E) starts atan initial value (Ei) and varies as a function of time (t) with agiven scan rate (ν)
= +E E vti (2)
We define the dimensionless rate constant of the reaction, m,as
=mRTF
knv
0
(3)
where k0 is the standard heterogeneous rate constant, and theoverpotential term η is given by
η = − ′⎡⎣⎢
⎤⎦⎥
nFRT
E Eexp ( )0
(4)
where F is Faraday’s constant, and T and R have their usualmeaning.We assume that the TERS signal is directly proportional to
the local coverage (ΓO) under the tip, neglecting signalenhancement variations inside the volume probed by the tip.Accordingly, the model presented here does not allow one toextract local coverage from the amplitude of the TERS CV.Additionally, the TERS sampling frequency (1 s−1) is muchsmaller than the rate constant59 for NB charge transfer inaqueous conditions, determined to be 10 s−1 under ourexperimental conditions (Figure S3). During a single TERSCV, one NB molecule converts between the oxidized andreduced states at an average of 10 reactions per second at E0′.In this situation, even a single-molecule TERS CV will have ashape similar to that of ensemble measurement by virtue oftime averaging.19,23,60 We can, therefore, model single-moleculeTERS CVs with the same functional form as an ensemblecoverage-potential curve.49,50 Following Laviron, we assumethat the total coverage ΓT of NB is constant during a TERSmeasurement and that the coverage is low enough to ignoreintermolecular interactions in the single-molecule regime. Thisis a simplification for the ensemble measurement because some
NB is lost during the CV either to reductive desorption orquenching by side reactions. However, in the single-moleculelimit a return of the TERS signal upon reoxidation verifiesconstant surface coverage during the CV. A rare example inwhich the TERS signal does not return during the anodicsweep, accompanied by a discussion of the possible influence ofdesorption and readsorption on the TERS signal, is shown inFigure S6. The total coverage at any point during the CV canbe expressed as the sum of the coverages of the oxidized andreduced species
Γ = Γ + ΓT O R (5)
We also assume that a Langmuir isotherm describes thesystem, which implies that all surface sites are identical. This isa simplification for a polycrystalline ITO electrode. However,for a single molecule on a single site the Laviron curverepresents the time-averaged response of the same singlemolecule oxidizing and reducing many times on the same singlesite. Therefore, it is exactly analogous to many identicalmolecules reacting on many identical sites for which aLangmuir isotherm is valid. Moreover, in this situation themultiplicity of sites on the electrode will be recovered by thestatistical analysis of a series of single-molecule experiments atdifferent single sites. Using a Langmuir isotherm in the single-molecule limit, we can express the current as
= −Γ
i nFAt
dd
O(6)
where A is the electrode surface area. In the Butler−Volmerformalism, the current is expressed as
η η= Γ − Γα α− −i nFAk { }s O R1
(7)
where α is a charge transfer coefficient, which is assumed be 0.5in our simulations. From eqs 6 and 7, a reduced coverage of O(ΓO/ΓT) can be expressed as the following ordinary differentialequation (ODE)61
ηη η η+ +
ΓΓ
=α α
ΓΓ − − −
⎛⎝⎜
⎞⎠⎟
( )m m
d
d(1 ) 1 O
T
O
T
(8)
An analytic solution for eq 8 only exists when m = 0 (totallyirreversible) or m is infinite (totally reversible). After evaluatingthe coverage from eq 8, we can calculate the net current tosimulate a linear potential sweep voltammogram (LSV), whichis simply the forward or reverse sweep of a cyclic voltammo-gram (CV), using eq 6 for a given E0′ and v.For simplicity, we have modeled NB reduction and oxidation
as two-electron transfer reactions with apparent formalpotential (Eapp
0′) and standard rate constant (kapp0) in which
the effects of proton transfer are implicit and are known to varywith pH.51,62−64 Throughout this discussion, we will refer tothe apparent formal potential and rate constant simply as E0′and k0, respectively. Our fitting procedure adopts a globaloptimization technique called differential evolution. It allowsthe algorithm to explore the available space of parameters withreduced risk of being stuck in a local minimum. Preliminaryattempts showed that the standard Runge−Kutta basedmethods were unreliable and often yielded local minima unlessthe starting parameters were already very close to the optimalresults. The implementation provided by the Scipy65 pythonlibrary was used. The standard odeint solver implemented inthe Scipy library (based on the lsoda algorithm from the
Nano Letters Letter
DOI: 10.1021/acs.nanolett.6b04868Nano Lett. 2017, 17, 590−596
592
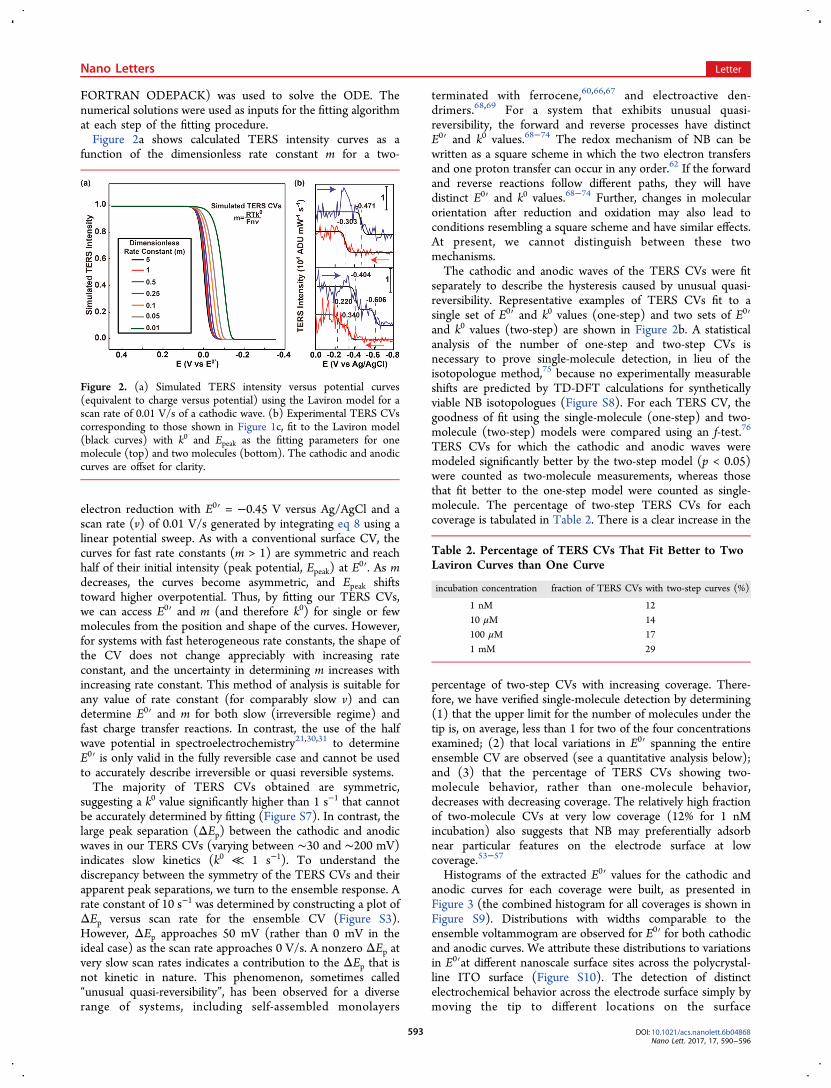
FORTRAN ODEPACK) was used to solve the ODE. Thenumerical solutions were used as inputs for the fitting algorithmat each step of the fitting procedure.Figure 2a shows calculated TERS intensity curves as a
function of the dimensionless rate constant m for a two-
electron reduction with E0′ = −0.45 V versus Ag/AgCl and ascan rate (v) of 0.01 V/s generated by integrating eq 8 using alinear potential sweep. As with a conventional surface CV, thecurves for fast rate constants (m > 1) are symmetric and reachhalf of their initial intensity (peak potential, Epeak) at E
0′. As mdecreases, the curves become asymmetric, and Epeak shiftstoward higher overpotential. Thus, by fitting our TERS CVs,we can access E0′ and m (and therefore k0) for single or fewmolecules from the position and shape of the curves. However,for systems with fast heterogeneous rate constants, the shape ofthe CV does not change appreciably with increasing rateconstant, and the uncertainty in determining m increases withincreasing rate constant. This method of analysis is suitable forany value of rate constant (for comparably slow v) and candetermine E0′ and m for both slow (irreversible regime) andfast charge transfer reactions. In contrast, the use of the halfwave potential in spectroelectrochemistry21,30,31 to determineE0′ is only valid in the fully reversible case and cannot be usedto accurately describe irreversible or quasi reversible systems.The majority of TERS CVs obtained are symmetric,
suggesting a k0 value significantly higher than 1 s−1 that cannotbe accurately determined by fitting (Figure S7). In contrast, thelarge peak separation (ΔEp) between the cathodic and anodicwaves in our TERS CVs (varying between ∼30 and ∼200 mV)indicates slow kinetics (k0 ≪ 1 s−1). To understand thediscrepancy between the symmetry of the TERS CVs and theirapparent peak separations, we turn to the ensemble response. Arate constant of 10 s−1 was determined by constructing a plot ofΔEp versus scan rate for the ensemble CV (Figure S3).However, ΔEp approaches 50 mV (rather than 0 mV in theideal case) as the scan rate approaches 0 V/s. A nonzero ΔEp atvery slow scan rates indicates a contribution to the ΔEp that isnot kinetic in nature. This phenomenon, sometimes called“unusual quasi-reversibility”, has been observed for a diverserange of systems, including self-assembled monolayers
terminated with ferrocene,60,66,67 and electroactive den-drimers.68,69 For a system that exhibits unusual quasi-reversibility, the forward and reverse processes have distinctE0′ and k0 values.68−74 The redox mechanism of NB can bewritten as a square scheme in which the two electron transfersand one proton transfer can occur in any order.62 If the forwardand reverse reactions follow different paths, they will havedistinct E0′ and k0 values.68−74 Further, changes in molecularorientation after reduction and oxidation may also lead toconditions resembling a square scheme and have similar effects.At present, we cannot distinguish between these twomechanisms.The cathodic and anodic waves of the TERS CVs were fit
separately to describe the hysteresis caused by unusual quasi-reversibility. Representative examples of TERS CVs fit to asingle set of E0′ and k0 values (one-step) and two sets of E0′and k0 values (two-step) are shown in Figure 2b. A statisticalanalysis of the number of one-step and two-step CVs isnecessary to prove single-molecule detection, in lieu of theisotopologue method,75 because no experimentally measurableshifts are predicted by TD-DFT calculations for syntheticallyviable NB isotopologues (Figure S8). For each TERS CV, thegoodness of fit using the single-molecule (one-step) and two-molecule (two-step) models were compared using an f-test.76
TERS CVs for which the cathodic and anodic waves weremodeled significantly better by the two-step model (p < 0.05)were counted as two-molecule measurements, whereas thosethat fit better to the one-step model were counted as single-molecule. The percentage of two-step TERS CVs for eachcoverage is tabulated in Table 2. There is a clear increase in the
percentage of two-step CVs with increasing coverage. There-fore, we have verified single-molecule detection by determining(1) that the upper limit for the number of molecules under thetip is, on average, less than 1 for two of the four concentrationsexamined; (2) that local variations in E0′ spanning the entireensemble CV are observed (see a quantitative analysis below);and (3) that the percentage of TERS CVs showing two-molecule behavior, rather than one-molecule behavior,decreases with decreasing coverage. The relatively high fractionof two-molecule CVs at very low coverage (12% for 1 nMincubation) also suggests that NB may preferentially adsorbnear particular features on the electrode surface at lowcoverage.53−57
Histograms of the extracted E0′ values for the cathodic andanodic curves for each coverage were built, as presented inFigure 3 (the combined histogram for all coverages is shown inFigure S9). Distributions with widths comparable to theensemble voltammogram are observed for E0′ for both cathodicand anodic curves. We attribute these distributions to variationsin E0′at different nanoscale surface sites across the polycrystal-line ITO surface (Figure S10). The detection of distinctelectrochemical behavior across the electrode surface simply bymoving the tip to different locations on the surface
Figure 2. (a) Simulated TERS intensity versus potential curves(equivalent to charge versus potential) using the Laviron model for ascan rate of 0.01 V/s of a cathodic wave. (b) Experimental TERS CVscorresponding to those shown in Figure 1c, fit to the Laviron model(black curves) with k0 and Epeak as the fitting parameters for onemolecule (top) and two molecules (bottom). The cathodic and anodiccurves are offset for clarity.
Table 2. Percentage of TERS CVs That Fit Better to TwoLaviron Curves than One Curve
incubation concentration fraction of TERS CVs with two-step curves (%)
1 nM 1210 μM 14100 μM 171 mM 29
Nano Letters Letter
DOI: 10.1021/acs.nanolett.6b04868Nano Lett. 2017, 17, 590−596
593

demonstrates the power of TERS for probing nanoscale andsingle-molecule electrochemical processes. Because the histo-grams in Figure 3 are constructed from E0′ values only, they donot capture the full behavior of the CVs. Instead, thesehistograms represent the spread of E0′ experienced bymolecules in distinct local environments on the electrode.The center potential and the full width at half-maximum(fwhm) of each histogram was extracted by fitting to a Gaussiandistribution. The fwhm and peak position for the cathodic andanodic distributions at each coverage are given in Table 3 withthe errors reported as the 95% confidence interval.The results in Table 3 reveal that the anodic distributions are
narrower than cathodic distributions, which is consistent withthe ensemble CVs (Figure 1a). Differences in peak width andshape in surface CVs may be attributed to intermolecularinteractions49 or heterogeneity of sites on the electrode.However, at coverages well below a monolayer, the effects ofintermolecular interactions are expected to be small. Wehypothesize that the electrochemical behavior of the neutral NB(NBRED) is less sensitive to local environment compared to thebehavior of the cationic oxidized form (NBOX). Further, thepeak positions of the cathodic distributions in Figure 3 vary byas much as 100 mV, whereas those for the anodic distributionsvary only by ∼50 mV, which also supports this hypothesis.Variation in the peak position from coverage to coverageindicates that each measurement for a given coverage wasacquired on a distinct ITO grain. The AFM image in FigureS10 reveals a heterogeneous ITO surface with grainsapproximately 100 nm in diameter. For 20−25 measurementsrandomly sampled at distances of 5−10 nm from the previousmeasurement, it is likely that most of the measurements for agiven coverage were acquired on the same grain. EC-AFM-TERS imaging experiments are underway to spatially correlateeach unique formal potential with the particular surface featureat which it occurs.
The difference between the cathodic and anodic E0′ in thehistograms is larger (>100 mV) than the 50 mV ΔEp of theensemble CV. However, the values of k0 extracted from fittingthe TERS CVs are fast (>1 s−1), indicating that this increasedhysteresis is due to unusual quasi-reversibility. A histogram ofE0′ separation for all TERS CVs is shown in Figure S11. Thedistribution of peaks is centered at ΔE0′ = 125 mV. Wehypothesize that interactions of NB molecules with the tip mayinhibit orientation changes or proton transfer within the tip−sample junction, leading to increased hysteresis compared tothe ensemble. As with the ensemble hysteresis, it is not possiblewith the current methodology to distinguish between these twomechanisms. Additionally, local perturbation of the electricaldouble-layer may contribute to the increased hysteresis in thetip−sample junction.36 Understanding the mechanism ofhysteresis in TERS voltammetry is critical to interpretingboth point EC-AFM-TERS measurements and EC-AFM-TERSimages, which will be the subject of future work.We have successfully demonstrated EC-AFM-TERS meas-
urements of NB at the few- and single-molecule limit. ResultantTERS CVs were analyzed by fitting to the Laviron model toquantitatively extract single-molecule formal potentials. Nano-scale spatial variations in E0′ were observed and attributed toheterogeneity of surface sites across the polycrystalline ITOfilm electrode. Further, it was determined that electrochemicalbehavior of the cationic NBOX is more sensitive to localenvironment than that of the neutral NBRED. Thus, single-molecule EC-TERS has provided us with new informationregarding the role of molecule−surface interactions in localelectrochemical behavior that is unavailable using ensembletechniques. Correlation of these local variations in E0′ withlocal electrode structure is currently underway using TERSimaging as a function of potential. Two-color EC-TERS for thesimultaneous detection of NBOX and NBRED is also in progressto monitor changes in molecular orientation and elucidate themechanism of increased hysteresis in the tip−sample junction.A complete understanding of variations in electrochemicalreactivity across nanoscale features on the electrode surface islikely to have a profound impact on applications such aselectrocatalysis, energy storage, biological electron transfer, andplasmon driven electron transfer.
■ ASSOCIATED CONTENT*S Supporting InformationThe Supporting Information is available free of charge on theACS Publications website at DOI: 10.1021/acs.nano-lett.6b04868.
Details of density functional theory calculations of NBvibrational modes; details for TERS CV fitting with theLaviron model; photograph and schematic of the EC-TERS cell; NB redox mechanism, ensemble CVs fromFigure 1 without background subtraction; representa-tions of the four most intense Raman active vibrationalmodes of NB with mode assignments; additional TERS
Figure 3. Histograms of single-molecule formal potentials extractedfrom fitting TERS CVs for 1 nM, 10 μM, 100 μM, and 1 mM NBincubation (a−d). Potential histograms for cathodic waves (blue) andanodic waves (red) were fitted to Gaussian distributions (blackcurves).
Table 3. Peak Positions and Full Widths at Half Maximum of the Gaussian Fits in Figure 3
incubation concentration cathodic peak position (V) cathodic fwhm (mV) anodic peak position (V) anodic fwhm (mV)
1 nM −0.463 ± 0.007 108 ± 16 −0.321 ± 0.006 64 ± 1410 μM −0.553 ± 0.027 180 ± 64 −0.348 ± 0.005 80 ± 11100 μM −0.499 ± 0.005 104 ± 12 −0.377 ± 0.001 54 ± 21 mM −0.453 ± 0.004 78 ± 10 −0.362 ± 0.001 58 ± 4
Nano Letters Letter
DOI: 10.1021/acs.nanolett.6b04868Nano Lett. 2017, 17, 590−596
594

CVs for 10 μM, 100 μM, and 1 mM incubation;ensemble CVs as a function of scan rate; demonstrationof the error in determining fast k0 from TERS CVs;combined histogram of extracted E0′ values at all fourcoverages; AFM image and roughness measurement ofthe ITO surface; histogram of ΔEp for all TERS CVs;representative TERS CV with three consecutive potentialcycles (PDF)
■ AUTHOR INFORMATION
Corresponding Author*E-mail: [email protected].
ORCIDMichael Mattei: 0000-0002-8276-5562Richard P. Van Duyne: 0000-0001-8861-2228Present Address(D.V.C.) University of Minnesota, Department of Chemistry,207 Pleasant St. SE, Minneapolis, Minnesota 55455, UnitedStates.
NotesThe authors declare no competing financial interest.
■ ACKNOWLEDGMENTS
M.M., G.K., G.G., G.C.S., and R.P.V.D. acknowledge supportfrom the Air Force Office of Scientific Research MURI(FA9550-14-1-0003). L.J. and D.V.C. acknowledge supportfrom the NSF award CHE-1362825.The authors thank Dr.Allen J. Bard, Dr. Henry S. White, Dr. Katherine A. Willets, andDr. Stephanie Zaleski for helpful discussions.
■ REFERENCES(1) Bard, A. J. J. Am. Chem. Soc. 2010, 132 (22), 7559−7567.(2) Hill, C. M.; Clayton, D. A.; Pan, S. Phys. Chem. Chem. Phys. 2013,15 (48), 20797−20807.(3) Bard, A. J.; Fan, F.-R. F. Acc. Chem. Res. 1996, 29 (12), 572−578.(4) Byers, J. C.; Paulose Nadappuram, B.; Perry, D.; McKelvey, K.;Colburn, A. W.; Unwin, P. R. Anal. Chem. 2015, 87 (20), 10450−10456.(5) Fan, F.-R. F.; Bard, A. J. Science 1995, 267 (5199), 871−874.(6) Fan, F.-R. F.; Kwak, J.; Bard, A. J. J. Am. Chem. Soc. 1996, 118(40), 9669−9675.(7) Kang, S.; Mathwig, K.; Mampallil, D.; Kostiuchenko, Z.; Lemay,S. G. Faraday Discuss. 2016, 193, 41.(8) Lemay, S. G.; Kang, S.; Mathwig, K.; Singh, P. S. Acc. Chem. Res.2013, 46 (2), 369−377.(9) Huang, X.; Zhao, Z.; Cao, L.; Chen, Y.; Zhu, E.; Lin, Z.; Li, M.;Yan, A.; Zettl, A.; Wang, Y. M.; Duan, X.; Mueller, T.; Huang, Y.Science 2015, 348 (6240), 1230−1234.(10) Mao, X.; Hatton, T. A. Ind. Eng. Chem. Res. 2015, 54 (16),4033−4042.(11) Neurock, M.; Janik, M.; Wieckowski, A. Faraday Discuss. 2009,140 (0), 363−378.(12) Spendelow, J. S.; Xu, Q.; Goodpaster, J. D.; Kenis, P. J. A.;Wieckowski, A. J. Electrochem. Soc. 2007, 154 (12), F238−F242.(13) Lipson, A. L.; Ginder, R. S.; Hersam, M. C. Adv. Mater. 2011, 23(47), 5613−5617.(14) Lipson, A. L.; Puntambekar, K.; Comstock, D. J.; Meng, X.;Geier, M. L.; Elam, J. W.; Hersam, M. C. Chem. Mater. 2014, 26 (2),935−940.(15) Davis, J. J.; Burgess, H.; Zauner, G.; Kuznetsova, S.; Salverda, J.;Aartsma, T.; Canters, G. W. J. Phys. Chem. B 2006, 110 (41), 20649−20654.
(16) Goldsmith, R. H.; Tabares, L. C.; Kostrz, D.; Dennison, C.;Aartsma, T. J.; Canters, G. W.; Moerner, W. E. Proc. Natl. Acad. Sci. U.S. A. 2011, 108 (42), 17269−17274.(17) Salverda, J. M.; Patil, A. V.; Mizzon, G.; Kuznetsova, S.; Zauner,G.; Akkilic, N.; Canters, G. W.; Davis, J. J.; Heering, H. A.; Aartsma, T.J. Angew. Chem., Int. Ed. 2010, 49 (33), 5776−5779.(18) Chen, P.; Xu, W.; Zhou, X.; Panda, D.; Kalininskiy, A. Chem.Phys. Lett. 2009, 470 (4−6), 151−157.(19) Gesquiere, A. J.; Park, S.-J.; Barbara, P. F. J. Phys. Chem. B 2004,108 (29), 10301−10308.(20) Lei, C.; Hu, D.; Ackerman, E. J. Chem. Commun. 2008, No. 43,5490−5492.(21) Liu, J.; Hill, C. M.; Pan, S.; Liu, H. Phys. Chem. Chem. Phys.2014, 16 (42), 23150−23156.(22) Palacios, R. E.; Chang, W.-S.; Grey, J. K.; Chang, Y.-L.; Miller,W. L.; Lu, C.-Y.; Henkelman, G.; Zepeda, D.; Ferraris, J.; Barbara, P. F.J. Phys. Chem. B 2009, 113 (44), 14619−14628.(23) Palacios, R. E.; Fan, F.-R. F.; Bard, A. J.; Barbara, P. F. J. Am.Chem. Soc. 2006, 128 (28), 9028−9029.(24) Rao, V. G.; Dhital, B.; He, Y.; Lu, H. P. J. Phys. Chem. C 2014,118 (35), 20209−20221.(25) Rao, V. G.; Dhital, B.; Peter Lu, H. Chem. Commun. 2015, 51(94), 16821−16824.(26) Shen, H.; Zhou, X.; Zou, N.; Chen, P. J. Phys. Chem. C 2014,118 (46), 26902−26911.(27) Xu, W.; Shen, H.; Kim, Y. J.; Zhou, X.; Liu, G.; Park, J.; Chen, P.Nano Lett. 2009, 9 (12), 3968−3973.(28) Zaino, L. P.; Grismer, D. A.; Han, D.; Crouch, G. M.; Bohn, P.W. Faraday Discuss. 2015, 184 (0), 101−115.(29) Zhao, J.; Zaino Iii, L. P.; Bohn, P. W. Faraday Discuss. 2013, 164(0), 57−69.(30) Cortes, E.; Etchegoin, P. G.; Le Ru, E. C.; Fainstein, A.; Vela, M.E.; Salvarezza, R. C. J. Am. Chem. Soc. 2010, 132 (51), 18034−18037.(31) Cortes, E.; Etchegoin, P. G.; Le Ru, E. C.; Fainstein, A.; Vela, M.E.; Salvarezza, R. C. J. Am. Chem. Soc. 2013, 135 (7), 2809−2815.(32) Wang, Y.; Sevinc, P. C.; He, Y.; Lu, H. P. J. Am. Chem. Soc. 2011,133 (18), 6989−6996.(33) Weber, M. L.; Wilson, A. J.; Willets, K. A. J. Phys. Chem. C 2015,119 (32), 18591−18601.(34) Wilson, A. J.; Willets, K. A. Nano Lett. 2014, 14 (2), 939−945.(35) Zaleski, S.; Cardinal, M. F.; Klingsporn, J. M.; Van Duyne, R. P.J. Phys. Chem. C 2015, 119 (50), 28226−28234.(36) Kurouski, D.; Mattei, M.; Van Duyne, R. P. Nano Lett. 2015, 15(12), 7956−7962.(37) Zeng, Z.-C.; Huang, S.-C.; Wu, D.-Y.; Meng, L.-Y.; Li, M.-H.;Huang, T.-X.; Zhong, J.-H.; Wang, X.; Yang, Z.-L.; Ren, B. J. Am.Chem. Soc. 2015, 137 (37), 11928−11931.(38) Anderson, M. S. Appl. Phys. Lett. 2000, 76 (21), 3130−3132.(39) Hayazawa, N.; Inouye, Y.; Sekkat, Z.; Kawata, S. Opt. Commun.2000, 183 (1−4), 333−336.(40) Pettinger, B.; Picardi, G.; Schuster, R.; Ertl, G. Electrochemistry2000, 68 (12), 942−949.(41) Stockle, R. M.; Suh, Y. D.; Deckert, V.; Zenobi, R. Chem. Phys.Lett. 2000, 318 (1−3), 131−136.(42) Chen, C.; Hayazawa, N.; Kawata, S. Nat. Commun. 2014, 5,3312−3316.(43) Jiang, N.; Chiang, N.; Madison, L. R.; Pozzi, E. A.; Wasielewski,M. R.; Seideman, T.; Ratner, M. A.; Hersam, M. C.; Schatz, G. C.; VanDuyne, R. P. Nano Lett. 2016, 16 (6), 3898−3904.(44) Jiang, S.; Zhang, Y.; Zhang, R.; Hu, C.; Liao, M.; Luo, Y.; Yang,J.; Dong, Z.; Hou, J. G. Nat. Nanotechnol. 2015, 10 (10), 865−869.(45) Zhang, R.; Zhang, Y.; Dong, Z. C.; Jiang, S.; Zhang, C.; Chen, L.G.; Zhang, L.; Liao, Y.; Aizpurua, J.; Luo, Y.; Yang, J. L.; Hou, J. G.Nature 2013, 498 (7452), 82−86.(46) Martín Sabanes, N.; Driessen, L. M. A.; Domke, K. F. Anal.Chem. 2016, 88 (14), 7108−7114.(47) Schmid, T.; Yeo, B.-S.; Leong, G.; Stadler, J.; Zenobi, R. J.Raman Spectrosc. 2009, 40 (10), 1392−1399.
Nano Letters Letter
DOI: 10.1021/acs.nanolett.6b04868Nano Lett. 2017, 17, 590−596
595
(48) Touzalin, T.; Dauphin, A. L.; Joiret, S.; Lucas, I. T.;Maisonhaute, E. Phys. Chem. Chem. Phys. 2016, 18 (23), 15510−15513.(49) Laviron, E. J. Electroanal. Chem. Interfacial Electrochem. 1974, 52(3), 395−402.(50) Laviron, E. J. Electroanal. Chem. Interfacial Electrochem. 1979,100 (1), 263−270.(51) Ni, F.; Feng, H.; Gorton, L.; Cotton, T. M. Langmuir 1990, 6(1), 66−73.(52) Pettinger, B.; Ren, B.; Picardi, G.; Schuster, R.; Ertl, G. J. RamanSpectrosc. 2005, 36 (6−7), 541−550.(53) Avouris, P.; Lyo, I. W.; Molinas-Mata, P. Chem. Phys. Lett. 1995,240 (5), 423−428.(54) Han, P.; Mantooth, B. A.; Sykes, E. C. H.; Donhauser, Z. J.;Weiss, P. S. J. Am. Chem. Soc. 2004, 126 (34), 10787−10793.(55) Klingsporn, J. M.; Jiang, N.; Pozzi, E. A.; Sonntag, M. D.;Chulhai, D.; Seideman, T.; Jensen, L.; Hersam, M. C.; Van Duyne, R.P. J. Am. Chem. Soc. 2014, 136 (10), 3881−3887.(56) Stranick, S. J.; Kamna, M. M.; Weiss, P. S. Surf. Sci. 1995, 338(1), 41−59.(57) Sykes, E. C. H.; Han, P.; Kandel, S. A.; Kelly, K. F.; McCarty, G.S.; Weiss, P. S. Acc. Chem. Res. 2003, 36 (12), 945−953.(58) Zong, C.; Chen, C.-J.; Zhang, M.; Wu, D.-Y.; Ren, B. J. Am.Chem. Soc. 2015, 137 (36), 11768−11774.(59) Malinauskas, A.; Ruzgas, T.; Gorton, L. J. Electroanal. Chem.2000, 484 (1), 55−63.(60) Amatore, C.; Maisonhaute, E.; Schollhorn, B.; Wadhawan, J.ChemPhysChem 2007, 8 (9), 1321−1329.(61) Laviron, E. J. Electroanal. Chem. Interfacial Electrochem. 1979,101 (1), 19−28.(62) Laviron, E. J. Electroanal. Chem. Interfacial Electrochem. 1980,109 (1), 57−67.(63) Laviron, E. J. Electroanal. Chem. Interfacial Electrochem. 1983,146 (1), 1−13.(64) Laviron, E.; Meunier-Prest, R. J. Electroanal. Chem. 1992, 324(1), 1−18.(65) Jones, E.; Oliphant, T.; Peterson, P. Open source scientific tools forPython; Scipy: 2001.(66) Dudek, S. P.; Sikes, H. D.; Chidsey, C. E. D. J. Am. Chem. Soc.2001, 123 (33), 8033−8038.(67) Sikes, H. D.; Smalley, J. F.; Dudek, S. P.; Cook, A. R.; Newton,M. D.; Chidsey, C. E. D.; Feldberg, S. W. Science 2001, 291 (5508),1519−1523.(68) Amatore, C.; Bouret, Y.; Maisonhaute, E.; Abruna, H. D.;Goldsmith, J. I. C. R. Chim. 2003, 6 (1), 99−115.(69) Amatore, C.; Bouret, Y.; Maisonhaute, E.; Goldsmith, J. I.;Abruna, H. D. Chem. - Eur. J. 2001, 7 (10), 2206−2226.(70) Everett, D. H. Trans. Faraday Soc. 1954, 50 (0), 1077−1096.(71) Everett, D. H. Trans. Faraday Soc. 1955, 51 (0), 1551−1557.(72) Everett, D. H.; Smith, F. W. Trans. Faraday Soc. 1954, 50 (0),187−197.(73) Everett, D. H.; Whitton, W. I. Trans. Faraday Soc. 1952, 48 (0),749−757.(74) Feldberg, S. W.; Rubinstein, I. Mol. Cryst. Liq. Cryst. Inc.Nonlinear Opt. 1988, 160 (1), 101−101.(75) Sonntag, M. D.; Klingsporn, J. M.; Garibay, L. K.; Roberts, J. M.;Dieringer, J. A.; Seideman, T.; Scheidt, K. A.; Jensen, L.; Schatz, G. C.;Van Duyne, R. P. J. Phys. Chem. C 2012, 116 (1), 478−483.(76) Kearns, M.; Mansour, Y.; Ng, A. Y.; Ron, D. Mach. Learn. 1997,27 (1), 7−50.
Nano Letters Letter
DOI: 10.1021/acs.nanolett.6b04868Nano Lett. 2017, 17, 590−596
596