tips as an asset class - tripod.comphilgmh.tripod.com/tips.pdf · ibbotson associates page 3 tips...
TRANSCRIPT

TIPS as an Asset Class
Peng ChenIbbotson Associates
225 N. Michigan Ave., Suite 700Chicago, IL 60601
(312) 616 -1620
Matt Terrien1
Ibbotson Associates225 N. Michigan Ave., Suite 700
Chicago, IL 60601(312) 616 -1620
November 1999
1 Peng Chen is a Senior Research Consultant and Matt Terrien is a Consultant at Ibbotson Associates inChicago, Illinois.

Ibbotson Associates Page 2 TIPS as an Asset Class
TIPS as an Asset Class
Abstract
When designing investment portfolios within a long-term strategic asset allocation context, the
authors maintain that TIPS (Treasury Inflation-Protection Securities) should be evaluated as a
separate, distinct asset class. These securities possess unique characteristics that are not directly
available through other investment vehicles. Their most significant benefit lies in the fact that they
provide a direct hedge against one specific measure of inflation (i.e. the non-seasonally adjusted
Consumer Price Index for all urban consumers; CPI-U); which allows investors to maintain real
purchasing power and hedge against future nominal increases in the overall domestic price level. In
addition to their obvious appeal to investors guarding against increases in inflation, TIPS may also
appeal to a broader audience by virtue of their relatively low correlation with other traditional
asset classes. The authors demonstrate that TIPS offer potentially significant diversification
benefits, establishing them as a viable asset class to be considered when constructing a long-term
asset allocation policy.
Ibbotson Associates Page 3 TIPS as an Asset Class
Introduction
Although inflation-indexed bonds have existed in other nations (e.g. U.K., Israel, Australia, etc.)
for a number of years, U.S. TIPS were first auctioned in January 1997. Unlike conventional
Treasury bonds that have fixed nominal coupon rates, the coupon payments of TIPS are fixed in
real terms at the time of issuance. That is, over the life of the bond, nominal interest payments are
adjusted based on the actual inflation rate (as measured by changes in the CPI-U). TIPS’ par values
are also adjusted in a similar manner, such that the principal is returned to the investor upon
maturity, fully adjusted for inflation. An example may clarify how this process works. Assume a
ten-year inflation-indexed bond is issued with a par value of $10,000 and guarantees a real yield of
3% per year. Suppose that the inflation rate is 5% in the first year. The face value of the bond will
rise to $10,500 and the coupon payment would be $315 (i.e. 3% of $10,500)2. If deflation occurs,
the principal and the coupon payment will be adjusted down based on the falling CPI-U. However,
if deflation reduces the principal below par, the investor will still receive the par value at maturity.
As Wrase [1997] points out, though, “the Treasury does not expect to have to implement this
‘minimum guarantee’ because it does not expect a prolonged decline in consumer prices to occur.”
TIPS ensure that neither the U.S. Treasury nor the investor faces the risk that an unanticipated
increase or decrease in inflation will erode or boost the purchasing power of the bond payments.
Thus, TIPS are structured in a manner that allows them to maintain their real value, thereby
offering a long-term hedge against inflation3.
2 This hypothetical example assumes a single annual coupon payment. In practice, the interest payments onTIPS are made semi-annually.3 Although TIPS are significantly more apt to preserve real purchasing power than traditional nominal bondsare, they do not provide a completely perfect hedge against inflation. Semi-annual coupon payments aresubject to reinvestment risk. Also, an investor’s specific liabilities may increase at a faster rate than the CPI-U; therefore, making TIPS a less than effective funding vehicle for such expenses. Taxable investors arepartially exposed to inflation risk due to the tax code’s current inability to distinguish between nominal andreal income. An increase in a TIPS’ principal value is taxable as normal interest income, even though theadjustment simply keeps the principal value fixed in real terms. This problem of taxes exposing a TIPSinvestor to inflation risk is dealt with more thoroughly by Shen [1998]. Finally, as Wrase [1997] illustrates,“inflation-indexed bonds . . . are subject to an ‘indexation lag’ - bond payments are linked to a [3-month]lagged value of a price index. Because of the indexation lag, an indexed bond also lacks inflation protectionfor a short period right before it matures.”

Ibbotson Associates Page 4 TIPS as an Asset Class
Performance
As of October 31, 1999 TIPS accounted for less than 2% of total outstanding U.S. government
debt. The total market value of TIPS is $100.1 billion, whereas total outstanding government debt
is $5.59 trillion. There are currently six available TIPS issues. As outlined in Table 1, below, the
current yield differential between TIPS and similar maturity nominal bonds tends to hover near
200 basis points for maturities under 10 years, whereas a slightly higher differential exists for the
longer maturities.
Table 1 - Yield Comparison of Existing TIPS Issues and Similar Maturity “Nominal” BondsTIPS “Nominal Bonds”
YieldCoupon Maturity Yield4 Coupon Maturity Yield3 Differential
3 5/8 % July 15, 2002 3.83% 6 % July 31, 2002 5.85% 2.02%3 3/8 % January 15, 2007 4.11% 6 ¼ % February 15, 2007 6.17% 2.06%3 5/8 % January 15, 2008 4.11% 5 ½ % February 15, 2008 6.15% 2.04%3 7/8 % January 15, 2009 4.10% 5 ½ % May 15, 2009 6.07% 1.97%3 5/8 % April 15, 2028 4.11% 5 ½ % August 15, 2028 6.34% 2.23%3 7/8 % April 15, 2029 4.11% 5 ¼ % February 15, 2029 6.26% 2.15%
For the majority of their existence U.S. TIPS have outperformed the CPI-U measurement of
inflation. They have underperformed the broader Government Treasury market by a significant
margin, however. Figure 1, below, illustrates these trends.
4 Yield figures represent yield to maturity on accrued principal as reported in the Wall Street Journal,November 1,1999.
Ibbotson Associates Page 5 TIPS as an Asset Class
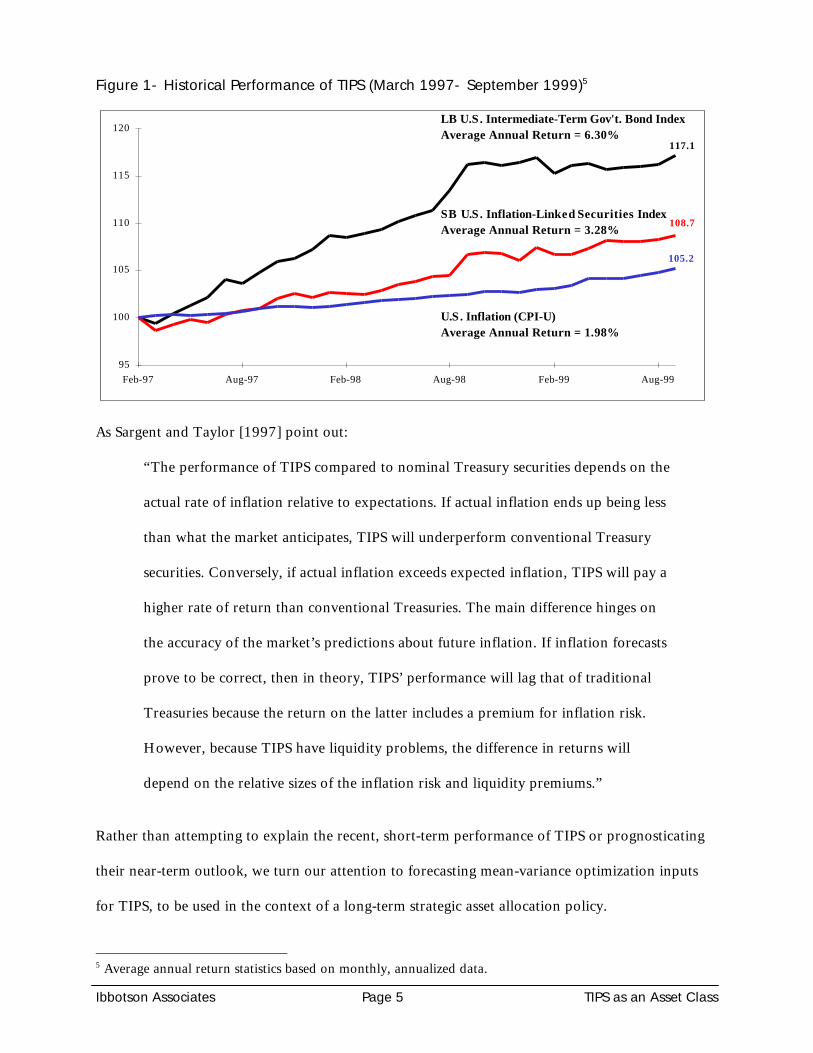
Figure 1- Historical Performance of TIPS (March 1997- September 1999)5
As Sargent and Taylor [1997] point out:
“The performance of TIPS compared to nominal Treasury securities depends on the
actual rate of inflation relative to expectations. If actual inflation ends up being less
than what the market anticipates, TIPS will underperform conventional Treasury
securities. Conversely, if actual inflation exceeds expected inflation, TIPS will pay a
higher rate of return than conventional Treasuries. The main difference hinges on
the accuracy of the market’s predictions about future inflation. If inflation forecasts
prove to be correct, then in theory, TIPS’ performance will lag that of traditional
Treasuries because the return on the latter includes a premium for inflation risk.
However, because TIPS have liquidity problems, the difference in returns will
depend on the relative sizes of the inflation risk and liquidity premiums.”
Rather than attempting to explain the recent, short-term performance of TIPS or prognosticating
their near-term outlook, we turn our attention to forecasting mean-variance optimization inputs
for TIPS, to be used in the context of a long-term strategic asset allocation policy.
5 Average annual return statistics based on monthly, annualized data.
95
100
105
110
115
120
Feb-97 Aug-97 Feb-98 Aug-98 Feb-99 Aug-99
LB U.S. Intermediate-Term Gov't. Bond IndexAverage Annual Return = 6.30%
SB U.S. Inflation-Linked Securities IndexAverage Annual Return = 3.28%
117.1
108.7
105.2
U.S. Inflation (CPI-U)Average Annual Return = 1.98%
Ibbotson Associates Page 6 TIPS as an Asset Class
Return, Risk and Correlation of TIPS
From a conceptual standpoint, inflation-indexed bonds are expected to provide slightly lower
return and risk than traditional, nominal government bonds with similar maturities. The
explanation for this lies in the fact that inflation-indexed bonds hedge away the inflation risk
associated with regular bonds. An increase in inflation prompts investors to require higher yields
from nominal bonds in order to compensate for the loss of purchasing power; this results in a drop
in the prices of these instruments. TIPS, however, have both their principal amount and coupon
payments adjusted to reflect changes in inflation. The inflation protection received by TIPS
investors is valuable, and this value is paid for in the form of lower yields as compared to regular
bonds. Due to the fact that inflation impacts traditional bonds quite differently than TIPS, the
correlation coefficient between the two is expected to be low. When inflation increases, the prices
of both equities and nominal bonds decrease (as investors require higher discount rates for future
dividends and coupon payments). Therefore, the correlation between equity and TIPS is also
expected to be lower than the correlation between equities and nominal bonds.
To incorporate inflation-indexed bonds in a long-term asset allocation framework using mean-
variance analysis, it is necessary to analyze their expected return, standard deviation and
correlation coefficients with other asset classes. An examination of historical data would be helpful
when estimating these mean-variance inputs. Inflation-indexed bonds, however, were introduced
less than three years ago here in the United States. The existing data sample is insufficient for
estimating long-term mean-variance inputs. Instead, synthetic inflation-indexed bond series were
created, based on historical inflation and Treasury bond yield data6. For the purposes of this study,
a synthetic 10-year inflation-indexed bond was utilized.
6 A synthetic return series for inflation-indexed bonds was created covering the 1970 – 1998 time period.Appendix A provides a detailed description of the methodology employed to create this series.
Ibbotson Associates Page 7 TIPS as an Asset Class
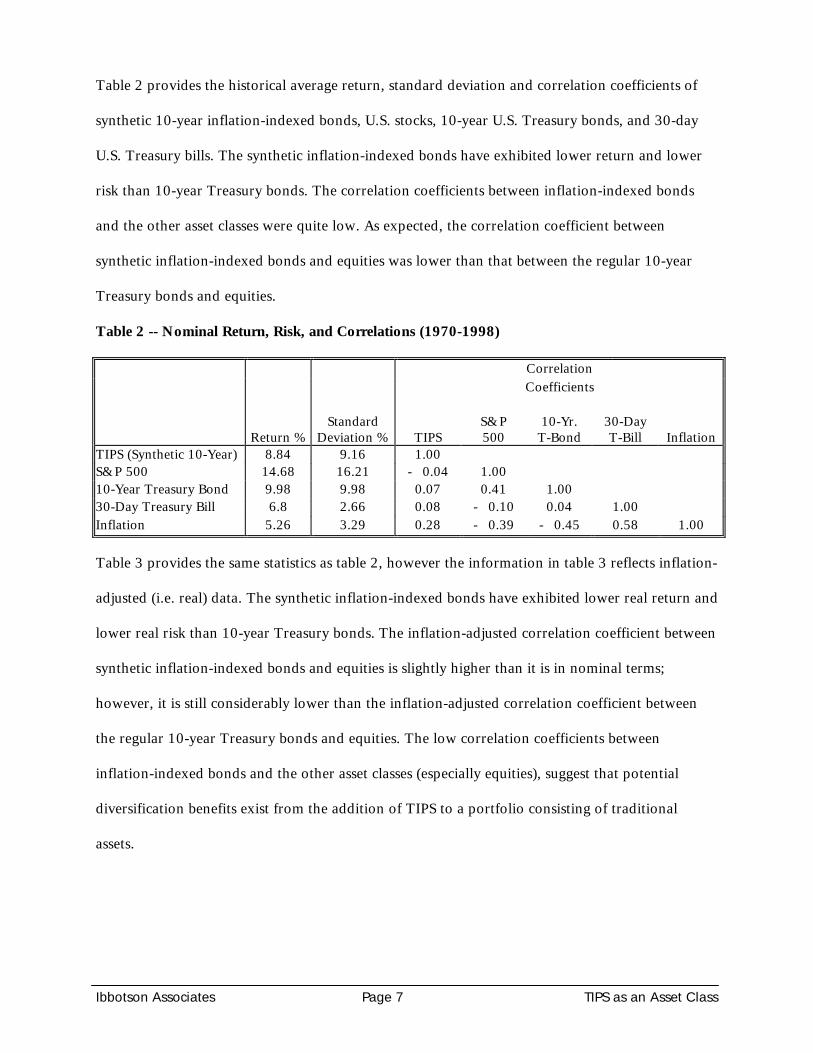
Table 2 provides the historical average return, standard deviation and correlation coefficients of
synthetic 10-year inflation-indexed bonds, U.S. stocks, 10-year U.S. Treasury bonds, and 30-day
U.S. Treasury bills. The synthetic inflation-indexed bonds have exhibited lower return and lower
risk than 10-year Treasury bonds. The correlation coefficients between inflation-indexed bonds
and the other asset classes were quite low. As expected, the correlation coefficient between
synthetic inflation-indexed bonds and equities was lower than that between the regular 10-year
Treasury bonds and equities.
Table 2 -- Nominal Return, Risk, and Correlations (1970-1998)
CorrelationCoefficients
Return %Standard
Deviation % TIPSS&P500
10-Yr.T-Bond
30-DayT-Bill Inflation
TIPS (Synthetic 10-Year) 8.84 9.16 1.00S&P 500 14.68 16.21 - 0.04 1.0010-Year Treasury Bond 9.98 9.98 0.07 0.41 1.0030-Day Treasury Bill 6.8 2.66 0.08 - 0.10 0.04 1.00Inflation 5.26 3.29 0.28 - 0.39 - 0.45 0.58 1.00
Table 3 provides the same statistics as table 2, however the information in table 3 reflects inflation-
adjusted (i.e. real) data. The synthetic inflation-indexed bonds have exhibited lower real return and
lower real risk than 10-year Treasury bonds. The inflation-adjusted correlation coefficient between
synthetic inflation-indexed bonds and equities is slightly higher than it is in nominal terms;
however, it is still considerably lower than the inflation-adjusted correlation coefficient between
the regular 10-year Treasury bonds and equities. The low correlation coefficients between
inflation-indexed bonds and the other asset classes (especially equities), suggest that potential
diversification benefits exist from the addition of TIPS to a portfolio consisting of traditional
assets.

Ibbotson Associates Page 8 TIPS as an Asset Class
Table 3 -- Real Return, Risk, and Correlations (1970-1998)
CorrelationCoefficients
Return %Standard
Deviation % TIPSS&P500
10-Yr.T-Bond
30-DayT-Bill
TIPS (Synthetic 10-Year) 3.43 8.44 1.00S&P 500 9.24 16.73 0.12 1.0010-Year Treasury Bond 4.72 11.30 0.23 0.55 1.0030-Day Treasury Bill 1.52 2.62 - 0.02 0.46 0.67 1.00
Ibbotson Associates Page 9 TIPS as an Asset Class
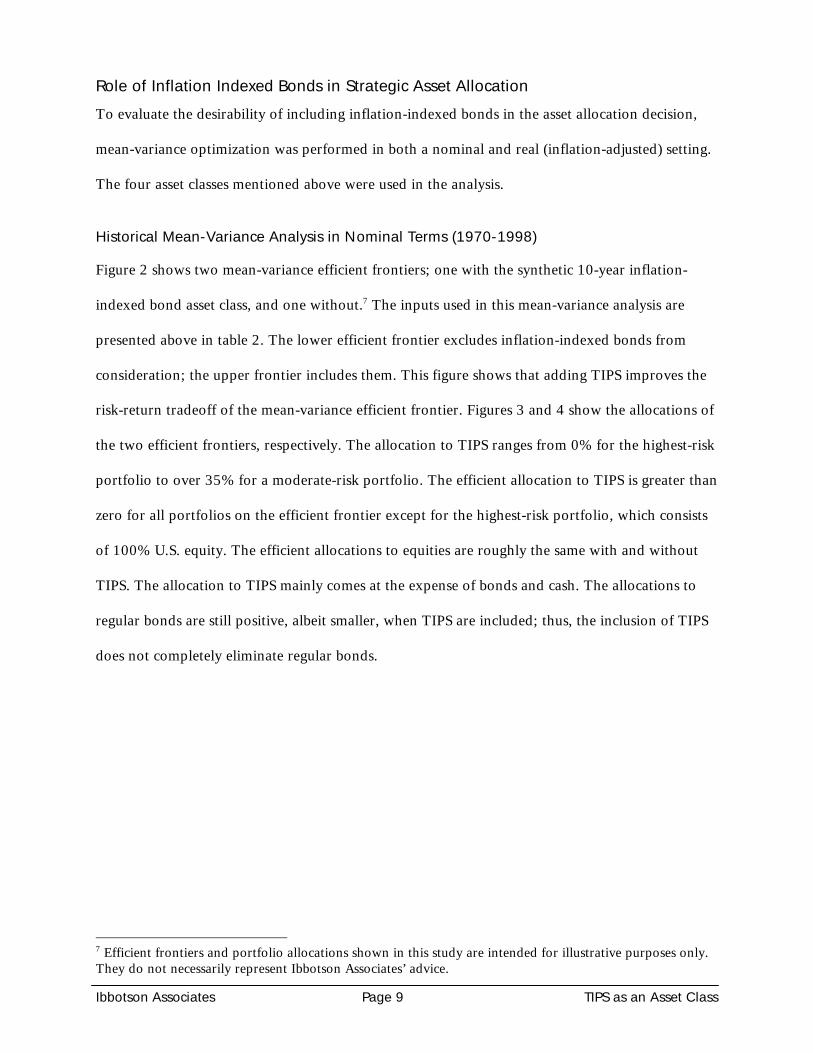
Role of Inflation Indexed Bonds in Strategic Asset AllocationTo evaluate the desirability of including inflation-indexed bonds in the asset allocation decision,
mean-variance optimization was performed in both a nominal and real (inflation-adjusted) setting.
The four asset classes mentioned above were used in the analysis.
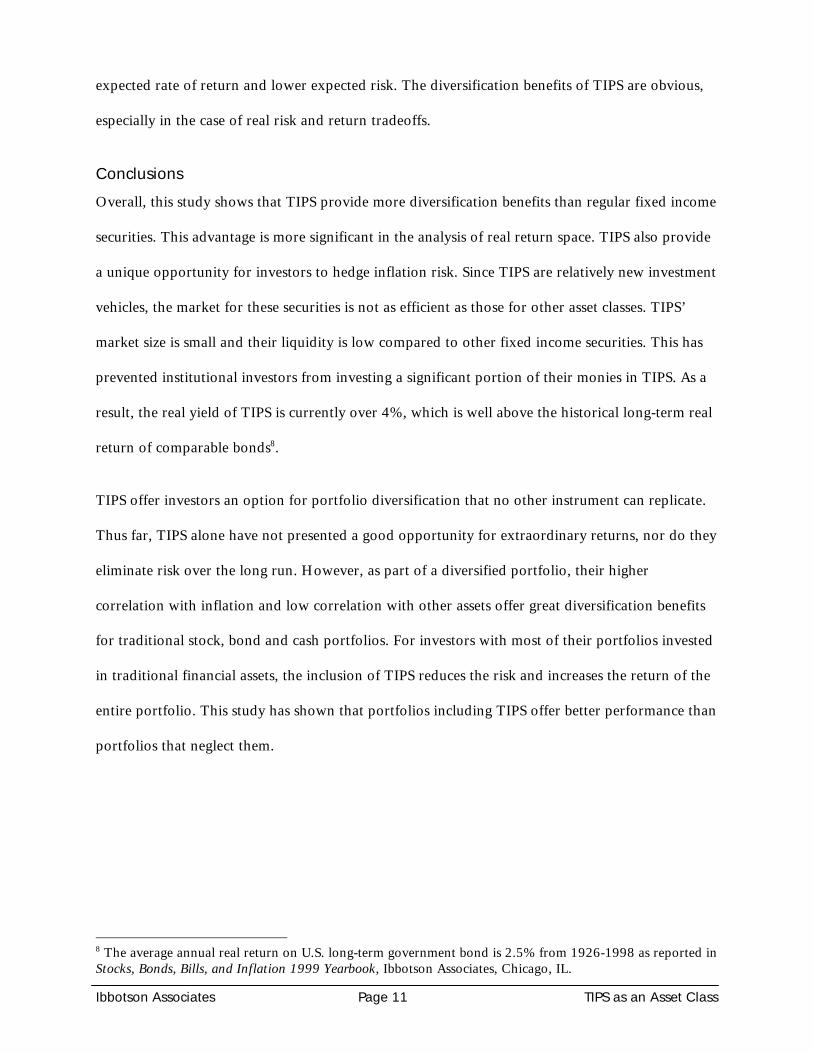
Historical Mean-Variance Analysis in Nominal Terms (1970-1998)
Figure 2 shows two mean-variance efficient frontiers; one with the synthetic 10-year inflation-
indexed bond asset class, and one without.7 The inputs used in this mean-variance analysis are
presented above in table 2. The lower efficient frontier excludes inflation-indexed bonds from
consideration; the upper frontier includes them. This figure shows that adding TIPS improves the
risk-return tradeoff of the mean-variance efficient frontier. Figures 3 and 4 show the allocations of
the two efficient frontiers, respectively. The allocation to TIPS ranges from 0% for the highest-risk
portfolio to over 35% for a moderate-risk portfolio. The efficient allocation to TIPS is greater than
zero for all portfolios on the efficient frontier except for the highest-risk portfolio, which consists
of 100% U.S. equity. The efficient allocations to equities are roughly the same with and without
TIPS. The allocation to TIPS mainly comes at the expense of bonds and cash. The allocations to
regular bonds are still positive, albeit smaller, when TIPS are included; thus, the inclusion of TIPS
does not completely eliminate regular bonds.
7 Efficient frontiers and portfolio allocations shown in this study are intended for illustrative purposes only.They do not necessarily represent Ibbotson Associates’ advice.

Ibbotson Associates Page 10 TIPS as an Asset Class
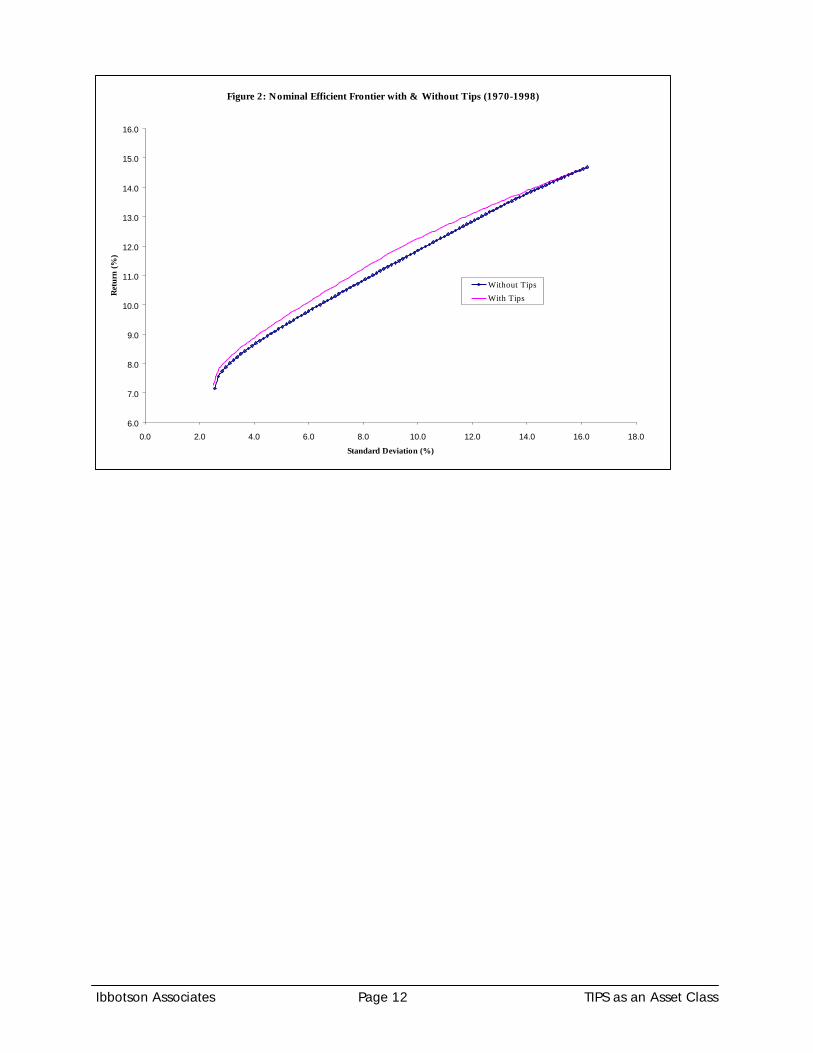
Historical Mean-Variance Analysis in Real Terms (1970-1998)
Figure 5 shows the results of the mean-variance analysis in real return space. In this scenario,
return and risk are inflation-adjusted, which is appropriate for investors who are concerned about
the purchasing power of their portfolios. The real return, risk, and correlation coefficients of TIPS
and the other three asset classes are presented above in table 3. The upper efficient frontier is the
result of including TIPS in the efficient portfolios of traditional stocks, bonds and cash. Including
TIPS improves the real risk-return efficiency of traditional stock, bond and cash portfolios. Figures
6 and 7 provide the detailed allocations of the portfolios from the two frontiers shown in Figure 5.
TIPS play an important role in the efficient portfolios. The allocations to TIPS range from about
10% in the minimum variance portfolio to about 50% for moderate-risk portfolios. The
allocations to equities are not significantly affected by the inclusion of TIPS in real return space.
Allocations to bonds and cash are considerably lower after TIPS are included. Nominal bonds are
almost completely replaced by TIPS.
Comparing the efficient allocations in real return space with those in nominal return space yields
some interesting results:
1) The allocation to TIPS is greater in real return space than in nominal return space. This
indicates that the benefit of including TIPS in a portfolio is greater in real return space
(i.e. for investors whose objective is to maximize inflation-adjusted returns and
minimize risk).
2) The allocation to regular bonds is much smaller in real return space than in nominal
return space regardless of whether TIPS are included or not.
3) Allocations to equities remain about the same in both real and nominal return space.
Including TIPS improves the risk-return tradeoff of the mean-variance efficient frontier in both
nominal and real terms. Investing part of a portfolio in TIPS helps investors achieve a higher
Ibbotson Associates Page 11 TIPS as an Asset Class
expected rate of return and lower expected risk. The diversification benefits of TIPS are obvious,
especially in the case of real risk and return tradeoffs.
ConclusionsOverall, this study shows that TIPS provide more diversification benefits than regular fixed income
securities. This advantage is more significant in the analysis of real return space. TIPS also provide
a unique opportunity for investors to hedge inflation risk. Since TIPS are relatively new investment
vehicles, the market for these securities is not as efficient as those for other asset classes. TIPS’
market size is small and their liquidity is low compared to other fixed income securities. This has
prevented institutional investors from investing a significant portion of their monies in TIPS. As a
result, the real yield of TIPS is currently over 4%, which is well above the historical long-term real
return of comparable bonds8.
TIPS offer investors an option for portfolio diversification that no other instrument can replicate.
Thus far, TIPS alone have not presented a good opportunity for extraordinary returns, nor do they
eliminate risk over the long run. However, as part of a diversified portfolio, their higher
correlation with inflation and low correlation with other assets offer great diversification benefits
for traditional stock, bond and cash portfolios. For investors with most of their portfolios invested
in traditional financial assets, the inclusion of TIPS reduces the risk and increases the return of the
entire portfolio. This study has shown that portfolios including TIPS offer better performance than
portfolios that neglect them.
8 The average annual real return on U.S. long-term government bond is 2.5% from 1926-1998 as reported inStocks, Bonds, Bills, and Inflation 1999 Yearbook, Ibbotson Associates, Chicago, IL.
Ibbotson Associates Page 12 TIPS as an Asset Class
Figure 2: Nominal Efficient Frontier with & Without Tips (1970-1998)
6.0
7.0
8.0
9.0
10.0
11.0
12.0
13.0
14.0
15.0
16.0
0.0 2.0 4.0 6.0 8.0 10.0 12.0 14.0 16.0 18.0
Standard Deviation (%)
Retu
rn (%
)
Without TipsWith Tips

Ibbotson Associates Page 13 TIPS as an Asset Class
Figure 3: Nominal Efficient Allocations without Tips(1970-1998)
0%
20%
40%
60%
80%
100%
Return (%)Std (%)
8.53.8
9.35.2
10.16.6
10.87.9
11.59.3
12.210.7
12.912.1
13.513.5
14.114.8
S&P 500 TR10 year coupon TRU.S. 30 Day TBill TR
Figure 4: Nominal Efficient Allocations With Tips (1970-1998)
0%
20%
40%
60%
80%
100%
Return (%)Std (%)
8.73.8
9.65.1
10.46.5
11.27.9
11.99.3
12.510.7
13.112.1
13.713.4
14.214.8
S&P 500 TRTips Returns (10 year)10 year coupon TRU.S. 30 Day TBill TR
Ibbotson Associates Page 14 TIPS as an Asset Class
Figure 5: Real Efficient Frontiers With & Without Tips (1970-1998)
0.0
1.0
2.0
3.0
4.0
5.0
6.0
7.0
8.0
9.0
10.0
0.0 2.0 4.0 6.0 8.0 10.0 12.0 14.0 16.0 18.0
Real Standard Deviations (%)
Real
Ret
urns
(%)
Without TipsWith Tips
Figure 6: Real Efficient Allocations without Tips (1970-1998)
0%
20%
40%
60%
80%
100%
Return(%)
Std (%)
2.63.9
3.45.3
4.26.8
5.08.2
5.79.6
6.411.0
7.212.5
7.913.9
8.615.3
S&P 500 TR REAL10 year coupon TR REALU.S. 30 Day TBill TR REAL

Ibbotson Associates Page 15 TIPS as an Asset Class
Figure 7: Real Efficient Allocations with Tips (1970-1998)
0%
20%
40%
60%
80%
100%
Return(%)
Std (%)
2.93.8
3.85.2
4.66.7
5.48.1
6.29.5
6.911.0
7.612.4
8.113.9
8.715.3
S&P 500 TR REALTips Returns (10 year) REAL10 year coupon TR REALU.S. 30 Day TBill TR REAL

Ibbotson Associates Page 16 TIPS as an Asset Class
Appendix A
Historical Real Yields
Theoretically, an inflation-linked bond series can be thought of as the price of the real yield of a
bond (in contrast to regular bonds that price nominal yields). In other words, the price of an
inflation-indexed bond is only affected by changes in real yields. When real yields increase, the
inflation-indexed bond price will fall; when real yields decrease, the inflation-indexed bond price
will rise. Therefore, it is critical to develop a historical real yield series in order to construct the
synthetic inflation-indexed bond series.
To estimate historical real yields, we apply the Domestic Fisher Relation. The nominal yield, rN, is
the compounding of the real yield, rR, and expected inflation, E(I), over the investment time
horizon.
)I(Er1))I(E1()r1(r RRN +≈−+×+= (1)
Therefore, the real yield can be approximated by the nominal yield less expected inflation.
)(1))(1/()1( IErIErr NNR −≈−++= (2)
Historical nominal yields are readily available, and can be estimated from the prices of bonds
traded in the open market. However, a measurement of expected inflation is not readily available.
The authors agree with Lucas and Queck [1998] that “predicting inflation is a difficult job . . .
[and] perhaps this is why the market uses YOY CPI as its inflation forecast; it is as good as any
other method.” As such, in our analysis, we use an adaptive expectations approach, whereby
expected inflation is proxied by the most recent calendar year’s inflation rate.
Both nominal yields and real yields can be observed from the current market prices for regular
Treasury bonds and inflation-indexed bonds. According to the Fisher relation, the implied
expected inflation would be the difference between the nominal and real yields. Several alternative
models were explored as a proxy for market expected inflation, including: monthly and annual

Ibbotson Associates Page 17 TIPS as an Asset Class
auto-regression, a weighted average of recent inflation and the inflation forecast by the Survey of
Professional Forecasters (formerly ASA/NBER Economic Outlook Survey). However, the
inflationary expectations formed through these various methods violate the Fisher relation in the
current market; the expectations produced are much higher than the implied inflation from the
bond yields. If the inflationary expectations from these models are correct, then there is an
arbitrage opportunity, where investors should buy inflation-indexed bonds and sell nominal bonds.
Since we believe the market is relatively efficient, there should not be such an arbitrage
opportunity. Therefore, the inflation models inherent in these various approaches must be
inaccurate. We determined to make the simplifying assumption that the inflation process follows a
random walk,
ε+= − 1tt IIand
1)( −= tt IIE
Where, It is the inflation of period t
ε is a random term with zero mean.
Therefore, the expected real yield on a nominal bond is
1)( −−=−= tNNR IrIErr (3)
Investors should be willing to accept a lower real yield for inflation-indexed bonds than nominal
bonds, since inflation-indexed bonds provide a perfect inflation hedge. Investors pay a premium
for owning inflation-indexed bonds. Intuitively, the real return of an inflation-indexed bond will
be lower than the implied real rate of return from a nominal bond, because an inflation-indexed
bond guarantees that the return will keep pace with inflation. The current premium is calculated as
the difference between the expected real return of the nominal bond and the current real yield of
the inflation-indexed bond with a comparable maturity. The following equation expresses this
calculation:

Ibbotson Associates Page 18 TIPS as an Asset Class
tIIttNtIItNt rIrrIErIIP ,1,,, )( −−=−−= − (4)
As of 03/05/1999, the nominal yield on a traditional 10-year government bond and the yield on a
10-year inflation-indexed bond were:
rN = 5.67%rII=3.89%
The increase in inflation during calendar year 1998 was:
It-1=1.61%
The current inflation-index premium, from (4), above = 5.67% - 1.61% -3.89% = 0.17%
This premium is assumed to be proportional to the past 36 months standard deviation of inflation.
The idea is that the premium investors are willing to pay is tied to the recent volatility of inflation.
If the inflation volatility is high, then investors are willing to pay a higher premium. The historical
inflation index premium can be derived as follows:
tt
ii IIP
SS
IIP ×= (5)
Where, i is any month in the past (since January 1970)
St is the standard deviation of inflation over the 36 month time period from Feb.1996 through Jan. 1999
Si is the standard deviation of inflation over the most recent 36 month time periodfrom month i
Finally, subtracting the inflation index premium from the real yield produces a synthetic
measurement of historical yields for inflation-indexed bonds.
ttNtNttRtII IIPIrIIPIErIIPrr −−=−−=−= − 1,, )( (6)
Several assumptions were made in the use of the above method:

Ibbotson Associates Page 19 TIPS as an Asset Class
1. The availability (i.e. presence or absence) of inflation-indexed bonds in the marketplace has no
impact on the inflation rate or the market prices of bonds.
2. Expected inflation is assumed to be the most recent twelve months’ inflation rate.
3. A nominal bond’s expected real rate of return is equal to the difference between the bond’s
yield and expected inflation. The expected real interest rate will always be greater than two
percent.
Historical Return Series
The objective of the analysis was to create a synthetic inflation-indexed bond series having a
maturity of ten years, as well as a series having a maturity equivalent to the assumed investment
time horizon of twenty years. We calculate the total returns by utilizing the historical yields
(derived via the methodology described above) of the inflation-indexed bonds. It is assumed that
the manager of the portfolio buys a newly issued par bond at the beginning of each month, and
then sells it at the beginning of the next month. We calculated the rate of return for the synthetic
inflation-indexed bonds for each month from January 1970 through December 1998.
The income and total returns are calculated through the following formulas:
1)1(
1
100
11 11
−+×
+
×+
+
=
∑= +−+−
Ipar
frequencyyld
frequencyrate
frequencyyld
redemption
TR
N
k EDSC
NE
DSCN
E
A
frequencyrate
IR ×=
Where, TR = Total return
IR = Income Return
DSC = number of days from settlement day to the next coupon date.

Ibbotson Associates Page 20 TIPS as an Asset Class
E = number of days in coupon period in which settlement date occurs.
N = number of coupons payable between settlement date and redemption date.
A = number of days from beginning of coupon period to settlement date.
Rate = annual coupon rate (yield when the inflation-indexed bond was bought)
Frequency = frequency of coupon payments per year
Yld = yield to maturity (the current yield on the inflation-indexed bond)
I = inflation over the most recent calendar year
Par = original face value of a bond
Redemption = proceeds from the sale of a bond

Ibbotson Associates Page 21 TIPS as an Asset Class
References
Lucas, Gerald, and Timothy Quek. “A Portfolio Approach to TIPS.” Journal of Fixed Income,December 1998, p. 77.
Sargent, Kevin H., and Richard D. Taylor. “TIPS for Safer Investing.” Federal Reserve Bank ofCleveland, Economic Commentary, July 1997.
Shen, Pu. “Features and Risks of Treasury Inflation Protection Securities.” Federal Reserve Bank ofKansas City, Economic Review, First Quarter 1998, pp. 31-33.
Wrase, Jeffrey M. “Inflation-Indexed Bonds: How Do They Work?” Federal Reserve Bank ofPhiladelphia, Business Review, July/August 1997, p. 10.