tissue classification with gene expression...
TRANSCRIPT

TissueClassificationwith GeneExpressionProfiles���
Amir Ben-Dor�Agilent Laboratories
3500DeerCreekRoad,MS 25U-5
PaloAlto, CA 94304
and
TheUniversityof Washington,Seattle
Laurakay BruhnAgilent Laboratories
3500DeerCreekRoad,MS 25U-7
PaloAlto, CA 94304
laurakay [email protected]
Nir FriedmanSchoolof ComputerScience& Engineering
Hebrew University
Jerusalem,91904,ISRAEL
Iftach NachmanCenterfor ComputationalNeuroscience
and
Schoolof ComputerScience& Engineering
Hebrew University
Jerusalem,91904,Israel
Michel SchummerUniversityof Washington
Box 357730
Seattle,WA 98195
Zohar YakhiniAgilent Laboratories
MATAM Bdg30
Haifa 31905,Israel
zohar [email protected]
May 3, 2000
Abstract
Constantlyimproving geneexpressionprofiling technologiesareexpectedto provide un-derstandingandinsight into cancerrelatedcellular processes.Geneexpressiondatais also�
A preliminaryversionof this work appearedin Proceedingsof the Fourth AnnualInternationalConferenceonComputationalMolecularBiology, 2000.�
Part this work wasdonewhile Amir Ben-Dorwasat University of Washington,Seattle,with supportfrom theProgramfor MathematicsandMolecularBiology(PMMB). Nir FriedmanandIftachNachmanweresupportedthroughthegenerosityof theMichaelSacherTrustandIsraeliScienceFoundationequipmentgrant.Partof thiswork wasdonewhile ZoharYakhiniwasvisiting theComputerScienceDepartmentat theTechnion.�
Contactauthor.
1

expectedto significantlyaid in thedevelopmentof efficientcancerdiagnosisandclassificationplatforms.In thiswork weexaminethreesetsof geneexpressiondatameasuredacrosssetsoftumor(s)andnormalclinical samples:Thefirst setconsistsof 2,000genes,measuredin 62ep-ithelial colonsamples(Alon et al. 1999).Thesecondconsistsof � 100,000clones,measuredin 32ovariansamples(unpublishedextensionof datasetdescribedin (Schummeretal. 1999)).The third setconsistsof � 7,100genes,measuredin 72 bonemarrow andperipheralbloodsamples(Golub et al. 1999). We examinethe useof scoringmethods,measuringseparationof tissuetype(e.g.,tumorsfrom normals)usingindividual geneexpressionlevels. Thesearethencoupledwith high dimensionalclassificationmethodsto assessthe classificationpowerof completeexpressionprofiles.Wepresentresultsof performingleave-one-outcrossvalida-tion (LOOCV) experimentson thethreedatasets,employing nearestneighborclassifier, SVM(Cortes& Vapnik 1995),AdaBoost(Freund& Schapire1997)anda novel clusteringbasedclassificationtechnique.As tumorsamplescandiffer from normalsamplesin their cell-typecompositionwealsoperformLOOCV experimentsusingappropriatelymodifiedsetsof genes,attemptingto eliminatetheresultingbias.
Wedemonstratesuccessrateof at least90%in tumorvsnormalclassification,usingsetsofselectedgenes,with aswell aswithout cellularcontaminationrelatedmembers.Theseresultsareinsensitive to theexactselectionmechanism,over acertainrange.
1 Intr oduction
The processby which the approximately100,000genesencodedby the humangenomeareex-pressedasproteinsinvolvestwo steps.DNA sequencesare initially transcribedinto mRNA se-quences. ThesemRNA sequencesin turn are translatedinto the amino acid sequencesof theproteinsthat performvariouscellular functions. A crucial aspectof propercell function is theregulationof geneexpression,sothatdifferentcell typesexpressdifferentsubsetsof genes.Mea-suringmRNA levels canprovide a detailedmolecularview of the subsetof genesexpressedindifferentcell typesunderdifferentconditions.Recentlydevelopedarray-basedmethodsenablesi-multaneousmeasurementsof theexpressionlevelsof thousandsof genes.Thesemeasurementsaremadeby quantitatingthehybridization(detectedfor example,by fluorescence)of cellularmRNAto an arrayof definedcDNA or oligonucleotideprobesimmobilizedon a solid substrate.Arraymethodologieshave led to a tremendousaccelerationin therateat which geneexpressionpatterninformation is accumulated(DeRisi. et al. 1997,Khan et al. 1998,Lockhart et al. 1996,Wenet al. 1998).Measuringgeneexpressionlevelsunderdifferentconditionsis importantfor expand-ing ourunderstandingof genefunction,how variousgeneproductsinteract,andhow experimentaltreatmentscanaffect cellularfunction.
Geneexpressiondatacanhelpin betterunderstandingof cancer. Normalcellscanevolve intomalignantcancercellsthroughaseriesof mutationsin genesthatcontrolthecell cycle,apoptosis,andgenomeintegrity, to nameonlyafew. Asdeterminationof cancertypeandstageis oftencrucialto theassignmentof appropriatetreatment(Golubetal.1999),acentralgoalof theanalysisof geneexpressiondatais theidentificationof setsof genesthatcanserve,via expressionprofiling assays,asclassificationor diagnosisplatforms.
Another importantpurposeof geneexpressionstudiesis to improve understandingof cellu-lar responsesto drug treatment.Expressionprofiling assaysperformedbefore,during andafter

treatment,areaimedat identifying drugresponsivegenes,indicationsof treatmentoutcomes,andat identifying potentialdrug targets(Clarke et al. 1999). More generally, completeprofilescanbeconsideredasa potentialbasisfor classificationof treatmentprogressionor othertrendsin theevolutionof thetreatedcells.
Dataobtainedfrom cancerrelatedgeneexpressionstudiestypically consistsof expressionlevelmeasurementsof thousandsof genes.This complexity calls for dataanalysismethodologiesthatwill efficiently aid in extractingrelevantbiologicalinformation.Previousgeneexpressionanalysiswork emphasizesclusteringtechniques,which aim at partitioning the set of genesinto subsetsthatareexpressedsimilarly acrossdifferentconditions.Indeed,clusteringhasbeendemonstratedto identify functionally relatedfamiliesof genes(Ben-Doret al. 1999,DeRisi. et al. 1997,Chuet al. 1998,Eisenet al. 1998,Iyer et al. 1999,Wen et al. 1998). Similarly, clusteringmethodscanbeusedto dividea setof cell samplesinto clustersbasedon their expressionprofile. In (Alonetal.1999)thisapproachwasappliedto asetof colonsampleswhichwasdividedinto two groups,onecontainingmostlytumorsamples,andtheothercontainingmostlynormaltissuesamples.
Clusteringmethods,however, do not useany tissueannotation(e.g.,tumorvs.normal)in thepartitioningstep.This informationis only usedto assesthesuccessof themethod.Suchmethodsare often referredto as unsupervised. In contrast,supervisedmethods,attemptto predict theclassificationof new tissues,basedon their geneexpressionprofilesafter training on examplesthathavebeenclassifiedby anexternal“supervisor”.
Thepurposeof thiswork is to rigorouslyassessthepotentialof classificationapproachesbasedongeneexpressiondata.Wepresentanovelclusteringbasedclassificationmethodology, andapplyit togetherwith two otherrecentlydevelopedclassificationapproaches,Boosting(Schapire1990,Freund& Schapire1997)andSupportVectorMachines(Cortes& Vapnik1995,Vapnik1999)tothreedatasets.Thesesetsinvolvecorrespondingtissuesamplesfrom tumorandnormalbiopsies.Thefirst is a datasetof coloncancer(Alon et al. 1999),thesecondis a datasetof ovariancancer(an extensionof the dataset reportedin (Schummeret al. 1999)),andthe third is a datasetofleukemia (Golub et al. 1999). We useestablishedstatisticaltools, suchas leaveoneout crossvalidation(LOOCV), to evaluatethepredictivepowerof thesemethodsin thedatasets.
Oneof themajorchallengesof geneexpressiondatais the largenumberof genesin thedatasets. For example,oneof our datasetsincludesalmost100,000clones. Many of theseclonesarenot relevant to the distinctionbetweencancerandtumor andintroducenoisein the classifi-cationprocess.Moreover, for diagnosticpurposesit is importantto find small setsof genesthataresufficiently informative to distinguishbetweencellsof differenttypes.To this endwe suggesta simplecombinatorialerror ratescorefor eachgene,andusethis methodto selectinformativegenes.As we show, selectingrelatively smallsubsetsof genescandrasticallyimprove theperfor-mance.Moreover, this selectionprocessalsoisolatesgenesthatarepotentiallyintimatelyrelatedto thetumormakeupandthepathomechanism.
To realisticallyassesstheperformanceof suchmethodsoneneedsto addresstheissueof sam-ple contamination. Tumorandnormalsamplesmaydramaticallydiffer in termsof their cell-typecomposition.For example,in thecoloncancerdata(Alon et al. 1999),theauthorsobserved thatthe normalcolon biopsyalso includedsmoothmuscletissuefrom the colon walls. As a result,smoothmusclerelatedgenesshowed high expressionlevels in the normalsamplescomparedtothe tumor samples.This artifact, if consistent,could contribute to successin classification.Toeliminatethis effect we remove the musclespecificgenesandobserve the effect on the success
3

rateof theprocess.The restof the paperis organizedasfollows. In Section2, we describethe principal classi-
fication methodswe usein this study. Theseincludetwo stateof theart methodsfrom machinelearning,anda novel approachbasedon the clusteringalgorithm of (Ben-Dor et al. 1999). InSection3, we describethethreedatasets,theLOOCV evaluationmethod,andevaluatetheclas-sificationmethodson thethreedatasets. In Section4 we addresstheproblemof geneselection.Weproposeasimplemethodfor selectinginformativegenesandevaluatetheeffectof geneselec-tion on the classificationmethods.In Section5, we examinethe effect of samplecontaminationon possibleclassification.We concludein Section6 with a discussionof relatedwork andfuturedirections.
2 ClassificationMethods
In this section,we describethe main classificationmethodsthat we will be using in this paper.We startby formally definingtheclassificationproblem.Assumethatwe aregivena training set�
, consistingof pairs � ��������� , for ����������������� . Eachsample � is a vectorin R thatdescribesexpressionvaluesof ! genes/clones.The label ��� associatedwith � is either "#� or $%� (for sim-plicity, we will discusstwo-labelclassificationproblems).A classificationalgorithmis a function&
thatdependson two arguments,thetrainingset�
, andaquery (' R , andreturnsapredictedlabel )�*� &,+.- 0/ . We alsoallow for no classificationto occur if is eithercloseto noneof theclassesor whenit is tooborderlinefor adecisionto betaken.Formally, this is realizedby allowing)� to be "1� , $%� or 2 , thelatter representinganunclassifiedquery. Goodclassificationprocedurespredict labelsthat typically matchthe “true” label of the query. For a precisedefinition of thisnotionin theabsenceof theunclassifiedoptionassumethatthereis some(unknown) joint distribu-tion 3 - 4���5/ of expressionpatternsandlabels.Theerror of aclassificationfunction
&,+.-76 / is definedas 3 -8&,+9- 0/;:�<�5/ . Of course,sincewe do not have accessto 3 -=6 / , we cannotpreciselyevaluatethis termanduseestimatorsinstead.Whenunclassifiedis acceptedasapossibleoutputoneneedsto considerthe costs/penaltiesof the variousoutcomesin analyzingthe valueof a classificationmethod. For a comprehensive discussionof classificationproblemssee(Bishop1995,Duda&Hart1973,Ripley 1996).
2.1 NearestNeighbor Classifier
Oneof thesimplestclassificationproceduresis thenearestneighborclassifier(Duda& Hart1973).Theintuition is simple.To classifya query , find themostsimilar examplein
�andpredictthat hasthesamelabel asthat example. To carryout this procedurewe needto definea similarity
measureon expressionpatterns.In our experiments,we usethePearsoncorrelationasa measureof similarity (see,e.g.,(Eisenet al. 1998)).
Formally, let > ? - 4��@A/B�DC E - �F" C E GH/ - @I�F" C E @JG�/�GK L M�N EPO G L M�N ERQ Gbe the Pearsoncorrelationbetweentwo vectorsof expressionlevels. Given a new vector , the
4

nearestneighborclassificationproceduresearchesfor thevector � in thetrainingdatathatmaxi-mizes
> ? - 4�S ��/ , andreturns��� , thelabelof � .This simplenon-parametricclassificationmethoddoesnot take any global propertiesof the
trainingsetinto consideration.However, it is surprisinglyeffective in many typesof classificationproblems.We useit in our analysisasa strawman,to which we comparethemoresophisticatedclassificationapproaches.
2.2 UsingClustering for Classification
Recallthatclusteringalgorithms,whenappliedto expressionpatterns,attemptto partitionthesetof elementsinto clustersof patterns,so that all the patternswithin a clusteraresimilar to eachother, anddifferentfrom patternsin otherclusters.This suggeststhat if thelabelingof patternsiscorrelatedwith thepatterns,thenunsupervisedclusteringof thedata(labelsnottakeninto account)would clusterpatternswith the samelabel togetherand separatepatternswith different labels.Indeed,sucharesultis reportedby Alon etal. (1999)in theiranalysisof coloncancer. Theirstudy(which we describein more detail in Section3) involves geneexpressionpatternsfrom colonsamplesthatincludebothtumorsandnormaltissues.Applying ahierarchicalclusteringprocedureto thedata,Alon et al. observe that the topmostdivision in thedendrogramdividessamplesintotwo groups,onepredominantlytumor, andthe otherpredominantlynormal. This suggeststhatfor sometypesof classificationproblems,suchas tumor vs. normal, clusteringcandistinguishbetweenlabels. Following this intuition, we build a clusteringbasedclassifier. We first describetheunderlyingclusteringalgorithmandthenpresenttheclassifier.
2.2.1 The clustering algorithm
The CAST algorithm, implementedin the BioClust analysissoftware package(Ben-Dor et al.1999),takesasinputathresholdparameterT , whichcontrolsthegranularityof theresultingclusterstructure,anda similarity measurebetweenthetissues.U We saythata tissueV hashigh similarityto asetof tissuesW , if theaveragesimilarity betweenV andthetissuesin W is at leastT . Otherwise,wesaythat V haslow similarity to W . CASTconstructstheclustersoneatatime,andhaltswhenalltissuesareassignedto clusters.Intuitively, thealgorithmalternatesbetweenaddinghighsimilaritytissuesto W , andremoving low similarity tissuesfrom it. Eventually, all thetissuesin W havehighsimilarity to W , while all thetissuesoutsideof W have low similarity to W . At thisstagetheclusterW is closed,anda new clusteris started(See(Ben-Doret al. 1999)for completedescriptionof thealgorithm).
Clearly, thethresholdvalue T , hasgreateffecton theresultingclusterstructure.As T increases,theclustersformedaresmaller. At theextremecase,if T is high enough,eachtissuewould forma singletoncluster. Similarly, as T decreases,theclusterstendto get larger. If T is low enough,alltissuesareassignedto thesamecluster.X
In thiswork weusethePearsoncorrelationbetweengeneexpressionprofilesasthesimilarity measure.However,any similarity measurecanbeused.
5

2.2.2 Clustering basedclassification
As describedabove, the thresholdparameterT determinesthe cohesivenessand the numberofthe resultingclusters.A similar situationoccursin otherclusteringalgorithms.For example,inhierarchicalclusteringalgorithms(e.g.,(Alon et al. 1999,Eisenet al. 1998)),thecutoff “level” ofthetreecontrolsthenumberof clusters.In any clusteringalgorithm,it is clearthatattemptingtopartitionthedatainto exactly two clusterswill notbetheoptimalchoicefor predictinglabels.Forexample,if the tumorclassconsistsof several typesof tumors,thenthemostnoticeabledivisioninto two clustersmight separate“extreme” tumorsfrom the milder onesandthe normaltissues,andonly a furtherdivisionwill separatethenormalsfrom themilder tumors.
For thepurposeof determiningtheright parameterto beusedin clusteringdatathatcontainssomelabeledsampleswe proposea measureof clusterstructurecompatibilitywith a givenlabelassignment.The intuition is simple: on the onehand,we want clustersto be uniformly labeledandthereforepenalizepairsof samplesthatarewithin thesameclusterbut have differentlabels;on theotherhand,we do not wantto createunnecessarypartitionsandthereforepenalizepairsofsamplesthathave thesamelabel,but arenot within thesamecluster.
Formally, we definethe compatibilityscoreof a clusterstructurewith the training setasthesumof two terms. The first is the numberof tissuepairs
- VY��Z0/ suchthat V and Z have thesamelabel, andareassignedto the samecluster. The secondterm is the numberof
- VY��Z0/ pairs thathave differentlabels,andareassignedto differentclusters.This scoreis alsocalledthematchingcoefficient in theliterature(Everitt 1993).To handlelabelassignmentsdefinedonly onasubsetofthedatawe restrictthecomparisonto countpairsof examplesfor which labelsareassigned(thematchingcoefficient for asubmatrixis computed).
Usingthisnotion,wecanoptimize,usingabinarysearch,thechoiceof clusteringparameterstofind themostcompatibleclustering.That is: we considerdifferentthresholdvalues,T ; useCASTto clusterthe tissues;measurethe compatibility [ - T\/ of the resultingclusterstructurewith thegivenlabelassignment;andfinally, choosetheclusteringthathasmaximal [ - T\/ . Thus,althoughtheclusteringalgorithmis unsupervised, in thesensethat it doesnot take into accountthelabels,we usea supervisedprocedurefor choosingtheclusteringthreshold.We alsoemphasizethat thisgeneralideacanbeappliedto any parameterdependentclusteringmethod,andis not restrictedtoour particularchoice.
To classifyaquerysampleweclusterthetrainingdataandthequery, maximizingcompatibilityto the labelingof the trainingdata. We thenexaminethe labelsof all elementsof theclusterthequerybelongsto andusea simplemajority rule to determinetheunknown label. The intuition isthat thequery’s labelshouldagreewith theprevailing label in its cluster. Variousmajority rules,taking into accountstatisticalconfidencecanbe used. Whenconfidenceis too low the query islabeledasunclassified. The stringency of this testdeterminesthe strictnessof our classificationrule. In thecurrentexperimentweusethemostliberal rule, i.e. aqueryis unclassifiedonly if thereis anequalnumberof elementsof eachlabelin its cluster. Thechoiceof majority ruledependsonthecostof non-classificationvs. thecostof misclassification.
2.3 Lar ge-Margin Classifiers
Thecluster-basedapproachwediscussedin theprevioussectionattemptsto find inherentstructurein thedata(i.e., clustersof samples)andusesthis structurefor prediction.We canalsousedirect
6

methodsthatattemptto learna decisionsurfacethatseparatesthepositive labeledsamplesfromthenegatively labeledsamples.
The literatureof supervisedlearningdiscussesa largenumberof methodsthat learndecisionsurfaces.Thesemethodscanbedescribedby two aspects.First, theclassof surfacesfrom whichoneis selected.This questionis oftencloselyrelatedto the representationof thelearnedsurface.Examplesincludelinearseparation(which we discussin moredetailbelow), decision-treerepre-sentations,andtwo-layerartificial neuralnetworks. Second,the learningrule that is beingused.For example,oneof thesimplestlearningrulesattemptsto minimize thenumberof errorson thetrainingset.
Application of direct methodsto our domaincan suffer from a seriousproblem. In gene-expressiondataweexpect ! , thenumberof measuredgenes,to besignificantlylargerthan ] , thenumberof samples.Thus,dueto thelargenumberof dimensionstherearemany simpledecisionsurfacesthatcanseparatethepositiveexamplesfrom thenegativeones.This meansthatcountingthe numberof training seterrorsis not restrictive enoughto distinguishgooddecisionsurfacesfrom badones(in termsof theirperformanceon examplesnot in thetrainingset).
In this paper, we usetwo methodsthatreceivedmuchrecentattentionin themachinelearningliterature.Bothmethodsattemptto follow theintuition thatclassificationof examplesdependsnotonly on theregion they arein, but alsoon a notionof margin: how closethey areto thedecisionsurface.Classificationof exampleswith smallmargins is not asconfidentasclassificationof ex-ampleswith largemargins. (Givenslightly differenttrainingdata,theestimateddecisionsurfacemovesa bit, thuschangingtheclassificationof pointswhich arecloseto it.) This reasoningsug-geststhatweshouldselectadecisionsurfacethatclassifiesall thetrainingexamplescorrectlywithlargemargin. Following thesameargument,giventhe learneddecisionsurfaceandanunlabeledsample , we canseta thresholdon themargin of for classification.If is closerto thesurfacethenthe allowed threshold,we mark is asunclassified.Again, the thresholdwill dependon therelativecostsof thedifferentoutcomes.
The basicintuition of large margin classifiersis developedin quite differentmannersin thefollowing two approaches.
2.3.1 Support Vector Machines
Supportvector machines(SVM) were developedin (Cortes& Vapnik 1995,Vapnik 1999). AtutorialonSVMscanbefoundin (Burges1998).Theintuition for supportvectormachinesis bestunderstoodin theexampleof lineardecisionrules.A lineardecisionrule canberepresentedby ahyperplanein ^ suchthatall examplesontheonesideof thehyperplanearelabeledpositiveandall theexamplesontheothersidearelabelednegative. Of course,in sufficiently high-dimensionaldatawe canfind many linear decisionrulesthat separatethe examples.Thus,we want to find ahyperplanethat is asfar away aspossiblefrom all theexamples.More precisely, we wantto finda hyperplanethatseparatesthepositiveexamplesfrom thenegativeones,andalsomaximizestheminimumdistanceof theclosestpointsto thehyperplane.
We now make this intuition moreconcrete. A linear decisionrule can be representedby ahyperplanein ^ suchthat all exampleson the onesideof the hyperplaneare labeledpositiveandall theexampleson theothersidearelabeledasnegative. Sucha rule canberepresentedbya vector _`'a^ anda scalarb thattogetherspecifythehyperplane_ 6 c$dbe�f2 . Classification
7

for anew example is performedby computingsign- _ 6 1$gb�/ . Recallthat hji�k lnmnopqp l pqp h is thedistance
from to theline 6 _r$sb.�t2 . Thus,if all pointsin thetrainingdatasatisfy�u� - � 6 _r$sb�/.vw� (1)
than all points are correctly classified,andall of themhave a distanceof at least �yxYhjh _zhjh fromthe hyperplane.We canfind the hyperplanethat maximizesthe margin of error by solving thefollowing quadraticprogram:
Minimize h�h _zhjh {Subject to �u� - � 6 _s$sb�/.vw� for �|�}�~����������� .
Suchquadraticprogramscanbesolvedin thedual form. This dual form is posedin termsofauxiliaryvariables�4� . Thesolutionhasthepropertythat_��t� � �4�H���j ���andthus,wecanclassifyanew example by evaluating
sign- � � �4�H���=5 �8�S0�4$�b�/ (2)
In practice,thereis arangeof optimizationmethodsthatcanbeusedfor solvingthedualoptimiza-tion problem.SeeBurges(1998)for moredetails.
TheSVM dualoptimizationproblemandits solutionhave severalattractive properties.Mostimportantly, only asubsetof thetrainingexamplesdeterminethepositionof thehyperplane.Intu-itively, theseareexactly thesesamplesthatareat a distance�yxFhjh _�h�h from thehyperplane.It turnsout that the dual problemsolutionassigns������2 to all examplesthat arenot “supporting” thehyperplane.Thus,weonly needto storethesupportvectors � for which �����d2 . (Hencethenameof thetechnique.)
It is clear that linear hyperplanesarea restrictedform of decisionsurfaces. Onemethodoflearningmore expressive separatingsurfacesis to project the training examples(and later onqueries)into a higher-dimensionalspace,and learna linear separatorin that space. For exam-ple, if our trainingexamplesarein ^ U , we canprojecteachinput value to thevector
- 4�\ { / . Alinearseparatorin theprojectedspaceis equivalentto aninterval in theoriginal representationofthetrainingexamples.
In general,we canfix anarbitraryprojection �t� R ��� R � to higherdimensionalspace,andgetmoreexpressivedecisionsurfaces.However, it seemsthatit requiresusto solveaharderSVMoptimizationproblem,sincewenow dealwith higherdimensionalspace.
Somewhat surprisingly, it turnsout that the dual form of the quadraticoptimizationprobleminvolvesonly inner productsof vectorsin ^ (i.e., expressionsof the form �� - �5/���� - ���/\� ). Inotherwords,vectors � do not appearoutsidethescopeof an innerproductoperation.Similarly,theclassificationrule (2) only examinesvectorsin ^ insidetheinnerproductoperation.Thus,ifwe wantto considerany projection �t� R ��� R � , we canfind anoptimalseparatinghyperplanein thatprojectedspaceby solvingthequadraticproblemwith innerproducts�� - ��/���� - ���/\� . Thus,if we cancomputetheseinner products,thecostof thequadraticoptimizationproblemdoesnotincreasewith thenumberof dimensionsin theprojectedspace.
8

Moreover, for many projectionstherearekernel functionsthatcomputetheresultof theinnerproduct. A kernel function
>for a projection � satisfies
> - 4��@A/%���� - 0/���� - @A/S� . Given a legalkernelfunction,wecanuseit withoutknowing or explicitly computingtheactualmapping� . Formany projections,the kernelfunction canbe computedin time that is linear in ! , regardlessofthedimension] . For example,kernelfunctionsof theform
> - 4��@n/�� - 54�S@n�F$d�y/ ? computedot-
productsfor a projectionfrom ^ to ^ -�� � / , whereeachcoordinateis a polynomialof degree� intheoriginalcoordinatesin ^ . Notethatin thisexample,a lineardecisionsurfacein theprojectedspacecorrespondsto apolynomialmanifoldof degree� in theoriginal space.
To summarize,if we wantto learnexpressivedecisionsurfaces,we canchoosea kernelfunc-tion, anduseit insteadof the inner-productin the executionof the SVM optimization. This isequivalentto learninga linearhyperplanein theprojectedspace.
In this work weconsidertwo kernelfunctions:� Thelinearkernel
> U - 4��@A/���54��@A� .� Thequadratickernel
> { - 4��@A/�� - �4��@n��$��y/7{ .Therationalfor usingthesesimplekernels,is thatsinceour input spaceis high dimensional,wecanhopeto find a simpleseparationrule in thatspace.We thereforetestthelinearseparator, andthenext orderseparatorasacomparisonto checkif higherorderkernelscanyield betterresults.
Note that the quadratickernel is strictly more expressive than the linear one: any decisionsurfacethatcanberepresentedwith
> U -=6 � 6 / canalsoberepresentedwith
> { -76 � 6 / . Nonetheless,it isnot obviousthatthemoreexpressive representationwill alwaysperformbetter. Givena largersetof decisionsurfacesto choosefrom, this procedureis moresusceptibleto overfitting, i.e. learningadecisionsurfacethatperformswell on thetrainingdatabut performsbadlyon testdata.
2.3.2 Boosting
Boostingwasinitially developedasa methodfor constructinggoodclassifiersby repeatedcallsto “weak” learningprocedures(Freund& Schapire1997,Schapire1990).Theassumptionis thatwe have accessto a “weak learner”thatgivena trainingset
�, constructsa function
&,+.- 0/ . Thelearneris weakin thesensethat the training seterror is only slightly betterthanthatof a randomguess. Formally, we assumethat
&I+.- 0/ classifiesat least �yx���$��yx��Y ,��@ - �¡/ of the input spacecorrectly.
In this paper, weusea fairly simpleweaklearner, thatfindssimplerulesof theform:¢ - £�y¤~�ST���¥�/��§¦ ¥ E ¤~G4��T"¨¥ E ¤~G4©�Twhere is anexpressionprofile (e.g.,a tissueto beclassified),¤ is an index of a gene, E ¤~G is theexpressionvalueof the ¤ ’ th genein the vector , T is a thresholdcorrespondingto gene¤ , and¥a'«ªI$%�~��"#��¬ is a directionparameter. Sucha rule is calleda decisionstump. Givena dataset�
, we learndecisionstumpsby exhaustively searchingall genes,for eachgenesearchingoverallthresholdsanddirections,andfinally returningthe combinationthat hasthe smallestnumberof
9

errors.{Boostingusestheweaklearningprocedure(in ourcase,thedecisionstumplearner)to construct
a sequenceof classifiers& U ��������� &, , andthenusesa weightedvoteamongtheseclassifiers.Thus,
thepredictionmadeby theboostingalgorithmhastheform :® - 0/¯� sign- � � _¯� & � - 0/\/
where_9� aretheweightsassignedto theclassifiers.The crux of the algorithmis the constructionof the sequenceof classifiers.The intuition is
simple. Supposethatwe train theweaklearneron theoriginal trainingdata�
to geta classifier& U - 0/ . Then,wecanfind theexamplesin�
thatareclassifiedincorrectlyby& U . We wantto force
thelearningalgorithmto givetheseexamplesspecialattention.This is doneby constructinganewtrainingdatasetin which theseexamplesaregivenmoreweight. Boostingtheninvokestheweaklearneron thereweightedtrainingsetandobtainsa new classifier. Examplesarethenreweightedagain,andtheprocessis iterated.Thus,boostingadaptively reweightstrainingexamplesto focuson the“hard” ones.° In thispaper, weusetheAdaBoostalgorithmof FreundandSchapire(1997).Thisalgorithmis describedin Figure1.
In practiceboostingis anefficient learningprocedurethatusuallyhasasmallnumberof errorsontestsets.Thetheoreticalunderstandingof thisphenomenonusesanotionof margin thatis quitesimilar to theonedefinedfor SVMs. Recall,thatboostingclassificationis madeby averagingthe“votes”of many classifiers.Definethemargin of example � to be�±�²�³�u� � � _¯� & � - ��/��By definition,wehavethatif �±�|�d2 , then
® - ��/´�³��� , andthus � is classifiedcorrectly. However,if �±� is closeto 2 , thenthis classificationis “barely” made.On theotherhand,if �±� is closeto � ,thena large majority of theclassifiersmake the right predictionon � . Theanalysisof Schapireet al. (1998)andMasonet al. (1999)shows that the generalizationerror of boosting(andothervoting schemes)dependson thedistribution of marginsof trainingexamples.Schapireet al. alsoshow that repeatediterationsof AdaBoostcontinually increasethe smallestmargin of trainingexamples. This is contrastedwith other voting schemesthat are not necessarilyincreasingthemargin for thetrainingsetexamples.
3 Evaluation
In theprevioussectionwe discussedseveralapproachesfor classification.In this sectionwe ex-aminetheir performance,on experimentaldata.µ
Notethatfor eachgene,we needto consideronly ¶ rules,sincethegenetakesat most ¶ differentvaluesin thetrainingdata.Thus,wecanlimit ourattentionto mid-waypointsbetweenconsecutivevaluesattainedby the · ’ th genein thetrainingdata.¸
More precisely, boostingdistortsthe distribution of the input samples.For someweaklearners,like the stumpclassifier, this canbesimulatedby simply reweightingthesamples.
10

Input:� A datasetof � labeledexamplesª - U ��� U /���������� - ¹e����¹º/�¬� A weaklearningalgorithm » .
Initialize: thedistributionover thedataset:� U - ��/¯�¼�yx,� for �½�f�´�����\�Iterate:for T¯�¼�~���¾���u���u�S¿� Call » with distribution
�%À; Getbackahypothesis
® À.� Calculatetheerrorof
® À: Á À � ¹��R U �%À - ��/���ª,���´:� ® À - ��/�¬� Set _ À � U{ �� ¢ U�Ã�ÄHÅÄHÅ� Setthenew distribution to be:�%À m U - �5/�Æ �ÇÀ - �5/7È l Å�ÉPÊuË�Å�Ì i Ê�Í
suchthat�%À m U will sumto 1.
Output: Thefinal hypothesis ® - 0/´�tÎÏ� ¢�Ð -½Ñ�À  U _ À ® À - 0/S/Figure1: ThegenericAdaBoostalgorithm.In oursettingweusetheweaklearner» is aprocedurethatsearchesfor a decisionstumpthathasthesmallest(weighted)erroron thetrainingdata(withweightsdefinedby
�%À). The final outputof AdaBoostin this caseis a weightedcombinationof
decisionstumps.
11

3.1 Data Sets
Descriptionsof thethreedatasetsstudiedfollow. Thefirst two datasetsinvolvecomparingtumorandnormalsamplesof thesametissue,while thethird datasetinvolvessamplesfrom two variantsof thesamedisease.
Colon cancerdata set. This datasetis a collectionof expressionmeasurementsfrom colonbiopsy samplesreportedby Alon et al. (1999). The dataset consistsof 62 samplesof colonepithelialcells. Thesesampleswerecollectedfrom colon-cancerpatients.The“tumor” biopsieswerecollectedfrom tumors,andthe “normal” biopsieswerecollectedfrom healthypartsof thecolonsof thesamepatients.Thefinal assignmentsof thestatusof biopsysamplesweremadebypathologicalexamination.
Geneexpressionlevelsin these62 samplesweremeasuredusinghigh densityoligonucleotidearrays.Of the Ò<Ó~2~2~2 genesrepresentedin thesearrays,2000geneswereselectedbasedon theconfidencein themeasuredexpressionlevels. Thedata,62 samplesover 2000genesis availableathttp://www.molbio.princeton.edu/colondata.
Ovarian cancer data set. This datasetis a collectionof expressionmeasurementsfrom 32samples:15 ovary biopsiesof ovariancarcinomas,13 biopsiesof normalovaries,and4 samplesof othertissues.Thus,thedatasetconsistsof 28 sampleslabeledastumoror normal. Geneex-pressionlevelsin these32samplesweremeasuredusingamembrane-basedarraywith radioactiveprobes.The arrayconsistedof cDNAs representingapproximately100,000clonesfrom ovarianclonelibraries.For someof thesamples,therearetwo or threerepeatedhybridizationsfor erroras-sessments.In thesecases,wecollapsedtherepeatedexperimentsinto oneexperiment,representedby theaveragelevel of expression.
Leukemia data set. This dataset is a collection of expressionmeasurementsreportedbyGolubet al. (1999). Thedatasetcontains72 samples.Thesesamplesaredividedto two variantsof leukemia:25samplesof acutemyeloidleukemia(AML) and47samplesof acutelymphoblasticleukemia(ALL). Thesourceof thegeneexpressionmeasurementswastaken from 63 bonemar-row samplesand9 peripheralblood samples.Geneexpressionlevels in these72 samplesweremeasuredusinghigh densityoligonucleotidemicroarrays.The expressionlevels of 7129genesarereported.Thedata,72 samplesover7129genesis availableathttp://www.genome.wi.mit.edu/MPR.
3.2 Estimating Prediction Err ors
Whenevaluatingthe predictionaccuracy of the classificationmethodswe describedabove, it isimportantnot to usethetrainingerror. Mostclassificationmethodswill performwell onexamplesthey haveseenduringtraining.To getarealisticestimateof performanceof theclassifier, wemusttest it on examplesthat did not appearin the training set. Unfortunately, sincewe have a smallnumberof examples,wecannotremoveasizeableportionof thetrainingsetanduseit for testing.
A commonmethodto testaccuracy in suchsituationsis cross-validation. To applythismethod,wepartitionthedatainto
>setsof samples,[ U ����������[ (typically, thesewill beof roughlythesame
size).Then,weconstructadataset� �Ô� � "g[º� , andtesttheaccuracy of
&I+ Ê - / on thesamplesin[º� . Having donethis for all �ÖÕf�eÕ >we estimatetheaccuracy of themethodby averagingthe
accuracy over the
>cross-validationtrials.
12

Cross-validationhasseveralimportantproperties. First, thetrainingsetandthetestsetin eachtrial aredisjoint. Second,theclassifieris testedon eachsampleexactly once.Finally, thetrainingsetfor eachtrial is
- > "�y/Sx > of theoriginaldataset.Thus,for largek, wegetarelatively unbiasedestimateof theclassifierbehavior givena trainingsetof size � .
Thereareseveral possiblechoicesof
>. A commonapproachis to set
> �<� . In this case,every trial removesa singlesampleandtrainson therest.This methodis known asleaveoneoutcrossvalidation (LOOCV). Othercommonchoicesare
> ���2 or
> �ÚÙ . LOOCV hasbeeninusesinceearlydaysof patternrecognition(e.g.,(Duda& Hart 1973)). In somesituations,usinglargerpartitionsreducesthevarianceof theestimators(see(Kohavi 1995)).In thiswork, sincethenumberof samplesis small,weuseLOOCV.
Table1 lists theaccuracy estimatesfor thedifferentmethodsappliedto thethreedatasets.Aswe cansee,theclusteringapproachperformssignificantlybetterthantheotherapproacheson thecolon cancerdataset,but not so on the ovariandatasets. AdaBoostperformsbetterthanothermethodson the leukemiaandoveriandatasets. We canalsoseethat quadraticSVM doesnotperformaswell asthe linearSVM, probablybecauseit overfits thetrainingdata.Thesamephe-nomenonoccursin Adaboost,wheretheclassifiersareslightly moreaccurateafter100iterationsthanafter10000iterations.
3.3 ROC Curves
Estimatesof classificationaccuracy giveonly apartial insighton theperformanceof a method.Inourevaluation,wetreatedall errorsashaving equalpenalty. In many applications,however, errorshaveasymmetricweights.For ageneraldiscussionof risk andlossconsiderationsin classificationsee,e.g, (Ripley 1996). To setterminologyfor our particularcase,we distinguishfalsepositiveerrors- normaltissuesclassifiedastumor, and falsenegativeerrors- tumor tissuesclassifiedasnormal. In diagnosticapplications,falsenegative errorscanbedetrimental,while falsepositivesmaybetolerated(sinceadditionaltestswill beperformedon thepatient).
To dealwith asymmetricweightsfor errors,weintroducetheconfidenceparameter, Û . In clus-teringapproaches,themodifiedprocedurelabelsaquerysampleastumorif theclustercontainingit hasat leasta fraction Û of tumors. In asimilarmanner, wecanintroduceconfidenceparametersfor SVM andboostingapproachesby changingthe thresholdmargin neededfor positive classifi-cation.
ROCcurvesareusedtoevaluatethe“power” of aclassificationmethodfor differentasymmetricweights(see,for example,(Swets1988)). A ROC curve plotsthetradeoff betweenthetwo typesof errorsastheconfidenceparametervaries.Eachpointonthetwo dimensionalcurvecorrespondsto a particularvalue of the confidenceparameter. The
- 4��@n/ coordinatesof a point representthe fractionsof negative andpositive samplesthat areclassifiedaspositive with this particularconfidenceparameter. The extremeendsof the curvesare the moststrict andmostpermissiveconfidencevalues:with thestrictestconfidencevaluenothingis classifiedaspositive,putting
- 2A��2Ü/onthecurve;with themostpermissiveconfidencevalueeverythingis classifiedaspositive,putting- �����y/ onthecurve. Thepathbetweenthesetwo extremesshowshow flexible theprocedureis withrespectto trading-off error rates. The bestcasescenariois that the pathgoesthroughthe point- 2¾���y/ . This impliesthatfor someconfidenceparameter, all positivesareclassifiedaspositive,andall negativesareclassifiedasnegative. Thatis - theprocedurecanbemadeverystrictwith respect
13

Table1: Summaryof classificationperformanceof the differentmethodson the threedatasets.The tablesshows the precentof samplesthat werecorrectlyclassified,incorrectlyclassfied,andunclassfiedby eachmethodin theLOOCV evaluation.Unsupervisedlabelsfor margin basedclas-sifier weredecidedby a fixedthresholdon classificationmargin: in SVM, 2A�Ý��Ù , andin Adaboost,2A�Þ2ÜÙ .
Dataset Method Percentcorrect incorrect unclassified
ColonClustering 88.7 11.3 0.0NearestNeighbor 80.6 19.4 0.0SVM, linearkernel 77.4 12.9 9.7SVM, quad.kernel 74.2 14.5 11.3Boosting,100iter. 72.6 17.7 9.7Boosting,1000iter. 72.6 17.7 9.7Boosting,10,000iter. 71.0 19.4 9.7
OvarianClustering 42.9 17.9 39.3NearestNeighbor 71.4 28.6 0.0SVM, linearkernel 67.9 3.6 28.6SVM, quad.kernel 64.3 3.6 32.1Boosting,100iter. 89.3 10.7 0.0Boosting,1000iter. 85.7 10.7 3.6Boosting,10,000iter. 85.7 14.3 0.0
LeukemiaNearestNeighbor 91.6 8.4 0.0SVM, linearkernel 93.0 1.4 5.6SVM, quad.kernel 94.4 1.4 4.2Boosting,100iter. 95.8 2.8 1.4Boosting,1000iter. 95.8 2.8 1.4Boosting,10,000iter. 95.8 2.8 1.4
14

0
0.2
0.4
0.6
0.8
1
0 0.2 0.4 0.6 0.8 1
Po
siti
ve R
ate
Negative Rate
C lusteringS VM , linearS VM , quad .
B oosting , 100
Figure2: ROCcurvesfor methodsappliedto thecoloncancerdataset.The -axisshowspercent-ageof negativeexamplesclassifiedaspositives,and @ -axisshowspercentageof positiveexamplesclassifiedaspositive. Eachpoint along the curve correspondsto the percentagesachieved at aparticularconfidencethresholdvalueby thecorrespondingclassificationmethod.Error estimatesarebasedon LOOCV trials.
to falsepositiveerror, with no falsenegativepriceto pay. ROCcurveswith largeareasunderneathmeanthathigh falsepositivestringenciescanbeobtainedwithout muchof a falsenegativeprice.
In Figure2 we plot the ROC curves for clustering,SVM andboostingon the colon cancerdataset. As we cansee,thereis no cleardominationamongthe methods.(The only exceptionis SVM with quadratickernelthat is consistentlyworsethanthe othermethods.)The clusteringprocedureis dominantin the region wheremisclassificationerrorsof both typesareroughly ofthesameimportance.However, SVM with linearkernelandboostingarepreferablein regionsofhighly asymmetricerror cost (both endsof the spectrum).This may be dueto the fact that thematchingcoefficient score(seeSection2.2),which determinestheclustergranularity, treatsbothtypesof errorsashaving equalcosts.
4 GeneSelection
It is clearthat the expressionlevels of many of the genesthat aremeasuredin our datasetsareirrelevant to the distinctionbetweentumor andnormal tissues.Taking suchgenesinto accountduring classificationincreasesthe dimensionalityof the classificationproblem,presentscompu-tationaldifficulties,andintroducesunnecessarynoiseto the process.Anotherissuewith a largenumberof genesis the interpretability of the results. If the “signal” that allows our methodstodistinguishtumor from normaltissuesis encodedin the expressionlevelsof few genes,thenwemight be able to understandthe biological significanceof thesegenes.Moreover, a major goalfor diagnosticresearchis to developdiagnosticproceduresbasedon inexpensivemicroarraysthathave enoughprobesto detectdiseases.Thus,it is crucial to recognizewhethera smallnumberof
15

genescansuffice for goodclassification.Theproblemof featureselectionreceiveda thoroughtreatmentin patternrecognitionandma-
chinelearning.Thegeneexpressiondatasetsareproblematicin thatthey containa largenumberof genes(features)andthusmethodsthatsearchover subsetsof featurescanbeprohibitively ex-pensive. Moreover, thesedatasetscontainonly a small numberof samples,so the detectionofirrelevantgenescansuffer from statisticalinstabilities.
4.1 The TNoM Score
To addresstheseissues,we utilize measuresof “relevance”of eachgene.In particular, we focuson a quantitywe call the thresholdnumberof misclassificationor TNoM score of a gene. Theintuition is that an informative genehasquite different valuesin the two classes(normal andtumor),andthuswe shouldbeableto separatetheseby a thresholdvalue. Formally, we seekthebestdecisionstumpfor that gene(asdefinedin Section2.3.2),andthencountthe classificationerrorsthis decisionstumpmakeson thetrainingexamples.
Recallthatwe describea decisionstumprule by two parameters¥ , and T . Thepredictedclassis simply sign
- ¥ - Ö"ßT\/S/ . Thenumberof errorsmadeby adecisionstumpis definedasà N�N -\á ��â�hIã0��ä5/��t��åaæ4ªJä å :� sign-SáÇ6�- O å E ãJG "çâ\/S/�¬J�
where � E ¢ G is theexpressionvalueof gene¢ in the � ’ th sampleand �u� is thelabelof the � ’ th sample.TheTNoM scoreof ageneis simplydefinedas:èÔé1êÏë - ã0��ä5/´��ì�í�îï�ðqñ à N�N -\á ��â�hIã0��ä5/��
thenumberof errorsmadeby thebestdecisionstump.Theintuition is thatthisnumberreflectsthequality of decisionsmadebasedon theexpressionlevelsof this gene.
Notethattheexpressivenessof decisionstumprulesis severelylimited. Thus,moreexpressivequeriesaboutthe gene’s expressionlevel (e.g.,whetherit is within a particularrange)might bemore useful for predictingthe label of the tissue. However, if we are interestedin geneswithsignificantover-expressionor under-expressionin oneof the labels,thensucha thresholdshouldseparatethetwo groups.
4.2 Evaluating the Significanceof a Gene
An immediatequestionto askis whethergeneswith low TNoM scoresare indeedindicative oftheclassificationof expression.In otherwords,we want to testthestatisticalsignificanceof thescoresof the bestscoringgenesin our dataset. One way to evaluatethe significanceof suchresultsis to testthemagainstrandomdata.Moreexplicitly: wewantto estimatetheprobabilityofagenescoringbetterthansomefixedlevel Î in randomlylabeleddata.Thisnumberis thep-valuecorrespondingto the given level Î . Geneswith very low p-valuesarevery rare in randomdataandtheir relevanceto thestudiedphenomenonis thereforelikely to have biological,mechanisticor protocolreasons.Geneswith low p-valuesfor which thelattertwo optionscanberuledoutareinterestingsubjectsfor furtherinvestigationandareexpectedto givedeeperinsightinto thestudiedphenomena.
16

Let ªJ"#��$�¬~Ìóò ð ? Í denoteall vectorswith Ðõô " ô entriesand � ô $ ô entries(the normal/cancerse-manticis onepossibleinterpretation).Let Z bea vectorof labels. Also let ¢ bea vectorof geneexpressionvalues.TheTNoM scoreis a functionthattakes ¢ and Z andreturnsthescoreof ¢ withrespectto labeling Z .
We wantto computethep-valueof a scoreon a particulargene.We assumethatthevectorofgeneexpressionvalues¢ is fixed,andconsiderrandomlabelassignments.Let ö ò ð ? bea randomvectordrawn uniformly over ªJ"1��$�¬ ÌÞò ð ? Í . Thep-valueof a scoreÎ is then÷ L M ä - Î1� ¢ � Ð �8�F/��«ø N ê�ù - èÔé1êÏë - ã0� úÔû ð ü /ºÕ«ý,/�� (3)
Weassume,without lossof generality, thatthevaluesin ¢ appearin ascendingorder. Notethatthe
èÔé1êÏëscoreis insensitiveto theactualdistancebetweenconsecutiveexpressionvaluesof the
gene.Thus,whenwe examinep-values,we do not needto examinethespecificsof ¢ . Therefor,wecanusetheshorthands÷ L M ä - Î#� Ð �8�Y/ and
èÔé#êÏë -=þ / .The combinatorialcharacterof TNoM makesit amenableto rigorouscalculations.We now
describearecursiveprocedurethatcomputestheexactdistributionof TNoM scoresin ªJ"1��$%¬ ÌÞò ð ? Í .Westartby definingthetwo one-sidedTNoM scores:
Definition 4.1 Let V±'aªJ"#��$�¬ Ìóò ð ? Í . Define:Î Ã m - VA/�� ìzíjî�RÂnÿ������ ò m ? ��� # of $ s in V U ���u�u����Vy�$
# of " s in Vy� m U ���u���u��V ò m ?��� �
andsymmetrically: Î m à - V¾/�� ìzíjî� Ânÿ������ ò m ? ��� # of " s in V U ���u���u��Vy�$
# of $ s in Vy� m U ���u�u����V ò m ?��� �
Intuitively, Î Ã m - V¾/ is thescoreof thelabeling V whenwe only examinedecisionstumpsin whichvaluesabove the thresholdarelabeled$ andvaluesbelow the thresholdarelabeled " . (That is,the ¥ coefficient is positive). Similarly, Î m à - VA/ is the scoreof the labelingwhenwe imposethesymmetricconstraint.
Thefollowing simplepropositionis thebasisof therecursivestep:
Proposition 4.2 Let V±'aªJ"#��$�¬ Ìóò ð ? Í . There are two cases:
1. if Vc��Z0$ , for Zõ'aªJ"1��$%¬ ÌÞò ð Ì ? à U�Í�Í , thenÎ m à - V¾/´��¦ Î m à - Z0/Ô$�� if Î m à - Z0/º© ÐÎ m à - Z0/ if Î m à - Z0/�� Ðand Î Ã m - VA/��tÎ Ã m - Z0/��
2. if Vc��Z4" , for Zõ'ߪJ"1��$�¬ ÌuÌóò,à U�Í ð ? Í , thenÎ m à - VA/��tÎ m à - Z0/��and Î Ã m - V¾/��§¦ Î Ã m - Z²/�$�� if Î Ã m - Z0/º©ß�Î Ã m - Z²/ if Î Ã m - Z0/��r�
17

Supposewe are now interestedin computingall TNoM scoredistributions for the spacesªJ"#��$�¬ Ìóò ð ? Í where Ð rangesfrom 2 to and � rangesfrom 2 to � . We definean array ¿ asfollows ¿ - Ð �8�Ô��Î~�ST\/�� �������
�� �� VÖ'aªJ"#��$�¬ ÌÞò ð ? Í � Î Ã m - V¾/��«ÎandÎ m à - V¾/¯��T
� �����������
Contributionsto ¿ - Ð �8����Î~�ST\/ comefrom vectorsin ªJ"#��$�¬ ÌuÌóò,à U�Í ð ? Í by concatenatinga " andfromvectorsin ªJ"#��$�¬~Ìóò ð Ì ? à U�ÍuÍ by concatenatinga $ . Proposition4.2 indicatesthe sizeof eachsuchcontribution in thevariouscasesandweobtainthefollowing recursionformula:
¿ - Ð �8����ÎÜ�\T\/ � ¿ - Ð ���c"ç�~��Î~�ST�"ç�y/�$¿ - Ð "d�~������Î�"��~�ST\/�$� E T�� Ð G 6 ¿ - Ð �8�c"ç�~��ÎÜ� Ð /Ô$� E Îe�s�nG 6 ¿ - Ð "ç���8���8���\T\/�� (4)
where� E T¯� Ð G is 1 if f T¯� Ð and0 otherwise.
Initial conditionsfor this recursive calculationaretrivially set.To obtaintheexplicit distribu-tion andthusthep-valuesweusethefollowing formula:ø N ê�ù - èÔé1êÏë - úÔû ð ü /��}ý,/¯� è -�� � ÷ ��ýÜ��ý,/�$�� 6�� ñ���� è -�� � ÷ ��ý~��â\/� û m üü! �4.3 Inf ormativeGenesin Cancer Data
Considera setof actuallabeledgeneexpressiondata,suchastheoneswe describedabove. Itis beneficialto give somequantitative scoreto the abundanceof highly informative genes,withrespectto the given labeling. Figure 3 depictsa comparisonbetweenthe expectednumberofgenesscoringbetterthana given thresholdandthe actualnumberfound in the data. As we cansee,thenumberof highly informative genesis well above theexpectednumberaccordingto thenull-hypothesis.
To evaluatethebiologicalmeaningof thehighscoringgeneswehaveorderedthegenesin thedatasets,accordingto theirTNoM scores,andexaminedthegenesat thetopof thelist (thosewithbetterTNoM scores).AppendixA lists thehigh-scoringgenesin thecolonandleukemiadatasets.
Amongthetopscoringgenes(èÔé#êÏë Õ¼æ#" ) in thecoloncancerdatasetthereareanumberof
genesthatareinterestingfrom theperspectiveof a potentialinvolvementin tumorigenesisinclud-ing, for example,genesinvolvedin cell cycle regulationandangiogenesis.Therewerealsogenes,for example(D63874)HMG-1 (human)and(T55840)tumor-associatedantigenL6 (human),thathavepreviouslybeenfoundto haveaparticularassociationwith colorectalcarcinomas(Schiedecket al. 1998,Xianget al. 1997).
Amongthetop scoring137clonesin theovariancancerdata,thereare85 clonesthatmatch8cancerrelatedgenes(potentialmarkersor expressedin cancercells)andonegenethatis relatedtoincreasedmetabolicrate(mitochondrialgene).The8 genesarekeratin18(breastcancer),pyruvatekinasemuscle2 (hepatoma),thymopoietin(cell proliferation),HE4 (ovariancancer),SLPI (many
18

0 0.1 0.2 0.3 0.4 0.5 0.6 0.7 0.8 0.9 10
200
400
600
800
1000
1200
1400
1600
1800
2000
P-value
Num
ber
of g
enes
Observed Expected
10-8 10-6 10-4 10-2 1000
20
40
60
80
100
120
140
160
180
200
P-value
Num
ber
of g
enes
Observed Expected
(a) (b)
0 0.1 0.2 0.3 0.4 0.5 0.6 0.7 0.8 0.9 10
1000
2000
3000
4000
5000
6000
7000
P-value
Num
ber
of g
enes
Observed Expected
10-15 10-10 10-5 1000
100
200
300
400
500
600
700
P-value
Num
ber
of g
enes
Observed Expected
(c) (d)
Figure3: Comparisonof thenumberof significantgenesin actualdatasetsto theexpectednum-ber under the null-hypothesis(randomlabels). The -axis denotesp-value and the @ -axis thenumberof genes. The expectednumberof geneswith score
èÔé#êÏëbetter than a given Î isø N ê�ù - èÔé1êÏë - úÔû ð ü /×Õ ý,/ 64- # of genes/ . Graphs(a) and (b) show resultsfrom the Colon data
set. Graphs(c) and(d) show resultsfrom theLeukemiadataset. Thegraphson the left, (a) and(c), show thewholesignificancerange,andthegraphsontheright, (b) and(d), show thetail of thedistribution(p-valuesarein log-scale).
differentcancers,amongthemlung,breast,oropharyngeal,bladder, endometrial,ovarianandcol-orectalcarcinoma),ferritin H (ovariancancer),collagen1A1 (ovariancancer, osteosarcoma,cer-vical carcinoma),andGAPDH (cancersof lung, cervix andprostate).In addition,2 cloneswithnohomologyto aknown genearefoundin thisselection.Giventhehighnumberof cancerrelatedgenesin the top 137, it is likely that thesenovel genesexhibit a similar cancer-relatedbehavior.We conductedexpressionvalidationfor GAPDH,SLPI,HE4 andkeratin18 which confirmedtheelevatedexpressionin someovariancarcinomascomparedto normalovariantissues.
4.4 Classifying with SelectedSubsets
Whenusinggeneselection,we needto pre-processthe training datato selectgenes.Then,theclassificationprocedureis appliedusingthetrainingdatarestrictedto thesubsetof selectedgenes.Thegeneselectionstageis givena parameter
>, whichdeterminesthelargesterror-scoreallowed.
It thenselectsall genesthathavea smalleror equalerrorscoreon thetrainingdata.Alternatively,
19
a p-valueapproachcanbe taken: all geneswith scoreswhich arevery rare in randomdataareselected.
To evaluateperformancewith geneselection,we have to be careful to jointly evaluatebothstagesof theprocess:geneselectionandclassification.Thus,in eachcross-validationtrial, geneselectionis appliedbasedon the training examplesin that trial. Note, that since the trainingexamplesaredifferentin differentcrossvalidationtrials, we expectthenumberof selectedgenesto dependon thetrial.
Figure4 describestheperformanceof someof themethodswediscussedabovewhenwevarythestringency of theselectionprocess.
In thecolondataset,geneselectionleadsto mixedresults.Somemethods,suchasclustering,performslightly worsewith fewer genes,while others,suchasSVM, performbetterwith smallersetof genes.Ontheotherhand,in theovariandataset,geneselectionleadsto impressiveimprove-mentin all methods.All methodsperformwell in theregionbetweenthreshold3 (avg. 173clones)to 6 (avg. 4375clones).Note thatbothBoostingandSVM performwell evenwith fewer clones.In the leukemiadataset,geneselectionslightly improved the performanceof AdaBoost(whichperformedwell with all thegenes),andsignificantlyimprovedtheperformanceof othermethods(betweenthresholdof 11 to 13
èÔé#êÏëscore).
Figure 5 shows ROC curves for Clusteringapproach,Boosting, and quadraticSVM withthresholdof 3 (linear SVM hassimilar curve to quadraticSVM, andthuswasnot plotted). Aswe cansee,althoughall methodshave roughlythesameaccuracy with this subsetof genes,theirROC profile is strikingly different.Thesecurvesclearlyshow thattheClusteringapproachmakesfalsepositiveerrors,while all theotherapproachesmake falsenegativeerrors.
It is instructive to comparetheTNoM scoresof genesto othermethodsfor selectinggenes.Inparticular, we notethat the AdaBoostprocedureis effectively a geneselectionmethod. In eachiterationtheAdaBoostprocedureselectsastumpclassifierthatexaminestheexpressionvalueof asinglegene.Thus,we canevaluatetheimportanceof a genein theAdaBoostclassificationby theweightassignedto decisionstumpsthatqueriesthevalueof thatgene.Figure6 shows acompari-sonof geneAdaBoostweightsto TNoM scores.As wecansee,thehighestweightgeneshave lowTNoM scores.In theleukemiadatasetwealsoseethatthereis acorrelationbetweengeneweightandtheTNoM score.Notethatin thisdataset,AdaBoostis veryeffectivewithoutadditionalgeneselection.On theotherhand,in thecolondataset,AdaBoost’sperformanceis improvedwhenweremove geneswith high TNoM score.We notethat in generaltheAdaBoostproceduredoesnotuseall of thegeneswith low TNoM score.This suggeststhat thereis a significantoverlapin theinformationthatthesegenesconvey abouttheclassification.
5 SampleContamination
Cancerclassificationbasedon array-basedgeneexpressionprofiling maybe complicatedby thefactthatclinical samples,e.g.tumorvs. normal,will likelycontainamixtureof differentcell types.In addition,thegenomicinstability inherentin tumorsamplesmayleadto alargedegreeof randomfluctuationsin geneexpressionpatterns.Although both the biological andgeneticvariability intumorsampleshave thepotentialto leadto confusinganddifficult to interpretexpressionprofiles,geneexpressionprofiling doesallow us to efficiently distinguishtumor andnormalsamples,as
20

ColonC lustering
N earest Ne ighborB oosting 10 ,000
S VM , linearS VM , quad.
0
10
20
30
40
50
8 [-6 .7] 9 [-5 .9] 10 [-5 .2 ] 11 [-4 .5 ] 12 [-3 .9 ] 13 [-3 .3 ] 14 [-2 .8 ] 15 [-2 .3 ] 16 [-1 .8 ]
Err
ors
+ U
nc
lass
ifie
d (
%)
E rror Score [log p-value ]
Ovarian
0
10
20
30
40
50
1 [-5 .8] 2 [-4 .7] 3 [-3 .8] 4 [-3 .0] 5 [-2 .3] 6 [-1 .7] 7 [-1 .2] 8 [-0 .8]
Err
ors
+ U
nc
lass
ifie
d (
%)
E rror Score [log p-value ]
C lusteringN earest Ne ighbor
B oosting 10 ,000S VM , linearS VM , quad.
Leukemia
$ %%&%'() *+, -''./ . 0123 4
576 6 8969:<;=896 >@? A 8CB@DFE GIH9A JK>ILMNO PQR=M
O ? EFRSNUT VIL P ? EFR=MWT XKL QY? E QWT QIL R=MY? E X9T NCL RSN@? E ZWT XKL R O ? E O T O L R P ? E [\T [�L
]�>CH96 >C^`_U]�>9a B9bCcK896d\8C8C^`_ a eKBfR=MWg MCMCM:Uh�iYgIA a eK>CH96:Uhjikgml9JKHCnWT
$ %%&%'() *+, -''./ . 0123 4
576 6 8969:<;=896 >@? A 8CB@DFE GIH9A JK>ILMNO PQR=M
O ? EFRSNUT VIL P ? EFR=MWT XKL QY? E QWT QIL R=MY? E X9T NCL RSN@? E ZWT XKL R O ? E O T O L R P ? E [\T [�L
]�>CH96 >C^`_U]�>9a B9bCcK896d\8C8C^`_ a eKBfR=MWg MCMCM:Uh�iYgIA a eK>CH96:Uhjikgml9JKHCnWT
Figure4: Classificationperformance,asit dependson thethresholdusedfor selectinggenes.Theo -axisshows theTNoM scorethresholdusedandthebase10 logarithmof theassociatedp-value.TheresultsarebasedonperformingLOOCV for thewholeprocessof selectionandclassification,asexplainedin thetext. For eachmethod,thesolid barrepresentsthefractionof thetrainingdatathatwasmis-classified.Thethin line extensionsrepresentthefractionwhich wasunclassified.
21

0
0.2
0.4
0.6
0.8
1
0 0.2 0.4 0.6 0.8 1
Po
sitiv
e R
ate
Negative R ate
ClusteringBoosting, 10,000
SVM, quad.
Figure5: ROC curvesfor threemethodsthatareappliedto theovariandatasetwith TNoM scorethresholdsetto pwe have seenin the previous sections.However, the presenceof differentcell typeswithin andbetweensamplescould lead to identificationof genesthat stronglyaffect clusterformationbutwhichmayhavelittle to dowith theprocessbeingstudied,in thiscasetumorigenesis.For example,in thecaseof thecoloncancerdatasetpresentedabove,a largenumberof muscle-specificgeneswereidentifiedasbeingcharacteristicof normalcolonsamplesboth in our clusteringresultsandin the resultsof Alon et al. (1999). This is mostlikely dueto a higherdegreeof smoothmusclecontaminationin thenormalversustumorsamples.
This raisestheconcernthatourclassificationmaybebiasedby thepresenceof musclespecificgenes.To testthis hypothesis,we attemptedto constructdatasetsthatavoid genesthat aresus-pectedin introducingbias.Welistedthetop200error-scorerankinggenesin thecoloncancerdataset,andidentifiedmuscle-specificgenes.Theseinclude(J02854)myosinregulatorylight chain2,smoothmuscleisoform (human);(T60155)actin, aortic smoothmuscle(human);and(X12369)tropomyosinalphachain,smoothmuscle(human)thataredesignatedassmoothmuscle-specificby Alon et al.’sanalysis,and(M63391)desmin(human),completecds;(D31885)muscle-specificEST (human);and (X7429) alpha7B integrin (human)which aresuspectedto be expressedinsmoothmusclebasedon literaturesearches.
An additionalform of “contamination”is dueto the high metabolicrateof the tumors. Thisresultsin high expressionvaluesfor ribosomalgenes.Althoughsuchhigh expressionlevelscanbe indicative of tumors,sucha finding doesnot necessarilyprovide novel biological insight intotheprocess,nor doesit providea diagnostictool sinceribosomalactivity is presentin virtually alltissues.Thus,wealsoidentifiedribosomalgenesin thetop200scoringgenes.
Figure7 shows the performanceof the clusteringapproachon threedatasets: the full 2000genedataset,adatasetwithoutmusclespecificgenes,andadatasetwithoutbothmusclespecific
22

0
0.01
0.02
0.03
0.04
0.05
0.06
0.07
0.08
5 10 15 20
Ada
Boo
st w
eigh
t
TNoM Score
0
0.02
0.04
0.06
0.08
0.1
0 5 10 15 20
Ada
Boo
st w
eigh
t
TNoM Score
Colon Leukemia
Figure6: Comparisonof theweightassignedto genesin theAdaBoostclassification(withoutgeneselection)andtheTNoM score.Eachpoint in thescatterplot correspondsto a gene.The o -axisdenotesthe TNoM scoreof the gene,andthe q -axis the weight associatedwith all the decisionstumpsthatquerythegene’sexpressionvaluein theclassifierlearnedby AdaBoost.
andribosomalgenes.As thelearningcurvesshow, theremoval of genesaffectstheresultsonly incasesusingthesmallestsetsof genes.Fromerrorscorethresholdof 10(avg.9.1genes)andhigher,thereis no significantchangein performancefor the procedure.Thus,althoughmusclespecificgenescanbehighly indicative, theclassificationprocedureperformswell evenwithout relyingonthesegenes.
Although themusclecontaminationdid not necessarilyalter theability of this genesetto beusedto classifytumorvs. normalsamplesin this case,it will continueto beimportantto accountfor possibleaffectsof tissuecontaminationon clusteringandclassificationresults.Experimentaldesignsthatincludegeneexpressionprofilesof tissueand/orcell culturesamplesrepresentativeoftypesof tissuecontaminantsknown to beisolatedalongwith differenttypesof tumorsamples(forexampleseePerouet al. (1999)),canbeutilized to helpdistinguishcontaminantgeneexpressionprofilesfrom thoseactuallyassociatedwith specifictypesof tumorcells.
6 Conclusions
In this paperwe examinedthequestionof tissueclassificationbasedon expressiondata.Our con-tribution is four-fold. First, we introduceda new cluster-basedapproachfor classification.Thisapproachbuilds on clusteringalgorithmsthat aresuitablefor geneexpressiondata. Second,weperformedrigorousevaluationof this method,andof known methodsfrom the machinelearn-ing literature. Theseinclude large margin classificationmethods(SVM andAdaBoost)andthenearest-neighbormethod.Third, we highlightedtheissueof samplecontaminationandestimatedthesensitivity of our approachto samplevariability. Dif ferencesin tissuebiopsiescouldtheoret-ically affect the quality of any given classificationmethod. Studyingthis issue,we observed no
23

40
50
60
70
80
90
100
8 9 10 11 12 13 14 15 16
All genesw/o Muscle
w/o Muscle & R ibosomeCo
rre
ct P
red
icti
on
s (
%)
Error Score
Figure7: Curvesshowing thepredictive performanceof clusteringmethodsin theoriginal Alonet al. dataset, and datasetswheremusclespecific,and ribosomalgeneswere removed. Allestimatesare basedon LOOCV evaluation. Theseresultsshow that even without the obviouscontaminations,ourmethodsaresuccessfulin reliablypredictingtissuetype.
significantcontaminatingtissuebiasin thecoloncancerdataset.Finally, we investigatedtheissueof geneselectionin expressiondata.As our resultsfor theovariandatasetshow, a largenumberof clonescanhave a negative impacton predictive performance.We showed that a fairly sim-ple selectionprocedurecanleadto significantimprovementsin predictionaccuracy. In addition,we derivedanefficient dynamicprogrammingmethodfor computingexact p-valuesfor a gene’sTNoM score.
The work reportedhereis closely relatedto two recentpapers. First, Golub et al. (1999)(seealso(Slonimet al. 2000))examineda scoringrule to selectinformativegenesandperformedLOOCV experimentsto testa voting basedclassificationapproach.Althoughtheir scorefor geneselectionandtheir classificationmethodaredifferentthanours,their main conclusionsarequitesimilar in that they get goodclassificationaccuracy with relatively small numberof genes.Ourresultson the samedataset (leukemia) are comparableor better. Theseresultsemphasizetheconclusionthat the two leukemiaphenotypes(ALL andAML) arewell seperatedin expressiondata.
Second,Brown et al. (1999)usesupportvectormachinesin the context of geneexpressiondata. In contrastto our approach,they attemptto classify the genesratherthensamples.Thus,they dealwith thedual classificationproblem. Thecharacteristicsof their classificationproblemarequitedifferent: many examples(i.e., thousandsof genes),andfew attributes(i.e., expressionin differentsamples). We notethatsomeof theapproacheswe usedin this work (e.g.,clusteringbasedclassification)might beapplicableto this dualclassificationproblemaswell.
24

As notedabove, the geneselectionprocesswe explored in this paperis quite simplistic. Inparticular, it was basedon scoringsingle genesfor relevance. Thus, the processmight selectseveral genesthat convey the sameinformation, and might ignore genesthat add independentinformation. We are currently studyingmore direct approachesto the selectionof informativesetsof genes.Identifying setsof genesthat give rise to efficient learnedclassifiersmight revealpreviouslyunknown diseaserelatedgenesandguidefurtherbiologicalresearch.
Acknowledgments
Theauthorsaregratefulto YoramSingerfor helpwith SVM.
References
Alon, U., Barkai,N., Notterman,D., Gish,K., Ybarra,S.,Mack,D. & Levine,A. J.(1999),‘Broadpatternsof geneexpressionrevealedby clusteringanalysisof tumorandnormalcolontissuesprobedby oligonucleotidearrays’,Proc.Nat.Acad.Sci.USA96, 6745–6750.
Ben-Dor,A., Shamir, R. & Yakhini, Z. (1999),‘Clusteringgeneexpressionpatterns’,Journal ofComputationalBiology6, 281–297.
Bishop,C. M. (1995),Neural Networksfor PatternRecognition, OxfordUniversityPress,Oxford,U.K.
Brown, M., Grundy, W., Lin, D., Cristianini,N., Sugnet,C., Furey, T., Jr., M. A. & Haussler, D.(1999),Knowledge-basedanalysisof microarraygeneexpressiondatausingsupportvectormachines,TechnicalReportUCSC-CRL-99-09,U. C. SantaCruz.
Burges,C. J. C. (1998), ‘A tutorial on SupportVectorMachinesfor patternrecognition’,DataMining andKnowledgeDiscovery2, 121–167.
Chu,S., DeRisi, J., Eisen,M., Mullholland, J., Botstein,D., Brown, P. & Herskowitz, I. (1998),‘The transcriptionalprogramof sporulationin buddingyeast’,Science282, 699–705.
Clarke, P. A., George, M., Cunningham,D., Swift, I. & Workman,P. (1999), Analysis of tu-morgeneexpressionfollowing chemotherapeutictreatmentof patientswith bowel cancer, in‘Proc.NatureGeneticsMicroarrayMeeting99’, Scottsdale,Arizona,p. 39.
Cortes,C. & Vapnik,V. (1995),‘Supportvectormachines’,MachineLearning20, 273–297.
DeRisi., J., Iyer, V. & Brown, P. (1997), ‘Exploring the metabolicandgeneticcontrol of geneexpressionon agenomicscale’,Science282, 699–705.
Duda,R. O. & Hart,P. E. (1973),PatternClassificationandSceneAnalysis, JohnWiley & Sons,New York.
Eisen,M., Spellman,P., Brown, P. & Botstein,D. (1998),‘Clusteranalysisanddisplayof genome-wideexpressionpatterns’,Proc.Nat.Acad.Sci.USA95, 14863–14868.
25

Everitt, B. (1993),ClusterAnalysis, third edn,EdwardArnold, London.
Freund,Y. & Schapire,R. E. (1997),‘A decision-theoreticgeneralizationof on-line learningandanapplicationto boosting’,J. ComputerandSystemSciences55, 119–139.
Golub,T., Slonim,D., Tamayo,P., Huard,C.,M. Caasenbeek,J.M., Coller, H., Loh,M., Downing,J., Caligiuri, M., Bloomfield, C. & Lander, E. (1999), ‘Molecular classificationof cancer:classdiscoveryandclasspredictionby geneexpressionmonitoring’,Science286, 531–537.
Iyer, V., Eisen,M., Ross,D., Schuler, G., Moore, T., Lee, J., Trent, J., Staudt,L., Hudson,J.,Boguski,M., Lashkari,D., Shalon,D., Botstein,D. & Brown, P. (1999),‘The transcriptionalprogramin theresponseof humanfibroblaststo serum’,Science283, 83–87.
Khan, J., Simon,R., Bittner, M., Chen,Y., Leighton,S. B., Pohida,T., Smith, P. D., Jiang,Y.,Gooden,G. C., Trent,J.M. & Meltzer, P. S. (1998),‘Geneexpressionprofiling of Alveolarrhabdomyosarcomawith cDNA microarrays’,CancerReasearch .
Kohavi, R. (1995),A studyof cross-validationandbootstrapfor accuracy estimationandmodelse-lection, in ‘Proc.FourteenthInternationalJointConferenceon Artificial Intelligence(IJCAI’95)’, MorganKaufmann,SanFrancisco,Calif., pp.1137–1143.
Lockhart,D. J.,Dong,H., Byrne,M. C.,Follettie,M. T., Gallo,M. V., Chee,M. S.,Mittmann,M.,Want,C.,Kobayashi,M., Horton,H. & Brown,E.L. (1996),‘DNA expressionmonitoringbyhybridizationof highdensityoligonucleotidearrays’,NatureBiotechnology14, 1675–1680.
Mason,L., Bartlett,P. & Baxter, J.(1999),Directoptimizationof marginsimprovesgeneralizationin combinedclassifiers,in ‘Advancesin Neural InformationProcessingSystems11’, MITPress,Cambridge,Mass.
Perou,C.M., Jeffrey, S.S.,v deRijn, M., Rees,C.A., Eisen,M. B., Ross,D. T., Pergamenschikov,A., Williams, C. F., Zhu,S.X., Lee,J.C. F., Lashkari,D., Shalon,D., Brown, P. O. & D, B.(1999),‘Distinctive geneexpressionpatternsin humanmammaryepithelialcellsandbreastcancers’,Proc.Nat.Acad.Sci.USA96, 9212–9217.
Ripley, B. D. (1996),PatternRecognitionandNeural Networks, CambridgeUniversityPress.
Schapire,R. E. (1990),‘The strengthof weaklearnability’,MachineLearning5, 197–227.
Schapire,R. E., Freund,Y., Bartlett,P. & Lee,W. S. (1998),‘Boostingthemargin: A new expla-nationfor theeffectivenessof votingmethods’,Annalsof Statistics26, 1651–1686.
Schiedeck,T., Christoph,S.,Duchrow, M. & Bruch,H. (1998),‘Detectionof hl6-mRNA: new pos-sibilities in serologictumordiagnosisof colorectalcarcinomas’,Zentralbl Chir 123(2), 159–162.
Schummer, M., NG, W., Bumgarner, R., Nelson,P., Schummer, B., Hassell,L., Baldwin., L. R.,Karlan, B. & Hood, L. (1999), ‘Comperative hybridizationof an array of 21,500ovariancDNAs for the discovery of genesoverexpressedin ovariancarcinomas’,Gene238, 375–385.
26
Slonim,D. K., Tamayo,P., Mesirov, J. P., Golub,T. R. & Lander, E. S. (2000),Classpredictionanddiscovery using geneexpressiondata, in ‘Fourth Annual InternationalConferenceonComputationalMolecularBiology’, pp.263–272.
Swets,J. (1988),‘Measuringtheaccuracy of diagnosticsystems’,Science240, 1285–1293.
Vapnik,V. (1999),StatisticalLearningTheory, JohnWiley & Sons,New York.
Wen, X., Furhmann,S., Micheals,G. S., Carr, D. B., Smith, S., Barker, J. L. & Somogyi,R.(1998),‘Large-scaletemporalgeneexpressionmappingof centralnervoussystemdevelop-ment’,Proc.Nat.Acad.Sci.USA95, 334–339.
Xiang, Y., Wang,D., Tanaka,M., Suzuki,M., Kiyokawa, E., Igarashi,H., Naito, Y., Shen,Q. &Sugimura,H. (1997),‘Expressionof high-mobilitygroup-1mRNA in humangastrointestinaladenocarcinomaandcorrespondingnon-cancerousmucosa’,Int J. Cancer74(1), 1–6.
27

A Top ScoringGenes
A.1 Colon Cancer Data SetTNoM Gene Description
7 M63391 Humandesmingene,completecds.8 M26383 Humanmonocyte-derivedneutrophil-activating protein(MONAP) mRNA, completecds.9 R87126 197371MYOSINHEAVY CHAIN, NONMUSCLE(Gallusgallus)9 M76378 Humancysteine-richprotein(CRP)gene,exons5 and6.9 M76378 Humancysteine-richprotein(CRP)gene,exons5 and6.9 M22382 MITOCHONDRIAL MATRIX PROTEIN P1PRECURSOR(HUMAN);.9 J05032 Humanaspartyl-tRNA synthetasealpha-2subunit mRNA, completecds.
10 M76378 Humancysteine-richprotein(CRP)gene,exons5 and6.10 R36977 26045P03001TRANSCRIPTIONFACTOR IIIA ;.10 H40095 175181MACROPHAGE MIGRATION INHIBIT ORY FACTOR (HUMAN);.10 J02854 MYOSIN REGULATORY LIGHT CHAIN 2, SMOOTH MUSCLE ISOFORM (HUMAN);contains element
TAR1 repetitive element;.11 H08393 45395COLLAGENALPHA 2(XI) CHAIN (Homosapiens)11 X12671 Humangenefor heterogeneousnuclearribonucleoprotein(hnRNP)coreproteinA1.11 T96873 121343HYPOTHETICAL PROTEIN IN TRPE)11 X63629 H.sapiensmRNA for p cadherin.11 U25138 HumanMaxiK potassiumchannelbetasubunit mRNA, completecds.11 T71025 84103Human(HUMAN);.11 T92451 118219TROPOMYOSIN,FIBROBLAST AND EPITHELIAL MUSCLE-TYPE(HUMAN);.11 U09564 HumanserinekinasemRNA, completecds.11 R64115 139618ADENOSYLHOMOCYSTEINASE(Homosapiens)12 R42501 29607INOSINE-5’-MONOPHOSPHATE DEHYDROGENASE2 (HUMAN);.12 T86473 114645NUCLEOSIDEDIPHOSPHATE KINASEA (HUMAN);.12 T47377 71035S-100PPROTEIN (HUMAN).12 X14958 HumanhmgI mRNA for high mobility groupproteinY.12 D31885 HumanmRNA (KIAA0069) for ORF(novel proetin),partialcds.12 M36634 Humanvasoactive intestinalpeptide(VIP) mRNA, completecds.12 X86693 H.sapiensmRNA for hevin like protein.12 T60778 76539MATRIX GLA-PROTEIN PRECURSOR(Rattusnorvegicus)12 U29092 Humanubiquitin conjugatingenzymemRNA, completecds.12 X54942 H.sapiensckshs2mRNA for Cks1proteinhomologue.12 T60155 81422ACTIN, AORTIC SMOOTH MUSCLE(HUMAN);.12 M36981 Humanputative NDPkinase(nm23-H2S)mRNA, completecds.12 T79152 11354560SRIBOSOMAL PROTEIN L19 (HUMAN);.13 X53586 HumanmRNA for integrin alpha6.13 H43887 183264COMPLEMENTFACTOR D PRECURSOR(Homosapiens)13 X56597 HumanhumFibmRNA for fibrillarin.13 H77597 214162H.sapiensmRNA for metallothionein(HUMAN);.13 M26697 Humannucleolarprotein(B23)mRNA, completecds.13 X70326 H.sapiensMacMarcksmRNA.13 R08183 127228Q0498410KD HEAT SHOCKPROTEIN, MITOCHONDRIAL ;.13 R52081 40295TRANSCRIPTIONAL ACTIVATORGCN5(Saccharomycescerevisiae)13 T95018 12003240SRIBOSOMAL PROTEIN S18(Homosapiens)13 X12466 HumanmRNA for snRNPE protein.13 Z49269 H.sapiensgenefor chemokineHCC-1.13 X62048 H.sapiensWee1hugene.13 T61609 78081LAMININ RECEPTOR(HUMAN);.13 T67077 66563SODIUM/POTASSIUM-TRANSPORTING ATPASEGAMMA CHAIN (Ovisaries)13 U19969 Humantwo-handedzincfingerproteinZEB mRNA, partialcds.13 X15183 HumanmRNA for 90-kDaheat-shockprotein.13 T57633 7546740SRIBOSOMAL PROTEIN S8(HUMAN).13 M91463 Humanglucosetransporter(GLUT4) gene,completecds.13 D29808 HumanmRNA for T-cell acutelymphoblasticleukemiaassociatedantigen1 (TALLA-1), completecds.13 T51023 75127HEAT SHOCKPROTEIN HSP90-BETA (HUMAN).13 H87135 252431IMMEDIATE-EARLY PROTEIN IE180(Pseudorabiesvirus)13 T83368 116679MEMBRANE COFACTOR PROTEIN PRECURSOR(Homosapiens)13 T51529 72384ELONGATION FACTOR 1-DELTA (Artemiasalina)
28

TNoM Gene Description14 U30825 HumansplicingfactorSRp30cmRNA, completecds.14 Z50753 H.sapiensmRNA for GCAP-II/uroguanylin precursor.14 U32519 HumanGAP SH3bindingproteinmRNA, completecds.14 R84411 194660SMALL NUCLEAR RIBONUCLEOPROTEIN ASSOCIATED PROTEINS B AND B’ (HUMAN);.14 H40560 175410THIOREDOXIN (HUMAN);.14 T62947 7936660SRIBOSOMAL PROTEIN L24 (Arabidopsisthaliana)14 T51571 72250P24480CALGIZZARIN.14 X55715 HumanHums3mRNA for 40Sribosomalproteins3.14 T52185 71940P1707440SRIBOSOMAL PROTEIN.14 D63874 HumanmRNA for HMG-1.14 Z49269 H.sapiensgenefor chemokineHCC-1.14 U17899 HumanchloridechannelregulatoryproteinmRNA, completecds.14 L41559 Homosapienspterin-4a-carbinolaminedehydratase(PCBD)mRNA, completecds.14 H64489 238846LEUKOCYTEANTIGEN CD37(Homosapiens)14 L08069 Humanheatshockprotein,E. coli DnaJhomologuemRNA, completecds.14 H89087 253224SPLICINGFACTORSC35(Homosapiens)14 R75843 143567TRANSLATIONAL INITIATION FACTOR 2 GAMMA SUBUNIT (Homosapiens)14 T40454 60221ANTIGENIC SURFACE DETERMINANT PROTEIN OA3 PRECURSOR(Homosapiens)14 H06524 44386GELSOLINPRECURSOR,PLASMA (HUMAN);.14 T57630 75459S34195RIBOSOMAL PROTEIN L3 -.14 D00596 Humanthymidylatesyntase(EC 2.1.1.45)gene,completecds.14 U26312 HumanheterochromatinproteinHP1Hs-gammamRNA, partialcds.14 L05144 PHOSPHOENOLPYRUVATE CARBOXYKIN ASE, CYTOSOLIC (HUMAN);contains Alu repetitive ele-
ment;containselementPTR5repetitive element;.14 M80815 H.sapiensa-L-fucosidasegene,exon 7 and8, andcompletecds.14 X74295 H.sapiensmRNA for alpha7B integrin.14 T86749 114310Human(clonePSK-J3)cyclin-dependentproteinkinasemRNA, completecds.,.14 M64110 HumancaldesmonmRNA, completecds.14 X70944 H.sapiensmRNA for PTB-associatedsplicingfactor.14 X74262 H.sapiensRbAp48mRNA encodingretinoblastomabindingprotein.14 R78934 146232ENDOTHELIAL ACTIN-BINDING PROTEIN (Homosapiens)14 H11719 47679MONOCYTE DIFFERENTIATION ANTIGEN CD14PRECURSOR(HUMAN);.14 H55916 204131PEPTIDYL-PROLYL CIS-TRANSISOMERASE,MITOCHONDRIAL PRECURSOR(HUMAN);.14 D42047 HumanmRNA (KIAA0089) for ORF(mouseglycerophosphatedehydrogenase-related),partialcds.14 L25941 Homosapiensintegral nuclearenvelopeinnermembraneprotein(LBR) gene,completecds.14 H20819 5144226SPROTEASEREGULATORY SUBUNIT 6 (Homosapiens)14 X12496 HumanmRNA for erythrocyte membranesialoglycoproteinbeta(glycophorinC).14 X13482 U2 SMALL NUCLEAR RIBONUCLEOPROTEIN A’ (HUMAN);containsMER22repetitive element;.
29

A.2 Leukemia Data SetTNoM Gene Description
3 M23197 CD33CD33antigen(differentiationantigen)3 X95735 Zyxin3 M27891 CST3CystatinC (amyloidangiopathyandcerebralhemorrhage)4 U46499 GLUTATHIONE S-TRANSFERASE,MICROSOMAL4 D88422 CYSTATIN A4 M84526 DF D componentof complement(adipsin)4 M31523 TCF3Transcriptionfactor3 (E2A immunoglobulin enhancerbindingfactorsE12/E47)5 L09209 APLP2Amyloid beta(A4) precursor-like protein25 M11722 TerminaltransferasemRNA5 M83652 PFCProperdinP factor, complement6 M92287 CCND3Cyclin D36 X62320 GRN Granulin7 X62654 ME491geneextractedfrom H.sapiensgenefor Me491/CD63antigen7 J05243 SPTAN1 Spectrin,alpha,non-erythrocytic 1 (alpha-fodrin)7 M96326 Azurocidingene8 X59417 PROTEASOMEIOTA CHAIN8 M31211 MYL1 Myosin light chain(alkali)8 M63138 CTSDCathepsinD (lysosomalaspartylprotease)8 M55150 FAH Fumarylacetoacetate8 X52056 SPI1Spleenfocusformingvirus (SFFV)proviral integrationoncogenespi19 X61587 ARHG Rashomologgenefamily, memberG (rho G)9 X17042 PRG1Proteoglycan1, secretorygranule9 M19507 MPO Myeloperoxidase9 U50136 LeukotrieneC4synthase(LTC4S)gene9 M63379 CLU Clusterin(complementlysis inhibitor; testosterone-repressedprostatemessage2; apolipoproteinJ)9 M16038 LYN V-yes-1Yamaguchisarcomaviral relatedoncogenehomolog9 Z15115 TOP2BTopoisomerase(DNA) II beta(180kD)9 M22960 PPGBProtective proteinfor beta-galactosidase(galactosialidosis)9 HG1612-HT1612 Macmarcks9 M31303 Oncoprotein18 (Op18)gene9 M83667 NF-IL6-betaproteinmRNA9 HG3494-HT3688 NuclearFactorNf-Il6
10 D88270 GB DEF= (lambda)DNA for immunoglobinlight chain10 U05259 MB-1 gene10 D14664 KIAA0022 gene10 M93056 LEUKOCYTEELASTASEINHIBIT OR10 X90858 Uridine phosphorylase10 X85116 Epb72geneexon 110 X16546 RNS2Ribonuclease2 (eosinophil-derived neurotoxin;EDN)10 M11147 FTL Ferritin, light polypeptide10 M14636 PYGL GlycogenphosphorylaseL (liver form)10 M62762 ATP6CVacuolarH+ ATPaseprotonchannelsubunit10 U05572 MANB Mannosidasealpha-B(lysosomal)10 X64072 SELL Leukocyte adhesionproteinbetasubunit10 M19508 MPO from Humanmyeloperoxidasegene,exons1-4./ntype=DNA /annot=exon10 X14008 Lysozymegene(EC3.2.1.17)10 X17648 GRANULOCYTE-MACROPHAGE COLONY-STIMULATING FACTOR RECEPTOR ALPHA CHAIN
PRECURSOR10 U22376 C-mybgeneextractedfrom Human(c-myb)gene,completeprimarycds,andfive completealternatively spliced
cds10 M32304 TIMP2 Tissueinhibitor of metalloproteinase210 X70297 CHRNA7 Cholinergic receptor, nicotinic,alphapolypeptide710 M63838 Interferon-gammainducedprotein(IFI 16)gene10 M33195 Fc-epsilon-receptorgamma-chainmRNA10 S82470 BB1
30

TNoM Gene Description11 Z49194 OBF-1mRNA for octamerbindingfactor111 L47738 InducibleproteinmRNA11 X07743 PLECKSTRIN11 M29696 IL7R Interleukin7 receptor11 L21954 PERIPHERAL-TYPEBENZODIAZEPINERECEPTOR11 M31166 PTX3 Pentaxin-relatedgene,rapidly inducedby IL-1 beta11 X98411 GB DEF= Myosin-IE11 X97267 LPAP gene11 Y07604 Nucleoside-diphosphatekinase11 J02783 P4HB Procollagen-proline,2-oxoglutarate4-dioxygenase(proline 4-hydroxylase),beta polypeptide(protein
disulfideisomerase;thyroid hormonebindingproteinp55)11 Z29067 Nek3mRNA for proteinkinase11 L09717 LAMP2 Lysosome-associatedmembraneprotein2 alternative products11 U02020 Pre-Bcell enhancingfactor(PBEF)mRNA11 X76648 GLRX Glutaredoxin(thioltransferase)11 L42379 Quiescin(Q6)mRNA, partialcds11 M13792 ADA Adenosinedeaminase11 U16954 (AF1q) mRNA11 X06182 KIT V-kit Hardy-Zuckerman4 felinesarcomaviral oncogenehomolog11 M81695 ITGAX Integrin, alphaX (antigenCD11C(p150),alphapolypeptide)11 U70063 Acid ceramidasemRNA11 J04990 CATHEPSING PRECURSOR11 M23178 MACROPHAGE INFLAMMA TORY PROTEIN 1-ALPHA PRECURSOR11 M98399 CD36CD36antigen(collagentypeI receptor, thrombospondinreceptor)12 M89957 IGB Immunoglobulin-associatedbeta(B29)12 M29474 Recombinationactivatingprotein(RAG-1) gene12 HG2788-HT2896 Calcyclin12 M92357 B94 PROTEIN12 M19045 LYZ Lysozyme12 S50223 HKR-T112 X66401 LMP2 geneextractedfrom H.sapiensgenesTAP1,TAP2,LMP2, LMP7 andDOB12 U49020 MEF2A gene(myocyte-specificenhancerfactor2A, C9 form) extractedfrom Humanmyocyte-specificenhancer
factor2A (MEF2A) gene,first coding12 D10495 PRKCDProteinkinaseC, delta12 U60644 HU-K4 mRNA12 M28130 Interleukin8 (IL8) gene12 Y00787 INTERLEUKIN-8 PRECURSOR12 L06797 PROBABLE G PROTEIN-COUPLEDRECEPTORLCR1HOMOLOG12 D49950 Liver mRNA for interferon-gammainducingfactor(IGIF)12 U41813 HOXA9 HomeoboxA912 U97105 Dihydropyrimidinaserelatedprotein-212 X63469 GTF2E2GeneraltranscriptionfactorTFIIE betasubunit, 34kD12 X74262 RETINOBLASTOMA BINDING PROTEIN P4812 L11672 ZNF91Zinc fingerprotein91 (HPF7,HTF10)12 HG4321-HT4591 Ahnak-RelatedSequence12 U40369 Spermidine/spermineN1-acetyltransferase(SSAT) gene12 M13452 LMNA LaminA12 X58431 HOX 2.2geneextractedfrom HumanHox2.2genefor ahomeoboxprotein12 AB002559 Hunc18b212 M54995 PPBPConnective tissueactivationpeptideIII12 U00802 DrebrinE13 M84371 CD19gene13 U29175 TranscriptionalactivatorhSNF2b13 K01911 NPY NeuropeptideY13 M28170 CD19CD19antigen13 D26156 TranscriptionalactivatorhSNF2b13 M63959 LRPAP1Low densitylipoprotein-relatedprotein-associatedprotein1 (alpha-2-macroglobulin receptor-associated
protein113 M65214 TCF3Transcriptionfactor3 (E2A immunoglobulin enhancerbindingfactorsE12/E47)13 M80254 PEPTIDYL-PROLYL CIS-TRANSISOMERASE,MITOCHONDRIAL PRECURSOR
31
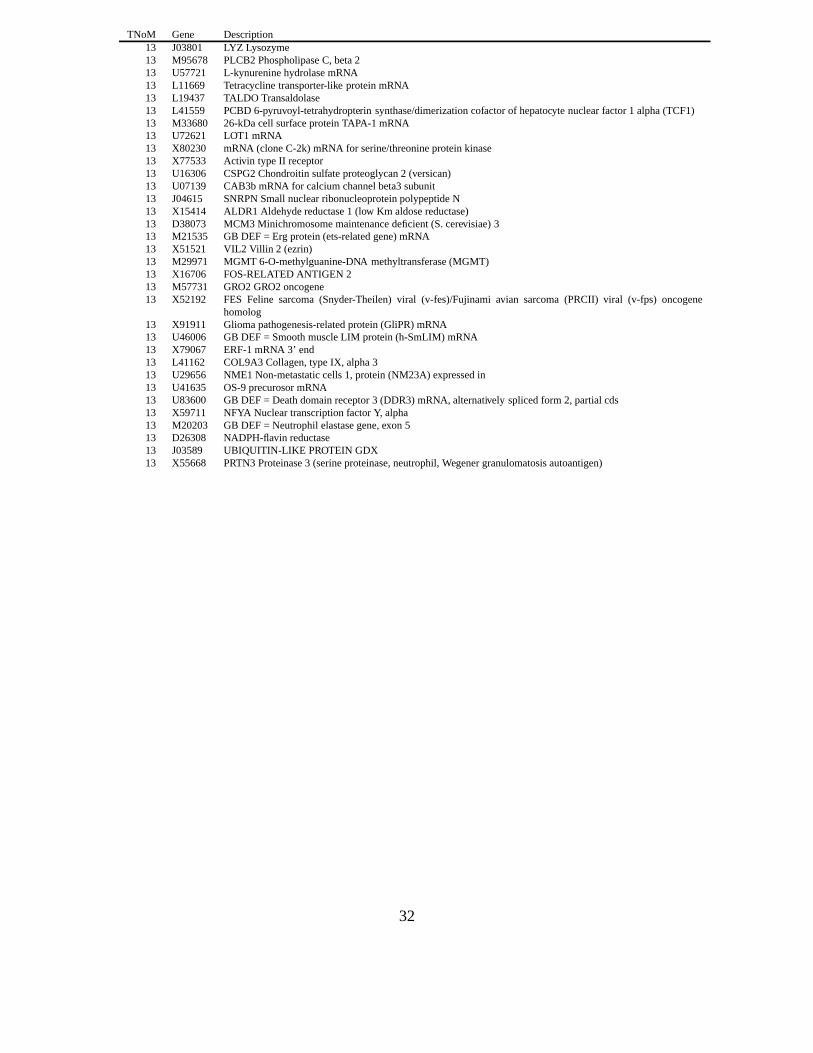
TNoM Gene Description13 J03801 LYZ Lysozyme13 M95678 PLCB2PhospholipaseC, beta213 U57721 L-kynureninehydrolasemRNA13 L11669 Tetracycline transporter-like proteinmRNA13 L19437 TALDO Transaldolase13 L41559 PCBD6-pyruvoyl-tetrahydropterin synthase/dimerizationcofactorof hepatocyte nuclearfactor1 alpha(TCF1)13 M33680 26-kDacell surfaceproteinTAPA-1 mRNA13 U72621 LOT1 mRNA13 X80230 mRNA (cloneC-2k) mRNA for serine/threonineproteinkinase13 X77533 Activin typeII receptor13 U16306 CSPG2Chondroitinsulfateproteoglycan2 (versican)13 U07139 CAB3b mRNA for calciumchannelbeta3subunit13 J04615 SNRPNSmallnuclearribonucleoproteinpolypeptideN13 X15414 ALDR1 Aldehydereductase1 (low Km aldosereductase)13 D38073 MCM3 Minichromosomemaintenancedeficient(S.cerevisiae)313 M21535 GB DEF= Erg protein(ets-relatedgene)mRNA13 X51521 VIL2 Villin 2 (ezrin)13 M29971 MGMT 6-O-methylguanine-DNA methyltransferase(MGMT)13 X16706 FOS-RELATED ANTIGEN 213 M57731 GRO2 GRO2 oncogene13 X52192 FES Feline sarcoma(Snyder-Theilen) viral (v-fes)/Fujinami avian sarcoma(PRCII) viral (v-fps) oncogene
homolog13 X91911 Gliomapathogenesis-relatedprotein(GliPR) mRNA13 U46006 GB DEF= SmoothmuscleLIM protein(h-SmLIM) mRNA13 X79067 ERF-1mRNA 3’ end13 L41162 COL9A3 Collagen,typeIX, alpha313 U29656 NME1 Non-metastaticcells1, protein(NM23A) expressedin13 U41635 OS-9precurosormRNA13 U83600 GB DEF= Deathdomainreceptor3 (DDR3) mRNA, alternatively splicedform 2, partialcds13 X59711 NFYA NucleartranscriptionfactorY, alpha13 M20203 GB DEF= Neutrophilelastasegene,exon 513 D26308 NADPH-flavin reductase13 J03589 UBIQUITIN-LIKE PROTEIN GDX13 X55668 PRTN3 Proteinase3 (serineproteinase,neutrophil,Wegenergranulomatosisautoantigen)
32