title slide no more than 2 lines - sql chick · evolution of power bi v1: power bi for office 365...
TRANSCRIPT

Triad SQL
Server Users
Group
3/29/2016
Melissa CoatesSolution Architect, BlueGranite
blue-granite.com
Blog: sqlchick.com
Twitter: @sqlchick
Power BIArchitecture, Integration Points, Implementation Options

Agenda:
Brief Overview and History of Power BI
Implementation Options & Architecture
Authoring Tools for Business Users
Service Architecture & Delivery Options
Types of Datasets, Data Sources & Refresh
Sharing & Distributing Content
Custom Development Options
Service Limits & Licensing
Bimodal BI: Use Cases for Power BI
Things to Consider Getting Started
Power BIArchitecture, Integration Points, Implementation Options
Overview
&
Evolution of Power BI

Set of tools targeted primarily at analysts & power users to facilitate
acquiring, cleansing, standardizing, modeling, presenting & sharing of data.
Components of Power BI
Power
Query
Power
Pivot
Power View,
Excel PivotTable,
Excel PivotChart
|------------- Power BI Desktop -----------|
|------------------- Excel ------------------|
Reports,
Dashboards,
Sharing,
Q&A
Power BI
Service
Mobile
|-- Web --|Edit
Queries
Data &
Relationships Report
Power BI
Mobile
Apps
|-- Mobile --|
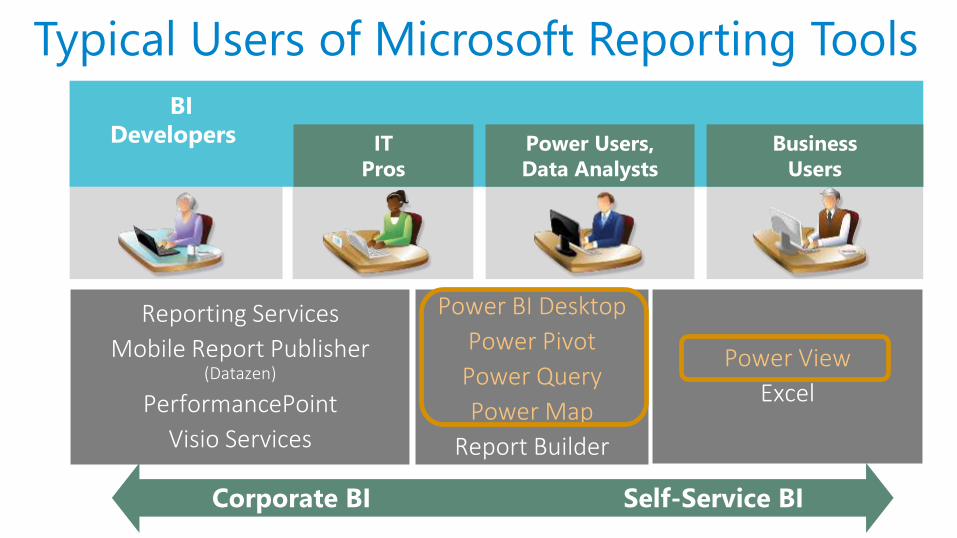
Typical Users of Microsoft Reporting Tools
Reporting Services
Mobile Report Publisher (Datazen)
PerformancePoint
Visio Services
Power BI Desktop
Power Pivot
Power Query
Power Map
Report Builder
Power View
Excel
Corporate BI Self-Service BI

Evolution of Power BI
V1: Power BI for Office 365GA Release Feb 2014
Excel Add-Ins
V2: Power BI DashboardsGA Release July 2015
Excel Add-Ins or Power BI Desktop
Integrated with Office 365 +
SharePoint OnlineIndependent Software as a Service
Data must be replicated in
embedded data model (Power Pivot)
Support for embedded data model
or direct connectivity
Deprecated as of 3/31/2016;
customers required to migrate to V2
Scope: Self-Service BIScope: Self-Service BI +
elements of Corporate BI, Analytics
Toolsets are maturing; very fast
release cycles
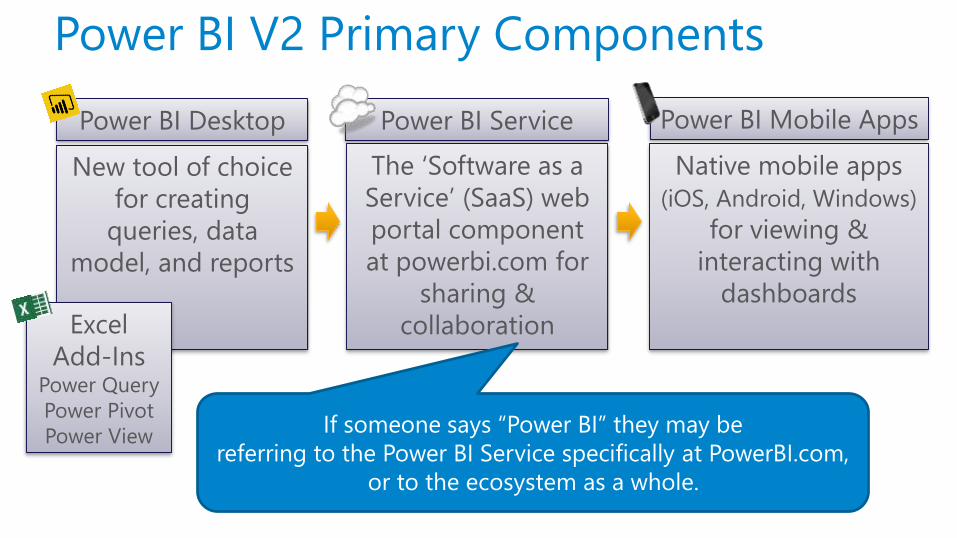
Power BI V2 Primary Components
Power BI Desktop Power BI Service Power BI Mobile Apps
New tool of choice
for creating
queries, data
model, and reports
Native mobile apps
(iOS, Android, Windows)
for viewing &
interacting with
dashboards
The ‘Software as a
Service’ (SaaS) web
portal component
at powerbi.com for
sharing &
collaboration
If someone says “Power BI” they may be
referring to the Power BI Service specifically at PowerBI.com,
or to the ecosystem as a whole.
Excel
Add-InsPower Query
Power Pivot
Power View

Power BI V2 End-to-End

Authoring Tools
for Business Users

Authoring Environments
Power BI Desktop Excel Add-Ins Power BI Service
New tool of choice
for creating queries,
data model, and
reports
Monthly release cycle
for new features
PBIX format
Includes Power Query,
Power Pivot, and
Power View add-ins
Much slower release
cycle of new features
due to deep Excel
integration
XLSX format
The web portal component
for sharing & collaboration
Dashboards and Q&A must
be created in the web;
Reports can optionally be
edited in the web
Weekly release cycle for
new features
Tip: There’s no download ability (PBIX or XLSX) yet from the Power BI Service.
Since a report originally uploaded from PBI Desktop or Excel can be
modified in the web, you need to be careful with where the ‘original’ resides.

Power BI Desktop

Excel Add-Ins

Power BI Service

Authoring & Reuse of Power BI ObjectsA dashboard can
contain elements
from many reports.
A report can
reference data from
one dataset.
A single dataset can
be reused among
various reports.

Deciding Which Tool to Use?
Power BI Desktop Excel Add-Ins
You run an older Excel version
You have 32-bit Excel
You want the newest features as
quickly as possible
You want to access SaaS
connectors & other new sources
Release cycle: new Power BI Desktop
msi installer 1x / month *
You already have an Excel 2013 or 2016
click-to-run version that supports the
‘Power’ add-ins running in 64-bit mode
Your analysts feel strongly about using
Excel & don’t mind waiting for features
You want to use pivot tables, pivot
charts, and cube functions (will require publishing to OneDrive or SPO)
It’s likely you’ll upsize to SSAS Tabular
* Power BI Desktop updates monthly – all users who collaborate must be on same
version. It may be easiest for IT to push updated versions on a schedule.
Service Architecture
&
Delivery Options

Power BI Service Architecture
Image source: https://powerbi.microsoft.com/en-us/documentation/powerbi-admin-power-bi-security/
Info about Enhanced In-Memory Tabular DB: Pg 14-15 Applied Microsoft Power BI by Teo Lachev
1 1
The Power BI Service is
built on Azure.
Web Front End cluster
handles connectivity &
authentication
Back End cluster
manages Power BI
Service activities
User data is uploaded
to Blob storage
Metadata is stored in
SQLDB
Public internet boundary
2
2
Azure
3
3
4
4
5
5
“Enhanced” In-Memory
Tabular DB to service queries

Cloud ServicesOn-Premises
Power BI Delivery Options
Power Pivot for SharePoint
Power BI Service
Third Party Integration
File Share
Public Website
Custom Application
1
Hybrid
2
3
5
6
Native Mode Reporting Services4
7

Power BI Service Standard method of delivery in V2
On-Premises Cloud Services
1

Custom ApplicationAPIs to expose a tile or report for embedding in an application
On-Premises Cloud Services
2

Public WebsiteReport published from Power BI Service to a Public Website
On-Premises Cloud Services
Note: Publish to web can be disabled by the system administrator.
3

Native Mode Reporting Services 2016Storage only for XLSX and PBIX; not fully integrated yet
4
On-Premises

File SharePower BI Desktop and/or Excel without the Power BI Service or Mobile Apps
On-Premises
5

Power Pivot for SharePoint
Not fully supported in SharePoint 2013.
Power Query will be supported in 2016.
6
On-Premises: SharePoint 2013 Architecture
Power Pivot for SharePoint6
On-Premises: SharePoint 2016 Architecture
Diagram coming soon with new
2016 architecture

Third Party IntegrationPower BI Desktop published to 3rd party platform
On-Premises
7

Power BI Delivery

Types of Datasets,
Data Sources,
& Refresh
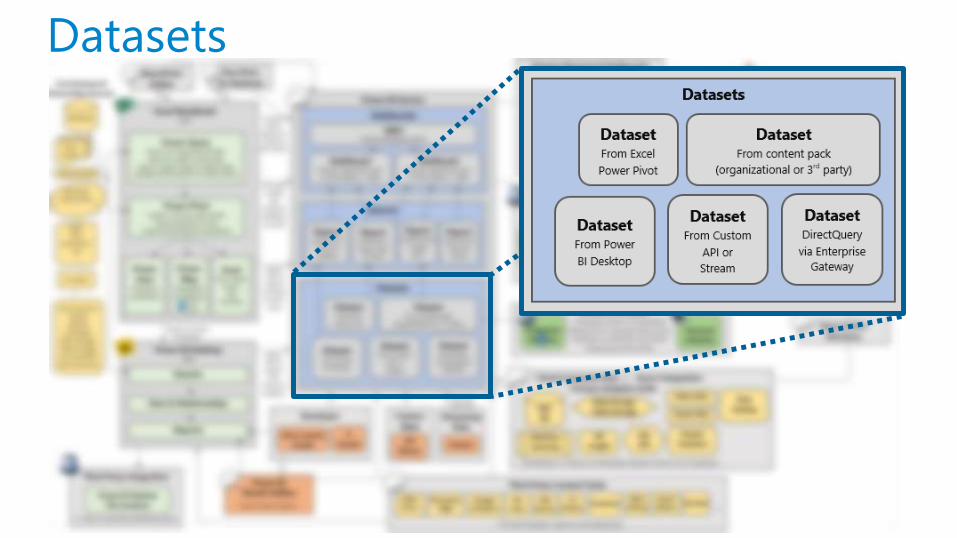
Datasets

Types of DatasetsImported Dataset
An in-memory columnar data structure.
Limited to 250MB compressed in size which
applies to storage limits.
In this situation, the data is *stored* in the
dataset and imported to the Power BI Service.
Requires refresh schedule to stay current.
Imported datasets can be created various ways:
Pull
• Power BI Desktop
• Power Pivot Excel add-in
• SaaS Connector (SaaS Content Pack)
Push
• Streaming data from Azure Stream Analytics
• API library
Direct Query | Live Connection
Queries are live back to original data source.
Useful for:
• Utilizing existing data investments
• Larger datasets that cannot or shouldn’t
be replicated
• When row-level security is required
(via SSAS with EffectiveUserName)
No refresh schedule is required.
In this situation, the dataset in the Power BI
service is a connection string only.
DirectQuery is supported for:
• SQL Server, Oracle, Teradata (with Enterprise GW)
• SAP HANA (with Enterprise GW)
• Azure SQL DB
• Azure SQL DW
• Spark on HDInsight
Live Connection is supported for:
• SSAS Tabular (with Enterprise GW)
• SSAS Multidimensional (with Enterprise GW)
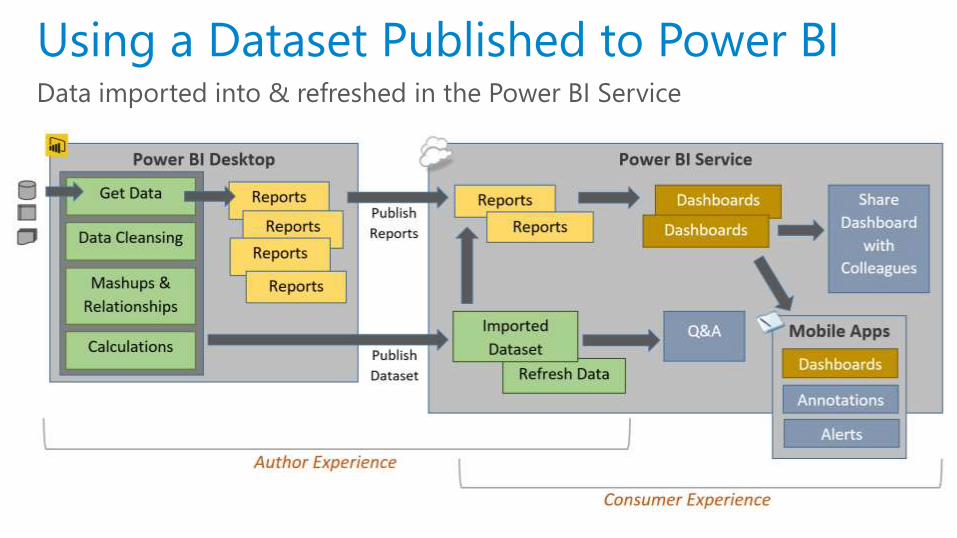
Using a Dataset Published to Power BIData imported into & refreshed in the Power BI Service

Using DirectQuery or Live ConnectionLive queries to source (Tiles are cached in the Power BI Service as images in
order to improve performance)

Data Sources & Refresh
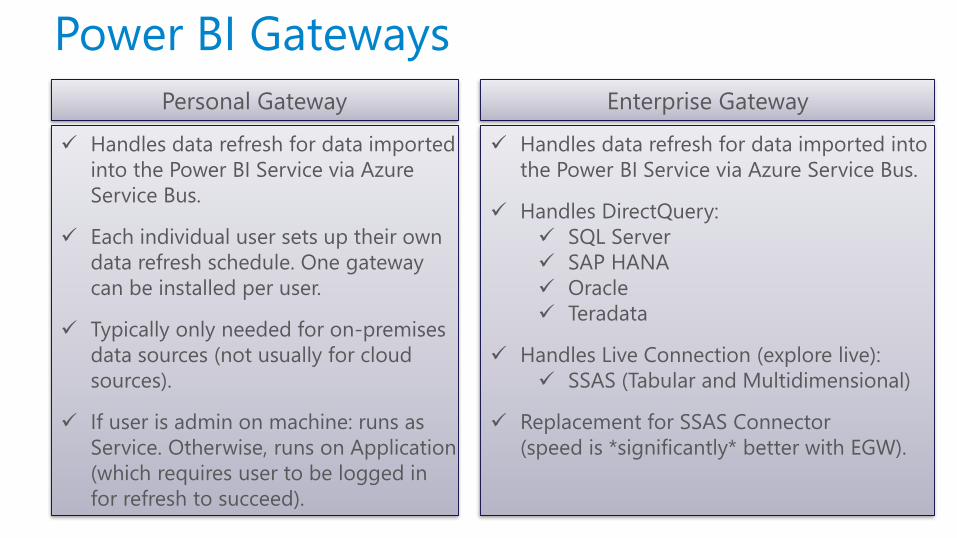
Power BI Gateways
Personal Gateway Enterprise Gateway
Handles data refresh for data imported
into the Power BI Service via Azure
Service Bus.
Each individual user sets up their own
data refresh schedule. One gateway
can be installed per user.
Typically only needed for on-premises
data sources (not usually for cloud
sources).
If user is admin on machine: runs as
Service. Otherwise, runs on Application
(which requires user to be logged in
for refresh to succeed).
Handles data refresh for data imported into
the Power BI Service via Azure Service Bus.
Handles DirectQuery:
SQL Server
SAP HANA
Oracle
Teradata
Handles Live Connection (explore live):
SSAS (Tabular and Multidimensional)
Replacement for SSAS Connector
(speed is *significantly* better with EGW).

Third Party SaaS Content Packs

Sharing &
Distributing Content

Sharing Content
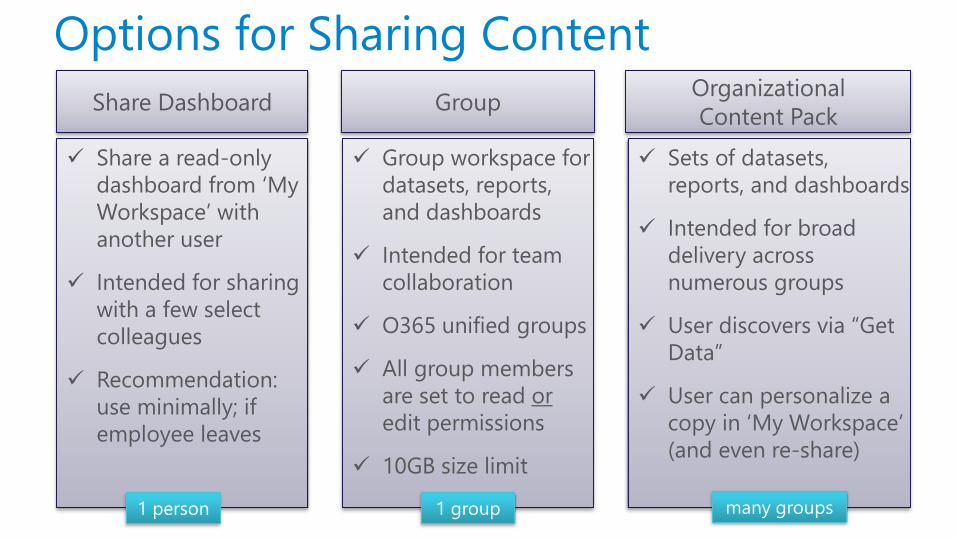
Options for Sharing Content
Share Dashboard GroupOrganizational
Content Pack
Share a read-only
dashboard from ‘My
Workspace’ with
another user
Intended for sharing
with a few select
colleagues
Recommendation:
use minimally; if
employee leaves
Group workspace for
datasets, reports,
and dashboards
Intended for team
collaboration
O365 unified groups
All group members
are set to read or
edit permissions
10GB size limit
Sets of datasets,
reports, and dashboards
Intended for broad
delivery across
numerous groups
User discovers via “Get
Data”
User can personalize a
copy in ‘My Workspace’
(and even re-share)
1 person 1 group many groups

Workspaces, Sharing, and Collaboration

Custom Development Options
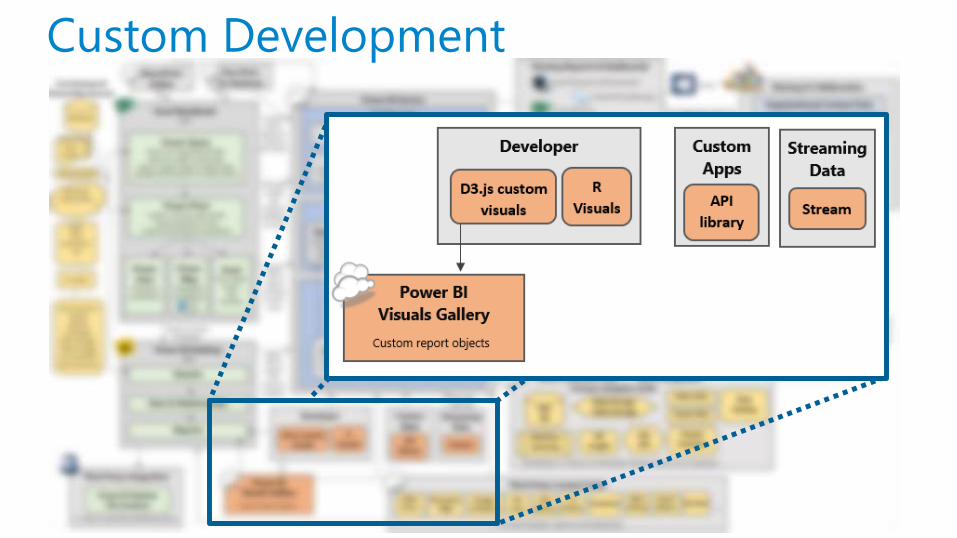
Custom Development

Custom Visuals Power BI Developer Tools for
creation of custom visuals
Public Power BI Visuals Gallery
to download visuals and/or see
source code
Based on D3 (Data-Driven
Documents) JavaScript library
All existing visuals are in a
GitHub open source project

API Library
Power BI is Delivery Vehicle
API pushes data to dataset within the
Power BI Service (data is imported)
Limited to 250MB
Limited to 200 rows if streaming
(uses first-in-first-out method)
Application is Delivery Vehicle
Get reports or dashboard tiles from
Power BI Service
Embed in custom application

Service Limits
&
Licensing

Power BI Service Limits
# of reports per
dataset: 200
(Multi-page reports
still count as 1)
# of
datasets:
200
Size for imported dataset
(non-direct connect):
250MB compressed
# of
dashboards:
100
# of reports:
40,000
Workspace data storage:
1 GB (Free license)
10 GB (Pro license)
API calls:
Single push: 10,000 rows
Continuous push: 500 rows once per second
Max rows per table: 5,000,000 (or 2,000,000 if continuous)
Pending requests: 5
Per user account or group:
Per tenant: Global data storage: 10 GB x # of Pro licenses purchased
Sharing to a group > 500 members is
not supported
**Be sure to verify these as
things change very fast!**

Who Needs a Pro License?Freemium model: Free license & Pro license
Retail pricing of a Power BI Pro license is $9.99 / user / month
Both producers and consumers need a Pro license if any
‘paid’ features are being utilized.
Paid features include:
Data refresh more frequently than daily
Data streams in excess of 10k rows/hour
Data accessed via DirectQuery or Live Connection
Data accessed and refreshed via the Enterprise or Personal Gateway
Storage > 1GB for data models published and refreshed in Power BI Service
Publishing via organizational content packs
Publishing to a group workspace

Power BI V2 End-to-End

Bimodal BI
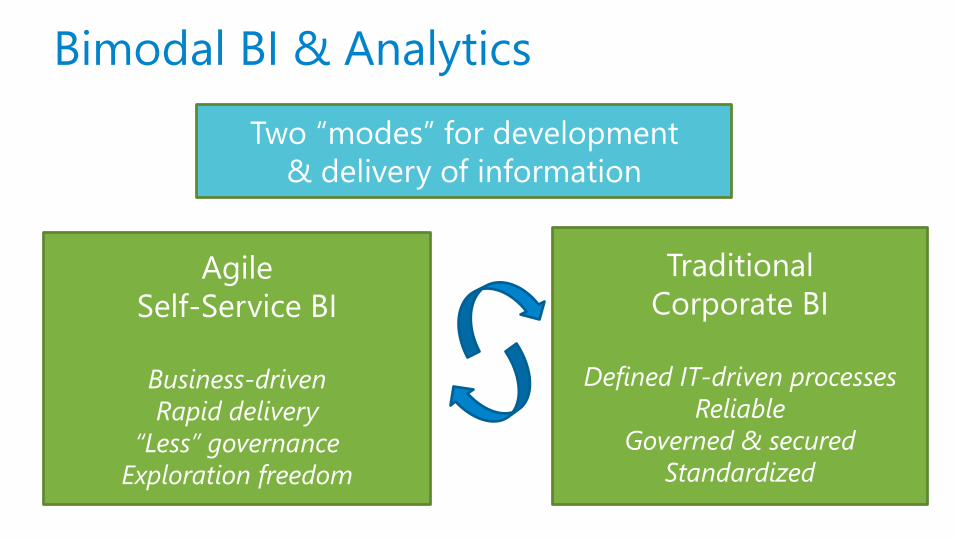
Bimodal BI & Analytics
Traditional
Corporate BI
Defined IT-driven processes
Reliable
Governed & secured
Standardized
Agile
Self-Service BI
Business-driven
Rapid delivery
“Less” governance
Exploration freedom
Two “modes” for development
& delivery of information

Use Cases for Power BI
Power BI used for
data shaping,
modeling, and
reporting(data is imported
into Power BI)
• Small individual self-service projects
• Data mashups (up to 250MB compressed in web)
• One-time or infrequent analysis
• ‘On the fly reporting’ with Q&A
• Standalone SaaS connectors
• APIs to programmatically push data to Power BI
Query Model Report
Power BI used for
reporting only(live queries to original
data source)
• DirectQuery or Live Connection to original data source
• Reports from source w/ higher data volumes
• Reports from source w/ row level security (SSAS)
Report Only

Bimodal BI: Where Power BI Can Fit
Self-Service BI Corporate BI
Upsize
Mashup of
different
data sources
Standalone SaaS
Connectors
(ex: SalesForce,
CRM)
Application
Integration
(APIs)
Machine
LearningStreaming
Data
Warehouse
SSAS Tabular
ModelExcel Data Model
(Power Pivot) Prototype
One-time or
infrequent
analysis
Augment
corporate
BI solutionsPower BI Reporting
Supply info
needed
very quicklyData
LakeAnalytical
DW & Analytics Environment
Typically: Imported Data Typically: Live Connections

Recap +
Questions
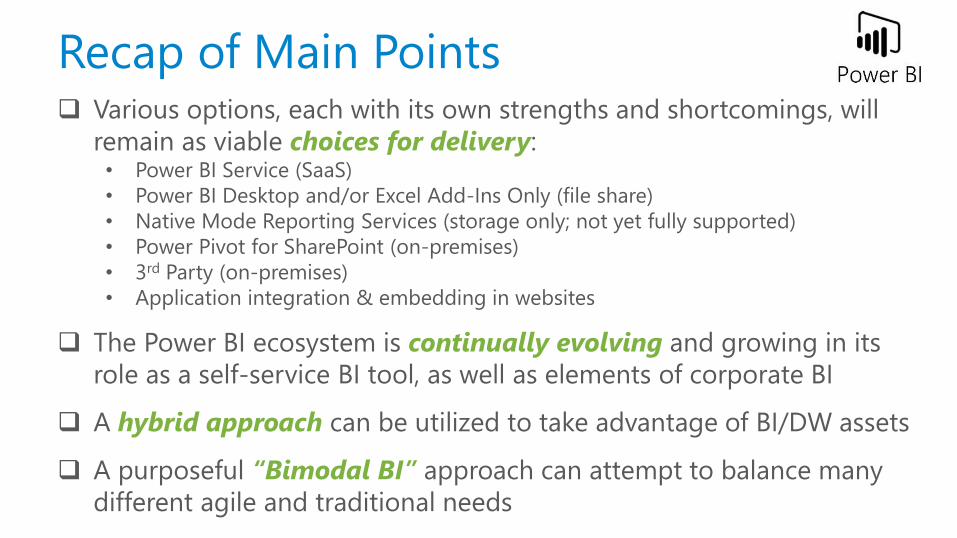
Recap of Main Points Various options, each with its own strengths and shortcomings, will
remain as viable choices for delivery:• Power BI Service (SaaS)
• Power BI Desktop and/or Excel Add-Ins Only (file share)
• Native Mode Reporting Services (storage only; not yet fully supported)
• Power Pivot for SharePoint (on-premises)
• 3rd Party (on-premises)
• Application integration & embedding in websites
The Power BI ecosystem is continually evolving and growing in its
role as a self-service BI tool, as well as elements of corporate BI
A hybrid approach can be utilized to take advantage of BI/DW assets
A purposeful “Bimodal BI” approach can attempt to balance many
different agile and traditional needs

Resources To FollowPower BI Team Blog: http://blogs.msdn.com/b/powerbi/
Weekly Power BI Service Updates
Monthly Power BI Desktop Updates
Power BI Support Blog: http://blogs.technet.com/b/powerbisupport/
Power BI Community Site: http://community.powerbi.com/
Support & Documentation
User Voice (ideas for product team)
File Downloads
GuyInACube YouTube Channel: aka.ms/guyinacube
Short videos from Adam Saxton

Things to Consider Getting Started Decision on using Power BI Desktop, or Excel, or both + training needs
Use of Groups, including integration of O365 unified groups with AD
Organizing content into Groups by subject area and/or user security
boundaries
Securing access to content and row-level security needs which can be met
using Live Connection to SSAS using EffectiveUserName via Enterprise
Gateway
Types of users; who will be consumers vs publishers and is there a process
for verification/approval of data models published
Data source types and usage (imported to Service vs DirectQuery)
Options for distributing, publishing, sharing content (file system, Power BI
Service, application integration, mobile apps)

Melissa Coates
Twitter: @sqlchick
Blog: sqlchick.com
Check “Presentations & Downloads” at sqlchick.com for this slide deck.
Creative Commons License:
Attribution-NonCommercial-NoDerivative Works 3.0
Thanks for Attending!