tivoli management services warehouse and reporting sg247290
TRANSCRIPT

ibm.com/redbooks
Tivoli Management Services Warehouseand Reporting
Vasfi GucerNaeem Altaf
Iris CoJames A. EdwardsChristopher LaytonDenis Vasconcelos
Paul WiggettAlessandro Zonin
Insider’s guide to Tivoli warehousing and reporting
Tuning Tivoli Data Warehouse for best performance
BIRT-based reporting solution included
Front cover


Tivoli Management Services Warehouse and Reporting
January 2007
International Technical Support Organization
SG24-7290-00

© Copyright International Business Machines Corporation 2007. All rights reserved.Note to U.S. Government Users Restricted Rights -- Use, duplication or disclosure restricted by GSA ADPSchedule Contract with IBM Corp.
First Edition (January 2007)
This edition applies to IBM Tivoli Monitoring Version 6.1 Fix Pack 3.
Note: Before using this information and the product it supports, read the information in “Notices” on page xxiii.
Contents
Figures . . . . . . . . . . . . . . . . . . . . . . . . . . . . . . . . . . . . . . . . . . . . . . . . . . . . . . . ix
Tables . . . . . . . . . . . . . . . . . . . . . . . . . . . . . . . . . . . . . . . . . . . . . . . . . . . . . . xvii
Examples. . . . . . . . . . . . . . . . . . . . . . . . . . . . . . . . . . . . . . . . . . . . . . . . . . . . . xix
Notices . . . . . . . . . . . . . . . . . . . . . . . . . . . . . . . . . . . . . . . . . . . . . . . . . . . . . xxiiiTrademarks . . . . . . . . . . . . . . . . . . . . . . . . . . . . . . . . . . . . . . . . . . . . . . . . . . xxiv
Preface . . . . . . . . . . . . . . . . . . . . . . . . . . . . . . . . . . . . . . . . . . . . . . . . . . . . . xxvThe team that wrote this IBM Redbook . . . . . . . . . . . . . . . . . . . . . . . . . . . . . xxvBecome a published author . . . . . . . . . . . . . . . . . . . . . . . . . . . . . . . . . . . . . xxviiiComments welcome. . . . . . . . . . . . . . . . . . . . . . . . . . . . . . . . . . . . . . . . . . . xxviii
Chapter 1. Overview of IBM Tivoli Data Warehouse. . . . . . . . . . . . . . . . . . . 11.1 IBM IT Service Management. . . . . . . . . . . . . . . . . . . . . . . . . . . . . . . . . . . . 21.2 IBM Tivoli Data Warehouse. . . . . . . . . . . . . . . . . . . . . . . . . . . . . . . . . . . . . 4
1.2.1 Tivoli Data Warehouse and CCMDB. . . . . . . . . . . . . . . . . . . . . . . . . . 41.3 Tivoli’s reporting strategy . . . . . . . . . . . . . . . . . . . . . . . . . . . . . . . . . . . . . . 6
1.3.1 Understanding a report . . . . . . . . . . . . . . . . . . . . . . . . . . . . . . . . . . . . 61.4 Differences between Tivoli Data Warehouse V2.1 and 1.x . . . . . . . . . . . . . 9
1.4.1 Implementation differences . . . . . . . . . . . . . . . . . . . . . . . . . . . . . . . . 101.4.2 Usability differences . . . . . . . . . . . . . . . . . . . . . . . . . . . . . . . . . . . . . 111.4.3 Scalability differences . . . . . . . . . . . . . . . . . . . . . . . . . . . . . . . . . . . . 12
1.5 Tivoli products that exploit Tivoli Data Warehouse V2.1 . . . . . . . . . . . . . . 141.5.1 IBM Tivoli Monitoring. . . . . . . . . . . . . . . . . . . . . . . . . . . . . . . . . . . . . 141.5.2 IBM Tivoli Service Level Advisor . . . . . . . . . . . . . . . . . . . . . . . . . . . . 151.5.3 IBM Tivoli Enterprise Console. . . . . . . . . . . . . . . . . . . . . . . . . . . . . . 151.5.4 IBM Tivoli Composite Application Manager . . . . . . . . . . . . . . . . . . . 16
Chapter 2. IBM Tivoli Data Warehouse internals and deployment configurations . . . . . . . . . . . . . . . . . . . . . . . . . . . . . . . . . . . . . . . 19
2.1 Tivoli Data Warehouse Version 2.1: High-level architecture . . . . . . . . . . . 202.1.1 Tivoli Data Warehouse Version 2.1 supported platforms . . . . . . . . . 222.1.2 Recommended hardware considerations for the Tivoli Data Warehouse
components . . . . . . . . . . . . . . . . . . . . . . . . . . . . . . . . . . . . . . . . . . . 242.2 Tivoli Data Warehouse: Deployment scenarios . . . . . . . . . . . . . . . . . . . . 24
2.2.1 Small-to-medium installation (400 agents maximum) . . . . . . . . . . . . 252.2.2 Large installation (4000 agents maximum) . . . . . . . . . . . . . . . . . . . . 27
© Copyright IBM Corp. 2007. All rights reserved. iii

2.2.3 Huge installation (greater than 4000 agents) . . . . . . . . . . . . . . . . . . 312.3 Firewall considerations . . . . . . . . . . . . . . . . . . . . . . . . . . . . . . . . . . . . . . . 332.4 High-availability considerations . . . . . . . . . . . . . . . . . . . . . . . . . . . . . . . . . 42
2.4.1 Tivoli Data Warehouse failure behavior . . . . . . . . . . . . . . . . . . . . . . 432.4.2 Recommendations . . . . . . . . . . . . . . . . . . . . . . . . . . . . . . . . . . . . . . 44
2.5 Historical data collection architecture . . . . . . . . . . . . . . . . . . . . . . . . . . . . 522.5.1 Component flows . . . . . . . . . . . . . . . . . . . . . . . . . . . . . . . . . . . . . . . 542.5.2 Data tables and attributes . . . . . . . . . . . . . . . . . . . . . . . . . . . . . . . . . 572.5.3 Object definitions. . . . . . . . . . . . . . . . . . . . . . . . . . . . . . . . . . . . . . . . 69
2.6 Storage considerations for Tivoli Data Warehouse Version 2.1 . . . . . . . . 712.7 Tivoli Data Warehouse Version 2.1 load projection spreadsheet . . . . . . . 77
2.7.1 How the spreadsheet works . . . . . . . . . . . . . . . . . . . . . . . . . . . . . . . 782.7.2 Details for the agent worksheets. . . . . . . . . . . . . . . . . . . . . . . . . . . . 812.7.3 Detail of the Summary worksheet . . . . . . . . . . . . . . . . . . . . . . . . . . . 88
2.8 Deployment considerations for Tivoli Data Warehouse V1.X clients . . . . 912.9 Tivoli Warehouse Proxy . . . . . . . . . . . . . . . . . . . . . . . . . . . . . . . . . . . . . . 94
2.9.1 Tivoli Warehouse Proxy internals . . . . . . . . . . . . . . . . . . . . . . . . . . . 952.9.2 The Tivoli Warehouse Proxy step by step. . . . . . . . . . . . . . . . . . . . . 992.9.3 Multiple Warehouse Proxies . . . . . . . . . . . . . . . . . . . . . . . . . . . . . . 101
2.10 Tivoli Summarization and Pruning agent. . . . . . . . . . . . . . . . . . . . . . . . 1032.10.1 Tivoli Summarization and Pruning agent internals . . . . . . . . . . . . 1032.10.2 Tivoli Summarization and Pruning agent step by step . . . . . . . . . 1052.10.3 Tivoli Summarization and Pruning agent scheduling . . . . . . . . . . 1062.10.4 Tivoli Summarization and Pruning agent processing and time
considerations. . . . . . . . . . . . . . . . . . . . . . . . . . . . . . . . . . . . . . . . . 1062.10.5 Tivoli Summarization and Pruning agent performance tuning . . . 107
Chapter 3. Warehousing in action . . . . . . . . . . . . . . . . . . . . . . . . . . . . . . . 1093.1 Overview of the lab environment for this book . . . . . . . . . . . . . . . . . . . . 1103.2 Configuring the Tivoli Warehouse Proxy . . . . . . . . . . . . . . . . . . . . . . . . . 111
3.2.1 On a Windows system . . . . . . . . . . . . . . . . . . . . . . . . . . . . . . . . . . 1133.2.2 On a Linux or an AIX system . . . . . . . . . . . . . . . . . . . . . . . . . . . . . 118
3.3 Configuring multiple Warehouse Proxies . . . . . . . . . . . . . . . . . . . . . . . . 1263.4 Configuring the Summarization and Pruning agent. . . . . . . . . . . . . . . . . 128
3.4.1 On a Windows system . . . . . . . . . . . . . . . . . . . . . . . . . . . . . . . . . . 1293.4.2 On a Linux or a UNIX system . . . . . . . . . . . . . . . . . . . . . . . . . . . . . 138
3.5 Configuring historical data collection. . . . . . . . . . . . . . . . . . . . . . . . . . . . 1473.6 Tivoli Enterprise Console and Data Warehouse integration . . . . . . . . . . 151
3.6.1 Prerequisites . . . . . . . . . . . . . . . . . . . . . . . . . . . . . . . . . . . . . . . . . . 1523.6.2 Configuring Tivoli Enterprise Console. . . . . . . . . . . . . . . . . . . . . . . 1543.6.3 Configuring the Tivoli Monitoring for Tivoli Enterprise
Console agent. . . . . . . . . . . . . . . . . . . . . . . . . . . . . . . . . . . . . . . . . 1573.6.4 Collecting the Tivoli Enterprise Console agent historical data . . . . 164
iv Tivoli Management Services Warehouse and Reporting

3.6.5 Tivoli Enterprise Console agent: Historical workspace examples. . 1653.7 Configuring IBM Tivoli Service Level Advisor and Tivoli Data Warehouse
integration. . . . . . . . . . . . . . . . . . . . . . . . . . . . . . . . . . . . . . . . . . . . . . . . 1673.7.1 Configuration steps on all supported systems . . . . . . . . . . . . . . . . 1683.7.2 Examples of IBM Tivoli Service Level Advisor reports using Tivoli Data
Warehouse data . . . . . . . . . . . . . . . . . . . . . . . . . . . . . . . . . . . . . . . 1863.8 IBM Tivoli Composite Application Manager for Response Time Tracking and
Tivoli Data Warehouse integration . . . . . . . . . . . . . . . . . . . . . . . . . . . . . 1883.8.1 IBM Tivoli Composite Application Manager for Response Time Tracking
agent configuration . . . . . . . . . . . . . . . . . . . . . . . . . . . . . . . . . . . . . 1893.8.2 Collecting the IBM Tivoli Composite Application Manager for Response
Time Tracking agent historical data . . . . . . . . . . . . . . . . . . . . . . . . 1983.8.3 IBM Tivoli Composite Application Manager for Response Time Tracking
agent workspace examples . . . . . . . . . . . . . . . . . . . . . . . . . . . . . . 1993.9 IBM Tivoli Composite Application Manager for WebSphere and Tivoli Data
Warehouse integration . . . . . . . . . . . . . . . . . . . . . . . . . . . . . . . . . . . . . . 2013.9.1 IBM Tivoli Composite Application Manager for WebSphere agent
configuration . . . . . . . . . . . . . . . . . . . . . . . . . . . . . . . . . . . . . . . . . . 2033.9.2 Collecting the IBM Tivoli Composite Application Manager for
WebSphere agent historical data . . . . . . . . . . . . . . . . . . . . . . . . . . 2133.9.3 IBM Tivoli Composite Application Manager for WebSphere agent
workspace examples . . . . . . . . . . . . . . . . . . . . . . . . . . . . . . . . . . . 2153.10 Tivoli Composite Application Manager for SOA and Tivoli Data Warehouse
integration. . . . . . . . . . . . . . . . . . . . . . . . . . . . . . . . . . . . . . . . . . . . . . . . 2193.10.1 IBM Tivoli Composite Application Manager for SOA
agent configuration . . . . . . . . . . . . . . . . . . . . . . . . . . . . . . . . . . . . . 2213.10.2 Enabling IBM Tivoli Composite Application Manager for SOA
monitoring agent data collectors. . . . . . . . . . . . . . . . . . . . . . . . . . . 2243.10.3 Collecting the IBM Tivoli Composite Application Manager for SOA
agent historical data . . . . . . . . . . . . . . . . . . . . . . . . . . . . . . . . . . . . 2273.10.4 IBM Tivoli Composite Application Manager for SOA agent workspace
examples . . . . . . . . . . . . . . . . . . . . . . . . . . . . . . . . . . . . . . . . . . . . 229
Chapter 4. IBM Tivoli Data Warehouse tuning . . . . . . . . . . . . . . . . . . . . . 2334.1 Using data marts . . . . . . . . . . . . . . . . . . . . . . . . . . . . . . . . . . . . . . . . . . . 235
4.1.1 Better reporting performance . . . . . . . . . . . . . . . . . . . . . . . . . . . . . 2354.1.2 Data mart scenario . . . . . . . . . . . . . . . . . . . . . . . . . . . . . . . . . . . . . 235
4.2 Manual creation of data tables . . . . . . . . . . . . . . . . . . . . . . . . . . . . . . . . 2414.2.1 Benefits . . . . . . . . . . . . . . . . . . . . . . . . . . . . . . . . . . . . . . . . . . . . . . 2414.2.2 Procedure . . . . . . . . . . . . . . . . . . . . . . . . . . . . . . . . . . . . . . . . . . . . 241
4.3 Batch option . . . . . . . . . . . . . . . . . . . . . . . . . . . . . . . . . . . . . . . . . . . . . . 2434.4 Database tuning . . . . . . . . . . . . . . . . . . . . . . . . . . . . . . . . . . . . . . . . . . . 2434.5 Database parameter tuning. . . . . . . . . . . . . . . . . . . . . . . . . . . . . . . . . . . 244
Contents v

4.5.1 DB2 . . . . . . . . . . . . . . . . . . . . . . . . . . . . . . . . . . . . . . . . . . . . . . . . . 2444.5.2 Oracle . . . . . . . . . . . . . . . . . . . . . . . . . . . . . . . . . . . . . . . . . . . . . . . 2484.5.3 SQL Server . . . . . . . . . . . . . . . . . . . . . . . . . . . . . . . . . . . . . . . . . . . 249
4.6 Physical design considerations . . . . . . . . . . . . . . . . . . . . . . . . . . . . . . . . 2534.6.1 Hardware and operating system usage . . . . . . . . . . . . . . . . . . . . . 2534.6.2 DB2 . . . . . . . . . . . . . . . . . . . . . . . . . . . . . . . . . . . . . . . . . . . . . . . . . 2574.6.3 Oracle . . . . . . . . . . . . . . . . . . . . . . . . . . . . . . . . . . . . . . . . . . . . . . . 2644.6.4 SQL Server . . . . . . . . . . . . . . . . . . . . . . . . . . . . . . . . . . . . . . . . . . . 268
4.7 SQL tuning . . . . . . . . . . . . . . . . . . . . . . . . . . . . . . . . . . . . . . . . . . . . . . . 2774.7.1 Review application SQL for efficiencies . . . . . . . . . . . . . . . . . . . . . 2774.7.2 General SQL review process . . . . . . . . . . . . . . . . . . . . . . . . . . . . . 2774.7.3 General SQL-ANSI tuning tips . . . . . . . . . . . . . . . . . . . . . . . . . . . . 2954.7.4 Database-specific tuning. . . . . . . . . . . . . . . . . . . . . . . . . . . . . . . . . 307
Chapter 5. Integrating data from external or third-party applications into Tivoli Data Warehouse . . . . . . . . . . . . . . . . . . . . . . . . . . . . . . . 315
5.1 The Tivoli Monitoring V6.1 Universal Agent . . . . . . . . . . . . . . . . . . . . . . 3165.1.1 IBM Tivoli Universal Agent architecture . . . . . . . . . . . . . . . . . . . . . 3175.1.2 Data providers: Informing IBM Tivoli Universal Agent how to collect and
monitor . . . . . . . . . . . . . . . . . . . . . . . . . . . . . . . . . . . . . . . . . . . . . . 3185.1.3 Metafiles: Informing Universal Agent what to collect and monitor. . 3215.1.4 Manipulating data with Tivoli Enterprise Portal . . . . . . . . . . . . . . . . 3245.1.5 Use cases for the Universal Agent . . . . . . . . . . . . . . . . . . . . . . . . . 3265.1.6 Universal Agent deployment steps . . . . . . . . . . . . . . . . . . . . . . . . . 326
5.2 Warehousing Data using IBM Tivoli Monitoring 6.1 Universal Agent (script provider) . . . . . . . . . . . . . . . . . . . . . . . . . . . . . . . . . . . . . . . . . . . . . . . . . 327
5.2.1 Configuring the Tivoli Universal Agent . . . . . . . . . . . . . . . . . . . . . . 3275.2.2 Viewing the data in the Tivoli Enterprise Portal. . . . . . . . . . . . . . . . 3295.2.3 Warehousing the Universal Agent data. . . . . . . . . . . . . . . . . . . . . . 3315.2.4 Creating graphical views for historical data. . . . . . . . . . . . . . . . . . . 339
5.3 Warehousing data using IBM Tivoli Monitoring 6.1 Universal Agent (ODBC provider) . . . . . . . . . . . . . . . . . . . . . . . . . . . . . . . . . . . . . . . . . . . . . . . . . 348
5.3.1 Configuring the Tivoli Universal Agent . . . . . . . . . . . . . . . . . . . . . . 3485.3.2 Viewing the data in the Tivoli Enterprise Portal. . . . . . . . . . . . . . . . 370
5.4 Tivoli Storage Manager Universal Agent in the Tivoli Enterprise Portal . 3715.4.1 Warehousing the Universal Agent data. . . . . . . . . . . . . . . . . . . . . . 372
5.5 Viewing data in Tivoli Enterprise Portal Server using an external ODBC data source. . . . . . . . . . . . . . . . . . . . . . . . . . . . . . . . . . . . . . . . . . . . . . . . . . . 379
Chapter 6. OPAL solutions and reporting with BIRT . . . . . . . . . . . . . . . . 3876.1 IBM Tivoli Open Process Automation Library . . . . . . . . . . . . . . . . . . . . . 388
6.1.1 QuickReporter for IBM Tivoli Monitoring (Primeur) . . . . . . . . . . . . . 3886.1.2 Warehouse Designer for IBM Tivoli Monitoring 6.1 (Axibase) . . . . 389
vi Tivoli Management Services Warehouse and Reporting

6.1.3 Warehouse reporting using BIRT . . . . . . . . . . . . . . . . . . . . . . . . . . 3906.2 Case study: Web-publishing with BIRT . . . . . . . . . . . . . . . . . . . . . . . . . . 391
6.2.1 Client scenario and requirements . . . . . . . . . . . . . . . . . . . . . . . . . . 3916.2.2 Our lab environment . . . . . . . . . . . . . . . . . . . . . . . . . . . . . . . . . . . . 3926.2.3 The developed solution . . . . . . . . . . . . . . . . . . . . . . . . . . . . . . . . . . 3926.2.4 Report creation: Detailed CPU usage per host . . . . . . . . . . . . . . . . 3976.2.5 Report creation: Disk usage . . . . . . . . . . . . . . . . . . . . . . . . . . . . . . 4116.2.6 Report creation: DB2 table spaces . . . . . . . . . . . . . . . . . . . . . . . . . 4166.2.7 Report creation: Tivoli Enterprise Console throughput . . . . . . . . . . 4216.2.8 Report creation: Tivoli Storage Manager usage . . . . . . . . . . . . . . . 4226.2.9 Publishing results . . . . . . . . . . . . . . . . . . . . . . . . . . . . . . . . . . . . . . 4246.2.10 How to schedule a report . . . . . . . . . . . . . . . . . . . . . . . . . . . . . . . 425
Chapter 7. Reporting with Crystal Reports. . . . . . . . . . . . . . . . . . . . . . . . 4277.1 Crystal Reports . . . . . . . . . . . . . . . . . . . . . . . . . . . . . . . . . . . . . . . . . . . . 4287.2 The developed solution . . . . . . . . . . . . . . . . . . . . . . . . . . . . . . . . . . . . . . 428
7.2.1 Installing Crystal Reports XI Release 2. . . . . . . . . . . . . . . . . . . . . . 4297.2.2 Creating a database connection . . . . . . . . . . . . . . . . . . . . . . . . . . . 4297.2.3 Creating a data source in the report . . . . . . . . . . . . . . . . . . . . . . . . 4337.2.4 Report creation: CPU Usage by Host . . . . . . . . . . . . . . . . . . . . . . . 4407.2.5 Report creation: Disk Usage . . . . . . . . . . . . . . . . . . . . . . . . . . . . . . 459
Chapter 8. Troubleshooting . . . . . . . . . . . . . . . . . . . . . . . . . . . . . . . . . . . . 4718.1 Warehouse Proxy agent . . . . . . . . . . . . . . . . . . . . . . . . . . . . . . . . . . . . . 472
8.1.1 Environments with multiple Warehouse Proxy agents . . . . . . . . . . 4738.1.2 Problems and solutions. . . . . . . . . . . . . . . . . . . . . . . . . . . . . . . . . . 473
8.2 Summarization and Pruning agent . . . . . . . . . . . . . . . . . . . . . . . . . . . . . 4758.2.1 Problems and solutions. . . . . . . . . . . . . . . . . . . . . . . . . . . . . . . . . . 476
8.3 RDBMS troubleshooting . . . . . . . . . . . . . . . . . . . . . . . . . . . . . . . . . . . . . 4768.3.1 DB2 . . . . . . . . . . . . . . . . . . . . . . . . . . . . . . . . . . . . . . . . . . . . . . . . . 4768.3.2 Oracle . . . . . . . . . . . . . . . . . . . . . . . . . . . . . . . . . . . . . . . . . . . . . . . 4828.3.3 Microsoft SQL Server . . . . . . . . . . . . . . . . . . . . . . . . . . . . . . . . . . . 487
Appendix A. Example mdl file for the Tivoli Storage Manager Universal Agent scenario . . . . . . . . . . . . . . . . . . . . . . . . . . . . . . . . . . . 491
Example mdl file for Tivoli Storage Manager Universal Agent scenario. . . . . 492
Appendix B. Additional material . . . . . . . . . . . . . . . . . . . . . . . . . . . . . . . . 521Locating the Web material . . . . . . . . . . . . . . . . . . . . . . . . . . . . . . . . . . . . . . . 521Using the Web material . . . . . . . . . . . . . . . . . . . . . . . . . . . . . . . . . . . . . . . . . 522
System requirements for downloading the Web material . . . . . . . . . . . . . 522How to use the Web material . . . . . . . . . . . . . . . . . . . . . . . . . . . . . . . . . . 522
Abbreviations and acronyms . . . . . . . . . . . . . . . . . . . . . . . . . . . . . . . . . . . 523
Contents vii

Related publications . . . . . . . . . . . . . . . . . . . . . . . . . . . . . . . . . . . . . . . . . . 525IBM Redbooks . . . . . . . . . . . . . . . . . . . . . . . . . . . . . . . . . . . . . . . . . . . . . . . . 525Publications . . . . . . . . . . . . . . . . . . . . . . . . . . . . . . . . . . . . . . . . . . . . . . . . . . 525Online resources . . . . . . . . . . . . . . . . . . . . . . . . . . . . . . . . . . . . . . . . . . . . . . 526How to get IBM Redbooks . . . . . . . . . . . . . . . . . . . . . . . . . . . . . . . . . . . . . . . 528Help from IBM . . . . . . . . . . . . . . . . . . . . . . . . . . . . . . . . . . . . . . . . . . . . . . . . 528
Index . . . . . . . . . . . . . . . . . . . . . . . . . . . . . . . . . . . . . . . . . . . . . . . . . . . . . . . 529
viii Tivoli Management Services Warehouse and Reporting

Figures
1-1 A comprehensive approach to IBM IT Service Management. . . . . . . . . . 21-2 Tivoli software portfolio . . . . . . . . . . . . . . . . . . . . . . . . . . . . . . . . . . . . . . 31-3 IT Service Management reporting . . . . . . . . . . . . . . . . . . . . . . . . . . . . . . 51-4 Report example . . . . . . . . . . . . . . . . . . . . . . . . . . . . . . . . . . . . . . . . . . . . 71-5 Dashboards examples . . . . . . . . . . . . . . . . . . . . . . . . . . . . . . . . . . . . . . . 81-6 Business intelligence example. . . . . . . . . . . . . . . . . . . . . . . . . . . . . . . . . 92-1 Tivoli Data Warehouse Version 2.1: Basic architecture. . . . . . . . . . . . . 212-2 Basic data flow of Tivoli Data Warehouse architecture . . . . . . . . . . . . . 222-3 Small Tivoli Data Warehouse environment (400 agents maximum) . . . 262-4 Large Tivoli Data Warehouse environment (4000 agents maximum) . . 282-5 Huge Tivoli Data Warehouse environment (greater than 4000 agents). 322-6 Warehouse Proxy agent in less secure zone. . . . . . . . . . . . . . . . . . . . . 402-7 Warehouse Proxy agent in more secure zone. . . . . . . . . . . . . . . . . . . . 412-8 Clusters overview. . . . . . . . . . . . . . . . . . . . . . . . . . . . . . . . . . . . . . . . . . 452-9 Idle standby . . . . . . . . . . . . . . . . . . . . . . . . . . . . . . . . . . . . . . . . . . . . . . 462-10 Mutual takeover . . . . . . . . . . . . . . . . . . . . . . . . . . . . . . . . . . . . . . . . . . . 472-11 Historical data types. . . . . . . . . . . . . . . . . . . . . . . . . . . . . . . . . . . . . . . . 542-12 Historical collection location Tivoli Enterprise Monitoring Agent . . . . . . 562-13 Tivoli Monitoring 6.1 component model (historical collection location Tivoli
Enterprise Monitoring Server) . . . . . . . . . . . . . . . . . . . . . . . . . . . . . . . . 572-14 Example of NT_Memory detail and summarization tables. . . . . . . . . . . 622-15 UNIX Disk table (multiple-instance) example. . . . . . . . . . . . . . . . . . . . . 632-16 Historical data row equations. . . . . . . . . . . . . . . . . . . . . . . . . . . . . . . . . 732-17 Load projection spreadsheet worksheets . . . . . . . . . . . . . . . . . . . . . . . 782-18 Load projection spreadsheet summary page example . . . . . . . . . . . . . 792-19 Load projection spreadsheet bar graph example with unused agent
types . . . . . . . . . . . . . . . . . . . . . . . . . . . . . . . . . . . . . . . . . . . . . . . . . . . 802-20 Load projection spreadsheet bar graph example with only used agents 812-21 UNIX agent worksheet example . . . . . . . . . . . . . . . . . . . . . . . . . . . . . . 822-22 Load projection spreadsheet attribute group calculated values example842-23 Load projection spreadsheet agent summary calculated values exam-
ple . . . . . . . . . . . . . . . . . . . . . . . . . . . . . . . . . . . . . . . . . . . . . . . . . . . . . 862-24 Load projection spreadsheet summary worksheet: Example 1 . . . . . . . 882-25 Load projection spreadsheet summary worksheet: Example 2 . . . . . . . 892-26 Load projection spreadsheet summary calculated values example. . . . 902-27 Tivoli Monitoring V6.1 versus V5.x. . . . . . . . . . . . . . . . . . . . . . . . . . . . . 922-28 Tivoli Data Warehouse: V1.x versus V2.1 . . . . . . . . . . . . . . . . . . . . . . . 932-29 Suggested architecture for existing Tivoli Data Warehouse V1.x and Dis-
© Copyright IBM Corp. 2007. All rights reserved. ix

tributed Monitoring V3.7 clients . . . . . . . . . . . . . . . . . . . . . . . . . . . . . . . 942-30 Components of the Tivoli Warehouse Proxy agent . . . . . . . . . . . . . . . . 952-31 Operation of the Tivoli Warehouse Proxy agent . . . . . . . . . . . . . . . . . . 993-1 Lab environment for this book . . . . . . . . . . . . . . . . . . . . . . . . . . . . . . . 1103-2 Windows informational display. . . . . . . . . . . . . . . . . . . . . . . . . . . . . . . 1133-3 Windows Warehouse Proxy agent: Configuration of communication proto-
col . . . . . . . . . . . . . . . . . . . . . . . . . . . . . . . . . . . . . . . . . . . . . . . . . . . . 1143-4 Windows Warehouse Proxy agent hub Tivoli Enterprise Monitoring Server
and port configuration . . . . . . . . . . . . . . . . . . . . . . . . . . . . . . . . . . . . . 1143-5 Windows Tivoli Monitoring Warehouse ODBC configuration confirmation
message . . . . . . . . . . . . . . . . . . . . . . . . . . . . . . . . . . . . . . . . . . . . . . . 1153-6 Windows database selection for Warehouse Proxy configuration . . . . 1153-7 Windows data source configuration window for the Warehouse Proxy 1173-8 Windows warehouse configuration status message . . . . . . . . . . . . . . 1183-9 Windows Warehouse Proxy database configuration completion . . . . . 1183-10 Linux and AIX monitoring services window . . . . . . . . . . . . . . . . . . . . . 1203-11 Linux and AIX Warehouse Proxy configuration window . . . . . . . . . . . 1213-12 Linux and AIX agent parameters tab . . . . . . . . . . . . . . . . . . . . . . . . . . 1253-13 Configuring Summarization and Pruning agent through monitoring con-
sole . . . . . . . . . . . . . . . . . . . . . . . . . . . . . . . . . . . . . . . . . . . . . . . . . . . 1293-14 Configuring Summarization and Pruning agent connection protocol . . 1293-15 Summarization and Pruning agent configuration confirmation . . . . . . 1303-16 Configuring Summarization and Pruning agent . . . . . . . . . . . . . . . . . . 1313-17 Configuring the data collection and pruning. . . . . . . . . . . . . . . . . . . . . 1333-18 Scheduling the data collection and pruning . . . . . . . . . . . . . . . . . . . . . 1343-19 Defining shift periods and vacation settings. . . . . . . . . . . . . . . . . . . . . 1353-20 Configuring additional parameters . . . . . . . . . . . . . . . . . . . . . . . . . . . . 1363-21 Saving the Summarization and Pruning agent configuration . . . . . . . . 1373-22 Configuring Summarization and Pruning agent through monitoring con-
sole . . . . . . . . . . . . . . . . . . . . . . . . . . . . . . . . . . . . . . . . . . . . . . . . . . . 1383-23 Summarization and Pruning agent connection protocol . . . . . . . . . . . 1393-24 Configuring Summarization and Pruning agent . . . . . . . . . . . . . . . . . . 1413-25 Configuring the data collection and pruning. . . . . . . . . . . . . . . . . . . . . 1423-26 Scheduling the data collection and pruning on a Linux or AIX system 1433-27 Defining shift periods and vacation settings. . . . . . . . . . . . . . . . . . . . . 1453-28 Configuring additional parameters on a Linux or UNIX system . . . . . . 1463-29 TEP client historical collection icon . . . . . . . . . . . . . . . . . . . . . . . . . . . 1473-30 History collection configuration . . . . . . . . . . . . . . . . . . . . . . . . . . . . . . 1483-31 History configuration panel . . . . . . . . . . . . . . . . . . . . . . . . . . . . . . . . . 1493-32 Configuring monitoring agent for Tivoli Enterprise Console. . . . . . . . . 1593-33 Configuring Tivoli agent for Tivoli Enterprise Console connection pro-
tocol . . . . . . . . . . . . . . . . . . . . . . . . . . . . . . . . . . . . . . . . . . . . . . . . . . . 1603-34 Configuring Tivoli agent for Tivoli Enterprise Console: Health log path161
x Tivoli Management Services Warehouse and Reporting

3-35 Configuring Tivoli agent for Tivoli Enterprise Console: Event distribution settings. . . . . . . . . . . . . . . . . . . . . . . . . . . . . . . . . . . . . . . . . . . . . . . . . 162
3-36 Tivoli Enterprise Console Server Agent: Default historical groups . . . 1643-37 Event Activity By Class - Last 24hrs workspace example . . . . . . . . . . 1663-38 Event Throughput - Last 24hrs workspace example . . . . . . . . . . . . . . 1673-39 Tivoli Service Level Advisor integration . . . . . . . . . . . . . . . . . . . . . . . . 1683-40 Example SLA report (SLO results). . . . . . . . . . . . . . . . . . . . . . . . . . . . 1873-41 Example SLA report (SLO chart) . . . . . . . . . . . . . . . . . . . . . . . . . . . . . 1873-42 IBM Tivoli Composite Application Manager for Response Time Tracking
and Tivoli Monitoring V6.1 . . . . . . . . . . . . . . . . . . . . . . . . . . . . . . . . . . 1893-43 Configuring monitoring agent for IBM Tivoli Composite Application Manag-
er for RTT through monitoring console . . . . . . . . . . . . . . . . . . . . . . . . 1923-44 Configuring Tivoli agent for IBM Tivoli Composite Application Manager for
RTT connection protocol . . . . . . . . . . . . . . . . . . . . . . . . . . . . . . . . . . . 1933-45 Configuring IBM Tivoli Composite Application Manager for RTT manage-
ment server identity information. . . . . . . . . . . . . . . . . . . . . . . . . . . . . . 1943-46 Configuring IBM Tivoli Composite Application Manager for RTT agent1953-47 Configuring IBM Tivoli Composite Application Manager for RTT manage-
ment server database information . . . . . . . . . . . . . . . . . . . . . . . . . . . . 1963-48 IBM Tivoli Composite Application Manager for RTT Tracking agent default
historical groups. . . . . . . . . . . . . . . . . . . . . . . . . . . . . . . . . . . . . . . . . . 1993-49 Tivoli Composite Application Manager for RTT: Response Time Tracking
workspace example . . . . . . . . . . . . . . . . . . . . . . . . . . . . . . . . . . . . . . . 2003-50 Tivoli Composite Application Manager for RTT: Response Time Tracking
Reporting Groups workspace example . . . . . . . . . . . . . . . . . . . . . . . . 2013-51 IBM Tivoli Composite Application Manager for WebSphere and IBM Tivoli
Monitoring V6.1 . . . . . . . . . . . . . . . . . . . . . . . . . . . . . . . . . . . . . . . . . . 2023-52 Configuring monitoring agent for IBM Tivoli Composite Application Manag-
er for WebSphere through monitoring console . . . . . . . . . . . . . . . . . . 2063-53 Configuring Tivoli agent for IBM Tivoli Composite Application Manager for
RTT connection protocol . . . . . . . . . . . . . . . . . . . . . . . . . . . . . . . . . . . 2073-54 Configuring IBM Tivoli Composite Application Manager for WebSphere:
Basic information . . . . . . . . . . . . . . . . . . . . . . . . . . . . . . . . . . . . . . . . . 2083-55 Configuring Tivoli Composite Application Manager for WebSphere: Ad-
vanced agent configuration . . . . . . . . . . . . . . . . . . . . . . . . . . . . . . . . . 2093-56 Configuring Tivoli Composite Application Manager for WebSphere ad-
vanced collection information. . . . . . . . . . . . . . . . . . . . . . . . . . . . . . . . 2103-57 Configuring Tivoli Composite Application Manager for WebSphere: Ad-
vanced application server information . . . . . . . . . . . . . . . . . . . . . . . . . 2113-58 IBM Tivoli Composite Application Manager for WebSphere agent default
historical groups. . . . . . . . . . . . . . . . . . . . . . . . . . . . . . . . . . . . . . . . . . 2143-59 Tivoli Composite Application Manager for WebSphere: WebSphere App
Server workspace example . . . . . . . . . . . . . . . . . . . . . . . . . . . . . . . . . 217
Figures xi

3-60 IBM Tivoli Composite Application Manager for WebSphere: Pool Analysis workspace example . . . . . . . . . . . . . . . . . . . . . . . . . . . . . . . . . . . . . . . 218
3-61 IBM Tivoli Composite Application Manager for WebSphere: Thread Pools workspace example . . . . . . . . . . . . . . . . . . . . . . . . . . . . . . . . . . . . . . . 219
3-62 IBM Tivoli Composite Application Manager for SOA structure . . . . . . 2203-63 Configuring monitoring agent for Tivoli Composite Application Manager for
SOA through monitoring console . . . . . . . . . . . . . . . . . . . . . . . . . . . . . 2223-64 Configuring Tivoli agent for Tivoli Composite Application Manager for SOA
connection protocol . . . . . . . . . . . . . . . . . . . . . . . . . . . . . . . . . . . . . . . 2223-65 IBM Tivoli Composite Application Manager for SOA agent directory struc-
ture. . . . . . . . . . . . . . . . . . . . . . . . . . . . . . . . . . . . . . . . . . . . . . . . . . . . 2243-66 Tivoli Composite Application Manager for SOA agent default historical
groups . . . . . . . . . . . . . . . . . . . . . . . . . . . . . . . . . . . . . . . . . . . . . . . . . 2283-67 Tivoli Composite Application Manager for SOA: Services Management
Agent Environment workspace example . . . . . . . . . . . . . . . . . . . . . . . 2303-68 Tivoli Composite Application Manager for SOA: Performance Summary
workspace example . . . . . . . . . . . . . . . . . . . . . . . . . . . . . . . . . . . . . . . 2313-69 Tivoli Composite Application Manager for SOA: Message Summary work-
space example. . . . . . . . . . . . . . . . . . . . . . . . . . . . . . . . . . . . . . . . . . . 2324-1 General SQL review process . . . . . . . . . . . . . . . . . . . . . . . . . . . . . . . . 2784-2 Access plan shown through Visual Explain tool. . . . . . . . . . . . . . . . . . 2804-3 Access plan showing that a tablescan was made . . . . . . . . . . . . . . . . 2934-4 Access plan showing that an index scan was made . . . . . . . . . . . . . . 2945-1 Universal Agent high-level architecture and data flow . . . . . . . . . . . . . 3175-2 Attribute group DPLOG in Tivoli Enterprise Portal . . . . . . . . . . . . . . . . 3255-3 AIX disk Universal Agent in the TEP . . . . . . . . . . . . . . . . . . . . . . . . . . 3295-4 DISKDATA data view in TEP . . . . . . . . . . . . . . . . . . . . . . . . . . . . . . . . 3305-5 TEP Historical Configuration tab . . . . . . . . . . . . . . . . . . . . . . . . . . . . . 3315-6 DISKDATA history collection configuration window. . . . . . . . . . . . . . . 3325-7 DISKDATA collection interval configuration window . . . . . . . . . . . . . . 3335-8 DISKDATA collection location configuration window . . . . . . . . . . . . . . 3345-9 DISKDATA warehouse interval configuration window . . . . . . . . . . . . . 3355-10 DISKDATA configuration window . . . . . . . . . . . . . . . . . . . . . . . . . . . . 3365-11 DISKDATA started status in configuration window . . . . . . . . . . . . . . . 3375-12 TEP DISKDATA date/time icon . . . . . . . . . . . . . . . . . . . . . . . . . . . . . . 3385-13 Customized TEP workspaces example . . . . . . . . . . . . . . . . . . . . . . . . 3395-14 Bar chart selection icon . . . . . . . . . . . . . . . . . . . . . . . . . . . . . . . . . . . . 3405-15 Bar chart attribute selection window . . . . . . . . . . . . . . . . . . . . . . . . . . 3405-16 Bar chart data view . . . . . . . . . . . . . . . . . . . . . . . . . . . . . . . . . . . . . . . 3415-17 Bar chart properties customization window . . . . . . . . . . . . . . . . . . . . . 3425-18 Bar chart style parameters properties window. . . . . . . . . . . . . . . . . . . 3435-19 Stylized bar chart workspace . . . . . . . . . . . . . . . . . . . . . . . . . . . . . . . . 3445-20 Historical time span view configuration window. . . . . . . . . . . . . . . . . . 345
xii Tivoli Management Services Warehouse and Reporting

5-21 Two-day historical data view . . . . . . . . . . . . . . . . . . . . . . . . . . . . . . . . 3465-22 Historical data plot graph view . . . . . . . . . . . . . . . . . . . . . . . . . . . . . . . 3475-23 Viewing the data in TEP. . . . . . . . . . . . . . . . . . . . . . . . . . . . . . . . . . . . 3705-24 TSM00 data view in Tivoli Enterprise Portal . . . . . . . . . . . . . . . . . . . . 3715-25 TEP Historical Configuration tab . . . . . . . . . . . . . . . . . . . . . . . . . . . . . 3725-26 TSM history collection configuration window . . . . . . . . . . . . . . . . . . . . 3735-27 TSM collection interval configuration window . . . . . . . . . . . . . . . . . . . 3745-28 TSM collection location configuration window . . . . . . . . . . . . . . . . . . . 3755-29 TSM warehouse interval configuration window . . . . . . . . . . . . . . . . . . 3765-30 TSM configuration window. . . . . . . . . . . . . . . . . . . . . . . . . . . . . . . . . . 3775-31 Tivoli Storage Manager started status in configuration window. . . . . . 3785-32 Tivoli Enterprise Portal Tivoli Storage Manager date/time icon . . . . . . 3795-33 Creating a query from an ODBC data source . . . . . . . . . . . . . . . . . . . 3805-34 Custom SQL window . . . . . . . . . . . . . . . . . . . . . . . . . . . . . . . . . . . . . . 3815-35 Assigning a custom query to a workspace. . . . . . . . . . . . . . . . . . . . . . 3825-36 Query selection window . . . . . . . . . . . . . . . . . . . . . . . . . . . . . . . . . . . . 3835-37 Custom SQL query workspace view example . . . . . . . . . . . . . . . . . . . 3845-38 Custom data source bar graph view . . . . . . . . . . . . . . . . . . . . . . . . . . 3856-1 Our test environment . . . . . . . . . . . . . . . . . . . . . . . . . . . . . . . . . . . . . . 3926-2 Creating a new project report. . . . . . . . . . . . . . . . . . . . . . . . . . . . . . . . 3976-3 Creating a new data source . . . . . . . . . . . . . . . . . . . . . . . . . . . . . . . . . 3986-4 Defining a new data source . . . . . . . . . . . . . . . . . . . . . . . . . . . . . . . . . 3996-5 Creating a new data set . . . . . . . . . . . . . . . . . . . . . . . . . . . . . . . . . . . . 4006-6 Defining a data set query . . . . . . . . . . . . . . . . . . . . . . . . . . . . . . . . . . . 4016-7 Previewing results . . . . . . . . . . . . . . . . . . . . . . . . . . . . . . . . . . . . . . . . 4026-8 Defining a new parameter . . . . . . . . . . . . . . . . . . . . . . . . . . . . . . . . . . 4036-9 Defining the parameter SystemNamePar . . . . . . . . . . . . . . . . . . . . . . 4046-10 Defining the parameter Timestamp1Par . . . . . . . . . . . . . . . . . . . . . . . 4056-11 Defining the parameter Timestamp2Par . . . . . . . . . . . . . . . . . . . . . . . 4066-12 Defining filtering criteria . . . . . . . . . . . . . . . . . . . . . . . . . . . . . . . . . . . . 4076-13 Parameter dialog box. . . . . . . . . . . . . . . . . . . . . . . . . . . . . . . . . . . . . . 4086-14 Defining a simple table layout . . . . . . . . . . . . . . . . . . . . . . . . . . . . . . . 4096-15 Previewing query result . . . . . . . . . . . . . . . . . . . . . . . . . . . . . . . . . . . . 4096-16 Bar chart representation . . . . . . . . . . . . . . . . . . . . . . . . . . . . . . . . . . . 4106-17 Data set definition . . . . . . . . . . . . . . . . . . . . . . . . . . . . . . . . . . . . . . . . 4116-18 Defining the system name parameter . . . . . . . . . . . . . . . . . . . . . . . . . 4126-19 Defining the system pattern parameter . . . . . . . . . . . . . . . . . . . . . . . . 4136-20 Defining filters . . . . . . . . . . . . . . . . . . . . . . . . . . . . . . . . . . . . . . . . . . . 4146-21 Runtime parameter box . . . . . . . . . . . . . . . . . . . . . . . . . . . . . . . . . . . . 4156-22 Report layout . . . . . . . . . . . . . . . . . . . . . . . . . . . . . . . . . . . . . . . . . . . . 4156-23 Data set definition . . . . . . . . . . . . . . . . . . . . . . . . . . . . . . . . . . . . . . . . 4166-24 Timestamp parameter definition . . . . . . . . . . . . . . . . . . . . . . . . . . . . . 4176-25 Table space parameter definition. . . . . . . . . . . . . . . . . . . . . . . . . . . . . 418
Figures xiii

6-26 Filtering values. . . . . . . . . . . . . . . . . . . . . . . . . . . . . . . . . . . . . . . . . . . 4196-27 Runtime parameter window . . . . . . . . . . . . . . . . . . . . . . . . . . . . . . . . . 4196-28 Report layout . . . . . . . . . . . . . . . . . . . . . . . . . . . . . . . . . . . . . . . . . . . . 4206-29 Data set definition . . . . . . . . . . . . . . . . . . . . . . . . . . . . . . . . . . . . . . . . 4216-30 Tivoli Enterprise Console throughput report . . . . . . . . . . . . . . . . . . . . 4226-31 Data set definition . . . . . . . . . . . . . . . . . . . . . . . . . . . . . . . . . . . . . . . . 4236-32 Filtering value. . . . . . . . . . . . . . . . . . . . . . . . . . . . . . . . . . . . . . . . . . . . 4236-33 Tivoli Storage Manager usage sample layout . . . . . . . . . . . . . . . . . . . 4247-1 Selecting IBM DB2 ODBC Driver . . . . . . . . . . . . . . . . . . . . . . . . . . . . . 4307-2 Creating ODBC connection . . . . . . . . . . . . . . . . . . . . . . . . . . . . . . . . . 4307-3 Data Source tab . . . . . . . . . . . . . . . . . . . . . . . . . . . . . . . . . . . . . . . . . . 4317-4 TCP/IP tab . . . . . . . . . . . . . . . . . . . . . . . . . . . . . . . . . . . . . . . . . . . . . . 4327-5 Successful creation of an ODBC data source . . . . . . . . . . . . . . . . . . . 4337-6 Selecting DB2 Unicode . . . . . . . . . . . . . . . . . . . . . . . . . . . . . . . . . . . . 4347-7 Entering the connection information . . . . . . . . . . . . . . . . . . . . . . . . . . 4357-8 Successful creation of a native DB2 data source named WAREHOUS4367-9 Selecting the DSN that you previously created . . . . . . . . . . . . . . . . . . 4377-10 Entering the connection information . . . . . . . . . . . . . . . . . . . . . . . . . . 4387-11 Successful creation of an ODBC data source named ITM_reporting . 4397-12 Expanding tables and selecting Linux_CPU . . . . . . . . . . . . . . . . . . . . 4407-13 Selecting the fields that you want to display in your report . . . . . . . . . 4417-14 Selecting the grouping and sort order . . . . . . . . . . . . . . . . . . . . . . . . . 4427-15 Selecting the metrics to be summarized and selecting the aggregation
type . . . . . . . . . . . . . . . . . . . . . . . . . . . . . . . . . . . . . . . . . . . . . . . . . . . 4437-16 Group sorting . . . . . . . . . . . . . . . . . . . . . . . . . . . . . . . . . . . . . . . . . . . . 4447-17 Selecting chart options. . . . . . . . . . . . . . . . . . . . . . . . . . . . . . . . . . . . . 4457-18 Record Selection window. . . . . . . . . . . . . . . . . . . . . . . . . . . . . . . . . . . 4467-19 Selecting the template for the report . . . . . . . . . . . . . . . . . . . . . . . . . . 4477-20 Automatically generated report . . . . . . . . . . . . . . . . . . . . . . . . . . . . . . 4487-21 Selecting new SQL Expression Field. . . . . . . . . . . . . . . . . . . . . . . . . . 4497-22 Two SQL Expression Fields created: Timestamp, Timestamp_STR. . 4507-23 Timestamp as a datetime field automatically formatted into system default
format. . . . . . . . . . . . . . . . . . . . . . . . . . . . . . . . . . . . . . . . . . . . . . . . . . 4517-24 Filtering record selection using Select Expert to pick the fields to filter 4527-25 Selecting Timestamp SQL Expression Field . . . . . . . . . . . . . . . . . . . . 4537-26 %Timestamp is in the period LastFullMonth . . . . . . . . . . . . . . . . . . . . 4537-27 Date ranges functions available in Crystal Reports XI . . . . . . . . . . . . . 4547-28 SQL Query of the report. . . . . . . . . . . . . . . . . . . . . . . . . . . . . . . . . . . . 4557-29 Inserting a group in the report . . . . . . . . . . . . . . . . . . . . . . . . . . . . . . . 4557-30 Selecting a field for grouping and the sort order . . . . . . . . . . . . . . . . . 4567-31 Group Header #1 area on the right side of the window . . . . . . . . . . . . 4577-32 Chart Expert showing %Timestamp_STR and metrics . . . . . . . . . . . . 4577-33 Bar chart representation of data . . . . . . . . . . . . . . . . . . . . . . . . . . . . . 458
xiv Tivoli Management Services Warehouse and Reporting

7-34 Selecting table Disk_D for this report. . . . . . . . . . . . . . . . . . . . . . . . . . 4597-35 Selecting the fields to show in the report . . . . . . . . . . . . . . . . . . . . . . . 4607-36 Inserting groups and sorting in ascending order . . . . . . . . . . . . . . . . . 4617-37 Selecting appropriate aggregation for the Summarized Fields . . . . . . 4627-38 Disk Usage report . . . . . . . . . . . . . . . . . . . . . . . . . . . . . . . . . . . . . . . . 4637-39 Successful creation of Writetime and Writetime_STR . . . . . . . . . . . . . 4647-40 Replacing the database field WRITETIME with %Writetime . . . . . . . . 4647-41 Selecting %Writetime and for each day . . . . . . . . . . . . . . . . . . . . . . . . 4657-42 Selecting group layout . . . . . . . . . . . . . . . . . . . . . . . . . . . . . . . . . . . . . 4667-43 Bar chart representation with text details . . . . . . . . . . . . . . . . . . . . . . . 4677-44 Details of the generated report . . . . . . . . . . . . . . . . . . . . . . . . . . . . . . 4687-45 Export dialog box . . . . . . . . . . . . . . . . . . . . . . . . . . . . . . . . . . . . . . . . . 469
Figures xv

xvi Tivoli Management Services Warehouse and Reporting
Tables
2-1 Supported platforms for Tivoli Data Warehouse Version 2.1 database . 222-2 Supported platforms for Tivoli Warehouse Proxy agent . . . . . . . . . . . . 232-3 Supported platforms for Tivoli Summarization and Pruning agent. . . . . 232-4 Default port usage for IBM Tivoli Monitoring . . . . . . . . . . . . . . . . . . . . . 342-5 RAID classifications . . . . . . . . . . . . . . . . . . . . . . . . . . . . . . . . . . . . . . . . 492-6 Summary of RAID performance characteristics. . . . . . . . . . . . . . . . . . . 502-7 Default attribute group examples . . . . . . . . . . . . . . . . . . . . . . . . . . . . . . 582-8 Short-term binary table names. . . . . . . . . . . . . . . . . . . . . . . . . . . . . . . . 592-9 Linux CPU tables example. . . . . . . . . . . . . . . . . . . . . . . . . . . . . . . . . . . 672-10 NT OS agents Network Interface attribute group. . . . . . . . . . . . . . . . . . 722-11 Configured historical attribute groups . . . . . . . . . . . . . . . . . . . . . . . . . . 762-12 Number of rows retained per retention time unit . . . . . . . . . . . . . . . . . 1043-1 Lab environment for this book . . . . . . . . . . . . . . . . . . . . . . . . . . . . . . . 1113-2 The location of the JDBC driver files . . . . . . . . . . . . . . . . . . . . . . . . . . 1193-3 Tivoli Data Warehouse URLs. . . . . . . . . . . . . . . . . . . . . . . . . . . . . . . . 1223-4 JDBC driver names . . . . . . . . . . . . . . . . . . . . . . . . . . . . . . . . . . . . . . . 1234-1 Files required for manual table creation. . . . . . . . . . . . . . . . . . . . . . . . 2414-2 SQL files created . . . . . . . . . . . . . . . . . . . . . . . . . . . . . . . . . . . . . . . . . 2424-3 Affinity mask values for an 8-CPU system. . . . . . . . . . . . . . . . . . . . . . 2504-4 Operators that might be displayed in the access plan graph . . . . . . . . 2824-5 Operator and operands . . . . . . . . . . . . . . . . . . . . . . . . . . . . . . . . . . . . 2995-1 IBM Tivoli Universal Agent data providers . . . . . . . . . . . . . . . . . . . . . . 3185-2 Data source and preferred data providers . . . . . . . . . . . . . . . . . . . . . . 3195-3 Typical ports used by the IBM Tivoli Universal Agent . . . . . . . . . . . . . 3205-4 Metafile control statement . . . . . . . . . . . . . . . . . . . . . . . . . . . . . . . . . . 3216-1 Sample reports. . . . . . . . . . . . . . . . . . . . . . . . . . . . . . . . . . . . . . . . . . . 3937-1 Sample reports. . . . . . . . . . . . . . . . . . . . . . . . . . . . . . . . . . . . . . . . . . . 428
© Copyright IBM Corp. 2007. All rights reserved. xvii

xviii Tivoli Management Services Warehouse and Reporting

Examples
2-1 IBM Tivoli Monitoring algorithm to calculate listening port . . . . . . . . . . . 352-2 Example for KDC_FAMILIES=IP.PIPE COUNT . . . . . . . . . . . . . . . . . . 362-3 docknt ODI file example. . . . . . . . . . . . . . . . . . . . . . . . . . . . . . . . . . . . . 692-4 RAS log . . . . . . . . . . . . . . . . . . . . . . . . . . . . . . . . . . . . . . . . . . . . . . . . 1073-1 Settings questions . . . . . . . . . . . . . . . . . . . . . . . . . . . . . . . . . . . . . . . . 1633-2 Configuration values . . . . . . . . . . . . . . . . . . . . . . . . . . . . . . . . . . . . . . 1633-3 Example of dsutil command usage in the lab environment . . . . . . . . . 1703-4 Example of scmd dfa setTepsConProps command usage . . . . . . . . . 1713-5 scmd dfa listTEPSagents command output . . . . . . . . . . . . . . . . . . . . . 1723-6 scmd register command used in the lab environment . . . . . . . . . . . . . 1783-7 Tivoli Composite Application Manager for RTT configuration options . 1973-8 Tivoli Composite Application Manager for RTT configuration options . 1983-9 IBM Tivoli Composite Application Manager for WebSphere agent configu-
ration options . . . . . . . . . . . . . . . . . . . . . . . . . . . . . . . . . . . . . . . . . . . . 2123-10 IBM Tivoli Composite Application Manager for WebSphere agent configu-
ration options . . . . . . . . . . . . . . . . . . . . . . . . . . . . . . . . . . . . . . . . . . . . 2133-11 Tivoli Composite Application Manager for SOA configuration options. 2233-12 Enabling JAX-RPC handler . . . . . . . . . . . . . . . . . . . . . . . . . . . . . . . . . 2264-1 Creating wrapper . . . . . . . . . . . . . . . . . . . . . . . . . . . . . . . . . . . . . . . . . 2364-2 Creating a server definition . . . . . . . . . . . . . . . . . . . . . . . . . . . . . . . . . 2374-3 Creating user mapping. . . . . . . . . . . . . . . . . . . . . . . . . . . . . . . . . . . . . 2374-4 Creating nicknames . . . . . . . . . . . . . . . . . . . . . . . . . . . . . . . . . . . . . . . 2374-5 Querying the nicknames . . . . . . . . . . . . . . . . . . . . . . . . . . . . . . . . . . . 2384-6 Creating MQTs. . . . . . . . . . . . . . . . . . . . . . . . . . . . . . . . . . . . . . . . . . . 2384-7 Querying a MQT . . . . . . . . . . . . . . . . . . . . . . . . . . . . . . . . . . . . . . . . . 2394-8 Double-checking the creation of the MQT . . . . . . . . . . . . . . . . . . . . . . 2394-9 Create table example. . . . . . . . . . . . . . . . . . . . . . . . . . . . . . . . . . . . . . 2604-10 Create table example. . . . . . . . . . . . . . . . . . . . . . . . . . . . . . . . . . . . . . 2604-11 Refresh option . . . . . . . . . . . . . . . . . . . . . . . . . . . . . . . . . . . . . . . . . . . 2674-12 Refresh option . . . . . . . . . . . . . . . . . . . . . . . . . . . . . . . . . . . . . . . . . . . 2684-13 Setting the database’s truncate log on checkpoint option to false . . . . 2704-14 Create view . . . . . . . . . . . . . . . . . . . . . . . . . . . . . . . . . . . . . . . . . . . . . 2714-15 DBCC CHECKDB . . . . . . . . . . . . . . . . . . . . . . . . . . . . . . . . . . . . . . . . 2724-16 DBCC CHECKDB . . . . . . . . . . . . . . . . . . . . . . . . . . . . . . . . . . . . . . . . 2724-17 Rebuilding indexes in table using DBCC DBREINDEX command. . . . 2724-18 Rebuilding indexes in table using DBCC INDEXDEFRAG command . 2734-19 Rebuilding indexes in a table using the ALTER INDEX command . . . 2734-20 DBCC SQLPERF . . . . . . . . . . . . . . . . . . . . . . . . . . . . . . . . . . . . . . . . . 273
© Copyright IBM Corp. 2007. All rights reserved. xix

4-21 GET SNAPSHOT command . . . . . . . . . . . . . . . . . . . . . . . . . . . . . . . . 2794-22 Access plan extracted from the output generated by db2exfmt tool . . 2804-23 Query used on the XYZ01 report i . . . . . . . . . . . . . . . . . . . . . . . . . . . . 2924-24 Using select * example . . . . . . . . . . . . . . . . . . . . . . . . . . . . . . . . . . . . 2964-25 A more efficient select example . . . . . . . . . . . . . . . . . . . . . . . . . . . . . . 2964-26 Using UNION ALL . . . . . . . . . . . . . . . . . . . . . . . . . . . . . . . . . . . . . . . . 2974-27 Using UNION . . . . . . . . . . . . . . . . . . . . . . . . . . . . . . . . . . . . . . . . . . . . 2974-28 DB2 Query Optimizer changing the SQL . . . . . . . . . . . . . . . . . . . . . . . 2984-29 Not using DISTINCT keyword . . . . . . . . . . . . . . . . . . . . . . . . . . . . . . . 2984-30 Using DISTINCT keyword . . . . . . . . . . . . . . . . . . . . . . . . . . . . . . . . . . 2984-31 Using a NOT EXISTS . . . . . . . . . . . . . . . . . . . . . . . . . . . . . . . . . . . . . 2994-32 Using a NOT IN . . . . . . . . . . . . . . . . . . . . . . . . . . . . . . . . . . . . . . . . . . 3004-33 Using IN . . . . . . . . . . . . . . . . . . . . . . . . . . . . . . . . . . . . . . . . . . . . . . . . 3004-34 Using BETWEEN . . . . . . . . . . . . . . . . . . . . . . . . . . . . . . . . . . . . . . . . . 3004-35 Using scalar function . . . . . . . . . . . . . . . . . . . . . . . . . . . . . . . . . . . . . . 3014-36 Not using scalar function . . . . . . . . . . . . . . . . . . . . . . . . . . . . . . . . . . . 3014-37 DB2 Query Optimizer changing the first SQL . . . . . . . . . . . . . . . . . . . 3014-38 Using the SUBSTRING function . . . . . . . . . . . . . . . . . . . . . . . . . . . . . 3024-39 Using the LIKE condition . . . . . . . . . . . . . . . . . . . . . . . . . . . . . . . . . . . 3024-40 Sorting based on two columns. . . . . . . . . . . . . . . . . . . . . . . . . . . . . . . 3044-41 Sorting based on one column . . . . . . . . . . . . . . . . . . . . . . . . . . . . . . . 3044-42 No sorting. . . . . . . . . . . . . . . . . . . . . . . . . . . . . . . . . . . . . . . . . . . . . . . 3044-43 Select example . . . . . . . . . . . . . . . . . . . . . . . . . . . . . . . . . . . . . . . . . . 3054-44 Select example . . . . . . . . . . . . . . . . . . . . . . . . . . . . . . . . . . . . . . . . . . 3054-45 DB2 Optimizer changed the query. . . . . . . . . . . . . . . . . . . . . . . . . . . . 3054-46 Separate subqueries . . . . . . . . . . . . . . . . . . . . . . . . . . . . . . . . . . . . . . 3064-47 Combined subqueries . . . . . . . . . . . . . . . . . . . . . . . . . . . . . . . . . . . . . 3064-48 Combined subqueries using inline view technique . . . . . . . . . . . . . . . 3064-49 Changing a table space to read only . . . . . . . . . . . . . . . . . . . . . . . . . . 3114-50 SELECT FOR UPDATE. . . . . . . . . . . . . . . . . . . . . . . . . . . . . . . . . . . . 3114-51 Changing a filegroup to read-only . . . . . . . . . . . . . . . . . . . . . . . . . . . . 3134-52 Select example . . . . . . . . . . . . . . . . . . . . . . . . . . . . . . . . . . . . . . . . . . 3145-1 Metafile example . . . . . . . . . . . . . . . . . . . . . . . . . . . . . . . . . . . . . . . . . 3225-2 AIX disk metric .mdl example. . . . . . . . . . . . . . . . . . . . . . . . . . . . . . . . 3275-3 AIX disk metrics query disk.sh script example. . . . . . . . . . . . . . . . . . . 3285-4 Commands used to import .mdl file on UNIX and Linux . . . . . . . . . . . 3285-5 Commands used to import .mdl file on Windows. . . . . . . . . . . . . . . . . 3515-6 Adding a data source example . . . . . . . . . . . . . . . . . . . . . . . . . . . . . . 3796-1 Defining DB2 function TWH_TIMESTAMP_FMT. . . . . . . . . . . . . . . . . 3956-2 Defining DB2 functions FIRST_DAY and LAST_DAY . . . . . . . . . . . . . 3958-1 Network problems: Example 1 . . . . . . . . . . . . . . . . . . . . . . . . . . . . . . . 4778-2 List database directory. . . . . . . . . . . . . . . . . . . . . . . . . . . . . . . . . . . . . 4778-3 List node directory command. . . . . . . . . . . . . . . . . . . . . . . . . . . . . . . . 478
xx Tivoli Management Services Warehouse and Reporting

8-4 Network problems: Example 2 . . . . . . . . . . . . . . . . . . . . . . . . . . . . . . . 4788-5 List node directory command. . . . . . . . . . . . . . . . . . . . . . . . . . . . . . . . 4788-6 Querying problems: Example 1 . . . . . . . . . . . . . . . . . . . . . . . . . . . . . . 4798-7 Querying problems: Example 2 . . . . . . . . . . . . . . . . . . . . . . . . . . . . . . 4798-8 Querying problems: Example 3 . . . . . . . . . . . . . . . . . . . . . . . . . . . . . . 4808-9 Querying problems: Example 4 . . . . . . . . . . . . . . . . . . . . . . . . . . . . . . 4808-10 LIST APPLICATIONS command . . . . . . . . . . . . . . . . . . . . . . . . . . . . . 4808-11 Querying problems: Example 5 . . . . . . . . . . . . . . . . . . . . . . . . . . . . . . 4818-12 Refreshing an MQT table. . . . . . . . . . . . . . . . . . . . . . . . . . . . . . . . . . . 4818-13 Querying problems: Example 6 . . . . . . . . . . . . . . . . . . . . . . . . . . . . . . 4818-14 Error while creating a MQT . . . . . . . . . . . . . . . . . . . . . . . . . . . . . . . . . 4828-15 Querying problems: Example 7 . . . . . . . . . . . . . . . . . . . . . . . . . . . . . . 4828-16 Network problems: Example 1 . . . . . . . . . . . . . . . . . . . . . . . . . . . . . . . 4828-17 Network problems: Example 2 . . . . . . . . . . . . . . . . . . . . . . . . . . . . . . . 4838-18 Network problems: Example 3 . . . . . . . . . . . . . . . . . . . . . . . . . . . . . . . 4838-19 Querying problems: Example 1 . . . . . . . . . . . . . . . . . . . . . . . . . . . . . . 4838-20 Querying problems: Example 2 . . . . . . . . . . . . . . . . . . . . . . . . . . . . . . 4848-21 Querying problems: Example 3 . . . . . . . . . . . . . . . . . . . . . . . . . . . . . . 4858-22 Querying problems: Example 4 . . . . . . . . . . . . . . . . . . . . . . . . . . . . . . 4858-23 Querying problems: Example 5 . . . . . . . . . . . . . . . . . . . . . . . . . . . . . . 4858-24 Querying problems: Example 6 . . . . . . . . . . . . . . . . . . . . . . . . . . . . . . 4868-25 Querying problems: Example 7 . . . . . . . . . . . . . . . . . . . . . . . . . . . . . . 4868-26 Querying problems: Example 8 . . . . . . . . . . . . . . . . . . . . . . . . . . . . . . 4868-27 Querying problems: Example 9 . . . . . . . . . . . . . . . . . . . . . . . . . . . . . . 4868-28 Querying problems: Example 10 . . . . . . . . . . . . . . . . . . . . . . . . . . . . . 4868-29 Querying problems: Example 11 . . . . . . . . . . . . . . . . . . . . . . . . . . . . . 4878-30 Network problems: Example 1 . . . . . . . . . . . . . . . . . . . . . . . . . . . . . . . 4878-31 Network problems: Example 2 . . . . . . . . . . . . . . . . . . . . . . . . . . . . . . . 4878-32 Network problems: Example 3 . . . . . . . . . . . . . . . . . . . . . . . . . . . . . . . 4878-33 Network problems: Example 4 . . . . . . . . . . . . . . . . . . . . . . . . . . . . . . . 4888-34 Querying problems: Example 1 . . . . . . . . . . . . . . . . . . . . . . . . . . . . . . 4888-35 Querying problems: Example 2 . . . . . . . . . . . . . . . . . . . . . . . . . . . . . . 4898-36 Querying problems: Example 3 . . . . . . . . . . . . . . . . . . . . . . . . . . . . . . 4898-37 Querying problems: Example 4 . . . . . . . . . . . . . . . . . . . . . . . . . . . . . . 4898-38 Querying problems: Example 5 . . . . . . . . . . . . . . . . . . . . . . . . . . . . . . 4898-39 Querying problems: Example 6 . . . . . . . . . . . . . . . . . . . . . . . . . . . . . . 490A-1 Example mdl file. . . . . . . . . . . . . . . . . . . . . . . . . . . . . . . . . . . . . . . . . . 492
Examples xxi

xxii Tivoli Management Services Warehouse and Reporting

Notices
This information was developed for products and services offered in the U.S.A.
IBM may not offer the products, services, or features discussed in this document in other countries. Consult your local IBM representative for information on the products and services currently available in your area. Any reference to an IBM product, program, or service is not intended to state or imply that only that IBM product, program, or service may be used. Any functionally equivalent product, program, or service that does not infringe any IBM intellectual property right may be used instead. However, it is the user's responsibility to evaluate and verify the operation of any non-IBM product, program, or service.
IBM may have patents or pending patent applications covering subject matter described in this document. The furnishing of this document does not give you any license to these patents. You can send license inquiries, in writing, to: IBM Director of Licensing, IBM Corporation, North Castle Drive, Armonk, NY 10504-1785 U.S.A.
The following paragraph does not apply to the United Kingdom or any other country where such provisions are inconsistent with local law: INTERNATIONAL BUSINESS MACHINES CORPORATION PROVIDES THIS PUBLICATION "AS IS" WITHOUT WARRANTY OF ANY KIND, EITHER EXPRESS OR IMPLIED, INCLUDING, BUT NOT LIMITED TO, THE IMPLIED WARRANTIES OF NON-INFRINGEMENT, MERCHANTABILITY OR FITNESS FOR A PARTICULAR PURPOSE. Some states do not allow disclaimer of express or implied warranties in certain transactions, therefore, this statement may not apply to you.
This information could include technical inaccuracies or typographical errors. Changes are periodically made to the information herein; these changes will be incorporated in new editions of the publication. IBM may make improvements and/or changes in the product(s) and/or the program(s) described in this publication at any time without notice.
Any references in this information to non-IBM Web sites are provided for convenience only and do not in any manner serve as an endorsement of those Web sites. The materials at those Web sites are not part of the materials for this IBM product and use of those Web sites is at your own risk.
IBM may use or distribute any of the information you supply in any way it believes appropriate without incurring any obligation to you.
Information concerning non-IBM products was obtained from the suppliers of those products, their published announcements or other publicly available sources. IBM has not tested those products and cannot confirm the accuracy of performance, compatibility or any other claims related to non-IBM products. Questions on the capabilities of non-IBM products should be addressed to the suppliers of those products.
This information contains examples of data and reports used in daily business operations. To illustrate them as completely as possible, the examples include the names of individuals, companies, brands, and products. All of these names are fictitious and any similarity to the names and addresses used by an actual business enterprise is entirely coincidental.
COPYRIGHT LICENSE:
This information contains sample application programs in source language, which illustrate programming techniques on various operating platforms. You may copy, modify, and distribute these sample programs in any form without payment to IBM, for the purposes of developing, using, marketing or distributing application programs conforming to the application programming interface for the operating platform for which the sample programs are written. These examples have not been thoroughly tested under all conditions. IBM, therefore, cannot guarantee or imply reliability, serviceability, or function of these programs.
© Copyright IBM Corp. 2007. All rights reserved. xxiii

TrademarksThe following terms are trademarks of the International Business Machines Corporation in the United States, other countries, or both:
AIX®AS/400®CICS®DataPropagator™DB2 Connect™DB2 Universal Database™DB2®Domino®Enterprise Storage Server®eServer™FlashCopy®
HACMP™i5/OS®IBM®IMS™Informix®Lotus Notes®Lotus®Notes®Rational®Redbooks (logo) ™Redbooks™
System Storage™Tivoli Enterprise Console®Tivoli Enterprise™Tivoli Management Environment®Tivoli®TME®WebSphere®z/OS®zSeries®
The following terms are trademarks of other companies:
Oracle, JD Edwards, PeopleSoft, and Siebel are registered trademarks of Oracle Corporation and/or its affiliates.
mySAP, SAP R/3, SAP, and SAP logos are trademarks or registered trademarks of SAP AG in Germany and in several other countries.
ITIL is a registered trademark, and a registered community trademark of the Office of Government Commerce, and is registered in the U.S. Patent and Trademark Office.
EJB, Java, JavaScript, JDBC, JMX, JRE, JVM, J2EE, Solaris, Sun, and all Java-based trademarks are trademarks of Sun Microsystems, Inc. in the United States, other countries, or both.
Active Directory, BizTalk, Microsoft, SharePoint, Windows NT, Windows Server, Windows, and the Windows logo are trademarks of Microsoft Corporation in the United States, other countries, or both.
Intel, Intel logo, Intel Inside logo, and Intel Centrino logo are trademarks or registered trademarks of Intel Corporation or its subsidiaries in the United States, other countries, or both.
UNIX is a registered trademark of The Open Group in the United States and other countries.
Linux is a trademark of Linus Torvalds in the United States, other countries, or both.
Other company, product, or service names may be trademarks or service marks of others.
xxiv Tivoli Management Services Warehouse and Reporting

Preface
As the amount of management data that is gathered continues to grow, the data is not being used effectively for IT business-relevant decisions. IBM® Tivoli® Data Warehouse helps solve this problem by being the central repository in which you can store historical data about your IT infrastructure. This includes network devices and connections, desktops, hardware, software, events, and other information. Stored data is subsequently analyzed and used to produce reports about the behavior of IT components and services.
This IBM Redbook discusses all aspects of IBM Tivoli Data Warehouse V2.1 (the version that is shipped with IBM Tivoli Monitoring V6.1) including deployment best practices, scalability, performance optimization, external data integration, reporting, and troubleshooting. As part of the book, we provide a reporting solution for Tivoli Data Warehouse data, which is based on the Business Intelligence and Reporting Tools (BIRT) technology. BIRT is a free, Eclipse-based reporting tool. This solution was developed based on the requirements of a real client.
In addition, as an example of a commercial reporting solution, we present the Crystal Reports solution from Business Objects. Of course, you are not limited in your choices and can use any reporting solution for reporting against the Tivoli Data Warehouse data.
We also discuss two solutions that are published on IBM OPAL (Open Process Automation Library) Web site. These are QuickReporter for IBM Tivoli Monitoring from Primeur and Warehouse Designer for IBM Tivoli Monitoring 6.1 from Axibase. Both products are IBM certified solutions, specifically designed for IBM Tivoli Monitoring.
This book is a reference for IT professionals who implement and use a Tivoli Data Warehouse environment.
The team that wrote this IBM RedbookThis IBM Redbook was produced by a team of specialists from around the world working at the International Technical Support Organization (ITSO), Austin Center.
Vasfi Gucer is an IBM Certified Consultant IT Specialist at the ITSO Austin Center. He started his IBM career as a Network Specialist in 1989. He has over
© Copyright IBM Corp. 2007. All rights reserved. xxv

16 years of experience providing technical support across a variety of IBM products and technologies, including communications, network, and systems management. For the last six years, he has been working for IBM ITSO, where he has been writing IBM Redbooks™ and creating and teaching workshops around the world on a variety of topics. In this position, he also has worked on various Tivoli customer projects as a Systems Architect and Consultant. He holds a Master’s degree in Engineering.
Naeem Altaf is a Senior Software Engineer, working in IBM Tivoli Monitoring solutions for almost five years now. Altaf is currently working as a Solutions Architect, helping Business Partners and clients to integrate their products into IBM Tivoli Monitoring Enterprise Software.
Iris Co is an ACE Certified (Authorized Crystal Engineer) and works for Business Objects in the Sales Consulting group. She developed some Crystal Reports for Tivoli in 2004 for specific groups such as IBM Tivoli Monitoring for Transaction Performance, IBM Tivoli Monitoring for OS, and Security Compliance Manager.
James A. Edwards is a Software Engineer at Tivoli’s Austin location. He has 10 years of experience with IBM, and has worked the last five years at Tivoli. He manages the IBM Tivoli Monitoring 6.1 Server Scalability lab and has extensive knowledge of the IBM Tivoli Monitoring 6.1 server products.
Christopher Layton has been with IBM for four years. He joined the Americas Tivoli Database team just over a year ago. His job responsibilities include administration of IBM Tivoli Monitoring for Databases on many internal and commercial accounts. His team supports all the IBM DB2® databases that are used by Tivoli applications throughout the Americas. They also support Tivoli Data Warehouse 1.x and 2.1 for many commercial accounts.
Denis Vasconcelos is a Database Administrator with IBM Brazil. He has over five years of experience on several non-IBM data management systems before he joined IBM in 2006. His areas of expertise include database administration, data modeling, heterogeneous database migration, and project management. Denis has a Bachelor's degree in computer science and a post-graduate degree in project management.
Paul Wigget is a Senior IT Specialist working for Software Lab Services as part of the IBM Software Group in South Africa. He has over six years of experience in Enterprise Systems Management and distributed platform software. He holds a degree in Information Technology Management from the University of Johannesburg. His areas of expertise include Tivoli Systems Management Architecture and Implementation. He has extensive experience in designing, implementing, and supporting such Tivoli products as Tivoli Management Framework 3.x and 4.x, Tivoli Monitoring 5.1.x and 6.1, IBM Tivoli Enterprise™ Console 3.x, Tivoli Configuration Manager 4.x, and Tivoli Remote Control 3.8. He
xxvi Tivoli Management Services Warehouse and Reporting

is an IBM Tivoli Certified Deployment Professional in IBM Tivoli Monitoring 6.1 and is certified in Information Technology Infrastructure Library (ITIL®).
Alessandro Zonin is an IT Specialist working in IBM Global Technology Services Division in Padova (Italy) for nine years. His skills include IBM Tivoli Monitoring, IBM Tivoli Data Warehouse, IBM Tivoli Configuration Manager, IBM Tivoli Remote Control, IBM Tivoli Enterprise Console®, and Tivoli Framework, with expertise in IBM DB2 Universal Database™. Before this role, he worked as a Database Administrator for many projects for IBM clients in Northern Italy.
Thanks to the following people for their contributions to this project:
Arzu Gucer ITSO, Austin Center
Emma JacobsITSO, San Jose Center
Lorinda SchwarzErica WazewskiITSO, Poughkeepsie Center
Russ BabbittEd BernalJim CareyCatherine CookJonathan CookArun DesaiThad JenningsPam GeigerShayne GrantJohn KogelIBM U.S.
Marc Christopher PurnellIBM Germany
Bjoern W. SteffensIBM Switzerland
Matthias LauBausparkasse Mainz AG
Preface xxvii

Become a published authorJoin us for a two- to six-week residency program! Help write an IBM Redbook dealing with specific products or solutions, while getting hands-on experience with leading-edge technologies. You'll team with IBM technical professionals, Business Partners and/or customers.
Your efforts will help increase product acceptance and customer satisfaction. As a bonus, you'll develop a network of contacts in IBM development labs, and increase your productivity and marketability.
Find out more about the residency program, browse the residency index, and apply online at:
ibm.com/redbooks/residencies.html
Comments welcomeYour comments are important to us!
We want our Redbooks to be as helpful as possible. Send us your comments about this or other Redbooks in one of the following ways:
� Use the online Contact us review redbook form found at:
ibm.com/redbooks
� Send your comments in an email to:
� Mail your comments to:
IBM Corporation, International Technical Support OrganizationDept. HYTD Mail Station P0992455 South RoadPoughkeepsie, NY 12601-5400
xxviii Tivoli Management Services Warehouse and Reporting
Chapter 1. Overview of IBM Tivoli Data Warehouse
This chapter provides a general overview of IBM Tivoli Data Warehouse and applications that exploit Tivoli Data Warehouse, such as IBM Tivoli Monitoring, IBM Tivoli Service Level Advisor, IBM Tivoli Composite Application Manager, and IBM Tivoli Enterprise Console. We discuss the reporting strategy of Tivoli, how Tivoli Data Warehouse is positioned in the total IBM IT Service Management solution, the differences between Tivoli Data Warehouse V2.1 and V1.x, and the benefits of having a central systems management historical database.
This chapter covers the following topics:
� “IBM IT Service Management” on page 2
� “IBM Tivoli Data Warehouse” on page 4
� “Tivoli’s reporting strategy” on page 6
� “Differences between Tivoli Data Warehouse V2.1 and 1.x” on page 9
� “Tivoli products that exploit Tivoli Data Warehouse V2.1” on page 14
1
© Copyright IBM Corp. 2007. All rights reserved. 1

1.1 IBM IT Service Management
The IBM IT Service Management solution is a combination of services, software, and hardware that improves a company’s ability to manage IT as a business by integrating, automating, and optimizing key IT processes.
There are three key components:
� IT Operational Management products are the traditional management products that automate tasks.
� The IT Service Management platform helps to standardize and share information and administer consistent policy.
� The IT Process Management products integrate and automate processes (across domains) using the IBM IT Service Management platform and the IT Operational Management products.
All of the three components mentioned previously are built on IBM and industry best practices.
Figure 1-1 A comprehensive approach to IBM IT Service Management
The operational management pillar, as shown in Figure 1-1, is divided into software families. The availability solution addressed in business application management and server, network, and device management can be viewed as an integrated offering, as shown in Figure 1-2.
Best Practices
Change and ConfigurationManagement Database (CCMDB)
Server, Network & Device
ManagementStorage
ManagementSecurity
ManagementBusiness
ApplicationManagement
Service Delivery
& SupportService
DeploymentInformation
ManagementBusinessResilience
IT CRM & Business
Management
IT Service Management Platform
IT Process Management Products
IT Operational Management Products
2 Tivoli Management Services Warehouse and Reporting

Figure 1-2 Tivoli software portfolio
The Tivoli availability portfolio is divided into:
� Resource monitoring: Measuring and managing IT resource performance, including servers, databases, and middleware
� Composite application management: Monitoring and managing an application and its components, understanding applications from the availability standpoint
� Event correlation and automation: Correlates and automates events or faults that are generated by resource monitoring, application monitoring, or both to provide a concise root-cause analysis of the failure in the environment
� Orchestration and provisioning: Provides the ability to deploy or re-deploy servers or components as requested, on demand, to fulfill processing needs, if the need arises as indicated by the correlation engine
� Business service management: Provides a high-level view of business status as reflected by its underlying monitoring components; the view can either be in real time or based on a service level agreement
The Tivoli Data Warehouse product resides in the Resource Monitoring pillar from the Tivoli software portfolio.
In the following section, we provide a brief description of the major capabilities and functions of Tivoli Data Warehouse.
Business Service Management
Event Correlation and Automation
Resource Monitoring
Orchestration and Provisioning
Composite Application Management
Security Storage
Chapter 1. Overview of IBM Tivoli Data Warehouse 3

1.2 IBM Tivoli Data Warehouse
As the amount of management data that is gathered continues to grow, the data is not being used effectively for IT business-relevant decisions. Tivoli Data Warehouse helps solve this problem by being the central repository in which you can store historical data about your IT infrastructure, including network devices and connections, desktops, hardware, software, events, and other information. Stored data is subsequently analyzed and used to produce reports about the behavior of IT components and services.
1.2.1 Tivoli Data Warehouse and CCMDB
As shown in Figure 1-1 on page 2, at the heart of IBM IT Service Management lies the Change and Configuration Management Database (CCMDB), which is much more than a simple registry of physical assets. It provides an accurate inventory of clients’ IT resources and the relationships between them.
CCMDB delivers a federated view of all your enterprise’s IT data, including information about hardware, software, and the relationships between them. It integrates IT service functions into a unified, automated infrastructure management platform, which helps clients to:
� Consolidate information between disparate IT environments
� Create synergy between different IT service management functions
� Optimize the management of IT service demands
� Maximize IT performance and return on investment (ROI)
4 Tivoli Management Services Warehouse and Reporting

Figure 1-3 shows the IT Service Management reporting structure.
Figure 1-3 IT Service Management reporting
There are various examples of integration between data warehouse database and CCMDB. By matching the information contained in these two repositories, you can produce several correlated report, such as:
� Relationship between changes and resulting performance or availability
� Relationship between changes and forecasts or predictive analysis
� Cluster of similar incident or problem patterns
� Availability (Tivoli Composite Application Manager reports feed into IBM Tivoli Monitoring)
� Compliance (storage and security)
� Capacity planning
� Service level agreement adherence across multiple domains (security, storage, provisioning, availability)
IT Service Management reporting
Operational Management Products
Events
Monitor SnapshotsInventory
ConfigurationApplication
Response Records
Historical Data Warehousing
Basic Product Reports
Enterprise Console
IT Service Management Process Managers
CCMDBConfiguration Items
Process Artifacts and Flows
Basic Historical Reports
Basic Configuration ReportsBasic Process Reports
Events, snapshots, responses aggregated over time series
User & AccountDirectories
Dashboards
Relationship Analysis Reports
How effective is your change process?Relationship between changes and incidents
How effective is your change process?Relationship between changes and performance/availability
How efficient is your change process?Schedule, backlog analysis of change to release
How are your people operating the change process?Relationship users and changes
How proactive is your change process?Relationship between changes and historical trends, predictions
Chapter 1. Overview of IBM Tivoli Data Warehouse 5

1.3 Tivoli’s reporting strategy
One of the greatest assets that is generated by Tivoli products is the data from which clients monitor their environment, analyze its performance, plan their activities, and preform their actions. Reporting enables them to make decisions about their IT deployments and businesses.
Using a unique central repository for systems management data, you can:
� Correlate and analyze data from various monitors in one place
� Add value through cross-platform, business-oriented reports based on an end-to-end view of the enterprise
� Save costs and have data consistency
1.3.1 Understanding a report
All reports have the same purpose: To convey information. Reports differ from dashboards and business intelligence in many ways. At this point, a further classification has to be defined.
� Reports provide status conditions for particular actions based on a time range. Data can come from a single product or multiple products.
6 Tivoli Management Services Warehouse and Reporting

Figure 1-4 shows an example report.
Figure 1-4 Report example
� Dashboards are not reports. They are a real-time view of a single or a small group of metrics (for example, how much central processing unit (CPU) is being consumed right now for a particular server).
Chapter 1. Overview of IBM Tivoli Data Warehouse 7

Figure 1-5 shows some dashboard examples.
Figure 1-5 Dashboards examples
� Business intelligence (analytical reporting) is the process of analyzing large amounts of corporate data, which is usually stored in large databases such as the Data Warehouse, tracking business performance, detecting patterns and trends, and helping enterprise business users make better decisions.
Focus is to present high level summarized data
• Presents summary data• Requires considerable data analysis• Often times for a manager and/or buyer
personas• Demo floor attraction• Can drill down to operational views or reports
TBSM 3.1TM
TSLA TCAM for RTT
8 Tivoli Management Services Warehouse and Reporting

Figure 1-6 shows an example of business intelligence.
Figure 1-6 Business intelligence example
1.4 Differences between Tivoli Data Warehouse V2.1 and 1.x
The new Tivoli Data Warehouse V2.1 architecture is different from the older Tivoli Data Warehouse V1.x solution. The primary differences between the two versions can be grouped in the following topics:
� Implementation differences� Usability differences� Scalability differences
Chapter 1. Overview of IBM Tivoli Data Warehouse 9

1.4.1 Implementation differencesThere are a number of implementation differences between the two versions. These are:
� Tivoli Data Warehouse V2.1 uses row-based schema versus star-based schema.
� Detailed data is now stored in the data warehouse.
� Tivoli Data Warehouse V2.1 supports Oracle®, Microsoft® SQL (MS SQL), and DB2.
One of the primary architectural differences between Tivoli Data Warehouse V2.1 and Tivoli Data Warehouse V1.x is that Tivoli Data Warehouse V2.1 is based on a single database and a simple row-based schema. Version 1.x was based on a multi-tiered database structure with a central data warehouse database and a separate data mart database. It also required a more complex process to load the databases using an extract, transform, and load 1 (ETL1) and ETL2 process.
The Tivoli Data Warehouse V2.1 has a much simpler data collection and summarization architecture. The data mart database in Tivoli Data Warehouse V1.x was based on a star schema. A star schema is a series of fact and dimension tables that are arranged as a conceptual star. At the core of a star schema is a technique called database normalization. For more information, see:
http://en.wikipedia.org/wiki/Database_normalization
Row-based schemas are much simpler and are basically stored as a what you see is what you get arrangement. Row-based schemas are easier to manipulate than star schemas. However, star schemas are slightly more efficient for processing very large amounts of data. We cover this in 1.4.3, “Scalability differences” on page 12.
Another difference between Tivoli Data Warehouse V2.1 and Tivoli Data Warehouse V1.x is that Version 2.1 now stores detailed level monitoring data (raw data) in the data warehouse. The V1.x data was always aggregated to the hourly level when it was stored in the data warehouse. Version 2.1 also improves the way data aggregation occurs: This version is more flexible in the way in which attributes can be aggregated, and it always aggregates from the raw data (the detailed tables). Finally, the Tivoli Data Warehouse V2.1 database is not restricted to DB2 as the older version was. Version 2.1 now supports DB2 8.2 or later, Oracle 9 or later, and MS SQL 2000 and later.
10 Tivoli Management Services Warehouse and Reporting

1.4.2 Usability differencesThe usability differences between the two versions are described as follows:
� Tivoli Data Warehouse V2.1 stores more than 24 hours of detailed data.
� Detailed and summarized data resides in the same database.
� New GUI (IBM Tivoli Enterprise Portal (TEP)) is used to access the Tivoli Data Warehouse V2.1.
� Tivoli Data Warehouse V2.1 has an improved time-to-value.
The usability differences between Tivoli Data Warehouse V2.1 and Tivoli Data Warehouse V1.x are significant. One of the significant new features in Version 2.1 is that clients can now access more than 24 hours of detailed data. Users can configure a maximum time to keep the detailed data that is architecturally unlimited. (Planning considerations must apply.) For example, clients can now keep 30 days of detailed data in Tivoli Data Warehouse V2.1 if they choose.
Additionally, in Version 2.1, the detailed data is stored in the same database as the summarized data. Therefore, users no longer have to navigate multiple interfaces to run reports, because all of the data is in the same database and can be accessed through a common portal. Access to all levels of data is vastly improved in Version 2.1. In Tivoli Data Warehouse V1.x, a user had to use the Web Health Console to get to the detailed data and use a reporting tool such as Alphabox, Crystal Reports, Brio, or SAS to access the summarized data (the data mart). In Tivoli Data Warehouse V2.1, users can access all tables (detailed or summarized data) from the same repository using any relational database management system (RDBMS) reporting tool or using the Tivoli Enterprise Portal.
The IBM Tivoli Monitoring V6.1 new portal provides a robust graphical user interface (GUI). The Tivoli Enterprise Portal interface is used for querying and viewing all levels of the stored historical data. IBM Tivoli Monitoring V6.1 provides seven agents that are ready to use as is with thousands of queries. The fact that the combination of IBM Tivoli Monitoring V6.1 and Tivoli Data Warehouse V2.1 gives the client seamless access to all levels of the data is a major improvement over the Tivoli Data Warehouse V1.x architecture.
IBM Tivoli Monitoring V6.1 and Tivoli Data Warehouse V2.1 provide an improved time-to-value proposition. IBM Tivoli Monitoring V6.1 and Tivoli Data Warehouse V2.1 can be implemented in a matter of hours compared to a few days, and more likely weeks, with the old Tivoli Data Warehouse V1.x.
Chapter 1. Overview of IBM Tivoli Data Warehouse 11

1.4.3 Scalability differencesThere are a number of scalability differences between the two versions. These are broken down into the following categories:
� Data collection� Planning� Performance
With Tivoli Data Warehouse V2.1, you can now store detailed data in the database and this data can span for more than 24 hours of data. This provides tremendous opportunity. However, these features can also create some new pitfalls if proper planning is not applied. In this section, we discuss some of the implementation and usability experiences that were encountered when using IBM Tivoli Monitoring V5.x with Tivoli Data Warehouse V1.x.
The IBM Tivoli Monitoring V5.x-Tivoli Data Warehouse V1.x architecture handled data collection and retrieval very well. In the Tivoli Data Warehouse V1.x architecture, data was collected and retrieved by IBM Tivoli Monitoring 5.x from the endpoints using the Tivoli Framework MDist2 architecture. When a user requested a Web Health Console window that required detailed information, a request was made to the gateway and then to the endpoint using MDist2. All data collections from the endpoints in IBM Tivoli Monitoring V5.x were initiated from the endpoint’s gateway and the data was uploaded into an RDBMS from a gateway. This data collection process also made use of the Tivoli Framework’s MDist2 architecture.
IBM Tivoli Monitoring V6.1 does not use the Tivoli Framework architecture and MDist2 to collect data. In Version 6.1, if a user performs a query against detailed data for less than 24 hours for a large number of servers, the overhead of the request can affect the performance of the overall IBM Tivoli Monitoring V6.1 monitoring infrastructure. See 2.5, “Historical data collection architecture” on page 52, for more information about how data is stored and retrieved in Tivoli Data Warehouse V2.1.
In contrast, IBM Tivoli Monitoring V5.x and the MDist2 architecture always retrieved and collected data using a multi-tier structure (for example, endpoint → gateway → RDBMS). MDist2 also has a robust architecture for throttling and tuning data movement throughout an infrastructure.
Probably a more important scalability difference is that clients can now collect an enormous amount of data in Tivoli Data Warehouse V2.1. The collection and reporting against this data can have an impact on the IBM Tivoli Monitoring V6.1 monitoring infrastructure. In Tivoli Data Warehouse V1.x, all of the warehouse data was already aggregated to the hourly level on the endpoint and only the aggregated data was uploaded to the gateways. With the new Tivoli Data
12 Tivoli Management Services Warehouse and Reporting

Warehouse V2.1, historical data is collected at the agent or at the Tivoli Enterprise Monitoring Server. These agents or servers initiate Remote Procedure Call (RPC) requests to Warehouse Proxy Agents that load the data in a database using Open Database Connectivity (ODBC) or Java™ Database Connectivity (JDBC™) calls depending on the platform where the Warehouse Proxy Agent is installed.
User reporting can also negatively affect monitoring performance, depending on the configuration settings. In the Tivoli Data Warehouse V1.x architecture, the data mart was in a separate database from the operational data (the IBM Tivoli Monitoring RDBMS Interface Module (RIM) database). In Tivoli Data Warehouse V2.1, a single database is both the operational database and the data warehouse database. In Version 2.1, multiple users can run the same report against hundreds of servers for millions of lines of data. In Tivoli Data Warehouse V1.x, the data was summarized and also normalized using data marts and star schemas. Users might want to consider using an original equipment manufacturer (OEM) tool to create online analytical processing (OLAP) cubes or data marts in Tivoli Data Warehouse V2.1 to offload some of the reporting requirements. For using data marts in Tivoli Data Warehouse V2.1, see 4.1, “Using data marts” on page 235.
For more information about deployment considerations of existing Tivoli Data Warehouse V1.x clients, see 2.8, “Deployment considerations for Tivoli Data Warehouse V1.X clients” on page 91.
Note: With IBM Tivoli Monitoring V6.1 Fix Pack 2, you can have more than one Warehouse Proxy agents in your Tivoli Data Warehouse V2.1 environment, which improves data collecting performance. For using multiple Warehouse Proxy agents, see 2.9.3, “Multiple Warehouse Proxies” on page 101.
Chapter 1. Overview of IBM Tivoli Data Warehouse 13

1.5 Tivoli products that exploit Tivoli Data Warehouse V2.1
In this section, we provide a general overview of the Tivoli products that currently exploit the Tivoli Data Warehouse capabilities. You can refer to Chapter 3, “Warehousing in action” on page 109, for more information about how these products are integrated with Tivoli Data Warehouse V2.1.
1.5.1 IBM Tivoli Monitoring
IBM Tivoli Monitoring monitors and manages system and network applications on a variety of platforms and keeps track of the availability and performance of all parts of your enterprise. IBM Tivoli Monitoring provides reports that you can use to track trends and troubleshoot problems. The following sections give you an overview of the major components that make up IBM Tivoli Monitoring V6.1.
IBM Tivoli Enterprise Monitoring ServerThe Tivoli Enterprise Monitoring Server is the focal point and main component within IBM Tivoli Monitoring for managing your environment. The hub communicates with agents and other Tivoli Enterprise Monitoring Servers. Remote Tivoli Enterprise Monitoring Server allows you to minimize network traffic and support larger number of agents.
IBM Tivoli Enterprise Portal ServerThe Tivoli Enterprise Portal Server is used to get a high-level overview of the monitoring environment. By using the navigator window, managed systems are displayed in a tree-like structure. Workspaces can be customized within the portal to suit just about any monitoring requirement. There are two components to the Tivoli Enterprise Portal. The Tivoli Enterprise Portal Server communicates directly with the hub monitoring server. Tivoli Enterprise Portal Server contains a database that is the repository for all users of the Tivoli Enterprise Portal Server and their workspace configurations.
IBM Tivoli Enterprise Portal ClientThe portal client, either Web browser based or Windows® based client, communicates directly with the Tivoli Enterprise Portal Server.
AgentsAgents are data collectors that monitor systems, subsystems, or applications, and pass data to the TEP through the Tivoli Enterprise Monitoring Server. A Tivoli Enterprise Monitoring Agent interacts with a single system, and in most
14 Tivoli Management Services Warehouse and Reporting

cases, is installed on the monitored system. Multiple agents are typically installed on a single server.
There are three type of agents that can be classified into these groups:
� Operating system agents: Monitor the availability and performance of a system from the operating system level
� Application agents: Monitor the availability and performance of an application and its subsystems
� Universal agent: An agent that can be customized to monitor any data that you collect in your environment through the use of several different data providers that are supported
1.5.2 IBM Tivoli Service Level Advisor
IBM Tivoli Service Level Advisor provides service level management (SLM) capabilities for enterprise organizations that have to measure, manage, and report on availability and performance aspects of their internal IT infrastructure. The SLM capabilities of IBM Tivoli Service Level Advisor complement the performance and availability measurement functions of other Tivoli products, such as IBM Tivoli Composite Application Manager and IBM Tivoli Business Systems Manager.
By using IBM Tivoli Service Level Advisor, you can:
� Identify existing service levels and new requirements� Define offerings with OLAs and underpinning contracts� Agree on SLAs and maintain service catalog� Monitor and evaluate service levels� Report to the client and IT organization� Review and adjust service provision, service level agreement (SLA)
1.5.3 IBM Tivoli Enterprise Console
IBM Tivoli Enterprise Console is designed to help simplify a broad range of event management and correlation activities across virtually the entire IT environment. By including built-in intelligence to take corrective action automatically, it can help you to increase efficiency, reduce downtime, and meet important SLAs for critical business requirements.
Tivoli Enterprise Console consolidates events from networks, hardware, and software throughout the environment to provide an overview of your IT infrastructure. Using the Web console, you can analyze events to diagnose the root cause of problems and accelerate problem resolution. When preconfigured rules are used, responses can be automated to provide self-healing fixes. These
Chapter 1. Overview of IBM Tivoli Data Warehouse 15

built-in actions coupled with escalation and notification capabilities can help you to proactively manage your environment.
Additionally, when you use IBM Tivoli Enterprise Portal to combine this events view from Tivoli Enterprise Console with IBM Tivoli Monitoring, you have a single interface for identifying, diagnosing, and resolving problems.
1.5.4 IBM Tivoli Composite Application Manager
The aim of Tivoli Composite Application Manager is to simplify and enhance distributed application management. Application components can reside on multiple servers, across different platforms, and Java 2 Platform, Enterprise Edition (J2EE™) environments, and even through mainframes. The complexity of understanding and solving application-related problems, typically around performance issues, requires a cohesive set of tools to be able to provide an end-to-end view of the application.
� IBM Tivoli Composite Application Manager for Response Time Tracking manages Application Response Measurement (ARM) instrumented tools to track and break down distributed application response time.
– Provides application topology information to IBM IT Service Management Change and Configuration Management Database (CCMDB) to help manage application dependencies, and provides monitoring status for the IBM Tivoli Availability Process Manager
– Delivers full integration of the Web Response Monitor, designed to provide client, network, and server response times and metrics for Web applications without requiring agents on user systems
– Helps collect and report data by unique transaction, including transaction volume data in reports
– Offers custom reporting using Tivoli Enterprise Portal workspaces or direct Structured Query Language (SQL) queries of database views
– Helps report on monitoring by application, client, and location
– Helps simplify monitoring when using Mercury LoadRunner script
� IBM Tivoli Composite Application Manager for Internet Service Monitoring V6.0 is designed to monitor the availability, response time, and usability of Internet applications.
– Can record and simulate complex user transactions and is designed to provide user-side performance and availability metrics by acting like a client, user, or other system
– Metrics can be used to report on real-time service levels based on actual delivered services to the user
16 Tivoli Management Services Warehouse and Reporting

� IBM Tivoli Composite Application Manager for J2EE Operations V6.0 helps monitor the health and performance of IBM WebSphere® and BEA WebLogic applications. It is designed to measure hard-to-access application-specific metrics from within the application. Thresholds can be predefined to help alert administrators of problems before they occur, and metrics collected can be diagnosed to help troubleshoot problems. IBM Tivoli Composite Application Manager for J2EE Operations:
– Helps proactively monitor performance thresholds for changes in status
– Sends alerts about potential problems before brown outs and outages affect users
– Delivers automated action for pre-emptive problem resolution
� Tivoli Composite Application Manager for Service-Oriented Architecture (SOA) provides a management solution across the entire application life cycle for services architects, administrators, subject matter experts, operators, consultants, and others involved in the development, testing, deployment, and ongoing management of services-based systems. The key features of Tivoli Composite Application Manager for SOA include:
– Discovery, monitoring, diagnostics, and automated control of SOA services
– Support for key SOA platforms including WebSphere Application Server, IBM WebSphere Process Server, IBM WebSphere Business Integration Server Foundation, Microsoft .NET and BEA WebLogic
– Support for services deployed using SOAP over HTTP, SOAP over HTTPS, SOAP over Java Message Service (JMS) and WebSphere Application Server Service Integration Bus
– Ability to understand service relationships
– Drill-down from services to application components and IT resources within the Tivoli Enterprise Portal to identify the source of bottlenecks or failures to simplify and speed up problem identification and resolution time
� Tivoli Composite Application Manager for WebSphere V6.0 is a comprehensive performance and availability solution that provides effective application management for enterprise J2EE applications, including composite applications that have a J2EE user interface coupled with other back-end systems such as IBM Customer Information Control System (CICS®) and IBM Information Management System (IMS™). The key features of Tivoli Composite Application Manager for WebSphere V6.0 are:
– Helps to quickly identify application and server-level problems that impact user experience
– Helps to monitor the health of production WebSphere and J2EE applications using light-footprint agents
Chapter 1. Overview of IBM Tivoli Data Warehouse 17

– Integrates easily with Tivoli Enterprise Portal
– Delivers low-level application trace data to IBM Rational® Eclipse developer tools when used in combination with IBM Tivoli Composite Application Manager for Response Time Tracking
– Uses powerful memory diagnostic tools
– Views flows of transactions that span from J2EE into other back-end systems including CICS and IMS environments
– Creates reports that can reveal performance trends with deep-dive analytical views
18 Tivoli Management Services Warehouse and Reporting

Chapter 2. IBM Tivoli Data Warehouse internals and deployment configurations
This chapter explains the details of how to perform data gathering, data aggregation, and data pruning on Tivoli Data Warehouse Version 2.1. We also introduce some deployment configurations and sizing considerations.
This chapter discusses the following topics:
� “Tivoli Data Warehouse Version 2.1: High-level architecture” on page 20
� “Tivoli Data Warehouse: Deployment scenarios” on page 24
� “Firewall considerations” on page 33
� “High-availability considerations” on page 42
� “Historical data collection architecture” on page 52
� “Storage considerations for Tivoli Data Warehouse Version 2.1” on page 71
� “Tivoli Data Warehouse Version 2.1 load projection spreadsheet” on page 77
2
© Copyright IBM Corp. 2007. All rights reserved. 19
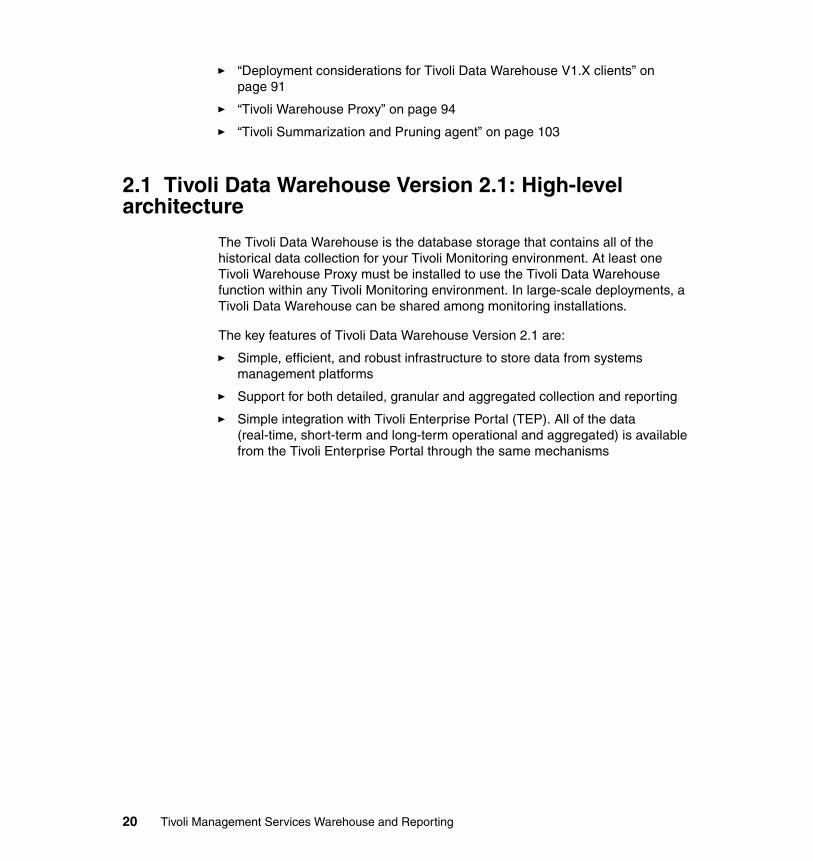
� “Deployment considerations for Tivoli Data Warehouse V1.X clients” on page 91
� “Tivoli Warehouse Proxy” on page 94
� “Tivoli Summarization and Pruning agent” on page 103
2.1 Tivoli Data Warehouse Version 2.1: High-level architecture
The Tivoli Data Warehouse is the database storage that contains all of the historical data collection for your Tivoli Monitoring environment. At least one Tivoli Warehouse Proxy must be installed to use the Tivoli Data Warehouse function within any Tivoli Monitoring environment. In large-scale deployments, a Tivoli Data Warehouse can be shared among monitoring installations.
The key features of Tivoli Data Warehouse Version 2.1 are:
� Simple, efficient, and robust infrastructure to store data from systems management platforms
� Support for both detailed, granular and aggregated collection and reporting
� Simple integration with Tivoli Enterprise Portal (TEP). All of the data (real-time, short-term and long-term operational and aggregated) is available from the Tivoli Enterprise Portal through the same mechanisms
20 Tivoli Management Services Warehouse and Reporting

Figure 2-1 shows a basic data warehouse and data collection infrastructure.
Figure 2-1 Tivoli Data Warehouse Version 2.1: Basic architecture
There are four major components that make up the infrastructure for the Tivoli Data Warehouse.
� The monitoring agents: These are responsible for the collection of the detailed metric data from a monitored system or application.
� The Tivoli Warehouse Proxy: This agent is responsible for receiving this detailed metric data from the agents and inserting it into the Tivoli Data Warehouse.
� The Tivoli Summarization and Pruning agent: This agent is responsible for summarizing the detailed data within your Tivoli Data Warehouse and pruning data that is no longer required.
� The Tivoli Data Warehouse: This is the data warehouse itself that is responsible for storing and providing the detailed and summarized data for all captured agents.
Desktop Client Browser Client
Tivoli Data Warehouse V2.1
Tivoli Enterprise PortalServer
Tivoli Enterprise PortalServer Database
Hub Tivoli EnterpriseMonitoring Server
Remote Tivoli EnterpriseMonitoring Server
(Optional)
Tivoli EnterpriseMonitoring Server
Database
ApplicationAgent Universal AgentOperating
System Agent
TivoliMonitoringV5.x Agent
Warehouse ProxySummarization & Pruning Agent
Optional 2nd
Warehouse Proxy
Agents From Another RemoteTivoli Enterprise
MonitoringServer
Reporting ToolsTivoli Service LevelAdvisor
Chapter 2. IBM Tivoli Data Warehouse internals and deployment configurations 21

The data flow of these component is further illustrated in Figure 2-2.
Figure 2-2 Basic data flow of Tivoli Data Warehouse architecture
2.1.1 Tivoli Data Warehouse Version 2.1 supported platforms
Table 2-1, Table 2-2, and Table 2-3 on page 23 show the supported platforms for the Tivoli Data Warehouse related components. Table 2-1 lists the supported platforms for the Tivoli Data Warehouse Version 2.1 database.
Table 2-1 Supported platforms for Tivoli Data Warehouse Version 2.1 database
IBM DB2 MS SQL Oracle
IBM DB2 Universal Database V8 (UDB V8), Fix Pack 10 and later on the following operating systems: � IBM AIX® V5.3� Solaris™ 10� Windows 2003 Server� SUSE Linux® Enterprise
Server 9 for Intel®� Red Hat Enterprise Linux 4
for Intel
� MS SQL 2000� MS SQL 2005
Oracle V9.2, 10g Release 1, and 10g Release 2 on the following operating systems: � AIX V5.3� Solaris 10� Windows 2003 Server� SUSE Linux Enterprise
Server 9 for Intel� Red Hat Enterprise Linux 4
for Intel
22 Tivoli Management Services Warehouse and Reporting

Table 2-2 lists the supported platforms for Tivoli Warehouse Proxy agent.
Table 2-2 Supported platforms for Tivoli Warehouse Proxy agent
Table 2-3 lists the supported platforms for Tivoli Summarization and Pruning agent.
Table 2-3 Supported platforms for Tivoli Summarization and Pruning agent
Windows AIX Linux
� Windows 2000 Server and Advanced Server
� Windows XP� Windows 2003 Server SE and
EE (32-bit) with Service Pack 1� Windows 2003 on VMWare
ESX Server V2.5.2
� AIX V5.3 (32-bit/64-bit)
� Red Hat Enterprise Linux 3 on Intel� Red Hat Enterprise Linux 3 and 4 on
IBM eServer™ zSeries® 31-bit� Red Hat Enterprise Linux 3 and 4 on
zSeries 64-bit� Red Hat Enterprise and Desktop
Linux 4 Intel� Red Hat Enterprise Linux 4 for Intel
on VMWare ESX Server V2.5.2� SUSE Linux Enterprise Server 8
and 9 Intel� SUSE Linux Enterprise Server 8
and 9 for zSeries 31-bit� SUSE Linux Enterprise Server 8
and 9 for zSeries 64-bit
Windows AIX Linux
� Windows 2000 Professional� Windows 2000 Server and
Advanced Server� Windows XP� Windows 2003 Server SE and
EE (32-bit) with Service Pack 1� Windows 2003 on VMWare
ESX Server V2.5.2
� AIX V5.1 (32-bit/64-bit)
� AIX V5.2 (32-bit/64-bit)
� AIX V5.3 (32-bit/64-bit)
� Solaris Operating Environment V8 (32-bit/64-bit)
� Solaris V9 (SPARC)� Solaris V10 (SPARC)
� Red Hat Enterprise Linux 2.1 Intel� Red Hat Enterprise Linux 3 on Intel� Red Hat Enterprise Linux 3 and 4
on zSeries 31-bit� Red Hat Enterprise Linux 3 and 4
on zSeries 64-bit� Red Hat Enterprise and Desktop
Linux 4 Intel� Red Hat Enterprise Linux 4 for Intel
on VMWare ESX Server V2.5.2� SUSE Linux Enterprise Server 8
and 9 Intel� SUSE Linux Enterprise Server 8
and 9 for zSeries 31-bit� SUSE Linux Enterprise Server 8
and 9 for zSeries 64-bit
Chapter 2. IBM Tivoli Data Warehouse internals and deployment configurations 23

2.1.2 Recommended hardware considerations for the Tivoli Data Warehouse components
The hardware considerations for the physical layout of the Tivoli Data Warehouse components are:
� Warehouse Proxy agent server
– Processors: Minimum of four for a large or huge enterprise
� Database server
– Processors: Minimum of four processors– Disk drives: 16 to 24 disk drives for a large or huge enterprise
For a more detailed description of estimation and sizing your Tivoli Data Warehouse Database, see 2.6, “Storage considerations for Tivoli Data Warehouse Version 2.1” on page 71, and 2.7, “Tivoli Data Warehouse Version 2.1 load projection spreadsheet” on page 77.
� Summarization and Pruning agent server
– Processors: Minimum of four processors– Memory: Minimum 2 GB
� Database server and Summarization and Pruning agent on the same machine
– Processors: Minimum of four processors– Memory: Minimum 4 GB – Disk drives: 16 to 24 disk drives for a large or huge enterprise
2.2 Tivoli Data Warehouse: Deployment scenarios
The deployment scenarios in this section attempt to provide a realistic understanding of architecture design. Use these scenarios mainly for guidance to assist in the planning and deployment strategy used for a production installation, because every deployment strategy is unique and only proper planning can guarantee a successful implementation.
We cover three types of environments:
� Small-to-medium installation (400 agents maximum)� Large installation (4000 agents maximum)� Huge installation (greater than 4000 agents)
24 Tivoli Management Services Warehouse and Reporting

2.2.1 Small-to-medium installation (400 agents maximum)
The small-to-medium installation is a fundamental design that uses only the minimum required components. This scenario is perfect for prototyping IBM Tivoli Monitoring and Tivoli Data Warehouse or using it within a production installation consisting of 400 agents. In fact, IBM Tivoli Monitoring V6.1 by design excels in superiority for the small-to-medium installation. The out-of-box monitoring collections, graphical user interface (GUI) presentation layer, historical data collection, and robustness provide a full monitoring solution with a modest total cost of ownership (TCO). It is implemented with the minimum hardware requirements necessary for a production IBM Tivoli Monitoring installation.
The installation consists of the following components:
� Hub Tivoli Enterprise Monitoring Server� Tivoli Enterprise Portal Server� Tivoli Enterprise Portal (client and browser client)� One Tivoli Warehouse Proxy agent� Tivoli Data Warehouse� Tivoli Summarization and Pruning agent
Note: Our classification is based on the number of IBM Tivoli Monitoring V6.1 agents. In practice, sometimes the number of employees is used to define the size of a business. For example, companies with up to 1000 employees are considered as small-to-medium businesses.
Chapter 2. IBM Tivoli Data Warehouse internals and deployment configurations 25

Figure 2-3 depicts the small-to-medium topology. It provides an overview of each IBM Tivoli Monitoring connected component.
Figure 2-3 Small Tivoli Data Warehouse environment (400 agents maximum)
Although it can handle agent tasks directly, we recommend that you do not use the hub Tivoli Enterprise Monitoring Server for this purpose. Instead, it must focus on data collecting and processing tasks between the Tivoli Enterprise Portal Server and itself. If the environment expands, install additional remote Tivoli Enterprise Monitoring Server and possibly additional Warehouse Proxies to process the additional agent requirement. Additional agent deployments increase processing requirements for the hub Tivoli Enterprise Monitoring Server, which can degrade if the hub is allowed to handle agent tasks directly.
For an average Tivoli Data Warehouse installation in a small-to-medium installation, having the Warehouse Proxy agent and the Tivoli Data Warehouse repository on the same system is sufficient. One Warehouse Proxy is more than sufficient. This installation provides historical data collection without the additional hardware. It is still a wise decision to monitor the Tivoli Data Warehouse and Warehouse Proxy after installation to ensure that the processing rate is on target.
26 Tivoli Management Services Warehouse and Reporting

2.2.2 Large installation (4000 agents maximum)
Building on the fundamentals of the small-to-medium installation, the large installation focuses on scalability. This Tivoli Monitoring environment consists of 4000 agents within a single Tivoli Monitoring installation. It requires the recommended hardware specification or later to properly scale the infrastructure.
The installation consists of the following components:
� Hub Tivoli Enterprise Monitoring Server
� Several remote Tivoli Enterprise Monitoring Servers
� Tivoli Enterprise Portal Server
� Tivoli Enterprise Portal (client and browser client)
� At least one Tivoli Warehouse Proxy agent (additional agents are optional and are based on the number of agents and the processing rate of data collection on these agents)
� Tivoli Data Warehouse
� Tivoli Summarization and Pruning agent
Figure 2-4 depicts the comprehensive architecture for all the interconnected components. It shows the recommended strategy for the Tivoli historical data collection. We advise that you configure the historical collection to be collected directly from the agent as opposed to collection at a Tivoli Enterprise Monitoring Server.
Note: A small environment (less than 200 agents) might collocate the Tivoli Enterprise Monitoring Server and the Tivoli Enterprise Portal Server on a single hardware. The requirement for remote Tivoli Enterprise Monitoring Server most likely does not exist at all.
Chapter 2. IBM Tivoli Data Warehouse internals and deployment configurations 27

Figure 2-4 Large Tivoli Data Warehouse environment (4000 agents maximum)
Performing an accurate plan and assessment stage is imperative for the large installation. Mapping all component topology with the recommended hardware specifications is critical to achieve a highly distributed environment with realistic goals. Have a thorough understanding of the monitoring environment before you proceed to implement any architectural design. It is important to account for all
Note: Figure 2-4 shows the agents connecting to a remote Tivoli Enterprise Monitoring Server and only the remote Tivoli Enterprise Monitoring Server connecting to the Warehouse Proxy Agent. This is true if the historical data is stored at the remote Tivoli Enterprise Monitoring Server, but if the historical data is stored at the agent, both the OS agent and Application agent should also connect to the Warehouse Proxy Agent.
Also, when you have two distinct IBM Tivoli Monitoring installations, it is important to note that both installations should use the same user ID to connect to the Tivoli Data Warehouse database, as this user ID will then become the first part name of all the Tivoli Data Warehouse tables. Having two user IDs prevents querying with one unique query information for all the systems of the same attribute group in the entire enterprise, as two tables with two different first part will exist.
28 Tivoli Management Services Warehouse and Reporting

the variables within the topology. Substantial consideration must be given to the infrastructure hardware requirements and the underlying network topology. Network bandwidth, latency, and firewall restriction require assessment.
IBM Tivoli Monitoring is ideal for small-to-medium installations. After installation, it begins using the best practice functionality immediately. If default historical data collection is turned on, the default attribute groups begin analysis and warehousing immediately. These default services can impede the large installation performance throughput, especially if unnecessary attributed group collections are enabled. It is vital to the performance of the large installation that only the required attribute group data collection is enabled.
A large monitoring installation supports approximately 1500 managed systems (servers on which monitoring agents reside) in an environment. For the large installation, the estimate is three agents per managed system. In this installation, a disproportionate distribution of agents is highly anticipated, and this scenario must complement your own environment analysis phrase. The recommended distribution is 400 agents for 10 remote Tivoli Enterprise Monitoring Servers. Keeping 400 agents as the high point per monitoring server allows for capacity expansion without exhausting the resources of the infrastructure.
The Tivoli Data Warehouse data requirement can be substantial. We advise you to separate the Tivoli Warehouse Proxy agent and the Tivoli Data Warehouse repository between two systems. Install the Tivoli Summarization and Pruning agent on the Tivoli Data Warehouse system. It is advisable to keep these two components together. Depending on the number of agents collecting data, add multiple Warehouse Proxies to allow for efficient data collection from the managed agents.
Important: We strongly discourage you from turning on the default historical data collection. For example, the Linux_Process attribute group is one of the default groups for the Linux agent, and it can collect a very large amount of data.
Chapter 2. IBM Tivoli Data Warehouse internals and deployment configurations 29

A large installation can introduce the IBM Tivoli Enterprise Console as part of the topology. IBM Tivoli Monitoring has built-in capabilities for event processing that work extremely well in the small-to-medium installation. However, the large installation can contain a reasonable increase in volume of event flow, and the Tivoli Enterprise Console is better adapted for large event flow management and correlation. The Tivoli Enterprise Console can be considered an event consolidation manager of managers. By using the Tivoli Monitoring For Tivoli Enterprise Console agent, the Tivoli Enterprise Console can provide Tivoli Data Warehouse Version 2.1 integration. This can provide valuable reporting and trend analysis capabilities for the events flowing through to the Tivoli Enterprise Console server and its event processing engine.
The TCO is still nominal compared to IBM Tivoli Monitoring functionality, despite the large hardware requirements that are necessary to scale this installation properly. The entire large installation can be managed from a single GUI presentation layer down to installing and upgrading agents.
Tip: It is acceptable to put the Summarization and Pruning agent on a separate machine from the warehouse database, if there is a fast network connection between them. Separating the Summarization and Pruning agent from the database increases the path for accessing the database, and it increases the amount of hardware devoted to the Summarization and Pruning function.
Also, it is important to set the KSY_MAX_WORKER_THREADS variable to an appropriate value. If the Summarization and Pruning agent is on the same machine as the warehouse database, set KSY_MAX_WORKER_THREADS to one less than the number of processors. This enables spare capacity for Warehouse Proxy agent inserts and TEP queries. If the Summarization and Pruning agent is on a separate machine, you can set a higher value for KSY_MAX_WORKER_THREADS. You can monitor the database server to make sure that Warehouse Proxy agent inserts are still occurring without problems, and that TEP queries for historical data are being processed normally.
30 Tivoli Management Services Warehouse and Reporting

2.2.3 Huge installation (greater than 4000 agents)
The huge installation scenario provides a guideline for any IBM Tivoli Monitoring installation that exceeds 4000 agents, or approximately 1500 monitored servers. The scope of the huge installation is similar to the large installation, except for additional configuration guidance.
The installation consists of the following components:
� Multiple Tivoli Enterprise Monitoring Servers� Multiple Tivoli Enterprise Portal Servers� Multiple Tivoli Enterprise Portals (Client and browser client)� Multiple Tivoli Warehouse Proxy agents� Tivoli Data Warehouse� Tivoli Summarization and Pruning agent
Figure 2-5 depicts the interconnections between two autonomous IBM Tivoli Monitoring installations. It shows the high-level component interaction between two installations that handle 4000 agents each, totaling 8000 agents entirely.
Tip: A large environment (less than 4000 agents) locates the Tivoli Enterprise Monitoring Server and the Tivoli Enterprise Portal Server on different hardware. To provide scalability, you can deploy additional remote Tivoli Enterprise Monitoring Server and additional Warehouse Proxies.
Depending on the amount of users, you can also deploy additional Tivoli Enterprise Portal Servers. Note that in that case, the second Tivoli Enterprise Portal Server must be considered as read only. Multiple Tivoli Enterprise Portal Servers do not clone each other, you have to do this manually. You have to manually export tables from your existing Tivoli Enterprise Portal Server database and import them on the new machine. Specifically, you have to copy KFWWORKSPACE table (includes your workspace presentation definitions), KFWPRESENTATION, and KFWPRESDEF tables. If you created any new users besides sysadmin, you also have to copy the KFWUAXREF, KFWUSER, and KFWUSERTOPO tables.
One other use of multiple Tivoli Enterprise Portal Servers is for testing the new maintenance; to clone current Portal server, apply maintenance and then test it out.
Chapter 2. IBM Tivoli Data Warehouse internals and deployment configurations 31

Figure 2-5 Huge Tivoli Data Warehouse environment (greater than 4000 agents)
The recommended deployment strategy is the same as for the large installation, except for the Tivoli Data Warehouse, Warehouse Proxy, and Summarization and Pruning agent. A huge installation can warehouse historical data collections to one single database server repository from two distinct IBM Tivoli Monitoring installations. Additionally, multiple Warehouse Proxies can be used per IBM Tivoli Monitoring installation.
The two installations are still built separately from each other. The only deviation is that one IBM Tivoli Monitoring installation requires a logical association as the master control for the Summarization and Pruning agent.
Important: As described in 2.2.2, “Large installation (4000 agents maximum)” on page 27, make sure that only the required attribute groups are enabled for Tivoli Data Warehousing. Enormous amounts of data can be collected between two large IBM Tivoli Monitoring installations. Best practice design is critical to ensure a stable, scalable environment.
32 Tivoli Management Services Warehouse and Reporting

A flexible feature that is required in the huge installation is the ability to configure multiple TEP instances in a single TEP desktop client. If a single TEP desktop client has to connect to a separate autonomous IBM Tivoli Monitoring installation, instances are created to associate the unique Tivoli Enterprise Portal Server connection information.
2.3 Firewall considerations
In most IBM Tivoli Monitoring and IBM Tivoli Data Warehouse implementations, firewalls can play an important role throughout the architecture. For a successful implementation, it is important to understand the component communication flow. The configuration to support IBM Tivoli Monitoring and Tivoli Data Warehouse within firewalls is further discussed in the following section.
Communications protocol selectionIf you install IBM Tivoli Monitoring and Tivoli Data Warehouse components across firewalls, the recommendation is to configure the IP.PIPE (Transmission Control Protocol (TCP) communication) protocol. The IP (User Datagram Protocol (UDP) communication) protocol is insufficient for firewall configurations. The connectionless UDP protocol requires the opening up of multiple ports
Note: There can be only one Summarization and Pruning agent for a single Tivoli Data Warehouse. Because the Summarization and Pruning agent requires connections to a Tivoli Enterprise Monitoring Server, one of the monitoring installations must be logically designated as the master. This is not a programmatic assignment, but a logical identification for configuration and management of the Summarization and Pruning agent. For more details about configuring, see 2.10, “Tivoli Summarization and Pruning agent” on page 103.
Important: Enhanced firewall functionality has been added through the use of a gateway feature in post general availability (GA) fix packs. For information about this function, see the Firewall Gateway Feature documented in the IBM Tivoli Monitoring information center:
http://publib.boulder.ibm.com/infocenter/tivihelp/v15r1/index.jsp?toc=/com.ibm.itm.doc/toc.xml
Tip: See IBM Tivoli Monitoring Installation and Setup Guide, GC32-9407, for expert advice about firewall scenarios. This book has several excellent examples using firewalls.
Chapter 2. IBM Tivoli Data Warehouse internals and deployment configurations 33

across firewalls to allow multiple connections from each individual IBM Tivoli Monitoring component. For example, a Tivoli Enterprise Monitoring Agent communicating to the Tivoli Enterprise Monitoring Server using IP (UDP communication) protocol requires multiple ports to operate properly. Also, using the IP.PIPE (TCP communication) enables the Ephemeral pipe operation automatically if certain conditions match.
The IP.PIPE protocol has some notable limitations:
� Only 16 IBM Tivoli Monitoring processes on a single system can share the base listening port (default port 1918) on a single network interface card when using the protocol. Any process that is more than 16 falls back to using the IP protocol (only if configured). This is mainly a restriction when running large numbers of Tivoli Enterprise Management Agents on one physical system. It is not a limitation for the total amount of Tivoli Enterprise Monitoring Agents connecting to one Tivoli Enterprise Monitoring Server. This might occur only when a system is required to run more than 16 Universal Agents or has more than 16 Database Agent instances. If firewall restrictions force the use of the IP.PIPE protocol, the only workaround is to move excess Tivoli Enterprise Management Agents more than 16 to another system.
� The Tivoli Enterprise Monitoring Server might run out of sockets (listen threads). The Tivoli Enterprise Monitoring Server log shows evidence of this:
message KDSMA010 – Communication did not succeed.
If this occurs, you must increase the number of sockets by changing the setting of KDS_NCSLISTEN. The maximum value that can be set is 256.
Table 2-4 depicts the default listening ports for the IBM Tivoli Monitoring components. Use Table 2-4 as a quick reference to understand the standard ports for an installation. Although modifying these default values is supported, we recommend that you do not modify it.
Table 2-4 Default port usage for IBM Tivoli Monitoring
Note: When IP.PIPE is specified as your communications protocol, you might still see other ports being used in communication traces and logs, but these ports are virtual and multiplexed over the default IP.PIPE port.
IBM Tivoli Monitoring component Listening port
Tivoli Enterprise Monitoring Server (IP.PIPE) 1918/tcp
Tivoli Enterprise Monitoring Server (IP.SPIPE) 3660/tcp
Tivoli Enterprise Monitoring Server (IP) 1918/udp
34 Tivoli Management Services Warehouse and Reporting

Using IP.PIPE enables some well-known ports to be open through the firewall. Use Example 2-1 to calculate which port to open. If the firewall is not using network address translation (NAT), the computation is sufficient to have the components connect through the firewall.
Every system that has IBM Tivoli Monitoring installed automatically reserves the well-known port (default 1918) for the Tivoli Enterprise Monitoring Server communication. No matter what order the components start up on a system that has several IBM Tivoli Monitoring components installed, the default well-known port is only used by the Tivoli Enterprise Monitoring Server.
For all components other than the Tivoli Enterprise Monitoring Server, the calculation in Example 2-1 is used internally by IBM Tivoli Monitoring to reserve the listening ports.
Example 2-1 IBM Tivoli Monitoring algorithm to calculate listening port
"reserved port" = well-known port + (N*4096)where: N= startup sequence
For example, the IBM Tivoli Monitoring component startup on the system Izmir follows this sequence:
1. The Universal Agent starts first: port 6014 (1918 + 1*4096)
2. The remote Tivoli Enterprise Monitoring Server starts second: port 1918 (always reserved for Tivoli Enterprise Monitoring Server)
Tivoli Enterprise Portal Server 1920/tcp15001/tcp
Tivoli Enterprise Console 5529/tcp
Warehouse Proxy agent 6014/tcp
Tip: Do not deviate from the default listening ports without a valid reason, even though this is supported. Listening port modification was not tested by IBM Tivoli Software Group.
Note: The default well-known port is 1918. Any well-known port can be configured, if the entire environment matches this port number.
IBM Tivoli Monitoring component Listening port
Chapter 2. IBM Tivoli Data Warehouse internals and deployment configurations 35

3. The Windows Operating System Agent starts third: port 10110 (1918 + 2*4096)
4. The Warehousing Proxy starts fourth: port 14206 (1918 + 3*4096)
Not all communication is through the firewallUsing the calculation from Example 2-1, it is now possible to control the port usage on individual systems. Additionally, using two parameters in the KDC_FAMILIES environment variable enables even finer control than the startup sequence method. Ideally, all components that require access through the firewall must use the lower-number ports, and components that do not cross the firewall use higher-number ports.
This is accomplished by specifying the SKIP and COUNT parameters on the KDC_FAMILIES environment variable for the individual IBM Tivoli Monitoring component. (See Example 2-2.)
For example:
KDC_FAMILIES=IP.PIPE COUNT:1 PORT:1918 IP use:n SNA use:n IP.SPIPE use:n
� The COUNT parameter (coded as COUNT:N where N is an integer that indicates which port to reserve) for the components that require access across a firewall. If the process is unable to bind to the highest port with reference to N, it immediately fails to start up.
� The SKIP parameter (coded as SKIP:N where N is an integer that indicates which port to reserve +1) for the components that do not require access across a firewall. If the process is unable to bind to the port with reference to N, it keeps trying to use the algorithm until all available ports are exhausted.
Example 2-2 Example for KDC_FAMILIES=IP.PIPE COUNT
The system Izmir has installed:-Tivoli Enterprise Monitoring Server-Windows OS Agent-Warehousing Proxy agent
The well-known port is the default port 1918.The Tivoli Enterprise Monitoring Server always uses port 1918.The Windows OS agent does not require firewall access and should be coded with KDC_FAMILIES=IP.PIPE SKIP:2 (port 10110).If the Windows OS agent fails to open port 10110, it will try SKIP:3 attempting to bind now to port 10370. A failure will result in trying SKIP:4 continuing to exhaust all possibilities with any subsequent failures.
36 Tivoli Management Services Warehouse and Reporting

The Warehouse Proxy does require firewall access and should coded with KDC_FAMILIES=IP.PIPE COUNT:1 (port 6014).If the Warehouse Proxy fails to open port 6014, start up fails.
Multiple network interface cardsWhenever an IBM Tivoli Monitoring component starts up, by default it discovers all available network interfaces on the system and actively uses them. This might not always produce the required results. For example, consider a Tivoli Enterprise Monitoring Server with two network interface cards (NIC): One interface connected to the main production network and a second interface connected to a limited network that is used only for server backup.
When a Tivoli Enterprise Monitoring Agent on another system starts up and makes the first connection to the Tivoli Enterprise Monitoring Server using the Global Location Broker, it connects to the Tivoli Enterprise Monitoring Server first interface. Additionally, assume that the Tivoli Enterprise Monitoring Agent does not have an interface connected to the limited backup network segment. The Tivoli Enterprise Monitoring Server sends a reply to the Tivoli Enterprise Monitoring Agent that contains the network address on which the Tivoli Enterprise Monitoring Server wants the Tivoli Enterprise Monitoring Agent to connect. This network address might be the NIC that is connected to the backup network. This results in the Tivoli Enterprise Monitoring Agent not being able to connect successfully even though the initial handshake succeeded.
To avoid this problem, you can specify an environment parameter on all of the IBM Tivoli Monitoring components to force it to use a specific network interface rather then using any available ones. You can accomplish this by passing either of these keywords:
� KDCB0_HOSTNAME: You can specify either the host name, corresponding to the NIC to be used, or its IP address in dotted decimal format. If specified, it will take priority over the KDEB_INTERFACELIST parameter. Use KDCB0_HOSTNAME only in an environment without NAT, because it also inactivates the use of the Ephemeral Pipe.
� KDEB_INTERFACELIST: Specify the NIC as dotted decimal IP addresses. This keyword is recommended when IBM Tivoli Monitoring is installed in an environment with NAT.
Regardless, this technique is still a good practice to ensure that the Tivoli Enterprise Management Agents connect to the proper Tivoli Enterprise Monitoring Server interface.
Chapter 2. IBM Tivoli Data Warehouse internals and deployment configurations 37

Installations with firewallsThe best practice with Tivoli Enterprise Management Agents on the less secure zone of the firewall is to deploy a remote Tivoli Enterprise Monitoring Server on the same firewall side. This enables all Tivoli Enterprise Monitoring Agents to connect to the remote Tivoli Enterprise Monitoring Server and have only the remote Tivoli Enterprise Monitoring Server connect through the firewall. This minimizes the number of systems that require firewall access and keeps port restrictions in place. See Figure 2-6 on page 40 and Figure 2-7 on page 41 for a visual diagram.
Special cases� Firewall with NAT: Ephemeral Pipe
Today, many firewall implementations include NAT, which further protects the systems behind the firewall by making them invisible using a different set of IP addresses. If the configuration includes a firewall with NAT, the easiest way to configure Tivoli Enterprise Monitoring Agent, Tivoli Enterprise Portal Server, or Tivoli Enterprise Monitoring Server to connect to another Tivoli Enterprise Monitoring Server is the Ephemeral Pipe. When an Ephemeral Pipe is active, it acts as a virtual tunnel that funnels all connections between two components through one single port. The Ephemeral Pipe is not explicitly started when using the standard installation scripts or tools, but is activated by default under following conditions:
– KDC_PARTITION definition file is not present; if KDC_PARTITION is used, it inactivates the Ephemeral Pipe.
– KDCB0_HOSTNAME parameter must not be specified; instead use the KDEB_INTERFACELIST variable.
– The initial communication must come from the agents, not by the Tivoli Enterprise Monitoring Server. Older configurations might still have a KDSSTART LBDAEMON command for the Location Broker at the Tivoli Enterprise Monitoring Server. Remove this command to activate the Ephemeral Pipe.
If these conditions are met, the Tivoli Enterprise Monitoring Agent to Tivoli Enterprise Monitoring Server communication automatically tries to create an Ephemeral Pipe connection and no further configuration actions are required. The main advantage of using Ephemeral Pipe is that no special configuration is required, therefore you do not have to manually update the configuration parameters at possibly hundreds of Tivoli Enterprise Monitoring Agents that run outside of the firewall.
You can explicitly configure the Ephemeral Pipe by setting this parameter:
KDC_FAMILIES=IP.PIPE PORT 1928 EPHEMERAL:Y
38 Tivoli Management Services Warehouse and Reporting

This forces the client to use outbound ephemeral connections. Use this kind of configuration if you encounter duplicate pipe setup failure messages in the Tivoli Enterprise Monitoring Server log. This occurs if you run multiple agents on the same system as the Tivoli Enterprise Monitoring Server and all connect to that particular Tivoli Enterprise Monitoring Server using the same pipe. In this case, EPHEMERAL:Y forces the agents to use the Ephemeral Pipe.
Although, Ephemeral Pipe is the first choice for firewall environments with NAT, it might not communicate successfully across firewalls in all environments. If communication failures occur between the Tivoli Enterprise Monitoring Agent and the Tivoli Enterprise Monitoring Server, a more detailed communications trace is required. Set the KDC_DEBUG=Y variable to generate the required level of detail trace.
If the output of the KDC_DEBUG=Y trace contains IP addresses with 0.0.0.0, this indicates the correct use of Ephemeral Pipe. However, if communications are still failing, you have to use the alternative technique that requires partition definitions. This can happen if the connections between Tivoli Enterprise Monitoring Agent and Tivoli Enterprise Monitoring Server have to cross multiple firewalls or if NAT has been set up without using generic patterns.
� Firewall with NAT: Partitioning
If Ephemeral Pipe fails to establish a connection between the agents and the hub Tivoli Enterprise Monitoring Server, the only alternative with this IBM Tivoli Monitoring release is to use partition files. This is fully documented in the IBM Tivoli Monitoring Installation and Setup Guide, GC32-9407.
Large installation with firewall architecturesKeep in mind that security guidelines in a specific environment might be inflexible when dealing with the location of some of the IBM Tivoli Monitoring components. Accurate comprehension of the communication flows and ports enables any installation to be customized to meet the underlying security policies.
The following recommended architectures provide visual guidance in understanding the communication flow among the IBM Tivoli Monitoring components. Mastery of IBM Tivoli Monitoring communication protocol provides the architect control over the entire network topology. We now describe two common designs.
Warehouse Proxy agent in less secure zoneThis scenario is based on less-restrictive firewall rules concerning the traffic flow for the historical data collection. In this scenario, the Warehouse Proxy agent is located in the less secure zone. Figure 2-6 depicts one recommended architecture for an IBM Tivoli Monitoring installation with firewall restrictions enabled and with the Warehouse Proxy agent located in the less secure zone.
Chapter 2. IBM Tivoli Data Warehouse internals and deployment configurations 39

Figure 2-6 Warehouse Proxy agent in less secure zone
This scenario keeps the Tivoli Enterprise Monitoring Agent warehousing traffic on the same side of the firewall, and the database repository on the more secure side. It is not necessary to keep track of the Warehouse Proxy agent listening port for firewall rules. Open a specific port on the firewall to enable the Warehouse Proxy agent to perform an Open Database Connectivity (ODBC) connection to the Tivoli Data Warehouse on the more secure side.
The port for the ODBC connection is unique to each relational database management system (RDBMS). Consult the database product manuals or your local database administrator.
Warehouse Proxy agent in more secure zoneIn this second scenario, the firewall restrictions are expanded to prevent any warehousing traffic on the less secure side of the firewall. Figure 2-7 depicts the recommended architecture for an IBM Tivoli Monitoring installation with firewall restrictions increased, and the Warehouse Proxy agent located in the more secure zone.
Note: When the Warehouse Proxy agent is on AIX or Linux, the JDBC interface is used.
40 Tivoli Management Services Warehouse and Reporting

Figure 2-7 Warehouse Proxy agent in more secure zone
This scenario forces the Tivoli Enterprise Monitoring Agent to warehouse traffic through the firewall. The Warehouse Proxy agent and the Tivoli Data Warehouse repository are both located in the more secure zone. This design increases the complexity for the Warehouse Proxy agent, but it also increases the security of the warehouse data.
To open the proper ports so that the Tivoli Enterprise Monitoring Agent can warehouse the historical data through the firewall, the Warehouse Proxy agent must establish a well-known listening port. This well-known port is calculated through the KDC_FAMILIES mechanism.
Chapter 2. IBM Tivoli Data Warehouse internals and deployment configurations 41

When warehousing data in a large installation especially within the boundaries of firewalls, note the following tips:
� Accurately calculate the collection amount of historical data. Firewall traffic can increase excessively when historical data collection is enabled.
� Only collect the critical attribute groups and be careful not to turn on unnecessary attribute groups.
� Historical data rollup can be stored on the remote Tivoli Enterprise Monitoring Server. However, it is severely limited to 250 Tivoli Enterprise Monitoring Agents per remote Tivoli Enterprise Monitoring Server.
� Windows has a limit of a maximum 2,000 sockets open simultaneously. Within a firewall environment, IP.PIPE is required. 500 sockets are reserved for internal processing, therefore if you want to use warehousing of historical data for more than 1,500 Tivoli Enterprise Monitoring Agents, you have to use more than one Warehouse Proxy Agent. Note that if you are using Warehouse Proxy Agent on UNIX/Linux, you do not have that limitation. Even if you use one UNIX/Linux Warehouse Proxy Agent, warehousing of historical data is supported for more than 1,500 Tivoli Enterprise Monitoring Agents.
2.4 High-availability considerations
Although hardware and software is often extremely reliable, there is no guarantee against failure, and there is certainly no absolute guarantee against events such as a natural disaster or any other unpredictable disaster.
High availability can be of vital importance when running business and IT intelligence applications such as Tivoli Data Warehouse and Tivoli Service Level Advisor. Single points of failure within a system can seriously impact both performance and availability. High availability is the term used to describe
Tip: The Warehouse Proxy agent calculated port is significant only when:
� The Tivoli Enterprise Monitoring Agents are warehousing data directly to the Warehouse Proxy agent, instead of storing on the remote Tivoli Enterprise Monitoring Server
� Firewall policies do not allow ODBC or JDBC connections to be made from less secure to the more secure infrastructure, and the Warehouse Proxy agent must be located behind the firewall from the agents
� The Tivoli Enterprise Monitoring Agent must go through a firewall to connect to the Warehouse Proxy agent
42 Tivoli Management Services Warehouse and Reporting

systems that run and are available to clients more or less all the time. High availability means different things to different people.
In some cases, high availability means provision of more or less instantaneous cutover facilities and continuing on standby hardware and software as though the original failure had never occurred. In other cases, high availability means possibly up to 30 minutes outage and continuing as before, which can be handled by provision of standby machines that can take over the work of the failing machine after some handover process of both hardware and software. This has the important attribute of experiencing no degradation in performance.
In many cases, high availability in a warehousing environment means that users can put up with a small loss of availability and also accept a degraded service until things are corrected completely. This can be achieved by making provision for what is called mutual takeover, whereby a machine with existing work on it can take on the extra work of all or part of the failing machine until such time as things are repaired completely.
For high availability to occur:
� Transactions must be processed efficiently, without appreciable performance degradations (or even loss of availability) during peak operating periods
� Systems must be able to recover quickly when hardware or software failures occur, or when disaster strikes
� Software that powers the Tivoli Data Warehouse database must be continuously running and available for transaction processing
2.4.1 Tivoli Data Warehouse failure behavior
In a typical Tivoli Data Warehouse scenario, there are a number of machines or systems performing a role, for example:
� The Tivoli Data Warehouse server that holds the target database
� The source monitoring agents from which the detailed data is extracted
� The Warehouse Proxy agent that loads the detailed data into the Tivoli Data Warehouse database
If the Tivoli Data Warehouse server fails or is not able to be written to, the Warehouse Proxy agent continues to attempt to write detailed data to the database. This behavior continues until the database becomes available. The data on the agent is not pruned by the Warehouse Proxy agent, because it has not performed any successful writes to the Tivoli Data Warehouse. This behavior is further explained in 2.9.1, “Tivoli Warehouse Proxy internals” on page 95.
Chapter 2. IBM Tivoli Data Warehouse internals and deployment configurations 43

There are limitations on this behavior although these are mostly related to the agent. The agent has the ability to store its collected detailed data on its own physical media. If the data is not pruned by the Warehouse Proxy agent due to disconnection, it can be stored for an infinite amount of time. Because the Warehouse Proxy is not able to write the data to the warehouse, the data stays local to the machine and is not removed until a successful warehouse write has been achieved by the Warehouse Proxy agent. In cases where many groups are configured for collection at short intervals, this can cause a large data transfer when the Tivoli Data Warehouse or Warehouse Proxy agent comes back online. In some cases, this is highly undesirable because it is not really throttled at any level and a spike in warehousing and processing activity can be expected.
The warehouse is obviously not able to report historical data to the Tivoli Enterprise Portal Server and its users while it is in a failed or disconnected state. A detailed data query can be run on the Tivoli Enterprise Portal Server. The reason for this is that this detailed data is queried directly from the agent if the warehouse is unavailable. This is a maximum of 24 hours if the Warehouse Proxy agent is able to write to the warehouse effectively, because it always prunes to the last 24 hours of data. An aggregated, summarized query cannot be run, therefore no aggregated or summarized historical views work in the Tivoli Enterprise Portal Server. If the agent process has to stop, there can be no collection of raw metric data on the agent because it is not operational.
2.4.2 Recommendations
When you start to plan and design your Tivoli Data Warehouse system, the main recommendations are:
� Take time to brainstorm a list of possible failure scenarios.
� Agree upon their degree of criticality to your environment, and then decide which scenarios must be accommodated in your system.
� Document what action must be taken for each of the important scenarios, if they occur.
Consider the following technologies when you plan for high availability for your Tivoli Data Warehouse infrastructure.
Important: The current monitoring agent process terminates after five days, if it has no connection to a Tivoli Enterprise Monitoring Server for the duration of this period. Keep this in mind when you consider high-availability scenarios.
44 Tivoli Management Services Warehouse and Reporting

Clustering and failover supportYou can achieve failover protection by keeping a copy of your database on another machine that is perpetually rolling the log files forward. With this approach, the primary database is restored to the standby machine using a database restore utility or the split mirror function.
The secondary database on the standby machine continuously rolls the log files forward. If the primary database fails, any remaining log files are copied over to the standby machine. After a roll forward to the end of the logs and stop operation, all clients are reconnected to the secondary database on the standby machine.
You can get failover support by adding platform-specific software to your system, for example:
� High-Availability Cluster Multi-Processing (HACMP™), Enhanced Scalability, for AIX
� Microsoft Cluster Server (MSCS), for Windows NT® or Windows 2000
� Sun™ Cluster, or VERITAS Cluster Server, for the Solaris operating environment
� Multi-Computer or ServiceGuard, for Hewlett-Packard
� Steeleye or Mission Critical Linux for Linux
Failover strategies are usually based on clusters of systems. A cluster is a group of connected systems that work together as a single system. Each processor is known as a node within the cluster. When failures occur, clustering allows servers to back each other up by picking up the workload of the failed server (Figure 2-8).
Figure 2-8 Clusters overview
Chapter 2. IBM Tivoli Data Warehouse internals and deployment configurations 45

IP address takeover (or IP takeover) is the ability to transfer a server IP address from one machine to another when a server goes down; to a client application, the two machines appear at different times to be the same server.
Failover software might use heartbeat monitoring or keepalive packets between systems to confirm availability. Heartbeat monitoring involves system services that maintain constant communication between all the nodes in a cluster. If a heartbeat is not detected, failover to a backup system starts. Users are usually not aware that a system has failed. There are two common failover strategies on the market known as idle standby and mutual takeover.
Idle standbyIn this configuration, one system is used to run a database instance, and the second system is idle, or in standby mode, ready to take over the instance if there is an operating system or hardware failure involving the first system. Overall system performance is not impacted, because the standby system is idle until required.
Figure 2-9 shows an idle standby example. The cluster includes all four nodes and one node is kept idle, standing by to take over the workload of any node that fails. Although this configuration is more costly, it does have the advantage that there is no performance degradation after failover of one machine at a time.
Figure 2-9 Idle standby
46 Tivoli Management Services Warehouse and Reporting

Mutual takeoverIn this configuration, each system is the designated backup for another system. Overall system performance might be impacted, because the backup system must do extra work following a failover: It must do its own work plus the work that was being done by the failed system.
Figure 2-10 shows an example of a partitioned database consisting of four database partitions, each running on a separate server. The server hardware consists of four nodes connected with a high-speed network. Additional cluster software such as HACMP on AIX or MSCS on Windows is installed. The four nodes are separated into two pairs. Each pair is defined as cluster to the cluster software. Each node acts as the failover server for the other node in the same cluster.
Figure 2-10 Mutual takeover
The mutual takeover configuration means that a failure results in that node’s partition being recovered and its workload being taken over from the other node in a cluster that is already running a workload. The cluster software typically allows the invocation of failover scripts when failover occurs. You can use these scripts to adjust various operating parameters when a failover or failback occurs. For example, use the failover scripts to shrink the buffer pools of both the affected logical partitions when a failover occurs, and restore them to normal on failback.
Chapter 2. IBM Tivoli Data Warehouse internals and deployment configurations 47

High availability of mediaIn this section, we look at various techniques that you can exploit to keep your data warehouse or data marts highly available by minimizing the chances of media failure (such as disk failure) and the time to recover from such failures.
Disk failure is one of the most commonly experienced problems. For example, if the warehouse system has 100 physical drives, have you estimated with what frequency you might expect some kind of disk failures? Careful planning and understanding of all the things that can go wrong can protect you from losing information.
Disk mirroringDisk mirroring is a useful technique for maximizing the availability of your database. Mirroring is the process of writing the same data to multiple storage devices at the same time. This is done either sequentially, when data is only written to the mirror when the master write is successful. It is also done in parallel, when both master and mirror writes occur at the same time. The first method is slower but you are more likely to have at least one good copy of the data if a failure occurs. When reading from a mirrored logical volume, the operating system (OS) reads from either the master or the mirror, whichever is quicker at the time. If a media failure occurs, operations are automatically switched to the good copy and the OS marks the faulty copy as stale. Users can use mirroring to continue working even though a media failure has occurred.
Mirroring can be implemented in either software or hardware. However, mirroring does not remove the need to back up databases. For example, you cannot use disk mirroring to restore a table that has been lost or damaged as a result of user error. Additionally, although disk mirroring dramatically reduces the impact of media failures, there is still a risk of damage to both sides of the mirror.
If a database is held on one set of physical volumes, and a mirror image of the same database is maintained on a separate set of physical volumes, it is possible for both sets of physical volumes to be damaged or destroyed. This can happen as a result of a disaster or it can be just bad luck. In such instances, it is necessary to recover the database from backup copies.
RAID technologyRAID stands for Redundant Array of Independent Disks, and provides a method of classifying the different ways of using multiple disks to increase availability and performance. RAID can eliminate or minimize the chance of unavailability of the critical warehouse resources such as target database tables and logs by allowing operation to continue in the degraded mode when a disk failure occurs.
48 Tivoli Management Services Warehouse and Reporting

Disk arrays and RAID are hardware solutions to improve some or all of the following disk characteristics:
� Performance: Operating multiple disks in parallel can boost input/output (I/O) performance.
� Size: Instead of engineering expensive large disks, replace them with a number of small disks that together work like a large disk.
� Reliability: Using either mirroring or parity information allows operation to continue in the degraded mode, even in the event of a single disk failure.
� Variety: Disk arrays come in a large variety of configurations with various number of tunable alternatives.
The original RAID classification described five levels of RAID (RAID-1 through RAID-5). RAID-0 (data-striping), RAID-1 Enhanced (data stripe mirroring), and Orthogonal RAID-5 (which includes extra redundancy of components such as disk adapters) have been added to these. RAID-0 is not a pure RAID type, because it does not provide any redundancy.
Different designs of arrays perform optimally in different environments. The two main environments are those where a high I/O rate is required, that is:
� High transfer rates are important
� High I/O rates are required, that is, for applications requesting short length random records
Table 2-5 shows the RAID array classifications.
Table 2-5 RAID classifications
In this section, we describe RAID-0, RAID-1, and RAID-5 and their functions.
RAID level Description
RAID-0 Block Interleave Data Striping without Parity
RAID-1 Disk Mirroring/Duplexing
RAID-1 Enhanced Data Strip Mirroring
RAID-2 Bit Interleave Data Striping with Hamming Code
RAID-3 Bit Interleave Data Striping with Parity Check
RAID-4 Block Interleave Data Striping with One Parity Disk
RAID-5 Block Interleave Data Striping with Skewed Parity
Orthogonal RAID-5 RAID-5 with Additional Redundancy (such as disk adapters)
Chapter 2. IBM Tivoli Data Warehouse internals and deployment configurations 49

RAID-0 is the data organization term used when striping data across multiple disk drives, without parity protection. Data striping improves performance with large files, since reads/writes are overlapped across all disks. However, reliability is decreased, as the failure of one disk can result in a complete failure of the disks.
RAID-1 is the term used with disk mirroring or duplexing at the hardware level. Whenever the computer makes an update to a disk, it can arrange to duplicate that update to a second disk, thus mirroring the original. This level of RAID is implemented in local area network (LAN) Server fault tolerance. Either of the disks can fail, and the data is still accessible. Additionally, because there are two disks, a read request can be serviced from either disk, thus leading to improved throughput and performance on the disk subsystem. However, the downside is the cost of using 50% of disk storage space for mirroring.
In the case of the IBM RAID controller, there are two separate disk Small Computer System Interface (SCSI) channels available from one card and therefore duplexing is possible from one disk controller card. Some might not consider this as true duplexing but as mirroring on separate disk control channels. In any case, the IBM RAID controller provides an extremely cost-effective and adaptable method for arranging data on a disk subsystem using RAID-1.
RAID-5 is the term used when striping data across three or more disks with skewed parity. This means that the data organization is essentially the same as RAID-0, but there is an additional element of parity checking. The parity checking is used to encode the data and guard it against loss, and is referred to as a checksum, disk parity, or error correction code (ECC). The principle is the same as memory parity, where the data is guarded against the loss of a single bit of data. In RAID-5, the parity information is stored on the disk array to guard against data loss, and skewing is used to remove the bottleneck that is created by having all the parity information stored on a single drive.
Using RAID technology to provide striping of data across multiple disks often improves performance, and enhances data integrity in an environment where data is predominantly read off the disk without a subsequent update (write).
Table 2-6 summarizes the RAID performance characteristics.
Table 2-6 Summary of RAID performance characteristics
RAID level Capacity Large transfers
High I/O rate
Data availability
Single Disk Fixed (100%) Good Good
RAID-0 Excellent Very Good Very Good Poor
50 Tivoli Management Services Warehouse and Reporting

Disk arraysThe capacity of single large disks has grown rapidly, but the performance improvements have been modest, when compared to the advances made in the other subsystems that make up a computer system. The reason is that disks are mechanical devices and are affected by delays in seeks and the rotation time of the media.
In addition, disks are often among the least reliable components of the computer systems. However, the failure of a disk can result in the unrecoverable loss of vital business data or the need to restore a tape backup with consequent delays. The use of arrays of inexpensive disks can offer a solution to these concerns.
It is usual to connect several disks to a computer to increase the amount of storage. Mainframes and minicomputers have always had banks of disks. The disk subsystem is called a disk array when several disks are connected and accessed by the disk controller in predetermined patterns designed to optimize performance, reliability, or both. The driving force behind disk array technology is the observation that it is cheaper to provide a given storage capacity or data rate with several small disks connected together than with a single disk.
Split mirrorA backup always degrades the performance of the production system. Especially if the warehouse database is big or in a 24x7 hour environment, it is hard to find a time frame to plan the backup so that it does not interfere with the normal operation. To free the production system from the overhead of backup, a copy or mirror of the database can be helpful if it is available for backup, report, or other purposes.
Some intelligent storage servers such as IBM Enterprise Storage Server® (ESS) support the split mirror feature. For example, the IBM FlashCopy® is the ESS’s implementation of the split mirror feature. Split mirror means that identical and independent copies of disk volumes can be established within those storage servers. These copies can usually be established in a short time (for example, 5 seconds to 20 seconds, depending on the device).
RAID-1 Moderate (50%) Good Good Good
RAID-5 Very Good Very Good Good Good
Orthogonal RAID-5 Very Good Very Good Good Very Good
RAID level Capacity Large transfers
High I/O rate
Data availability
Chapter 2. IBM Tivoli Data Warehouse internals and deployment configurations 51

If the database resides on a storage server that supports the split mirror feature, a copy of the disk volumes can be established and assigned to another (backup) machine. On the backup machine, the (backup) database can then be accessed exclusively for backup or other purposes without reference to users. You can use split mirror to establish an identical and independent copy of a disk volume. The source and target volumes must reside on the storage server.
2.5 Historical data collection architecture
There are two types of data stores for the IBM Tivoli Monitoring 6.1 historical data component:
� Short-term data� Long-term data
Short-term dataShort-term data is typically referred to in IBM Tivoli Monitoring 6.1 as data that is stored in binary files and is less than 24 hours old.
In the IBM Tivoli Monitoring 6.1 architecture, short-term data can be configured to store the binary files locally on the Tivoli Enterprise Management Agent, or it can be configured to store the binary files on the Tivoli Enterprise Monitoring Server. This can be configured by a user by agent type. In both cases, the binary data is considered short term because it is only designed for 24-hour access.
Note: It is stored in partitioned data set (PDS) on IBM z/OS® systems.
52 Tivoli Management Services Warehouse and Reporting
When the short-term data is successfully loaded into the Tivoli Data Warehouse V2.1 using the Warehouse Proxy agent, it is pruned on Tivoli Enterprise Monitoring Agent or Tivoli Enterprise Monitoring Server if it is older than 24 hours. If the Warehouse Proxy agent is not configured to collect the short-term data, then a user-defined pruning job must be implemented. At the time of writing this book, and unless otherwise specified by the specific agent, the recommendation was that the location for the binary short-term data must be on the Tivoli Enterprise Monitoring Agent. The binary short-term data can never be in aggregate or summarized format regardless of whether it is stored on the Tivoli Enterprise Monitoring Agent or the Tivoli Enterprise Monitoring Server.
Long-term dataLong-term data in IBM Tivoli Monitoring 6.1 is typically referred to as data that is older than 24 hours and has been collected up to the Tivoli Data Warehouse V2.1 RDBMS using the Warehouse Proxy agent. The long-term data
Note: This short-term data can be pruned by the IRA framework (see “IRA communication framework” on page 96 for more information) when the data is stored on the Tivoli Enterprise Monitoring Agent or by the Tivoli Enterprise Monitoring Server framework when the data is stored on the Tivoli Enterprise Monitoring Server.
When history data is stored on a z/OS agent or z/OS Tivoli Enterprise Monitoring Server, the PDS facility does not handle its data the same way as the distributed products do. History data is not explicitly deleted from the PDSs based on a time interval like the distributed short-term history files. The z/OS PDS facility relies on its own set of maintenance procedures to maintain the PDS history data sets. These PDSs maintenance procedures are invoked whenever the currently active PDS is full. The procedures switch to the next available PDS, so that there will always be one remaining empty data set.
History data is deleted from the PDSs when there are no more empty data sets remaining. The last full data set is wiped out, therefore it will be the new empty data set. Thus the amount of z/OS data remaining is dependent on the size of the PDSs for that product, and the amount of data being collected.
It is not possible for multiple z/OS agents to share the same runtime environment and PDSs. Each z/OS agent instance must have its own runtime PDSs and cannot share with other agent instances. You can run many different z/OS agent products in the same run time and address space (for example, Customer Information Control System (CICS), DB2, OS390, MQ agents), but they will all have their own individual PDSs defined for their usage.
Chapter 2. IBM Tivoli Data Warehouse internals and deployment configurations 53

resides in tables in the Tivoli Data Warehouse V2.1 database. The long-term RDBMS tables contain detailed data and summarized data in the Tivoli Data Warehouse V2.1. The Summarization and Pruning agent can be configured to run every day to roll up data from the detailed level to hourly, to weekly, to monthly, to quarterly, and to yearly level. The Summarization and Pruning agent also prunes the detailed data and summarized data, as shown in Figure 2-11.
Figure 2-11 Historical data types
2.5.1 Component flows
When historical data collection is configured in IBM Tivoli Monitoring 6.1, a user can determine whether the short-term data (the binary 24-hour data) must be stored on the Tivoli Enterprise Monitoring Server or on the Tivoli Enterprise Monitoring Agent. If the data is stored on the Tivoli Enterprise Monitoring Agent, then each monitored machine stores binary files for all of the monitoring agents running on that system. At the time of writing this book, collecting historical data on the Tivoli Enterprise Monitoring Server for large-scale clients was not recommended.
In some cases, it might be necessary to collect short-term historical data on the Tivoli Enterprise Monitoring Server. Some agents require this configuration. It might also be necessary if there are firewall considerations. If the short-term historical data collection is configured to collect on the Tivoli Enterprise Monitoring Server, the binary files for all monitored machines and their agents are collected up to the Tivoli Enterprise Monitoring Server. This creates a single
54 Tivoli Management Services Warehouse and Reporting

binary file for each type of monitoring attribute group for all machines and can become a single point of failure and cause reporting queries to run for a long time.
When the Warehouse Proxy agent is installed and configured, data is loaded from the Tivoli Enterprise Monitoring Agent or Tivoli Enterprise Monitoring Server (depending on the location setting) to the Tivoli Data Warehouse V2.1 RDBMS. When data is collected to the Warehouse Proxy agent, tables are created in the Tivoli Data Warehouse V2.1 database. When the historical collection is configured, a user can specify how often to prune the detailed data. The default is seven days. After the detailed data has been loaded into the Tivoli Data Warehouse V2.1 tables, data older than 24 hours is pruned from the short-term binary files located on the Tivoli Enterprise Monitoring Agent or Tivoli Enterprise Monitoring Server. At any given time, you can have 24 hours of short-term detailed data on the Tivoli Enterprise Monitoring Agent or Tivoli Enterprise Monitoring Server and detailed tables in the Tivoli Data Warehouse RDBMS that contains the same data. When a request is made from the Tivoli Enterprise Portal (TEP) to perform a query that uses the timespan function, data is retrieved from the binary file if the timespan is less than or equal to 24 hours. A query performed from the TEP that uses a timespan greater than 24 hours retrieves data from the Tivoli Data Warehouse V2.1 tables.
Important:
� The most recent 24 hours’ worth of data comes from a binary file that is stored at the agent or at the Tivoli Enterprise Monitoring Server. Beyond 24 hours, the data is retrieved from the Tivoli Data Warehouse. The Tivoli Enterprise Portal Server determines where to get the data: Either from the agent if the data is less than 24 hours old, or from the Tivoli Data Warehouse if the data is older than 24 hours. If the query goes to an agent and retrieves a large amount of data, it can consume a large amount of CPU and memory. You can experience low system performance while a large amount of data is retrieved from the agents.
� It is also important to note that if the Warehouse Proxy agent cannot insert the data requested by the agent or the Tivoli Enterprise Portal Server, the data will be kept on the Tivoli Enterprise Monitoring Agent or on the Tivoli Enterprise Portal Server in the binary file. This means that in bad conditions the short-term history file can contain more than 24 hours of data. Also, there is no limit in the size of this file and it can grow indefinitely if the Warehouse Proxy agent keeps failing to insert the data in the database.
Chapter 2. IBM Tivoli Data Warehouse internals and deployment configurations 55

Figure 2-12 shows the flow of historical data collected when the location is stored on the Tivoli Enterprise Monitoring Agent.
Figure 2-12 Historical collection location Tivoli Enterprise Monitoring Agent
TEPS
(Hub)TEMS
TEPDesktop
TEPBrowser
OS Agent OS Agent
Application Agent
Universal Agent
This is an example of a component model where the historical data location is
configured on the TEMA.
Warehouse ProxyTDW 2.1
Summarization& Pruning
Agent
BinaryFiles
BinaryFiles
BinaryFiles
56 Tivoli Management Services Warehouse and Reporting

Figure 2-13 shows the flow of historical data that is collected when the location is stored on the Tivoli Enterprise Monitoring Server.
Figure 2-13 Tivoli Monitoring 6.1 component model (historical collection location Tivoli Enterprise Monitoring Server)
2.5.2 Data tables and attributesHistorical collection of data is based on attribute groups, which are defined as groupings of attributes within a specific IBM Tivoli Monitoring 6.1 agent. For example, the IBM Tivoli Monitoring V6.1 Monitoring Agent for Windows OS has 42 attribute groups with more than 1000 attributes. Each agent has a set of default attribute groups defined that can be configured easily for historical monitoring. Additional attribute groups can be configured, if required. There is a separate user guide for each supported IBM Tivoli Monitoring 6.1 agent that describes the agent’s attribute groups and attributes.
Note: There is one binary file per attribute group. They are also called attribute group binary files.
TEPS
(Hub)TEMS
TEPDesktop
TEPBrowser
OS Agent OS Agent
Application Agent
Universal Agent
This is an example of a component model where the historical data location is
configured on the TEMS.
Warehouse ProxyTDW 2.1
Summarization& Pruning
AgentBinaryFiles
Chapter 2. IBM Tivoli Data Warehouse internals and deployment configurations 57

Table 2-7 is an example of three IBM Tivoli Monitoring V6.1 agents and their default attribute groups.
Table 2-7 Default attribute group examples
Short-term binary tablesWhen historical data collection is turned on in IBM Tivoli Monitoring 6.1, the default attribute groups can be configured to collect historical data, as described in 3.5, “Configuring historical data collection” on page 147. After the data collection starts, the agent starts storing short-term binary tables on the Tivoli Enterprise Monitoring Agent or Tivoli Enterprise Monitoring Server, depending on the collection location that is configured. For example, Table 2-8 lists the default
Agent Default attribute group
Monitoring Agent for Windows OS � Network_Interface� NT_Processor� NT_Logical_Disk� NT_Memory� NT_Physical_Disk� NT_Server� NT_System
Monitoring Agent for UNIX® � Disk� System
Monitoring Agent for Linux � Linux_CPU � Linux_CPU_Averages� Linux_CPU_Config� Linux_Disk� Linux_Disk_IO � Linux_Disk_Usage_Trends � Linux_IO_Ext� Linux_User_Login� Linux_Network � Linux_NFS_Statistics� Linux_OS_Config � Linux_Process � Linux_RPC_Statistics� Linux_Sockets_Status� Linux_Swap_Rate � Linux_System_Statistics � Linux_VM_Stats
Monitoring Agent for DB2 � KUDDBASEGROUP00� KUDDBASEGROUP01� KUDBUFFERPOOL00� KUDINFO00� KUDTABSPACE
58 Tivoli Management Services Warehouse and Reporting

binary file table names of four agents. These are the names of the binary file tables as they are displayed on the Tivoli Enterprise Monitoring Agent or Tivoli Enterprise Monitoring Server.
Table 2-8 Short-term binary table names
Agent Binary table name
Monitoring Agent for Windows OS � NETWRKIN� NTPROCSSR� WTLOGCLDSK� WTMEMORY� WTPHYSDSK� WTSERVER� WTSYSTEM
Monitoring Agent for UNIX � UNIXDISK� UNIXOS
Monitoring Agent for Linux � LNXCPU� LNXCPUAVG � LNXCPUCON � LNXDISK � LNXDSKIO� LNXDU � LNXIOEXT� LNXLOGIN� LNXNET� LNXNFS� LNXOSCON� LNXPROC � LNXRPC� LNXSOCKS� LNXSWPRT� LNXSYS� LNXVM
Monitoring Agent for DB2 � KUD3437500� KUD3437600� KUD4177600� KUD4238000� KUDTABSPC
Note: Although Linux_Process is part of the default groups, stop it immediately after default historical group configuration, because it can collect an enormous amount of data.
Chapter 2. IBM Tivoli Data Warehouse internals and deployment configurations 59

Each short-term binary file table also has an HDR file. Every binary file table has an associated HDR file (for example, NTPROCSSR.hdr). The time stamp of the HDR file can be useful to determine the first time that data collection took place for that attribute group. The time stamp on the table name (that is, the file without the *.hdr) indicates the last time data collection occurred for that attribute group. You can use the time stamps of these files for troubleshooting purposes.
The short-term binary tables are not accessed directly by a user. The binary tables are only accessed from the TEP for queries of data less than 24 hours. The binary tables are also in a proprietary format. Although the tables cannot be accessed directly, it can be helpful to know the names of the tables to determine whether short-term historical data is being collected. It is also helpful for troubleshooting. You can find the short-term binary files in the default IBM Tivoli Monitoring 6.1 installation directory. For example:
� For Windows:
<ITM Install dir>\tmaitm6\logs
� For a Linux agent on a Linux platform:
<ITM Install dir>/<platform abbreviation>/<product code>/hist
<platform abbreviation> can be li6263 for Linux and <product code> is lz
� For a UNIX agent on an AIX platform:
<ITM Install dir>/<platform abbreviation>/<product code>/hist
<platform abbreviation> can be aix513 for AIX and <product code> is ux
� For a DB2 agent on an AIX platform:
<ITM Install dir>/<platform abbreviation>/<product code>/hist
<platform abbreviation> can be aix513 for AIX and <product code> is ud
Long-term RDBMS tablesAt the core of the Tivoli Data Warehouse V2.1 is a single RDBMS database. Version 2.1 supported databases are provided in 2.1.1, “Tivoli Data Warehouse Version 2.1 supported platforms” on page 22. When an attribute group is configured and has started historical collection of data, a set of tables is created in the Tivoli Data Warehouse: One detailed table and multiple summarization tables for each attribute group.
Note: The platform abbreviation varies based on product and platform support (such as between 32-bit and 64-bit).
60 Tivoli Management Services Warehouse and Reporting

For example, if yearly, quarterly, monthly, weekly, daily, and hourly summarization are turned on for the NT_Memory attribute group, the following tables are created in the Tivoli Data Warehouse:
“NT_Memory” The detailed historical table for NT_Memory“NT_Memory_H” The summarized hourly historical table for NT_Memory“NT_Memory_D” The summarized daily historical table for NT_Memory“NT_Memory_W” The summarized weekly historical table for NT_Memory“NT_Memory_M” The summarized monthly historical table for NT_Memory“NT_Memory_Q” The summarized quarterly historical table for NT_Memory“NT_Memory_Y” The summarized yearly historical table for NT_Memory
Note: Do not forget that for raw tables to be created in the Tivoli Data Warehouse, Warehouse Proxy agent has to be installed, configured, and running successfully. Similarly for the summarization tables, the Summarization and Pruning agent has to be installed, configured, running, and scheduled. It is important to understand the division of labor of each of the warehousing components, especially when it comes to troubleshooting.
Note: All Tivoli Data Warehouse V2.1 table names are created with quotation marks for the table name. When referencing historical data in the Tivoli Data Warehouse database, you must use quotation marks to ensure correct access to that data.
Chapter 2. IBM Tivoli Data Warehouse internals and deployment configurations 61

Figure 2-14 shows a list of the NT_Memory tables in the Tivoli Data Warehouse as seen from the DB2 8.2 Control Center.
Figure 2-14 Example of NT_Memory detail and summarization tables
Some attribute groups collect data for single-instance attributes, and some attribute groups collect attributes for multiple-instance attributes. The NT_Memory attribute group is an example of a single-instance attribute group. The NT_Memory detailed table has only one row per collection interval. The Monitoring Agent for UNIX attribute group for disk monitoring creates a table called Disk. The Disk attribute group collects data for UNIX file systems and is a good example of a multiple-instance attribute group. The Disk detailed table has multiple rows per collection interval, with a row for each file system found on the specific agent.
62 Tivoli Management Services Warehouse and Reporting

Figure 2-15 shows an example of the UNIX Disk attribute group with collected data in the Tivoli Data Warehouse. Note that the 1050929094542000 time stamp has eleven file systems for that one collection (cycle).
Figure 2-15 UNIX Disk table (multiple-instance) example
Example 2-3 on page 69 shows a detailed list of the Tivoli Data Warehouse V2.1 table names and instance types.
Note: When an attribute group is configured and collection is started, all of the definitions for that attribute group are common for all agents. In IBM Tivoli Monitoring 6.1, you cannot filter historical collection by agents or groups of agents. For example, if the NT_Memory attribute group is configured to collect historical data, then all Windows OS Agents collect this attribute group. You cannot exclude certain machines or groups of machines for historical collection. Furthermore, all summarization and pruning definitions are in effect for all agents that the attribute group applies to. In other words, if NT_Memory is configured to keep seven days of detailed data, there will be seven days of detailed data for all Windows machines that have the Windows OS Agent deployed.
Chapter 2. IBM Tivoli Data Warehouse internals and deployment configurations 63

Detailed tablesAll of the detailed tables are based on a row-based schema. Each attribute group that has historical data collection turned on creates its own unique table and unique columns. Attribute values in the detailed tables store the raw values. Figure 2-15 on page 63 shows an example of the UNIX Disk table and some of the detailed values that are stored. All of the attribute groups and attributes are discussed in the IBM Tivoli Monitoring 6.1 specific agent monitoring guides. However, as we mentioned previously, there is no consistent documentation describing the table schemas that are available with IBM Tivoli Monitoring 6.1. One of the ways to get more information about tables and columns is discussed in 2.5.3, “Object definitions” on page 69.
Most of the columns in the detailed tables are unique according to their specific attribute group. However, three common columns are important to know to understand the Tivoli Data Warehouse V2.1 architecture. They are also useful for generating reports. These columns are:
� TMZDIFF
The TMZDIFF is the difference between the time zone where the agent is installed and the Universal Time (GMT). This value is shown in seconds, if the data is collected at the agent.
� WRITETIME
This is the time the record was written in the binary file. The format of this time stamp is a 16-character value in the format cyymmddhhmmssttt, where:
– c = century– yymmdd = year, month, day– hhmmssttt = hours, minutes, seconds, milliseconds
� Timestamp
This the date and time that the agent collects information as set on the monitored system. The format of this time stamp is the same 16-character value (cyymmddhhmmssttt) used for WRITETIME.
The origin node field is another field that you must consider when working with the Tivoli Data Warehouse V2.1 architecture. The origin node is typically the host name of the resource and is different depending on the agent type.
Agents typically use general guidelines for the origin node field, but some agents do not follow these guidelines. In general, the origin node is constructed as follows (the origin node might be of this form: instance:hostname:type)
� instance is optional.
� The delimiter usually is a colon.
64 Tivoli Management Services Warehouse and Reporting

� hostname is the machine name, but it can also be a broker name (in case of MQ Series, for instance).
� type is the node type or product such as KNT for the Windows agent, KUX for the UNIX agent, and so on.
Here are some examples:
� Monitoring Agent for Windows OS: The attribute for the monitored server name is Server_Name. For example:
Primary:CAIRO:NT
� Monitoring Agent for UNIX OS: The attribute for the monitored server name is Server_Name. For example:
istanbul.itsc.austin.ibm.com:KUX
� Monitoring Agent for Linux OS: The attribute for the monitored server name is Server_Name. For example:
istanbul.itsc.austin.ibm.com:LZ
� Monitoring Agent for DB2: The attribute for the monitored server name is Server_Name. For example:
DB2:KLLAA9B:UD
Summarized tablesIf summarization is configured for an attribute group, then additional tables that include summarized data are created in the Tivoli Data Warehouse. Summarization is the process of aggregating the detailed data into time-based categories, for example, hourly, daily, weekly, quarterly, and yearly based on the aggregation parameters. Summarizing data enables you to perform historical analysis of the data over time. Along with summarization parameters, pruning definitions can also be defined. The Summarization and Pruning agent creates the summarized tables and performs the pruning process to remove old data.
The Summarization and Pruning agent can be configured to run a summarization and running process once a day. When the Summarization and Pruning agent process (for example, ksy610.exe on Windows) is started, it runs as a process on the system OS (Windows, UNIX, or Linux). This process sleeps and wakes up every 5 minutes to check whether the summarization and pruning run has been scheduled to kick off. (The default schedule is once per day at 02:00 a.m.) If the summarization and pruning is scheduled to run within this 5 minute interval, then it will start the Summarization and Pruning agent scheduled run against the Tivoli Data Warehouse V2.1 database. The summarization portion of the run is a rollup process that aggregates data from the detailed tables to the specific summarization time-based tables (hourly, daily, weekly, quarterly, and yearly). The pruning portion of the run removes data from the detailed and summary
Chapter 2. IBM Tivoli Data Warehouse internals and deployment configurations 65

tables based on the configured pruning parameters. The default pruning parameters are as follows:
� Seven days of detailed data� Ninety days of hourly data� Twelve months of daily data� Two years of weekly data� Three years of monthly data� Three years of yearly data
The names of the summarization tables are the same as the detailed table name with an additional one-character identifier. Depending on the summarization interval that is chosen for the particular attribute group, the additional tables are created in the Tivoli Data Warehouse.
Important: You can run only one Summarization and Pruning agent per Tivoli Data Warehouse, even if you have multiple Tivoli Enterprise Monitoring Servers that are sharing a single Tivoli Data Warehouse database. Running multiple Summarization and Pruning agents causes conflicts, because the multiple instances attempt to prune the data in the tables simultaneously. The negative impact is that the configuration settings for the summarization and pruning periods have to be set only in one Tivoli Enterprise Monitoring Server; this monitoring server controls how the data is summarized and pruned for all monitoring servers.
Note: If a column or table name exceeds the RDBMS name length, the Tivoli Data Warehouse creates an internal column (or table) name and stores the internal name and original attribute name in a table called WAREHOUSEID. This table is also called Tivoli Enterprise Monitoring data dictionary. You can query this table to determine the correct attribute name for a table or a column name that has been internally converted. The name length limits are as follows for each RDBMS supported:
� DB2
Table name = 30 characters
Column name = 128 characters
� Oracle
Table name = 30 characters
Column name = 30 characters
� SQL Server
Table name = 128 characters
Column name = 128 characters
66 Tivoli Management Services Warehouse and Reporting

Table 2-9 shows a Linux CPU tables example.
Table 2-9 Linux CPU tables example
The attributes in the summarized tables are stored in separate tables than the detailed table attributes. When the attributes are aggregated in the summarized tables, a separate column is created for each summarization that is performed.
Eight aggregation behavior characterization types are used for aggregation; the following five types are used most often.
Behavior characterization typesThis sections describes the five behavior characterization types that are used most often.
� GAUGE
These attributes are range-based numeric data. They are aggregated with MIN, MAX, AVG, and SUM values from the detailed data to the appropriate summarization period. There are four attributes in the summarized table for each detailed attribute definition in the detailed table. The original attribute name is prefixed with MIN_, MAX_, AVG_, and SUM_. For example the Linux_CPU_D table has the following attributes for the System_CPU attribute:
– MIN_System_CPU– MAX_System_CPU– AVG_System_CPU– SUM_System_CPU
� COUNT
These attributes have increasing numeric values with occasional resets (for example, counts of x since ….). They are aggregated with TOTAL, HIGH, LOW, and LATEST values from the detailed data to the appropriate
Timespan Example
Detail Linux_CPU
Hourly Linux_CPU_H
Daily Linux_CPU_D
Weekly Linux_CPU_W
Monthly Linux_CPU_M
Quaterly Linux_CPU_Q
Yearly Linux_CPU_Y
Chapter 2. IBM Tivoli Data Warehouse internals and deployment configurations 67

summarization period. There are four attributes in the summarized table using the original attribute name prefixed with TOT_, HI_, LOW_ , and LAT_. For example, the Linux_System_Statistics_H table has the following attributes for the System_Uptime attribute:
– TOT_System_Uptime– HI_System_Uptime– LOW_System_Uptime– LAT_System_Uptime
Count type attributes use delta-based aggregation. Delta-based aggregation algorithms calculate the delta between two intervals and use that number as the stored value. For example, if you have an attribute that is the total amount of cache hits since the system has been started, then a delta-based calculation computes the difference between each cycle interval. At the end of the summarization period, it totals all deltas, stores the high value, stores the low value, and stores the last value recorded. For more details about delta-based summarization, see IBM Tivoli Monitoring Administering Tivoli Monitoring Guide, SC32-9408.
� PROPERTY
These attributes rarely change (for example, total amount of memory or CPU speed). There is one attribute in the summarized table that uses the original attribute name prefixed with just LAT_. For example, the Linux_VM_Stats_Q (Memory) table has the Total_Swap_Space attribute: LAT_Total_Swap_Space
� PEAK
These attributes are high watermarks or snapshot-based. There is one attribute in the summarized table that uses the original attribute name prefixed with just MAX_. For example the Linux_Swap_Rate_Y table has the Peak_Swap_Space_Used attribute: MAX_Peak_Swap_Space_Used
� LOW
These attributes are low watermarks or snapshot-based. There is one attribute in the summarized table that uses the original attribute name prefixed with just MIN_. For example the Linux_Swap_Rate_Y table has the Low_Free_Memory attribute: MIN_Low_Free_Memory
The other three types, which are rarely used, are:
� SAMPLECOUNT
These attributes are used to calculate the number of intervals that are sampled to get an average. There is one attribute in the summarized table that uses the original attribute name prefixed with just SUM.
68 Tivoli Management Services Warehouse and Reporting

� PDEL
These attributes are deltas precalculated by the application (change over a period of time). These attributes are aggregated with MIN, MAX, and SUM values.
� STATE
These attributes are not used at this time. Generally, this is an enumeration list of options referring to the condition of a resource (for example, up, down).
For more information about the Tivoli Summarization and Pruning agent, see 2.10, “Tivoli Summarization and Pruning agent” on page 103.
2.5.3 Object definitions
In IBM Tivoli Monitoring 6.1, all attribute groups and attributes are defined as object definitions in files called Object Definition Interchange (ODI) files. You can obtain most of the Tivoli Data Warehouse V2.1 schema information by knowing how to interpret the ODI files. You can find the ODI files on the Tivoli Enterprise Portal Server in the default IBM Tivoli Monitoring 6.1 installation directory (for example, c:\IBM\ITM\CNPS). The naming format of the ODI files is docnnn, where nnn is the product identifier.
For example:
� docknt: The ODI file for Windows OS agent� dockux: The ODI file for UNIX OS agent� docklz: The ODI file for Linux OS agent� dockud: The ODI file for DB2 agent
Example 2-3 shows selected parameters from a Windows docknt ODI file.
Example 2-3 docknt ODI file example
*TABLE: WTSYSTEM*OBJECT: NT_System*OCCURS: Single*OPGRP: COM, CONF*NLSID: KNT0000*INDEX: IRAKEY USERNAME OSTYPE VERSION*INDEX: IRAKEY NETADDRESS NUMOFPRCSR PRCSSRTYPE PAGESIZE PCTTLPRIVT*INDEX: IRAKEY PCTTLPCSRT PCTTLUSERT CTXSWITCH FLECTLBYT FLECTLOP*INDEX: IRAKEY FLEDATOP FLEREADBTS FLEREADOP FLEWRTEBTS FLEWRTEOP*INDEX: IRAKEY PRCQUELNG SYSCALLSEC SYSUPTIME TTLINTSEC ALIFIXRATE*INDEX: IRAKEY EXCDISRATE FLOATERATE *FILE: VSAM.WTSYSTEM*REM: System Object
Chapter 2. IBM Tivoli Data Warehouse internals and deployment configurations 69

*REM: Index: 002The System object type includes those counters that apply to allprocessors on the computer collectively. These counters represent theactivity of all processors on the computer.
*ATTR: Processor_Type*CAPTION:Processor\Type*COLUMN: PRCSSRTYPE*TYPE: I,4*BEHAV: PROPERTY*NLSID: KNT0020The type of the processors on the pc.
*ATTR: %_Total_User_Time*CAPTION:%_Total\User_Time*COLUMN: PCTTLUSERT*TYPE: I,4*BEHAV: GAUGE*RANGE: 0-100*ENUM: Unknown=-1*NLSID: KNT0028The % Total User Time is the average percentage ...
*ATTR: System_Up_Time*CAPTION: System Up Time (Seconds)*COLUMN: SYSUPTIME*PRINTF: "%u"*TYPE: I,4*BEHAV: COUNT*NLSID: KNT0050Total Time (in seconds) that the computer has been operational sinceit was last started.
The ODI files contain a lot of information about IBM Tivoli Monitoring 6.1 objects. In this chapter, we describe only ODI files for the purposes of obtaining information about the Tivoli Data Warehouse V2.1 schema. Therefore, we focus on only the following ODI keywords:
� *TABLE
Every attribute group is uniquely identified by a *TABLE: keyword in an ODI file. In this example, WTSYSTEM identifies the short-term binary file table name for the Windows OS agent. After each *TABLE: keyword are multiple *ATTR: keywords (one for each attribute defined in that table).
70 Tivoli Management Services Warehouse and Reporting

� *OBJECT
The *OBJECT: keyword identifies the long-term RDBMS table name. If the table name exceeds the RDBM name limit, an internal name is used in the RDBMS and the real name is in the WAREHOUSEID table.
� *ATTR
The *ATTR: keyword identifies the column names used in the RDBMS tables. If the column name exceeds the RDBM name limit, an internal name is used in the RDBMS and the real name is in the WAREHOUSEID table.
� *COLUMN
The *COLUMN keyword identifies the short name used when the value for *ATTR exceeds the limit for the database for column name.
� *TYPE
The *TYPE: keyword can be used to determine how the column is stored in the RDBMS. It does not describe the DDL, but it can give an idea of whether the column is, for example, a string or an integer.
� *BEHAV
The *BEHAV: keyword describes the aggregation algorithm used for summarization and pruning. See “Behavior characterization types” on page 67.
2.6 Storage considerations for Tivoli Data Warehouse Version 2.1
A monitoring agent’s set of attribute groups characterizes the information that it monitors. An attribute group can be thought of as a schema for a data table generated by its monitoring agent. Each attribute group contains several attributes that comprise the columns of this schema. If historical data collection is configured for a specific attribute group, an agent generates a row of data for every monitored instance at every collection interval.
Chapter 2. IBM Tivoli Data Warehouse internals and deployment configurations 71
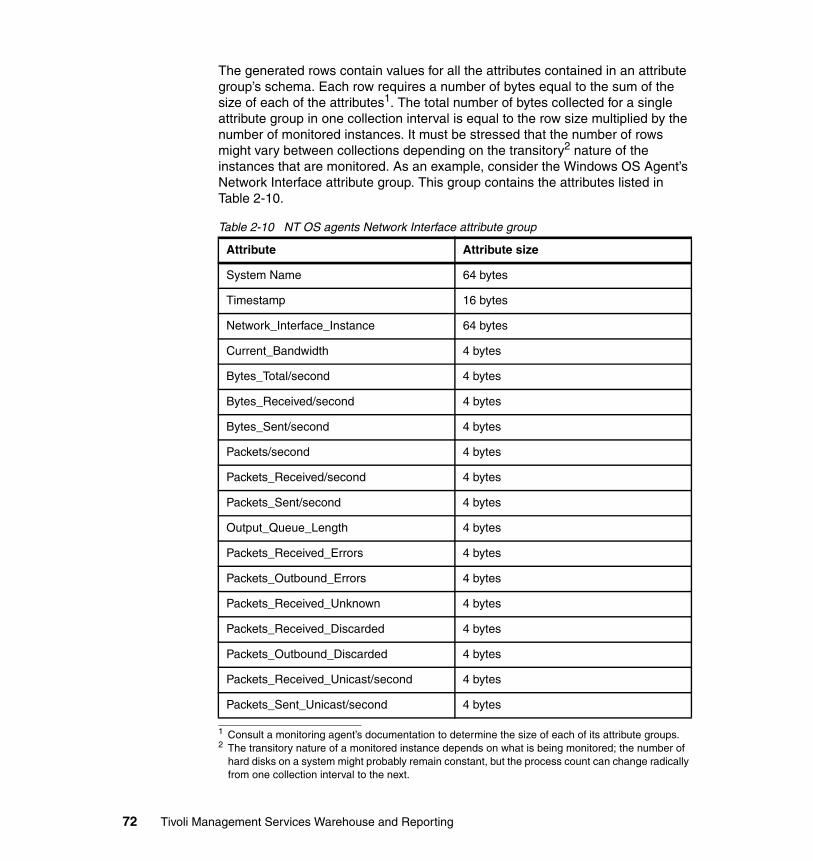
The generated rows contain values for all the attributes contained in an attribute group’s schema. Each row requires a number of bytes equal to the sum of the size of each of the attributes1. The total number of bytes collected for a single attribute group in one collection interval is equal to the row size multiplied by the number of monitored instances. It must be stressed that the number of rows might vary between collections depending on the transitory2 nature of the instances that are monitored. As an example, consider the Windows OS Agent’s Network Interface attribute group. This group contains the attributes listed in Table 2-10.
Table 2-10 NT OS agents Network Interface attribute group
1 Consult a monitoring agent’s documentation to determine the size of each of its attribute groups.2 The transitory nature of a monitored instance depends on what is being monitored; the number of
hard disks on a system might probably remain constant, but the process count can change radically from one collection interval to the next.
Attribute Attribute size
System Name 64 bytes
Timestamp 16 bytes
Network_Interface_Instance 64 bytes
Current_Bandwidth 4 bytes
Bytes_Total/second 4 bytes
Bytes_Received/second 4 bytes
Bytes_Sent/second 4 bytes
Packets/second 4 bytes
Packets_Received/second 4 bytes
Packets_Sent/second 4 bytes
Output_Queue_Length 4 bytes
Packets_Received_Errors 4 bytes
Packets_Outbound_Errors 4 bytes
Packets_Received_Unknown 4 bytes
Packets_Received_Discarded 4 bytes
Packets_Outbound_Discarded 4 bytes
Packets_Received_Unicast/second 4 bytes
Packets_Sent_Unicast/second 4 bytes
72 Tivoli Management Services Warehouse and Reporting
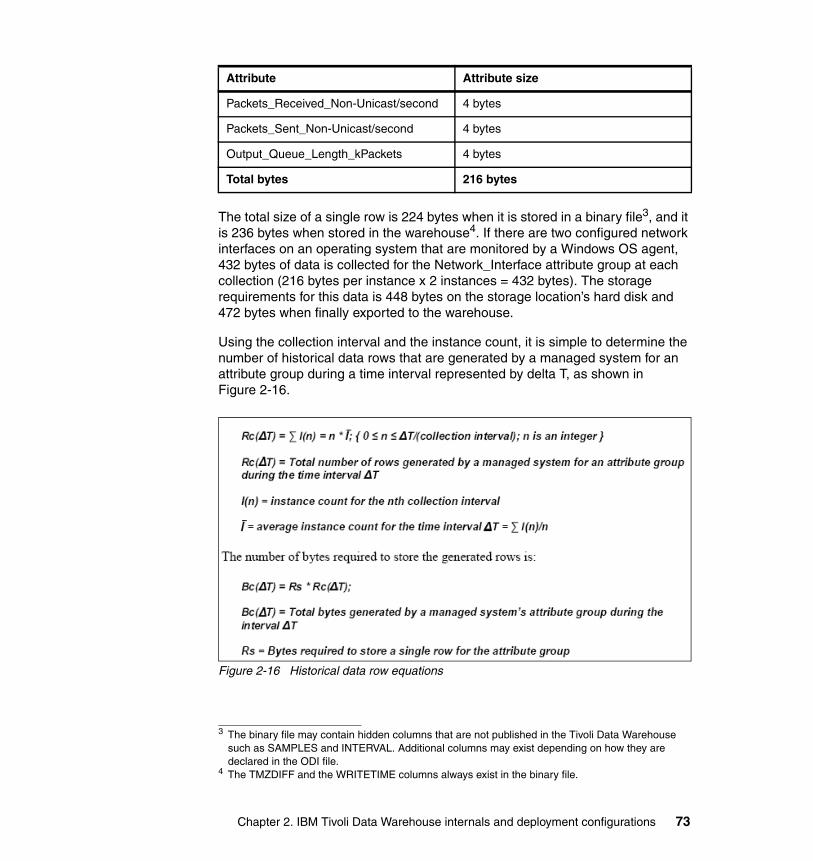
The total size of a single row is 224 bytes when it is stored in a binary file3, and it is 236 bytes when stored in the warehouse4. If there are two configured network interfaces on an operating system that are monitored by a Windows OS agent, 432 bytes of data is collected for the Network_Interface attribute group at each collection (216 bytes per instance x 2 instances = 432 bytes). The storage requirements for this data is 448 bytes on the storage location’s hard disk and 472 bytes when finally exported to the warehouse.
Using the collection interval and the instance count, it is simple to determine the number of historical data rows that are generated by a managed system for an attribute group during a time interval represented by delta T, as shown in Figure 2-16.
Figure 2-16 Historical data row equations
Packets_Received_Non-Unicast/second 4 bytes
Packets_Sent_Non-Unicast/second 4 bytes
Output_Queue_Length_kPackets 4 bytes
Total bytes 216 bytes
3 The binary file may contain hidden columns that are not published in the Tivoli Data Warehouse such as SAMPLES and INTERVAL. Additional columns may exist depending on how they are declared in the ODI file.
4 The TMZDIFF and the WRITETIME columns always exist in the binary file.
Attribute Attribute size
Chapter 2. IBM Tivoli Data Warehouse internals and deployment configurations 73

Use the equations in Figure 2-16 to make estimates of the disk space that is required for historical data on a host with one or more managed systems installed. You can even make projections of the disk space required by a Tivoli Data Warehouse serving an entire IBM Tivoli Monitoring V6.1 installation. You have to calculate the space requirements of every host in the environment, taking into account each configured attribute group associated with every managed system installed on the host. This process is complex and time consuming for all but the most trivial environments. However, Tivoli provides two estimation tools that can greatly simplify this task.
First, the IBM Tivoli Monitoring Installation and Setup Guide, GC32-9407, contains a worksheet5, which is based on the equations presented in Figure 2-16. To use the standard worksheet to produce an estimate requires that you refer to the User’s Guides6 of each agent type for attribute group row lengths and estimations on the number of instances during a normal collection interval. This can be tedious for complex environments containing several different types of monitoring agents.
The IBM Tivoli Monitoring V6.1/Tivoli Data Warehouse 2.1 Warehouse Load Projections spreadsheet7 provides a more comprehensive solution than the standard worksheet available in the installation guide. This spreadsheet was created to simplify the task of producing space requirement estimates for a data warehouse. It includes attribute group information for over 50 different agent types, and the user can use it to perform “what-if” exercises to see the effect of different historical data collection and configuration options. See 2.7, “Tivoli Data Warehouse Version 2.1 load projection spreadsheet” on page 77, for a more detailed explanation of this tool.
Estimating storage requirementsEstimating storage requirements on the storage locations and in the data warehouse is a prerequisite before you configure historical data collection in any IBM Tivoli Monitoring V6.1 environment. This is especially critical for large-scale environments, where even low-intensity warehousing configurations can generate huge amounts of data. Additionally, determine an appropriate
Note: For more information about historical data row equations, see IBM Tivoli Monitoring Installation and Setup Guide, GC32-9407.
5 The worksheet is on page 34 of the IBM Tivoli Monitoring Installation and Setup Guide, GC32-9407.
6 You can find the User’s Guides at:http://publib.boulder.ibm.com/infocenter/tivihelp/v15r1/index.jsp?toc=/com.ibm.itm.doc/toc.xml
7 The IBM Tivoli Monitoring 6.1/Tivoli Data Warehouse 2.1 Warehouse Load Projections spreadsheet is available from the Open Process Automation Library (OPAL) Web site.
74 Tivoli Management Services Warehouse and Reporting

summarization and pruning strategy to ensure that the warehouse database tables do not outgrow the storage limitations imposed by the database’s host.
Use the IBM Tivoli Monitoring 6.1/Tivoli Data Warehouse 2.1 Warehouse Load Projections spreadsheet to determine the following quantities at the storage locations:
� Number of instance rows generated during a warehouse interval per attribute group
� Maximum amount of short-term data that is stored at the storage location
The first quantity, the number of generated instance rows, determines the number of data exports that is required to upload the historical data to the data warehouse from a particular storage location.
The next quantity determines the disk space requirements of the storage location for storing short-term data. Remember that short-term data includes data that is generated during the warehousing interval before it is uploaded to the data warehouse; if the warehousing interval is 1 hour, there can be up to 25 hours of short-term data on the storage location. Up to 48 hours of short-term data can be on the storage location if the warehousing interval is 24 hours.
You can also use the IBM Tivoli Monitoring 6.1/Tivoli Data Warehouse 2.1 Warehouse Load Projections spreadsheet to determine the growth rate of the warehouse and its average size. The spreadsheet provides a summary page with the following quantities:
� Total megabytes (MB) of new data that is inserted into the warehouse per hour� Total gigabytes (GB) of new data that is inserted into the warehouse per day� Total gigabytes of data retained in the warehouse
The last quantity assumes that a sufficient summarization and pruning strategy is implemented, otherwise the warehouse grows until the database is full.
As an example, consider a large-scale IBM Tivoli Monitoring V6.1 environment that consists of 10,000 monitoring systems, 5000 Windows OS agents, 2500 Linux OS agents, and 2500 UNIX OS agents. Historical data collection is configured for each of the attribute groups that are shown in Table 2-11.
Note: Note that if the Warehouse Proxy agent does not successfully insert the data in the Tivoli Data Warehouse database, the short-term binary file continues to grow and might contain more than 48 hours of data.
Chapter 2. IBM Tivoli Data Warehouse internals and deployment configurations 75

Table 2-11 Configured historical attribute groups
Using the IBM Tivoli Monitoring 6.1/Tivoli Data Warehouse 2.1 Warehouse Load Projections spreadsheet and assuming a collection interval of 15 minutes for all attributes and a warehousing interval of 1 hour, you obtain the following load estimations:
� 390,000 total record inserts per hour� 134.5 MB of new data per hour� 3.2 GB of new data per day� 224.3 GB of data in the warehouse
The last metric assumes that detailed data is kept for all metrics for 7 days and that the default settings for hourly, daily, weekly and monthly summarized data are set. The disk requirements on each agent are:
� 300 KB on Windows� 400 KB on UNIX� 200 KB on Linux
Because the volume of data in the warehouse is large, if TEP client users have to access the warehouse data often, it might be a good idea to think about using data marts.
A data mart is a repository that contains data that is specific to a particular business group in an enterprise. All data in a data mart derives from the data warehouse, and all data relates directly to the enterprise-wide data model. Often, data marts contain summarized or aggregated data that the user community can easily consume. Basically, it is a subset of the data from the data warehouse. It is usually summarized or aggregated that is ready for the user to consume because a data mart is often defined by the user of the data.
Another way to differentiate a data warehouse from a data mart is to look at the consumers and format of the data. IT analysts and canned reporting utilities consume warehouse data, whose storage is usually coded and cryptic. The user community consumes data mart data, whose storage is usually in a more
Windows OS agents Linux OS agents UNIX OS agents
� Network Interface� NT_Logical_Disk� NT_Memory� NT_Physical_Disk� NT_Processor� NT_Server� NT_System
� Linux_CPU� Linux_CPU_Averages� Linux_CPU_Config� Linux_Disk� Linux_Disk_IO� Linux_Disk_Usage_Trends� Linux_IO_Ext� Linux_Network� Linux_System_Statistics
� Disk� Disk_Performance� Network� SMP_CPU� System
76 Tivoli Management Services Warehouse and Reporting

readable format. For example, to reduce the need for complex queries and assist business users who might not be familiar with SQL, data tables can contain the denormalized code table values.
A data mart contains a subset of corporate data that is of value to a specific business unit, department, or set of users. This subset consists of historical, summarized, and possibly detailed data that is captured from transaction processing systems or from an enterprise data warehouse. It is important to realize that a data mart is defined by the functional scope of its users, and not by the size of the data mart database.
2.7 Tivoli Data Warehouse Version 2.1 load projection spreadsheet
The IBM Tivoli Monitoring Installation and Setup Guide, GC32-9407 contains information about how to estimate the disk space requirements for the Tivoli Data Warehouse. To perform the steps required to produce an estimate, the user has has to refer to the User’s Guides for each agent type to be used in the configuration for attribute group row lengths, and for information about how to estimate the number of rows that can be generated at each data collection interval.
The IBM Tivoli Monitoring 6.1/Tivoli Data Warehouse 2.1 Warehouse Load Projections spreadsheet was created to simplify the task of producing a disk space estimate for the Tivoli Data Warehouse. This spreadsheet includes the attribute group information for over 50 different agent types, and the user can use it to perform “what-if” exercises to see the effect of different historical data collection configuration options. The spreadsheet includes two predefined charts showing the contribution of each agent type to the total Tivoli Data Warehouse disk space estimate. Because it is implemented in a standard spreadsheet format, other charts can be generated easily.
The total data size estimate that is given in the Summary worksheet (“Total GB of data in TDW (based on retention settings)”) must be comparable to the one produced by performing Steps 1 through 5 of the section “Estimating the required size of your database” of IBM Tivoli Monitoring Installation and Setup Guide, GC32-9407. The instructions in this manual recommend that you increase this value by 50% to accommodate uncertainty, and then compare this number to the
Note: For more information about data marts and an example scenario on how to use them in a Tivoli Data Warehouse environment, see 4.1, “Using data marts” on page 235.
Chapter 2. IBM Tivoli Data Warehouse internals and deployment configurations 77

Database data row in Table 8 on page 35 to determine the number of disks that you require for your database.
Consider the projections produced by this spreadsheet as rough estimates, but they are useful in making configuration planning decisions and in performing sensitivity analysis and what-if exercises. The disk storage required for a given monitoring configuration depends on complex interrelationships among many variables, not all of which have been, or can be, modeled. It is the responsibility of the user to validate the spreadsheet inputs and outputs.
2.7.1 How the spreadsheet works
The spreadsheet is made up of several dozen worksheets. For all of the worksheets within the spreadsheet, input cells are shown with a green background. Cells showing calculations based on the input parameters are shown with a yellow background.
The spreadsheet consists of the following worksheets:
� The ReadMe worksheet describes the model and the limitations of its use.
� The BarGraph worksheet shows a bar graph of the amount of detailed and aggregate data projected for the Tivoli Data Warehouse, based on the agent usage parameters specified in other worksheets.
� The PieGraph worksheet shows the same data as the BarGraph worksheet, except in a pie graph.
� The Summary worksheet is the main worksheet, showing a list of agent types (both distributed and IBM z/OS-based). The user enters the estimated count of agents (or managed systems) for each agent type in the green cells. The yellow cells show summary calculations based on input parameters on this and other worksheets.
� There is a separate agent worksheet for each agent type listed on the Summary worksheet (Windows, UNIX, Linux, and so on). There are more than 50 separate agent worksheets.
To move from one worksheet to another, click one of the tabs at the bottom of the spreadsheet, as shown in Figure 2-17. Use the arrow buttons on the bottom left corner to scroll through the different worksheets.
Figure 2-17 Load projection spreadsheet worksheets
78 Tivoli Management Services Warehouse and Reporting

Typical usage scenarioIn a typical usage scenario, the user opens the Summary worksheet. For each agent type to be monitored in the configuration, the user enters the expected number of agents on the Summary worksheet, and then switches to the corresponding agent worksheet to specify more details about what must be monitored for agents of that type.
For example, if a configuration contains 100 UNIX agents to be monitored, the user enters 100 for the UNIX count, as shown in Figure 2-18.
Figure 2-18 Load projection spreadsheet summary page example
The user switches to the UNIX worksheet to specify more details about the historical data collection configuration. After the user specifies input parameters for each agent type to be used in the monitoring configuration, the Summary worksheet contains the total disk space estimate for data to be stored in the warehouse.
Usage notesBecause the spreadsheet includes attribute group information for a large number of agent types, the bar and pie charts contain many agent types that are not being used. To remove these unused agent types from the graphs, you can hide the rows for the unused agent types in the Summary worksheet. To hide a row, click the row number at the left of the row to select it, then right-click and select Hide from the pop-up menu. You can hide multiple rows in one operation by using the Ctrl and Shift keys when selecting the rows. To show rows that are hidden, select the rows before and after the hidden rows, right-click and select Unhide from the pop-up menu.
Chapter 2. IBM Tivoli Data Warehouse internals and deployment configurations 79

Figure 2-19 is an example of the BarGraph with the unused agent types included.
Figure 2-19 Load projection spreadsheet bar graph example with unused agent types
80 Tivoli Management Services Warehouse and Reporting

With the unused agent types hidden, the graph is much more legible, as shown Figure 2-20.
Figure 2-20 Load projection spreadsheet bar graph example with only used agents
2.7.2 Details for the agent worksheets
For each agent type shown on the Summary worksheet, there is a separate worksheet that lists the attribute groups that are eligible for historical data collection and warehousing.
Note: For some agent types, such as the CICS agent, multiple instances (for example, CICS regions) are monitored as managed systems using sub-nodes. For these agents, specify the number of managed systems for the Count value on the Summary worksheet.
Chapter 2. IBM Tivoli Data Warehouse internals and deployment configurations 81

Figure 2-21 shows the UNIX agent worksheet.
Figure 2-21 UNIX agent worksheet example
The first line of the agent worksheet lists the agent name, the release number reflected in the spreadsheet, and the product code. The next eight lines contain summary calculations for the agent. The first of these, “Number of agents (from Summary worksheet)”, is a cell reference to the Summary worksheet cell, where the user entered the number of agents of that type to be monitored. The remaining summary statistics are discussed in the following sections.
Attribute group input parametersBeneath the summary calculations is a table that contains the agent attribute groups that are eligible for historical data collection.
� The first column shows the attribute group name, which corresponds to the table name used in the Tivoli Data Warehouse. Attribute groups that are part of the “default group” for historical data collection are shown in Bold. The default group is not enabled by default, but if the user selects “Show Default Groups” from the TEP Historical Data Collection Configuration Panel, these attribute groups are displayed.
82 Tivoli Management Services Warehouse and Reporting

� The second column “Collection Interval” is an input column. For attribute groups to be collected, the user must specify the data collection interval in minutes. Valid values are 5, 15, 30, or 60. If the data collection interval is not specified, the attribute group is not included in any summary calculations.
� The third column “Average Rows / Interval” is used to specify the number of rows the user expects to have logged per data collection interval. Some attribute groups (such as UNIX System and UNIX Network) only log one record per interval. Other attribute groups can log multiple records per interval. For attribute groups that only write one row per interval, the cell in this column contains the value “1” and it does not have a green background.
� The fourth column “Expected number of instances/rows” contains information from the agent documentation (if available) that can be helpful in determining how many rows to expect for a given attribute group. The fourth column is “help” information that is used in specifying values for the third column.
� The fifth column is used to specify how many days of detailed data is kept in the warehouse for this attribute group. This assumes that the user has the Summarization and Pruning agent or some other mechanism in place to remove old data from the warehouse.
� For agents that exploit the capabilities of the Summarization and Pruning agent, the next six columns are used to specify how many aggregate records are kept in the warehouse for the attribute group. The columns are for Hourly, Daily, Weekly, Monthly, Quarterly, and Yearly records. Tables for these aggregation periods are created by the Summarization and Pruning agent, based on specified configuration parameters.
– For example, to represent a two-year retention of weekly records, the number of aggregate records for the Weekly table is 2 years x 52 weeks/year or 104 aggregate records.
– To represent a 60-day retention of hourly records, the number of aggregate records for the Hourly table is 60 days x 24 hours/day or 1440 aggregate records.
For agents that do not yet exploit the capabilities of the Summarization and Pruning agent, these columns are hidden.
Attribute group calculated valuesThe remainder of the columns and cells in the agent worksheets represent calculated values based on the input parameters given in the green cells. Several columns are displayed to the right of the green input parameters for the attribute groups, as shown in Figure 2-22.
Chapter 2. IBM Tivoli Data Warehouse internals and deployment configurations 83

Figure 2-22 Load projection spreadsheet attribute group calculated values example
There is a group of columns with a yellow background that show calculated values. To the right of these columns is a group of four columns with a white background, which contains agent attribute group information. The following list describes the last four columns:
� The first column, “AgentRowSize,” shows the estimated row length in bytes for storing a row of attribute group information at the agent.
� The second column, “DetailRowSize,” shows the estimated row length in bytes for storing a row of detailed data for the attribute group in the warehouse.
� The third column, “AggRowSize,” shows the estimated row length in bytes for storing a row of aggregate data for the attribute group in the warehouse. The aggregate records are produced by the Summarization and Pruning agent. For agents that do not yet exploit the capabilities of the Summarization and Pruning agent, this column is hidden.
� The fourth column, “Agent Tablename,” shows the name of the file that is used to store short-term historical data for the attribute group at the agent. Short-term historical data has not yet been written to the warehouse, and is typically less than 24 hours old. This column is not used in any calculations, but is included for reference.
In most cases, data for these last four columns is taken from the agent User’s Guides, which you can find at:
http://publib.boulder.ibm.com/infocenter/tivihelp/v15r1/index.jsp?toc=/com.ibm.itm.doc/toc.xml
84 Tivoli Management Services Warehouse and Reporting
The columns with a yellow background contain calculations based on the input parameters (with a green background) and the attribute group row sizes (with a white background). The following list describes each of these columns:
� The “TDW inserts/hour/agent” column is calculated as:
(60 / collection interval) * average rows/interval
Dividing 60 (the number of minutes in an hour) by the collection interval in minutes gives the number of data collection intervals per hour. Multiplying this by the average rows per interval gives the average number of Tivoli Data Warehouse row inserts per hour for each agent.
� The “TDW bytes inserted/hour/agent” column is calculated by multiplying the value for the “TDW inserts/hour/agent” column by the value for the “DetailRowSize” column.
� The “Agent HDC Disk Space KB/agent” column shows an estimate of the amount of disk space (in KB) required for the short-term historical data collection for the attribute group on the agent. This is the approximate size of the file with the file name shown in the “Agent Tablename” column. This value is calculated by multiplying the value from the “TDW inserts/hour/agent” column by the “AgentRowSize” column, multiplying it by 24 (the number of hours of short-term historical data kept on the agent), and dividing it by 1024 (to convert the result from bytes to KB).
� The next column shows the estimated size in MB to keep the specified number of days of detailed data in the warehouse for this attribute group for all of the agents to be monitored. This estimate is calculated by multiplying the number of agents of this type (from the Count column on the Summary worksheet) by:
“TDW inserts/hour/agent” * “DetailRowSize” * 24 (hours/day) *Number of days of detailed data / 1024 (bytes per KB) / 1024 (KB per MB)
This calculation yields a result in MB.
� For agents that exploit the Summarization and Pruning agent, the next six columns show the size for the aggregate tables, based on the number of aggregate records for each aggregation period, and the “AggRowSize” column. A seventh column shows the total number of aggregate records for this attribute group, which is the sum of the six aggregate interval count input parameters shown with a green background.
Chapter 2. IBM Tivoli Data Warehouse internals and deployment configurations 85

Agent summary calculated valuesThe top portion of the Agent workspace (Figure 2-23) shows a set of calculated values, which are based on the attribute group calculations described in the previous section.
Figure 2-23 Load projection spreadsheet agent summary calculated values example
The following values are shown at the top of the agent worksheet:
� Number of agents (from Summary worksheet)
This cell contains a reference to the Count value that is specified on the Summary worksheet. This cell is used in the attribute group calculations in the agent worksheet.
� TDW record inserts/hour/agent
This value is the sum of the attribute group “TDW inserts/hour/agent” estimates contained further down in the agent worksheet.
� TDW KB inserted/hour/agent
This value is the sum of the attribute group “TDW bytes inserted/hour/agent” estimates contained further down in the agent worksheet.
� Agent HDC Disk Space (MB – per agent, across all attribute groups)
This value is the sum of the attribute group “Agent HDC Disk Space KB/agent” estimates, converted to MB result.
86 Tivoli Management Services Warehouse and Reporting

� TDW Disk Space – Detailed data (MB – total across all attribute groups for all agents)
This value is the sum of the attribute group detailed data disk space estimates (column O).
� TDW Disk Space – Aggregate data (MB – total across all attribute groups for all agents)
This value is the sum of the attribute group aggregate table disk space estimates (column P through U), for agent types that exploit the capabilities of the Summarization and Pruning agent.
� Average size for detailed records (bytes)
This value is calculated by multiplying the “TDW KB inserted/hour/agent” estimate by 1024 (to convert it to bytes), and then dividing by the “TDW record inserts/hour/agent” estimate.
� Average size for aggregate records (bytes)
This value is calculated by multiplying the “TDW Disk Space – Aggregate data” result by 1024 (to convert it to bytes), and then dividing the result by the sum of the “Total Num. Aggregate Records” values across all of the attribute groups.
Most of the values from top portion of the agent worksheet are referenced from the Summary worksheet.
Chapter 2. IBM Tivoli Data Warehouse internals and deployment configurations 87

2.7.3 Detail of the Summary worksheet
Figure 2-24 shows a sample view of the Summary worksheet.
Figure 2-24 Load projection spreadsheet summary worksheet: Example 1
There are three main areas in the Summary worksheet. The upper left side lists some brief notes and assumptions, and gives summary results for the specified set of input parameters. The upper right side shows a bar graph of the disk space estimates by agent type. This graph is a smaller version of the graph shown on the BarGraph worksheet.
The lower part shows a list of the agent types, with an input cell to specify the count of agents (or managed systems) of each type in the desired configuration. The cells with a yellow background show the summarized values based on results from the individual agent worksheets (see 2.7.2, “Details for the agent worksheets” on page 81). See Figure 2-25.
88 Tivoli Management Services Warehouse and Reporting

Figure 2-25 Load projection spreadsheet summary worksheet: Example 2
Agent summary calculated valuesThe following summarized values are shown for each agent type:
� TDW record inserts/hour
This value is an estimate of the total number of detailed records inserted into the warehouse database per hour for the given agent type. This value is calculated by multiplying the Count input value by the “TDW inserts/hour/agent” value (column I, which is a reference to the “TDW record inserts/hour/agent” value from the Agent worksheet).
� TDW MB inserted/hour
This value is an estimate of the total amount of detailed data (in MB) inserted into the warehouse database per hour for the given agent type. This value is calculated by multiplying the Count input value by the “TDW KB inserted/hour/agent” value (column J, which is a reference to the value of the same name from the Agent worksheet), and dividing it by 1024 to convert from a KB value to a MB value.
� TDW Detailed MB Total
This value is an estimate of the total amount of detailed data (in MB) that resides in the warehouse database for the given agent type, based on the specified warehouse retention settings. This value is a reference to the “TDW Disk Space - Detailed data (MB - total across all attribute groups for all agents)” value from the Agent worksheet.
� TDW Aggregate MB Total
This value is an estimate of the total amount of aggregate data (in MB) that resides in the warehouse database for the given agent type, based on the
Chapter 2. IBM Tivoli Data Warehouse internals and deployment configurations 89

specified warehouse retention settings. This value is a reference to the “TDW Disk Space - Aggregate data (MB - total across all attribute groups for all agents)” value from the Agent worksheet.
The next five calculated values are references to values of the same name from the Agent workspaces.
Summary calculated valuesThe upper left part of the spreadsheet contains the summarized values across all agent types, as shown in Figure 2-26.
Figure 2-26 Load projection spreadsheet summary calculated values example
The following summarized values are shown in Figure 2-26:
� Total TDW record inserts per hour
This value is an estimate of the total number of row inserts of detailed data that will be performed per hour by the Warehouse Proxy agent. This value is calculated by summing the “TDW inserts/hour/agent” values for each agent type shown in the lower portion of the Summary worksheet.
� Average length of records inserted (bytes)
This value is an estimate of the average length of detailed rows inserted into the warehouse. This value is calculated by dividing the “Total MB of new data inserted into TDW per hour” value (which is described in the following section) by the “Total TDW record inserts per hour” value (described in the previous section).
� Total MB of new data inserted into TDW per hour
This value is an estimate of the total amount of detailed data (in MB) inserted into the warehouse database per hour across all agent types. This value is calculated by the sum of the “TDW MB inserted/hour” values for each agent type shown in the lower portion of the Summary worksheet.
� Total GB of new data inserted into TDW per day
This value is an estimate of the total amount of detailed data (in GB) inserted into the warehouse database per day across all agent types. This value is calculated by multiplying the “Total MB of new data inserted into TDW per hour” value by 24 (hours/day), and dividing it by 1024 (to convert from MB to GB).
90 Tivoli Management Services Warehouse and Reporting

� Total GB of data in TDW (based on retention settings)
This value is an estimate of the total amount of detailed data and aggregate data (in GB) to be stored in the warehouse, based on the retention settings specified for each attribute group. This value is calculated by the sum of the “TDW Detailed MB Total” and “TDW Aggregate MB Total” values across all agent types.
The “Total GB of data in TDW” result gives an estimate of the total amount of data that can be maintained in the warehouse database. This estimate is similar to that which is produced by Steps 1 through 5 in the section “Estimating the required size of your database” of the IBM Tivoli Monitoring Installation and Setup Guide, GC32-9407. The instructions in this manual recommend that you increase this value by 50% to accommodate uncertainty, and then compare this number to the Database data row in Table 8 on page 35 to determine the number of disks that you require for your database.
2.8 Deployment considerations for Tivoli Data Warehouse V1.X clients
With the new release of the Tivoli Data Warehouse (Version 2.1) and IBM Tivoli Monitoring (Version 6.1), some concerns have been raised due to the difference in architectures between older versions of these products. In 1.4, “Differences between Tivoli Data Warehouse V2.1 and 1.x” on page 9, we have already discussed the differences between the two Tivoli Data Warehouse versions from the implementation, usability, and scalability perspectives. In this section, we provide some guidance to clients using Tivoli Data Warehouse V1.x.
Chapter 2. IBM Tivoli Data Warehouse internals and deployment configurations 91

Figure 2-27 shows the differing architectures of Tivoli Monitoring V5.x and V6.1.
Figure 2-27 Tivoli Monitoring V6.1 versus V5.x
As shown in Figure 2-27, the main difference between the architectures is a move from the base Tivoli Framework and a shift to a new database schema included with Tivoli Data Warehouse V2.1.
Tivoli Data Warehouse Version 2.1 moves away from data marts, star schemas, and extract, transform, and load (ETLs) to a more simple schema and population mechanism. It also provides a self-pruning capability and an integrated viewing in the Tivoli Enterprise Portal.
92 Tivoli Management Services Warehouse and Reporting

Figure 2-28 compares the Tivoli Data Warehouse V1.x architecture with V2.1.
Figure 2-28 Tivoli Data Warehouse: V1.x versus V2.1
We recommend that current clients who use Tivoli Data Warehouse V1.3 in production to deploy a shadow Tivoli Monitoring V6.1 environment to stay up-to-date with new product releases and to use the new functionality that is being introduced by new versions of Tivoli Service Level Advisor. Use existing Tivoli Data Warehouse 1.x reports only on Tivoli Data Warehouse 1.x data. The two products can share the same database, but the Tivoli Data Warehouse 1.x data is not migrated to Tivoli Data Warehouse V2.x data.
Tivoli Distributed Monitoring V3.7 clients have to continue making use of the Tivoli Data Warehouse V1.3 reporting for their currently existing agents when they follow the upgrade path. They have to maintain both data warehouses and prune them individually during the upgrade period. Tivoli Monitoring V5.x clients as an interim can make use of the Tivoli Monitoring V5.x integration agent to import their current V5.x agents data into the Tivoli Data Warehouse V2.1 database. This agent can run in parallel with the current Tivoli Monitoring V5.x agent.
Chapter 2. IBM Tivoli Data Warehouse internals and deployment configurations 93

Figure 2-29 shows the suggested architecture for existing Tivoli Data Warehouse V1.x and Tivoli Distributed Monitoring V3.7 clients.
Figure 2-29 Suggested architecture for existing Tivoli Data Warehouse V1.x and Distributed Monitoring V3.7 clients
2.9 Tivoli Warehouse Proxy
The Warehouse Proxy agent is a special agent that handles warehousing requests from all managed systems in the enterprise. It provides a conduit from a historical data client (Tivoli Enterprise Monitoring Server or Tivoli Enterprise Monitoring Agent depending on configuration options) to the Tivoli Data Warehouse. It uses ODBC or JDBC to write the historical data to a supported relational database. The Warehouse Proxy connects to a hub monitoring server.
The amount of historical data generated can be huge, particularly in environments with thousands of monitoring agents or when instance intense attribute groups are enabled. You can use multiple Warehouse Proxies to distribute load in a large-scale environment. Properly configuring the Warehouse Proxy agents can ensure all historical data is smoothly transferred to the Tivoli Data Warehouse. An improper configuration can cause poor performance of the proxy and historical data buildup on the storage locations.
94 Tivoli Management Services Warehouse and Reporting

2.9.1 Tivoli Warehouse Proxy internals
Default settings for the Warehouse Proxy agent parameters must be suitable for most environments. Before you modify the parameters, it is helpful to have a basic understanding of how the Warehouse Proxy agent collects and transfers data to the warehouse.
The internal structure of the proxy comprises three distinct components:
� The Intelligent Remote Agent (IRA) communication framework � The work queue� The exporter threads
These three components work together to collect, translate, and transmit historical data to the warehouse. Historical data flows from one component to the next, undergoing specific processing at each step before being passed on.
Figure 2-30 shows the architecture of Tivoli Warehouse Proxy and illustrates how data is transferred from the agents, through the proxy components, and then into the warehouse.
Figure 2-30 Components of the Tivoli Warehouse Proxy agent
Important: We suggest that you contact your IBM support representative, before changing any of these parameters.
Chapter 2. IBM Tivoli Data Warehouse internals and deployment configurations 95

The components of the Tivoli Warehouse Proxy agent are further described in the following sections.
IRA communication frameworkThe Warehouse Proxy agent is considered an IBM Tivoli Monitoring V6.1 agent because it uses the IRA framework to provide most of its basic functionality. This includes how it communicates with the IBM Tivoli Monitoring V6.1 hub Tivoli Enterprise Monitoring Server and the other IBM Tivoli Monitoring V6.1 processes. In environments where a large amount of historical data is collected, the Warehouse Proxy agent can experience a very high volume of Remote Procedure Calls (RPCs). Because of this, tuning the communication framework of the proxy might be necessary.
The Warehouse Proxy agent uses one of the common communication transports to receive and respond to the historical data export requests sent from the IBM Tivoli Monitoring V6.1 clients that are uploading the data. Both the reliability and speed of an upload is affected by the selected protocol. The socket count and memory profile of the Warehouse Proxy agent are also affected.
The ip.pipe protocol is the most reliable protocol to use for historical data uploads. Each client maintains a connection with the proxy, and export requests have the reliability of TCP. It is also typically the fastest. Unreliable transfers give rise to broken exports, requiring the client to retry the export later. For historical data uploads, reliability equals speed.
The ip.spipe protocol functions similarly to the ip.pipe protocol, but imposes encryption and decryption on the transferred data. This impacts the speed of the data uploads, but provides the same reliability as ip.pipe. The ip.udp protocol must be used for communication to agents that have good network connectivity to the proxy and only if the additional resources required on the proxy host are not available to support an ip.pipe server/client configuration.
The number of threads processing the incoming RPC calls can also affect the performance and reliability of the communication framework. These threads are controlled by the IRA framework, and are called network control segment (NCS) listen threads. The number of NCS listen threads associated with an agent can be modified using the CTIRA_NCSLISTEN environment variable. The default number created for all IBM Tivoli Monitoring V6.1 agents is 10, but this might be insufficient for the Warehouse Proxy agent. Enabling 10 NCS listen threads per export thread is a good starting place. Increase the ratio if the proxy’s insertion rate is adequate but there are numerous RPC errors in the proxy’s log file.
96 Tivoli Management Services Warehouse and Reporting

The work queueThe work queue provides the proxy with a scalable and simple export scheduling solution. When all the historical data for an export request is uploaded to the Warehouse Proxy agent, the data structure containing the export buffer is placed on the work queue. Exports are processed in order by the exporter threads. The exporter threads become dormant, if no more work is available on the queue. When the queue reaches its maximum size, the proxy no longer accepts export requests from the clients.
The size of the work queue can be set using the KHD_QUEUE_LENGTH environment variable and defaults to a value of 1000. The queue size must be set equal to the number of clients that regularly upload data to a particular proxy. This ensures that each client is able to place at least one export buffer on the queue during a collection interval, provided no export errors occur. Because the majority of the memory used by the Warehouse Proxy is allocated for storing the historical data in the export buffers, modifying this value changes the maximum amount of memory that the Warehouse Proxy requires. To estimate the export buffer contribution to memory, multiply the row size of the largest attribute group by 1000, and then multiply by the value of KHD_QUEUE_LENGTH that you have set. For example, if there are 2000 agents uploading historical data for the Network_Interface attribute group, the maximum size of the proxy due to the export buffers is 432 MB. This assumes that KHD_QUEUE_LENGTH is set to 2000 and that each row of the Network_Interface attribute group is 216 bytes.
It might be necessary to limit the size of the proxy by setting the KHD_QUEUE_LENGTH to a value less than the number of exporting clients. In this case, it is important to estimate the number of rejected requests due to a full queue size, and to determine if all of the export requests are being serviced. The work queue maintains a set of metrics that track queue performance and workload. The maximum queue size, the total number of rejected requests, and the total work queued metrics provide the most useful information regarding rejection percentages. If the value of maximum queue size is greater than the value of KHD_QUEUE_LENGTH, it is possible that some export requests never get serviced. Calculate the ratio of total number of rejected requests to the total work queued metric. This number provides the percentage of requests that were rejected due to the export queue being full. If the value of this ratio is over 0.2, it is possible that there are some export requests that never get serviced. Increasing KHD_QUEUE_LENGTH is probably warranted.
Tip: You can set these Warehouse Proxy agent environment variables in the KHDENV file in %CANDLEHOME%\TMAITM6 on Windows and in the hd.ini file in $CANDLEHOME/config on AIX and Linux.
Chapter 2. IBM Tivoli Data Warehouse internals and deployment configurations 97

The exporter threadsThe exporter threads remove export buffers from the work queue, prepare SQL statements appropriate for the data, and insert data into the warehouse using a Java Database Connectivity (JDBC) or ODBC bridge supported by the warehouse database. After the export has finished, the export thread notifies the client of the export status. The number of exporter threads and database connections affect the rate at which data is inserted into the warehouse.
Before Fix Pack 2, the Warehouse Proxy agent was only supported on Windows platforms and used an appropriate ODBC interface to connect to the data warehouse. Fix Pack 2 introduced support for a Warehouse Proxy running on selected Linux platforms, using a JDBC interface appropriate for the data warehouse. Fix Pack 2 also introduced batch inserts that can increase the data insertion rate of the Warehouse Proxy agent. This is especially true if the proxy and the warehouse are located on different hosts. Batch inserts are supported for both ODBC and JDBC warehouse connections. To enable batch inserts, set KHD_BATCH_USE=Y. Batch option is discussed more in 4.3, “Batch option” on page 243.
To configure the number of exporter threads, use the environment variable KHD_EXPORT_THREADS. The default number of exporter threads is 10. This is a good default setting and can serve for most database and host configurations. The system resources required by the 10 export threads and the associated database connections are minimal, and are well worth the extra performance that the concurrent exports provide. If the value of KHD_EXPORT_THREADS is decreased, be sure to change the CNX_POOL_SIZE to the same value. The excess connections are not used, and they consume system resources unnecessarily.
Proxy agents using the JDBC interface start a Java Virtual Machine (JVM™) to support Java Native Interface (JNI) calls to JDBC. If the heap size of the JVM is set to a low value, proxy performance can be degraded by frequent garbage collections. Setting KHD_JNI_VERBOSE=Y in the hd.ini file enables logging of the garbage collector’s actions. If the Java log contains several garbage collection entries during a single warehousing interval, consider increasing the size of the java heap. You can do this by using the KHD_JAVA_ARGS environment variable and the –Xmx<heap size>m JVM option.
98 Tivoli Management Services Warehouse and Reporting

2.9.2 The Tivoli Warehouse Proxy step by step
Figure 2-31 illustrates the operation of the Tivoli Warehouse Proxy. This section describes this operation in detail.
Figure 2-31 Operation of the Tivoli Warehouse Proxy agent
When the Warehouse Proxy starts, it registers its network address with the global location broker on the hub Tivoli Enterprise Monitoring Server. If data collection is set up to store data at the Tivoli Enterprise Monitoring Server, the Tivoli Enterprise Monitoring Server checks the global location broker for the Warehouse Proxy agent location when the export starts.
If data collection is set up to store data at the agent, the Tivoli Enterprise Monitoring Server checks the global location broker every 60 minutes for the Warehouse Proxy agent location. The Tivoli Enterprise Monitoring Server sends this address to all of its online agents. After starting the Tivoli Enterprise Monitoring Server if you change the location of the Warehouse Proxy agent, it may take 1 hour after the Warehouse Proxy agent starts for the warehouse proxy address to be sent to the agents.
The KPX_WAREHOUSE_CHK variable allows the Tivoli Enterprise Monitoring Server to check the global location broker for the Warehouse Proxy agent location. For example, setting the variable KPX_WAREHOUSE_CHK=5 causes it
JDBC
Chapter 2. IBM Tivoli Data Warehouse internals and deployment configurations 99

to check for the Warehouse Proxy agent location every 5 minutes. Every collection time (5, 15, 30, or 60 minutes) depending on the setting that you have specified, new data is collected and stored in the binary file on the agent or the Tivoli Enterprise Monitoring Server.
Every warehousing time (1 hour or 1 day) depending on the setting that you have specified, the export service (khdxcl1) uses worker threads to find the Warehouse Proxy agent address, and then export per batch a maximum of 1000 rows from each binary file. There can be one or more worker threads per binary file. By default, the maximum number of worker threads is set to 10. This is set with the variable KHD_EXPORT_THREADS =10.
The export worker threads are then placed on a working queue. The maximum size of the queue is set to 1000. This is set by the variable KHD_QUEUE_LENGTH=1000. Each worker thread requests an ODBC/JDBC connection from the connection pool. The connection pool is initialized when the Warehouse Proxy agent is started. The default number of connection in the pool is set to 10. This is set by the variable KHD_CNX_POOL_SIZE=10. It is important to set the number of worker threads greater or equal to the number of ODBC/JDBC connections. Therefore, the variable KHD_EXPORT_THREADS (see “The exporter threads” on page 98) must be greater than or equal to that of KHD_CNX_POOL_SIZE.
In addition to the configurable environment variables mentioned previously, the standard agent framework provides some control over the Warehouse Proxy agent’s scalability and performance profile. When the Warehouse Proxy agent starts up, it initializes a number of RPC listeners. This is set with the variable CTIRA_NCSLISTEN=10 (see “IRA communication framework” on page 96).
If the export request is successful, that is, all the data from the export is inserted successfully in the database before the server timeout, a successful status is sent to the export service on the agent or Tivoli Enterprise Monitoring Server depending where you have configured the collection point. If this is not the case, an unsuccessful status (with a status number indicating the reason of failure) is sent to the export service.
On the agent or Tivoli Enterprise Server depending where you have configured collection when a successful export status is received, an entry is created in the marker file khdexp.cfg for the corresponding table and with the last WRITETIME time stamp inserted in the database. If no status has been received before the client timeout, a new export request is sent.
After every successful export, all the data older than 24 hours in the binary file is pruned if the corresponding data has been successfully inserted in the database. This is done using the marker file khdexp.cfg.
100 Tivoli Management Services Warehouse and Reporting

A client timeout can occur if a status has not been received from the Warehouse Proxy before the timeout set by the variable KHD_STATUSTIMEOUT (the default is 900s or 15 minutes). If this occurs the export request is re-sent.
A server timeout can also occur and the current export can be rejected by the Warehouse Proxy agent at the following four stages:
� Stage END_QUEUE: If the time between when the export is sent to the work queue and the time before it is extracted from the queue exceeds the server timeout, the export request is rejected.
� Stage START EXPORT: If the time between when the export is sent to the work queue and the time before it starts to do some existence checking in the database exceeds the server timeout, the export request is rejected.
� Stage START SAMPLE: If the time between when the export is sent to the work queue and the time before it fetches all the rows in the sample exceeds the server timeout, the export request is rejected.
� Stage COMMIT EXPORT: If the time between when the export is sent to the work queue and the time before committing the rows in the database exceeds the server timeout, the export request is rejected.
The server timeout is configured with the variable KHD_SRV_STATUSTIMEOUT and by default is set to 600s (10 minutes).
2.9.3 Multiple Warehouse Proxies
IBM Tivoli Monitoring V6.1 Fix Pack 2 added support for multiple Warehouse Proxies in a single IBM Tivoli Monitoring V6.1 enterprise. This introduces both greater scalability and flexibility to the IBM Tivoli Monitoring V6.1 data warehousing solution. All Warehouse Proxies associated with the enterprise register with the hub Tivoli Monitoring Server’s global location broker and must export data to a single warehouse.
Warehouse Proxy agents existing in a multiple environment are installed exactly as though they are to exist alone. Consult the IBM Tivoli Monitoring Installation and Setup Guide, GC32-9407, for specific details about the installation and configuration of a Warehouse Proxy agent. All proxies must be configured to use the hub Tivoli Enterprise Monitoring Server as their parent. When installed, a proxy can be associated with a subset of the enterprise’s Tivoli Enterprise Monitoring Server instances by adding the KHD_WAREHOUSE_TEMS_LIST environment variable to the environment file of the proxy. This is KHDENV for
Note: The KHD_SRV_STATUSTIMEOUT variable must always be less than the KHD_STATUSTIMEOUT by at least 60s.
Chapter 2. IBM Tivoli Data Warehouse internals and deployment configurations 101

Windows installations and hd.ini for Linux or UNIX installations. The KHD_WAREHOUSE_TEMS_LIST is a space-delimited list of Tivoli Enterprise Monitoring Server instance names. Any Tivoli Enterprise Monitoring Server instance in this list might select the configured proxy to be its monitoring agent’s export server. The names of the Tivoli Enterprise Monitoring Server instances in the list are limited to length of 64 bytes and cannot contain spaces. An example setting for KHD_WAREHOUSE_TEMS_LIST might look like:
KHD_WAREHOUSE_TEMS_LIST=REMOTE_TEMS1 REMOTE_TEMS2 . . . .
Upon startup, a proxy attempts to register itself with the global location broker on the hub. It makes this attempt every five minutes or until it succeeds, after which it re-registers its information with the hub every hour. The registered entry in the global location broker contains the list of Tivoli Enterprise Monitoring Server machines that it is configured to service. If no other proxy is configured as the default proxy for this enterprise, it registers itself as the default proxy.
Every Tivoli Enterprise Monitoring Server instance in the IBM Tivoli Monitoring V6.1 enterprise queries the global location broker on the hub to determine which Warehouse Proxy it is associated with. The query uses the name of the Tivoli Enterprise Monitoring Server to perform the lookup. If a matching proxy is found, the Tivoli Enterprise Monitoring Server sends this proxy’s address to all of its child agents to use during historical data exports. A Tivoli Enterprise Monitoring Server instance checks the global location broker every hour for updates, and re-sends these updates to its agents, if required. This interval can be modified using the KPX_WAREHOUSE_REGCHK environment variable. This value specifies the number of minutes to wait between rechecking the global location broker and has the default value of 60.
To verify that the proxy is registering with the hub, add the (UNIT: khdxrpcr STATE) trace entry to the proxy’s environment file. This setting prints the value of KHD_WAREHOUSE_TEMS_LIST and shows any errors associated with proxy registration.
To determine which Warehouse Proxy a particular Tivoli Enterprise Monitoring Server selects for its agents, add the (UNIT: kpxrwhpx STATE) trace entry to the Tivoli Enterprise Monitoring Server environment. This setting logs entries in the Tivoli Enterprise Monitoring Server’s RAS log whenever a registration change occurs, displaying the address of the new proxy.
Selecting the number of proxies for an enterprise primarily depends on the number of clients and factors described in “IRA communication framework” on page 96. When the historical data is uploaded from the clients to the proxy, this completes a major part of the process, particularly if the warehouse is properly tuned and its warehouse’s host system is robust. If the clients are using ip.pipe or ip.spipe as the primary protocol when contacting the proxies, an optimal
102 Tivoli Management Services Warehouse and Reporting

configuration associates no more than 2000 clients to each proxy. A client to proxy ratio of 2000 performs acceptably, provided the proxy is installed on a platform that meets the basic system requirements for a proxy installation. Consult the IBM Tivoli Monitoring Installation and Setup Guide, GC32-9407, for these requirements.
Using ip.udp results in more orphaned exports and rejected requests, particularly across slower networks. Before Fix Pack 2, no more than 2000 clients were able connect to a single proxy using ip.pipe or ip.spipe. Fix Pack 2 relaxed this limitation on both ODBC-based and JDBC-based clients.
2.10 Tivoli Summarization and Pruning agent
The Summarization and Pruning agent performs the aggregation and pruning of the data inside the Tivoli Data Warehouse Version 2.1. The Tivoli Monitoring Version 6.1 administrator sets up how often to collect the detailed data, what intervals to aggregate and prune on, and how often to run the aggregation and pruning engine.
2.10.1 Tivoli Summarization and Pruning agent internals
The Summarization and Pruning agent manages the data in the data warehouse by aggregating historical data into time-based categories and removing data (both detailed and summarized) older than a specified age. The time-based categories are hourly, daily, weekly, monthly, quarterly, and yearly. Pruning can be enabled for each time-based category and for the detailed data. Managing the data in the warehouse is a requirement for any sustainable warehouse configuration. This is particularly true for large-scale environments. The Summarization and Pruning agent is a multi-threaded, Java-based application. It interacts with the warehouse using a JDBC driver appropriate to the warehouse’s database.
Historical data retentionEach time-based category has a retention period that specifies how long the data is retained in the warehouse before it is purged by the Summarization and Pruning agent. The time-based categories for short time durations exhibit higher retained row counts than the ones for longer time durations. Table 2-12 shows the number of rows retained per retention time unit for a single instance of an attribute group. It also includes the total retained row count, the default retention unit, and the default retention configuration. Values for each time-base category are displayed.
Chapter 2. IBM Tivoli Data Warehouse internals and deployment configurations 103

Table 2-12 Number of rows retained per retention time unit
Three years have to elapse before this level of warehouse saturation is realized. The short duration time-based categories reach saturation sooner and also contribute much more to the total row count than the long duration periods. The
Note: In Table 2-12, the detail data number was calculated for an attribute group that only returns exactly one instance and the collection interval is 5 minutes.
For the non-detailed data, the exact calculation formula is as follows (depending on your assumptions, the non-detailed data numbers that you calculate might be different from the ones given in Table 2-12.)
1. Hourly rows retained per month is: 24 * (number of days in month) * (2 if shifts are enabled; 1 if shifts are not enabled)
2. Daily rows retained per year is: (365 or 366) * (3 if shifts are enabled; 1 if shifts are not enabled)
3. Weekly rows retained per year is: 52 * (3 if shifts are enabled; 1 if shifts are not enabled) * (3 if vacations are enabled; 1 if vacations are not enabled)
4. Monthly rows retained per year is: 12 * (3 if shifts are enabled; 1 if shifts are not enabled) * (3 if vacations are enabled; 1 if vacations are not enabled)
5. Quarterly rows retained per year is: 4 * (3 if shifts are enabled; 1 if shifts are not enabled) * (3 if vacations are enabled; 1 if vacations are not enabled)
6. Yearly rows retained per year is: 1 * (3 if shifts are enabled; 1 if shifts are not enabled) * (3 if vacations are enabled; 1 if vacations are not enabled)
Category Default retention unit
Rows retained/unit
Default period
Total rows retained
Detailed Day 288 7 days 2016 rows
Hourly Month 744 3 months 2232 rows
Daily Year 365 1 year 365 rows
Weekly Year 52 2 years 104 rows
Monthly Year 12 3 years 36 rows
Quarterly Year 4 3 years 12 rows
Yearly Year 1 3 years 3 rows
104 Tivoli Management Services Warehouse and Reporting

hourly category is particularly row-intensive, because it requires 744 rows of aggregated data per month per instance.
If warehouse space is an issue, consider reducing the default periods of the more detailed time-based categories, especially the hourly category. Reducing the retention period of the hourly category from 3 months to 2 months can result in a 15% reduction in the saturated size of the warehouse. In a large-scale environment, this can be a significant reduction.
The Summarization and Pruning agent does not maintain the WAREHOUSELOG table or the other utility tables found in the data warehouse. The system administrator or the warehouse database administrator (DBA) has to purge old entries in these tables manually.
2.10.2 Tivoli Summarization and Pruning agent step by step
When the Tivoli Summarization and Pruning agent is configured and set up, it checks its schedule every 5 minutes. If the schedule is ready within 5 minutes, then the Tivoli Summarization and Pruning agent starts its work.
The Tivoli Summarization and Pruning agent starts its work by retrieving the metadata from the Tivoli Enterprise Portal Server. This metadata is retrieved:
� Per product, table
– Hour, day, week, month, quarter, year summarization– Pruning metadata for raw, hour, day, week, month, quarter, year
� Per column
– Minimum, maximum, average, sum, total, high, low, latest, earliest
When this is complete, the agent reads some settings from the environment file. These settings include features such as shift and vacation settings. The agent then checks if the tables defined by the Tivoli Enterprise Portal Sever metadata is created by the Warehouse Proxy. For the raw tables, the agent determines where it finished its last run. The new data is selected into memory. The Summarization and Pruning agent processes one attribute group at a time. For a given attribute group, it iterates over all the MSNs (Managed System Node, also called Originnode or simply Node) that exist for the attribute group in the raw table. It then aggregates the data for a given row for a given MSN and places that summarized information into the database. It then moves to the next row and eventually the next MSN.
Chapter 2. IBM Tivoli Data Warehouse internals and deployment configurations 105

2.10.3 Tivoli Summarization and Pruning agent scheduling
The Tivoli Summarization and Pruning agent can be configured to start processing data from the warehouse at a specific hour and minute. The KSY_MINUTE_TO_RUN, KSY_HOUR_TO_RUN, and KSY_HOUR_AM_PM environment variables can be modified in the Summarization and Pruning agent’s environment file to modify its schedule. The processing of historical data by the Summarization and Pruning agent imposes a noticeable impact on the performance of the warehouse database, therefore Summarization and Pruning agent processing runs must take place when queries to the warehouse are unlikely to occur.
How often the Summarization and Pruning agent runs is just as important as when it runs. The KSH_EVERY_N_DAY environment variable specifies how many days must elapse between Summarization and Pruning agent data processing sessions. For large-scale environments, it is important that aggregation and pruning of the data in the warehouse occurs every day. This ensures that excess data is not retained past any pruning periods. Also, if aggregation is performed every day, the new detailed data is processed during sessions that are shorter and more manageable. Set KSH_EVERY_N_DAY to 1 to schedule daily runs.
2.10.4 Tivoli Summarization and Pruning agent processing and time considerations
The IBM Tivoli Monitoring 6.1/Tivoli Data Warehouse 2.1 Warehouse Load Projections spreadsheet provides estimates regarding the size of the warehouse at its saturation point, provided a configuration is specified for the Summarization and Pruning agent. The spreadsheet does not provide an estimate of how long the Summarization and Pruning agent takes to perform a run. If the Summarization and Pruning agent must run longer than 24 hours to process a day’s worth of new data. it cannot keep up with the requirements of the warehouse. A continuously running Summarization and Pruning agent can impact the performance of the warehouse. This can affect the ability of the Warehouse Proxy agent to insert new historical data and the performance of any query run against the warehouse through the TEP. Even processing runs that last longer than a few hours can be disruptive, especially during times when access to the historical data is a priority. See 2.10.3, “Tivoli Summarization and Pruning agent scheduling” on page 106, for instructions about how to set the run time and frequency of the Summarization and Pruning agent.
Examine the RAS log of the Summarization and Pruning agent’s JVM to obtain the length of time that it takes for a run to complete. The Summarization and Pruning agent logs the entries shown in Example 2-4 to indicate the start and the
106 Tivoli Management Services Warehouse and Reporting

end of historical data processing (see 8.2, “Summarization and Pruning agent” on page 475 for Summarization and Pruning agent troubleshooting).
Example 2-4 RAS log
== 2006-05-24 02.00.00.012 -0500 : Trace resumed, level: 1, maxFiles:5, maxLines: 300000, sqlDump: false== 761 t=main Summarization and pruning agent started== 762 t=main Next scheduled time is within 60 seconds so start now== 763 t=main PARA0040 aggProduct:...== 871 t=main Summarization and pruning agent successfully ended== 2006-05-24 02.00.41.891 -0500 : Trace paused
Compare the start time to the end time to determine the total elapsed time of the processing run. The start and end times can be found on the lines that contain the Trace resumed and Trace paused entries.
If the RAS log exhibits run times that are unacceptable, use the performance tuning suggestions described in 2.10.5, “Tivoli Summarization and Pruning agent performance tuning”. Also, ensure that the warehouse’s database is properly configured using the guidelines presented in 2.9, “Tivoli Warehouse Proxy” on page 94. It might be necessary to upgrade the hardware used by the Tivoli Data Warehouse if an acceptable run time is not realized.
2.10.5 Tivoli Summarization and Pruning agent performance tuning
The Summarization and Pruning agent is a multi-threaded, Java-based application. It interacts with the warehouse using a JDBC driver appropriate to the warehouse’s database. The number of threads and the heap size of the JVM affect the performance of the Summarization and Pruning agent and the length of time of its processing runs. The installation location of the Summarization and Pruning agent is another important aspect of Summarization and Pruning agent performance tuning.
The number of worker threads started by the Summarization and Pruning agent for the purpose of performing the summarization and pruning tasks can be set using the KSY_MAX_WORKER_THREADS environment variable. The suggested number of worker threads is one less than the number of processors on the host system, but configuring more threads than attribute groups does not decrease the processing time.
Chapter 2. IBM Tivoli Data Warehouse internals and deployment configurations 107

Increase the JVM heap size as the daily amount of data collected by the Warehouse Proxy agent increases. The suggested values are 512 MB for collection rates of 10 GB a day and 1536 MB for collection rates of 25 GB a day. The heap size can be set for the Summarization and Pruning agent by specifying a value for the –Xmx Java option in the KSZ_JAVA_ARGS environment variable.
Install the Summarization and Pruning agent on the same host as the warehouse to minimize network communication. Multiple Summarization and Pruning agents are not supported, therefore distributing the processing loads across multiple hosts is not possible. Co-locating the Summarization and Pruning agent with the warehouse eliminates wait times that are induced while performing SQL calls across a network. If the Summarization and Pruning agent cannot be installed on the warehouse database server, ensure that there is a high-speed network connection between them (100 Mbps or higher).
Note: Set the Summarization and Pruning agent environment variables in the KSYENV file in %CANDLEHOME%\TMAITM6 on Windows and in the sy.ini file in $CANDLEHOME/config on UNIX and Linux.
108 Tivoli Management Services Warehouse and Reporting

Chapter 3. Warehousing in action
In addition to IBM Tivoli Monitoring and the monitoring agents, there are a number of other Tivoli products that use the Tivoli Data Warehouse Version 2.1. This chapter provides step-by-step procedures on how to customize these Tivoli products to integrate with the Tivoli Data Warehouse V2.1. In the future, you can expect to see even more Tivoli products to use the Tivoli Data Warehouse architecture. This chapter contains the following topics:
� “Overview of the lab environment for this book” on page 110
� “Configuring the Tivoli Warehouse Proxy” on page 111
� “Configuring multiple Warehouse Proxies” on page 126
� “Configuring the Summarization and Pruning agent” on page 128
� “Configuring historical data collection” on page 147
� “Tivoli Enterprise Console and Data Warehouse integration” on page 151
� “Configuring IBM Tivoli Service Level Advisor and Tivoli Data Warehouse integration” on page 167
� “IBM Tivoli Composite Application Manager for Response Time Tracking and Tivoli Data Warehouse integration” on page 188
� “IBM Tivoli Composite Application Manager for WebSphere and Tivoli Data Warehouse integration” on page 201
� “Tivoli Composite Application Manager for SOA and Tivoli Data Warehouse integration” on page 219
3
© Copyright IBM Corp. 2007. All rights reserved. 109

3.1 Overview of the lab environment for this book
In this book, we have created all charts and reports using data gathered from our lab environment. In this lab environment, we used a mixture of Windows, AIX, and Linux servers, a variety of agents, and some non-IBM Tivoli Monitoring products. Figure 3-1 gives a overview of the servers that we used and the agents and Tivoli Data Warehouse sources that we configured on each.
Figure 3-1 Lab environment for this book
110 Tivoli Management Services Warehouse and Reporting

Table 3-1 provides the hardware and software details our lab environment.
Table 3-1 Lab environment for this book
3.2 Configuring the Tivoli Warehouse Proxy
The Warehouse Proxy is used to upload historical data from agents into the Tivoli Enterprise Data Warehouse for historical reporting. The Warehouse Proxy agent installation is described in more detail in the IBM Tivoli Monitoring Installation and Setup Guide, GC32-9407.
This section describes the steps for configuring a Warehouse Proxy agent. The Tivoli Data Warehouse requires a relational database to store the historical data. DB2 UDB is the preferred database, but Microsoft SQL and Oracle are also supported. The product ships with a copy of DB2 UDB.
Host name Operating system (OS) CPU RAM Hard disk
berlin Windows 2003 3 GHz 2 GB 40 GB
belfast AIX 5.3 400 MHz 512 MB 9 GB
oslo Red Hat AS 4 1.5 GHz 1 GB 9 GB
ankara SUSE 9 1.5 GHz 1 GB 9 GB
rome AIX 5.3 375 MHz 896 MHz 9 GB
edinburg Windows 2000 1.5 GHz 256 MB 30 GB
lizbon Windows 2000 1.5 GHz 256 MB 30 GB
prov006 Windows 2000 1.5 GHz 256 MB 30 GB
toronto Windows 2003 2.4 GHz 1.5 GB 40 GB
br AIX 5.3 400 MHz 512 MB 9 GB
nice Windows 2003 3 GHz 1.5 GB 75 GB
florence Windows 2003 3 GHz 256 MB 75 GB
rttserver Red Hat AS 1.5 GHz 1 GB 9 GB
Note: ITMUser is the default user in the Warehouse Proxy agent, but can be changed if needed.
Chapter 3. Warehousing in action 111

Database configuration prerequisitesUse the following recommendations when you install relational database management system (RDBMS) on DB2 or Oracle.
� DB2
You must use at least DB2 V8.2 Fix Pack 10 (FP 10). You also have to set the environment variable DB2CODEPAGE=1208 as a system environment on the Windows machine where the Warehouse Proxy is installed.
You can find the DB2 fix packs at the following Web site:
http://www.ibm.com/software/data/db2/udb/support/downloadv8.html
� Oracle
If you have Oracle 9.2, you must upgrade the Open Database Connectivity (ODBC) driver to Version 9.2.0.4. Set the environment variable NLS_LANG=AMERICAN_AMERICA.AL32UTF8 as a system environment on the Windows machine where the Warehouse Proxy is installed.
The Web site for Oracle ODBC drivers:
http://www.oracle.com/technology/software/tech/windows/odbc/htdocs/utilsoft.html
112 Tivoli Management Services Warehouse and Reporting

3.2.1 On a Windows system
The first step in the configuration of the Warehouse Proxy is to configure it to connect to the database to insert and retrieve data from the database. To perform the Warehouse Proxy agent configuration on a Windows system, perform the following steps:
1. From the Manage Tivoli Enterprise Monitoring Services console, right-click the Warehouse Proxy and select Reconfigure.
2. The message shown in Figure 3-2 opens. Click OK.
Figure 3-2 Windows informational display
Chapter 3. Warehousing in action 113

3. Configure the protocol communication between the Tivoli Enterprise Monitoring Server and the Warehouse Proxy, as shown in Figure 3-3. Click OK.
Figure 3-3 Windows Warehouse Proxy agent: Configuration of communication protocol
4. Configure the hub Tivoli Enterprise Monitoring Server host name and the ports where the Warehouse Proxy connect, as shown in Figure 3-4. Click OK.
Figure 3-4 Windows Warehouse Proxy agent hub Tivoli Enterprise Monitoring Server and port configuration
114 Tivoli Management Services Warehouse and Reporting

5. The window shown in Figure 3-5 opens. Click Yes.
Figure 3-5 Windows Tivoli Monitoring Warehouse ODBC configuration confirmation message
6. Select the database for the Warehouse Proxy agent that you want to use, as shown in Figure 3-6.
Figure 3-6 Windows database selection for Warehouse Proxy configuration
Note: Selecting Other database type is not supported. It is reserved for future use.
Chapter 3. Warehousing in action 115

7. The window shown in Figure 3-7 opens. Enter the necessary information for the following fields:
– Data Source Name: You can leave as ITM Warehouse or change if needed. If you want to change this default, you should create your own ODBC data source using the Windows ODBC Data Source Administrator panel. Then you have to set the exact name of the ODBC data source created with this panel in the Tivoli Configuration panel. If your database is remote, you have to create your own ODBC data source and you have to catalog your remote database.
– Database Name: The name of the database that the Warehouse Proxy agent will use to store the data
– Admin User ID: The database user administrator created during database installation (default is db2admin for DB2). This user (which should already exist) is used to create the Tivoli Data Warehouse database.
– Admin Password: The user database administrator password
– Database User ID: The user ID that will own the table made to store warehouse data
This user must be created on the OS first. The default user is ITMUser.
– Database Password: The password of the Database user ID
Click OK.
116 Tivoli Management Services Warehouse and Reporting

Figure 3-7 Windows data source configuration window for the Warehouse Proxy
Note: After this step is completed, a local database will be created only if the data source does not exist already. The status tables (WAREHOUSELOG, WAREHOUSEID, UTF8TEST) are created when the Warehouse Proxy agent is started. The application tables are created when the Warehouse Proxy agent exports data to the Tivoli Data Warehouse.
Chapter 3. Warehousing in action 117

8. The pop-up window shown in Figure 3-8 opens. It shows the message that the Data Warehouse configuration was successfully completed. Click OK.
Figure 3-8 Windows warehouse configuration status message
9. In the new window (Figure 3-9), click Yes to complete the configuration.
Figure 3-9 Windows Warehouse Proxy database configuration completion
10.Restart the Warehouse Proxy agent by double-clicking it.
3.2.2 On a Linux or an AIX system
Fix Packs 002 and 003 add support for the Warehouse Proxy agent on AIX and Linux. The Warehouse Proxy on AIX and Linux uses a Java Database Connectivity (JDBC) connection to export data collected from IBM Tivoli Monitoring agents to the Tivoli Data Warehouse.
Important: The default ODBC data source name is stored in the Windows registry in the the string ODBCDATASOURCE, at the following registry key:
HKEY_LOCAL_MACHINE\SOFTWARE\CANDLE\KHD\Ver610\Primary\Environment.
Rather than changing this entry directly, if you want to change the default ODBC data source name, use the Windows ODBC Data Source Administrator panel.
Important: An X Window System is required to configure the Warehouse Proxy on AIX or Linux.
118 Tivoli Management Services Warehouse and Reporting

The JDBC driver JAR files that come with your database product must be located on the computer where you installed the Warehouse Proxy agent.
� If you are using DB2 for your Tivoli Data Warehouse database, the JDBC driver files are included with the database product installation. If your Tivoli Data Warehouse is located on a remote computer, copy the driver files to the local computer (the computer where you installed the Warehouse Proxy agent).
� If you are using Oracle or Microsoft SQL Server for your Tivoli Data Warehouse database, download the driver files from the company Web site to the computer where you installed the Warehouse Proxy agent.
Table 3-2 shows the location of the driver files for each database product. Copy or download the files to any directory on the computer where the Warehouse Proxy agent is installed.
Table 3-2 The location of the JDBC driver files
Database product JDBC driver files
IBM DB2 The DB2 driver files are located with your DB2 installation in the following directories:<db2installdir>/java/db2jcc.jar <db2installdir>/java/db2jcc_license_cu.jar
Here <db2installdir> is the directory where DB2 is installed. The default DB2 Version 8 installation directory is as follows:� On AIX: /usr/opt/db2_08_01� On Linux: /opt/IBM/db2/V8.1
Oracle Obtain the Oracle JDBC driver from the following Web site:
http://www.oracle.com/technology/software/tech/java/sqlj_jdbc/index.html
Download the ojdbc14.jar file. This file supports Java Runtime Environment 1.4.2 (JRE™ 1.4.2) or later, the required Java Runtime Environment for IBM Tivoli Monitoring.
Microsoft SQL Server
Use the Microsoft SQL Server 2005 Driver to connect to a Tivoli Data Warehouse on either SQL Server 2000 or SQL Server 2005. (The SQL Server 2005 JDBC Driver works with a Tivoli Data Warehouse on SQL Server 2000. Note that SQL Server 2000 JDBC drivers are not supported with Tivoli Data Warehouse). Obtain the 2005 JDBC driver from the following Microsoft Web page:
http://msdn.microsoft.com/data/jdbc/default.aspx
Download and install the driver to the computer where you installed the Warehouse Proxy Agent. Follow the instructions on the Microsoft download page for installing the driver. After you install the driver, the JAR file name and location are as follows:
<base-dir>\sqljdbc_1.0\enu\sqljdbc.jar
Chapter 3. Warehousing in action 119

After you install the JDBC drivers, you are ready to configure the Warehouse Proxy agent. The purpose of the configuration is to establish the JDBC connection between the Warehouse Proxy agent and the Tivoli Data Warehouse, and to register the Warehouse Proxy agent with the Tivoli Enterprise Monitoring Server.
1. Log on to the computer where the Warehouse Proxy agent is installed.
2. Start the Manage Tivoli Enterprise Monitoring Services utility:
a. Change to the bin directory:
cd install_dir/bin
b. Run the following command:
./itmcmd manage [-h ITMinstall_dir]
In this command, -h is an optional attribute that is used to specify the installation directory. ITMinstall_dir is the directory where the Warehouse Proxy agent is installed. The default installation directory is /opt/IBM/ITM.
3. The Manage Tivoli Enterprise Monitoring Services window opens, as shown in Figure 3-10. Right-click Warehouse Proxy and select Configure.
Figure 3-10 Linux and AIX monitoring services window
Note: The Platform column for agents lists the platform that the binary code was built on, not the platform that you are running on.
120 Tivoli Management Services Warehouse and Reporting

4. The Configure Warehouse Proxy window opens, as shown in Figure 3-11. In the TEMS Connection tab, enter the information about the Tivoli Enterprise Monitoring Server to which the Warehouse Proxy agent connects:
a. Enter the host name of the monitoring server in the TEMS Hostname field. (If the field is not active, clear the No TEMS check box.)
b. Select the communications protocol that the monitoring server uses from the Protocol drop-down list.
c. Enter the port number of the monitoring server in the Port Number field.
Figure 3-11 Linux and AIX Warehouse Proxy configuration window
Chapter 3. Warehousing in action 121

5. In the Agent Parameters tab (Figure 3-12 on page 125), perform the following steps.
a. Add the names and directory locations of the JDBC driver JAR files to the JDBC Drivers field.
i. Use the scroll bar at the bottom of the window to display the Add and Delete buttons, which are located to the right of the JDBC Drivers field. Click Add to display the file browser window. Navigate to the location of the driver files on your computer and select the driver files for your database product. See Table 3-4 on page 123 for the names of the driver files to add.
ii. Click OK to close the browser window and add the JDBC driver files to the list. If you want to delete an entry from the list, select the entry and click Delete.
b. In the Database drop-down list, select the database product that you are using for the Tivoli Data Warehouse.
c. Change the default value displayed in the Warehouse URL field if it is not correct. Table 3-3 lists the default Tivoli Data Warehouse URLs for the different database products.
Table 3-3 Tivoli Data Warehouse URLs
If the Tivoli Data Warehouse is installed on a remote computer, specify the host name of the remote computer instead of localhost. Change the port number if it is different. If the name of the Tivoli Data Warehouse database is not WAREHOUS, replace WAREHOUS with the actual name.
d. Verify the JDBC driver name, which is displayed in the Warehouse Driver field.
Database product Warehouse URL
IBM DB2 jdbc:db2://localhost:60000/WAREHOUS
Oracle jdbc:oracle:thin:@localhost:1521:WAREHOUS
Microsoft SQL Server 2000 jdbc:Microsoft:sqlserver://localhost:1433;databaseName=WAREHOUS
Microsoft SQL Server 2005 jdbc:sqlserver://localhost:1433;databaseName=WAREHOUS
Note: The Warehouse Driver field displays the driver name, in contrast to the driver JAR files that are listed in the JDBC Drivers field.
122 Tivoli Management Services Warehouse and Reporting

Table 3-4 lists the JDBC driver names for each database product:
Table 3-4 JDBC driver names
e. If necessary, change the entries in the Warehouse User and Warehouse Password fields to match the user name and password that were created for the Tivoli Data Warehouse.
f. Select the Use Batch check box if you want the Warehouse Proxy agent to submit multiple execute statements to the Tivoli Data Warehouse database for processing as a batch.
In some situations, such as crossing a network, sending multiple statements as a unit is more efficient than sending each statement separately. Batch processing is one of the features provided with the JDBC 2.0 application programming interface (API).
Database product JDBC driver name
IBM DB2 com.ibm.db2.jcc.DB2Driver
Oracle oracle.jdbc.driver.OracleDriver
Microsoft SQL Server com.microsoft.sqlserver.jdbc.SQLServerDriver
Note: The SQL Server name given in Table 3-4 is the name of the recommended 2005 SQL Driver. The name of the 2000 SQL Driver was com.microsoft.jdbc.sqlserver.SQLServerDriver. Note the reversal of the string jdbc.sqlserver.
Important: The default user name is itmuser and the default password is itmpswd1.
Note: Select this check box only if you are using a JDBC driver that supports the batch option. If you select the check box when using a JDBC driver that does not support batch, the Warehouse Proxy agent fails.
Chapter 3. Warehousing in action 123

g. Click Test database connection to ensure that you can communicate with the Tivoli Data Warehouse database. Test database connection button has to report success. If it does not, the Warehouse Proxy agent is not going to work.
h. Click Save.
Note: If you are using DB2 and you receive the following error, you might have to add the path to the DB2 JDBC driver to your PATH environment variable:
Database connection failed. The version of the IBM Universal JDBC driver in use is not licensed for connectivity to QDB2/NT databases.
To address this, add the following statement to the PATH environment variable definition:
/usr/opt/db2_08_01/java
Stop and restart the Manage Tivoli Enterprise Monitoring Services utility when this complete.
124 Tivoli Management Services Warehouse and Reporting

Figure 3-12 Linux and AIX agent parameters tab
6. Start the Warehouse Proxy agent by performing one of the following actions:
– To start from the Manage Tivoli Enterprise Services window, right-click Warehouse Proxy and select Start.
– To start the Warehouse Proxy agent from the command line, enter the following command:
./itmcmd agent start hd
In this command, hd is the product code for the Warehouse Proxy agent.
Chapter 3. Warehousing in action 125
3.3 Configuring multiple Warehouse Proxies
Fix Pack 003 introduces support for multiple Warehouse Proxies within a single hub monitoring server environment. The provision for multiple Warehouse Proxies provides for greater scalability and performance in historical data collection.
The support for multiple Warehouse Proxies has the following important features:
� All Warehouse Proxy agents within a single hub monitoring server environment export data to a single Tivoli Data Warehouse.
� Each Warehouse Proxy agent is associated with a subset of monitoring server instances that you specify when you configure the proxy agent. Each Warehouse Proxy exports data only for monitoring agents that report to one of the monitoring servers on the specified list.
The following sequence of events explains how the monitoring agents, which collect the data for historical reports, know which Warehouse Proxy agent to use:
1. When a Warehouse Proxy agent starts, it registers with the global location broker on the hub monitoring server, and sends it the list of monitoring servers that it is configured to serve. This registration process is repeated every hour.
2. Each monitoring server queries the global location broker at regular intervals to determine which Warehouse Proxy it is associated with. The monitoring server then sends the address of this Warehouse Proxy to all of its child monitoring agents to use during historical data exports. You can change the default query interval of 60 minutes to some other value.
When a Warehouse Proxy agent registers with the global location broker, it is registered as the default proxy agent if no other proxy agent is already configured as the default. When a monitoring server queries the global location broker for its associated Warehouse Proxy, the default proxy agent is used if that monitoring server is not in the list of servers for any proxy agent.
Note: The procedure for installing a proxy agent into an environment with multiple proxy agents is the same as the procedure for installing a single proxy agent.
126 Tivoli Management Services Warehouse and Reporting

To install and configure each Warehouse Proxy agent, perform the following steps:
1. Associate each proxy agent with the list of monitoring servers that you want the proxy agent to serve:
a. Open the environment file for the proxy agent:
• Windows: ITMinstall_dir\TMAITM6\KHDENV• Linux: ITMinstall_dir/config/hd.ini
Where ITMinstall_dir is the directory where you installed the product.
b. Add the environment variable KHD_WAREHOUSE_TEMS_LIST to the file and set it to specify a space-delimited list of monitoring server instance names. For example:
KHD_WAREHOUSE_TEMS_LIST=REMOTE_TEMS1 REMOTE_TEMS2
The name of a monitoring server is specified when the server is installed. The default name of a monitoring server is HUB_host_name (for a hub monitoring server) or REMOTE_host_name (for a remote monitoring server), where host_name is the short host name.
2. Optionally, modify the interval at which a monitoring server queries the global location broker to determine which Warehouse Proxy it is associated with:
a. Open the environment file for the monitoring server:
• Windows: ITMinstall_dir\CMS\KBBENV• UNIX or Linux: ITMinstall_dir/config/ms.ini
Where ITMinstall_dir is the directory where you installed the product.
b. Change the following entry to specify a different query interval:
KPX_WAREHOUSE_REGCHK=60
The query interval is specified in minutes. The default value is 60 minutes.
3. Start the Warehouse Proxy agent.
– To start a Warehouse Proxy agent on Windows or Linux from the Manage Tivoli Enterprise Services window, right-click Warehouse Proxy and select Start.
– To start a Warehouse Proxy agent on Linux, from the command line, enter the following command:
./itmcmd agent start hd
In this command, hd is the product code for the Warehouse Proxy agent.
Chapter 3. Warehousing in action 127

Verifying the configurationUse the following trace settings to verify the configuration:
� To verify that a Warehouse Proxy is registering with the hub monitoring server and placing the correct entries into the global location broker:
a. Open the environment file for the proxy agent:
• Windows: ITMinstall_dir\TMAITM6\KHDENV• Linux: ITMinstall_dir/config/hd.ini
Where ITMinstall_dir is the directory where you installed the product.
b. Add the following entry to the KBB_RAS1 trace setting:
KBB_RAS1=ERROR(UNIT:khdxrpcr STATE)
This setting prints the value of KHD_WAREHOUSE_TEMS_LIST and shows any errors associated with its components.
� To determine which Warehouse Proxy a particular monitoring server uses for its agents:
a. Open the environment file for the monitoring server:
• Windows: ITMinstall_dir\CMS\KBBENV• UNIX or Linux: ITMinstall_dir/config/ms.ini
Where ITMinstall_dir is the directory where you installed the product.
b. Add the following entry to the KBB_RAS1 trace setting:
KBB_RAS1=ERROR(UNIT:kprwhpx STATE)
This setting prints entries in the RAS log of the monitoring server when a registration change occurs. The entry specifies the name and address of the new Warehouse Proxy agent that the monitoring server is using.
3.4 Configuring the Summarization and Pruning agent
The Summarization and Pruning agent is responsible for aggregating historical data and for pruning the size of the database according to the required guidelines. This section focuses on how to configure the Summarization and Pruning agent.
128 Tivoli Management Services Warehouse and Reporting

3.4.1 On a Windows system
To configure the Summarization and Pruning agent on a Windows system, perform the following steps:
1. From your Windows desktop, click Start → Programs → IBM Tivoli Monitoring → Manage Tivoli Enterprise Monitoring Services.
2. Right-click Warehouse Summarization and Pruning Agent. Select Reconfigure, as shown in Figure 3-13.
Figure 3-13 Configuring Summarization and Pruning agent through monitoring console
3. In the Advanced Configuration window, click OK, as shown in Figure 3-14.
Figure 3-14 Configuring Summarization and Pruning agent connection protocol
Chapter 3. Warehousing in action 129

4. In the new window that opens, click OK.
5. In the Warehouse Summarization and Pruning Agent window (Figure 3-15), click Yes to configure the Summarization and Pruning agent.
Figure 3-15 Summarization and Pruning agent configuration confirmation
6. The Configure Summarization and Pruning Agent window is displayed, as shown in Figure 3-16 on page 131. In the Sources tab, enter the Tivoli Data Warehouse database and Tivoli Enterprise Portal server information. Use the following procedure to update the information:
a. In the JDBC Drivers field:
i. Click Add to open the file browser window to select your JDBC driver. The default is DB2: C:\Program Files\IBM\SQLLIB\java\db2java.zip.
ii. Click OK to close the browser and add the JDBC drivers to the list.
To delete a driver, highlight its entry in the JDBC drivers list and click Delete.
Use this method to collect JDBC drivers to communicate with your Tivoli Data Warehouse database. JDBC drivers are installed separately and each database provides a set of these JDBC drivers.
Important: Use only the type 4 DB2 JDBC driver (because the DB2 legacy driver (type 2) will soon be obsolete). Moreover, the type 4 driver does not need the DB2 client to be installed, which is convenient when the database is remote.
� The type 4 driver uses these files: db2jcc.jar, db2jcc_license_cu.jar.
� The type 2 driver is uses this file: db2java.zip.
This implies that you have change the default settings in the Windows Summarization and Pruning configuration panel (see Figure 3-16 on page 131). You should also change the Warehouse driver parameter to: com.ibm.db2.jcc.DB2Driver, which is not the default.
130 Tivoli Management Services Warehouse and Reporting

b. Enter the Warehouse URL, Driver, Schema, user ID, and password. Note that the Warehouse URL is in the following format: "jdbc:+ instance name + database name”. As for the user ID, you can use the default database user that is created (ITMUser) when installing Tivoli Data Warehouse or any other user as long as this user is defined in the RDBMS server.
c. Click Test database connection to ensure that you can communicate with your Tivoli Data Warehouse database. Remember, Test database connection button has to report success.
d. Enter the Tivoli Enterprise Portal Server host and port. It is very important to provide the correct host name and port.
Figure 3-16 Configuring Summarization and Pruning agent
Chapter 3. Warehousing in action 131
7. Click the Defaults tab and select the settings for your summarization and pruning information, as shown in Figure 3-17 on page 133.
If you click Reset, all settings in this window return to the default settings.
a. If you do not want to use the defaults, select the appropriate time periods that you want in the Summarization section to change your summarization values.
b. To change your Pruning settings:
i. Select the time periods for the pruning of your data: Keep yearly data for, Keep quarterly data for, and so on.
ii. In the next field, enter the value for the time periods that you want.
iii. Select the time period that you want. For example, if you want to prune hourly data when it becomes 30 days old, select Hourly, specify 30, and choose Days as the time period from the drop-down list.
c. To keep the changes that you make, select the Apply settings to default tables for all agents check box.
Important: The defaults specified in this panel are only configured the first time that the Summarization and Pruning agent is started. If you start the Summarization and Pruning agent and then reconfigure the agent and change these settings, they have no effect.
Important: We recommend that you do not select the “Apply settings to default tables for all agents” check box as it may generate more tables in the Tivoli Data Warehouse database than you really need. For instance, the Linux agent has the Linux_Process table set as a default table. A large amount of data is generated for this table and may cause performance issue if you have not planned to reserve enough space in your Tivoli Data Warehouse database.
Also, for the ITM5 integration agents, all the tables of all the ITM5 agents are considered as default. This also may be more than what you really need.
132 Tivoli Management Services Warehouse and Reporting

Figure 3-17 Configuring the data collection and pruning
8. Click the Scheduling tab and select the scheduling information, as shown in Figure 3-18.
a. Schedule the agent to run every x days.
b. Select the hour of the day when you want the summarization to run. The default is to run every day at 2 a.m.
Chapter 3. Warehousing in action 133

Figure 3-18 Scheduling the data collection and pruning
9. Click the Work Days tab (Figure 3-19 on page 135) and specify shift information and vacation settings:
a. Select the day the week starts on.
b. If you want to specify shifts, select Specify shifts. The default settings for this field are listed in the Peak Shift Hours field on the right side of the window. To change these settings, select the hours that you want in the Off Peak Shift Hours field and click the right arrow button to add them to the Peak Shift Hours field.
c. To change your vacation settings, select Specify vacation days. If you do not want to set your vacation days, clear this check box.
d. Select Yes to count weekends as vacation days.
Note: Changing the shift information after the data is summarized can create an inconsistency in the data. Data that is collected and summarized cannot be recalculated with the new shift values.
134 Tivoli Management Services Warehouse and Reporting

e. To add vacation days, click Add and select the vacation days that you want to add from the calendar.
f. The days that you select are displayed in the field below the Count weekends as vacation field. If you want to delete any days that you have previously chosen, select them and click Delete.
Figure 3-19 Defining shift periods and vacation settings
10.Click the Additional Parameters tab (Figure 3-20):
a. Specify the age of the hourly and daily data that you want summarized. Values are 0 through n. The default is 1 for hourly data and 0 for daily data.
b. Specify the maximum number of rows that can be deleted in a single database transaction. The values are 1 through n. The default is 1000.
Chapter 3. Warehousing in action 135

c. Choose the time zone that you want to use from the drop-down list. If the Tivoli Data Warehouse and agents that are collecting data are all not in the same time zone, and all the data is stored in the same database, use this option to identify the time zone that you want to use.
Figure 3-20 Configuring additional parameters
136 Tivoli Management Services Warehouse and Reporting

11.In the next window, to save your configuration, click Yes, as shown in Figure 3-21.
Figure 3-21 Saving the Summarization and Pruning agent configuration
12.Restart the Summarization And Pruning agent by double-clicking it.
To change the default data summarization, pruning configurations, or both after installing the Summarization and Pruning agent, use the History Collection Configuration window in the Tivoli Enterprise Portal.
Chapter 3. Warehousing in action 137

3.4.2 On a Linux or a UNIX system
To configure the Summarization and Pruning agent on AIX or Linux, perform the following steps:
1. On a Linux or UNIX system, cd to install_dir/bin and type:
./itmcmd manage
2. Right-click Summarization and Pruning Agent and select Configure, as shown in Figure 3-22.
Figure 3-22 Configuring Summarization and Pruning agent through monitoring console
Important: An X Window System is required to configure the Summarization and Pruning agent on AIX or Linux.
Note: For more details about this command, run this phrase: itmcmd manage ?. Alternatively, see the IBM Tivoli Monitoring Installation and Setup Guide, GC32-9407.
138 Tivoli Management Services Warehouse and Reporting

3. In the Configure Summarization and Pruning Agent window (Figure 3-23), review the TEMS Connection settings. Click the Agent Parameters tab.
Figure 3-23 Summarization and Pruning agent connection protocol
Note: The buttons Save, Reload, and Cancel are visible only on a UNIX or Linux system:
� Click Save after you have completed all your settings correctly.
� Click Reload to reload the original values.
� Click Cancel, at any time, to cancel out of the Configure Summarization and Pruning Agent window. You are prompted to save any data that you have changed.
Chapter 3. Warehousing in action 139

4. In the Sources tab (Figure 3-24 on page 141), enter the Tivoli Data Warehouse database and Tivoli Enterprise Portal server information. Most of the fields in this window have default options. Before performing any update, confirm that the default configuration is accurate. Use the following procedure to update the information:
a. In the JDBC drivers field:
i. Click Add to open the file browser window to select your JDBC driver.
ii. Click OK to close the browser and add the JDBC drivers to the list. To delete a driver, highlight the entry in the JDBC drivers list and click Delete.
Use this method to collect JDBC drivers to communicate with your Tivoli Data Warehouse database. JDBC drivers are installed separately and each database provides a set of these JDBC drivers.
b. Enter the Warehouse URL, Driver, Schema, user ID, and password.
c. Click Test database connection to ensure that you can communicate with your Tivoli Data Warehouse database.
d. Enter the Tivoli Enterprise Portal Server host and port if you do not want to use the defaults.
140 Tivoli Management Services Warehouse and Reporting

Figure 3-24 Configuring Summarization and Pruning agent
5. Click the Defaults tab (Figure 3-25 on page 142) and select the settings for your summarization and pruning information.
a. If you do not want to use the defaults, select the appropriate time periods that you want in the Summarization section to change your summarization values.
b. To change your pruning settings:
i. Select the time periods for the pruning of your data: Keep yearly data for, Keep quarterly data for, and so on.
ii. In the next field, enter the value for the time periods that you want.
iii. Select the time period that you want. For example, if you want to prune hourly data when it becomes 30 days old, select Hourly, specify 30, and choose Days as the time period from the drop-down list.
Chapter 3. Warehousing in action 141

c. To keep the changes that you make, select the Apply settings to default tables for all agents check box.
Figure 3-25 Configuring the data collection and pruning
Important: We recommend that you do not select the “Apply settings to default tables for all agents” check box as it may generate more tables in the Tivoli Data Warehouse database than you really need. For instance, the Linux agent has the Linux_Process table set as a default table. A large amount of data is generated for this table and may cause performance issue if you have not planned to reserve enough space in your Tivoli Data Warehouse database.
Also, for the ITM5 integration agents, all the tables of all the ITM5 agents are considered as default. This also may be more than what you really need.
142 Tivoli Management Services Warehouse and Reporting

6. Click the Scheduling tab (Figure 3-26) and select the scheduling information:
a. Schedule the agent to run every x days.
b. Select the hour of the day that you want the summarization to run. The default is to run every day at 2 a.m.
Figure 3-26 Scheduling the data collection and pruning on a Linux or AIX system
Chapter 3. Warehousing in action 143

7. Click the Work Days tab (Figure 3-27 on page 145) and specify the shift information and vacation settings:
a. Select day the week starts on.
b. If you want to specify shifts, select the Specify shifts check box. The default settings for this field are listed in the Peak Shift Hours field on the right side of the window. To change these settings, select the hours that you want in the Off Peak Shift Hours field and click the right arrow button to add them to the Peak Shift Hours field.
c. To change your vacation settings, select the Specify vacation days check box. If you do not want to set your vacation days, clear this check box.
d. Click Yes to count weekends as vacation days.
e. To add vacation days, click Add and select the vacation days that you want to add from the calendar.
f. The days that you select are displayed in the field below the Count weekends as vacation field. If you want to delete any days that you have previously chosen, select them and click Delete.
Note: Changing the shift information after the data is summarized can create an inconsistency in the data. Data that is collected and summarized cannot be recalculated with the new shift values.
Note: On UNIX or Linux, right-click to select the month and year.
144 Tivoli Management Services Warehouse and Reporting

Figure 3-27 Defining shift periods and vacation settings
8. Click the Additional Parameters tab (Figure 3-28):
a. Specify the age of the hourly and daily data that you want summarized. Values are 0 through n. The default is 1 for hourly data and 0 for daily data.
b. Specify the maximum number of rows that can be deleted in a single database transaction. The values are 1 through n. The default is 1000.
c. Choose the time zone that you want to use from the drop-down list. If the Tivoli Data Warehouse and agents that are collecting data are all not in the same time zone, and all the data is stored in the same database, use this option to identify the time zone that you want to use.
Chapter 3. Warehousing in action 145

Figure 3-28 Configuring additional parameters on a Linux or UNIX system
9. Click Save after you complete the configuration.
10.Start the Summarization and Pruning agent by performing one of the following actions:
– To start from the Manage Tivoli Enterprise Services window, right-click the Summarization and Pruning agent and select Start.
– To start the Summarization and Pruning agent from the command line, enter the following command:
./itmcmd agent start sy
Where sy is the product code for the Summarization and Pruning agent.
To change the default data summarization, pruning configurations, or both after you install the Summarization and Pruning agent, use the History Collection Configuration window in the Tivoli Enterprise Portal. See the following section.
146 Tivoli Management Services Warehouse and Reporting
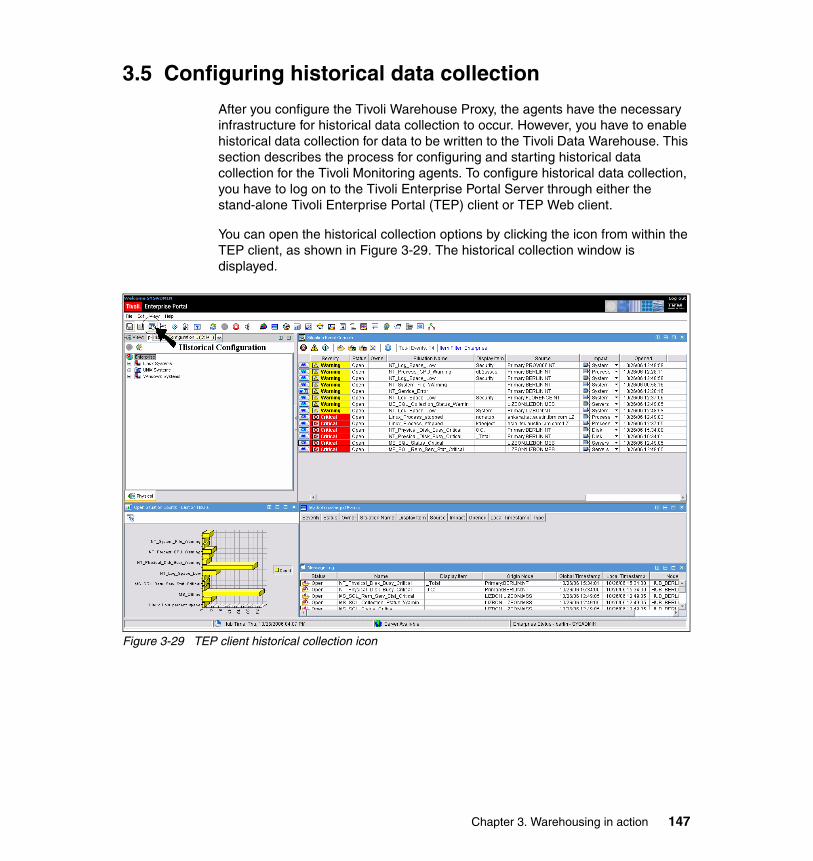
3.5 Configuring historical data collection
After you configure the Tivoli Warehouse Proxy, the agents have the necessary infrastructure for historical data collection to occur. However, you have to enable historical data collection for data to be written to the Tivoli Data Warehouse. This section describes the process for configuring and starting historical data collection for the Tivoli Monitoring agents. To configure historical data collection, you have to log on to the Tivoli Enterprise Portal Server through either the stand-alone Tivoli Enterprise Portal (TEP) client or TEP Web client.
You can open the historical collection options by clicking the icon from within the TEP client, as shown in Figure 3-29. The historical collection window is displayed.
Figure 3-29 TEP client historical collection icon
Chapter 3. Warehousing in action 147

You can configure the agent attribute groups, as shown by the steps in Figure 3-30.
Figure 3-30 History collection configuration
The steps presented in Figure 3-30 are as follows:
1. Select the history configuration icon from the Tivoli Enterprise Portal Server graphical user interface (GUI).
2. Highlight the specific attribute groups that you want to collect historical data for and add the configuration settings. If you select the Show Default Groups button, the panel highlights all of the preconfigured attribute groups for the current agent. This is useful if it is the first time that you are setting up an agent for historical collection.
3. Select the Configure Groups button for the highlighted groups. If it is the first time that you are configuring an attribute group and you have selected Show Default Groups, all of the default settings that you defined in the Summarization and Pruning agent configuration are loaded.
4. Highlight the specific groups again and select the Start button.
148 Tivoli Management Services Warehouse and Reporting

Figure 3-31 shows an example of how to configure the default attribute groups for the Linux OS agent.
Figure 3-31 History configuration panel
The fields and buttons in Figure 3-31 include:
� Collection Interval (radio buttons)
The collection interval sets the default time to collect data on the Tivoli Enterprise Monitoring Agent or Tivoli Enterprise Monitoring Server to the
Note: Note that if the warehouse interval is off, then you have to manage the short-term binary files. Otherwise, they will grow indefinitely. You can also use the krarloff utility to manage files.
Chapter 3. Warehousing in action 149

binary files. The default 5-minute value might be a little low for all default attribute groups. You can configure this for one group or a list of highlighted groups.
� Collection Location (radio buttons)
This is the default location for storing the binary files. We recommend that whenever possible you select Tivoli Enterprise Monitoring Agent (at the agent).
� Warehouse Interval (radio buttons)
This is the interval at which the Tivoli Enterprise Monitoring Agent or Tivoli Enterprise Monitoring Server binary data is uploaded to the Warehouse Proxy agent. The options are 1 hour, daily, or off. For environments with a lot of agents, we recommend that you select 1 hour. If the warehouse interval off button is selected, no data is collected in the Tivoli Data Warehouse for the selected attribute groups. However, if the attribute group is started with the interval set to off, then the binary data will be collected on the agent; but, it will never be pruned. For information about pruning the local binary data in this special case, see IBM Tivoli Monitoring Administering Tivoli Monitoring Guide, SC32-9408.
� Summarization
These settings specify which summarization tables are created in the Tivoli Data Warehouse for the specific attribute groups.
� Pruning settings
Use these settings to specify how long to keep the data in the Tivoli Data Warehouse. Data that is older than the prune settings is removed from the Tivoli Data Warehouse.
� Configure Groups (button)
Click this to configure the highlighted attribute groups’ historical configuration settings. You can highlight a single group or multiple groups.
� Unconfigure Groups (button)
Click this to unconfigure the highlighted attribute groups’ historical configuration settings. You can highlight a single group or multiple groups.
� Show Default Groups (button)
This highlights all of the predefined (by the agent) attribute groups. Click this to configure the highlighted attribute groups’ historical configuration settings. You can highlight a single group or multiple groups.
� Start Collection (button)
Click this to start all of the highlighted attribute groups. You can highlight a single group or multiple groups.
150 Tivoli Management Services Warehouse and Reporting
� Stop Collection (button)
Click this to stop all of the highlighted attribute groups. You can highlight a single group or multiple groups. If one of the highlighted attribute groups is already stopped, this button will be grayed out.
� Refresh Status (button)
Click this to refresh the status (Started or Stopped) of all the agents.
3.6 Tivoli Enterprise Console and Data Warehouse integration
Tivoli Enterprise Console is a Tivoli enterprise event collection, correlation, and management product. It consists of event collectors, a persistent store, a prolog correlation engine, event consoles, and Tivoli Management Framework automated tasking. Clients have often had problems with the lack of or difficulty of self-monitoring, visualization, and optimization within the product. The IBM Tivoli Monitoring for Tivoli Enterprise Console agent remedies many of these limitations.
The Tivoli Enterprise Console Health Monitoring Agent obtains metric data by:
� Monitoring the Tivoli Enterprise Console processes
Monitoring the Tivoli Enterprise Console processes can provide information such as the amount of system resources (memory, CPU) consumed, whether or the processes are running, and so on.
� Querying the event repository
The RDBMS Interface Module (RIM) API is used to query the event repository. This enables event distribution statistics to be gathered. This provides a snapshot of the event data.
� Reading metric log files that are written by the Tivoli Enterprise Console Server processes
Because the Tivoli Enterprise Console Health Monitoring Agent is a Tivoli Monitoring V6.1 agent, it has the ability to archive and warehouse its data into the Tivoli Data Warehouse like any other Tivoli Monitoring agent. This
Important: If you have selected the Apply settings to default tables for all agents check box when you configured the Summarization and Pruning agent, these historical and summarization settings will already be set for all agents. When they are set, historical data collection is started the first time that the Summarization and Pruning agent runs after configuration.
Chapter 3. Warehousing in action 151

warehousing functionality exceeds that provided by the Tivoli Data Warehouse V1.3 Tivoli Enterprise Console Warehouse Enablement Packs.
The agent provides three classes of data about the managed service (Tivoli Enterprise Console):
� Availability: The availability of the Tivoli Enterprise Console Server processes
� Resource use: The resource use of the Tivoli Enterprise Console Server processes
� Workload: The events workload on the Tivoli Enterprise Console Server
Only the Tivoli Enterprise Console Server components and the event repository are monitored. The agent does not monitor:
� The stand-alone rule engine� Tivoli Enterprise Console gateways, including state correlation� Active Correlation Technology (ACT)
3.6.1 Prerequisites
The following software prerequisites are necessary for the agent to function correctly:
� Tivoli Enterprise Console Fix Pack 5� Tivoli Enterprise Console Interim Fix 3.9.0.5-TEC-00521
� Tivoli Monitoring V6.1 Fix Pack 3
The Tivoli Enterprise Console fixes mentioned previously provide two new Tivoli Enterprise Console command-line interfaces (CLIs) among other things such as adding new options to the .tec_config to enable data collection by Tivoli Enterprise Console for the use of the monitoring agent.
� wesvragt
This is a new executable that ships with Tivoli Enterprise Console 3.9 Fix Pack 5 and is installed with the existing Tivoli Enterprise Console CLI commands. It is responsible for providing data for many of the health agent’s attribute groups. When querying the Tivoli Enterprise Console database, the wesvragt utility uses the RIM API to communicate with the Tivoli Enterprise Console database.
� wagtinit
This command creates the database tables that are required for the wesvragt application. This CLI has to be run only once as a post-installation step for the
1 This provides two new Tivoli Enterprise Console CLIs among other things such as adding new options to the .tec_config to enable data collection by Tivoli Enterprise Console for the use of the monitoring agent.
152 Tivoli Management Services Warehouse and Reporting

health monitoring agent. The wesvragt application can create the tables it requires at run time, but this is not a preferred approach for most clients. Creating a new CLI for creating the tables addresses the following concerns:
– Security
Many clients do not want the Tivoli Enterprise Console RIM user to have create table privileges. Temporarily granting these privileges during installation is more acceptable.
– Physical storage
If the wesvragt process creates tables dynamically, the tables can be created in the default table space in the database. The wagtinit CLI provides an option to specify the table space.
The following new configuration values are also added to the Tivoli Enterprise Console Server configuration:
� tec_log_metrics
When this value is YES, the Tivoli Enterprise Console components that are instrumented for the health monitoring gather metric data and write the logs to the value specified in tec_log_metric_dir.
� tec_max_log_entries
This is the maximum number of entries (lines) that can be written to a single log file. Each line uses a maximum of approximately 200 bytes.
� tec_rule_sample_period
The value (specified in seconds) is used to determine how often Tivoli Enterprise Console writes the event type relevance metric data to a file. The counters for the metric are reset when the data is written out. The minimum value allowed is 120 seconds. If the value is less than 120 seconds but not 0, it is set to 120 seconds. If the value is not set, the default value is 120 seconds. A value of 0 indicates that the rule engine metrics is not gathered.
� tec_reception_sample_period
The value (specified in seconds) is used to determine how often Tivoli Enterprise Console writes the event throughput metric data from Tivoli Enterprise Console reception to a file. Counters maintained for a time interval are reset when the data is written out.
Smaller values cause data to be written to disk more often and depending on the event stream, can cause less memory to be consumed. A value of 0 turns off the gathering of event throughput metric data.
Values are not likely to be written to the log file at the exact time interval specified. To optimize performance, a timer is not maintained in the Tivoli
Chapter 3. Warehousing in action 153

Enterprise Console reception code. The main logic of the Tivoli Enterprise Console Reception component consists of a single while loop. Within the loop, a lot of work is performed, including the reception of new events, passing events to Tivoli Enterprise Console rule, and so on. At the bottom of the loop, the code checks to see if the metrics are being gathered and whether the tec_reception_sample_period time interval has elapsed. If a lot of work is performed in the while loop, the actual time interval can be significantly larger.
� tec_rule_sample_class_size
This value specifies the maximum number of different classes the metric keeps track of. If the number of classes that we are keeping track of is greater than the maximum number of classes allowed, we output the current metric and reset the counters. The minimum value allowed is 200. A value of 0 or if the keyword is not specified, this indicates that the rule engine metrics are not gathered.
� tec_log_metric_dir
This is the directory where the metric log files are written and is by default $DBDIR/tec_health.
3.6.2 Configuring Tivoli Enterprise Console
After the agent is installed on your Tivoli Enterprise Console Server, perform the following steps to set up the Tivoli Enterprise Console product to support monitoring.
1. On the Tivoli Enterprise Console event server, set up the TME by running the setup_env.cmd (Windows) or setup_env.sh (Linux or UNIX) script.
2. On the Tivoli Enterprise Console event server, create the working tables that the monitoring agent uses to store gathered metrics from the event repository. Use this command:
wagtinit {-c|-r} [-t tablespace] [-p] [-d]
The parameters are as follows:
– -c: This parameter creates the tables and views for the agent. You must specify either the -c or the -r parameter.
– -r: This parameter removes the tables and views for the agent. You must specify either the -c or the -r parameter.
Important: To be able to run Tivoli Management Environment® (TME®) tasks, the agent must be started by a user with sufficient TME privileges.
154 Tivoli Management Services Warehouse and Reporting

– -t tablespace: This parameter specifies the location for the working tables. Replace tablespace with one of the following values:
• For a DB2 or Oracle database, the name of an existing tablespace• For an IBM Informix® database, the name of an existing dbspace• For an SQL Server database, the name of an existing file group• For a Sybase database, the name of an existing segment
If you do not specify the -t parameter, the command uses the default location for the user specified in the Tivoli Management Framework RIM object.
– -p: This parameter creates the specified SQL statements without creating or removing the tables and views. Use this option in combination with -c or -r if you want to modify the generated SQL before creating or removing the tables and views.
– -d: This parameter specifies that the wagtinit command must produce an output of additional debugging messages.
The following command creates the required tables and views in the default location:
wagtinit -c
3. Modify the Tivoli Enterprise Console event server configuration to enable gathering of performance metrics. Configure the following parameters in the $BINDIR/TME/TEC/.tec_config configuration file:
– tec_log_metrics=YES|NO
This enables or disables the gathering of performance metrics. Setting this parameter to NO disables the gathering of all performance metrics.
– tec_rule_sample_class_size=size
This is the number of performance metrics counters to keep in memory; one counter is used for each unique event class name encountered. The minimum valid value for this parameter is 200 counters. Setting this parameter to 0, or omitting it, disables the gathering of event activity metrics.
Note: The wagtinit command creates tables and views using the user ID defined in the RIM object. This user ID must have CREATE VIEW and CREATE TABLE privileges for the command to function. The database administrator can grant these privileges temporarily and revoke them after the wagtinit command creates the tables and views.
Chapter 3. Warehousing in action 155

– tec_rule_sample_period=seconds
This is the sample period (in seconds) to use when monitoring event activity in the Tivoli Enterprise Console rule engine. Setting this parameter to 0, or omitting it, disables the gathering of event activity metrics.
– tec_reception_sample_period=seconds
This is the sample period (in seconds) to use when gathering performance metrics for Tivoli Enterprise Console event reception. Setting this parameter to 0 disables the gathering of performance metrics for event reception.
– tec_max_log_entries=lines
This the maximum number of lines to write to the log files used for performance metrics. Each line uses a maximum of approximately 200 bytes of disk space. As many as two log files are created for each metric attribute group. The minimum valid value for this parameter is 5000 lines (approximately 1 MB of disk space).
– tec_log_metrics_dir=path
This is the directory to use for storing the performance metrics log files. This value must match the value entered in the agent configuration. On Windows systems, ensure that the path does not include any spaces (for example, specify C:\Progra~1\... instead of C:\Program Files\...).
4. On the Tivoli Enterprise Console event server, create the directory specified by the tec_log_metrics_dir parameter in the .tec_config configuration file. Make sure that the agent user account has sufficient privileges to read files in this directory.
5. Restart the Tivoli Enterprise Console event server.
If you are using a Sybase or SQL Server database, you might also have to modify your database configuration. Because the event distribution workspaces use a significant amount of temporary workspace for queries, make sure that the tempdb database has sufficient space allocated. The amount of space that is required is proportional to the number of events in the event repository and is increased if you enable the event source and host dimensions for the event distribution data. The minimum recommended allocation for the tempdb database is 100 MB.
Note: If you do not allocate sufficient space for the tempdb database, the Tivoli Enterprise Console product might stop functioning. If this happens, messages in the database log files indicate that there is insufficient temporary space available.
156 Tivoli Management Services Warehouse and Reporting

3.6.3 Configuring the Tivoli Monitoring for Tivoli Enterprise Console agent
Provide the following configuration values for the agent to operate. When you configure an agent, a panel is displayed, which you can use to type in each value. When there is a default value, this is pre-entered into the field. If a field represents a password, two entry fields are displayed. You must enter the same value in each field. The values that you type are not displayed. This helps to maintain the security of these values.
The following fields are defined for this agent:
� Tab: Event Distribution
� Field: Include host dimension
� Type: Restricted; Flag to indicate whether to include the host dimension in the event distribution data
In other words, this indicates whether to gather event distribution statistics by the event host slot.
� Tab: Event Distribution
� Field: Include event source dimension
� Type: Restricted; Flag to indicate whether to include the event source dimension in the event distribution data
In other words, this indicates whether to gather event distribution statistics by the event source slot.
� Tab: Paths
� Field: Log directory
� Type: String
This is the directory that contains the Tivoli Enterprise Console metric log files. Value must match tec_log_metrics_dir value in the .tec_config file. Use a fully qualified path that does not include any environment variable references. On Windows systems, ensure that the path does not include any spaces or long file names.
Note: This setting is disabled by default. Enabling this option can negatively affect the performance.
Note: This setting is disabled by default. Enabling this option can negatively affect the performance.
Chapter 3. Warehousing in action 157

� Tab: Event Distribution
� Field: String to represent null values
� Type: String
Value that represents a NULL or blank value; This string must be no more than 64 characters in length. Events might not have a host or source value set. The user can choose to not gather event distribution statistics by source or by host. A value that represents a NULL or blank value has to be returned with each attribute group. For example, N/A. The user must be able to specify the value.
� Tab: Event Distribution
� Field: Refresh Interval
� Type: Numeric
The maximum time, in minutes, that the event distribution data might be cached; A value of 0 indicates that the distribution is recalculated every time a request is made for the data.
The configuration steps are detailed in the following sections.
Note: The default value for this field contains environment variable references. Change it to a fully qualified path for certain workspaces to function correctly.
Note: The 0 value setting is useful for attribute groups such as the event distribution attribute groups, which might cache data in a database. A value of 0 causes the agent to query the Tivoli Enterprise Console event database and to populate working tables each time the data is requested. A manual or automatic refresh from a Tivoli Enterprise Portal Server console or a situation can trigger the agent to obtain data. This can significantly reduce the performance of Tivoli Enterprise Console, because table spaces scans are being performed. Locking problems can be avoided by using uncommitted reads on platforms that support them (DB2). Oracle never locks on reads, therefore locking is not an issue on that platform.
158 Tivoli Management Services Warehouse and Reporting

For Windows systemsTo configure Tivoli Monitoring agent for Tivoli Enterprise Console on a Windows system, perform the following steps:
1. From your Windows desktop on your Tivoli Enterprise Console event server, click Start → Programs → IBM Tivoli Monitoring → Manage Tivoli Enterprise Monitoring Services.
2. Right-click Monitoring Agent for Tivoli Enterprise Console and click Reconfigure, as shown in Figure 3-32.
Figure 3-32 Configuring monitoring agent for Tivoli Enterprise Console
Chapter 3. Warehousing in action 159

3. The Advanced Configuration window opens as shown in Figure 3-33. Click OK.
Figure 3-33 Configuring Tivoli agent for Tivoli Enterprise Console connection protocol
4. In the new window that opens, click OK.
160 Tivoli Management Services Warehouse and Reporting

5. In the Paths tab (Figure 3-34), enter the Tivoli Enterprise Console health log directory, as described in 3.6.2, “Configuring Tivoli Enterprise Console” on page 154.
Figure 3-34 Configuring Tivoli agent for Tivoli Enterprise Console: Health log path
6. In the Event Distribution tab (Figure 3-35), enter the required settings, as described in 3.6.2, “Configuring Tivoli Enterprise Console” on page 154. After you configure the settings as required, click OK.
Note: Enter the fully qualified path name in this field.
Chapter 3. Warehousing in action 161

Figure 3-35 Configuring Tivoli agent for Tivoli Enterprise Console: Event distribution settings
7. Restart the monitoring agent for Tivoli Enterprise Console by double-clicking it. Alternatively, right-click and select Start.
For Linux or UNIX systemsTo configure Tivoli Monitoring agent for Tivoli Enterprise Console on a Linux or UNIX system, perform the following steps
1. To configure the Tivoli Monitoring agent for Tivoli Enterprise Console, you have to log on to the server and issue the following command from the %InstallDir%/IBM/ITM/bin directory:
./itmcmd config -A ka
The following line is displayed:
Agent configuration started...
2. The following questions enable you to configure the configuration options for the agent. These are explained in more detail in 3.6.2, “Configuring Tivoli Enterprise Console” on page 154. Example 3-1 shows the settings that are requested.
162 Tivoli Management Services Warehouse and Reporting

Example 3-1 Settings questions
Edit 'Paths' settings? (default is: Yes):Log Directory (default is: $DBDIR/tec_health):Edit 'Event Distribution' settings? (default is: Yes):Refresh Interval (default is: 15):Include event source dimension Type number of item from the below list 1. NO 2. YES (default is: DIST_BY_SOURCE_FALSE):Include host dimension Type number of item from the below list 1. NO 2. YES (default is: DIST_BY_HOST_FALSE):String to represent null values (default is: N/A):
3. The agent asks to configure the connection information to the Tivoli Enterprise Monitoring Server. Example 3-2 shows the configuration values.
Example 3-2 Configuration values
Will this agent connect to a TEMS? [YES or NO] (Default is: YES):TEMS Host Name (Default is: belfast):
Network Protocol [ip, sna, ip.pipe or ip.spipe] (Default is: ip.pipe):
Now choose the next protocol from one of these: - ip - sna - ip.spipe - noneNetwork Protocol 2 (Default is: none):IP.PIPE Port Number (Default is: 1918):Enter name of KDC_PARTITION (Default is: null):
Configure connection for a secondary TEMS? [YES or NO] (Default is: NO):Enter Optional Primary Network Name or "none" (Default is: none):
After you complete these steps, the following message is displayed:
Agent configuration completed...
The agent is now configured and ready to be started.
Chapter 3. Warehousing in action 163

4. You can start the agent by issuing the following command from the %InstallDir%/IBM/ITM/bin directory:
./itmcmd agent start ka
3.6.4 Collecting the Tivoli Enterprise Console agent historical data
As mentioned previously, the mechanism for collecting IBM Tivoli Monitoring agent data is the same for all agents. Therefore, enabling the historical collection for the Tivoli Enterprise Console agent involves configuring the historical collection as detailed in 3.5, “Configuring historical data collection” on page 147.
In the product name field of the historical configuration window, select Tivoli Enterprise Console Server Agent. Figure 3-36 shows the default groups for the Tivoli Enterprise Console Server Agent.
Figure 3-36 Tivoli Enterprise Console Server Agent: Default historical groups
164 Tivoli Management Services Warehouse and Reporting

3.6.5 Tivoli Enterprise Console agent: Historical workspace examples
IBM Tivoli Monitoring for Tivoli Enterprise Console provides the following predefined workspaces, which are organized by navigator item:
� Tivoli Enterprise Console navigator item
– Tivoli Enterprise Console workspace
� Availability navigator item
– Availability workspace– Tivoli Enterprise Console UI Server Process workspace
� Event Activity navigator item
– Event Activity workspace– Event Activity By Class - Last 24hrs workspace– Event Activity By Class - Last 1 Week workspace– Event Activity By Class - Last 1 Month workspace– Event Activity By Class - Last 1 Year workspace
� Event Distribution navigator item
– Event Distribution workspace– Open Events Distribution workspace– Acknowledged Events Distribution workspace– Closed Events Distribution workspace
� Event Throughput navigator item
– Event Throughput” workspace– Event Throughput - Last 24hrs workspace– Event Throughput - Last 1 Week workspace– Event Throughput - Last 1 Month workspace– Event Throughput - Last 1 Year workspace
To obtain more detailed information about these workspaces, see IBM Tivoli Monitoring for Tivoli Enterprise Console, GC32-1959. We provide some examples of the Tivoli Monitoring for Tivoli Enterprise Console workspaces.
Chapter 3. Warehousing in action 165

Figure 3-37 shows an example of the Event Activity By Class - Last 24hrs workspace.
Figure 3-37 Event Activity By Class - Last 24hrs workspace example
166 Tivoli Management Services Warehouse and Reporting

Figure 3-38 shows an example of the Event Throughput - Last 24hrs workspace.
Figure 3-38 Event Throughput - Last 24hrs workspace example
3.7 Configuring IBM Tivoli Service Level Advisor and Tivoli Data Warehouse integration
IBM Tivoli Service Level Advisor Version 2.1.1 augments the existing extract, transform, and load (ETL) mechanism of pulling data from the Tivoli Data Warehouse versions 1.2 and 1.3 with the addition of the data feed adapter and data extractor architecture, which pulls data from the IBM Tivoli Monitoring V6.1 Data Warehouse. The Tivoli Enterprise Portal Server historical configuration controls the rollup of this data into the data warehouse. Multiple monitoring agents collect data and roll up the data into the data warehouse based on the settings in the Tivoli Enterprise Portal Server historical configuration.
Chapter 3. Warehousing in action 167

Figure 3-39 shows the Tivoli Service Level Advisor integration architecture.
Figure 3-39 Tivoli Service Level Advisor integration
The data feed adapter and the data extractor components extract and summarize raw data points that are collected by IBM Tivoli Monitoring agents and previously written to the Tivoli Data Warehouse component. When summarized, the data feed adapter stores the data points into the IBM Tivoli Service Level Advisor databases.
The data extractor component establishes a connection to the data warehouse to collect and return a range of raw data point records as determined by the data feed adapter. The data feed adapter is responsible for managing and summarizing the raw data (returned from the data extractor) for a specific monitoring agent. It continuously collects the data throughout the day based on how you configure the poll interval. The data that is polled or summarized (this is performed by IBM Tivoli Service Level Advisor, not by Summarization and Pruning agent) is determined by the metadata for the corresponding IBM Tivoli Monitoring agents that you registered during installation. After the data feed adapter has completed polling and has stored the data in the data mart, the data is evaluated and analyzed by IBM Tivoli Service Level Advisor against any existing service level agreements (SLAs).
3.7.1 Configuration steps on all supported systems
To integrate IBM Tivoli Service Level Advisor and Tivoli Data Warehouse V2.1, perform the following configuration steps:
1. Configure an IBM Tivoli Service Level Advisor data source in order for Tivoli Service Level Advisor to be able to read the Tivoli Data Warehouse V2.1 historical data. The dsutil utility shows or updates data source information
V2.1
168 Tivoli Management Services Warehouse and Reporting

for the given data source. If you have IBM Tivoli Service Level Advisor distributed on multiple systems, you must run dsutil on each system that has a service level management (SLM) installation option (SLM Server, SLM Administration Server, or SLM Reports). Use the following command to set the Tivoli Data Warehouse data source:
dsutil tdw [url=<url>] [driver=<driver>] [userid=<userid>] [password=<password>] [minconnections=<min_connections>] [maxconnections=<max_connections>]
The parameters for this command are:
– url=<url>
This specifies the JDBC connection URL necessary to identify the appropriate databases and drivers. See your specific database management system documentation for the format of this URL.
– driver=<driver>
This specifies the JDBC driver used to establish a connection to the database. See your specific database management system documentation for the format of the driver string. For the DB2 application driver, this value is set to COM.ibm.db2.jdbc.app.DB2Driver.
– userid=<userid>
This specifies the user name that is used to connect to the database.
– password=<password>
This specifies the password used to connect to the database.
– minconnections=<min_connections>
This specifies the minimum number of connections to hold in the database connection pool. This value must be greater than zero and less than or equal to the value specified in maxconnections. If this value is not set properly, an error is returned and the parameter is not set.
– maxconnections=<max_connections>
This specifies the maximum number of connections to hold in the database connection pool. This value must be greater than or equal to the value specified in minconnections. This configuration parameter is associated with the DB2 database level configuration parameter maxappls.
The maxappls database configuration parameter specifies the maximum number of concurrent applications that can be connected to a database. If you increase the maxconnections value in dsutil, you might also have to increase the value of maxappls. See IBM DB2 UDB Administration Guide: Implementation V8.2, SC09-4820, for more information about database
Chapter 3. Warehousing in action 169
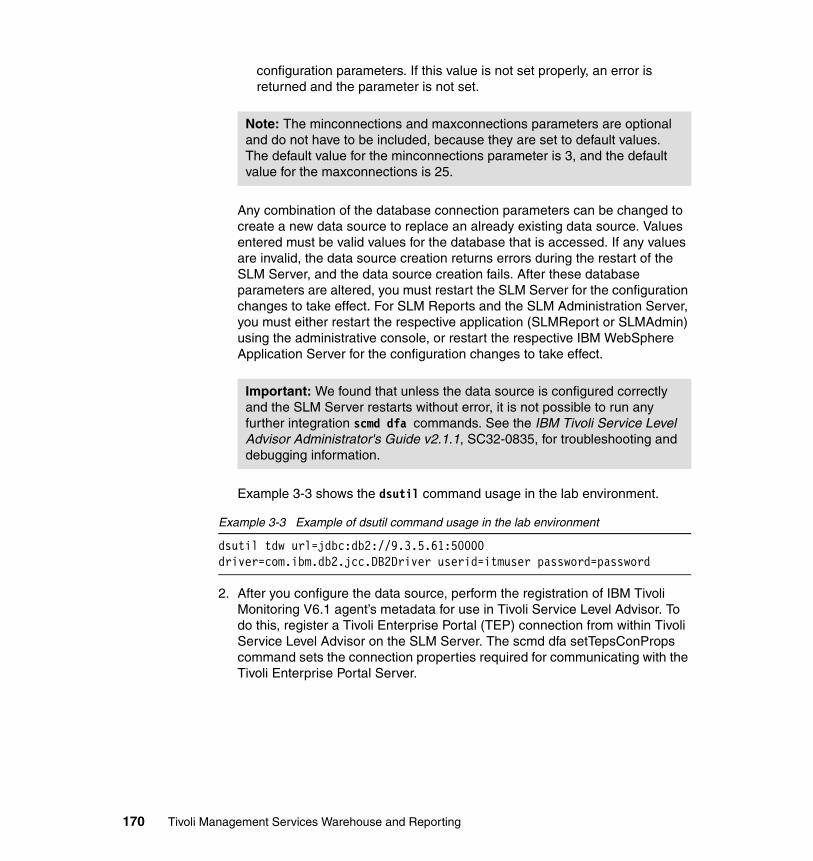
configuration parameters. If this value is not set properly, an error is returned and the parameter is not set.
Any combination of the database connection parameters can be changed to create a new data source to replace an already existing data source. Values entered must be valid values for the database that is accessed. If any values are invalid, the data source creation returns errors during the restart of the SLM Server, and the data source creation fails. After these database parameters are altered, you must restart the SLM Server for the configuration changes to take effect. For SLM Reports and the SLM Administration Server, you must either restart the respective application (SLMReport or SLMAdmin) using the administrative console, or restart the respective IBM WebSphere Application Server for the configuration changes to take effect.
Example 3-3 shows the dsutil command usage in the lab environment.
Example 3-3 Example of dsutil command usage in the lab environment
dsutil tdw url=jdbc:db2://9.3.5.61:50000 driver=com.ibm.db2.jcc.DB2Driver userid=itmuser password=password
2. After you configure the data source, perform the registration of IBM Tivoli Monitoring V6.1 agent’s metadata for use in Tivoli Service Level Advisor. To do this, register a Tivoli Enterprise Portal (TEP) connection from within Tivoli Service Level Advisor on the SLM Server. The scmd dfa setTepsConProps command sets the connection properties required for communicating with the Tivoli Enterprise Portal Server.
Note: The minconnections and maxconnections parameters are optional and do not have to be included, because they are set to default values. The default value for the minconnections parameter is 3, and the default value for the maxconnections is 25.
Important: We found that unless the data source is configured correctly and the SLM Server restarts without error, it is not possible to run any further integration scmd dfa commands. See the IBM Tivoli Service Level Advisor Administrator's Guide v2.1.1, SC32-0835, for troubleshooting and debugging information.
170 Tivoli Management Services Warehouse and Reporting
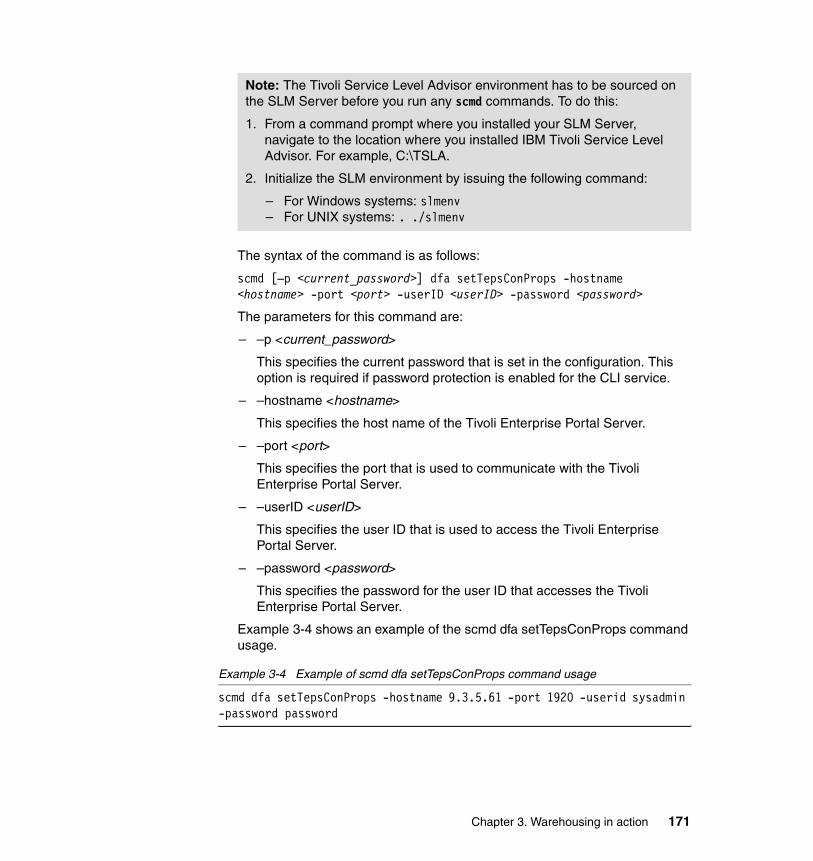
The syntax of the command is as follows:
scmd [–p <current_password>] dfa setTepsConProps -hostname <hostname> -port <port> -userID <userID> -password <password>
The parameters for this command are:
– –p <current_password>
This specifies the current password that is set in the configuration. This option is required if password protection is enabled for the CLI service.
– –hostname <hostname>
This specifies the host name of the Tivoli Enterprise Portal Server.
– –port <port>
This specifies the port that is used to communicate with the Tivoli Enterprise Portal Server.
– –userID <userID>
This specifies the user ID that is used to access the Tivoli Enterprise Portal Server.
– –password <password>
This specifies the password for the user ID that accesses the Tivoli Enterprise Portal Server.
Example 3-4 shows an example of the scmd dfa setTepsConProps command usage.
Example 3-4 Example of scmd dfa setTepsConProps command usage
scmd dfa setTepsConProps -hostname 9.3.5.61 -port 1920 -userid sysadmin -password password
Note: The Tivoli Service Level Advisor environment has to be sourced on the SLM Server before you run any scmd commands. To do this:
1. From a command prompt where you installed your SLM Server, navigate to the location where you installed IBM Tivoli Service Level Advisor. For example, C:\TSLA.
2. Initialize the SLM environment by issuing the following command:
– For Windows systems: slmenv– For UNIX systems: . ./slmenv
Chapter 3. Warehousing in action 171

Restart the SLM database for the new properties to take effect. You can check that the Tivoli Enterprise Portal Server connection is functioning correctly by issuing the command:
scmd dfa listTEPSagents
If the connection is functioning correctly, you see an output similar to Example 3-5.
Example 3-5 scmd dfa listTEPSagents command output
Agents registered on Tivoli Enterprise Portal Server: [9.3.5.61:1920]1: ABA ITM 5.x: Domino2: ABH ITM 5.x: mySAP3: AMA ITM 5.x: Active Directory domain controller4: AMB ITM 5.x: Active Directory replication5: AMD ITM 5.x: DHCP6: AMN ITM 5.x: DNS7: AMS ITM 5.x: Solaris8: AMW ITM 5.x: Windows9: AMX ITM 5.x: UNIX - Linux10: BIW ITM 5.x: MQ Workflow11: BIX ITM 5.x: WebSphere InterChange Server12: CTD ITM 5.x: DB213: CTO ITM 5.x: Oracle14: CTQ ITM 5.x: WebSphere MQ15: CTR ITM 5.x: IBM Informix16: CTW ITM 5.x: Microsoft SQL Server17: CTY ITM 5.x: Microsoft Exchange Server18: GMS ITM 5.x: Siebel19: GWA ITM 5.x: Apache20: GWI ITM 5.x: Internet Information Server21: GWL ITM 5.x: WebLogic22: GWP ITM 5.x: IPlanet23: IQS ITM 5.x: Microsoft Commerce Server
Note: Restart the SLM Server for the new properties to take effect. You can check the properties that are defined by using the following command:
scmd dfa getTepsConProps
You see an output similar to:
Hostname: 9.3.5.61Port: 1920UserID: sysadmin
172 Tivoli Management Services Warehouse and Reporting

24: IQY ITM 5.x: Microsoft Internet Security and Acceleration Server25: IQZ ITM 5.x: Microsoft BizTalk Server26: IUD ITM 5.x: Microsoft UDDI Services27: IUI ITM 5.x: Microsoft Host Integration Server28: IVD ITM 5.x: Microsoft Internet Security and Acceleration Server 200429: IVI ITM 5.x: VMware ESX30: IXA ITM 5.x: Microsoft SharePoint Portal Server31: IXB ITM 5.x: Sybase ASE32: IXT ITM 5.x: Citrix MetaFrame Access Suite33: IYM ITM 5.x: Microsoft Content Management Server34: IZY ITM 5.x: WebSphere Application Server35: KA4 i5/OS36: KIB CCC Logs37: KKA Tivoli Enterprise Console Server Agent38: KLZ Linux39: KNT Windows OS40: KOQ Microsoft SQL Server41: KOR Oracle42: KOY Sybase Server43: KT2 ITCAM Response Time Tracking44: KTM ITM 5.x: Health45: KUD00 DB246: KUX UNIX OS47: MMI ITM 5.x: WebSphere MQ Integrator48: MYS00 MYSQL49: UAG00 UAGENT
3. Register the IBM Tivoli Monitoring V6.1 agent’s metadata for use in IBM Tivoli Service Level Advisor. The scmd dfa register command registers information about monitoring data that can be used by the IBM Tivoli Service Level Advisor in offerings. The registration information links this data to its originator (for example, an IBM Tivoli Monitoring agent) and identifies where
Note: The following products are trademarked:� IBM Domino®� mySAP™� Active Directory® � Siebel®� BizTalk®� SharePoint®� IBM i5/OS®
Chapter 3. Warehousing in action 173

the data can be found for extraction by the data feed adapter. Any mapping information that is required to transform the data from its format in its source location to the data format used by IBM Tivoli Service Level Advisor within its SLM databases is supplied during the registration process.
In this release, the main utilization of the scmd dfa register command is to register data that is found in the IBM Tivoli Monitoring 6.1.0 data warehouse database that is supplied by the IBM Tivoli Monitoring agents. The IBM Tivoli Monitoring 6.1.0 Group Name tables are mapped to the new IBM Tivoli Service Level Advisor component types. The registration process maps the columns in the IBM Tivoli Monitoring 6.1.0 Group Name tables to identify the component names, metrics, and attribute type data objects. The scmd dfa register obtains its information either directly from a connected Tivoli Enterprise Portal Server or from an agent registration file that is in the Extensible Markup Language (XML) format.
Agents can provide an abundance of monitoring data and only a subset is suitable for meaningful service level agreements. The register command enables the user to selectively choose a subset of component types and metrics that IBM Tivoli Service Level Advisor recognizes from the total set that the agent might provide. IBM Tivoli Service Level Advisor contains several best practice files that are tailored for commonly used agents that indicate a subset of component types and metrics that are best suited for use in service level agreements.
Use these best practices when you obtain registration information from the Tivoli Enterprise Portal Server to register only the recommended data. If you have to selectively tailor the metrics or attribute types registered for a particular agent, use the XML formatted agent registration file, which provides detailed control over what is registered. Create the agent registration file by saving the data obtained directly from the Tivoli Enterprise Portal Server. This is covered in more detail in IBM Tivoli Service Level Advisor Command Reference v2.1.1, SC32-0833, and IBM Tivoli Service Level Advisor Administrator's Guide v2.1.1, SC32-0835.
You can run the scmd dfa register command multiple times to add more component types, attributes, or metrics to pre-existing agent registration data. Use the scmd dfa unregister command to unregister agents. It is possible to automatically register agent metadata during your installation of IBM Tivoli Service Level Advisor. Select the Register best practices check box during your installation and it registers the metadata for the component types and metrics that Tivoli Service Level Advisor recommends for the monitoring agents that you have installed in your Tivoli Enterprise Portal Server.
174 Tivoli Management Services Warehouse and Reporting

The usage of the scmd dfa register command is:
scmd [.p <current_password>] dfa register -file <agent-registration-filename> { -compType {<component type code> ... | ALL} | -list | -validateOnly }
Alternatively:
scmd [.p <current_password>] dfa register -teps{ <ITM Agent code> | ALL} { -allmetrics | -bestpractices {<best practice category> ... | ALL} } { -compType {<component type code> ... | ALL} | -save <save filename> | -list | -validateOnly }
Where <best practice category> choices are:
– Availability– Performance– Utilization
There are two mutually exclusive options, -teps and -file, which determine the other options that you can use.
The parameters for this command are:
– -teps<ITM Agent code>|ALL }
This option requires an active connection to the Tivoli Enterprise Portal Server and obtains registration information from the Tivoli Enterprise Portal Server for either a single IBM Tivoli Monitoring, version 6.1.0 agent or for all agents that are currently installed for the Tivoli Enterprise Portal Server. Again, you can use the scmd dfa listTEPSagents command to determine what agents are available for registration. When the registration information is obtained and if the –save, -list, or –validateOnly options are not specified, the new component types, attribute types, and metrics are registered and become available for use in offerings. This option is mutually exclusive with the -file option.
– –p <current_password>
This specifies the current password that is set in the configuration. This option is required if password protection is enabled for the CLI service.
– -file<agent-registration-filename>
This reads an agent registration file from the $SLMBASEDIR/agentdefs/ subdirectory to obtain registration information for a single IBM Tivoli Monitoring, version 6.1.0 agent. Specify the file name with the –file option, and you must not include the.xml extension. For example, -file docknt option reads the $SLMBASEDIR/agentdefs/docknt.xml file. Create the agent registration file initially in a prior running of the scmd dfa register command with the –teps and –save options. After you save and edit the agent registration file, it can be used to register the specified
Chapter 3. Warehousing in action 175

component types, attribute types, and metrics with the –file option. This option is mutually exclusive with the -teps option.
– -compType<acomponent type code...>|ALL }
This option enables you to select all or a subset of available components types that are listed in the registration information, which is obtained from the Tivoli Enterprise Portal Server or from the agent registration file. If you specify the –bestPractice option, the available component list is narrowed down by that option’s arguments before the arguments take affect. Run the -list option in a different invocation of the scmd dfa register command to get the names and codes of the component types that are available for your selection. You must use the –compType option when you register agents to specify either that all available component types and their metrics must be registered (indicated by the ALL keyword) or just the subset of component types (indicated in the argument list). This option is mutually exclusive with the -save, -list, and -validateOnly options, but is supported with either the –teps or –file options.
– -list
This displays the codes and names of the component types that can be registered based on the registration information obtained from the Tivoli Enterprise Portal server or from the agent registration file, and the impact of the –bestPractice arguments if you specified that option. This option is mutually exclusive with the –componentType, -save, and -validateOnly options, but is supported with either the –teps or –file options.
– -validateOnly
This does not register any component types or metrics within IBM Tivoli Service Level Advisor, but validates the contents of the agent registration XML that is supplied by the -file option or internally generated by the -teps option. Although this option is supported with either the –teps or –file options, it is most useful with the –file option, because it validates the file that you created or edited. If you specify the –bestPractice option, the available component list is narrowed down by that option’s arguments and validation occurs only on those component types. This option is mutually exclusive with the -save, -list, and -compType options.
– -save <agent-registration-filename>
You can use this option only with the -teps option and does not register any component types or metrics within IBM Tivoli Service Level Advisor, but saves the agent registration information that is obtained from the Tivoli Enterprise Portal Server as an XML file in the $SLMBASEDIR/agentdefs subdirectory. For example, -save my-agent-reg-file creates or overwrites the $SLMBASEDIR/agentdefs/my-agent-reg-file.xml file. The file name specified with the -save option does not include the.xml
176 Tivoli Management Services Warehouse and Reporting

extension. After you save the agent registration XML file, you can edit and register it at a later time using the scmd dfa -file <agent-registration-filename> command. This option is mutually exclusive with the -compType, -list, and -validateOnly options.
– -allmetrics
You can use this option only used with the –teps option and registers all metrics that are defined for the component types specified in the –compType option. Within the registration information obtained from the Tivoli Enterprise Portal Server, availability metrics are not as clearly defined as performance and utilization metrics. For certain agents, IBM Tivoli Service Level Advisor has defined availability metrics in best practice files that are based on the monitoring data attributes supplied by the IBM Tivoli Monitoring 6.1.0 agents. These definitions are placed in availability best practices files.
This option examines any availability best practices files that are defined for the agents specified through the –teps option and also registers those availability metrics. Before you use the –all metrics option, be aware that this might unnecessarily degrade the overall IBM Tivoli Service Level Advisor performance, because the data feed adapter extracts, summarizes, and stores the metric data for all metrics that are specified whether they are used in SLAs. In addition, all metrics that are registered for component types are displayed to the SLM specialist when creating offerings. A cluttered list of unused metrics might become a problem for some users. These two negative impacts are intensified if you choose to use the –teps ALL with the –allMetrics and - compType ALL options, which registers the maximum data possible. This option is mutually exclusive with the -bestpractice option.
– -bestpractice {<best practice category>...|ALL}
This selects the predefined categories of best practice component types and metrics for registration in IBM Tivoli Service Level Advisor. Some IBM Tivoli Monitoring 6.1.0 agents provide many component types and metrics that are not relevant for creating SLAs. For some agents, IBM Tivoli Service Level Advisor has selected a subset of component types and associated metrics that it recommends for inclusion in SLAs and places these recommendations in the best practices XML files. IBM Tivoli Service Level Advisor classifies metrics under the following resource characteristic categories:
• Availability• Utilization• Performance
For each agent that has pertinent component types and metrics, a best practices file is provided for each category. By using this option and listing
Chapter 3. Warehousing in action 177

the desired categories, you can specify that one or more best practice files to be used to filter the total set of component types and metrics obtained from the Tivoli Enterprise Portal Server for the agent or agents that you specified in the –teps option. By using the ALL keyword, you can specify that all existing best practice files be used. Best practices files are located in the $SLMBASEDIR/agentdefs/bestpractices subdirectory with the following file name notation: doc<agent code>-bp-< best practice category>.xml For example, the KNT agent has these associated best practices files:
• docknt-bp-availabilty.xml• docknt-bp-performance.xml• docknt-bp-utilization.xml
This option is mutually exclusive with the -allmetrics option.
In our lab environment and for the purpose of simplicity, we imported the best practice agent metadata from the Tivoli Enterprise Portal Server. Example 3-6 shows the syntax that we used and the output obtained from the command.
Example 3-6 scmd register command used in the lab environment
C:\PROGRA~1\TSLA\cfg\default\com\tivoli\managed\spi\toronto\ds>scmd dfa register -teps ALL -bestpractices ALL
These agents on the Tivoli Enterprise Portal Server have no best practice filesand will not be processed for registration:1: ABA ITM 5.x: Domino2: ABH ITM 5.x: mySAP3: AMA ITM 5.x: Active Directory domain controller4: AMB ITM 5.x: Active Directory replication5: AMD ITM 5.x: DHCP6: AMN ITM 5.x: DNS7: AMS ITM 5.x: Solaris8: AMW ITM 5.x: Windows9: AMX ITM 5.x: UNIX - Linux10: BIW ITM 5.x: MQ Workflow11: BIX ITM 5.x: WebSphere InterChange Server12: CTD ITM 5.x: DB213: CTO ITM 5.x: Oracle14: CTQ ITM 5.x: WebSphere MQ15: CTR ITM 5.x: IBM Informix16: CTW ITM 5.x: Microsoft SQL Server17: CTY ITM 5.x: Microsoft Exchange Server18: GMS ITM 5.x: Siebel
178 Tivoli Management Services Warehouse and Reporting

19: GWA ITM 5.x: Apache20: GWI ITM 5.x: Internet Information Server21: GWL ITM 5.x: WebLogic22: GWP ITM 5.x: IPlanet23: IQS ITM 5.x: Microsoft Commerce Server24: IQY ITM 5.x: Microsoft Internet Security and Acceleration Server25: IQZ ITM 5.x: Microsoft BizTalk Server26: IUD ITM 5.x: Microsoft UDDI Services27: IUI ITM 5.x: Microsoft Host Integration Server28: IVD ITM 5.x: Microsoft Internet Security and Acceleration Server 200429: IVI ITM 5.x: VMware ESX30: IXA ITM 5.x: Microsoft SharePoint Portal Server31: IXB ITM 5.x: Sybase ASE32: IXT ITM 5.x: Citrix MetaFrame Access Suite33: IYM ITM 5.x: Microsoft Content Management Server34: IZY ITM 5.x: WebSphere Application Server35: KIB CCC Logs36: KKA Tivoli Enterprise Console Server Agent37: KT2 ITCAM Response Time Tracking38: KTM ITM 5.x: Health39: MMI ITM 5.x: WebSphere MQ Integrator40: MYS00 MYSQL41: UAG00 UAGENTStarting to process Tivoli Enterprise Portal Server agent: [kud00 : DB2][kud00 : DB2] Applying best practices file -> dockud00-bp-performance.xml[kud00 : DB2] Applying best practices file -> dockud00-bp-availability.xml[kud00 : DB2] Applying best practices file -> dockud00-bp-utilization.xmlProcessing Component Type code: KUD2649900 name: KUDDB2APPLGROUP00_UProcessing Component Type code: KUD3437500 name: KUDDBASEGROUP00Processing Component Type code: KUD3437600 name: KUDDBASEGROUP01Processing Component Type code: KUD4177600 name: KUDBUFFERPOOL00Processing Component Type code: KUD4238000 name: KUDINFO00Processing Component Type code: KUD5214100
Chapter 3. Warehousing in action 179

name: KUDLOCKCONFLICT00Processing Component Type code: KUDTABSPC name: KUDTABSPACEStarting to process Tivoli Enterprise Portal Server agent: [ka4 : i5/OS][ka4 : i5/OS] Applying best practices file -> docka4-bp-performance.xml[ka4 : i5/OS] Applying best practices file -> docka4-bp-utilization.xml
Proceeding to register this agent with IBM Tivoli Service Level Advisor: i5/OS
Processing Component Type code: KA4ACCTJ name: OS400_Acct_JrnProcessing Component Type code: KA4ASYNC name: OS400_Comm_AsyncProcessing Component Type code: KA4BSYNC name: OS400_Comm_BisyncStarting to process Tivoli Enterprise Portal Server agent: [kor : Oracle][kor : Oracle] Applying best practices file -> dockor-bp-performance.xml[kor : Oracle] Applying best practices file -> dockor-bp-availability.xml[kor : Oracle] Applying best practices file -> dockor-bp-utilization.xml
Proceeding to register this agent with IBM Tivoli Service Level Advisor: Oracle
Processing Component Type code: KORDB name: Oracle_DatabaseProcessing Component Type code: KORDISPD name: Oracle_Dispatcher_DetailProcessing Component Type code: KORFILES name: Oracle_FilesProcessing Component Type code: KORLISTD name: Oracle_Listener_DetailProcessing Component Type code: KORLOCKS name: Oracle_Contention_SummaryProcessing Component Type code: KORPROCD name: Oracle_Process_DetailProcessing Component Type code: KORPROCS name: Oracle_Process_SummaryProcessing Component Type code: KORRBST name: Oracle_Rollback_Segments
180 Tivoli Management Services Warehouse and Reporting

Processing Component Type code: KORSESSD name: Oracle_Session_DetailProcessing Component Type code: KORSGA name: Oracle_SGA_MemoryProcessing Component Type code: KORSRVR name: Oracle_ServerProcessing Component Type code: KORSTATS name: Oracle_Statistics_SummaryProcessing Component Type code: KORTS name: Oracle_TablespacesStarting to process Tivoli Enterprise Portal Server agent: [koq : Microsoft SQLServer][koq : Microsoft SQL Server] Applying best practices file -> dockoq-bp-performance.xml[koq : Microsoft SQL Server] Applying best practices file -> dockoq-bp-availability.xml[koq : Microsoft SQL Server] Applying best practices file -> dockoq-bp-utilization.xml
Proceeding to register this agent with IBM Tivoli Service Level Advisor: Microsoft SQL Server
Processing Component Type code: KOQDBD name: MS_SQL_Database_DetailProcessing Component Type code: KOQDBS name: MS_SQL_Database_SummaryProcessing Component Type code: KOQDEVD name: MS_SQL_Device_DetailProcessing Component Type code: KOQPRCD name: MS_SQL_Process_DetailProcessing Component Type code: KOQPRCS name: MS_SQL_Process_SummaryProcessing Component Type code: KOQPROBS name: MS_SQL_Problem_SummaryProcessing Component Type code: KOQSRVD name: MS_SQL_Server_DetailProcessing Component Type code: KOQSRVS name: MS_SQL_Server_SummaryProcessing Component Type code: KOQSTATS name: MS_SQL_Statistics_Summary
Chapter 3. Warehousing in action 181

Processing Component Type code: KOQTBLD name: MS_SQL_Table_DetailStarting to process Tivoli Enterprise Portal Server agent: [klz : Linux][klz : Linux] Applying best practices file -> docklz-bp-performance.xml[klz : Linux] Applying best practices file -> docklz-bp-availability.xml[klz : Linux] Applying best practices file -> docklz-bp-utilization.xml
Proceeding to register this agent with IBM Tivoli Service Level Advisor: Linux
Processing Component Type code: LNXCPU name: Linux_CPUProcessing Component Type code: LNXCPUAVG name: Linux_CPU_AveragesProcessing Component Type code: LNXDISK name: Linux_DiskProcessing Component Type code: LNXDSKIO name: Linux_Disk_IOProcessing Component Type code: LNXDU name: Linux_Disk_Usage_TrendsProcessing Component Type code: LNXNET name: Linux_NetworkProcessing Component Type code: LNXNFS name: Linux_NFS_StatisticsProcessing Component Type code: LNXPROC name: Linux_ProcessProcessing Component Type code: LNXRPC name: Linux_RPC_StatisticsProcessing Component Type code: LNXSOCKD name: Linux_Sockets_DetailProcessing Component Type code: LNXSOCKS name: Linux_Sockets_StatusProcessing Component Type code: LNXSYS name: Linux_System_StatisticsProcessing Component Type code: LNXVM name: Linux_VM_StatsStarting to process Tivoli Enterprise Portal Server agent: [kux : UNIX OS][kux : UNIX OS] Applying best practices file -> dockux-bp-performance.xml[kux : UNIX OS] Applying best practices file -> dockux-bp-availability.xml
182 Tivoli Management Services Warehouse and Reporting

[kux : UNIX OS] Applying best practices file -> dockux-bp-utilization.xml
Proceeding to register this agent with IBM Tivoli Service Level Advisor: UNIX OS
Processing Component Type code: UNIXCPU name: SMP_CPUProcessing Component Type code: UNIXDISK name: DiskProcessing Component Type code: UNIXDPERF name: Disk_PerformanceProcessing Component Type code: UNIXNET name: NetworkProcessing Component Type code: UNIXNFS name: N_F_S_and_R_P_C_StatisticsProcessing Component Type code: UNIXOS name: SystemProcessing Component Type code: UNIXPS name: ProcessProcessing Component Type code: UNIXUSER name: UserStarting to process Tivoli Enterprise Portal Server agent: [knt : Windows OS][knt : Windows OS] Applying best practices file -> docknt-bp-performance.xml[knt : Windows OS] Applying best practices file -> docknt-bp-availability.xml[knt : Windows OS] Applying best practices file -> docknt-bp-utilization.xml
Proceeding to register this agent with IBM Tivoli Service Level Advisor: Windows OS
Processing Component Type code: DHCPSRV name: DHCP_ServerProcessing Component Type code: DNSQUERY name: DNS_QueryProcessing Component Type code: DNSWINS name: DNS_WINSProcessing Component Type code: ICMPSTAT name: ICMP_Statistics
Chapter 3. Warehousing in action 183

Processing Component Type code: IPSTATS name: IP_StatisticsProcessing Component Type code: KNTRASTOT name: RAS_TotalProcessing Component Type code: NETSEGMT name: Network_SegmentProcessing Component Type code: NETWRKIN name: Network_InterfaceProcessing Component Type code: NTDEVICE name: NT_DevicesProcessing Component Type code: NTPAGEFILE name: NT_Paging_FileProcessing Component Type code: NTPRINTER name: NT_PrinterProcessing Component Type code: NTPROCSSR name: NT_ProcessorProcessing Component Type code: NTSERVICE name: NT_ServicesProcessing Component Type code: PRINTQ name: Print_QueueProcessing Component Type code: TCPSTATS name: TCP_StatisticsProcessing Component Type code: UDPSTATS name: UDP_StatisticsProcessing Component Type code: WTLOGCLDSK name: NT_Logical_DiskProcessing Component Type code: WTMEMORY name: NT_MemoryProcessing Component Type code: WTPHYSDSK name: NT_Physical_DiskProcessing Component Type code: WTPROCESS name: NT_ProcessProcessing Component Type code: WTSERVER name: NT_ServerProcessing Component Type code: WTSERVERQ name: NT_Server_Work_QueuesProcessing Component Type code: WTSYSTEM name: NT_SystemStarting to process Tivoli Enterprise Portal Server agent: [koy : Sybase Server]
[koy : Sybase Server] Applying best practices file -> dockoy-bp-performance.xml[koy : Sybase Server] Applying best practices file -> dockoy-bp-availability.xml
184 Tivoli Management Services Warehouse and Reporting

[koy : Sybase Server] Applying best practices file -> dockoy-bp-utilization.xml
Proceeding to register this agent with IBM Tivoli Service Level Advisor: SybaseServer
Processing Component Type code: KOYDBD name: Sybase_Database_DetailProcessing Component Type code: KOYDBS name: Sybase_Database_SummaryProcessing Component Type code: KOYDEVD name: Sybase_Device_DetailProcessing Component Type code: KOYENGD name: Sybase_Engine_DetailProcessing Component Type code: KOYENGS name: Sybase_Engine_SummaryProcessing Component Type code: KOYLCKD name: Sybase_Lock_DetailProcessing Component Type code: KOYPRCD name: Sybase_Process_DetailProcessing Component Type code: KOYPRCS name: Sybase_Process_SummaryProcessing Component Type code: KOYSDEVD name: Sybase_Physical_Device_DetailProcessing Component Type code: KOYSQLD name: Sybase_SQL_DetailProcessing Component Type code: KOYSRVD name: Sybase_Server_DetailProcessing Component Type code: KOYSRVS name: Sybase_Server_SummaryProcessing Component Type code: KOYSTATS name: Sybase_Statistics_Summary
Processing has completed.
C:\PROGRA~1\TSLA\cfg\default\com\tivoli\managed\spi\toronto\ds>
Chapter 3. Warehousing in action 185

3.7.2 Examples of IBM Tivoli Service Level Advisor reports using Tivoli Data Warehouse data
This section shows some examples of how IBM Tivoli Service Level Advisor uses the warehouse historical data.
Important: You must schedule your data feed adapter poll frequency carefully, because a low interval value might result in unnecessary CPU processing overhead. In the Tivoli Enterprise Portal Server environment, a product group is configured to have its data uploaded (through an agent) into the Tivoli Data Warehouse database on an hourly basis or daily basis. Although several product groups might be configured for the same setting (for example, hourly), their corresponding agents might not be delivering the data at the same time each hour.
For example, one product group might deliver data 5 minutes into the hour, and another product group might deliver data 20 minutes. It might seem logical to change the default data feed adapter poll setting of 30 minutes to summarize frequently to gather the latest update poll as soon as possible. However, each time a poll is issued, all components types are queried and the latest data points that were not summarized are retrieved to determine if the data has reached a time where it can be finally summarized. For the majority of these polls, no summarization takes place and the processing overhead to reach that decision is wasted. By spacing out the polls to a larger value (the default value of 30 minutes), your polls yield more actual data summarization without delaying evaluation results.
If your environment has all the product groups configured for a daily setting, setting the data feed adapter poll even higher than the default value (every four hours) serves a similar purpose. For more information about the data feed adapter and data extractor, see Getting Started with IBM Tivoli Service Level Advisor v2.1, SC32-0834.
186 Tivoli Management Services Warehouse and Reporting

Figure 3-40 shows an example SLA reports (SLO results).
Figure 3-40 Example SLA report (SLO results)
Figure 3-41 shows an example SLA report (SLO chart).
Figure 3-41 Example SLA report (SLO chart)
Chapter 3. Warehousing in action 187

3.8 IBM Tivoli Composite Application Manager for Response Time Tracking and Tivoli Data Warehouse integration
IBM Tivoli Composite Application Manager for Response Time Tracking can be integrated into the IBM Tivoli Monitoring V6.1 infrastructure, enabling you to exploit fully IBM Tivoli Monitoring V6.1 functionality such as Tivoli Data Warehouse V2.1, correlate response time information with data from other IBM Tivoli Monitoring V6.1 agents, and have this information presented in Tivoli Enterprise Portal.
The integration into IBM Tivoli Monitoring V6.1 infrastructure uses the IBM Tivoli Composite Application Manager for Response Time Tracking monitoring agent. The task of the Tivoli Enterprise Monitoring Agent is to retrieve information from IBM Tivoli Composite Application Manager for Response Time Tracking management server and to forward the response time information to Tivoli Enterprise Monitoring Server.
Tivoli Enterprise Monitoring Agent is shipped as part of IBM Tivoli Composite Application Manager for Response Time Tracking. It connects to the IBM Tivoli Composite Application Manager for Response Time Tracking management server and collects information at customizable intervals. This enables you to install it on any machine with a TCP/IP connection to the IBM Tivoli Composite Application Manager for Response Time Tracking management server. It is much easier to have the management server itself host the Tivoli Enterprise Monitoring Agent as the Tivoli Enterprise Monitoring Agent host name is shown in Tivoli Enterprise Portal as the source of the monitor.
188 Tivoli Management Services Warehouse and Reporting

Figure 3-42 shows the agent conceptual architecture.
Figure 3-42 IBM Tivoli Composite Application Manager for Response Time Tracking and Tivoli Monitoring V6.1
3.8.1 IBM Tivoli Composite Application Manager for Response Time Tracking agent configuration
You must provide the following configuration values for the agent to operate. When configuring an agent, a panel is displayed. Use this panel to type in each value. When there is a default value, this will be pre-entered into the field. If a field represents a password, two entry fields are displayed. You must enter the same value in each field. The values that you type are not displayed. This helps to maintain the security of these values. All mandatory values for the configuration are shown in bold.
Define the following fields for this agent:
� Tab: ITCAM for Response Time Tracking Management Server Identity
� Field: Response Time Tracking Management Server Host
� Explanation: Use this field to define the IBM Tivoli Composite Application Manager for Response Time Tracking management server host name.
Chapter 3. Warehousing in action 189

� Tab: ITCAM for Response Time Tracking Management Server Identity
� Field: Response Time Tracking Management Server Port
� Explanation: Use this field to define the port the IBM Tivoli Composite Application Manager for Response Time Tracking management server is using for communication. This is defined in the RTT server.properties file on your RTT Management Server
� Tab: ITCAM for Response Time Tracking Management Server Identity
� Field: Response Time Tracking User Login ID
� Explanation: Use this field to define a valid IBM Tivoli Composite Application Manager for Response Time Tracking user that the agent can use to log on to the Response Time Tracking management server.
� Tab: ITCAM for Response Time Tracking Management Server Identity
� Field: Response Time Tracking Management Login Password
� Explanation: Use this field to define the password for the user login defined in the Response Time Tracking User Login ID field.
� Tab: ITCAM for Response Time Tracking Management Server Identity
� Field: Is Response Time Tracking Management Server SSL Enabled?
� Explanation: Use this field to define whether your IBM Tivoli Composite Application Manager for Response Time Tracking server is enabled for Secure Sockets Layer (SSL) communication.
� Tab: ITCAM for Response Time Tracking Management Server Identity
� Field: Response Time Tracking Keystore File
� Explanation: This slot is only required if your IBM Tivoli Composite Application Manager for Response Time Tracking server is SSL enabled. It is used to define the keystore file that is used in SSL communications.
� Tab: ITCAM for Response Time Tracking Management Server Identity
� Field: Response Time Tracking Keystore Password
� Explanation: This slot is only required if your IBM Tivoli Composite Application Manager for Response Time Tracking server is SSL enabled. It is used to define the keystore file password that is used in SSL communications.
190 Tivoli Management Services Warehouse and Reporting

� Tab: Response Time Tracking Agent Configuration Options
� Field: Maximum Timespan for Instance Selection in hours
� Explanation: Use this field to define the maximum amount of instance reporting data that is displayed in the IBM Tivoli Composite Application Manager for Response Time Tracking agent TEP workspace.
� Tab: Response Time Tracking Agent Configuration Options
� Field: Maximum number of log messages
� Explanation: Use this field to define the maximum number of log messages from the IBM Tivoli Composite Application Manager for Response Time Tracking management server log that are displayed in the IBM Tivoli Composite Application Manager for Response Time Tracking agent TEP workspace.
� Tab: Response Time Tracking Agent Configuration Options
� Field: Agent Message expiration
� Explanation: Use this field to define the expiration time for the agent message data that is displayed in the IBM Tivoli Composite Application Manager for Response Time Tracking agent TEP workspace.
� Tab: Response Time Tracking Managing Server Database Configuration Options
� Field: Select the Database type for Managing Server Database
� Explanation: Use this field to define the database type used for the IBM Tivoli Composite Application Manager for Response Time Tracking management server database.
� Tab: Response Time Tracking Managing Server Database Configuration Options
� Field: Fully qualified hostname of the Managing Server Database Machine
� Explanation: Use this field to define the host name of the server where the IBM Tivoli Composite Application Manager for Response Time Tracking management server database resides.
� Tab: Response Time Tracking Managing Server Database Configuration Options
� Field: Specify Database Port: default for DB2 is 50000 and for Oracle is 1521
� Explanation: Use this field to define the port that is used to communicate with the IBM Tivoli Composite Application Manager for Response Time Tracking management server database.
Chapter 3. Warehousing in action 191

� Tab: Response Time Tracking Managing Server Database Configuration Options
� Field: RTT MS Schema User Login Name
� Explanation: Use this field to define the database user that can be used by the agent to connect to the IBM Tivoli Composite Application Manager for Response Time Tracking management server database.
� Tab: Response Time Tracking Managing Server Database Configuration Options
� Field: RTT MS Schema User Login Password
� Explanation: Use this field to define the user password for the database user specified in the “RTT MS Schema User Login Name” field described previously.
The configuration steps for the agent are detailed in the following sections.
For Windows systemsTo configure the IBM Tivoli Composite Application Manager for Response Time Tracking agent on Windows systems, perform the following steps:
1. From your Windows desktop on your server where you installed the IBM Tivoli Composite Application Manager for Response Time Tracking IBM Tivoli Monitoring 6.1 agent, click Start → Programs → IBM Tivoli Monitoring → Manage Tivoli Enterprise Monitoring Services.
2. Right-click Response Time Tracking Agent. Click Reconfigure, as shown in Figure 3-43.
Figure 3-43 Configuring monitoring agent for IBM Tivoli Composite Application Manager for RTT through monitoring console
192 Tivoli Management Services Warehouse and Reporting

3. In the advanced configuration window, click OK, as shown in Figure 3-44.
Figure 3-44 Configuring Tivoli agent for IBM Tivoli Composite Application Manager for RTT connection protocol
4. In the new window, enter the name of your Tivoli Enterprise Monitoring Server that you want to connect the agent to and click OK.
Chapter 3. Warehousing in action 193

5. In the ITCAM for Response Time Tracking Management Server Identity tab (Figure 3-45), specify the fields, as described in 3.8.1, “IBM Tivoli Composite Application Manager for Response Time Tracking agent configuration” on page 189.
Figure 3-45 Configuring IBM Tivoli Composite Application Manager for RTT management server identity information
194 Tivoli Management Services Warehouse and Reporting

6. In the Response Time Tracking Agent Configuration Options tab (Figure 3-46), enter the required settings, as described in 3.8.1, “IBM Tivoli Composite Application Manager for Response Time Tracking agent configuration” on page 189.
Figure 3-46 Configuring IBM Tivoli Composite Application Manager for RTT agent
Chapter 3. Warehousing in action 195

7. In the Response Time Tracking Managing Server Database Configuration Options tab (Figure 3-47), specify the fields as described in 3.8.1, “IBM Tivoli Composite Application Manager for Response Time Tracking agent configuration” on page 189. Click OK after you configure the settings as required.
Figure 3-47 Configuring IBM Tivoli Composite Application Manager for RTT management server database information
8. Restart the Response Time Tracking agent by double-clicking it. Alternatively, right-click the agent and select Start.
For Linux or UNIX systemsTo configure the IBM Tivoli Composite Application Manager for Response Time Tracking agent on Linux or UNIX, perform the following steps:
1. Log on to the server and issue the following command from the %InstallDir%/IBM/ITM/bin directory:
./itmcmd config -A t2
The following line is displayed:
Agent configuration started...
196 Tivoli Management Services Warehouse and Reporting

2. The following questions enable you to configure the configuration options for the agent. These are explained in more detail in 3.8.1, “IBM Tivoli Composite Application Manager for Response Time Tracking agent configuration” on page 189. The settings that are requested are shown in Example 3-7.
Example 3-7 Tivoli Composite Application Manager for RTT configuration options
Edit 'ITCAM for Response Time Tracking Management Server Identity' settings? (default is: Yes):Response Time Tracking Management Server Host (default is: ):Response Time Tracking Management Server Port (default is: ):Response Time Tracking User Login ID (default is: ):Response Time Tracking Login Password (default is: ):Is Response Time Tracking Management Server SSL Enabled? Type number of item from the below list 1. Yes 2. No (default is: ): Response Time Tracking Keystore File (default is: ):Response Time Tracking Keystore Password (default is: ):Edit 'Response Time Tracking Agent Configuration Options' settings? (default is: Yes):Maximum Timespan for Transaction Reporting in hours (default is: 8): Maximum Timespan for Instance Selection in hours (default is: 1):Maximum number of log messages (default is: 100):Agent Messsage expiration (default is: 7):Edit 'Response Time Tracking Managing Server Database Configuration Options' set tings? (default is: Yes):Select the Database type for Managing Server Database Type number of item from the below list 1. DB2 2. ORACLE (default is: ):Fully qualified hostname of the Managing Server Database Machine (default is: ):Specify Database Port: default for DB2 is 50000 and for Oracle is 1521 (default is: 50000):Database Name or SID Name (default is: ):RTT MS Schema User Login Name (default is: ):RTT MS Schema User Login Password (default is: ):
Chapter 3. Warehousing in action 197

3. The agent asks to configure the connection information to the Tivoli Enterprise Monitoring server. The configuration values are shown in Example 3-8.
Example 3-8 Tivoli Composite Application Manager for RTT configuration options
Will this agent connect to a TEMS? [YES or NO] (Default is: YES):TEMS Host Name (Default is: belfast):
Network Protocol [ip, sna, ip.pipe or ip.spipe] (Default is: ip.pipe):
Now choose the next protocol from one of these: - ip - sna - ip.spipe - noneNetwork Protocol 2 (Default is: none):IP.PIPE Port Number (Default is: 1918):Enter name of KDC_PARTITION (Default is: null):
Configure connection for a secondary TEMS? [YES or NO] (Default is: NO):Enter Optional Primary Network Name or "none" (Default is: none):
4. When you complete these steps, the following message is displayed:
Agent configuration completed...
The agent is now configured and ready to be started.
You can start the agent by issuing the following command from the %InstallDir%/IBM/ITM/bin directory:
./itmcmd agent start t2
3.8.2 Collecting the IBM Tivoli Composite Application Manager for Response Time Tracking agent historical data
As mentioned previously, the mechanism for collecting IBM Tivoli Monitoring agent data is the same for all agents. Therefore, enabling the historical collection for the IBM Tivoli Composite Application Manager for RTT agent involves configuring the historical collection as detailed in 3.5, “Configuring historical data collection” on page 147.
198 Tivoli Management Services Warehouse and Reporting

In the product name field of the historical configuration window, select ITCAM Response Time Tracking. The default groups for the IBM Tivoli Composite Application Manager Response Time Tracking agent are shown in Figure 3-48.
Figure 3-48 IBM Tivoli Composite Application Manager for RTT Tracking agent default historical groups
3.8.3 IBM Tivoli Composite Application Manager for Response Time Tracking agent workspace examples
IBM Tivoli Composite Application Manager for Response Time Tracking provides the following predefined workspaces, which are organized by navigator item:
� Response Time Tracking navigator item
– Response Time Tracking workspace– Historical Monthly Summarization for Reporting Groups workspace
Chapter 3. Warehousing in action 199

� All Reporting Groups navigator item
– Response Time Tracking Reporting Groups workspace
� Applications navigator item
– Response Time Tracking Reporting Group Applications workspace
� Customers navigator item
– Response Time Tracking Reporting Group Customers workspace
� Locations navigator item
– Response Time Tracking Reporting Group Locations workspace
Some examples of the Tivoli Monitoring for IBM Tivoli Composite Application Manager for Response Time Tracking workspaces are shown in Figure 3-49 and Figure 3-50.
Figure 3-49 Tivoli Composite Application Manager for RTT: Response Time Tracking workspace example
200 Tivoli Management Services Warehouse and Reporting

Figure 3-50 Tivoli Composite Application Manager for RTT: Response Time Tracking Reporting Groups workspace example
3.9 IBM Tivoli Composite Application Manager for WebSphere and Tivoli Data Warehouse integration
IBM Tivoli Composite Application Manager for WebSphere can be integrated into the IBM Tivoli Monitoring V6.1 infrastructure. This enables you to exploit fully IBM Tivoli Monitoring V6.1 functionality such as Tivoli Data Warehouse V2.1, correlation of WebSphere Application Server information with data from other IBM Tivoli Monitoring V6.1 agents, and presentation with Tivoli Enterprise Portal.
The Tivoli Enterprise Monitoring Agent collects performance data about the WebSphere and Java 2 Platform, Enterprise Edition (J2EE) Application Servers running on a single node from four primary sources:
� Response time data for application server requests from the IBM Tivoli Composite Application Manager for WebSphere and J2EE data collector
� Resource data from the WebSphere and J2EE Performance Monitoring Infrastructure
Chapter 3. Warehousing in action 201

� WebSphere Application and J2EE Server log messages
� Garbage collector activity recorded in the verbose Garbage Collector trace of Java Virtual Machine
The Tivoli Enterprise Monitoring Agent accumulates data from all of these sources and ships them to the Tivoli Enterprise Monitoring Server. The Tivoli Enterprise Monitoring Server merges the data with monitoring data from other agents (including other IBM Tivoli Composite Application Manager for WebSphere agents) and ships them to the Tivoli Enterprise Portal Server for display on the various Tivoli Enterprise Portal clients attached to it.
Figure 3-51 shows the interconnectivity structure.
Figure 3-51 IBM Tivoli Composite Application Manager for WebSphere and IBM Tivoli Monitoring V6.1
WebSphere
Custom Serviceam Publish databcm
JVMTI PMIJMX
Tivoli Enterprise Management Agent
KYN
To TEMS
202 Tivoli Management Services Warehouse and Reporting
The data sources that are employed by IBM Tivoli Composite Application Manager for WebSphere are:
� Java Virtual Machine Tool Interface (JVMTI) garbage collection data, method trace, stack trace, CPU time, and heap dump
� Java Management Extensions (JMX™) system resources
� System Management Facility (SMF) system resources (z/OS only)
� Performance Monitoring Infrastructure (PMI) system resources (WebSphere only)
� OS services SCC, platform CPU, and its environment
� Byte Code Modification (BCM) instrumentation of some classes
3.9.1 IBM Tivoli Composite Application Manager for WebSphere agent configuration
You must provide the following configuration values for the agent to operate. When configuring an agent, a panel is displayed. Use this panel to type in each value. When there is a default value, this will be pre-entered into the field. If a field represents a password, there are two entry fields that are displayed. You must enter the same value in each field. The values you type is not displayed. This helps maintain the security of these values. All mandatory values for configuration are shown in bold.
The following fields are defined for this agent:
� Tab: Basic
� Field: Request Data Monitoring
� Explanation: Use this field to define the level of request data you want to gather.
� Tab: Basic
� Field: Request Data Monitoring Method
� Explanation: Use this field to define the method you want to use to collect the request data, either on demand or at a fixed interval.
� Tab: Basic
� Field: Resource Data Monitoring
� Explanation: Use this field to define whether you want the agent to collect resource data.
Chapter 3. Warehousing in action 203

� Tab: Basic
� Field: Resource Data Monitoring Method
� Explanation: Use this field to define the method you want to use to collect the resource data, either on demand or at a fixed interval.
� Tab: Basic
� Field: Garbage Collection Monitoring
� Explanation: Use this field to define whether you want the agent to collect garbage collection data.
� Tab: Agent (Advanced)
� Field: Alternative Node ID for identifying this Agent
� Explanation: Use this field to define an alternative ID for identifying this agent in the TEP.
� Tab: Agent (Advanced)
� Field: ITCAM for WebSphere Agent Listening Port
� Explanation: Use this field to define the listening port for the IBM Tivoli Composite Application Manager for WebSphere agent so that the Tivoli Enterprise Monitoring Agent can communicate with it to gather data.
� Tab: Agent (Advanced)
� Field: Maximum Number Of Agent Log Events
� Explanation: Use this field to define the maximum number of log events the agent will display in the TEP.
� Tab: Agent (Advanced)
� Field: Custom MBeans Monitoring Port
� Explanation: Use this field to define the listening port for the custom MBeans so that the Tivoli Enterprise Monitoring Agent can communicate with it to gather data.
� Tab: Agent (Advanced)
� Field: Custom MBeans Monitoring Enabled
� Explanation: Use this field to define whether you want the agent to collect custom MBeans data.
204 Tivoli Management Services Warehouse and Reporting
� Tab: Collection (Advanced)
� Field: Request Data On Demand Maximum Sample Age (sec)
� Explanation: Use this field to define the maximum sample age in seconds when the agent is collecting request data on demand.
� Tab: Collection (Advanced)
� Field: Request Data Fixed Interval between Collections (sec)
� Explanation: Use this field to define the interval in seconds between data requests when the agent is collecting request data at a fixed interval.
� Tab: Collection (Advanced)
� Field: Request Data Sampling Rate (%)
� Explanation: Use this field to define the sampling rate in percent when the agent is collecting request data.
� Tab: Collection (Advanced)
� Field: Resource Data On Demand Maximum Sample Age (sec)
� Explanation: Use this field to define the maximum sample age in seconds when the agent is collecting resource data on demand.
� Tab: Collection (Advanced)
� Field: Resource Data Fixed Interval between Collections (sec)
� Explanation: Use this field to define the interval in seconds between data requests when the agent is collecting resource data at a fixed interval.
� Tab: Collection (Advanced)
� Field: Garbage Collection Polling Interval (sec)
� Explanation: Use this field to define the polling interval in seconds the Tivoli Enterprise Monitoring Agent will use to query data if garbage data collection is enabled.
� Tab: Collection (Advanced)
� Field: Log Scan Polling Interval (sec)
� Explanation: Use this field to define the polling interval in seconds the Tivoli Enterprise Monitoring Agent will use to query the logs for data.
Chapter 3. Warehousing in action 205

� Tab: Application Servers (Advanced)
� Field: New
� Explanation: Use this field to define new advanced configuration options for the application servers tracked by the IBM Tivoli Composite Application Manager for WebSphere agent.
The configuration steps for the agent are detailed in the following sections.
For Windows systemsTo configure the IBM Tivoli Composite Application Manager for WebSphere agent on Windows system, perform the following steps:
1. From your Windows desktop on your server where you installed the IBM Tivoli Composite Application Manager for WebSphere IBM Tivoli Monitoring 6.1 agent, click Start → Programs → IBM Tivoli Monitoring → Manage Tivoli Enterprise Monitoring Services.
2. Right-click ITCAM for WebSphere Agent. Click Reconfigure, as shown in Figure 3-52.
Figure 3-52 Configuring monitoring agent for IBM Tivoli Composite Application Manager for WebSphere through monitoring console
206 Tivoli Management Services Warehouse and Reporting

3. In the Advanced Configuration window, click OK, as shown in Figure 3-53.
Figure 3-53 Configuring Tivoli agent for IBM Tivoli Composite Application Manager for RTT connection protocol
4. In the new window, enter the name of your Tivoli Enterprise Monitoring Server that you want to connect the agent to and click OK.
Chapter 3. Warehousing in action 207

5. In the Basic tab (Figure 3-54), enter the fields as described in 3.9.1, “IBM Tivoli Composite Application Manager for WebSphere agent configuration” on page 203.
Figure 3-54 Configuring IBM Tivoli Composite Application Manager for WebSphere: Basic information
208 Tivoli Management Services Warehouse and Reporting
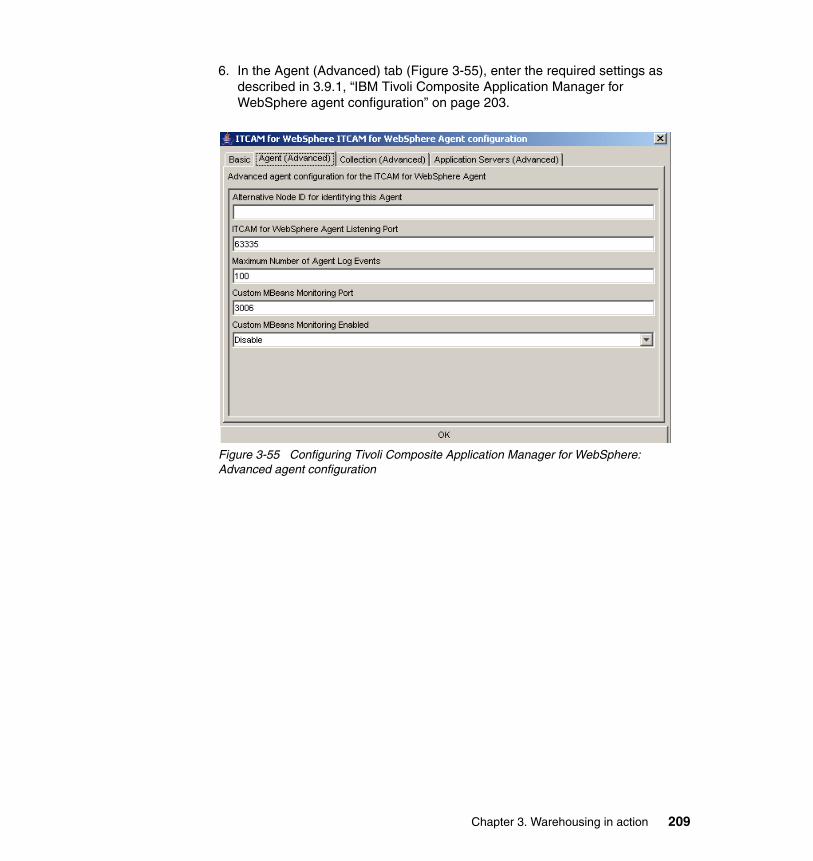
6. In the Agent (Advanced) tab (Figure 3-55), enter the required settings as described in 3.9.1, “IBM Tivoli Composite Application Manager for WebSphere agent configuration” on page 203.
Figure 3-55 Configuring Tivoli Composite Application Manager for WebSphere: Advanced agent configuration
Chapter 3. Warehousing in action 209

7. In the Collection (Advanced) tab (Figure 3-56), enter the fields as described in 3.9.1, “IBM Tivoli Composite Application Manager for WebSphere agent configuration” on page 203.
Figure 3-56 Configuring Tivoli Composite Application Manager for WebSphere advanced collection information
210 Tivoli Management Services Warehouse and Reporting

8. In the Application Servers (Advanced) tab (Figure 3-57), enter the fields as described in 3.9.1, “IBM Tivoli Composite Application Manager for WebSphere agent configuration” on page 203. Click OK after you configure the settings as required.
Figure 3-57 Configuring Tivoli Composite Application Manager for WebSphere: Advanced application server information
9. Restart the IBM Tivoli Composite Application Manager for WebSphere Agent by double-clicking it. Alternatively, right-click it and select Start.
For Linux or UNIX systemsTo configure the IBM Tivoli Composite Application Manager for WebSphere agent on Linux or UNIX systems, perform the following steps:
1. Log in to the server and issue the following command from the %InstallDir%/IBM/ITM/bin directory:
./itmcmd config -A yn
The following line is displayed:
Agent configuration started...
Chapter 3. Warehousing in action 211

2. The following questions enable you to configure the configuration options for the agent. These are explained in more detail in 3.9.1, “IBM Tivoli Composite Application Manager for WebSphere agent configuration” on page 203. The settings that are requested are shown in Example 3-9.
Example 3-9 IBM Tivoli Composite Application Manager for WebSphere agent configuration options
Edit 'Basic' settings? (default is: Yes):Request Data Monitoring Type number of item from the below list 1. Disable 2. Level1 3. Level2 (default is: LEVEL1):Request Data Monitoring Method Type number of item from the below list 1. Fixed Interval 2. On Demand (default is: FIXEDINTERVAL):Resource Data Monitoring Type number of item from the below list 1. Disable 2. Enable (default is: ENABLE):Resource Data Monitoring Method Type number of item from the below list 1. Fixed Interval 2. On Demand (default is: ONDEMAND):Garbage Collection Monitoring Type number of item from the below list 1. Disable 2. Enable (default is: ENABLE):Edit 'Agent (Advanced)' settings? (default is: Yes):
Edit 'Collection (Advanced)' settings? (default is: Yes):
212 Tivoli Management Services Warehouse and Reporting

3. The agent asks to configure connection information to the Tivoli Enterprise Monitoring Server. The configuration values are shown in Example 3-10.
Example 3-10 IBM Tivoli Composite Application Manager for WebSphere agent configuration options
Will this agent connect to a TEMS? [YES or NO] (Default is: YES):TEMS Host Name (Default is: belfast):
Network Protocol [ip, sna, ip.pipe or ip.spipe] (Default is: ip.pipe):
Now choose the next protocol from one of these: - ip - sna - ip.spipe - noneNetwork Protocol 2 (Default is: none):IP.PIPE Port Number (Default is: 1918):Enter name of KDC_PARTITION (Default is: null):
Configure connection for a secondary TEMS? [YES or NO] (Default is: NO):Enter Optional Primary Network Name or "none" (Default is: none):
4. When you complete these steps, the following message is displayed:
Agent configuration completed...
The agent is now configured and ready to be started. You can start the agent by issuing the following command from the %InstallDir%/IBM/ITM/bin directory:
./itmcmd agent start yn
3.9.2 Collecting the IBM Tivoli Composite Application Manager for WebSphere agent historical data
As mentioned previously, the mechanism for collecting IBM Tivoli Monitoring agent data is the same for all agents. Therefore, enabling the historical collection for the IBM Tivoli Composite Application Manager for WebSphere agent involves configuring the historical collection as detailed in 3.5, “Configuring historical data collection” on page 147.
Chapter 3. Warehousing in action 213

In the product name field of the historical configuration window, select ITCAM for WebSphere. The default groups for the IBM Tivoli Composite Application Manager for WebSphere agent are shown in Figure 3-58.
Figure 3-58 IBM Tivoli Composite Application Manager for WebSphere agent default historical groups
214 Tivoli Management Services Warehouse and Reporting

3.9.3 IBM Tivoli Composite Application Manager for WebSphere agent workspace examples
IBM Tivoli Monitoring for IBM Tivoli Composite Application Manager for WebSphere provides the following predefined workspaces, which are organized by navigator item:
� WebSphere Agent - Primary navigator item
– WebSphere Agent workspace
� WebSphere App Server - AppSrv01$ navigator item
– WebSphere App Server workspace– High Availability Manager workspace– DCS Stacks workspace
� Request Analysis navigator item
– Request Analysis workspace
� Garbage Collection Analysis navigator item
– Garbage Collection Analysis workspace
� Log Analysis navigator item
– Log Analysis workspace
� Pool Analysis navigator item
– Pool Analysis workspace
� Datasources navigator item
– Datasources workspace
� JMS Summary navigator item
– JMS Summary workspace
� Web Applications navigator item
– Web Applications workspace– Sessions workspace
� EJB™ Containers navigator item
– EJB Containers workspace– Enterprise Java Beans workspace– Container Transactions workspace– Container Object Pools workspace
Chapter 3. Warehousing in action 215

� DB Connection Pools navigator item
– DB Connection Pools workspace
� J2C Connection Pools navigator item
– J2C Connection Pools workspace
� Thread Pools navigator item
– Thread Pools workspace– Alarm Manager workspace
� Cache Analysis navigator item
– Cache Analysis workspace
� Workload Management navigator item
– Workload Management workspace
� Scheduler navigator item
– Scheduler workspace
� Web Services navigator item
– Web Services workspace
� Platform Messaging navigator item
– Messaging Engines workspace– Client Communications workspace– Messaging Engine Communications workspace– WMQ Client Link Communications workspace– WMQ Link Communications workspace
216 Tivoli Management Services Warehouse and Reporting

Some examples of IBM Tivoli Monitoring for IBM Tivoli Composite Application Manager for WebSphere workspaces are shown Figure 3-59, Figure 3-60, and Figure 3-61 on page 219.
Figure 3-59 Tivoli Composite Application Manager for WebSphere: WebSphere App Server workspace example
Chapter 3. Warehousing in action 217

Figure 3-60 IBM Tivoli Composite Application Manager for WebSphere: Pool Analysis workspace example
218 Tivoli Management Services Warehouse and Reporting

Figure 3-61 IBM Tivoli Composite Application Manager for WebSphere: Thread Pools workspace example
3.10 Tivoli Composite Application Manager for SOA and Tivoli Data Warehouse integration
IBM Tivoli Composite Application Manager for Service-Oriented Architecture (SOA) can be integrated into the IBM Tivoli Monitoring V6.1 infrastructure. This enables you to exploit fully IBM Tivoli Monitoring V6.1 functionality such as Tivoli Data Warehouse V2.1, correlation of SOA related data with that from other IBM Tivoli Monitoring V6.1 agents, and presentation with Tivoli Enterprise Portal.
IBM Tivoli Composite Application Manager for SOA works with several application server environments:
� IBM WebSphere Application Server� Microsoft .NET� BEA WebLogic server
Chapter 3. Warehousing in action 219

Figure 3-62 shows the IBM Tivoli Composite Application Manager for SOA data collection conceptual architecture.
Figure 3-62 IBM Tivoli Composite Application Manager for SOA structure
The monitoring agent data collector is implemented as a Java API for XML-based RPC (JAX-RPC) handler or service extension that is installed into the application servers that are hosting the monitored Web services. The handler is given control when either of the following events occurs:
� A client application invokes a Web service, which is referred to as a client-side interception.
� The Web service request is received by the hosting application server, which is referred to as a server-side interception.
The monitoring agent records and collects the monitored information in one or more local log files. The information is then transferred to Tivoli Enterprise Monitoring Server and can be archived into a historical database for later retrieval with IBM Web Services Navigator.
IBM Tivoli Composite Application Manager for SOA 6.0 focuses on the Simple Object Access Protocol (SOAP) engine of IBM WebSphere Application Server, WebSphere Service Integration Bus, the Microsoft .NET Framework, and BEA WebLogic.
ITCAM for SOAMonitoring agent
Microsoft .NET server
BEA WebLogic server
WebSphere Application Server
KD4 service extension
JAX-RPC handler
JAX-RPC handler
Data collector
Data collector
Data collector
Data collector adapter
IRAIntellignent
Resource Model
log
log
log
configuration
Tivoli Enterprise Management Server
Tivoli Enterprise Portal Server
220 Tivoli Management Services Warehouse and Reporting

The Web services data collector supports both J2EE application client and server container environments, because JAX-RPC handlers are supported only by these environments. The Web services must be compliant with JSR-109 specifications.
To ensure proper operation of the JAX-RPC handler, verify that the client applications are written according to the conventions that can be found at:
http://www.jcp.org/aboutJava/communityprocess/final/jsr109/
3.10.1 IBM Tivoli Composite Application Manager for SOA agent configuration
The IBM Tivoli Composite Application Manager for SOA agent is the only IBM Tivoli Composite Application Manager agent that does not require any explicit SOA agent configuration to function correctly. However, the agent still has to be pointed to a functioning Tivoli Enterprise Monitoring Server.
The configuration steps for the agent are detailed in the following sections.
For Windows systemsTo configure the Tivoli Monitoring agent for IBM Tivoli Composite Application Manager for SOA agent on Windows system, perform the following steps:
1. From your Windows desktop on your server where you installed the IBM Tivoli Composite Application Manager for WebSphere IBM Tivoli Monitoring 6.1 agent, click Start → Programs → IBM Tivoli Monitoring → Manage Tivoli Enterprise Monitoring Services.
Chapter 3. Warehousing in action 221

2. Right-click ITCAM for SOA Agent. Click Reconfigure, as shown in Figure 3-63.
Figure 3-63 Configuring monitoring agent for Tivoli Composite Application Manager for SOA through monitoring console
3. In the Advanced Configuration window, click OK, as shown in Figure 3-64.
Figure 3-64 Configuring Tivoli agent for Tivoli Composite Application Manager for SOA connection protocol
222 Tivoli Management Services Warehouse and Reporting

4. In the new window, enter the name of your Tivoli Enterprise Monitoring Server that you want to connect the agent to and click OK.
5. Restart the IBM Tivoli Composite Application Manager for SOA agent by double-clicking it. Alternatively, you can right-click it and select Start.
For Linux or UNIX systemsTo configure the Tivoli Monitoring agent for IBM Tivoli Composite Application Manager for SOA agent on Linux or UNIX systems, perform the following steps:
1. Log in to the server and issue the following command from the %InstallDir%/IBM/ITM/bin directory:
./itmcmd config -A d4
The following line is displayed:
Agent configuration started...
2. The agent asks to configure connection information to the Tivoli Enterprise Monitoring Server. The configuration values are shown in Example 3-11.
Example 3-11 Tivoli Composite Application Manager for SOA configuration options
Will this agent connect to a TEMS? [YES or NO] (Default is: YES):TEMS Host Name (Default is: belfast):
Network Protocol [ip, sna, ip.pipe or ip.spipe] (Default is: ip.pipe):
Now choose the next protocol from one of these: - ip - sna - ip.spipe - noneNetwork Protocol 2 (Default is: none):IP.PIPE Port Number (Default is: 1918):Enter name of KDC_PARTITION (Default is: null):
Configure connection for a secondary TEMS? [YES or NO] (Default is: NO):Enter Optional Primary Network Name or "none" (Default is: none):
3. When you complete these steps, the following message is displayed:
Agent configuration completed...
The agent is now configured and ready to be started. Start the agent by issuing the following command from the %InstallDir%/IBM/ITM/bin directory:
./itmcmd agent start d4
Chapter 3. Warehousing in action 223

3.10.2 Enabling IBM Tivoli Composite Application Manager for SOA monitoring agent data collectors
As stated previously, there is no explicit IBM Tivoli Composite Application Manager for SOA agent configuration required for the agent to function. However, you have to enable the data collectors for the application servers in order for them to collect data correctly. This depends on the application server environment that you have installed on this application server.
After the IBM Tivoli Composite Application Manager for SOA monitoring agent is installed on the application server, the data collector directory structure is created in the Tivoli Enterprise Monitoring Agent base directory as follows:
� For Windows: %TEMA_HOME%\CMA� For UNIX: $TEMA_HOME/<OS_INTERP>/d4� For z/OS: <TEMA_HOME>
This directory contains the structure shown in Figure 3-65.
Figure 3-65 IBM Tivoli Composite Application Manager for SOA agent directory structure
These directories contain all the files required to run the data collector on IBM WebSphere Application Server, Microsoft .NET, and BEA WebLogic.
KD4
bin
lib
config
logs
224 Tivoli Management Services Warehouse and Reporting

Depending on your operating system platform, issue KD4configDC.sh or KD4configDC.bat. The arguments for this command vary depending on the application server environment. See IBM Tivoli Composite Application Manger for SOA: Installing and Using Project Crystal, GC32-9492, for more detailed information about the KD4configDC options.
Configuring for WebSphere Application Server data collectorFor IBM WebSphere Application Server, run the following command from a command prompt:
KD4configDC -enable -env 1 <WAS_HOME>
This command enables IBM WebSphere Application Server to use the KD4 data collector as a JAX-RPC handler. The kd4dcagent.jar file is installed in the %WAS_HOME%/lib/ext directory.
After you configure the IBM Tivoli Composite Application Manager for SOA monitoring agent data collector, stop and restart IBM WebSphere Application Server.
Configuring for Microsoft .NET data collectorFor Microsoft .NET application server, run the following command from a command prompt:
KD4configDC -enable -env 2
No additional action is required.
Note: An installation script called KD4configDC is used to configure the data collector for all platforms. However, each platform requires its own additional parameters and steps that you must perform to enable monitoring of Web services.
On IBM WebSphere Application Server and BEA WebLogic, restart the application server after configuring the data collector. Microsoft .NET application server does not require a restart.
Note: If you have set the WAS_HOME environment variable, the configuration program can be invoked without any argument. The WAS_HOME environment variable is typically set using the setupCmdLine program from WebSphere.
Chapter 3. Warehousing in action 225

Configuring for BEA WebLogic data collectorBEA WebLogic client applications do not have deployment descriptors, therefore you must register the data collector handler using a Java program. For BEA WebLogic application server, the KD4configDC command adds the JAX-RPC handler intercept into the web-services.xml deployment descriptor for each deployed Web service running on a local BEA WebLogic application server.
You must add the data collector to BEA WebLogic handler chains for each Web service application individually. The KD4configDC script will do this, but if a new Web service is installed at a later time, run KD4configDC again to configure the new Web service.
Before you can run the KD4configDC command, you must perform some additional steps to prepare for both client and server side installation.
1. Add the IBM Tivoli Composite Application Manager for SOA handler with a program on the BEA WebLogic client side that uses the javax.xml.rpc.handler.HandlerInfo and javax.xml.rpc.handler.HandlerRegistry classes. See the code extract in Example 3-12 to enable a BEA WebLogic client application. For more information, see the following Web site:
http://e-docs.bea.com/wls/docs81/webserv/interceptors.html
Example 3-12 Enabling JAX-RPC handler
import java.util.ArrayList;import java.io.IOException;import java.xml.namespace.QName;import java.xml.rpc.ServiceException;import java.xml.rpc.handler.HandlerInfo;import java.xml.rpc.handler.HandlerRegistry
public main(String wsdl) {try {
. . .QName listQname[] = new QName[1];listQName[0] = new QName(“http://www.ibm.com/websight”,
“WEBSIGHT_SOAP”);ArrayList handlerList = new ArrayList();handlerList.add(new
HandlerInfo(com.ibm.management.soa.agent.bea.ITMBEAClientHandler.class, null, listQName));
Note: Unlike IBM WebSphere Application Server and Microsoft .NET application servers that allow the data collector to be global in the scope, BEA WebLogic does not have the concept of a global handler.
226 Tivoli Management Services Warehouse and Reporting

HandlerRegistry registry = service.getHandlerRegistry();registry.setHandlerChain(portName, handlerList);
} catch (IOException e) {} catch (ServiceException e) {}
}}
2. Before running KD4configDC on the BEA WebLogic server side:
– To modify the BEA WebLogic Server Classpath for all domains, use the commEnv.sh or commEnv.bat script in WebLogic_Home/common/bin and append the full path of kd4dcagent.jar to the WEBLOGIC_CLASSPATH environment variable.
– To modify the classpath for a specific BEA WebLogic Server domain, edit the setDomainEnv.sh or setDomainEnv.cmd script in the domain’s \bin directory, and prepend the fully qualified path of kd4dcagent.jar file onto the PRE_CLASSPATH environment variable.
3. Stop and restart the BEA WebLogic Server and set the BEA WebLogic Server environment by sourcing the setDomainEnv or setEnv command before running the KD4configDC script.
4. Run the KD4configDC script at the command prompt:
KD4configDC.[sh|bat] -enable -env 3 “t3://localhost:7001” weblogic weblogic
3.10.3 Collecting the IBM Tivoli Composite Application Manager for SOA agent historical data
As mentioned previously, the mechanism for collecting IBM Tivoli Monitoring agent data is the same for all agents. Therefore, enabling the historical collection for the IBM Tivoli Composite Application Manager for SOA agent involves configuring the historical collection as detailed in 3.5, “Configuring historical data collection” on page 147.
Chapter 3. Warehousing in action 227

In the product name field of the historical configuration window, select ITCAM for SOA. The default groups for the IBM Tivoli Composite Application Manager for SOA agent are shown in Figure 3-66.
Figure 3-66 Tivoli Composite Application Manager for SOA agent default historical groups
Note: The default groups shown in Figure 3-66 can differ depending on which applications servers data collectors are enabled.
228 Tivoli Management Services Warehouse and Reporting

3.10.4 IBM Tivoli Composite Application Manager for SOA agent workspace examples
IBM Tivoli Composite Application Manager for SOA provides the following predefined workspaces, which are organized by navigator item:
� Services Management Agent navigator item
– Services Management Agent workspace
� Message Arrival navigator item
– Message Arrival workspace
� Services Management Agent Environment navigator item
– Application Server Services Management workspace
� Performance Summary navigator item
– Performance Summary workspace
� Message Summary navigator item
– Message Count workspace
� Faults Summary navigator item
– Faults Summary workspace
To obtain more detailed information about these workspaces, see IBM Tivoli Composite Application Manger for SOA: Installing and Using Project Crystal, GC32-9492. Some examples of the Tivoli Monitoring for IBM Tivoli Composite Application Manager for SOA workspaces are shown in Figure 3-67, Figure 3-68, and Figure 3-69 on page 232.
Chapter 3. Warehousing in action 229

Figure 3-67 Tivoli Composite Application Manager for SOA: Services Management Agent Environment workspace example
230 Tivoli Management Services Warehouse and Reporting

Figure 3-68 Tivoli Composite Application Manager for SOA: Performance Summary workspace example
Chapter 3. Warehousing in action 231

Figure 3-69 Tivoli Composite Application Manager for SOA: Message Summary workspace example
232 Tivoli Management Services Warehouse and Reporting

Chapter 4. IBM Tivoli Data Warehouse tuning
This chapter provides information about tuning the Tivoli Data Warehouse by itself, the databases that serve it, and how to tune the Structured Query Language (SQL) code that is used on reports against the Tivoli Data Warehouse. The target audience of this chapter is database administrators.
This chapter discusses the following topics:
� “Using data marts” on page 235
� “Manual creation of data tables” on page 241
� “Batch option” on page 243
� “Database tuning” on page 243
� “Database parameter tuning” on page 244
4
Note: Some of the material in this chapter is based on a whitepaper (“Relational Database Design and Performance Tuning for DB2 Database Servers”) written by Edward Bernal from IBM USA. You can download this whitepaper at: http://www-03.ibm.com/support/techdocs/atsmastr.nsf/fe582a1e48331b5585256de50062ae1c/546c74feec117c118625718400173a3e?OpenDocument.
© Copyright IBM Corp. 2007. All rights reserved. 233

� “Physical design considerations” on page 253
� “SQL tuning” on page 277
234 Tivoli Management Services Warehouse and Reporting

4.1 Using data marts
A data mart is a specialized subset version of a data warehouse. They contain a snapshot of operational data just as the data warehouses, which helps business people to strategize based on analyses of past trends and experiences. The key difference between data warehouse and data mart is that the creation of a data mart is predicated on a specific, predefined need for a certain grouping and configuration of select data. Data marts can satisfy many objectives, such as departmental or organizational control, easier and faster to design and build, fast payback and faster query response times.
The data mart typically contains a subset of corporate data that is of value to a specific business unit, department, or set of users. This subset consists of historical, summarized, and possibly detailed data captured from transaction processing systems or from an enterprise data warehouse. It is important to realize that a data mart is defined by the functional scope of its users, and not by the size of the data mart database. Most data marts today involve less than 100 GB of data; some are larger. However, it is expected that as data mart usage increases, they will continue to increase in size.
The primary purposes of a data mart can be summarized as follows:
� Provides fast access to information for specific analytical needs� Controls user access to the information� Represents the user view and data interface to the data warehouse� Creates a multidimensional view of data for enhanced analysis� Offers multiple slice-and-dice capabilities for detailed data analysis� Stores pre-aggregated information for faster response times
4.1.1 Better reporting performance
Reporting against data marts has a better performance compared to reporting against the main data warehouse, because data marts only have a subset of the data available in the data warehouse, making input/output (I/O) less demanding. Additionally, because the filtering has already been applied at the mart extract, transform, and load (ETL), the reporting queries become much smaller. Smaller queries that are performing on a small subset of data are, of course, easier to tune. Therefore, the client experiences a better reporting performance.
4.1.2 Data mart scenario
To better explain to you the data mart concepts, we describe a small scenario in the context of Tivoli Data Warehouse database. We implement this scenario
Chapter 4. IBM Tivoli Data Warehouse tuning 235

using SQL scripts, but there are some tools that you can use for this purpose. These are described in “Other tools to create data marts” on page 239.
The IT department has a team focused only on the Windows operating system (OS) administration. This team is located in another country and not in the country where the main office is located. Their requirements are:
� Access just their server’s data
� Access data even if the network between the main data center and the local data center is down
� Access all data that is already available in the main data warehouse
� Increase the performance on the database for the reporting services
As you can see, we require a dependent data mart to satisfy these requirements. Because the Windows OS administration team is going to access the data that already exists in the main data warehouse, why not just create a set of database views that use the main data warehouse as their base tables? We can do that; however, the performance will not be improved, therefore the last requirement will not be achieved. The second requirement too will not be achieved, because the team will not be able to access the main data warehouse if the network connection between the main data center and the local data center is down.
Even though the creation of a set of views is not suitable to this scenario, they might be used in cases where access to the data warehouse must be controlled not by tables, but by columns and rows. By using views, you can force specific user IDs to access only data that matters to them. One example is the creation of views based on the NT_System table, for each IT Support team so that each one of them can only access data that matters to them. This filter can be achieved using the WHERE statement on the SQL that is used for creating the view.
In this example, we use materialized query table (MQT) instead of regular views and tables. For more information about materialized query table, see “Materialized query table” on page 259.
Our scenario is based on two databases that are stored on different servers. Because MQT cannot see the target data directly, we have to create federated database objects. The first step in this process is the creation of the wrapper, as shown in Example 4-1. A wrapper is a mechanism by which a federated server can interact with certain types of data sources, in this case DB2 itself.
Example 4-1 Creating wrapper
CREATE WRAPPER "DB2" LIBRARY 'db2drda.dll' OPTIONS( ADD DB2_FENCED 'N');
236 Tivoli Management Services Warehouse and Reporting

Now we have to create a server definition, which defines a data source to a federated database. It works similar to an Open Database Connectivity (ODBC) definition used to connect to any database. When you register the server definition, the federated server connects to the DB2 server and binds packages to the database. Because the information for authorization and password is not stored in the federated global catalog, you must include them in the server definition.
Example 4-2 shows how to create a server definition.
Example 4-2 Creating a server definition
CREATE SERVER WAREHOUS TYPE DB2/UDB VERSION '8.2' WRAPPER "DB2" AUTHID "itmuser" PASSWORD "*****" OPTIONS( ADD DBNAME 'WAREHOUS', PASSWORD 'Y');
Now we create the user mapping, as shown in Example 4-3. This is important, because without it we have to connect manually every time we want to run a select statement or any other SQL statement in a table that exists in a different server. Therefore, when you attempt to access another database server, in this case DB2, the federated server establishes a connection to the data source using a user ID and password that are valid for that data source. This valid user ID and password are defined when you create an association (a user mapping) between the federated server user ID and password and the corresponding data source user ID and password.
Example 4-3 Creating user mapping
CREATE USER MAPPING FOR "DB2ADMIN" SERVER "WAREHOUS" OPTIONS ( ADD REMOTE_AUTHID 'itmuser', ADD REMOTE_PASSWORD '*****');
At this point, we have finished all the steps required to connect to the source server. We now have to register one distinct nickname for each table or view that we want to access in our local database. Example 4-4 shows how to create nicknames.
Example 4-4 Creating nicknames
CREATE NICKNAME DENISV.NT_PROCESSOR FOR WAREHOUS.ITMUSER."NT_Processor";CREATE NICKNAME DENISV.NT_LOGICAL_DISK FOR WAREHOUS.ITMUSER."NT_Logical_Disk";CREATE NICKNAME DENISV.NT_MEMORY FOR WAREHOUS.ITMUSER."NT_Memory";
Chapter 4. IBM Tivoli Data Warehouse tuning 237
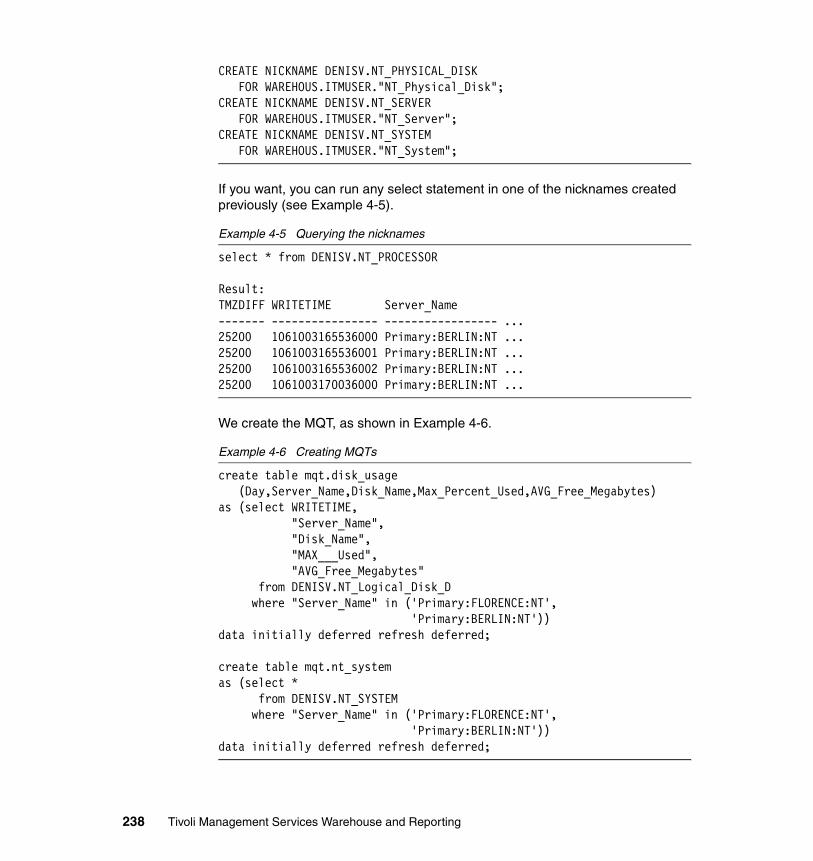
CREATE NICKNAME DENISV.NT_PHYSICAL_DISK FOR WAREHOUS.ITMUSER."NT_Physical_Disk";CREATE NICKNAME DENISV.NT_SERVER FOR WAREHOUS.ITMUSER."NT_Server";CREATE NICKNAME DENISV.NT_SYSTEM FOR WAREHOUS.ITMUSER."NT_System";
If you want, you can run any select statement in one of the nicknames created previously (see Example 4-5).
Example 4-5 Querying the nicknames
select * from DENISV.NT_PROCESSOR
Result:TMZDIFF WRITETIME Server_Name------- ---------------- ----------------- ...25200 1061003165536000 Primary:BERLIN:NT ...25200 1061003165536001 Primary:BERLIN:NT ...25200 1061003165536002 Primary:BERLIN:NT ...25200 1061003170036000 Primary:BERLIN:NT ...
We create the MQT, as shown in Example 4-6.
Example 4-6 Creating MQTs
create table mqt.disk_usage (Day,Server_Name,Disk_Name,Max_Percent_Used,AVG_Free_Megabytes)as (select WRITETIME, "Server_Name", "Disk_Name", "MAX___Used", "AVG_Free_Megabytes" from DENISV.NT_Logical_Disk_D where "Server_Name" in ('Primary:FLORENCE:NT', 'Primary:BERLIN:NT'))data initially deferred refresh deferred;
create table mqt.nt_systemas (select * from DENISV.NT_SYSTEM where "Server_Name" in ('Primary:FLORENCE:NT', 'Primary:BERLIN:NT'))data initially deferred refresh deferred;
238 Tivoli Management Services Warehouse and Reporting

You can double-check the creation by performing a select statement against any of the MQT or checking it in the DB2 catalog tables. Example 4-7 shows the process of querying an MQT.
Example 4-7 Querying a MQT
select TMZDIFF, WRITETIME, “Server_Name” from mqt.nt_system
Result:TMZDIFF WRITETIME Server_Name ------- ---------------- -----------------25200 1061003165541000 Primary:BERLIN:NT25200 1061003170041000 Primary:BERLIN:NT25200 1061003170541000 Primary:BERLIN:NT28800 1061103141503000 Primary:BERLIN:NT
Example 4-8 shows how to double-check the creation of the MQT.
Example 4-8 Double-checking the creation of the MQT
select name, creator, type from sysibm.systables where type='S' and creator='MQT'
Result:NAME CREATOR TYPE--------------- ------- ----DISK_USAGE MQT S NT_SYSTEM MQT S
Repeat the MQT creation step for each table that you want to have access in your local database. The main advantage of the MQT is that they work like a view, but they can store the information locally.
Other tools to create data martsThe data mart scenario in the previous scenario can also be implemented using IBM DB2 DataPropagator™, also known as DPROP or DPROP-R.
Tip: In these examples, we have chosen the refresh deferred option, which instructs DB2 not to automatically refresh the tables. You might want to change this option to immediate if you want so that you do not have to keep refreshing the tables manually or using a job.
Chapter 4. IBM Tivoli Data Warehouse tuning 239
Using DPROP you can perform the following functions:
� Manage scheduling: You can manage the schedule of the replication table by table or many tables all together using subscriptions sets. You can specify that the movement of data takes place on:
– Designated time intervals, therefore you can balance the workload in the servers and network
– Continuously
– Event-driven
� Transformation: Data can be filtered either horizontally or vertically so that only relevant data is replicated, and transformation can be applied inline with the data movement using standard SQL expressions or stored procedure execution.
� Distribution topologies: DPROP supports distribution (moving data from one database to many) and consolidation (moving data from many databases to one) scenarios. It also supports plain and simple database replication to make a replica copy. You can even have all the changes done in the replica sent and replicated in the original database, also known in this case as the source database.
You can find more information about IBM DB2 DataPropagator at:
http://www-306.ibm.com/software/data/integration/replication
Another tool that you might want to use is IBM DB2 Data Warehouse Edition. This is a special version of DB2 database server. It is designed for data warehousing, analytics, OLTP, and mixed workloads, and extends DB2 Enterprise Server Edition to provide real-time data insight and decision support. It also provides an infrastructure for warehouse building and maintenance, including tools for application design, deployment, execution, and administration.
You can find more information about IBM DB2 Data Warehouse Edition at:
http://www-306.ibm.com/software/data/db2/dwe/
You can also use WebSphere DataStage to integrate data across multiple and varied types, and high volumes of data sources and target applications in the time available. This is a powerful ETL tool.
You can find more information at:
http://www-306.ibm.com/software/data/integration/datastage/
240 Tivoli Management Services Warehouse and Reporting

4.2 Manual creation of data tables
Not all database administrators (DBAs) are happy about the idea of an application having the ability to create tables and indexes in a database that the DBAs support. It might be a better idea to have the ability to create the tables used in Tivoli Data Warehouse manually.
4.2.1 Benefits
There are many benefits to manually creating the tables beforehand rather than letting the application create them:
� Allows the DBA to restrict the rights that IBM Tivoli Monitoring has to the database
� Allows the DBA to apply any standards for tables and indexes
� Allows the data and the indexes to be placed in separate table spaces to increase performance
4.2.2 Procedure
To manually create the raw tables, there are several files in the warehouse database that are necessary. See Table 4-1 for more information about the files.
Table 4-1 Files required for manual table creation
Note: You have to install at least Tivoli Data Warehouse FP02 in your environment to use this feature. Also this is only available for Windows environment.
Required files Name of the file
Migration jar file %CANDLE_HOME%\TMAITM6\khdmig.jar
Main execution script %CANDLE_HOME%\TMAITM6\migratewarehouse.bat
Configuration file %CANDLE_HOME%\TMAITM6\KHDENV_MIG
Portal jar files cnp.jarcnp_vbjorball.jarutil.jarkjrall.jarbrowser.jar
Chapter 4. IBM Tivoli Data Warehouse tuning 241
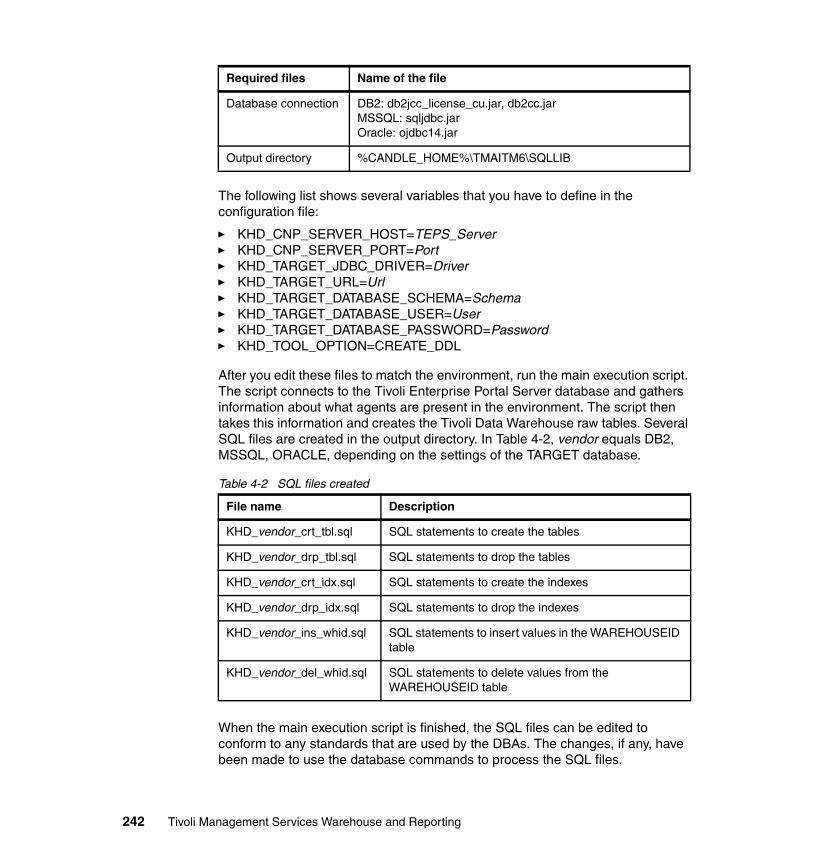
The following list shows several variables that you have to define in the configuration file:
� KHD_CNP_SERVER_HOST=TEPS_Server� KHD_CNP_SERVER_PORT=Port� KHD_TARGET_JDBC_DRIVER=Driver� KHD_TARGET_URL=Url� KHD_TARGET_DATABASE_SCHEMA=Schema� KHD_TARGET_DATABASE_USER=User� KHD_TARGET_DATABASE_PASSWORD=Password� KHD_TOOL_OPTION=CREATE_DDL
After you edit these files to match the environment, run the main execution script. The script connects to the Tivoli Enterprise Portal Server database and gathers information about what agents are present in the environment. The script then takes this information and creates the Tivoli Data Warehouse raw tables. Several SQL files are created in the output directory. In Table 4-2, vendor equals DB2, MSSQL, ORACLE, depending on the settings of the TARGET database.
Table 4-2 SQL files created
When the main execution script is finished, the SQL files can be edited to conform to any standards that are used by the DBAs. The changes, if any, have been made to use the database commands to process the SQL files.
Database connection DB2: db2jcc_license_cu.jar, db2cc.jarMSSQL: sqljdbc.jarOracle: ojdbc14.jar
Output directory %CANDLE_HOME%\TMAITM6\SQLLIB
File name Description
KHD_vendor_crt_tbl.sql SQL statements to create the tables
KHD_vendor_drp_tbl.sql SQL statements to drop the tables
KHD_vendor_crt_idx.sql SQL statements to create the indexes
KHD_vendor_drp_idx.sql SQL statements to drop the indexes
KHD_vendor_ins_whid.sql SQL statements to insert values in the WAREHOUSEID table
KHD_vendor_del_whid.sql SQL statements to delete values from the WAREHOUSEID table
Required files Name of the file
242 Tivoli Management Services Warehouse and Reporting

4.3 Batch option
Use this option to improve the performance when the database is not local. The Warehouse Proxy agent can then submit multiple execute statements to the Tivoli Data Warehouse database as a batch:
� Windows
To set this option, edit the KHDENV file and add the variable KHD_BATCH_USE=Y.
� Linux or UNIX
– Batch processing is one of the features provided with the Java Database Connectivity 2.0 (JDBC 2.0) application programming interface (API). The JDBC driver that is selected must support the batch feature to use this option.
– To set this option, select the Use Batch check box on the configuration panel. This updates the KHD_BATCH_USE variable to Y in the hd.ini file.
4.4 Database tuning
The warehouse database can be implemented using one of the three supported relational databases: DB2, Oracle or Microsoft SQL Server. It is critical that the database supporting the warehouse is correctly configured. Changing the database configuration from a reasonable to an ideal configuration might yield a small performance improvement, but a badly configured database can seriously impede the capabilities of the warehouse.
When we talk about relational database management system (RDBMS) tuning for Tivoli Data Warehouse performance optimization, there are two areas that have to be considered. These are:
� The overall warehouse database tuning (for data gathering and so on)� The reporting performance (against the warehouse database)
The overall warehouse database tuning is discussed in 4.5, “Database parameter tuning” on page 244 and 4.6, “Physical design considerations” on page 253. For information about optimizing the reporting performance, see 4.7, “SQL tuning” on page 277.
Chapter 4. IBM Tivoli Data Warehouse tuning 243

4.5 Database parameter tuning
In this section, we cover some fine-tuning tips for database configuration. Note that we focus only on the actions (or settings) that are applicable in a Tivoli Data Warehouse environment, because a Tivoli Data Warehouse user does not have control over all the possible performance optimization actions (such as changing the table structure, creating indexes) in this environment.
You should also note that the latest versions of commercial RDBMS programs, such as DB2, Oracle, and SQL Server have some form of self-tuning functionality. This means that the RDBMS observes what is running on itself, and automatically makes internal adjustments which, for the most part, keep the databases running as optimally as possible given the tasks at hand and the given hardware.
4.5.1 DB2
This section provides some information about how to tune a DB2 database in the context of parameters.
� DB2_PARALLEL_IO: Specifies whether DB2 can use parallel I/O when reading or writing data to and from table space containers (even in situations where the table space contains only one container).
The default value is NULL.
If you use multiple HDs (data-striping, multiple containers, RAID), you should set this parameter to DB2_PARALLEL_IO=*.
� DB2_STRIPED_CONTAINERS: Specifies whether the table space container ID tag will take up a partial or full RAID disk stripe.
The default value is NULL.
If you use multiple HDs (data-striping, multiple containers, RAID), you should set this parameter to DB2_STRIPED_CONTAINERS=on.
� DB2_BINSORT: Enables a new sort algorithm that reduces the CPU time and elapsed time of sorts.
The default value is YES.
The default value is recommended.
Attention: Before implementing any of these suggestions in your environment, proper backout procedures should be followed, such as saving a backup copy of database configuration, database manager configuration, and registry parameters.
244 Tivoli Management Services Warehouse and Reporting

� DB2_ANTIJOIN: Specifies whether the optimizer should search for opportunities to transform “NOT EXISTS” subqueries into anti-joins, which can be processed more efficiently by DB2.
The default value for an ESE environment is NO.
The default value for a non-ESE environment is YES.
You should set this parameter to YES.
� DB2_HASH_JOIN: Specifies whether a hash join can be used when compiling a data access plan.
The default value is NO.
You should enable this feature; set the parameter to YES.
� DB2_PRED_FACTORIZE: Specifies whether the optimizer searches for opportunities to extract additional predicates from disjuncts.
The default value is NO.
You should enable this feature; set the parameter to YES.
� DB2_CORRELATED_PREDICATES: Specifies if the optimizer should use the KEYCARD information of unique index statistics to detect cases of correlation, and dynamically adjust the combined selectivities of the correlated predicates, thus obtaining a more accurate estimate of the join size and cost.
The default value is YES.
You should keep the default value.
� DB2_RR_TO_RS: Next key lock is used to make sure that no phantom insert or delete happens while you are scanning data; when you turn on DB2_RR_TO_RS, you will not be able to guarantee the isolation level RR.
The default value is NO.
You should keep the default value, otherwise your application may have strange behaviors such as when DB2_RR_TO_RS is on, scans will skip over rows that have been deleted but not committed, even though the row may have qualified for the scan.
� DB2_DIRECT_IO and DB2NTNOCACHE: Specifies whether file system caching is performed on AIX and Windows respectively.
The default value is OFF for both operating systems.
You should enable this feature, setting the parameter to ON so that the system eliminates caching and allows more memory to be available to the database so that the buffer pool or sortheap can be increased.
Chapter 4. IBM Tivoli Data Warehouse tuning 245

� LOGFILSIZ: This parameter defines the size of each primary and secondary log file. The size of these log files limits the number of log records that can be written to them before they become full and a new log file is required.
The default value is 1000.
The default value is quite a small size, therefore you should start with a value of 8192, which means 8192 x 4 k pages of data.
The value of the logfilsiz should be increased if the database has a large number of update, delete, or insert transactions running against it, which will cause the log file to become full very quickly. This will generate a lot of error messages indicating log full. A log file that is too small can affect system performance, because of the overhead of archiving old log files, allocating new log files, and waiting for a usable log file.
� LOGPRIMARY: This parameter allows you to specify the number of primary log files to be preallocated.
The default value is 3.
The default value is not recommended; you should change it to a higher number starting with 10.
� LOGSECOND: This parameter specifies the number of secondary log files that are created and used for recovery log files, when the primary log files become full. The secondary log files (of same size as specified in logfilsiz) are allocated one at a time as needed, up to a maximum number as controlled by this parameter.
The default value is 2.
You should change the default value to a number close to 80% of the number in the LOGPRIMARY parameter in small environments that do not have a lot of transactions. Alternatively, change the default value to at least three times
Tip: You must balance the size of the log files with the number of primary log files; a small number of primary logs associated with a log file size too big will demand a lot of I/O when archiving that log.
Attention: Making this parameter too large can slow things down. The LOGBUFSZ memory comes out of memory for DBHEAP.
Tip: Use secondary log files for databases that have periodic need for large amounts of log space.
246 Tivoli Management Services Warehouse and Reporting

more than the LOGPRIMARY parameter to environments with a lot of transactions.
� DBHEAP: Contains control block information for tables, indexes, table spaces, buffer pools, and space for the log buffer. The value corresponds to the number of pages (4 KB).
The default value is:
– UNIX: 1200– Windows Database server with local and remote clients: 600– Windows 64-bit Database server with local clients: 600– Windows 32-bit Database server with local clients: 300
For large-scale environments, start with a value of 8000 or at least twice the size of the LOGBUFSZ parameter.
� DFT_DEGREE: This parameter specifies the default value for the CURRENT DEGREE special register and the DEGREE bind option.
The default value is 1.
A value of 1 means no intrapartition parallelism. A value of -1 means the optimizer determines the degree of intrapartition parallelism based on the number of processors and the type of query. For a multi-processor machine, set this to -1 (ANY), and allow intrapartition parallelism for this database.
� INTRA_PARALLEL: This parameter specifies whether the database manager can use intrapartition parallelism.
The default value is NO.
You should change it to YES.
� LOCKLIST: Indicates the amount of storage that is allocated to the locklist.
The default value is Automatic on DB2 V8 and 100 on earlier versions.
Start with a value between 800 and 1500, if you are running an older version of DB2, or leave as Automatic, if you are using the v8.
� LOGBUFSZ: Specifies the amount of database heap (defined by the dbheap parameter) to use as a buffer for log records before writing these records to disk. These indicate the number of pages (4 KB per page).
The default value is 8.
The default value is too small, therefore you should change it. Start with a value of 512 for small environments and 4000 for large-scale environments.
Restriction: The intra_parallel parameter does not work without changing the dtf_degree parameter.
Chapter 4. IBM Tivoli Data Warehouse tuning 247

� NUM_IOCLEANERS: Specifies the number of asynchronous page cleaners for a database.
The default value is Automatic.
You should not change it.
� NUM_IOSERVERS: Specifies the number of I/O servers for the database.
The default value is Automatic.
You should not change it.
� SORTHEAP: Defines the maximum number of private memory pages to be used for private sorts, or the maximum number of shared memory pages to be used for shared sorts.
The default value is Automatic on DB2 V8.
This may not be desirable in an OLTP environment; if this is your case, change it. Start with a value of 1024.
4.5.2 Oracle
This section provides some information about how to tune an Oracle database in the context of parameters.
� SGA_MAX_SIZE: Specifies the maximum size of the SGA for the lifetime of the instance. A good starting value is 800 MB.
The shared_pool_size parameter is very hard to determine before statistics are gathered about the actual use of the shared pool. The good news is that in Oracle 9i, it is dynamic, and the upper limit of shared pool size is controlled by the sga_max_size parameter.
For systems with more than 1 GB: shared_pool_size = 128 MB and sga_max_size = 30% of real memory.
Starting with Oracle 9i, SGA managing is dynamic. It means that the DBA just has to set the maximum amount of memory available to Oracle (sga_max_size) and a initial value (shared_pool_size), and it will automatically grow or shrink as necessary. Also, we advise you to use the lock_sga parameter to lock the SGA in real memory when you have large amounts of it.
� SGA_LOCK: Locks the entire SGA into physical memory, ensuring no SGA memory is paged to the disk.
Set to true.
� DB_CACHE_SIZE: Specifies the size of the DEFAULT buffer pool for buffers with the primary block size.
248 Tivoli Management Services Warehouse and Reporting

Start with a value of 500 MB. If you have no idea about how large to set this parameter (which is typical on a new system until you start running tests), then set it so that the SGA is roughly 40% to 50% of memory.
� OPEN_CURSORS: Specifies the maximum number of open cursors (handles to private SQL areas) a session can have at once. You can use this parameter to prevent a session from opening an excessive number of cursors.
Default value is 50.
The default value is usually too small for most of DSS and some OLTP environments, therefore you should set it to 500.
� SHARED_POOL_SIZE: Specifies the size of the shared pool, in bytes. The shared pool contains shared cursors, stored procedures, control structures, and other structures.
Start with a value of 148 MB.
� CURSOR_SHARING: Determines what kind of SQL statements can share the same cursors.
The default value is EXACT.
You can increase performance while you are running select statements, if you set CURSOR_SHARING to SIMILAR.
� PGA_AGGREGATE_TARGET: Specifies the target aggregate PGA memory available to all server processes attached to the instance. The recommended starting value is 1 GB. The WORKAREA_SIZE_POLICY will be set to AUTO, if the PGA_AGGREGATE_TARGET parameter is set to any value.
� LOG_BUFFER: Specifies the amount of memory (in bytes) that Oracle uses when buffering redo entries to a redo log file. This buffer speeds up the database performance by allowing transactions to record the updates to the database but not send nearly empty log records to the redo log disk. If there are many transactions added to the log buffer faster than they can be written to disk, then the buffer can get filled up. This is very bad for performance.
The recommended starting value is 1 MB; you can also set the size of this parameter to be equal to your redo log files’s size.
4.5.3 SQL Server
This section provides some information about how to tune an SQL Server database in the context of parameters.
� Affinity mask: Limits SQL Server execution to only a certain set of processors defined by the bit mask. It is useful for reserving processors for other applications running on the database server.
The default value is 0; execute on all processors.
Chapter 4. IBM Tivoli Data Warehouse tuning 249

There is no need to alter this setting, if your server is a dedicated database server with only one instance of SQL Server running. However, if you have multiple SQL Server instances, you might want to change the parameter to assign each SQL Server instance to particular processes on the server.
Table 4-3 shows the affinity mask values for an 8-CPU system.
Table 4-3 Affinity mask values for an 8-CPU system
� Affinity I/O mask: Limits SQL Server I/O threads execution to only a certain set of processors defined by the bit mask.
The default value is 0; execute on all processors.
The affinity I/O mask option is defined according to the same conditions as the affinity mask option. It is best to use the default setting of 0.
� Lightweight pooling: Controls fiber mode scheduling. It primarily helps large multiprocessor servers that are experiencing a high volume of context switching and high processor utilization.
The default value is OFF.
In general, the lightweight pooling option is not recommended, because it results in only minor performance improvements. This option is typically used for benchmark workloads that are extremely uniform.
� Priority boost: This options specifies whether SQL Server should have a higher scheduling priority than other processes on the same machine.
Decimal value Binary bit mask Allow SQL Server threads on processors
1 00000001 0
3 00000011 0 and 1
7 00000111 0, 1 and 2
15 00001111 0, 1, 2 and 3
31 00011111 0, 1, 2, 3, and 4
63 00111111 0, 1, 2, 3, 4, and 5
127 01111111 0, 1, 2, 3, 4, 5, and 6
255 11111111 0, 1, 2, 3, 4, 5, 6, and 7
Restriction: This parameter is not supported for Microsoft Windows 2000 and Microsoft Windows XP, as today only Windows Server® 2003 provides full support for lightweight pooling.
250 Tivoli Management Services Warehouse and Reporting

The default value is 0.
There is no need to alter this setting if your server is a dedicated database server, because you might drain CPU from other processes such as networking and even I/O. This can cause failure situations and transaction rollbacks, therefore you might be gaining performance on one side, but losing on the other.
� max degree of parallelism: Limits the number of processors considered for parallel plan execution to a specified value.
The default value is 0; execute on all processors, no limit. This default setting may help some complex SQL statements, but it can take away CPU cycles from other users during high online usage periods.
Set this parameter to 1 during peak OLTP periods. Increase the value of this parameter during periods of low OLTP and high batch processing, reporting, and query activity.
Performance tests on some of the batch processes showed that parallelism can result in very good performance. If you do not want to toggle this value based on the type of load, you can set the value to 1 to disable this setting. However, you may want to explore some middle ground by setting this option to a higher value, for example, 2, which may help some complex batch jobs and also online performance. The value can be changed to a even higher number up to 64. However, do not think that if you increase this value to the maximum, it will exponentially increase the overall performance of your SQL statement. This will not be true for 98% of the SQL statements, it may do the opposite, that is, a simple query may take longer than expected.
Attention: Raising the priority too high may drain resources from essential operating system and network functions, resulting in problems in shutting down SQL Server or using other operating system tasks on the server.
Note: Index creation and re-creation can take advantage of parallelism, therefore it is advisable to enable parallelism through this setting when planning to build or rebuild indexes.
Note: If the computer has only one processor, the max degree of parallelism value is ignored.
Chapter 4. IBM Tivoli Data Warehouse tuning 251
� Cost threshold for parallelism: Specifies the cost threshold in seconds that needs to be met before a query is eligible to be executed with a parallel query execution plan.
The default value is 5.
Most of the SQL statements of Tivoli are simple in nature and do not require parallel query execution plans. Consider increasing the value to 60 so that only true complex queries are evaluated for parallel query execution plans. Therefore, if you set this value to 60, this means that the Query Optimizer will not consider parallelism for any query that it thinks will take less than 60 seconds to run.
� Awe enabled: Enable this parameter to take advantage of memory above 4 GB. This is applicable only for 32-bit operating systems.
In Microsoft SQL Server 2005, you can use the Address Windowing Extensions (AWE) API to provide access to physical memory in excess of the limits set on configured virtual memory.
The default value is 0 (Disabled).
To enable AWE, set awe enabled to 1.
� Max server memory: Specifies the maximum and minimum memory respectively in megabytes allocated to an SQL Server instance.
The default values are 2147483647 and 0, respectively.
Important: If the affinity mask option is not set to the default, it may restrict the number of processors available to SQL Server on symmetric multiprocessing (SMP) systems.
Important: SQL Server ignores the cost threshold for parallelism value under the following conditions:
� Your computer has only one processor
� Only a single CPU is available to SQL Server because of the affinity mask configuration option
� The max degree of parallelism option is set to 1
Important: Using awe enabled and max server memory can affect the performance of other applications or SQL Server running in a multi-instance or cluster environment.
252 Tivoli Management Services Warehouse and Reporting

Max server memory / min server memory: SQL Server can adapt its memory consumption to the workload. SQL Server allocates memory dynamically within the range of the real memory. Use this setting for a dedicated database server that does not leverage AWE.
4.6 Physical design considerations
Physical design considerations have a lot of impact on the performance of RDBMS. First we start with general hardware and operating system considerations that are applicable to all RDBMS systems. Then we cover considerations for each supported RDBMS separately.
4.6.1 Hardware and operating system usage
This section discusses overall considerations for the hardware and operating system usage factors, but it does not discuss detailed calculations for capacity planning purposes.
MemoryUnderstanding how RDBMS organizes memory helps you to tune memory use for good performance. Many configuration parameters affect memory usage. Some might affect memory on the server, some on the client, and some on both. Furthermore, memory is allocated and de-allocated at different times and from different areas of the system. While the database server is running, you can increase or decrease the size of memory areas inside the database shared memory. You must understand how memory is divided among the different heaps before tuning to balance overall memory usage on the entire system.
Central processing unitThe CPU utilization goal must be approximately 70% to 80% of the total CPU time. Lower utilization means that the CPU can cope better with peak workloads. Workloads between 85% to 90% result in queuing delays for CPU resources, which affects response times. CPU utilization above 90% usually results in unacceptable response times. While running batch jobs, backups, or loading large amounts of data, the CPU might be driven to high percentages, such as to 80 to 100%, to maximize throughput.
Chapter 4. IBM Tivoli Data Warehouse tuning 253

Most RDBMS nowadays support the following processor configurations:
� Uni-Processor: This is a single system that contains only one single CPU.
� Symmetric multiprocessor (SMP): This is a single system that can contain multiple CPUs; scalability is limited to the CPU sockets provided on the motherboard.
� Massively parallel processors (MPP): This is a system with multiple nodes connected over a high speed link; each node has their own CPU. Scalability is achieved by adding new nodes.
Things to consider regarding CPU:
� Inefficient data access methods cause high CPU utilization, and are major problems for database system.
� Paging and swapping requires CPU time. Consider this factor when planning your memory requirements.
Input/output The following points are rules of thumb that you use to calculate total disk space required by an application. If you have more detailed information, use that instead of the following points.
� Calculate the raw data size:
– Add the column lengths of your database tables– Multiply by the number of rows expected
� When you have the raw data size, use the following scaling up ratios to factor in space for indexing, working space, and so on.
– OLTP ratio: 1:3– Data Description Specification (DSS) ratio: 1:4– Data warehouse ratio: 1:5
Consider the following tips to improve disk efficiency:
� Minimize I/O: In the order of magnitude, access to main memory is faster than it is to disk. Provide as much memory as possible to the database buffer pools and various memory heaps to avoid I/O.
� When I/O is required, reading simultaneously from several disks is the fastest way. Provide for parallel I/O operations by:
– Using several smaller disk rather than one big disk– Place the disk drives on separate controllers
254 Tivoli Management Services Warehouse and Reporting

Choosing disk drivesThere are several trends in current disk technology:
� Disk drives get bigger every year, roughly doubling in capacity every 18 months.
� The cost per GB is lower each year.
� The cost difference of the two smallest drives diminishes until there is little point in continuing with the smaller drive.
� The disk drives improve a little each year in seek time.
� The disk drives get smaller in physical size.
Although the disk drives continue to increase capacity with a smaller physical size, the speed improvements, seek, and so on, are small in comparison.
A database that had to take 36 * 1 GB drives a number of years ago can now be placed on one disk. This highlights the database I/O problems. For example, if each 1 GB disk drive can perform 80 I/O operations a second, this means the system can do a combined 36 * 80 = 2880 I/O operations per second. But a single 36 GB drive with a seek time of 7 minutes can perform only 140 I/O operations per second. Although increased disk drive capacity is good news, the lower numbers of disks cannot deliver the same I/O throughput.
RecommendationsConsider the following recommendations:
� When determining your I/O requirements, consider OLTP systems:
– Reading data involves reading indexes– Inserts and updates require data, index, and logs to be written
� Provide for parallel I/O operations:
– Separate data and indexes in separate table spaces, filegroups, or both.
– Use the smallest disk drives possible purely on the basis of increasing the number of disks for I/O throughput. If you buy larger drives, use only half the space (the middle area, which is the fastest) for the database, and the other half for:
• Backups • Archiving data• Off hour test databases• Extra space used for upgrades
Chapter 4. IBM Tivoli Data Warehouse tuning 255

NetworkUsually, the network is not a serious bottleneck, but it can influence the overall performance of your application, and it typically manifests itself when there is a delay in the following situations:
� The time between when a client machine sends a request to the server and the server receives this request
� The time between when the server machine sends data back to the client machine and the client machine receives the data
When a system is implemented, monitor the network to ensure that more than 50% of its bandwidth is not being consumed. You can monitor on UNIX with netpmon (for example, netpmon -O all -o netpmon.out), and on Windows with Perfmon.exe.
RecommendationsYou can use the following techniques to improve overall performance and avoid high network consumption:
� Consider reusing database connections, which can be accomplished using connection pooling features present in all the major RDBMS available in the market and in some application servers such as WebSphere.
Why is connection pooling so beneficial? Creating a connection is quite expensive, because it requires your application to connect to the database server, authenticate, and return a valid connection. Re-using a connection from a connection pool eliminates this overhead.
With Web applications, proper pooling is absolutely critical to performance, because if your application server or Web server is not properly configured, it might close all of the database connections of a page after the page is processed. With some Web sites or applications asking for hundreds, thousands, or millions of database requests, consider what can happen to your database server. Can it achieve so many demanding tasks, or is it likely to die as though it is being attacked by a Denial of Service (DoS) attack.
Connection pooling is implemented using tools such as:
– JDBC through, for example, the WebSphere connection pooling feature– IBM DB2 Connect™
� Use stored procedures to minimize the number of accesses to the database. Stored procedures are programs that reside on the RDBMS server and can be run as part of a transaction by the client applications. This way, several pre-programmed SQL statements can be run by using only one command from the client machine.
256 Tivoli Management Services Warehouse and Reporting
Using stored procedures typically makes it more difficult to run your application on different database platforms, such as DB2, Oracle, or SQL Server, because of the syntactical differences of their stored procedure implementation. Therefore, if you want to run your application on multiple database platforms, be aware of this consideration.
4.6.2 DB2
This section offers you information about how to tune a DB2 database in the context of physical design.
Buffer poolsA buffer pool is an area of memory into which database pages are read, modified, and held during processing, either as new data is added to a database or as data is retrieved from disk in response to a query. On any system, accessing memory is faster than disk I/O. DB2 uses database buffer pools to attempt to minimize disk I/O.
There is no definitive answer to the question of how much memory you must dedicate to the buffer pool. Generally, more is better. A good rule of thumb is to start with approximately 75% of your system's main memory devoted to buffer pools, but this rule is applicable only if the machine is a dedicated database server. Because it is a memory resource, its use has to be considered along with all other applications and processes running on a server. If your table spaces have multiple page sizes, then you must create only one buffer pool for each page size.
In some cases, defining multiple buffer pools of the same size can improve performance. However, if it is badly configured, it can have a huge negative impact on performance. It is often better to use a single large buffer pool than several small buffer pools. Using several small buffer pools can cause frequently accessed pages to be swapped in and out of memory more often. This, in turn, can lead to I/O contention for storage objects, such as system catalog tables or repeatedly accessed user tables and indexes. Consider the following points when you decide to create multiple buffer pools:
� You create tables that reside in table spaces using a page size other than the 4 KB default. This is required (as mentioned previously).
� You have tables that are accessed frequently and quickly by many short update transaction applications. Dedicated buffer pools for these tables might improve response times.
� You have tables larger than main memory, which are always fully scanned. These can have their own dedicated buffer pool.
Chapter 4. IBM Tivoli Data Warehouse tuning 257

LogsOne of the main purposes of all database systems is to maintain the integrity of your data. All databases maintain log files that keep records of database changes. DB2 logging consists of a set of primary and secondary log files that contain log records that record all changes to a database. The database log is used to roll back changes for units of work that are not committed and to recover a database to a consistent state. DB2 provides two logging strategy choices:
� Circular logging
This is the default log mode. With circular logging, the log records fill the log files, and then overwrite the initial log records in the initial log file. The overwritten log records are not recoverable. This type of logging is typically not suited for a production application.
� Log retain logging
Each log file is archived when filled with log records. New log files are made available for log records. Retaining log files enables roll-forward recovery. Roll-forward recovery reapplies changes to the database based on completed units of work (transactions) that are recorded in the log. You can specify that roll-forward recovery is to the end of the logs or to a particular point in time before the end of the logs. Archived log files are never directly deleted by DB2. Therefore, it is the responsibility of the application to maintain them, such as archive, purge, and so on.
Log performanceIgnoring the performance of your database in relation to its logging can be a costly mistake, the main cost being time. Placement of the log files has to be optimized, not only for write performance, but also for read performance, because the database manager has to read the log files during database recovery.
RecommendationsConsider the following recommendations:
� Use the fastest disks available for your log files.
Use a separate array, channel, or both, if possible.
� Use Log Retain logging.
� Mirror your log files.
258 Tivoli Management Services Warehouse and Reporting

� Increase the size of the database configuration Log Buffer parameter (logbufsz):
– This parameter specifies the amount of the database heap to use as a buffer for log records before writing these records to disk. The log records are written to disk when one of the following occurs:
• A transaction commits, or a group of transactions commit, as defined by the mincommit configuration parameter
• The log buffer is full
• As a result of some other internal database manager event
– Buffering the log records results in more efficient logging file I/O, because the log records are written to disk less frequently, and more log records are written at each time.
� Tune the Log File Size (logfilsiz) database configuration parameter so that you do not create excessive log files.
Materialized query tableA materialized query table (MQT) is a table whose definition is based upon the result of a query. You can think of an MQT as a kind of materialized view. Both views and MQTs are defined based on a query, but instead of just pointing to the data, MQTs store the query results in the form of data, such as a table. An MQT can query tables, views, and other MQTs. Collectively, these are called master tables (a replication term) or detail tables (a data warehouse term).
Materialized query tables can significantly improve the performance of queries, especially complex queries. Because complex queries’ results are based on data that does not change frequently, such as data used to make financial reports of last quarter or last month, they can be stored in these MQTs and be refreshed once a month, or whenever required. This way a user can query potentially terabytes of detail data in just a few seconds. This great performance is accomplished by the use of precomputed summarizations and joins of data.
An MQT can be defined as maintained by:
� System
When an MQT is maintained by the system, this means that you will not be able to do any insert, update, or deletes directly to the MQT. There are two types of System MQTs, and both types must be defined during the creation of the MQT. They are:
– REFRESH IMMEDIATE: When you specify REFRESH IMMEDIATE, this tells the RDBMS that the MQT must be created and loaded with data based on the result of query defined in the creation of it. And every time
Chapter 4. IBM Tivoli Data Warehouse tuning 259

that the underlying tables change, these changes are replicated in the MQT.
– REFRESH DEFERRED: When you specify REFRESH DEFERRED, this tells the RDBMS that the MQT must be created empty, with no data at all, and that you will refresh the content of the MQT using the REFRESH TABLE statement. Remember that you cannot run any DML statement against a System MQT. However, REFRESH IMMEDIATE system-maintained MQTs are updated with changes made to the underlying tables as a result of insert, update, or delete operations. See Example 4-9.
Example 4-9 Create table example
create table emp as (select e.empno, e.firstnme, e.lastname, d.mgrno
from employee e inner join department d
on e.workdept = d.deptno) data initially deferred refresh immediate
� User
A User MQT is maintained by the user itself, which means that the RDBMS does not perform any data loading at all in this MQT, and the users must by themselves do everything. In this type of MQT, you can run any DML statement against it, such as inserts, updates, and deletes. When you create a User MQT, you can only specify it as REFRESHED DEFERRED, therefore, the REFRESH IMMEDIATE command does not work in it. See Example 4-10.
Example 4-10 Create table example
create table emp as (select e.empno, e.firstnme, e.lastname, d.mgrno
from employee e inner join department d
on e.workdept = d.deptno) data initially deferred refresh deferred maintained by user
Database maintenanceRegular maintenance is a critical factor in the performance of a database environment. This involves running the Reorg, Runstats, and Rebind facilities, in that order, on the database tables. A regularly scheduled maintenance plan is essential to maintain peak performance of your system.
260 Tivoli Management Services Warehouse and Reporting

REORGAfter many changes to table data, which are caused by INSERT, DELETE, and UPDATE of variable length columns activity, logically sequential data might be on non-sequential physical data pages so that the database manager must perform additional read operations to access data. You can reorganize DB2 tables to eliminate fragmentation and reclaim space using the REORG command.
� Significant reductions in elapsed times due to improved I/O can result from regularly scheduled REORGs.
� DB2 provides two types of REORG operation.
– Classic REORG
• Provides the fastest method of REORG
• Indexes are rebuilt during the reorganization
• Ensures perfectly ordered data
• Access is limited to read-only during the UNLOAD phase; no access during other phases
• Is not restartable
– In-Place REORG
• Slower than the Classic REORG; takes longer to complete• Does not ensure perfectly ordered data or indexes• Requires more log space• Can be paused and restarted• Can allow applications to access the database during reorganization
RecommendationsConsider the following recommendations:
� Implement a regularly scheduled maintenance plan.
� If you have an established database maintenance window, use the Classic REORG.
� If you operate a 24x7 operation, use the In-Place REORG.
RUNSTATSAs mentioned previously, the DB2 optimizer uses information and statistics in the DB2 catalog to determine the best access to the database based on the query provided. Statistical information is collected for specific tables and indexes in the local database when you issue the RUNSTATS utility. When significant numbers of table rows are added or removed, or if data in columns for which you collect
Chapter 4. IBM Tivoli Data Warehouse tuning 261

statistics is updated, run RUNSTATS again to update the statistics. Use the RUNSTATS utility to collect statistics in the following situations:
� When data is loaded into a table and the appropriate indexes are created
� When you create a new index on a table; you have to issue RUNSTATS for only the new index, if the table has not been modified since you last ran RUNSTATS on it.
� When a table is reorganized with the REORG utility
� When the table and its indexes are extensively updated, by data modifications, deletions, and insertions (Extensive in this case can mean that 10% to 20% of the table and index data is affected.)
� Before binding or rebinding application programs whose performance is critical
� When you want to compare current and previous statistics; if you update statistics at regular intervals you can discover performance problems early.
� When the prefetch quantity is changed
� When you have used the REDISTRIBUTE DATABASE PARTITION GROUP utility
There are various formats of the RUNSTATS command, mainly determining the depth and breadth or statistics collected. The more you collect, the longer the command takes to run. Some of the options are as follows:
� Collecting either SAMPLED or DETAILED index statistics
� Collecting statistics on all columns or only columns used in JOIN operations
� Collecting distribution statistics on all, key, or no columns. Distribution statistics are useful when you have an uneven distribution of data on key columns
RecommendationsConsider the following recommendations:
� Care must be taken when you run RUNSTATS, because the information collected impacts the optimizer's selection of access paths.
� Implement as part of a regularly scheduled maintenance plan if some of the previously mentioned conditions occur.
� To ensure that the index statistics are synchronized with the table, issue RUNSTATS to collect both table and index statistics at the same time.
262 Tivoli Management Services Warehouse and Reporting

� Consider some of the following factors when deciding what type of statistics to collect:
– Collect statistics only for the columns used to join tables or in the WHERE, GROUP BY, and similar clauses of queries. If these columns are indexed, you can specify the columns with the ONLY ON KEY COLUMNS clause for the RUNSTATS command.
– Customize the values for num_freqvalues and num_quantiles for specific tables and specific columns in the tables.
– Collect DETAILED index statistics with the SAMPLE DETAILED clause to reduce the amount of background calculation performed for the detailed index statistics. The SAMPLE DETAILED clause reduces the time required to collect statistics and produces adequate precision in most cases.
– When you create an index for a populated table, add the COLLECT STATISTICS clause to create statistics as the index is created.
REBINDAfter running RUNSTATS on your database tables, you have to rebind your applications to take advantage of these new statistics. This is done to ensure that the best access plan is being used for your SQL statements. How that rebind takes place depends on the type of SQL that you are running. DB2 provides support for:
� Dynamic SQL
These are SQL statements that are prepared and run at run time. In dynamic SQL, the SQL statement is contained as a character string in a host variable and is not precompiled.
� Static SQL
These are SQL statements that are embedded within a program and are prepared during the program preparation process before the program is run. After being prepared, a static SQL statement does not change, although values of host variables specified by the statement can change. These static statements are stored in a DB2 object called a package.
Both dynamic SQL statements and packages can be stored in one of the caches of DB2. Based on these types of SQL, a rebind takes place under these conditions.
� Dynamic SQL
– If the statement is not in the cache, the SQL Optimizer binds the statement and generates a new access plan.
– If the statement is in the cache, no rebind takes place.
Chapter 4. IBM Tivoli Data Warehouse tuning 263

To clear the contents of the SQL cache, use the FLUSH PACKAGE CACHE SQL statement.
� Static SQL
– An explicit REBIND <package> is issued– Implicitly if the package is marked invalid
For example, this can occur if an index that the package was using has been dropped.
Monitoring toolsThe most convenient way for you is to use IBM Tivoli Monitoring DB2 agent to monitor your DB2 database, because IBM Tivoli Monitoring is already installed in your environment. For sample scenarios, refer to Deployment Guide Series: IBM Tivoli Monitoring Express Version 6.1, SG24 -7217.
In addition, DB2 provides several other tools that you can use for monitoring or analyzing your database. These monitoring and analyzing tools and their purposes are:
� Snapshot Monitor: This tool captures performance information at periodic points of time. It is used to determine the current state of the database.
� Event Monitor: This tool provides a summary of activity at the completion of events such as statement execution, transaction completion, or when an application disconnects.
� Explain Facility: This tool provides information about how DB2 accesses the data to resolve the SQL statements. We can use both the explain tool using any SQL editor, or the visual explain tool for those who prefer using a graphical user interface (GUI) application.
� db2batch tool: This tool provides performance information (benchmarking tool).
4.6.3 Oracle
This section provides some information about how to tune an Oracle database in the context of physical design.
Buffer poolsA buffer pool or buffer cache is a memory structure inside Oracle System Global Area (SGA) for each instance. This buffer cache is used for caching data blocks
Important: Perform a REBIND after running RUNSTATS as part of your usual database maintenance procedures.
264 Tivoli Management Services Warehouse and Reporting

in the memory. Accessing data from the memory is significantly faster than accessing data from disk. The goal of block buffer tuning is to efficiently cache frequently used data blocks in the buffer cache (SGA) and provide faster access to data. Tuning block buffer is a key task in any Oracle tuning initiative and is a part of the ongoing tuning and monitoring of production databases. Oracle maintains its own buffer cache inside the SGA for each instance. A properly sized buffer cache can usually yield a cache hit ratio over 90%, which means that nine requests out of ten are satisfied without going to disk. If a buffer cache is too small, the cache hit ratio will be small and more physical disk I/O will result. If a buffer cache is too big, then parts of the buffer cache will be underutilized and memory resources will be wasted.
Redo logsOne of the main purposes of all database systems is to maintain the integrity of your data. All databases maintain log files that keep records of database changes. Oracle redo log consists of a set of two or more redo log files, and these files are filled with redo records. The database requires a minimum of two files to guarantee that one is always available for writing, and the other is being archived (if the database is in ARCHIVELOG mode).
A redo record consists of a group of change vectors, each of which is a description of a change made to a single block in the database. The database log is used to roll back changes for units of work that are not committed, and to recover a database to a consistent state. LGWR is an Oracle process that takes care of writing the log from the buffer to the files. It writes to redo log files in a circular fashion. When the current redo log file fills, LGWR begins writing to the next available redo log file. When the last available redo log file is filled, LGWR returns to the first redo log file and writes to it, starting the cycle again. Filled redo log files are available to LGWR for reuse depending on whether archiving is enabled.
Oracle provides two logging strategy choices:
� No archive logging
This is the default log mode, and it is also known as NOARCHIVELOG mode. With circular logging, the log records fill the log files, and then overwrite the initial log records in the initial log file after all the changes are written to the data files. The overwritten log records are not recoverable. This type of logging is typically not suited for a production application.
� Archive logging
Each log file is archived only after all the changes are applied to the data files. After the archiving of the log file, it is available for use by the LGWR process. Retaining these log files enables roll-forward recovery. Roll-forward recovery reapplies changes to the database based on completed units of work
Chapter 4. IBM Tivoli Data Warehouse tuning 265

(transactions) that are recorded in the log. You can specify that roll-forward recovery is to the end of the logs, or to a particular point in time before the end of the logs. Archived log files are never directly deleted by Oracle, therefore it is the responsibility of the application to maintain them, such as to archive, purge, and so on.
Log performanceIgnoring the performance of your database in relation to its logging can be a costly mistake, the main cost being time. Placement of the log files has to be optimized, not only for write performance, but also for read performance, because the database manager has to read the log files during database recovery. Therefore when designing for performance, you must keep in mind four things:
� Multiplexing redo log files
Multiplexing means that you can have copies of your redo log files in different disks. It works like a log replication. Each copy is called a member. Oracle writes to these members simultaneously to ensure that the database is always recoverable, at the same time maintaining performance. But remember that you must have at least two log files per database and in that number you cannot include multiplexes copies.
� Placing redo log members on different disks
If you put each member in a different disk, it can improve the LGWR performance, because it uses less I/O.
� Setting the size of redo log members
The size of the redo log files can influence performance, because the behavior of the database writer and archiver processes depends on the redo log sizes. Generally, larger redo log files provide better performance. Undersized log files increase checkpoint activity and reduce performance.
It might not always be possible to provide a specific size recommendation for redo log files, but redo log files in the range of a 100 MB to a few GB are considered reasonable. Size your online redo log files according to the amount of redo that your system generates. A rough guide to switch logs is, at most, once every 20 minutes.
� Choosing the number of redo log files
You must have at least two log files’ members (no copies) per database, but you can have more. This depends on your approach. You might choose to get bigger redo logs or get more redo logs in different disks. You must achieve a balance between them to get the optimal performance.
266 Tivoli Management Services Warehouse and Reporting

Materialized viewsA materialized view is basically a table whose definition is based upon the result of a query. Both views and materialized views are defined based on a query, but instead of just pointing to the data, materialized views can store the query results in the form of data, such as a table. A materialized view can query tables, views, and other materialized views. Collectively, these are called master tables (a replication term) or detail tables (a data warehouse term).
Materialized views can significantly improve the performance of queries, especially complex queries. Because complex queries’ results are based on data that does not change frequently, such as data used to make financial reports of last quarter or last month, they can be stored in these materialized views and be refreshed once a month or whenever required. This way, a user can query potentially terabytes of detail data in just a few seconds. This great performance is accomplished by the use of precomputed summarizations and joins of data.
In Oracle’s materialized views, you can even define the time frame between automatic refreshes. Use the refresh option in the create statement, as shown in Example 4-11.
Example 4-11 Refresh option
create materialized view sample_mv build immediate refresh on commit enable query rewriteasSELECT dept.dname, count(*)
FROM emp INNER JOIN dept
ON emp.deptno = dept.deptno;
In Example 4-11, you can use the following options:
� Build immediate
This option commands the Oracle database to load the materialized view with data from that moment.
Attention: Oracle recommends that you multiplex your redo log files. The loss of the log file data can be catastrophic, if recovery is required.
Chapter 4. IBM Tivoli Data Warehouse tuning 267

� Refresh on commit
Every time the base or master tables are refreshed, the materialized view reflects those changes. You can also have a materialized view that is refreshed every seven days, as shown in Example 4-12.
Example 4-12 Refresh option
CREATE MATERIALIZED VIEW sample_mv REFRESH FAST START WITH SYSDATE NEXT SYSDATE + 7ASSELECT dept.dname, count(*)
FROM emp INNER JOIN dept
ON emp.deptno = dept.deptno;
Monitoring toolsYou can use IBM Tivoli Monitoring for Oracle agent to monitor database through IBM Tivoli Monitoring.
Oracle also provides some monitoring tools for Oracle database:
� TKProf: TKPROF stands for transient kernel profiler and is used to convert Oracle trace files into a more readable form.
� Oracle Enterprise Manager’s Tuning Pack: This pack contains tools that can be used to identify problems, give recommendations about indexes, and other useful tools, such as tuning the Oracle database.
4.6.4 SQL Server
This section provides some information about how to tune an SQL Server database in the context of physical design.
Buffer cacheThe buffer cache is divided into 8 KB pages. The buffer manager manages the functions for reading data or index pages from the database disk files into the buffer cache, and writing modified pages back to disk. A page remains in the buffer cache until it has either not been referenced for some time or the buffer manager requires the buffer area to read in more data. Data is written back to disk only if it is modified. Data in the buffer cache can be modified multiple times before being written back to disk.
268 Tivoli Management Services Warehouse and Reporting

SQL Server bufferThe Buffer Cache Hit Ratio counter indicates how often SQL Server goes to the buffer, and not the hard disk, to get data. In OLTP applications, this ratio must exceed 90%, and ideally be more than 99%. If your buffer cache hit ratio is lower than 90%, purchase more RAM. If the ratio is between 90% and 99%, then you must consider purchasing more RAM, because the closer you get to 99%, the faster your SQL Server performs. In some cases, if your database is very large, you might not be able to get close to 99%, even if you put the maximum amount of RAM in your server. You can try and add as much as you can.
In OLAP applications, the ratio can be much less because of the nature of how OLAP works. In any case, more RAM increases the performance of SQL Server.
LogsThe log files in SQL Server are known as transaction logs. Each SQL Server database has at least one log file, and this log is a wrap-around file. Each log file is subdivided in N virtual log files. These virtual log files do not have a specific size or amount of virtual files predefined. The SQL Server decides this when it extends or creates new log files. SQL Server writes all the transaction records in a wrap-around style.
For example, consider a database with two physical log files, each one with three virtual log files. When the database is created, the virtual and physical log file begins in the same place. New log records are added at the end of the logical log and expanded toward the end of the physical log. Log truncation frees any virtual logs that has a number of records smaller than the minimum recovery log sequence number (MinLSN). The MinLSN is the log sequence number of the oldest log record that is required for a successful database-wide rollback. When the end of the logical log reaches the end of the physical log file, the new log records wrap around to the start of the physical log file, and this keeps going while the logical log never reaches the beginning of the logical log. However, if that happens, the end of the logical log reaches the start of the logical log and one of following results occurs:
� If the FILEGROWTH setting is enabled for the log and space is available on the disk, the file is extended by the amount specified in growth_increment and the new log records are added to the extension.
� If the FILEGROWTH setting is not enabled or the disk that is holding the log file has less free space than the amount specified in growth_increment, an error is generated.
� If the log contains multiple physical log files, the logical log will move through all the physical log files before it wraps back to the start of the first physical log file.
Chapter 4. IBM Tivoli Data Warehouse tuning 269

Recommendations Consider the following recommendations:
� Each database can have one or more transaction logs. It is a good idea to have more than one transaction log per database and have them located in more than one disk.
� Restarting a server instance resizes the transaction log of the tempdb database to its original pre-autogrow size. This can reduce the performance of the tempdb transaction log. You can avoid this overhead by increasing the size of the tempdb transaction log after starting or restarting the server instance.
� As you can see, SQL Server does not have any feature for retaining or archiving the transaction logs as DB2 and Oracle have. Therefore, it is important that you design and implement a periodic transaction log backup. If you do not have a periodic backup, you will not be able to restore a database within a specific time, it will only be restored to the latest database backup you have.
However, you must make sure that the truncate log on the checkpoint option on the database is set to false. If it is set to true, as soon as 70% of the log file is used, or any error occurs, the SQL Server will try to take a checkpoint, and truncate all non-active log records. You can set the database’s truncate log on checkpoint option to false using the command shown in Example 4-13.
Example 4-13 Setting the database’s truncate log on checkpoint option to false
exec sp_dboption 'pubs', 'trunc. log on chkpt.', 'false'
This sets the option to false on the database pubs, but you can choose any of your databases.
The unused virtual log spaces are freed after each backup log that you make. This way your log file does not grow until it reaches the end of the disk.
� We recommend that you do not define the transaction log files’ initial size as too small or define the growth_increment value as too small. This way you can minimize the number of times that the log file grows, thereby decreasing the overhead necessary to do that.
Indexed viewsAn indexed view is a view that has a unique clustered index created on it. Usually views do not exist on disk as rows. This changes for indexed views, which exist in the database as rows that realize the view. There can also be nonclustered indexes on the view, if it has the unique clustered index. Both views and indexed views are defined based on a query, but instead of just pointing to the data, indexed views store the query results in the form of data, such as a table. An indexed view can query tables, views, and other indexed views. Collectively,
270 Tivoli Management Services Warehouse and Reporting

these are called master tables (a replication term) or detail tables (a data warehouse term). When the clustered index is created on the view, SQL Server immediately allocates storage space to store the results of the view. You can then treat the view like any other table by adding additional nonclustered indexes.
Indexed views can significantly improve the performance of queries, especially complex queries. Because complex queries’ results are based on data that does not change frequently, such as data used to make financial reports of last quarter or last month, they can be stored in these materialized views. This way, a user can query potentially terabytes of detail data in just a few seconds. This great performance is accomplished by the use of precomputed summarizations and joins of data.
An indexed view automatically reflects modifications made to the data in the base tables after the index is created, which is the same way that an index created on a base table does. Because modifications are made to the data in the base tables, the data modifications are also reflected in the data stored in the indexed view. See Example 4-14.
Example 4-14 Create view
CREATE VIEW Vdiscount1 WITH SCHEMABINDING AS SELECT SUM(UnitPrice*OrderQty) AS SumPrice, SUM(UnitPrice*OrderQty*(1.00-UnitPriceDiscount)) AS SumDiscountPrice, COUNT_BIG(*) AS Count, ProductIDFROM Sales.SalesOrderDetail GROUP BY ProductIDGOCREATE UNIQUE CLUSTERED INDEX VDiscountInd ON Vdiscount1 (ProductID)
Database maintenanceA comprehensive description of database maintenance is beyond the scope of this book. There are other books, articles, and Web sites, which provide further information about the commands shown in this section. The key to maintaining a database is to be familiar with how it runs. The commands shown in this section help you to spot the warning signs that the database is about to have a bad day and, hopefully, can help you to prevent them.
� DBCC CHECKDB
The first command to run, to help spot the problems in the database, is DBCC CHECKDB. The DBCC CHECKDB command verifies that index and data pages are linked properly, indexes are sorted, the pointers in the database are accurate, the data looks fine, and that there are proper page offsets. If you
Chapter 4. IBM Tivoli Data Warehouse tuning 271

are unsure of what that means, that is acceptable, as you are only looking for errors at this point. The syntax looks like Example 4-15.
Example 4-15 DBCC CHECKDB
DBCC CHECKDB ('DatabaseName')
The output goes on for sometime, but must not have any error codes. You can suppress the output of the information messages by adding WITH NO_INFOMSGS to the end of the command, as shown in Example 4-16.
Example 4-16 DBCC CHECKDB
DBCC CHECKDB ('DatabaseName') WITH NO_INFOMSGS
� DBCC CHECKTABLE
Use the DBCC CHECKTABLE command to drill in a bit further on any table that has generated an error.
� DBCC INDEXDEFRAG, DBCC DBREINDEX
The main item of database optimization is the index. Each index on a database is a set of pointers to where the data is stored in the physical arrangement of the tables. When these indexes are not kept up-to-date or become fragmented, then the access to the data is slow. To defragment the indexes, you can use both DBCC commands, if you have an earlier version of SQL Server. Alternatively, you can use the new ALTER INDEX command, because those two DBCC commands were deprecated on the SQL Server 2005 version. The difference between both DBCC commands is that the INDEXDEFRAG is an online operation and does not hold any locks.
Example 4-17 shows how to rebuild indexes in a table using the DBCC DBREINDEX command.
Example 4-17 Rebuilding indexes in table using DBCC DBREINDEX command
--Rebuilding a specific index in a tableDBCC DBREINDEX ('FactInternetSales', AK_FactInternetSales_SalesOrderNumber_SalesOrderLineNumber);
--Rebuilding all indexes in a tableDBCC DBREINDEX ('FactInternetSales', '');
272 Tivoli Management Services Warehouse and Reporting
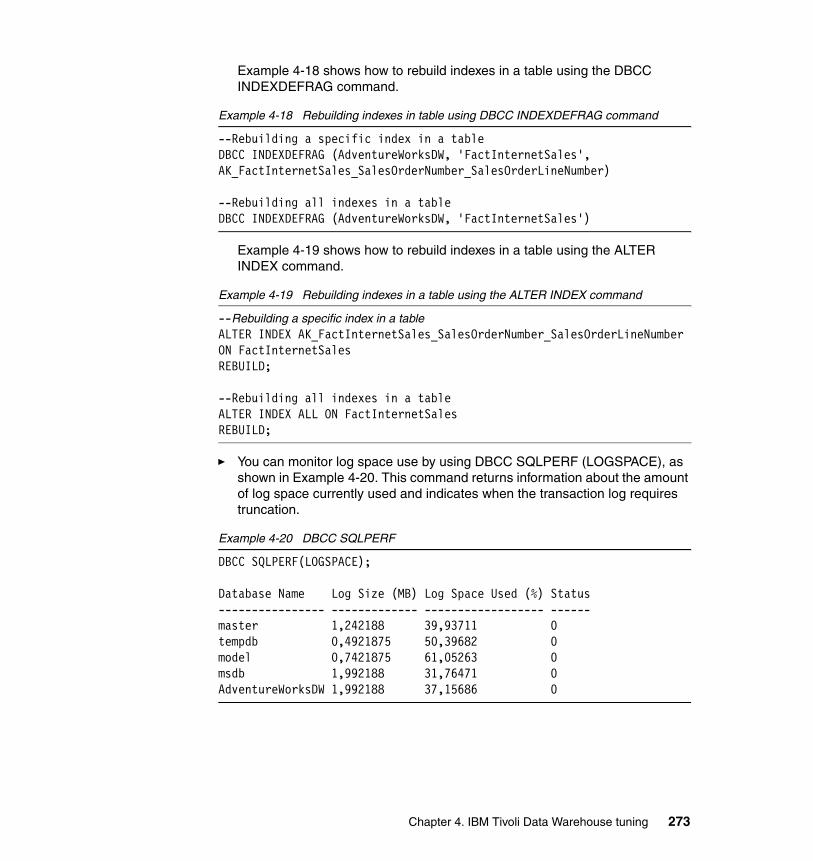
Example 4-18 shows how to rebuild indexes in a table using the DBCC INDEXDEFRAG command.
Example 4-18 Rebuilding indexes in table using DBCC INDEXDEFRAG command
--Rebuilding a specific index in a tableDBCC INDEXDEFRAG (AdventureWorksDW, 'FactInternetSales', AK_FactInternetSales_SalesOrderNumber_SalesOrderLineNumber)
--Rebuilding all indexes in a tableDBCC INDEXDEFRAG (AdventureWorksDW, 'FactInternetSales')
Example 4-19 shows how to rebuild indexes in a table using the ALTER INDEX command.
Example 4-19 Rebuilding indexes in a table using the ALTER INDEX command
--Rebuilding a specific index in a tableALTER INDEX AK_FactInternetSales_SalesOrderNumber_SalesOrderLineNumber ON FactInternetSalesREBUILD;
--Rebuilding all indexes in a tableALTER INDEX ALL ON FactInternetSales REBUILD;
� You can monitor log space use by using DBCC SQLPERF (LOGSPACE), as shown in Example 4-20. This command returns information about the amount of log space currently used and indicates when the transaction log requires truncation.
Example 4-20 DBCC SQLPERF
DBCC SQLPERF(LOGSPACE);
Database Name Log Size (MB) Log Space Used (%) Status---------------- ------------- ------------------ ------master 1,242188 39,93711 0 tempdb 0,4921875 50,39682 0 model 0,7421875 61,05263 0 msdb 1,992188 31,76471 0 AdventureWorksDW 1,992188 37,15686 0
Chapter 4. IBM Tivoli Data Warehouse tuning 273

Monitoring toolsYou can use IBM Tivoli Monitoring for SQL Server agent to monitor database through IBM Tivoli Monitoring. For sample scenarios, refer to Deployment Guide Series: IBM Tivoli Monitoring Express Version 6.1, SG24-7217.
SQL Server also provides several tools that you can use for monitoring or analyzing your database. The choice of the tool depends on the type of monitoring or tuning to be done and the particular events to be monitored. The following points discuss monitoring and analyzing tools and their purposes:
� SQLCMD: The SQLCMD tool is an operating system command-line based query tool. You can use it to connect to a server, run a command, and receive the output on the current command window. You can also run a script from a file, send the results to a file, and even use variables with it. To see all the options, drop to a command-line in the operating system where the tool is installed and type SQLCMD /?.
� SQL Server Profiler: This tool tracks engine process events. You can use it to monitor server and database activity. It can work as kind of SQL Sniffer, because it can read the information going to and from an SQL Server Database Engine or Analysis Services server. It functions similarly to the tool by the same name in SQL Server 2000. However, in this version you can include Windows Performance Monitor objects and counters so that you can observe platform information along with the SQL Server activity to correlate the two. When you use this feature, you can determine what T-SQL statement is running when the processor or memory load is high. You can also keep track of information such as the start of a batch or a transaction and deadlocks, fatal errors, or login activity.
� System Monitor: System Monitor primarily tracks resource usage, such as the number of buffer manager page requests in use enabling you to monitor server performance and activity using predefined objects and counters or user-defined counters to monitor events. System Monitor (Performance Monitor in Microsoft Windows NT 4.0) collects counts and rates rather than data about the events (for example, memory usage, number of active transactions, number of blocked locks, or CPU activity). You can set thresholds on specific counters to generate alerts that notify operators. System Monitor works on Microsoft Windows Server and Windows operating systems. It can monitor (remotely or locally) an instance of SQL Server on Windows NT 4.0 or later. The key difference between SQL Server Profiler and System Monitor is that SQL Server Profiler monitors Database Engine events, but System Monitor monitors resource usage associated with server processes.
274 Tivoli Management Services Warehouse and Reporting

� SQL Server Management Studio: The Activity Monitor in SQL Server Management Studio graphically displays information about:
– Processes running on an instance of SQL Server– Blocked processes– Locks– User activity
This is useful for ad hoc views of current activity.
� SQL Trace: Transact-SQL stored procedures that create, filter, and define tracing:
– sp_trace_create (Transact-SQL)– sp_trace_generateevent (Transact-SQL)– sp_trace_setevent (Transact-SQL)– sp_trace_setfilter (Transact-SQL)– sp_trace_setstatus (Transact-SQL)
� Error Logs: The Windows application event log provides an overall picture of events occurring on the Windows Server and Windows operating systems as a whole, and events in SQL Server, SQL Server Agent, and full-text search. It contains information about events in SQL Server that is not available elsewhere. You can use the information in the error log to troubleshoot SQL Server related problems.
� Database Engine Stored Procedures: The following SQL Server system stored procedures provide a powerful alternative for many monitoring tasks:
– sp_who: This reports snapshot information about current SQL Server users and processes, including the currently executing statement and whether the statement is blocked.
– sp_lock: This reports snapshot information about locks, including the object ID, index ID, type of lock, and type or resource to which the lock applies.
– sp_spaceused: This displays an estimate of the current amount of disk space used by a table (or a whole database).
– sp_monitor: This displays statistics, including CPU usage, I/O usage, and the amount of time idle since sp_monitor was last run.
� DBCC: Database Console Command (DBCC) statements enable you to check performance statistics and the logical and physical consistency of a database.
Chapter 4. IBM Tivoli Data Warehouse tuning 275

� Functions: Built-in functions display snapshot statistics about SQL Server activity since the server was started. These statistics are stored in predefined SQL Server counters. For example:
– @@CPU_BUSY contains the amount of time the CPU has been running SQL Server code
– @@CONNECTIONS contains the number of SQL Server connections or attempted connections
– @@PACKET_ERRORS contains the number of network packets occurring on SQL Server connections
� Trace Flags: Trace flags display information about a specific activity within the server and are used to diagnose problems or performance issues (for example, deadlock chains).
� Database Engine Tuning Advisor: Database Engine Tuning Advisor analyzes the performance effects of Transact-SQL statements run against databases that you want to tune. It provides recommendations to add, remove, or modify indexes, indexed views, and partitioning.
You can monitor activity for index performance issues with a tool called the Index Tuning Wizard. In SQL Server 2005, this capability is enhanced with the Database Tuning Advisor. Available as a tool of its own or from within SQL Server Management Studio, this tool can tune not only indexes but also the physical layout. The process is to start the tool when a set of operations are run on the server. This process is usually done on a testing server, but one similar in size and capability to the production server. After the activity completes, the Database Tuning Advisor makes suggestions on everything from table arrangements to filegroup and index layouts, based on the settings that you choose.
Database Engine Tuning Advisor is a tool that analyzes the performance effects of workloads run against one or more databases. A workload is a set of Transact-SQL statements that runs against databases that you want to tune. After analyzing the effects of a workload on your databases, Database Engine Tuning Advisor provides recommendations to add, remove, or modify physical design structures in Microsoft SQL Server databases. These physical performance structures include clustered indexes, nonclustered indexes, indexed views, and partitioning. When implemented, Database Engine Tuning Advisor recommendations enable the query processor to perform workload tasks in the shortest amount of time.
276 Tivoli Management Services Warehouse and Reporting

4.7 SQL tuning
In a majority of the cases, probably the single most important factor for performance with databases when doing reports or extracting data from them is how efficiently your SQL statements are written.
4.7.1 Review application SQL for efficiencies
There is no magic formula, method, or technique for tuning SQL queries. We provide some recommendations, based on our past experiences.
This topic mainly deals with SQL search criteria, which can be present in SELECT, UPDATE, DELETE, or INSERT (through a subselect) statements. Reviewing SQL queries serves the following purposes:
� It provides the database designers with the necessary information they require to determine the proper indexes that must be created on your database tables. These statements are essential for the designer to be able to create the optimal indexes to support your database access. All of the considerations mentioned previously regarding indexes must be considered.
� It allows an independent review of the SQL for the purpose of using efficient SQL coding techniques.
� It determines if locking strategies are appropriate.
� It assesses the impact of changes in your data model or data content.
� It assess the impact of the application of service to the database manager.
4.7.2 General SQL review process
Keep in mind that this is not a magic SQL review process, and is not by any means the only and absolute review process. You can use this as a basis for your own review process, or modify it to meet your needs and expectations. To review the SQL, you can use the following process or workflow shown in Figure 4-1.
Recommendation: Implement a formal SQL review process for your applications or use the one suggested in this book, which is referred to in the following section.
Chapter 4. IBM Tivoli Data Warehouse tuning 277

Figure 4-1 General SQL review process
3
5
6
7
8
10
4
1311 12
9
No
Yes
Yes
Yes
No
No
1
2
1 - Identify the SQL query.2 - Gather business information about it.3 - Does the SQL query only do what was planned to do.4 - Exclude all data not necessary for the required5 - Rerun the query6 - Is it still performing badly?7 - Close out8 - Get the access plan for it.9 - Get the data model.10 - Analysis of the access plan11 - Rewrite the query or change the DB design.12 - Is the performance OK?13 - Closeout
278 Tivoli Management Services Warehouse and Reporting

1. Identify the SQL query that performs badly.
We have to determine the SQL queries that have to be worked on. If you are developing your application today, you probably already know what SQL queries run faster or slower, therefore finding which queries have to be tuned is not a problem at all. However, if you do not know which query is performing badly or you cannot access the application’s source code, you can still determine which query has to be tuned. You just require a tool that traces all the SQLs running in your database at that moment.
For example, you might require the Activity Monitor tool or the GET SNAPSHOT command shown in Example 4-21.
Example 4-21 GET SNAPSHOT command
% db2 reset monitor all% db2 get snapshot for dynamic sql on bank% db2 get snapshot for dynamic sql on bank > snap1.txt% grep -i 'Total execution' snap1.txt
2. Gather all the business information about it.
Before performing any analysis on the queries that you found, you must gather all the information you can about them, such as what are they used for, what information is necessary, and so on.
3. Exclude all data that is not necessary for the business requirement.
Remove all information that is not required for your business goal, for example, any column not required from the SELECT clause. This decreases, for example, I/O, and network usage.
4. Re-run the query.
Re-run the query to determine if it is still performing badly.
5. Get the access plan for it.
At this stage, you know what the database is accessing and why, but you do not know how the database is accessing it. For that, you require an access plan, which can be provided by the Visual Explain tool or through the db2exfmt tool, or you can have access to the information created by the Explain tool using simple plain SQL queries against the Explain’s tables.
Chapter 4. IBM Tivoli Data Warehouse tuning 279

We provide two examples of outputs (Figure 4-2 and Example 4-22) that you can use to check the access plan generated by the RDBMS.
Figure 4-2 Access plan shown through Visual Explain tool
Example 4-22 Access plan extracted from the output generated by db2exfmt tool
Access Plan:-----------
Total Cost: 19,7333Query Degree:1
Rows
280 Tivoli Management Services Warehouse and Reporting

RETURN ( 1) Cost I/O | 3,08 TBSCAN ( 2) 19,7333 1,53314 | 3,08 SORT ( 3) 19,7328 1,53314 | 3,08 FETCH ( 4) 19,7315 1,53314 /----+---\ 3,08 77 IXSCAN TABLE: DENISV ( 5) EMPLOYEE 0,0232886 0 | 77 INDEX: DENISV IX_JOB
6. Get the data model of the database or databases involved in the SQL query.
The access plan shows you how the database is accessing the data through tables’ scans, indexes’ scans, and so on. But the information is worthless if you do not know what it is about. The reason behind getting the data model of the database you are accessing is to understand it better, and have a clear view of what and how it is accessing.
If you do not have a data model, you can do a reverse engineering by using tools such as IBM Rational Data Architect or AllFusion ERwin Data Modeler so that you can obtain one. But if your company does not have the licenses and does not want to buy them, you have to obtain this information by using the DB2 catalog tables (Data Dictionary).
Chapter 4. IBM Tivoli Data Warehouse tuning 281

7. Analyze the access plan.
Now that you have the access plan, either in graphic format or text format, you can study it and try to find the most CPU and I/O consuming operations, such as tablescan. Use this study as your basis when comparing the access plan, the SQL statement, and both the non-technical and technical information that you have gathered about the SQL statement.
When performing your access plan analysis the operators listed in Table 4-4 might be shown in it.
Table 4-4 Operators that might be displayed in the access plan graph
Tip: It is important to have the statistics of your database up-to-date, otherwise the query optimizer will not work as required, choosing a non-optimal access plan.
Operator Brief description
DELETE Deletes rows from a table
EISCAN Scans a user-defined index to produce a reduced stream of rows
FETCH Fetches columns from a table using a specific record identifier
FILTER Filters data by applying one or more predicates to it
GRPBY Groups rows by common values of designated columns or functions, and evaluates set functions
HSJOIN Represents a hash join, where two or more tables are hashed on the join columns
INSERT Inserts rows into a table
IXAND ANDs together the row identifiers (RIDs) from two or more index scans
IXSCAN Scans an index of a table with optional start/stop conditions, producing an ordered stream of rows
MSJOIN Represents a merge join, where both outer and inner tables must be in join-predicate order
NLJOIN Represents a nested loop join that accesses an inner table once for each row of the outer table
RETURN Represents the return of data from the query to the user
RIDSCN Scans a list of RIDs obtained from one or more indexes
282 Tivoli Management Services Warehouse and Reporting

We describe the operators in Table 4-4 in more detail:
– DELETE
This operator represents a necessary operation. To improve access plan costs, concentrate on other operators, such as scans and joins, which define the set of rows to be deleted.
Performance suggestion: If you are deleting all rows from a table, consider using the DROP TABLE statement or the LOAD REPLACE command in DB2, or if you are using Oracle or SQL Server, use the TRUNCATE command instead.
– EISCAN
This operator scans a user-defined index to produce a reduced stream of rows. The scanning uses the multiple start/stop conditions from the user-supplied range producer function. This operation is performed to narrow down the set of qualifying rows before accessing the base table (based on predicates).
RPD An operator for remote plans; It is very similar to the SHIP operator in Version 8 (RQUERY operator in previous versions), except that it does not contain an SQL statement.
SHIP Retrieves data from a remote database source; used in the federated system
SORT Sorts rows in the order of specified columns, and optionally eliminates duplicate entries
TBSCAN Retrieves rows by reading all required data directly from the data pages
TEMP Stores data in a temporary table to be read back out (possibly multiple times)
TQUEUE Transfers table data between database agents
UNION Concatenates streams of rows from multiple tables
UNIQUE Eliminates rows with duplicate values, for specified columns
UPDATE Updates rows in a table
Operator Brief description
Chapter 4. IBM Tivoli Data Warehouse tuning 283
Performance suggestions:
• Over time, database updates might cause an index to become fragmented, resulting in more index pages than necessary. This can be corrected by dropping and recreating the index, or reorganizing the index.
• If statistics are not current, update them using the runstats command.
– FETCH
This operator represents the fetching of columns from a table using a specific RID.
Performance suggestions:
• Expand index keys to include the fetched columns so that the data pages do not have to be accessed.
• Find the index related to the fetch and double-click its node to display its statistics window. Ensure that the degree of clustering is high for the index.
• Increase the buffer size if the I/O incurred by the fetch is greater than the number of pages in the table.
• If statistics are not current, update them using the runstats command.
The quantile and frequent value statistics provide information about the selectivity of predicates, which determines when index scans are chosen over table scans. To update these statistics, use the runstats command on a table with the WITH DISTRIBUTION clause.
– FILTER
This operator represents the application of residual predicates so that data is filtered based on the criteria supplied by the predicates.
Performance suggestions:
• Ensure that you have used predicates that retrieve only the data you require. For example, ensure that the selectivity value for the predicates represents the portion of the table that you want returned.
• Ensure that the optimization class is at least 3 so that the optimizer uses a join instead of a subquery. If this is not possible, try rewriting the SQL query by hand to eliminate the subquery.
– GRPBY
This operator is the grouping of rows according to common values of designated columns or functions. This operation is required to produce a group of values or to evaluate set functions.
284 Tivoli Management Services Warehouse and Reporting

If no GROUP BY columns are specified, the GRPBY operator can still be used if there are aggregation functions in the SELECT list, indicating that the entire table is treated as a single group when doing that aggregation.
Performance suggestions:
• This operator represents a necessary operation. To improve access plan costs, concentrate on other operators (such as scans and joins), which define the set of rows to be grouped.
• To improve the performance of a SELECT statement that contains a single aggregate function but no GROUP BY clause, try the following methods:
- For a MIN(C) aggregate function, create an ascending index on C. - For a MAX(C) aggregate function, create a descending index on C.
– HSJOIN
This operator is a hash join for which the qualified rows from tables are hashed to allow direct joining, without pre-ordering the content of the tables.
A join is necessary whenever there is more than one table referenced in a FROM clause. A hash join is possible whenever there is a join predicate that equates columns from two different tables. The join predicates have to be exactly the same data type. Hash joins might also arise from a rewritten subquery, as is the case with NLJOIN.
A hash join does not require that the input tables be ordered. The join is performed by scanning the inner table of the hash join and generating a lookup table by hashing the join column values. It then reads the outer table, hashing the join column values, and checking in the lookup table generated for the inner table.
Performance suggestions:
• Use local predicates (that is, predicates that reference one table) to reduce the number of rows to be joined.
• Increase the size of the sort heap to make it large enough to hold the hash lookup table in memory.
• If statistics are not current, update them using the runstats command.
– INSERT
This operator represents a necessary operation. To improve access plan costs, concentrate on other operators (such as scans and joins), which define the set of rows to be inserted.
Chapter 4. IBM Tivoli Data Warehouse tuning 285

– IXAND
This operator represents the ANDing of the results of multiple index scans using Dynamic Bitmap techniques. The operator allows ANDed predicates to be applied to multiple indexes, to reduce underlying table accesses to a minimum.
This operator is performed to:
• Narrow down the set of rows before accessing the base table • AND together predicates applied to multiple indexes• AND together the results of semi-joins, used in star joins
Performance suggestions:
• Over time, database updates might cause an index to become fragmented, resulting in more index pages than necessary. This can be corrected by dropping and recreating the index, or reorganizing the index.
• If statistics are not current, update them using the runstats command.
• In general, index scans are most effective when only a few rows qualify. To estimate the number of qualifying rows, the optimizer uses the statistics that are available for the columns referenced in predicates. If some values occur more frequently than others, it is important to request distribution statistics by using the WITH DISTRIBUTION clause for the runstats command. By using the non-uniform distribution statistics, the optimizer can distinguish among frequently and infrequently occurring values.
• IXAND can best exploit single column indexes, because start and stop keys are critical in the use of IXAND.
• For star joins, create single-column indexes for each of the most selective columns in the fact table and the related dimension tables.
– IXSCAN
This operator represents the scanning of an index to produce a reduced stream of rows. The scanning can use optional start/stop conditions, or it can apply to indexable predicates that reference columns of the index.
This operation is performed to narrow down the set of qualifying rows before accessing the base table (based on predicates).
Performance suggestions:
• Over time, database updates might cause an index to become fragmented, resulting in more index pages than necessary. This can be corrected by dropping and recreating the index, or reorganizing the index.
286 Tivoli Management Services Warehouse and Reporting

• When two or more tables are being accessed, access to the inner table using an index can be made more efficient by providing an index on the join column of the outer table.
• If statistics are not current, update them using the runstats command.
• In general, index scans are most effective when only a few rows qualify. To estimate the number of qualifying rows, the optimizer uses the statistics that are available for the columns referenced in predicates. If some values occur more frequently than others, it is important to request distribution statistics by using the WITH DISTRIBUTION clause for the runstats command. By using the non-uniform distribution statistics, the optimizer can distinguish among frequently and infrequently occurring values.
– MSJOIN
This operator is a merge join for which the qualified rows from both outer and inner tables must be in join-predicate order. A merge join is also called a merge scan join or a sorted merge join.
A join is necessary whenever there is more than one table referenced in a FROM clause. A merge join is possible whenever there is a join predicate that equates columns from two different tables. It might also arise from a rewritten subquery.
A merge join requires ordered input on joining columns, because the tables are typically scanned only once. This ordered input is obtained by accessing an index or a sorted table.
Performance suggestions:
• Use local predicates (that is, predicates that reference one table) to reduce the number of rows to be joined.
• If statistics are not current, update them using the runstats command.
– NLJOIN
This operator is a nested loop join that scans (usually with an index scan) the inner table once for each row of the outer table.
A join is necessary whenever there is more than one table referenced in a FROM clause. A nested loop join does not require a join predicate, but generally performs better with one.
A nested loop join is performed either:
• By scanning through the inner table for each accessed row of the outer table
• By performing an index lookup on the inner table for each accessed row of the outer table
Chapter 4. IBM Tivoli Data Warehouse tuning 287

Performance suggestions:
• A nested loop join is likely to be more efficient if there is an index on the join-predicate columns of the inner table (the table displayed to the right of the NLJOIN operator). Check to see if the inner table is a TBSCAN rather than an IXSCAN. If it is, consider adding an index on its join columns.
• Another (less important) way to make the join more efficient is to create an index on the join columns of the outer table so that the outer table is ordered.
• If statistics are not current, update them using the runstats command.
– RETURN
This operator represents the return of data from a query to the user. This is the final operator in the access plan graph and shows the total accumulated values and costs for the access plan. This operator represents a necessary operation.
Performance suggestion: Ensure that you have used predicates that retrieve only the data you require. For example, ensure that the selectivity value for the predicates represents the portion of the table that you want returned.
– RIDSCN
This operator represents the scan of a list of RIDs that is obtained from one or more indexes. This operator is considered by the optimizer when:
• Predicates are connected by OR keywords, or there is an IN predicate; a technique called index ORing can be used, which combines results from multiple index accesses on the same table.
• It is beneficial to use list prefetch for a single index access, because sorting the row identifiers before accessing the base rows makes the I/O more efficient.
– RPD
This is an operator that is used in the federated system to retrieve data from a remote data source using a non-relational wrapper.
This operator is considered by the optimizer when it contains a remote plan that will not be inspected by the optimizer. An RPD operator sends a request to a remote non-relational data source to retrieve the query result. The request is generated by the non-relational wrapper using the API supported by the data source.
288 Tivoli Management Services Warehouse and Reporting

– SHIP
This operator is used in the federated system to retrieve data from a remote data source. It is considered by the optimizer when it contains a remote plan that is not inspected by the optimizer. A SHIP operator sends an SQL SELECT statement to a remote data source to retrieve the query result. The SELECT statement is generated using the SQL dialect supported by the data source, and it can contain any valid query as allowed by the data source.
– SORT
This operator represents the sorting of the rows in a table into the order of one or more of its columns, optionally eliminating duplicate entries.
Sorting is required when no index exists that satisfies the requested ordering, or when sorting is less expensive than an index scan. Sorting is usually performed as a final operation when the required rows are fetched, or to sort data before a join or a group by.
If the number of rows is high or if the sorted data cannot be piped, the operation requires the costly generation of temporary tables.
Performance suggestions:
• Consider adding an index on the sort columns.
• Ensure that you have used predicates that retrieve only the data you require. For example, ensure that the selectivity value for the predicates represents the portion of the table that you want returned.
• Check that the prefetch size of the system temporary table space is adequate, that is, it is not I/O bound. (To check this, select Statement → Show statistics → Table spaces.)
• If frequent large sorts are required, consider increasing the values of the following configuration parameters:
Sort heap size (sortheap): To change this parameter, right-click the database in the Control Center, and then select Configure from the pop-up menu. Select the Performance tab from the notebook that opens.
Sort heap threshold (sheapthres): To change this parameter, right-click the database instance in the Control Center, and then select Configure from the pop-up menu. Select the Performance tab from the notebook that opens.
• If statistics are not current, update them using the runstats command.
Chapter 4. IBM Tivoli Data Warehouse tuning 289

– TBSCAN
This operator is a table scan (relation scan) that retrieves rows by reading all the required data directly from the data pages.
This type of scan is chosen by the optimizer over an index scan when:
• The range of values scanned occurs frequently (that is, most of the table must be accessed)
• The table is small
• Index clustering is low
• An index does not exist
Performance suggestions:
• An index scan is more efficient than a table scan if the table is large, with most of the table's rows not being accessed. To increase the possibility that an index scan is used by the optimizer for this situation, consider adding indexes on columns for which there are selective predicates.
• If an index already exists but was not used, check that there are selective predicates on each of its leading columns. If these predicates do exist, check that the degree of clustering is high for the index. (To see this statistic, open the Table Statistics window for the table beneath the sort, and select the Indexes button to bring up the Index Statistics window.)
• Check that the prefetch size of the table space is adequate, that is, it is not I/O bound. (To check this, select Statement → Show statistics → Table spaces.)
• If the statistics are not current, update them using the runstats command.
The quantile and frequent value statistics provide information about the selectivity of predicates. For example, these statistics are used to determine when index scans are chosen over table scans. To update these values, use the runstats command on a table with the WITH DISTRIBUTION clause.
– TEMP
This operator represents the action of storing data in a temporary table, which is to be read back out by another operator (possibly multiple times). The table is removed after the SQL statement is processed, if not before.
This operator is required to evaluate subqueries or to store intermediate results. In some situations (such as when the statement can be updated), it might be mandatory.
290 Tivoli Management Services Warehouse and Reporting

– TQUEUE
This operator represents a table queue that is used to pass table data from one database agent to another when there are multiple database agents processing a query. Multiple database agents are used to process a query when parallelism is involved. Table queue types are:
• Local
The table queue is used to pass data between database agents within a single node. A local table queue is used for intrapartition parallelism.
• Non-local
The table queue is used to pass data between database agents on different nodes.
– UNION
This operator is the concatenation of streams of rows from multiple tables. It represents a necessary operation. To improve access plan costs, concentrate on other operators (such as scans and joins), which define the set of rows to be concatenated.
– UNIQUE
This operator represents the elimination of rows having duplicate values for specified columns.
Performance suggestion: This operator is not necessary if only a unique index exists on appropriate columns.
– UPDATE
This operator represents the updating of data in the rows of a table, and it is a necessary operation. To improve access plan costs, concentrate on other operators (such as scans and joins), which define the set of rows to be updated.
8. Rewrite the query or change the database design.
After you perform the analysis, you can first try to rewrite the query, using some of the tips provided in this book.
After you have made your changes, re-run the query to see how much improvement you get from your changes. If the elapse and CPU time is not as required, return to step 5 and continue in the loop until you reach your performance goal.
9. Close out.
This step finalizes all tuning activities on this SQL query and prepares the lessons learned for future reference.
Chapter 4. IBM Tivoli Data Warehouse tuning 291

SQL tuning scenarioWe received some requests from the users saying that the report XYZ01 is running slower than they wanted. Therefore, we requested information about what query the XYZ01 report is using, but the users did not know. Therefore, we had to get a snapshot from the queries running at the same moment as the report was running. To do this, we can run the DB2 GET SNAPSHOT command, or use the Active Monitor graphic tool.
In this case, we found that the query used on the XYZ01 report is the one shown in Example 4-23.
Example 4-23 Query used on the XYZ01 report i
select empno,lastname, firstnme,edlevel from employee where UPPER(job)='MANAGER'order by empno, lastname;
Now gather both technical and non-technical information about the report, the query, and the application itself. This includes the data model, or information extracted about table, and indexes on the tables used in the report, business requirements, and so on.
Attention: All the commands and tools used in this review process come from DB2. If you want to use this review process with other RDBMS, just look for what similar commands your target RDBMS has and use them.
292 Tivoli Management Services Warehouse and Reporting

After performing this, you can request the access plan through Visual Explain. In this case, you get the output shown in Figure 4-3.
Figure 4-3 Access plan showing that a tablescan was made
Figure 4-3 shows that the SQL query is doing a tablescan. However, if you do a research on the data model or the DB2 catalog tables, you find that an index is created for this example in the column JOB, similar to the following command:
create index IX_JOB on employee(JOB);
Therefore, why is the query optimizer not using the index that you created? Because when you use a scalar function in a column that has an index that was not created based on the same expression, DB2 has to retrieve each row, and then use the function before making the comparison.
At this moment, you have to know why the SQL query is using that specific scalar function. That is the real reason behind the need for grabbing business
Chapter 4. IBM Tivoli Data Warehouse tuning 293

information. Based on the business information and application’s requirement that you have, there is no need to use that scalar function because the application always insert the jobs in uppercase. Therefore, remove the scalar function from the query and request a new access plan. If your statistics are updated, you might see an output similar to the one shown in Figure 4-4.
Figure 4-4 Access plan showing that an index scan was made
In the output shown in Figure 4-4 the steps in the access plan are:
1. Index scan based on the Employee’s IX_JOB index, shown here by the IXSCAN node
2. Retrieving of the actual rows from the Employee table, shown here by the FETCH node
294 Tivoli Management Services Warehouse and Reporting

3. After retrieving of the rows, a sort is made as requested, shown here by the SORT node
4. A tablescan from the result set generated by the SORT, shown here by the TBSCAN node
5. The delivery of the rows requested, shown here by the RETURN node
Check if your performance goal is reached. If it is not, go back to the analysis. Go ahead and do some documentation as lessons learned, which can be used by the developers or others DBAs.
4.7.3 General SQL-ANSI tuning tips
In this section, we describe some SQL tips that you can use when tuning your SQL queries. We also provide some feedback in terms of numbers showing how much that can help.
� Fetch required columns only
When reading a record, all columns and column values are always moved into memory. If you have tables with a lot of columns and you only require information from a few, a lot of unnecessary information must be loaded. With SQL, you can select only the columns that you require to satisfy the data request. If you specify the required columns in your select statements, the optimizer might perform index only access.
There is additional CPU cost associated with each column that is selected or fetched from the database. Higher I/O cost might also be experienced, if sorting is required. By returning data that you do not require, you cause the database to perform I/O it does not have to perform, thereby wasting resources. In addition, it increases network traffic, which can also lead to reduced performance. If the table is very large, a table scan will lock the table during the time-consuming scan, preventing other users from accessing it, hurting concurrency.
Another negative aspect of a table scan is that it tends to flush out data pages from the cache with useless data. This reduces the ability to reuse useful data in the cache, which increases disk I/O and affects performance.
Tip: You can use all the tips provided in the following list as a basis for your tuning, but note that they might not be best choices for your problem. Every time you make a change to your SQL query, compare the latest access plan against the old one; this way you can be sure of which choices best fit your environment.
Chapter 4. IBM Tivoli Data Warehouse tuning 295

� Recommendations:
– Select or fetch only the columns that you require– Never code “SELECT *” to retrieve all columns in a table
In Example 4-24, you can see that the total the cost of using “SELECT * ”, instead of just the columns that you require, is higher. These numbers are obtained from the DB2 Explain tool, but you can use any tool available in your RDBMS.
Example 4-24 Using select * example
select * from employee e inner join department d on e.workdept = d.deptno inner join emp_act ea on ea.empno = e.empno inner join project p on p.projno = ea.projno where e.empno='000010';
Total cost: 51,5344
Example 4-25 shows a more efficient select example.
Example 4-25 A more efficient select example
select e.lastname, d.deptname, p.projname from employee e inner join department d on e.workdept = d.deptno inner join emp_act ea on ea.empno = e.empno inner join project p on p.projno = ea.projno where e.empno='000010';
Total cost: 38,6797
� UNION versus UNION ALL
When you use the UNION statement, keep in mind that, by default, it performs the equivalent of a SELECT DISTINCT on the final result set. In other words, UNION takes the results of two similar recordsets, combines them, and then performs a SELECT DISTINCT to eliminate any duplicate rows. This process occurs even if there are no duplicate records in the final recordset. If you know that there are duplicate records, and this presents a problem for your application, then use the UNION statement to eliminate the duplicate rows. However, if you know that there will never be any duplicate rows, or if there are, this does not present any problem to your application, then use the UNION ALL statement instead of the UNION statement. The advantage of the UNION ALL is that it does not perform the SELECT DISTINCT function, which saves a lot of unnecessary SQL Server resources from being used.
296 Tivoli Management Services Warehouse and Reporting

Example 4-26 shows a UNION ALL example.
Example 4-26 Using UNION ALL
select t.creator, t.name, t.type, c.name, c.coltype, c.length, c.scale from sysibm.systables as t INNER JOIN sysibm.syscolumns as C ON c.tbname = t.name and c.tbcreator = t.creator where creator='DENISV'UNION ALLselect t.creator, t.name, t.type, c.name, c.coltype, c.length, c.scale from sysibm.systables as t INNER JOIN sysibm.syscolumns as C ON c.tbname = t.name and c.tbcreator = t.creator where creator='SYSIBM';
Total cost: 161,776
Example 4-27 shows a UNION example.
Example 4-27 Using UNION
select t.creator, c.tbname, t.type, c.name, c.coltype, c.length, c.scale
from sysibm.systables as t INNER JOIN sysibm.syscolumns as C ON c.tbname = t.name and c.tbcreator = t.creator where creator='DENISV'UNIONselect t.creator, c.tbname, t.type,
c.name, c.coltype, c.length, c.scale from sysibm.systables as t INNER JOIN sysibm.syscolumns as C ON c.tbname = t.name and c.tbcreator = t.creator where creator='SYSIBM';
Total cost: 161,778
The individual costs are very close; however, the DB2 Query Optimizer changed the SQL by itself, as shown in Example 4-28.
Chapter 4. IBM Tivoli Data Warehouse tuning 297

Example 4-28 DB2 Query Optimizer changing the SQL
SELECT DISTINCT Q7.$C0 AS “CREATOR”, Q7.$C1 AS “NAME”, Q7.$C2 AS “TYPE”, Q7.$C3 AS “NAME”, Q7.$C4 AS “COLTYPE”, Q7.$C5 AS “LENGTH”, Q7.$C6 AS “SCALE” FROM (SELECT Q1.CREATOR, Q1.NAME, Q1.TYPE, Q2.NAME, Q2.COLTYPE, Q2.LENGTH, Q2.SCALE FROM SYSIBM.SYSTABLES AS Q1, SYSIBM.SYSCOLUMNS AS Q2 WHERE (Q2.TBNAME = Q1.NAME) AND (Q2.TBCREATOR = 'SYSIBM') AND (Q1.CREATOR = 'SYSIBM') UNION ALL SELECT Q4.CREATOR, Q4.NAME, Q4.TYPE, Q5.NAME, Q5.COLTYPE, Q5.LENGTH, Q5.SCALE FROM SYSIBM.SYSTABLES AS Q4, SYSIBM.SYSCOLUMNS AS Q5 WHERE (Q5.TBNAME = Q4.NAME) AND (Q5.TBCREATOR = 'DENISV') AND (Q4.CREATOR = 'DENISV') ) AS Q7
� DISTINCT
Carefully evaluate whether your SELECT query requires the DISTINCT clause. Some developers automatically add this clause to every one of their SELECT statements, even when it is not necessary. This practice must be stopped. Use the DISTINCT clause in SELECT statements only if you know that duplicate returned rows are a possibility, because having duplicate rows in the result set causes problems with your application. The DISTINCT clause creates extra work and reduces the physical resources that other SQL statements have at their disposal. Because of this, use the DISTINCT clause only if necessary.
Example 4-29 shows an example without the DISTINCT clause.
Example 4-29 Not using DISTINCT keyword
select e.lastname, d.deptname, p.projname from employee e inner join department d on e.workdept = d.deptno inner join emp_act ea on ea.empno = e.empno inner join project p on p.projno = ea.projno;
Total cost: 87,6521
Example 4-30 shows an example with the DISTINCT clause.
Example 4-30 Using DISTINCT keyword
select DISTINCT e.lastname, d.deptname, p.projname from employee e
298 Tivoli Management Services Warehouse and Reporting

inner join department d on e.workdept = d.deptno inner join emp_act ea on ea.empno = e.empno inner join project p on p.projno = ea.projno;
Total cost: 87,7049
� Operator and operands
In a WHERE clause, the various operators and operands that are used directly affect how fast a query is run. This is because some operators and operands lend themselves to speed over others. You might not be able to choose between them, but there are times when you can. Those operators and operands listed at the top of Table 4-5 produce results faster than those listed at the bottom.
Table 4-5 Operator and operands
� NOT IN versus NOT EXISTS
If you currently have a query that uses NOT IN, which offers poor performance, try to use NOT EXISTS instead, which offers better performance. It is a fairly common request to write an SQL query to compare two tables that have a logical relationship between them, but was not enforced, for example, during a load.
Example 4-31 and Example 4-32 show you how to do the same query in different ways.
Example 4-31 Using a NOT EXISTS
select e.lastname from employee e where NOT EXISTS (select 1 from emp_act a where a.empno = e.empno);
Operators Operands
= A single literal used by itself on one side of an operator
>, >=, <, <= A single column name used by itself on one side of an operator; a single parameter used by itself on one side of an operator
LIKE A multi-operand expression on one side of an operator
<>, != A single exact number on one side of an operator
Other numeric numbers (other than exact), dates, and times
Character data, NULLs
Chapter 4. IBM Tivoli Data Warehouse tuning 299

Total cost: 85,3155
Example 4-32 Using a NOT IN
select e.lastname from employee e where e.empno NOT IN (select a.empno from emp_act a);
Total cost: 137,335
When you have a choice between the IN or the EXISTS clause in your SQL, your preference must be the use of the EXISTS clause, as it is usually more efficient and performs faster when you want to compare the main SQL section with a big result set in the subquery. However, if the result set from the subquery is small, you can use IN, which performs better in many cases.
� IN versus BETWEEN
When you have a choice between the IN or the BETWEEN clauses in your SQL, your preference must be the use of the BETWEEN clause, because it is much more efficient if you have an index in the column that you are searching in. If not, the IN clause might be the best option. Therefore, every time you make a change, you want to know your environment through a data model or the information, you can get on the Catalog Tables, Data Dictionary, or System Tables, and check the access plan, to see if the change is an improvement. For examples, see Example 4-33 and Example 4-34.
Example 4-33 Using IN
select e.lastname from employee e where e.edlevel in (14,15,16);
Total cost(Index): 22,5895Total cost(No-Index): 25,7872
Example 4-34 Using BETWEEN
select e.lastname from employee e where e.edlevel BETWEEN 14 and 16;
Total cost(Index): 21,0947Total cost(No-Index): 25,802
Assuming there is a useful index on edlevel, the Query Optimizer can locate a range of numbers much faster (using BETWEEN) than it can find a series of
300 Tivoli Management Services Warehouse and Reporting

numbers using the IN clause (which is really just another form of the OR clause).
If your WHERE clause includes an IN operator along with a list of values to be tested in the query, order the list of values so that the most frequently found values are placed at the beginning of the list, and the less frequently found values are placed at the end of the list. This can increase the speed of the performance because the IN option returns true as soon as any of the values in the list produce a match. The sooner the match is made, the faster the query is completed.
� Scalar functions
If a scalar function is used in the WHERE clause, the RDBMS might not use an appropriate existing index. In some cases, you can avoid this problem by rewriting your query in a different manner. For example, if you want to select all the orders for a specific year or month, use a range and not the scalar functions YEAR or MONTH.
Example 4-35 shows a scalar function usage example.
Example 4-35 Using scalar function
select * from sales where YEAR(sales_date) = 2006;
Total cost: 12,9328
Example 4-36 shows an example where the scalar function is not used.
Example 4-36 Not using scalar function
select * from sales where sales_date between '2006-01-01' and '2006-12-31';
Total cost: 12,9328
The individual costs are equal; however, the DB2 Query Optimizer changed the first SQL by itself, as shown in Example 4-37.
Example 4-37 DB2 Query Optimizer changing the first SQL
SELECT Q1.SALES_DATE AS “SALES_DATE”, Q1.SALES_PERSON AS “SALES_PERSON”, Q1.REGION AS “REGION”, Q1.SALES AS “SALES” FROM DENISV.SALES AS Q1 WHERE ('1995-01-01' <= Q1.SALES_DATE)
Chapter 4. IBM Tivoli Data Warehouse tuning 301

AND (Q1.SALES_DATE < '1996-01-01');
� SUBSTRING functions
If possible, try to avoid using the SUBSTRING function in your WHERE clauses. Depending on how it is constructed, using the SUBSTRING function can force a table scan instead of allowing the optimizer to use an index (assuming there is one). If the substring you are searching for does not include the first character of the column you are searching for, then a table scan is performed.
If possible, avoid using the SUBSTRING function and use the LIKE condition instead for better performance. Instead of performing what is shown in Example 4-38, perform the actions shown in Example 4-39.
Example 4-38 Using the SUBSTRING function
select lastname, edlevel from employee where substr(lastname,1,1) = 'H';
Total Cost: 25,8085
Example 4-39 shows using the LIKE condition example.
Example 4-39 Using the LIKE condition
select lastname, edlevel from employee where lastname like 'H%';
Total Cost: 25,8013
If you decide to make this choice, keep in mind that you might want your LIKE condition to be sargable, that is, you must not place a wildcard in the first position.
� String concatenation
Where possible, avoid string concatenation in your SQL code, because it is not a fast process, contributing to overall slower performance of your application.
� If you have a WHERE clause that includes expressions connected by two or more AND operators, the RDBMS will evaluate them from left to right in the order that they are written. This assumes that no parenthesis has been used to change the order of execution. Because of this, you might want to consider one of the following tips when using AND:
– Locate the least feasible AND expression first. This way, if the AND expression is false, the clause will end immediately, saving time.
302 Tivoli Management Services Warehouse and Reporting

– If both parts of an AND expression are equally likely to be false, put the least complex AND expression first. This way, if it is false, less work is required to evaluate the expression.
� If you want to boost the performance of a query that includes an AND operator in the WHERE clause, consider:
– Of the search criterion in the WHERE clause, at least one of them must be based on a highly selective column that has an index.
– If at least one of the search criterion in the WHERE clause is not highly selective, consider adding indexes to all of the columns referenced in the WHERE clause.
– If none of the columns in the WHERE clause are selective enough to use an index on their own, consider creating a covering index for this query.
� The Query Optimizer performs a table scan or a clustered index scan on a table if the WHERE clause in the query contains an OR operator and if any of the referenced columns in the OR clause are not indexed (or does not have a useful index). Because of this, if you use many queries with OR clauses, you will want to ensure that each referenced column in the WHERE clause has a useful index.
� OR versus UNION ALL
A query with one or more OR clauses can sometimes be rewritten as a series of queries that are combined with a UNION ALL statement, to boost the performance of the query. If you have a query that uses ORs and does not make the best use of indexes, consider rewriting it as a UNION ALL, and then test the performance. Only through testing can you be sure that one version of your query is faster than another.
� Sorting
Do not use ORDER BY in your SELECT statements unless you really have to, because it adds an extra overhead. For example, it might be more efficient to sort the data at the client than at the server. In other cases, it can be that the client does not require sorted data to achieve its goal. The key here is to remember that you must not automatically sort data unless you know it is necessary. Whenever the RDBMS has to perform a sorting operation, additional resources have to be used to perform this task. Sorting often occurs when any of the following SQL statements are issued:
Important: The tips mentioned previously can be suitable to Oracle with the rule-based optimizer, but are not suitable to Oracle running the cost-based optimizer. In this last case, Oracle evaluates from right to left. Keep this in mind when tuning your SQL queries in Oracle.
Chapter 4. IBM Tivoli Data Warehouse tuning 303

– ORDER BY– GROUP BY– SELECT DISTINCT– UNION– CREATE INDEX (generally not as critical because this happens less often)
In many cases, these commands cannot be avoided. However, there are a few ways to reduce sorting overhead. These include:
– Keep the number of rows to be sorted to a minimum. Do this by only returning those rows that absolutely have to be sorted.
– Keep the number of columns to be sorted to the minimum. In other words, do not sort more columns than required.
– Keep the width (physical size) of the columns to be sorted to a minimum.
– Sort column with number data types instead of character data types.
If you have to sort by a particular column often, consider making that column a clustered index. This is because the data is already presorted for you and the RDBMS is smart enough not to resort the data.
Example 4-40 shows sorting based on two columns.
Example 4-40 Sorting based on two columns
select empno,lastname, firstnme,edlevel from employeeorder by empno, lastname;
Total cost: 25,8074
Example 4-41 shows sorting based on one column.
Example 4-41 Sorting based on one column
select empno,lastname, firstnme,edlevel from employeeorder by empno;
Total cost: 25,7962
Example 4-42 shows a no sorting example.
Example 4-42 No sorting
select empno,lastname, firstnme,edlevel from employee;
304 Tivoli Management Services Warehouse and Reporting

Total cost: 25,774
� If your SELECT statement contains a HAVING clause, write your query so that the WHERE clause does most of the work (removing the unnecessary rows) instead of the HAVING clause doing the work of removing unnecessary rows. Using the WHERE clause appropriately can eliminate unnecessary rows before they get to the GROUP BY and HAVING clause, because this saves unnecessary work and boosts performance. This happens because of the way that the RDBMS does its job. First, the WHERE clause is used to select the appropriate rows that have to be grouped. Next, the GROUP BY clause divides the rows into sets of grouped rows, and then aggregates their values. And lastly, the HAVING clause eliminates unnecessary aggregated groups. If the WHERE clause is used to eliminate as many of the unnecessary rows as possible, this means the GROUP BY and the HAVING clauses will have less work to do, and this boosts the overall performance of the query.
Example 4-43 and Example 4-44 show select examples.
Example 4-43 Select example
select sex,edlevel,count(*) as QTY from employeewhere edlevel IN (14,18,20)group by sex,edlevel;
Total cost: 25,791
Example 4-44 Select example
select sex,edlevel,count(*) as QTY from employeegroup by sex,edlevelhaving edlevel IN (14,18,20);
Total cost: 25,791
However, the DB2 Optimizer changed the query, as shown in Example 4-45.
Example 4-45 DB2 Optimizer changed the query
SELECT Q3.$C1 AS “SEX”, Q3.$C0 AS “EDLEVEL”, Q3.$C2 AS “QTY” FROM (SELECT Q2.$C1, Q2.$C0, COUNT(* ) FROM (SELECT Q1.SEX, Q1.EDLEVEL FROM DENISV.EMPLOYEE AS Q1
Chapter 4. IBM Tivoli Data Warehouse tuning 305

WHERE Q1.EDLEVEL IN (14, 18, 20)) AS Q2 GROUP BY Q2.$C1, Q2.$C0) AS Q3
Therefore, as shown in Example 4-45, the optimizer decided by itself that filtering the data before performing the GROUP BY saves some resources.
� Subquery blocks
Minimize the number of table lookups (subquery blocks) in queries, particularly if your statements include subquery SELECTs or multicolumn UPDATEs.
Example 4-46 shows separate subqueries example.
Example 4-46 Separate subqueries
select lastname, job,edlevel, salary from employee where comm in (select max(comm) from employee) and salary in (select max(salary) from employee);
Total cost: 77,3774
Example 4-47 shows combined subqueries example.
Example 4-47 Combined subqueries
select lastname, job,edlevel, salary from employee where (comm,salary) IN (select max(comm),max(salary) from employee);
Total cost: 51,5801
Example 4-48 shows an example of combined subqueries using inline view technique.
Example 4-48 Combined subqueries using inline view technique
select lastname, job,edlevel, salary from employee as e inner join (select max(comm) c, MAX(SALARY) s from employee) as aux on aux.c = e.comm and aux.s = e.salary;
Total cost: 51,5801
306 Tivoli Management Services Warehouse and Reporting

4.7.4 Database-specific tuning
Each database manager might have some tuning that can be done, just for a particular RDBMS. This section covers tuning for three RDBMS that are supported.
DB2In this section, we discuss the other actions that you can do when performing SQL statements against a DB2 database.
Concurrency control and isolation levelAn isolation level determines how data is locked or isolated from other processes while the data is being accessed. The isolation level is in effect for the duration of the unit of work. DB2 supports the following isolation levels, listed in the order of most restrictive to least restrictive:
� Repeatable Read
This isolation level locks all the rows in an application that are referenced within a transaction. When a program uses repeatable read protection, rows referenced by the program cannot be changed by other programs until the program ends the current transaction.
� Read Stability
This isolation level locks only the rows that an application retrieves within a transaction. Read stability ensures that any qualifying row that is read during a transaction is not changed by other application processes until the transaction is completed, and that any row changed by another application process is not read until the change is committed by that process.
� Cursor Stability
This isolation level locks any row accessed by a transaction of an application while the cursor is positioned on the row. The lock remains in effect until the next row is fetched or the transaction is terminated. If any data is changed in a row, the lock is held until the change is committed to the database.
� Uncommitted Read
This isolation level allows an application to access uncommitted changes of other transactions. The application does not lock other applications out of the row that it is reading, unless the other application attempts to drop or alter the table. This is sometimes referred to as dirty reads.
RecommendationsConsider the following recommendations:
Chapter 4. IBM Tivoli Data Warehouse tuning 307

� Make sure that you know the isolation level under which you are running. Do not count on default values, which can change based on how you access the database.
� Because the isolation level determines how data is locked and isolated from other processes while the data is being accessed, you must select an isolation level that balances the requirements of concurrency and data integrity for your particular application. The isolation level that you specify is in effect for the duration of the unit of work.
LockingTo provide concurrency control and prevent uncontrolled data access, the database manager places locks on tables, table blocks, or table rows. A lock associates a database manager resource with an application, called the lock owner, to control how other applications can access the same resource. Locking is a fundamental process of any database manager and is used to ensure the integrity of the data. However, when maintaining these locks, there is a potential impact on the concurrency and throughput of your application.
The database manager uses a number of factors to determine whether to use row level or table level locking:
� The different isolation levels described previously are used to control access to uncommitted data, prevent lost updates, allow nonrepeatable reads of data, and prevent phantom reads. Use the minimum isolation level that satisfies your application requirements.
� The access plan selected by the optimizer: Table scans, index scans, and other methods of data access each require different types of access to the data.
� The LOCKSIZE attribute for the table: This parameter indicates the granularity of the locks used when the table is accessed. The choices are either ROW for row locks or TABLE for table locks.
� The amount of memory devoted to locking: The amount of memory devoted to locking is controlled by the locklist database configuration parameter.
RecommendationsConsider the following recommendations:
� COMMIT as frequently as possible or whenever it is practical to do so, to release any locks that your application holds. If possible, design your application so that you can easily vary the commit frequency for large batch operations. This allows you to optimally balance the throughput and concurrency of your system.
� Use ALTER TABLE... LOCKSIZE TABLE for read-only tables. This reduces the number of locks required by database activity.
308 Tivoli Management Services Warehouse and Reporting

� If the lock list fills, performance can degrade due to lock escalations and reduced concurrency on shared objects in the database. If lock escalations occur frequently, increase the value of locklist, maxlocks, or both.
Query tuningThe following SQL statement clauses might improve the performance of your application:
� Use the FOR UPDATE clause to specify the columns that can be updated by a subsequent positioned UPDATE statement.
� Use the FOR READ/FETCH ONLY clause to make the returned columns read only.
� Use the OPTIMIZE FOR n ROWS clause to give priority to retrieve the first n rows in the full result set.
� Use the FETCH FIRST n ROWS ONLY clause to retrieve only a specified number of rows.
� Use the DECLARE CURSOR WITH HOLD statement to retrieve rows one at a time and maintain cursor position after a commit.
Take advantage of row blocking by specifying the FOR READ ONLY, FOR FETCH ONLY, OPTIMIZE FOR n ROWS clause, or if you declare your cursor as SCROLLing. This improves performance and, in addition, improves concurrency because exclusive locks are never held on the rows retrieved.
OracleIn this section, we discuss the other actions that you can do when performing SQL statements against an Oracle database.
Concurrency control and isolation levelAn isolation level determines how data is locked or isolated from other processes while the data is being accessed. The isolation level is in effect for the duration of the unit of work. Oracle supports the following isolation levels:
� Read committed
This isolation level allows an application to only access committed changes made to the data before the query began. If the query is run twice it might bring changed and committed data, because Oracle does not stop other transactions from changing the data that your query is reading, and you can experience both nonrepeatable read and phantoms. But at all times, you can only read committed data. This option is the Oracle default.
� Read-only
Chapter 4. IBM Tivoli Data Warehouse tuning 309
This isolation level allows an application to see only those changes that are already committed at the time the transaction began, but does not allow the current transaction to do any INSERT, UPDATE, and DELETE statements (other transactions or applications might still update data, but not the READ ONLY transaction).
� Serializable
This isolation level allows an application to see only those changes that are already committed at the time the transaction began, plus those changes made by the transaction itself through INSERT, UPDATE, and DELETE statements.
RecommendationsConsider the following recommendations:
� Make sure that you know the isolation level under which you are running. Do not count on default values, which can change based on how you access the database.
� Because the isolation level determines how data is locked and isolated from other processes while the data is being accessed, you must select an isolation level that balances the requirements of concurrency and data integrity for your particular application. The isolation level that you specify is in effect for the duration of the unit of work.
LockingTo provide concurrency control and prevent uncontrolled data access, the database manager places locks on tables, table blocks, or table rows. A lock associates a database manager resource with an application, called the lock owner, to control how other applications can access the same resource. Locking is a fundamental process of any database manager and is used to ensure the integrity of the data. But while maintaining these locks, there is a potential impact on the concurrency and throughput of your application.
There are a number of factors that the database manager uses to determine whether to use row level or table level locking:
� The different isolation levels described previously are used to control access to uncommitted data, prevent lost updates, allow nonrepeatable reads of data, and prevent phantom reads. Use the minimum isolation level that satisfies your application requirements.
� The access plan selected by the optimizer: Table scans, index scans, and other methods of data access each require different types of access to the data.
� The amount of memory devoted to locking: The amount of memory devoted to locking is controlled by the locklist database configuration parameter.
310 Tivoli Management Services Warehouse and Reporting

RecommendationsConsider the following recommendations:
� COMMIT as frequently as possible or whenever it is practical to do so, to release any locks that your application holds. If possible, design your application so that you can easily vary the commit frequency for large batch operations. This allows you to optimally balance the throughput and concurrency of your system.
� To reduce the number of locks required by database activity on any table that does not change, you can choose to put them on a specific table space, and then mark the table space as read-only, as shown in Example 4-49.
Example 4-49 Changing a table space to read only
ALTER TABLESPACE <tablespace_name> READ ONLY;
Query tuningThe following SQL statement clause might improve the performance of your application.
� If you want to delete all the rows from a table, you can use the TRUNCATE statement. The difference between the DELETE FROM and the TRUNCATE commands is that TRUNCATE does not do any logging at all and any DELETE triggers on that table are not fired.
� Use the FOR UPDATE clause to specify the columns that can be updated by a subsequent positioned UPDATE statement, as shown in Example 4-50.
Example 4-50 SELECT FOR UPDATE
SELECT cols FROM tables [WHERE...] FOR UPDATE [OF columns] [NOWAIT];
SQL ServerIn this section, we discuss other actions that you can do when performing SQL statements against an SQL Server database.
Concurrency control and isolation levelAn isolation level determines how data is locked or isolated from other processes while the data is being accessed. The isolation level is in effect for the duration of the unit of work. SQL Server supports the following isolation levels:
� Read uncommitted
This isolation level allows an application to access uncommitted changes made by other transactions. This is also known as dirty reads. The application does not lock other applications out of the row that it is reading, unless the other application attempts to drop or alter the table.
Chapter 4. IBM Tivoli Data Warehouse tuning 311

� Read committed
This isolation level allows an application to only access committed changes made to the data before the query began. If the query is run twice, it might bring changed and committed data, because the SQL Server does not stop other transactions from changing the data your query is reading, and you can experience both nonrepeatable read and phantoms. But at all times, you can only read committed data. This option is the SQL Server default.
� Repeatable read
This isolation level locks only the rows that an application retrieves within a transaction. Read stability ensures that any qualifying row that is read during a transaction is not changed by other application processes until the transaction is completed, and that any row changed by another application process is not read until the change is committed by that process.
� Snapshot
This isolation level allows an application to see only those changes that are already committed at the time the transaction began, plus those changes made by the transaction itself through INSERT, UPDATE, and DELETE statements.
� Serializable
This isolation level allows an application to see only those changes that are already committed at the time the transaction began, plus those changes made by the transaction itself through INSERT, UPDATE, and DELETE statements. This prevents other transactions not only from modifying data that is being read by your current transaction until your active transaction is completed, but also inserts new rows with key values that are in the range of keys that is read by your active transaction.
RecommendationsConsider the following recommendations:
� Make sure you that know the isolation level under which you are running. Do not count on default values, which can change based on how you access the database.
� Because the isolation level determines how data is locked and isolated from other processes while the data is being accessed, you must select an isolation level that balances the requirements of concurrency and data integrity for your particular application. The isolation level that you specify is in effect for the duration of the unit of work.
312 Tivoli Management Services Warehouse and Reporting

LockingTo provide concurrency control and prevent uncontrolled data access, the database manager places locks on tables, table blocks, or table rows. A lock associates a database manager resource with an application, called the lock owner, to control how other applications can access the same resource. Locking is a fundamental process of any database manager and is used to ensure the integrity of the data. But while maintaining these locks, there is a potential impact on the concurrency and throughput of your application.
The database manager uses a number of factors to determine whether to use row level or table level locking:
� The different isolation levels described previously are used to control access to uncommitted data, prevent lost updates, allow nonrepeatable reads of data, and prevent phantom reads. Use the minimum isolation level that satisfies your application requirements.
� The access plan selected by the optimizer: Table scans, index scans, and other methods of data access each require different types of access to the data.
� The amount of memory devoted to locking: The amount of memory devoted to locking is controlled by the locklist database configuration parameter.
RecommendationsConsider the following recommendations:
� COMMIT as frequently as possible or whenever it is practical to do so, to release any locks your application holds. If possible, design your application so that you can easily vary the commit frequency for large batch operations. This allows you to optimally balance the throughput and concurrency of your system.
� To reduce the number of locks required by database activity on any table that do not change, you can choose to put them on a specific filegroup, and then mark the filegroup as read-only, as shown in Example 4-51.
Example 4-51 Changing a filegroup to read-only
ALTER DATABASE AdventureWorksDWMODIFY FILEGROUP filegroup1 READ_ONLY;
Chapter 4. IBM Tivoli Data Warehouse tuning 313

Query tuningThe following SQL statement clause might improve the performance of your application.
� If you want to delete all rows from a table, you can use the TRUNCATE statement. The difference between the DELETE FROM and the TRUNCATE commands is that the TRUNCATE does not do any logging at all and any DELETE triggers on that table are not fired.
� Use the TOP clause to retrieve only a specified number of rows, or a percentage of them, as shown in Example 4-52.
Example 4-52 Select example
select TOP(10) PERCENT * from prospectivebuyer;
314 Tivoli Management Services Warehouse and Reporting

Chapter 5. Integrating data from external or third-party applications into Tivoli Data Warehouse
This chapter provides information about how to integrate data provided by custom or third-party data sources into the Tivoli Data Warehouse Version 2.1. It also introduces some ways of presenting information from third-party warehouses and auxiliary data sources through the Tivoli Enterprise Portal (TEP).
This chapter discusses the following topics:
� “The Tivoli Monitoring V6.1 Universal Agent” on page 316
� “Warehousing Data using IBM Tivoli Monitoring 6.1 Universal Agent (script provider)” on page 327
� “Warehousing data using IBM Tivoli Monitoring 6.1 Universal Agent (ODBC provider)” on page 348
� “Tivoli Storage Manager Universal Agent in the Tivoli Enterprise Portal” on page 371
� “Viewing data in Tivoli Enterprise Portal Server using an external ODBC data source” on page 379
5
© Copyright IBM Corp. 2007. All rights reserved. 315

5.1 The Tivoli Monitoring V6.1 Universal Agent
The Tivoli Monitoring V6.1 Universal Agent is a generic agent used to collect data from systems and applications in your network. In turn, this data can be stored in the Tivoli Data Warehouse and can also be summarized and aggregated using the Warehouse Proxy and Summarization and Pruning agent functionality. This data can also be used and visualized in the Tivoli Enterprise Portal. You can use all standard TEP data viewing options with the Universal Agent.
It is important to understand the difference between standard Tivoli Enterprise Monitoring Agents and IBM Tivoli Universal Agent, because these two types of agents complement each other to provide a robust and completely flexible monitoring solution. Tivoli Enterprise Monitoring Agents use a static set of hard-coded attributes (in other words, predefined data), therefore they cannot be enhanced by the field personnel to see more than they are developed for. Using the Universal Agent, you can dynamically create custom attributes and catalogs. It adds to monitoring solutions to make them complete and flexible for all platforms.
Most applications and systems have additional information that can be discovered by looking through the log files or using custom programs to query them. By combining this information with the power of the Tivoli Data Warehouse, we can generate management information to provide trending or capacity reports, which can benefit owners and users of certain application or system types.
The benefits of using the Universal Agent include:
� Monitors only the data attributes that interest you (configured through metafileapplications)
� Enables you to respond quickly to changing monitoring and management scenarios; for example, changes in the metafile can be easily made to support new features in an application.
� Monitors data not supported by other Tivoli Enterprise Monitoring Agents
� Integrates data from virtually any operating system and any source
� Gives you control of attributes and surfacing of data
� Provides a means of agentless monitoring
316 Tivoli Management Services Warehouse and Reporting
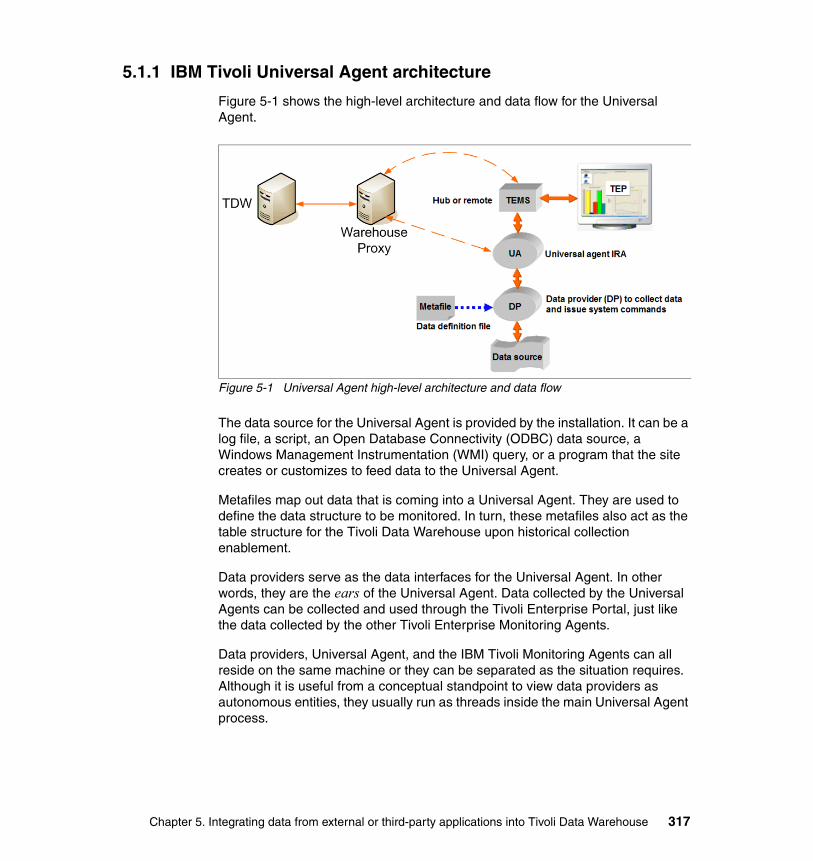
5.1.1 IBM Tivoli Universal Agent architecture
Figure 5-1 shows the high-level architecture and data flow for the Universal Agent.
Figure 5-1 Universal Agent high-level architecture and data flow
The data source for the Universal Agent is provided by the installation. It can be a log file, a script, an Open Database Connectivity (ODBC) data source, a Windows Management Instrumentation (WMI) query, or a program that the site creates or customizes to feed data to the Universal Agent.
Metafiles map out data that is coming into a Universal Agent. They are used to define the data structure to be monitored. In turn, these metafiles also act as the table structure for the Tivoli Data Warehouse upon historical collection enablement.
Data providers serve as the data interfaces for the Universal Agent. In other words, they are the ears of the Universal Agent. Data collected by the Universal Agents can be collected and used through the Tivoli Enterprise Portal, just like the data collected by the other Tivoli Enterprise Monitoring Agents.
Data providers, Universal Agent, and the IBM Tivoli Monitoring Agents can all reside on the same machine or they can be separated as the situation requires. Although it is useful from a conceptual standpoint to view data providers as autonomous entities, they usually run as threads inside the main Universal Agent process.
Chapter 5. Integrating data from external or third-party applications into Tivoli Data Warehouse 317

It is possible to run more than one Universal Agent on a host, but it is generally not necessary, because one Universal Agent can monitor data from multiple Simple Network Management Protocol (SNMP) agents, ODBC data sources, application programming interface (API) clients, scripts, and socket clients.
5.1.2 Data providers: Informing IBM Tivoli Universal Agent how to collect and monitor
Data is collected from the monitoring environment and passed to IBM Tivoli Universal Agent through structures named data providers. Data providers work as IBM Tivoli Universal Agent threads, using applications named metafiles to define the structures to be monitored. Data providers can be analyzed as IBM Tivoli Universal Agent autonomous entities. They are used to define how data is collected from systems and hosts.
Data providers enable the following activities:
� Validate and load metafile applications
� Collect data from different sources, such as logs, URLs, and SNMP agents
� Pass collected data and information about metafile definitions to IBM Tivoli Universal Agent
We can choose from nine data provider categories depending on our monitoring requirements. These are: API Server, API-Socket-File-Script (ASFS), File, HTTP, ODBC, Post, Script, SNMP, and Socket. Table 5-1 lists the data providers that are available with the Tivoli Universal Agent.
Table 5-1 IBM Tivoli Universal Agent data providers
Type Description
API Server Enables you to collect data from resources on remote machines where the IBM Tivoli Universal Agent API client software is supported
API, Socket, File, Script (ASFS)
Consolidates four types of data providers into one package, which is started as a single thread to save resource usage; this is the default data provider when you install the IBM Tivoli Universal Agent.
File Monitors sequential files, such as system or message logs; provides the most direct, simplest method of collecting data
HTTP Enables monitoring of Internet URLs for availability and response time; you can specify URLs to monitor in a startup configuration file or within Tivoli Enterprise Portal situations.
ODBC Enables data collection from ODBC-compliant databases using SQL Select statements and stored procedures; only available on Windows
318 Tivoli Management Services Warehouse and Reporting

The right choice of a data provider depends on the type of data that you want to monitor and the source of the data. For example, if the operational system is z/OS, it might not be possible to use an API data provider. In this case, using a socket data provider is a better choice. Table 5-2 lists the data source and related data providers.
Table 5-2 Data source and preferred data providers
Post TCP/IP socket application with predefined data; enables you to send ad hoc notifications such as messages, alerts, and status
Script Enables data collection from any script or program that sends results to standard output
SNMP Provides the functionality of an SNMP manager, including network discovery, trap monitoring, and Management Information Base (MIB) data collection
Socket Listens on a TCP/IP socket for data sent using program-to-program communication; enables you to collect data from remote devices or machines for which no IBM Tivoli Universal Agent API support is available
Type Description
Data source Preferred data providers
Log files File
Ad hoc notifications such as messages, alerts, and status information
Post
Application internals (supported API client operating system)
API Server
Application internals (non-supported API client operating system) using TCP/IP
Socket
Any combination of the following log files:� Application internals (supported API client operating
system)� Application internals (non-supported API client
operating system)� Stdout messages produced by a script or program
API, Socket, File, Script (ASFS)
Internet or intranet URLs HTTP
Relational databases ODBC
SNMP MIB data SNMP
Stdout messages produced by a script or program Script
Chapter 5. Integrating data from external or third-party applications into Tivoli Data Warehouse 319

The Universal Agent has the ability to run several instances of the same data provider on the same monitored host. The reasons for this can be:
� Run test and production versions of the Universal Agent on the same host
� Balance the data load of an IBM Tivoli Universal Agent that is overloaded
� Connect to several IBM Tivoli Universal Agents on different Tivoli Enterprise Monitoring Servers
Universal Agent and its data providers are configured to communicate over a variety of ports. Every port is changeable in the KUMENV file specifying the correct variable. Table 5-3 lists the typical Universal Agent ports.
Table 5-3 Typical ports used by the IBM Tivoli Universal Agent
By default, console commands target the primary Universal Agent using the console port 7700. We can change this port to access a secondary Universal Agent using the KUMP_DPCONSOLE_PORT variable to specify the alternate port number.
Note: ASFS is the default data provider setting in the Universal Agent. It consolidates four types of data providers (API, Socket, File, and Script) into one package, which is started as a single thread to save resource usages. This is the default data provider when you install the IBM Tivoli Universal Agent.
Port Description Variable
161 Standard SNMP port (used when running SNMP Universal Agent)
-
1919 Data Clearing House port KUMA_DCH_PORT
7500 Socket data provider listening port KUMP_DP_PORT
7575 Post data provider listening port KUMP_POST_DP_PORT
7600 API data provider listening port KUMP_API_DPAPI_PORT
7700-7710 Console ports (one for each DP activated at startup)
-
162 SNMP trap monitoring listening port KUMP_SNMP_TRAP_PORT
320 Tivoli Management Services Warehouse and Reporting

5.1.3 Metafiles: Informing Universal Agent what to collect and monitor
With applications called metafiles, we define the data structure to be monitored. In other words, metadata is a data map that specifies data characteristics based on application knowledge and monitoring requirements. It splits the input data into fields called attributes, which can be viewed or warehoused into the Tivoli Data Warehouse.
Using metafiles, the Universal Agent knows what to monitor on the systems and hosts. After a metafile is defined, it is imported into the Universal Agent and used by data providers that relay collected data to the Universal Agent. This data is finally used by Tivoli Enterprise Monitoring Server and the Tivoli Data Warehouse similar to data collected by specific IBM Tivoli Monitoring Agents.
Building a metafile application consists basically of defining the following items:
� Name of the application� Name of each application attribute group� Source or data sources in each group� Names and characteristics of each attribute item� Optional application help text, attribute group, and attributes
A metafile has the control statements (if present), which are listed in Table 5-4.
Table 5-4 Metafile control statement
Note: You can have many metafiles: One for each separate data source and type.
Control statement Description
SNMP (For SNMP data providers only) Introduces the data definition for IBM Tivoli Monitoring provided SNMP MIB applications; SNMP TEXT introduces the data definition for user-defined SNMP applications
APPL Specifies the name that IBM Tivoli Monitoring uses for the application
NAME Defines the name of an attribute group, the type of data being collected, and the period for which the data is valid
INTERNAL Provides for data redirection between attribute groups as a way to perform additional processing
SOURCE Defines the location of the data you are collecting
RECORDSET (For file data providers only) Defines the set of records from which the data provider extracts data
Chapter 5. Integrating data from external or third-party applications into Tivoli Data Warehouse 321

Example 5-1 shows a sample of a metafile that maps out log files. Each log file is identified as a separate managed system. “TAIL” tells the Universal Agent that you are going to read records from the end of the file as they are written.
Example 5-1 Metafile example
//appl MVS//name SYSTEM E//source file D:\UA_LOGS\PRA1.log TAIL ManagedSystemName=PRA1//source file D:\UA_LOGS\PRB1.log TAIL ManagedSystemName=PRB1//source file D:\UA_LOGS\PRC1.log TAIL ManagedSystemName=PRC1//source file D:\UA_LOGS\PRE1.log TAIL ManagedSystemName=PRE1//source file D:\UA_LOGS\PRF1.log TAIL ManagedSystemName=PRF1//source file D:\UA_LOGS\PRG1.log TAIL ManagedSystemName=PRG1//source file D:\UA_LOGS\PRX1.log TAIL ManagedSystemName=PRX1//source file D:\UA_LOGS\PRZ1.log TAIL ManagedSystemName=PRZ1//attributes ';'System D 10Application D 10Date D 10Time D 10Message D 256Threshold D 10AutoAction D 20
CONFIRM (For socket data providers only) Specifies the requirements for data acknowledgment
SQL (For ODBC data providers only) Defines the select statement or stored procedure to use for collecting relational data.
SUMMARY Defines the requirements for gathering the frequency of data input during monitoring
ATTRIBUTES Introduces the attribute definitions and specifies the attribute delimiters in the data string; below the ATTRIBUTES control statement, list the individual attribute definition statements
Control statement Description
322 Tivoli Management Services Warehouse and Reporting

Another point to take into account is the versioning of metafiles. Versioning enables you to identify the level of metafiles and run different versions of metafiles in different systems (for example, to monitor data for a new application version that the old one does not have).
Metafile has both version and modification number. When it is imported for the first time in the IBM Tivoli Universal Agent, it is assigned a version number 0 and a modification number 0. When changes are made in the metafile and it is refreshed on the IBM Tivoli Universal Agent, the version or modification number is incremented by one, depending on the type of the modification.
Changes that do not affect the number of version or modification of the metafile include:
� TTL value� A change to the SOURCE statement � Data type from P, S, or K to any of P, S, or K � Delimiter specified in the ATTRIBUTE statement � A change to the RECORDSET statement � A change to the CONFIRM statement � A change to an attribute FILTER parameters � A change to the SQL statement
The following changes affect the modification number (minor changes):
� Adding a new attribute to the end of the attribute list for an attribute group � Adding a new attribute group at the end of the metafile
Note: If you want to enable the metafile application for Summarization and Pruning agent, you have to use the WHEN parameter with the //APPL statement. The syntax is: //APPL <applname> [WHEN{<value>}]
If the WHEN parameter is omitted, the Summarization and Pruning agent does not process data for this application when the data is placed in the warehouse. The <value> parameter inside the {} brackets is a one-character tag to indicate the warehouse enablement option, specifically, the minimum level of data summarization found in the application source data. The valid values are:
� R Raw or sub-hourly� H Hourly � D Daily� W Weekly� M Monthly� Q Quarterly� Y Yearly
Chapter 5. Integrating data from external or third-party applications into Tivoli Data Warehouse 323
� Adding, removing, or changing help text � Atomizing an existing attribute � Adding, removing, or changing Scale or Precision values � Adding, removing, or changing Caption values � Adding, removing, or changing Warehouse or Aggregation parameters � Adding, removing, or changing HistoricalTimestamp or PrimaryKey options
The following changes increment the version number (major changes):
� Renaming or deleting an existing attribute
� Changing the type of an attribute
� Changing the length of an attribute
� Changing the name of an attribute group
� Adding a new attribute anywhere other than the end of a list of existing attributes
� Changing the order of attributes
� Changing a data type from E to P, S, or K
� Changing a data type from P, S, or K to E
� Adding a new attribute group anywhere other than the end of a metafile
5.1.4 Manipulating data with Tivoli Enterprise PortalThe data that is collected and monitored by the Universal Agent is used in the same way as the data collected by IBM Tivoli Monitoring agents in the Tivoli Enterprise Portal.
Tivoli Enterprise Portal objects are named managed systems and the name of each managed system identifies the collected data source, the application that is monitored, and the metafile version. Tivoli Enterprise Portal can configure workspaces to visualize collected data by the Universal Agent. Each attribute group defined in a metafile has its own workspace. It can also be customized to show only wanted data.
The attribute groups DPLOG and ACTION from each data provider are used for the Universal Agent self-monitoring, more specifically data providers. The DPLOG attribute shows the status from a data provider, and the ACTION attribute gives information about the execution of a situation and policies. Figure 5-2 shows the attribute group DPLOG in Tivoli Enterprise Portal.
324 Tivoli Management Services Warehouse and Reporting

Figure 5-2 Attribute group DPLOG in Tivoli Enterprise Portal
In the Tivoli Enterprise Portal, we visualize the data that is collected and stored by the Universal Agent with the historical data collection functionality.
The historical data collection enables you to:
� Specify the attribute group or groups for which data is collected
� Specify the interval at which data is collected
� Specify the interval at which data is warehoused (if warehouse is being used)
� Determine the source where collected data is stored, in the agent or Tivoli Enterprise Monitoring Server
Basically, Tivoli Enterprise Portal enables you to:
� Visualize stored data or data in real time
� Define situations with defined thresholds for potential availability or performance problems
Chapter 5. Integrating data from external or third-party applications into Tivoli Data Warehouse 325

� Define automatic responses for events and levels of alerts from monitored systems
� Self-monitoring of data providers
5.1.5 Use cases for the Universal AgentThe Universal Agent is a good choice, for example, when systems and applications cannot be monitored by existing monitoring solutions, when you want control over monitored data, when the solution requires automation, and when the application to be monitored frequently changes (new applications or operational systems releases).
Consider the following tips before the Universal Agent deployment:
� Choose the right data provider for your application monitoring. For example, you can use the ODBC data provider if you want to monitor a relational database, file data provider if you want to monitor log files from an application, and so on.
� Prepare the data source.
� Define an application (metafile) to be used by the data provider that satisfies the monitoring requirements.
� Enable historical collection for the created data source and version.
Some real-world Universal Agent usage examples are:
� Monitoring MQ Series Client Channels� Monitoring DEC OpenVMS� Integrating Cabletron Spectrum� Monitoring remote RF devices� Monitoring POS devices� Monitoring proprietary applications
5.1.6 Universal Agent deployment steps
Deploying a Universal Agent solution consists of the following steps:
1. Collect all the required information about the solution.
2. Select the data provider and start the Universal Agent with selected data providers.
3. Create the metafiles describing the Universal Agent application.
4. Load the metafile and send the data.
5. Use standard IBM Tivoli Monitoring features to finalize the solution.
326 Tivoli Management Services Warehouse and Reporting

The first step is especially important. Here are some questions that might help you determine to collect all the required information about the solution:
� Who needs the information?� What information is needed?� Where is the data located?� When and how often is the data collected?� Why is it required? Does it make good business sense to collect it?� How? What methodology will be used to collect the data?� What is the data used for after it is integrated?
After obtaining all of this information, determine the correct data provider type to use. This decision is based on the information that you collected in the first step.
5.2 Warehousing Data using IBM Tivoli Monitoring 6.1 Universal Agent (script provider)
In this section, we provide a practical example of how to configure the Tivoli Monitoring 6.1 Universal Agent. In doing so, we describe how data can be warehoused to the Tivoli Data Warehouse and viewed using the Tivoli Enterprise Portal client.
5.2.1 Configuring the Tivoli Universal Agent
The example we explore is a Universal Agent that is used to gather data disk metrics from an AIX system. To configure this agent, perform the following steps:
1. Install and configure Universal Agent. This is covered in detail in IBM Tivoli Monitoring Installation and Setup Guide, GC32-9407, and IBM Tivoli Monitoring Universal Agent User's Guide, SC32-9459. In our lab environment, we installed the agent on the AIX system (belfast). We installed the agent under (/opt/IBM/ITM/).
2. After you install the agent, create the mdl file for the agent. Create this file and place it in the (/opt/IBM/ITM/bin) directory. An example of the mdl file that we used is shown Example 5-2.
Example 5-2 AIX disk metric .mdl example
/ITM61/bin/disk.mdl//APPL DiskData//Name DiskUsageStats S 1440 AddTimeStamp//Source script /usr/bin/sh /ITM61/bin/disk.sh Interval=60//AttributesHostName (GetEnvValue = HOSTNAME)
Chapter 5. Integrating data from external or third-party applications into Tivoli Data Warehouse 327

Script (GetEnvValue = PROBE)FileSystem D 120BlockSize C 2147483647SpaceAvailable C 2147483647Perc_Used C 2147483647Inodes_Used C 2147483647Perc_Inodes_Used C 2147483647MountPoint D 120
3. Create a script that provides the required information to the Universal Agent. In our case, it was a simple shell script that was created under /opt/IBM/ITM/bin and was referenced in the .mdl example shown in Example 5-2. An example of the script that we used is shown in Example 5-3.
Example 5-3 AIX disk metrics query disk.sh script example
/usr/bin/df -k |grep -v Filesystem
4. After you create the .mdl file and data provider, register the .mdl file with the Universal Agent so that it knows the format of the data it will be receiving and the script that is used to provide this data. To do this, run the commands shown in Example 5-4.
Example 5-4 Commands used to import .mdl file on UNIX and Linux
export CANDLEHOME=/ITM61cd $CANDLEHOME/bin
./um_consoleKUMPS002I Enter console command <Application name or Metafile name or file name>import /ITM61/bin/disk.mdlKUMPS001I Console input accepted.KUMPS020I Import successfully completed for /ITM61/bin/disk.mdl
5. After you complete this, press Enter to exit.
6. Restart the Universal Agent.
328 Tivoli Management Services Warehouse and Reporting

5.2.2 Viewing the data in the Tivoli Enterprise Portal
To view the data that is being collected by the newly configured Universal Agent, perform the following steps:
1. Log on to either your TEP desktop client or your TEP Web client.
2. After you log on, you notice that a new agent, which you can view by selecting Enterprise → UNIX Systems → Hostname → Universal Agent. This is shown in Figure 5-3.
Figure 5-3 AIX disk Universal Agent in the TEP
Chapter 5. Integrating data from external or third-party applications into Tivoli Data Warehouse 329

3. When you click this Universal Agent, it shows all the data that is being collected by the script, running under the Universal Agent. See Figure 5-4.
Figure 5-4 DISKDATA data view in TEP
330 Tivoli Management Services Warehouse and Reporting
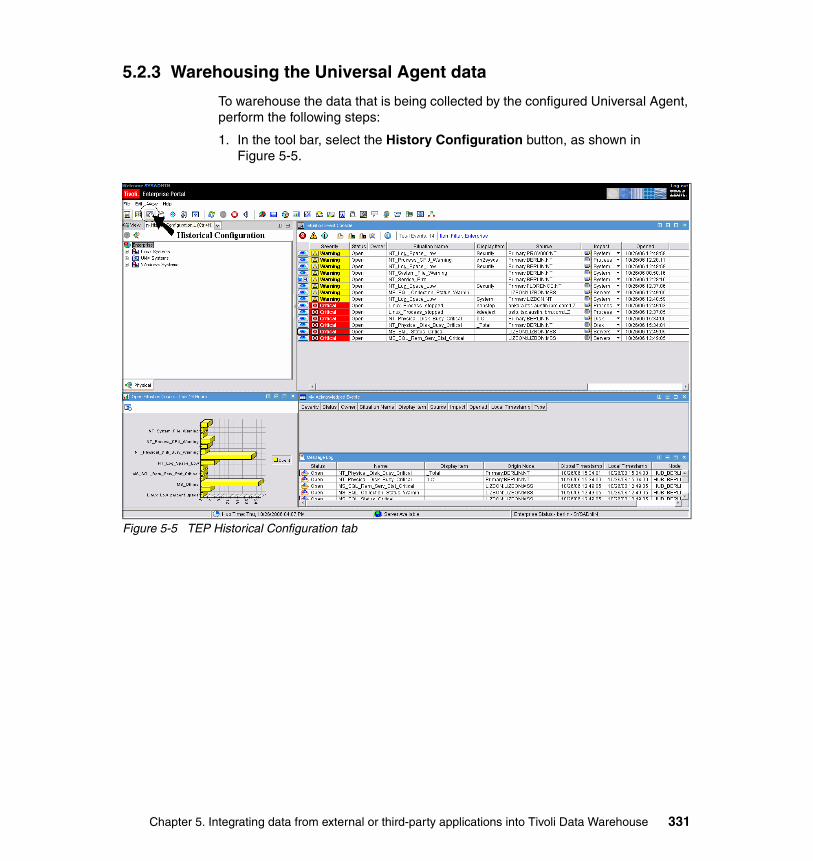
5.2.3 Warehousing the Universal Agent data
To warehouse the data that is being collected by the configured Universal Agent, perform the following steps:
1. In the tool bar, select the History Configuration button, as shown in Figure 5-5.
Figure 5-5 TEP Historical Configuration tab
Chapter 5. Integrating data from external or third-party applications into Tivoli Data Warehouse 331
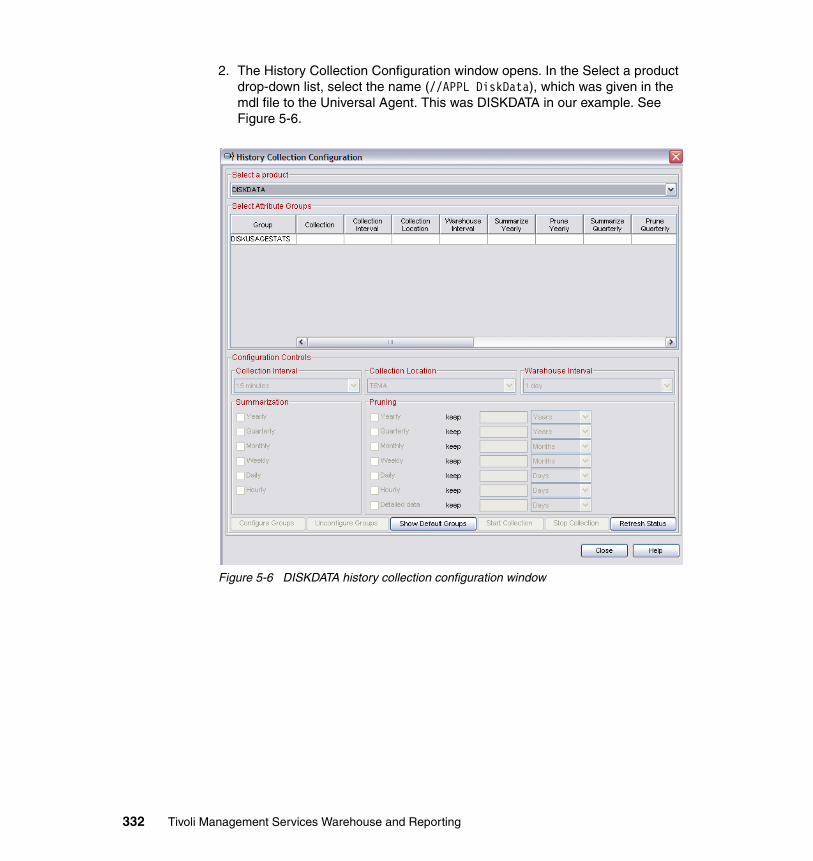
2. The History Collection Configuration window opens. In the Select a product drop-down list, select the name (//APPL DiskData), which was given in the mdl file to the Universal Agent. This was DISKDATA in our example. See Figure 5-6.
Figure 5-6 DISKDATA history collection configuration window
332 Tivoli Management Services Warehouse and Reporting

3. In the Select Attribute Groups list, click the group name. This enables the Configuration Controls options. You can specify the Collection Interval. Four options are available. The data for metrics presented under the DiskUsageStats attribute group can be collected every 5, 15, 30 or every 60 minutes, as shown in Figure 5-7.
Figure 5-7 DISKDATA collection interval configuration window
Chapter 5. Integrating data from external or third-party applications into Tivoli Data Warehouse 333

4. You can select the collection location. Two options are available. Historical data can be collected at either the Tivoli Enterprise Monitoring Agent (agent) or at the Tivoli Enterprise Monitoring Server (management server, hub or remote). We recommend that you specify to collect data at the Tivoli Enterprise Monitoring Agent location, as shown in Figure 5-8.
Figure 5-8 DISKDATA collection location configuration window
334 Tivoli Management Services Warehouse and Reporting

5. Select the warehouse interval. Two options are available. Historical data can be uploaded to Warehouse using the Warehouse Proxy agent ever hour or every 24 hours, as shown in Figure 5-9.
Figure 5-9 DISKDATA warehouse interval configuration window
Chapter 5. Integrating data from external or third-party applications into Tivoli Data Warehouse 335

6. After you select all the options under the configuration controls, select the Configure Groups button to save these changes. You see the saved options in the updated panel, as shown in Figure 5-10. You can see that the options are set to collect data every 5 minutes, which will be stored at the Tivoli Enterprise Monitoring Agent and written to the warehouse every hour.
Figure 5-10 DISKDATA configuration window
7. To start the data collection, click the Start Collection button to enable historical collection for the DiskUsageStats Attribute Group.
Note: Configuring the collection options for an attribute group does not start collection for that attribute group. You have to start the collection manually. We describe how to do this in more detail in the following steps.
336 Tivoli Management Services Warehouse and Reporting

The Collection field in the Select Attribute Groups section shows the status of the agent as Started, as shown in Figure 5-11. That is, the agent has started collection.
Figure 5-11 DISKDATA started status in configuration window
Chapter 5. Integrating data from external or third-party applications into Tivoli Data Warehouse 337

The history collection has now started. You can confirm this by checking the Universal Agents view, which shows a date/time icon, as shown in Figure 5-12.
Figure 5-12 TEP DISKDATA date/time icon
338 Tivoli Management Services Warehouse and Reporting

5.2.4 Creating graphical views for historical data
After you configure the historical data collection, you can create different views from this data, such as a bar chart. Figure 5-13 shows an example of a customized view.
Figure 5-13 Customized TEP workspaces example
To create a graphical view from table data format, perform the following steps:
1. From the list of icons in the menu, select Bar Chart, drag the icon, and drop it on the table view, as shown in Figure 5-14.
Chapter 5. Integrating data from external or third-party applications into Tivoli Data Warehouse 339

Figure 5-14 Bar chart selection icon
2. The Select attribute window opens. In the Attribute item field, select Perc Used metric and click OK, as shown in Figure 5-15.
Figure 5-15 Bar chart attribute selection window
340 Tivoli Management Services Warehouse and Reporting

3. A view with the bar charts opens with the Perc Used data, as shown in Figure 5-16. You can customize this view. To do this, right-click the view and select Properties.
Figure 5-16 Bar chart data view
Chapter 5. Integrating data from external or third-party applications into Tivoli Data Warehouse 341

A window opens, as shown in Figure 5-17.
Figure 5-17 Bar chart properties customization window
342 Tivoli Management Services Warehouse and Reporting
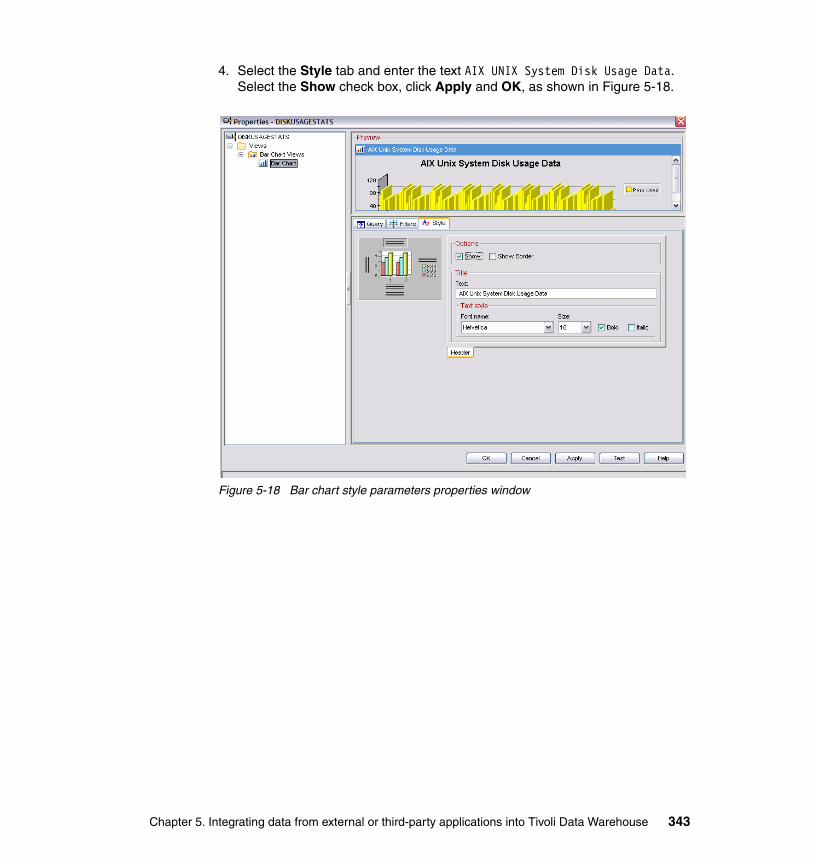
4. Select the Style tab and enter the text AIX UNIX System Disk Usage Data. Select the Show check box, click Apply and OK, as shown in Figure 5-18.
Figure 5-18 Bar chart style parameters properties window
Chapter 5. Integrating data from external or third-party applications into Tivoli Data Warehouse 343

5. The bar chart view opens showing the text that you entered, as shown in Figure 5-19. To view the historical data, click the Date/Time icon.
Figure 5-19 Stylized bar chart workspace
344 Tivoli Management Services Warehouse and Reporting

6. The Select the Time Span window opens. Select the Last option, and specify 2 to show data for the last two days, as shown in Figure 5-20. This makes a direct query in the warehouse database and gets the requested data.
Figure 5-20 Historical time span view configuration window
Chapter 5. Integrating data from external or third-party applications into Tivoli Data Warehouse 345

7. The view now retrieves all the rows for the last two days, as shown in Figure 5-21. You can customize this by dragging and dropping the graphical icons to view the historical data.
Figure 5-21 Two-day historical data view
346 Tivoli Management Services Warehouse and Reporting

This opens the plot graph shown in Figure 5-22.
Figure 5-22 Historical data plot graph view
Chapter 5. Integrating data from external or third-party applications into Tivoli Data Warehouse 347

5.3 Warehousing data using IBM Tivoli Monitoring 6.1 Universal Agent (ODBC provider)
In this section, we provide another practical example of how to configure the Tivoli Monitoring 6.1 Universal Agent. In doing so, we describe how data can be warehoused to the Tivoli Data Warehouse and viewed using the Tivoli Enterprise Portal client.
This solution monitors Tivoli Storage Manager by providing reports similar to the Daily Reports provided by Tivoli Storage Manager. The solution uses the Tivoli Storage Manager ODBC data provider to extract useful metrics about the working condition of your Tivoli Storage Manager server. This provides you with useful data about the performance and availability characteristics of your Tivoli Storage Manager server including:
� Client schedules� Administrative schedules� Disk pool information� Tape pool information� Data movement (restore/backup)� User and administrator information
You can use the collected information to perform trending analysis on your Tivoli Storage Manager server.
5.3.1 Configuring the Tivoli Universal Agent
The example that we provide is a Universal Agent that is used to gather data from a Tivoli Storage Manager database residing on a z/OS system. To configure this agent, perform the following steps:
1. Install and configure the Universal Agent. This is covered in detail in IBM Tivoli Monitoring Installation and Setup Guide, GC32-9407, and IBM Tivoli Monitoring Universal Agent User's Guide, SC32-9459. In our lab environment, we installed the agent on a Windows system (toronto) because of the dependency on ODBC. The ODBC data provider is only supported on a Windows environment. The agent was installed under (c:\IBM\ITM).
2. After you install the Universal Agent, configure it so that it has to use the ODBC data provider. To do this, edit the c:\ibm\itm\tmaitm6\kumenv file. Change the tag KUMA_STARTUP_DP=ASFS to read KUMA_STARTUP_DP=ODBC. After you do this, save the ENV file and restart the Universal Agent.
348 Tivoli Management Services Warehouse and Reporting

3. The ODBC data provider requires an ODBC data source. In our case, we installed and configured a data source using the Tivoli Storage Manager ODBC drivers located on the Tivoli Storage Manager client setup disks. For detailed information about how to install and configure a Tivoli Storage Manager ODBC connection, see:
http://publib.boulder.ibm.com/infocenter/tivihelp/v1r1/index.jsp?topic=/com.ibm.itsmreadme.doc/WINDOWS/ODBC/README_odbc_enu.htm
4. After you install, configure, and test the ODBC data source, create the mdl file for the agent. The ODBC mdl file is heavily dependent on knowing the database schema of the database that you are querying, because direct SQL statements are used. The attribute groups are also mapped to table names, therefore it is essential to know the schema that you want to use this provider on. Create the file and place it in the (c:\ibm\itm\tmaitm6\metafiles) directory. An example of the mdl file that we used is shown in Appendix A, “Example mdl file for the Tivoli Storage Manager Universal Agent scenario” on page 491.
Important: It is essential to modify the .mdl file and parameters to suit your environment. In our case, we used a system DSN named TSM ODBC as the data source, and the user name and password we used for querying the Tivoli Storage Manager server were both admin.
Chapter 5. Integrating data from external or third-party applications into Tivoli Data Warehouse 349
Note: It is possible to automatically build a metafile for the database that you are querying. To do this, issue the GENERATE command.
The GENERATE command automatically builds a complete and syntactically correct ODBC metafile when given a data source name as input. This command supports full generation of all tables that are defined to the specified data source. You can also limit the tables that are generated by selecting user tables, system tables, views, or some combination of the three, and specify a beginning string of characters to pattern match against any of the three table types.
The GENERATE command does not support metafile creation for stored procedures. You can start this command even when the IBM Tivoli Universal Agent is not running. GENERATE is only accessible on Windows operating systems and only through the kumpcon console interface. The syntax is as follows:
<ITMInstalldir>\tmaitm6\KUMPCON GENERATE dataSourceName user=userid pswd=password
In this syntax:
� <dataSourceName> indicates the specific name of the configured data source that is used to create the ODBC metafile. This parameter is required. If the data source contains any embedded blanks, it must be surrounded with single quotation marks.
� <userid> is the user ID that connects to the ODBC data source. If no user and password combination is required for this particular data source, then you can omit the user= parameter from the GENERATE command.
� <password> is the password that is associated with the user ID connecting to the ODBC data source. If specified, the user and pswd values are inserted into every //SOURCE statement in the generated ODBC metafile.
In our case, we used the following command to generate the .mdl file:
c:\ibm\itm\tmaitm6\kumpcon GENERATE TSMODBC user=admin pswd=admin
350 Tivoli Management Services Warehouse and Reporting

5. After you create the .mdl file, register it with the Universal Agent so that it knows the format of the data that it will be receive and the SQL statements that are used to provide this data. To do this, run the commands shown in Example 5-5.
Example 5-5 Commands used to import .mdl file on Windows
cd\ibm\itm\tmaitm6
kumpcon validate tsm.mdlKUMPS001I Console input accepted.KUMPV025I Processing input metafile C:\IBM\ITM\TMAITM6\metafiles\tsm.mdlKUMPV026I Processing record 0001 -> //APPL TSMKUMPV149I Note: APPL names starting with letters N-Z are designated for customer UA solutions.KUMPV026I Processing record 0002 -> //NAME ACTLOG S 300 @Server activity logKUMPV026I Processing record 0003 -> //SOURCE ODBC TSMODBC user=vasfi pswd=good4nowKUMPV026I Processing record 0004 -> //SQL Select * from ACTLOGKUMPV026I Processing record 0005 -> //ATTRIBUTESKUMPV026I Processing record 0006 -> DATE_TIME D 28 @Date/TimeKUMPV026I Processing record 0007 -> MSGNO N 8 @Message numberKUMPV026I Processing record 0008 -> SEVERITY D 4 @Message severityKUMPV026I Processing record 0009 -> MESSAGE D 256 @MessageKUMPV026I Processing record 0010 -> ORIGINATOR D 20 @OriginatorKUMPV026I Processing record 0011 -> NODENAME D 64 @Node NameKUMPV026I Processing record 0012 -> OWNERNAME D 64 @Owner NameKUMPV026I Processing record 0013 -> SCHEDNAME D 32 @Schedule NameKUMPV026I Processing record 0014 -> DOMAINNAME D 32 @Policy Domain NameKUMPV026I Processing record 0015 -> SESSID N 8 @Sess NumberKUMPV026I Processing record 0016 -> SERVERNAME D 64 @Server NameKUMPV026I Processing record 0017 -> SESSION N 8 @SESSIONKUMPV026I Processing record 0018 -> PROCESS N 8 @PROCESSKUMPV026I Processing record 0019 -> //NAME ADMINS K 300 @Server administratorsKUMPV026I Processing record 0020 -> //SOURCE ODBC TSMODBC user=vasfi pswd=good4nowKUMPV026I Processing record 0021 -> //SQL Select * from ADMINSKUMPV026I Processing record 0022 -> //ATTRIBUTESKUMPV026I Processing record 0023 -> ADMIN_NAME D 64 KEY ATOMIC @Administrator NameKUMPV026I Processing record 0024 -> LASTACC_TIME D 28 @Last Access Date/Time
Chapter 5. Integrating data from external or third-party applications into Tivoli Data Warehouse 351

KUMPV026I Processing record 0025 -> PWSET_TIME D 28 @Password Set Date/TimeKUMPV026I Processing record 0026 -> CONTACT D 128 @ContactKUMPV026I Processing record 0027 -> LOCKED D 12 @Locked?KUMPV026I Processing record 0028 -> INVALID_PW_COUNT C 999999 @Invalid Sign-on CountKUMPV026I Processing record 0029 -> SYSTEM_PRIV D 80 @System PrivilegeKUMPV026I Processing record 0030 -> POLICY_PRIV D 100 @Policy PrivilegeKUMPV026I Processing record 0031 -> STORAGE_PRIV D 100 @Storage PrivilegeKUMPV026I Processing record 0032 -> ANALYST_PRIV D 80 @Analyst PrivilegeKUMPV026I Processing record 0033 -> OPERATOR_PRIV D 80 @Operator PrivilegeKUMPV026I Processing record 0034 -> CLIENT_ACCESS D 256 @Client Access PrivilegeKUMPV026I Processing record 0035 -> CLIENT_OWNER D 256 @Client Owner PrivilegeKUMPV026I Processing record 0036 -> REG_TIME D 28 @Registration Date/TimeKUMPV026I Processing record 0037 -> REG_ADMIN D 64 @Registering AdministratorKUMPV026I Processing record 0038 -> PROFILE D 256 @Managing profileKUMPV026I Processing record 0039 -> PASSEXP N 8 @Password Expiration PeriodKUMPV026I Processing record 0040 -> //NAME ADMIN_SCHEDULES K 300 @Administrative command schedulesKUMPV026I Processing record 0041 -> //SOURCE ODBC TSMODBC user=vasfi pswd=good4nowKUMPV026I Processing record 0042 -> //SQL Select * from ADMIN_SCHEDULESKUMPV026I Processing record 0043 -> //ATTRIBUTESKUMPV026I Processing record 0044 -> SCHEDULE_NAME D 32 KEY ATOMIC @Schedule NameKUMPV026I Processing record 0045 -> DESCRIPTION D 256 @DescriptionKUMPV026I Processing record 0046 -> COMMAND D 256 @CommandKUMPV026I Processing record 0047 -> PRIORITY C 999999 @PriorityKUMPV026I Processing record 0048 -> STARTDATE D 12 @Start dateKUMPV026I Processing record 0049 -> STARTTIME D 8 @Start timeKUMPV026I Processing record 0050 -> DURATION N 8 @DurationKUMPV026I Processing record 0051 -> DURUNITS D 20 @Duration unitsKUMPV026I Processing record 0052 -> PERIOD N 8 @Period
352 Tivoli Management Services Warehouse and Reporting
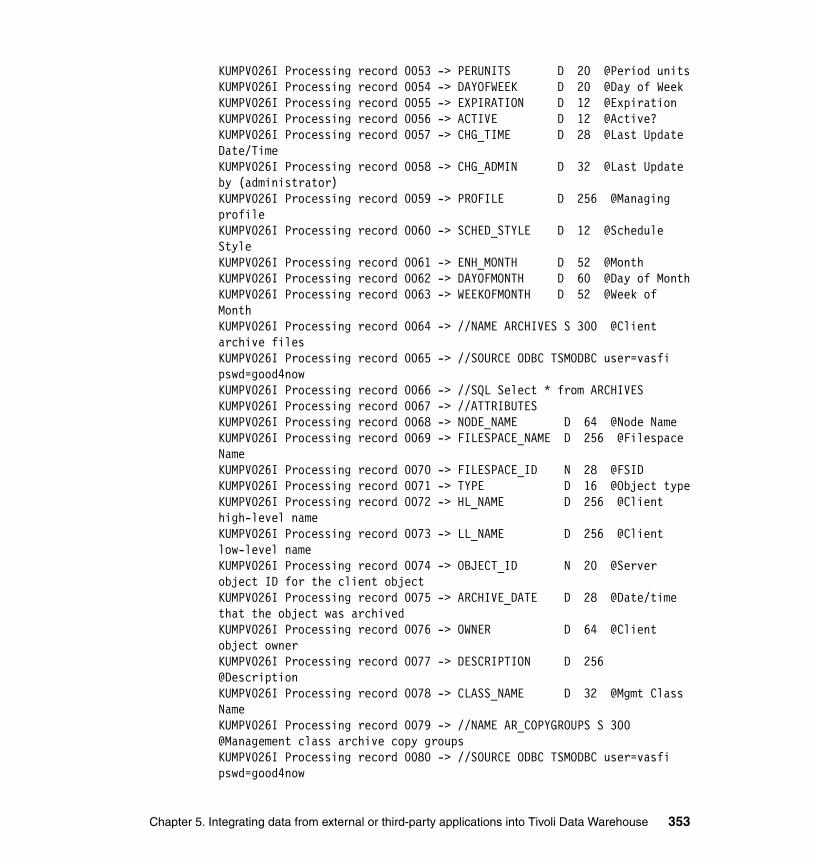
KUMPV026I Processing record 0053 -> PERUNITS D 20 @Period unitsKUMPV026I Processing record 0054 -> DAYOFWEEK D 20 @Day of WeekKUMPV026I Processing record 0055 -> EXPIRATION D 12 @ExpirationKUMPV026I Processing record 0056 -> ACTIVE D 12 @Active?KUMPV026I Processing record 0057 -> CHG_TIME D 28 @Last Update Date/TimeKUMPV026I Processing record 0058 -> CHG_ADMIN D 32 @Last Update by (administrator)KUMPV026I Processing record 0059 -> PROFILE D 256 @Managing profileKUMPV026I Processing record 0060 -> SCHED_STYLE D 12 @Schedule StyleKUMPV026I Processing record 0061 -> ENH_MONTH D 52 @MonthKUMPV026I Processing record 0062 -> DAYOFMONTH D 60 @Day of MonthKUMPV026I Processing record 0063 -> WEEKOFMONTH D 52 @Week of MonthKUMPV026I Processing record 0064 -> //NAME ARCHIVES S 300 @Client archive filesKUMPV026I Processing record 0065 -> //SOURCE ODBC TSMODBC user=vasfi pswd=good4nowKUMPV026I Processing record 0066 -> //SQL Select * from ARCHIVESKUMPV026I Processing record 0067 -> //ATTRIBUTESKUMPV026I Processing record 0068 -> NODE_NAME D 64 @Node NameKUMPV026I Processing record 0069 -> FILESPACE_NAME D 256 @Filespace NameKUMPV026I Processing record 0070 -> FILESPACE_ID N 28 @FSIDKUMPV026I Processing record 0071 -> TYPE D 16 @Object typeKUMPV026I Processing record 0072 -> HL_NAME D 256 @Client high-level nameKUMPV026I Processing record 0073 -> LL_NAME D 256 @Client low-level nameKUMPV026I Processing record 0074 -> OBJECT_ID N 20 @Server object ID for the client objectKUMPV026I Processing record 0075 -> ARCHIVE_DATE D 28 @Date/time that the object was archivedKUMPV026I Processing record 0076 -> OWNER D 64 @Client object ownerKUMPV026I Processing record 0077 -> DESCRIPTION D 256 @DescriptionKUMPV026I Processing record 0078 -> CLASS_NAME D 32 @Mgmt Class NameKUMPV026I Processing record 0079 -> //NAME AR_COPYGROUPS S 300 @Management class archive copy groupsKUMPV026I Processing record 0080 -> //SOURCE ODBC TSMODBC user=vasfi pswd=good4now
Chapter 5. Integrating data from external or third-party applications into Tivoli Data Warehouse 353

KUMPV026I Processing record 0081 -> //SQL Select * from AR_COPYGROUPSKUMPV026I Processing record 0082 -> //ATTRIBUTESKUMPV026I Processing record 0083 -> DOMAIN_NAME D 32 @Policy Domain NameKUMPV026I Processing record 0084 -> SET_NAME D 32 @Policy Set NameKUMPV026I Processing record 0085 -> CLASS_NAME D 32 @Mgmt Class NameKUMPV026I Processing record 0086 -> COPYGROUP_NAME D 32 @Copy Group NameKUMPV026I Processing record 0087 -> RETVER D 8 @Retain VersionKUMPV026I Processing record 0088 -> SERIALIZATION D 32 @Copy SerializationKUMPV026I Processing record 0089 -> DESTINATION D 32 @Copy DestinationKUMPV026I Processing record 0090 -> CHG_TIME D 28 @Last Update Date/TimeKUMPV026I Processing record 0091 -> CHG_ADMIN D 32 @Last Update by (administrator)KUMPV026I Processing record 0092 -> PROFILE D 256 @Managing profileKUMPV026I Processing record 0093 -> RETINIT D 8 @Retention InitiationKUMPV026I Processing record 0094 -> RETMIN N 8 @Retain Minimum DaysKUMPV026I Processing record 0095 -> //NAME ASSOCIATIONS S 300 @Client schedule associationsKUMPV026I Processing record 0096 -> //SOURCE ODBC TSMODBC user=vasfi pswd=good4nowKUMPV026I Processing record 0097 -> //SQL Select * from ASSOCIATIONSKUMPV026I Processing record 0098 -> //ATTRIBUTESKUMPV026I Processing record 0099 -> DOMAIN_NAME D 32 @Policy Domain NameKUMPV026I Processing record 0100 -> SCHEDULE_NAME D 32 @Schedule NameKUMPV026I Processing record 0101 -> NODE_NAME D 64 @Associated NodesKUMPV026I Processing record 0102 -> CHG_TIME D 28 @Last Update Date/TimeKUMPV026I Processing record 0103 -> CHG_ADMIN D 32 @Last Update by (administrator)KUMPV026I Processing record 0104 -> //NAME AUDITOCC K 300 @Server audit occupancy results
354 Tivoli Management Services Warehouse and Reporting

KUMPV026I Processing record 0105 -> //SOURCE ODBC TSMODBC user=vasfi pswd=good4nowKUMPV026I Processing record 0106 -> //SQL Select * from AUDITOCCKUMPV026I Processing record 0107 -> //ATTRIBUTESKUMPV026I Processing record 0108 -> NODE_NAME D 64 KEY ATOMIC @Node NameKUMPV026I Processing record 0109 -> BACKUP_MB N 8 @Backup Storage Used (MB)KUMPV026I Processing record 0110 -> BACKUP_COPY_MB N 8 @Backup Storage Used (MB)KUMPV026I Processing record 0111 -> ARCHIVE_MB N 8 @Archive Storage Used (MB)KUMPV026I Processing record 0112 -> ARCHIVE_COPY_MB N 8 @Archive Storage Used (MB)KUMPV026I Processing record 0113 -> SPACEMG_MB N 8 @Space-Managed Storage Used (MB)KUMPV026I Processing record 0114 -> SPACEMG_COPY_MB N 8 @Space-Managed Storage Used (MB)KUMPV026I Processing record 0115 -> TOTAL_MB N 8 @Total Storage Used (MB)KUMPV026I Processing record 0116 -> //NAME BACKUPS S 300 @Client backup filesKUMPV026I Processing record 0117 -> //SOURCE ODBC TSMODBC user=vasfi pswd=good4nowKUMPV026I Processing record 0118 -> //SQL Select * from BACKUPSKUMPV026I Processing record 0119 -> //ATTRIBUTESKUMPV026I Processing record 0120 -> NODE_NAME D 64 @Node NameKUMPV026I Processing record 0121 -> FILESPACE_NAME D 256 @Filespace NameKUMPV026I Processing record 0122 -> FILESPACE_ID N 28 @FSIDKUMPV026I Processing record 0123 -> STATE D 16 @File state (active, inactive)KUMPV026I Processing record 0124 -> TYPE D 16 @Object typeKUMPV026I Processing record 0125 -> HL_NAME D 256 @Client high-level nameKUMPV026I Processing record 0126 -> LL_NAME D 256 @Client low-level nameKUMPV026I Processing record 0127 -> OBJECT_ID N 20 @Server object ID for the client objectKUMPV026I Processing record 0128 -> BACKUP_DATE D 28 @Date/time that the object was backed upKUMPV026I Processing record 0129 -> DEACTIVATE_DATE D 28 @Date/time that the object was deactivated
Chapter 5. Integrating data from external or third-party applications into Tivoli Data Warehouse 355

KUMPV026I Processing record 0130 -> OWNER D 64 @Client object ownerKUMPV026I Processing record 0131 -> CLASS_NAME D 32 @Mgmt Class NameKUMPV026I Processing record 0132 -> //NAME BACKUPSETS S 300 @Backup SetKUMPV026I Processing record 0133 -> //SOURCE ODBC TSMODBC user=vasfi pswd=good4nowKUMPV026I Processing record 0134 -> //SQL Select * from BACKUPSETSKUMPV026I Processing record 0135 -> //ATTRIBUTESKUMPV026I Processing record 0136 -> NODE_NAME D 64 @Node NameKUMPV026I Processing record 0137 -> BACKUPSET_NAME D 256 @Backup Set NameKUMPV026I Processing record 0138 -> OBJECT_ID N 20 @Server object ID for the client objectKUMPV026I Processing record 0139 -> DATE_TIME D 28 @Date/TimeKUMPV026I Processing record 0140 -> RETENTION D 8 @Retention PeriodKUMPV026I Processing record 0141 -> DESCRIPTION D 256 @DescriptionKUMPV026I Processing record 0142 -> DEVCLASS D 32 @Device Class NameKUMPV026I Processing record 0143 -> //NAME BU_COPYGROUPS S 300 @Management class backup copy groupsKUMPV026I Processing record 0144 -> //SOURCE ODBC TSMODBC user=vasfi pswd=good4nowKUMPV026I Processing record 0145 -> //SQL Select * from BU_COPYGROUPSKUMPV026I Processing record 0146 -> //ATTRIBUTESKUMPV026I Processing record 0147 -> DOMAIN_NAME D 32 @Policy Domain NameKUMPV026I Processing record 0148 -> SET_NAME D 32 @Policy Set NameKUMPV026I Processing record 0149 -> CLASS_NAME D 32 @Mgmt Class NameKUMPV026I Processing record 0150 -> COPYGROUP_NAME D 32 @Copy Group NameKUMPV026I Processing record 0151 -> VEREXISTS D 8 @Versions Data ExistsKUMPV026I Processing record 0152 -> VERDELETED D 8 @Versions Data DeletedKUMPV026I Processing record 0153 -> RETEXTRA D 8 @Retain Extra VersionsKUMPV026I Processing record 0154 -> RETONLY D 8 @Retain Only VersionKUMPV026I Processing record 0155 -> MODE D 32 @Copy Mode
356 Tivoli Management Services Warehouse and Reporting

KUMPV026I Processing record 0156 -> SERIALIZATION D 32 @Copy SerializationKUMPV026I Processing record 0157 -> FREQUENCY C 999999 @Copy FrequencyKUMPV026I Processing record 0158 -> DESTINATION D 32 @Copy DestinationKUMPV026I Processing record 0159 -> TOC_DESTINATION D 32 @Table of Contents (TOC) DestinationKUMPV026I Processing record 0160 -> CHG_TIME D 28 @Last Update Date/TimeKUMPV026I Processing record 0161 -> CHG_ADMIN D 32 @Last Update by (administrator)KUMPV026I Processing record 0162 -> PROFILE D 256 @Managing profileKUMPV026I Processing record 0163 -> //NAME CLIENTOPTS S 300 @Client OptionsKUMPV026I Processing record 0164 -> //SOURCE ODBC TSMODBC user=vasfi pswd=good4nowKUMPV026I Processing record 0165 -> //SQL Select * from CLIENTOPTSKUMPV026I Processing record 0166 -> //ATTRIBUTESKUMPV026I Processing record 0167 -> OPTIONSET_NAME D 68 @OptionsetKUMPV026I Processing record 0168 -> OPTION_NAME D 68 @OptionKUMPV026I Processing record 0169 -> SEQNUMBER N 8 @Sequence numberKUMPV026I Processing record 0170 -> OPTION_VALUE D 256 @Option ValueKUMPV026I Processing record 0171 -> FORCE D 4 @Use Option Set Value (FORCE)KUMPV026I Processing record 0172 -> OBSOLETE D 12 @ObsoleteKUMPV026I Processing record 0173 -> WHEN_OBSOLETE D 12 @When Obsolete?KUMPV026I Processing record 0174 -> //NAME CLIENT_SCHEDULES S 300 @Client schedulesKUMPV026I Processing record 0175 -> //SOURCE ODBC TSMODBC user=vasfi pswd=good4nowKUMPV026I Processing record 0176 -> //SQL Select * from CLIENT_SCHEDULESKUMPV026I Processing record 0177 -> //ATTRIBUTESKUMPV026I Processing record 0178 -> DOMAIN_NAME D 32 @Policy Domain NameKUMPV026I Processing record 0179 -> SCHEDULE_NAME D 32 @Schedule NameKUMPV026I Processing record 0180 -> DESCRIPTION D 256 @DescriptionKUMPV026I Processing record 0181 -> ACTION D 20 @ActionKUMPV026I Processing record 0182 -> OPTIONS D 256 @Options
Chapter 5. Integrating data from external or third-party applications into Tivoli Data Warehouse 357

KUMPV026I Processing record 0183 -> OBJECTS D 256 @ObjectsKUMPV026I Processing record 0184 -> PRIORITY C 999999 @PriorityKUMPV026I Processing record 0185 -> STARTDATE D 12 @Start dateKUMPV026I Processing record 0186 -> STARTTIME D 8 @Start timeKUMPV026I Processing record 0187 -> DURATION N 8 @DurationKUMPV026I Processing record 0188 -> DURUNITS D 20 @Duration unitsKUMPV026I Processing record 0189 -> PERIOD N 8 @PeriodKUMPV026I Processing record 0190 -> PERUNITS D 20 @Period unitsKUMPV026I Processing record 0191 -> DAYOFWEEK D 20 @Day of WeekKUMPV026I Processing record 0192 -> EXPIRATION D 12 @ExpirationKUMPV026I Processing record 0193 -> CHG_TIME D 28 @Last Update Date/TimeKUMPV026I Processing record 0194 -> CHG_ADMIN D 32 @Last Update by (administrator)KUMPV026I Processing record 0195 -> PROFILE D 256 @Managing profileKUMPV026I Processing record 0196 -> SCHED_STYLE D 12 @Schedule StyleKUMPV026I Processing record 0197 -> ENH_MONTH D 52 @MonthKUMPV026I Processing record 0198 -> DAYOFMONTH D 60 @Day of MonthKUMPV026I Processing record 0199 -> WEEKOFMONTH D 52 @Week of MonthKUMPV026I Processing record 0200 -> //NAME CLOPTSETS K 300 @Client Option SetsKUMPV026I Processing record 0201 -> //SOURCE ODBC TSMODBC user=vasfi pswd=good4nowKUMPV026I Processing record 0202 -> //SQL Select * from CLOPTSETSKUMPV026I Processing record 0203 -> //ATTRIBUTESKUMPV026I Processing record 0204 -> OPTIONSET_NAME D 68 KEY ATOMIC @OptionsetKUMPV026I Processing record 0205 -> DESCRIPTION D 256 @DescriptionKUMPV026I Processing record 0206 -> LAST_UPDATE_BY D 68 @Last Update by (administrator)KUMPV026I Processing record 0207 -> PROFILE D 256 @Managing profileKUMPV026I Processing record 0208 -> //NAME COLLOCGROUP S 300 @Collocation groupsKUMPV026I Processing record 0209 -> //SOURCE ODBC TSMODBC user=vasfi pswd=good4nowKUMPV026I Processing record 0210 -> //SQL Select * from COLLOCGROUPKUMPV026I Processing record 0211 -> //ATTRIBUTESKUMPV026I Processing record 0212 -> COLLOCGROUP_NAME D 32 @Collocation Group Name
358 Tivoli Management Services Warehouse and Reporting

KUMPV026I Processing record 0213 -> DESCRIPTION D 256 @DescriptionKUMPV026I Processing record 0214 -> CHG_TIME D 28 @Last Update Date/TimeKUMPV026I Processing record 0215 -> CHG_ADMIN D 32 @Last Update by (administrator)KUMPV026I Processing record 0216 -> NODE_NAME D 64 @Node NameKUMPV026I Processing record 0217 -> //NAME CONTENTS S 300 @Storage pool volume contentsKUMPV026I Processing record 0218 -> //SOURCE ODBC TSMODBC user=vasfi pswd=good4nowKUMPV026I Processing record 0219 -> //SQL Select * from CONTENTSKUMPV026I Processing record 0220 -> //ATTRIBUTESKUMPV026I Processing record 0221 -> VOLUME_NAME D 256 @Volume NameKUMPV026I Processing record 0222 -> NODE_NAME D 64 @Node NameKUMPV026I Processing record 0223 -> TYPE D 20 @TypeKUMPV026I Processing record 0224 -> FILESPACE_NAME D 64 @Filespace NameKUMPV026I Processing record 0225 -> FILE_NAME D 256 @Client's Name for FileKUMPV026I Processing record 0226 -> AGGREGATED D 20 @Aggregated?KUMPV026I Processing record 0227 -> FILE_SIZE N 20 @Stored SizeKUMPV026I Processing record 0228 -> SEGMENT D 20 @Segment NumberKUMPV026I Processing record 0229 -> CACHED D 20 @Cached Copy?KUMPV026I Processing record 0230 -> FILESPACE_ID N 8 @FSIDKUMPV026I Processing record 0231 -> FILESPACE_HEXNAME D 64 @Hexadecimal Filespace NameKUMPV026I Processing record 0232 -> FILE_HEXNAME D 256 @Hexadecimal Client's Name for FileKUMPV026I Processing record 0233 -> //NAME DATAMOVERS K 300 @Data MoversKUMPV026I Processing record 0234 -> //SOURCE ODBC TSMODBC user=vasfi pswd=good4nowKUMPV026I Processing record 0235 -> //SQL Select * from DATAMOVERSKUMPV026I Processing record 0236 -> //ATTRIBUTESKUMPV026I Processing record 0237 -> MOVER_NAME D 64 KEY ATOMIC @Data Mover NameKUMPV026I Processing record 0238 -> TYPE D 16 @Data Mover Type
Chapter 5. Integrating data from external or third-party applications into Tivoli Data Warehouse 359

KUMPV026I Processing record 0239 -> HL_ADDRESS D 256 @IP AddressKUMPV026I Processing record 0240 -> LL_ADDRESS D 256 @TCP/IP Port NumberKUMPV026I Processing record 0241 -> USER_NAME D 64 @User NameKUMPV026I Processing record 0242 -> WWN D 16 @WWNKUMPV026I Processing record 0243 -> SERIAL D 64 @Serial NumberKUMPV026I Processing record 0244 -> COPYTHREADS N 8 @Copy ThreadsKUMPV026I Processing record 0245 -> DATA_FORMAT D 32 @Storage Pool Data FormatKUMPV026I Processing record 0246 -> ONLINE D 40 @On-LineKUMPV026I Processing record 0247 -> LAST_UPDATE_BY D 64 @Last Update by (administrator)KUMPV026I Processing record 0248 -> LAST_UPDATE D 28 @Last Update Date/TimeKUMPV026I Processing record 0249 -> //NAME DB S 300 @Server database informationKUMPV026I Processing record 0250 -> //SOURCE ODBC TSMODBC user=vasfi pswd=good4nowKUMPV026I Processing record 0251 -> //SQL Select * from DBKUMPV026I Processing record 0252 -> //ATTRIBUTESKUMPV026I Processing record 0253 -> AVAIL_SPACE_MB N 8 @Available Space (MB)KUMPV026I Processing record 0254 -> CAPACITY_MB N 8 @Assigned Capacity (MB)KUMPV026I Processing record 0255 -> MAX_EXTENSION_MB N 8 @Maximum Extension (MB)KUMPV026I Processing record 0256 -> MAX_REDUCTION_MB N 12 @Maximum Reduction (MB)KUMPV026I Processing record 0257 -> PAGE_SIZE C 999999 @Page Size (bytes)KUMPV026I Processing record 0258 -> USABLE_PAGES N 8 @Total Usable PagesKUMPV026I Processing record 0259 -> USED_PAGES N 8 @Used PagesKUMPV026I Processing record 0260 -> PCT_UTILIZED N 4 @Pct UtilKUMPV026I Processing record 0261 -> MAX_PCT_UTILIZED N 4 @Max. Pct UtilKUMPV026I Processing record 0262 -> PHYSICAL_VOLUMES N 8 @Physical VolumesKUMPV026I Processing record 0263 -> BUFF_POOL_PAGES N 12 @Buffer Pool PagesKUMPV026I Processing record 0264 -> TOTAL_BUFFER_REQ N 12 @Total Buffer Requests
360 Tivoli Management Services Warehouse and Reporting

KUMPV026I Processing record 0265 -> CACHE_HIT_PCT N 4 @Cache Hit Pct.KUMPV026I Processing record 0266 -> CACHE_WAIT_PCT N 4 @Cache Wait Pct.KUMPV026I Processing record 0267 -> BACKUP_RUNNING D 12 @Backup in Progress?KUMPV026I Processing record 0268 -> BACKUP_TYPE D 20 @Type of Backup In ProgressKUMPV026I Processing record 0269 -> NUM_BACKUP_INCR C 999999 @Incrementals Since Last FullKUMPV026I Processing record 0270 -> BACKUP_CHG_MB N 4 @Changed Since Last Backup (MB)KUMPV026I Processing record 0271 -> BACKUP_CHG_PCT N 4 @Percentage ChangedKUMPV026I Processing record 0272 -> LAST_BACKUP_DATE D 28 @Last Complete Backup Date/TimeKUMPV026I Processing record 0273 -> DB_REORG_EST N 8 @Estimate of Recoverable Space (MB)KUMPV026I Processing record 0274 -> DB_REORG_EST_TIME D 28 @Last Estimate of Recoverable Space (MB)KUMPV026I Processing record 0275 -> //NAME DBBACKUPTRIGGER S 300 @Database backup trigger informationKUMPV026I Processing record 0276 -> //SOURCE ODBC TSMODBC user=vasfi pswd=good4nowKUMPV026I Processing record 0277 -> //SQL Select * from DBBACKUPTRIGGERKUMPV026I Processing record 0278 -> //ATTRIBUTESKUMPV026I Processing record 0279 -> DEVCLASS D 32 @Full Device ClassKUMPV026I Processing record 0280 -> INCRDEVCLASS D 32 @Incremental Device ClassKUMPV026I Processing record 0281 -> LOGFULLPCT C 999999 @Log Full PercentageKUMPV026I Processing record 0282 -> NUMICREMENTAL C 999999 @Incrementals Between FullsKUMPV026I Processing record 0283 -> CHG_TIME D 28 @Last Update Date/TimeKUMPV026I Processing record 0284 -> CHG_ADMIN D 64 @Last Update by (administrator)KUMPV026I Processing record 0285 -> MININTERVAL C 999999 @Minimum Backup Interval (minutes)KUMPV026I Processing record 0286 -> MINLOGFREE C 999999 @Minimum Log Percentage FreedKUMPV026I Processing record 0287 -> //NAME DBSPACETRIGGER S 300 @Database space trigger information
Chapter 5. Integrating data from external or third-party applications into Tivoli Data Warehouse 361

KUMPV026I Processing record 0288 -> //SOURCE ODBC TSMODBC user=vasfi pswd=good4nowKUMPV026I Processing record 0289 -> //SQL Select * from DBSPACETRIGGERKUMPV026I Processing record 0290 -> //ATTRIBUTESKUMPV026I Processing record 0291 -> FULLPCT C 999999 @DB Full PercentageKUMPV026I Processing record 0292 -> EXPANSIONPCT C 999999 @DB Space Expansion PercentageKUMPV026I Processing record 0293 -> EXPANSION_PREFIX D 252 @DB Expansion prefixKUMPV026I Processing record 0294 -> MAXIMUM_DB_SIZE N 8 @DB Maximum Size (Megabytes)KUMPV026I Processing record 0295 -> MIRROR_PREFIX_1 D 252 @Mirror Prefix 1KUMPV026I Processing record 0296 -> MIRROR_PREFIX_2 D 252 @Mirror Prefix 2KUMPV026I Processing record 0297 -> CHG_TIME D 28 @Last Update Date/TimeKUMPV026I Processing record 0298 -> CHG_ADMIN D 64 @Last Update by (administrator)KUMPV026I Processing record 0299 -> //NAME DBVOLUMES S 300 @Database volumesKUMPV026I Processing record 0300 -> //SOURCE ODBC TSMODBC user=vasfi pswd=good4nowKUMPV026I Processing record 0301 -> //SQL Select * from DBVOLUMESKUMPV026I Processing record 0302 -> //ATTRIBUTESKUMPV026I Processing record 0303 -> COPY1_NAME D 256 @Volume Name (Copy 1)KUMPV026I Processing record 0304 -> COPY1_STATUS D 20 @Copy StatusKUMPV026I Processing record 0305 -> COPY2_NAME D 256 @Volume Name (Copy 2)KUMPV026I Processing record 0306 -> COPY2_STATUS D 20 @Copy StatusKUMPV026I Processing record 0307 -> COPY3_NAME D 256 @Volume Name (Copy 3)KUMPV026I Processing record 0308 -> COPY3_STATUS D 20 @Copy StatusKUMPV026I Processing record 0309 -> AVAIL_SPACE_MB N 8 @Available Space (MB)KUMPV026I Processing record 0310 -> ALLOC_SPACE_MB N 8 @Allocated Space (MB)KUMPV026I Processing record 0311 -> FREE_SPACE_MB N 8 @Free Space (MB)KUMPV026I Processing record 0312 -> //NAME DEVCLASSES K 300 @Device ClassesKUMPV026I Processing record 0313 -> //SOURCE ODBC TSMODBC user=vasfi pswd=good4now
362 Tivoli Management Services Warehouse and Reporting

KUMPV026I Processing record 0314 -> //SQL Select * from DEVCLASSESKUMPV026I Processing record 0315 -> //ATTRIBUTESKUMPV026I Processing record 0316 -> DEVCLASS_NAME D 32 KEY ATOMIC @Device Class NameKUMPV026I Processing record 0317 -> ACCESS_STRATEGY D 12 @Device Access StrategyKUMPV026I Processing record 0318 -> STGPOOL_COUNT N 8 @Storage Pool CountKUMPV026I Processing record 0319 -> DEVTYPE D 16 @Device TypeKUMPV026I Processing record 0320 -> FORMAT D 16 @FormatKUMPV026I Processing record 0321 -> CAPACITY D 40 @Est/Max CapacityKUMPV026I Processing record 0322 -> MOUNTLIMIT D 12 @Mount LimitKUMPV026I Processing record 0323 -> MOUNTWAIT N 8 @Mount Wait (min)KUMPV026I Processing record 0324 -> MOUNTRETENTION N 8 @Mount Retention (min)KUMPV026I Processing record 0325 -> PREFIX D 8 @Label PrefixKUMPV026I Processing record 0326 -> DRIVE D 4 @Drive LetterKUMPV026I Processing record 0327 -> LIBRARY_NAME D 32 @LibraryKUMPV026I Processing record 0328 -> DIRECTORY D 256 @DirectoryKUMPV026I Processing record 0329 -> SERVERNAME D 64 @Server NameKUMPV026I Processing record 0330 -> RETRYPERIOD N 8 @Retry PeriodKUMPV026I Processing record 0331 -> RETRYINTERVAL N 8 @Retry IntervalKUMPV026I Processing record 0332 -> TWO_SIDED D 4 @TwosidedKUMPV026I Processing record 0333 -> SHARED D 4 @SharedKUMPV026I Processing record 0334 -> HLADDRESS D 256 @HLAddrKUMPV026I Processing record 0335 -> MINCAPACITY D 40 @Minimum CapacityKUMPV026I Processing record 0336 -> WORM D 4 @WORMKUMPV026I Processing record 0337 -> SCALECAPACITY N 8 @Scaled CapacityKUMPV026I Processing record 0338 -> LAST_UPDATE_BY D 64 @Last Update by (administrator)KUMPV026I Processing record 0339 -> LAST_UPDATE D 28 @Last Update Date/TimeKUMPV026I Processing record 0340 -> //NAME DISKS S 300 @Disks
Chapter 5. Integrating data from external or third-party applications into Tivoli Data Warehouse 363

KUMPV026I Processing record 0341 -> //SOURCE ODBC TSMODBC user=vasfi pswd=good4nowKUMPV026I Processing record 0342 -> //SQL Select * from DISKSKUMPV026I Processing record 0343 -> //ATTRIBUTESKUMPV026I Processing record 0344 -> NODE_NAME D 64 @Node NameKUMPV026I Processing record 0345 -> DISK_NAME D 64 @Disk NameKUMPV026I Processing record 0346 -> WWN D 16 @WWNKUMPV026I Processing record 0347 -> SERIAL D 64 @Serial NumberKUMPV026I Processing record 0348 -> ONLINE D 40 @On-LineKUMPV026I Processing record 0349 -> LAST_UPDATE_BY D 64 @Last Update by (administrator)KUMPV026I Processing record 0350 -> LAST_UPDATE D 28 @Last Update Date/TimeKUMPV026I Processing record 0351 -> //NAME DOMAINS K 300 @Policy domainsKUMPV026I Processing record 0352 -> //SOURCE ODBC TSMODBC user=vasfi pswd=good4nowKUMPV026I Processing record 0353 -> //SQL Select * from DOMAINSKUMPV026I Processing record 0354 -> //ATTRIBUTESKUMPV026I Processing record 0355 -> DOMAIN_NAME D 32 KEY ATOMIC @Policy Domain NameKUMPV026I Processing record 0356 -> SET_LAST_ACTIVATED D 32 @Activated Policy SetKUMPV026I Processing record 0357 -> ACTIVATE_DATE D 28 @Activation Date/TimeKUMPV026I Processing record 0358 -> DEFMGMTCLASS D 32 @Activated Default Mgmt ClassKUMPV026I Processing record 0359 -> NUM_NODES N 8 @Number of Registered NodesKUMPV026I Processing record 0360 -> BACKRETENTION C 999999 @Backup Retention (Grace Period)KUMPV026I Processing record 0361 -> ARCHRETENTION C 999999 @Archive Retention (Grace Period)KUMPV026I Processing record 0362 -> DESCRIPTION D 256 @DescriptionKUMPV026I Processing record 0363 -> CHG_TIME D 28 @Last Update Date/TimeKUMPV026I Processing record 0364 -> CHG_ADMIN D 32 @Last Update Date/TimeKUMPV026I Processing record 0365 -> PROFILE D 256 @Managing profileKUMPV026I Processing record 0366 -> //NAME DRIVES S 300 @DrivesKUMPV026I Processing record 0367 -> //SOURCE ODBC TSMODBC user=vasfi pswd=good4now
364 Tivoli Management Services Warehouse and Reporting

KUMPV026I Processing record 0368 -> //SQL Select * from DRIVESKUMPV026I Processing record 0369 -> //ATTRIBUTESKUMPV026I Processing record 0370 -> LIBRARY_NAME D 32 @Library NameKUMPV026I Processing record 0371 -> DRIVE_NAME D 32 @Drive NameKUMPV026I Processing record 0372 -> DEVICE_TYPE D 16 @Device TypeKUMPV026I Processing record 0373 -> ONLINE D 40 @On-LineKUMPV026I Processing record 0374 -> READ_FORMATS D 16 @Read FormatsKUMPV026I Processing record 0375 -> WRITE_FORMATS D 16 @Write FormatsKUMPV026I Processing record 0376 -> ELEMENT C 999999 @ElementKUMPV026I Processing record 0377 -> ACS_DRIVE_ID D 16 @ACS DriveIdKUMPV026I Processing record 0378 -> DRIVE_STATE D 40 @Drive StateKUMPV026I Processing record 0379 -> ALLOCATED_TO D 64 @Allocated toKUMPV026I Processing record 0380 -> LAST_UPDATE_BY D 64 @Last Update by (administrator)KUMPV026I Processing record 0381 -> LAST_UPDATE D 28 @Last Update Date/TimeKUMPV026I Processing record 0382 -> CLEAN_FREQ D 12 @Cleaning Frequency (Gigabytes/ASNEEDED/NONE)KUMPV026I Processing record 0383 -> DRIVE_SERIAL D 64 @Serial NumberKUMPV026I Processing record 0384 -> VOLUME_NAME D 256 @Volume NameKUMPV026I Processing record 0385 -> //NAME DRMCSTGPOOLS S 300 @Copy storage pools managed by the disaster recovery managerKUMPV026I Processing record 0386 -> //SOURCE ODBC TSMODBC user=vasfi pswd=good4nowKUMPV026I Processing record 0387 -> //SQL Select * from DRMCSTGPOOLSKUMPV026I Processing record 0388 -> //ATTRIBUTESKUMPV026I Processing record 0389 -> STGPOOL_NAME D 32 @Storage Pool NameKUMPV026I Processing record 0390 -> //NAME DRMEDIA S 300 @Physical volumes managed by move drmediaKUMPV026I Processing record 0391 -> //SOURCE ODBC TSMODBC user=vasfi pswd=good4nowKUMPV026I Processing record 0392 -> //SQL Select * from DRMEDIAKUMPV026I Processing record 0393 -> //ATTRIBUTESKUMPV026I Processing record 0394 -> VOLUME_NAME D 256 @Storage pool volumesKUMPV026I Processing record 0395 -> STATE D 20 @StateKUMPV026I Processing record 0396 -> UPD_DATE D 28 @Last Update Date/Time
Chapter 5. Integrating data from external or third-party applications into Tivoli Data Warehouse 365

KUMPV026I Processing record 0397 -> LOCATION D 256 @LocationKUMPV026I Processing record 0398 -> STGPOOL_NAME D 32 @Storage Pool NameKUMPV026I Processing record 0399 -> LIB_NAME D 32 @Automated LibNameKUMPV026I Processing record 0400 -> VOLTYPE D 12 @Volume TypeKUMPV026I Processing record 0401 -> //NAME DRMMACHINE S 300 @Disaster recovery manager machine informationKUMPV026I Processing record 0402 -> //SOURCE ODBC TSMODBC user=vasfi pswd=good4nowKUMPV026I Processing record 0403 -> //SQL Select * from DRMMACHINEKUMPV026I Processing record 0404 -> //ATTRIBUTESKUMPV026I Processing record 0405 -> MACHINE_NAME D 64 @Machine NameKUMPV026I Processing record 0406 -> PRIORITY C 999999 @Machine PriorityKUMPV026I Processing record 0407 -> BUILDING D 16 @BuildingKUMPV026I Processing record 0408 -> FLOOR D 16 @FloorKUMPV026I Processing record 0409 -> ROOM D 16 @RoomKUMPV026I Processing record 0410 -> ADSM_SERVER D 4 @Server?KUMPV026I Processing record 0411 -> DESCRIPTION D 256 @DescriptionKUMPV026I Processing record 0412 -> CHARACTERISTICS D 4 @Characteristics?KUMPV026I Processing record 0413 -> RECINSTRUCTIONS D 4 @Recovery Instructions?KUMPV026I Processing record 0414 -> //NAME DRMMACHINECHARS S 300 @Disaster recovery manager machine characteristicsKUMPV026I Processing record 0415 -> //SOURCE ODBC TSMODBC user=vasfi pswd=good4nowKUMPV026I Processing record 0416 -> //SQL Select * from DRMMACHINECHARSKUMPV026I Processing record 0417 -> //ATTRIBUTESKUMPV026I Processing record 0418 -> MACHINE_NAME D 64 @Machine NameKUMPV026I Processing record 0419 -> CHARACTERISTICS D 256 @CharacteristicsKUMPV026I Processing record 0420 -> //NAME DRMMACHINENODE S 300 @Disaster recovery manager machine node associationsKUMPV026I Processing record 0421 -> //SOURCE ODBC TSMODBC user=vasfi pswd=good4nowKUMPV026I Processing record 0422 -> //SQL Select * from DRMMACHINENODEKUMPV026I Processing record 0423 -> //ATTRIBUTESKUMPV026I Processing record 0424 -> MACHINE_NAME D 64 @Machine NameKUMPV026I Processing record 0425 -> NODE_NAME D 64 @Node Name
366 Tivoli Management Services Warehouse and Reporting

KUMPV026I Processing record 0426 -> //NAME DRMMACHINERECINST S 300 @Disaster recovery manager machine recovery instructionsKUMPV026I Processing record 0427 -> //SOURCE ODBC TSMODBC user=vasfi pswd=good4nowKUMPV026I Processing record 0428 -> //SQL Select * from DRMMACHINERECINSTKUMPV026I Processing record 0429 -> //ATTRIBUTESKUMPV026I Processing record 0430 -> MACHINE_NAME D 64 @Machine NameKUMPV026I Processing record 0431 -> RECINSTRUCTIONS D 256 @Recovery InstructionsKUMPV026I Processing record 0432 -> //NAME DRMMACHINERECMEDIA S 300 @Disaster recovery manager machine recovery media associationsKUMPV026I Processing record 0433 -> //SOURCE ODBC TSMODBC user=vasfi pswd=good4nowKUMPV026I Processing record 0434 -> //SQL Select * from DRMMACHINERECMEDIAKUMPV026I Processing record 0435 -> //ATTRIBUTESKUMPV026I Processing record 0436 -> MACHINE_NAME D 64 @Machine NameKUMPV026I Processing record 0437 -> RECMEDIA_NAME D 32 @Recovery Media NameKUMPV026I Processing record 0438 -> //NAME DRMPSTGPOOLS S 300 @Primary storage pools managed by the disaster recovery managerKUMPV026I Processing record 0439 -> //SOURCE ODBC TSMODBC user=vasfi pswd=good4nowKUMPV026I Processing record 0440 -> //SQL Select * from DRMPSTGPOOLSKUMPV026I Processing record 0441 -> //ATTRIBUTESKUMPV026I Processing record 0442 -> STGPOOL_NAME D 32 @Storage Pool NameKUMPV026I Processing record 0443 -> //NAME DRMRECOVERYMEDIA K 300 @Disaster recovery manager recovery mediaKUMPV026I Processing record 0444 -> //SOURCE ODBC TSMODBC user=vasfi pswd=good4nowKUMPV026I Processing record 0445 -> //SQL Select * from DRMRECOVERYMEDIAKUMPV026I Processing record 0446 -> //ATTRIBUTESKUMPV026I Processing record 0447 -> RECMEDIA_NAME D 32 KEY ATOMIC @Recovery Media NameKUMPV026I Processing record 0448 -> TYPE D 8 @TypeKUMPV026I Processing record 0449 -> LOCATION D 256 @LocationKUMPV026I Processing record 0450 -> DESCRIPTION D 256 @DescriptionKUMPV026I Processing record 0451 -> PRODUCT D 16 @ProductKUMPV026I Processing record 0452 -> PRODUCT_INFO D 256 @Product Information
Chapter 5. Integrating data from external or third-party applications into Tivoli Data Warehouse 367

KUMPV026I Processing record 0453 -> VOLUMES D 256 @Volume NamesKUMPV026I Processing record 0454 -> //NAME DRMSRPF S 300 @Recovery plan files in source serverKUMPV026I Processing record 0455 -> //SOURCE ODBC TSMODBC user=vasfi pswd=good4nowKUMPV026I Processing record 0456 -> //SQL Select * from DRMSRPFKUMPV026I Processing record 0457 -> //ATTRIBUTESKUMPV026I Processing record 0458 -> RPF_NAME D 256 @Recovery Plan File NameKUMPV026I Processing record 0459 -> NODE_NAME D 68 @Node NameKUMPV026I Processing record 0460 -> DEVCLASS_NAME D 32 @Device Class NameKUMPV026I Processing record 0461 -> TYPE D 36 @Recovery Plan File TypeKUMPV026I Processing record 0462 -> MGMTCLASS_NAME D 32 @Mgmt Class NameKUMPV026I Processing record 0463 -> RPF_SIZE N 12 @Recovery Plan File SizeKUMPV026I Processing record 0464 -> RPF_DELETE D 20 @Marked For DeletionKUMPV026I Processing record 0465 -> RPF_DELDATE D 28 @Deletion DateKUMPV026I Processing record 0466 -> //NAME DRMSTANZA S 300 @Recovery plan file stanza namesKUMPV026I Processing record 0467 -> //SOURCE ODBC TSMODBC user=vasfi pswd=good4nowKUMPV026I Processing record 0468 -> //SQL Select * from DRMSTANZAKUMPV026I Processing record 0469 -> //ATTRIBUTESKUMPV026I Processing record 0470 -> STANZA_NAME D 256 @Stanza NameKUMPV026I Processing record 0471 -> //NAME DRMSTATUS S 300 @Disaster recovery manager status informationKUMPV026I Processing record 0472 -> //SOURCE ODBC TSMODBC user=vasfi pswd=good4nowKUMPV026I Processing record 0473 -> //SQL Select * from DRMSTATUSKUMPV026I Processing record 0474 -> //ATTRIBUTESKUMPV026I Processing record 0475 -> PLANPREFIX D 200 @Recovery Plan PrefixKUMPV026I Processing record 0476 -> INSTRPREFIX D 200 @Plan Instructions PrefixKUMPV026I Processing record 0477 -> PLANVPOSTFIX D 4 @Replacement Volume PostfixKUMPV026I Processing record 0478 -> NONMOUNTNAME D 256 @Not Mountable Location Name
368 Tivoli Management Services Warehouse and Reporting

KUMPV026I Processing record 0479 -> COURIERNAME D 256 @Courier NameKUMPV026I Processing record 0480 -> VAULTNAME D 256 @Vault Site NameKUMPV026I Processing record 0481 -> DBBEXPIREDAYS N 8 @DB Backup Series Expiration DaysKUMPV026I Processing record 0482 -> CHECKLABEL D 20 @Check Label?KUMPV026I Processing record 0483 -> FILEPROCESS D 20 @Process FILE Device Type?KUMPV026I Processing record 0484 -> CMDFILENAME D 256 @Command File NameKUMPV026I Processing record 0485 -> RPFEXPIREDAYS N 8 @Recovery Plan File Expiration DaysKUMPV026I Processing record 0486 -> //NAME DRMTRPF S 300 @Recovery plan files in target serverKUMPV026I Processing record 0487 -> //SOURCE ODBC TSMODBC user=vasfi pswd=good4nowKUMPV026I Processing record 0488 -> //SQL Select * from DRMTRPFKUMPV026I Processing record 0489 -> //ATTRIBUTESKUMPV026I Processing record 0490 -> RPF_NAME D 256 @Recovery Plan File NameKUMPV026I Processing record 0491 -> NODE_NAME D 68 @Node NameKUMPV026I Processing record 0492 -> DEVCLASS_NAME D 32 @Device Class NameKUMPV026I Processing record 0493 -> TYPE D 36 @Recovery Plan File TypeKUMPV026I Processing record 0494 -> MGMTCLASS_NAME D 32 @Mgmt Class NameKUMPV026I Processing record 0495 -> RPF_SIZE N 12 @Recovery Plan File SizeKUMPV026I Processing record 0496 -> RPF_DELETE D 20 @Marked For DeletionKUMPV026I Processing record 0497 -> RPF_DELDATE D 28 @Deletion DateKUMPV000I Validation completed successfullyKUMPV090I Application metafile validation report saved in file C:\IBM\ITM\TMAITM6\metafiles\tivstm.rpt.
KUMPS065I Do you wish to Import or Refresh this metafile? <Import/Refresh/Cancel>importKUMPS020I Import successfully completed for tivstm.mdl
6. After you do this, restart the Universal Agent.
Chapter 5. Integrating data from external or third-party applications into Tivoli Data Warehouse 369

5.3.2 Viewing the data in the Tivoli Enterprise Portal
To view the data that is collected by the newly configured Universal Agent, perform the following steps:
1. Log on to either your TEP desktop client or your TEP web client.
2. After you log on, you can see the new agent that is added by selecting Enterprise → Windows Systems → Hostname → Universal Agent. See Figure 5-23.
Figure 5-23 Viewing the data in TEP
370 Tivoli Management Services Warehouse and Reporting

5.4 Tivoli Storage Manager Universal Agent in the Tivoli Enterprise Portal
To see all the data that is collected by the ODBC data provider running under the Universal Agent, click the Universal Agent, as shown in Figure 5-24.
Figure 5-24 TSM00 data view in Tivoli Enterprise Portal
Chapter 5. Integrating data from external or third-party applications into Tivoli Data Warehouse 371

5.4.1 Warehousing the Universal Agent data
To warehouse the data that is being collected by the configured Universal Agent, perform the following steps:
1. In the tool bar, select the History Configuration button, as shown in Figure 5-25.
Figure 5-25 TEP Historical Configuration tab
372 Tivoli Management Services Warehouse and Reporting
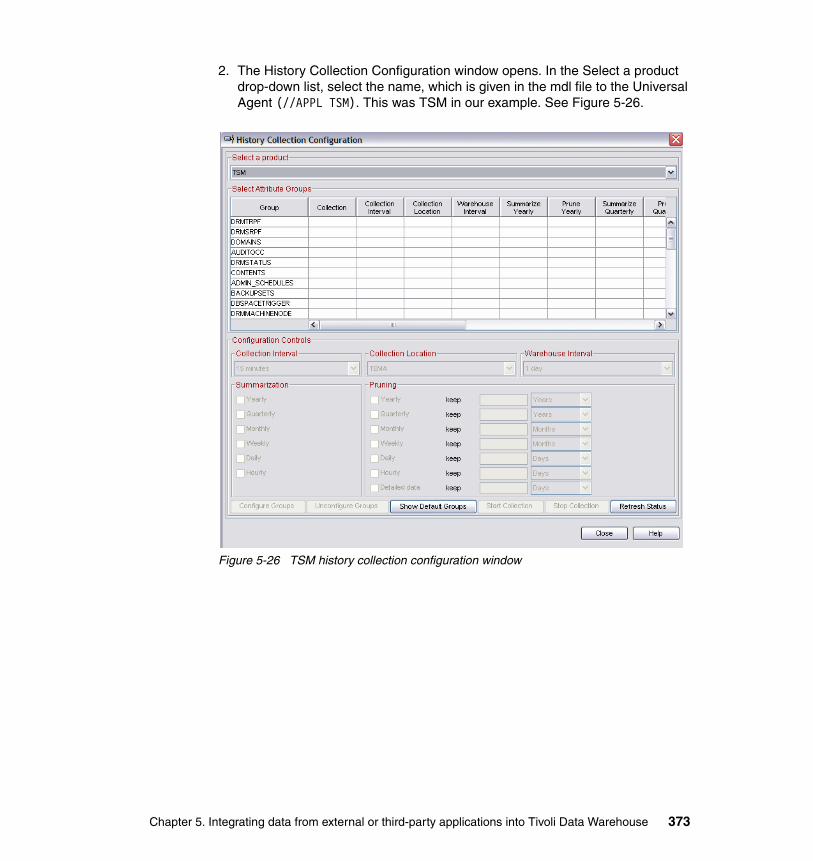
2. The History Collection Configuration window opens. In the Select a product drop-down list, select the name, which is given in the mdl file to the Universal Agent (//APPL TSM). This was TSM in our example. See Figure 5-26.
Figure 5-26 TSM history collection configuration window
Chapter 5. Integrating data from external or third-party applications into Tivoli Data Warehouse 373

3. In the Attribute Group list, click the group names. This enables the Configuration Control options. You can now specify the Collection Interval. Four options are available. Data for metrics presented under the Attribute Groups can be collected every 5, 15, 30 or every 60, minutes, as shown in Figure 5-27.
Figure 5-27 TSM collection interval configuration window
374 Tivoli Management Services Warehouse and Reporting

4. You can specify the collection location. Two options are available. Historical data can be collected at either the Tivoli Enterprise Monitoring Agent (agent) or at the Tivoli Enterprise Monitoring Server (management server, hub or remote). We recommend that you specify to collect data at the Tivoli Enterprise Monitoring Agent location, as shown in Figure 5-28.
Figure 5-28 TSM collection location configuration window
Chapter 5. Integrating data from external or third-party applications into Tivoli Data Warehouse 375

5. Select the warehouse interval. Two options are available. Historical data can be uploaded to Warehouse using the Warehouse Proxy agent ever hour or every 24 hours. See Figure 5-29.
Figure 5-29 TSM warehouse interval configuration window
376 Tivoli Management Services Warehouse and Reporting
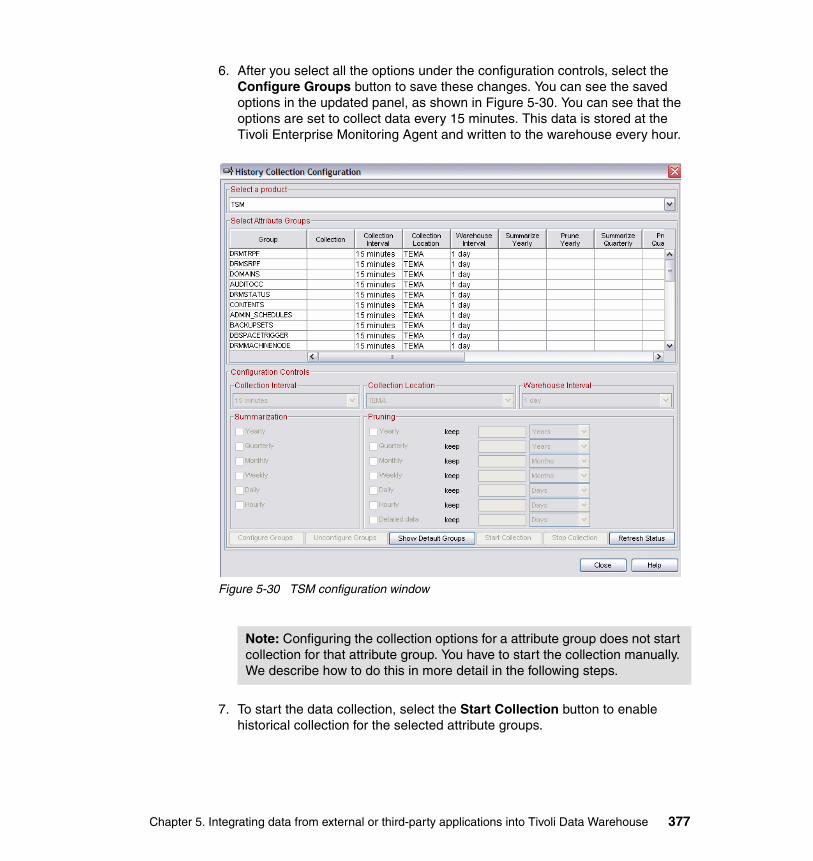
6. After you select all the options under the configuration controls, select the Configure Groups button to save these changes. You can see the saved options in the updated panel, as shown in Figure 5-30. You can see that the options are set to collect data every 15 minutes. This data is stored at the Tivoli Enterprise Monitoring Agent and written to the warehouse every hour.
Figure 5-30 TSM configuration window
7. To start the data collection, select the Start Collection button to enable historical collection for the selected attribute groups.
Note: Configuring the collection options for a attribute group does not start collection for that attribute group. You have to start the collection manually. We describe how to do this in more detail in the following steps.
Chapter 5. Integrating data from external or third-party applications into Tivoli Data Warehouse 377

The Collection field in the Select Attribute Groups section shows the status of the agent as Started, as shown in Figure 5-31. That is, the agent has started collection.
Figure 5-31 Tivoli Storage Manager started status in configuration window
378 Tivoli Management Services Warehouse and Reporting

The history collection has now started. You can confirm this by looking at the Universal Agents view, which shows a date/time icon, as shown in Figure 5-32.
Figure 5-32 Tivoli Enterprise Portal Tivoli Storage Manager date/time icon
5.5 Viewing data in Tivoli Enterprise Portal Server using an external ODBC data source
You can add any ODBC data source to Tivoli Enterprise Portal Server and view the data in the TEP desktop client. This data is only used for viewing purposes.
If you want to view data from an Oracle database, you can configure the portal server to add that data source by using the commands shown in Example 5-6.
Example 5-6 Adding a data source example
C:\IBM\ITM\BIN>tacmd login -u sysadmin -s berlinPassword?Validating user...KUIC00007I: User sysadmin logged into server on https://berlin:3759.C:\IBM\ITM\BIN>tacmd configureportalserver -s OracleDB -p DSN=OracleDB UID=system PWD=password KUICRA031: Are you sure you want to create the OracleDB datasource in the portal server configuration file C:\IBM\ITM\CNPS\kfwcma.ini and the Windows Registry with the following properties?DSN=OracleDB;UID=system;PWD=passwordEnter Y for yes or N for no: YKUICCP013I: The OracleDB datasource in the portal server configuration file C:\IBM\ITM\CNPS\kfwcma.ini has been created with the following properties:
Chapter 5. Integrating data from external or third-party applications into Tivoli Data Warehouse 379

DSN=OracleDB;UID=system;PWD=passwordKUICCP029I: The OracleDB datasource in the Windows Registry has been created with the following properties:DSN=OracleDB;UID=system;PWD=password
After you log in to the Tivoli Enterprise Portal Server, you can write a query to view data from your custom data source. To configure this, perform the following steps:
1. From the TEP client, open the Query Editor. You can create a custom query by selecting OracleDB data source and assign this query (OracleSQL) under Tivoli Enterprise Monitoring Server category to a view. The Query and View are displayed, as shown in Figure 5-33.
Figure 5-33 Creating a query from an ODBC data source
Note: After you add this data source, you must restart the Tivoli Enterprise Portal Server.
380 Tivoli Management Services Warehouse and Reporting

2. In the Custom SQL window, enter the following SQL (or an SQL of your choice):
SELECT PID, USERNAME, PROGRAM, PGA_USED_MEM, PGA_ALLOC_MEM, PGA_FREEABLE_MEM, PGA_MAX_MEM FROM V$PROCESS;
Click Apply and OK, as shown in Figure 5-34.
Figure 5-34 Custom SQL window
3. Select any workspace and you can apply the OracleSQL query created in the previous step.
a. Select a workspace at Enterprise Level, and click File → Save Workspace as, and give it a name.
b. Drag and drop a table icon on the empty view and click Yes to assign the query.
Chapter 5. Integrating data from external or third-party applications into Tivoli Data Warehouse 381

c. Select Click here to assign a query button, as shown in Figure 5-35.
Figure 5-35 Assigning a custom query to a workspace
d. Select the query (OracleSQL), which was created in the previous step. It is located under Queries → Tivoli Enterprise Monitoring Server → Custom SQL.
382 Tivoli Management Services Warehouse and Reporting

e. Click OK, Apply, and OK again, as shown in Figure 5-36.
Figure 5-36 Query selection window
Chapter 5. Integrating data from external or third-party applications into Tivoli Data Warehouse 383

The view opens with the data retrieved using SQL query, as shown in Figure 5-37.
Figure 5-37 Custom SQL query workspace view example
384 Tivoli Management Services Warehouse and Reporting
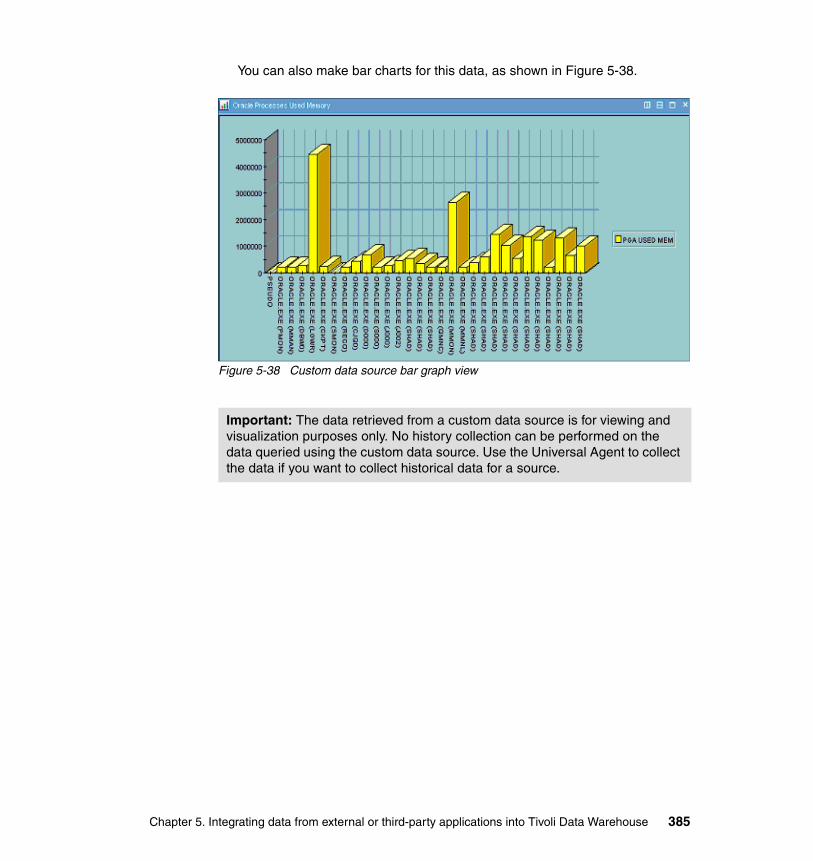
You can also make bar charts for this data, as shown in Figure 5-38.
Figure 5-38 Custom data source bar graph view
Important: The data retrieved from a custom data source is for viewing and visualization purposes only. No history collection can be performed on the data queried using the custom data source. Use the Universal Agent to collect the data if you want to collect historical data for a source.
Chapter 5. Integrating data from external or third-party applications into Tivoli Data Warehouse 385

386 Tivoli Management Services Warehouse and Reporting

Chapter 6. OPAL solutions and reporting with BIRT
This chapter starts by discussing several commercial reporting solutions that you can use with Tivoli Data Warehouse V2.1. These solutions are listed in the IBM Tivoli Open Process Automation Library (OPAL) Web site, which is a catalog of solutions provided by IBM and IBM Business Partners.
We also present a reporting solution that we developed during this IBM Redbook project, based on the requirements of a real client. This solution is based on Business Intelligence and Reporting Tools (BIRT), an open source reporting system with a case study based on a real-life client deployment scenario.
This chapter discusses the following topics:
� “IBM Tivoli Open Process Automation Library” on page 388
� “Case study: Web-publishing with BIRT” on page 391
6
Important: It is important to note that with the no-charge DB2 license that comes with IBM Tivoli Monitoring product, you are only entitled to access data from DB2 using native IBM Tivoli Monitoring interfaces. If you use an external reporting tool to access the data, you have to buy a DB2 license.
© Copyright IBM Corp. 2007. All rights reserved. 387

6.1 IBM Tivoli Open Process Automation Library
IBM Tivoli Open Process Automation Library (OPAL) is a worldwide online catalog accessible at:
http://catalog.lotus.com/wps/portal/topal/
This Web site provides a central location for hundreds of technically validated, ready-to-use Tivoli product extensions and services provided by IBM and IBM Business Partners.
OPAL contains downloadable product extensions such as:
� Automation packages� Integration adapters� Documentation� Plug-in tool kits� Technical services
In the OPAL catalog, the most evaluated topics in the data warehouse reporting area are:
� QuickReporter for IBM Tivoli Monitoring (Primeur)� Warehouse Designer for IBM Tivoli Monitoring 6.1 (Axibase)� Warehouse reporting using BIRT
Let us take a deeper look at these three solutions.
6.1.1 QuickReporter for IBM Tivoli Monitoring (Primeur)
QuickReporter for ITM is a product developed by PRIMEUR, a Premier Level IBM Business Partner. QuickReporter for ITM was the first solution that leveraged Business Intelligence and Reporting Tools (BIRT) technologies to provide a simple yet effective solution for generating PDF and HTML reports on resources managed by IBM Tivoli Monitoring V6.1 and other Tivoli products based on Tivoli Data Warehouse V2.1. QuickReporter for ITM does not require any database skill or knowledge of Tivoli Data Warehouse data schema.
Quick Reporter for ITM provides a large catalog (hundreds) of predefined reports: single or multi-metric; trend, summary, or rank; daily, weekly or monthly. A user-friendly Web interface can be used to select report types and associated monitored resources and to view (and save) generated reports.
Quick Reporter for ITM supports the following agents: IBM AS/400®, Windows, UNIX, Linux, IBM DB2, Oracle, Microsoft SQL Server, Microsoft Exchange, and Active Directory.
388 Tivoli Management Services Warehouse and Reporting

Main features of QuickReporter for IBM Tivoli MonitoringThe main features of QuickReporter for ITM are as follows:
� Reports can be generated in both PDF and HTML format
� Reports can be daily, weekly, and monthly based
� Reports can display trends for single or multiple metrics, in a single (overlay report) or multiple charts; reports can also display multiple resources as ranked with respect to one or more metrics
� Reports can be generated either at scheduled time or on demand
� Report can be generated for specific resources or resource groups managed by Tivoli, as discovered from Tivoli Data Warehouse
� A user-friendly Web interface can be used to both configure (admin role) the reports to be generated and to view or save (user role) generated reports
A new version of QuickReporter for ITM, Quick Reporter for ITM V2.0 will be available as of year end 2006. Among the major planned enhancements, QuickReporter for ITM will provide the ability to design and use custom reports, that is, reports where the graphical layout (for example, report title, additional information, and so on), the displayed metrics (such as IBM Tivoli Monitoring attributes, Tivoli Data Warehouse table and metric name), and time intervals of interest can be fully user specified. In particular, this feature will enable the definition of reports for data collected from Universal Agents.
QuickReporter for ITM has been certified by IBM as a Ready for Tivoli solution and it is published on IBM OPAL (Open Process Automation Library) Web site.
For more information, see the Primeur Web site at:
http://www.primeur.com
Information about Primeur Quick Reporter for ITM V1.4 can be found at:
http://www.primeur.com/products/system_management/tivoli/qr4itm_v14.html
6.1.2 Warehouse Designer for IBM Tivoli Monitoring 6.1 (Axibase)
Warehouse Designer is a Web-based solution for creating time-series graphs and reports based on historical and real-time performance data collected in Tivoli Data Warehouse V2.1 and IBM Tivoli Monitoring V6.1.
By integrating query-by-example modeler, chart viewer, and dual-repository data adapter with a simple Web-based interface, the Warehouse Designer enables users to easily access predefined charts and reports, and create their own
Chapter 6. OPAL solutions and reporting with BIRT 389

interactive charts and PDF reports without spending time on programming queries in SQL and mastering Tivoli Data Warehouse database schema.
The designer automatically discovers available tables, agents, and attributes, and it makes the design process as easy as selecting values from drop-down lists on a Web-based form.
Warehouse Designer for IBM Tivoli Monitoring 6.1 has been certified by IBM as a Ready for Tivoli solution and it is published on IBM OPAL (Open Process Automation Library) Web site.
Main features of Warehouse Designer for ITM 6.1The main features of Warehouse Designer for IBM Tivoli Monitoring are as follows:
� Real-time and historical time-series graphs based on Tivoli Data Warehouse data
� Form-based, query-by-example modeler with Tivoli Data Warehouse schema auto-discovery
� User-configurable chart options, including 3-D layout, zooming, and trend lines
� Raw data and aggregate statistics within a single viewbox
� Flexible report scheduling based on UNIX cron command syntax
� Frequently used query bookmarks and reporting dashboard
� Key Tivoli Data Warehouse health and growth statistics
� Integrated IBM Tivoli Monitoring security
For more information about Axibase’s offerings, see the following Web site:
http://www.axibase.com
For more information about Warehouse Designer for IBM Tivoli Monitoring 6.1, refer to the solution Web page at:
http://www.axibase.com/tivoli
6.1.3 Warehouse reporting using BIRT
BIRT is an Eclipse-based open source reporting system for Web applications, especially those based on Java and Java 2 Platform, Enterprise Edition (J2EE). BIRT has two main components: A Report Designer based on Eclipse and a runtime component that you can add to your application server (the BIRT Viewer).
390 Tivoli Management Services Warehouse and Reporting

Your BIRT reports can have charts, lists, graphics, and tables. You can use BIRT to sort, filter, and group data in a report and add business-specific logic using JavaScript™. A report produced in BIRT can produce the output as a PDF document or an HTML document.
You can find more documentation and information about BIRT at the Eclipse Web site:
http://www.eclipse.org/birt/phoenix/
6.2 Case study: Web-publishing with BIRT
This section provides an example of a BIRT-based reporting solution that is based on a real-life client scenario. We discuss the following topics:
� Client scenario and requirements� Our lab environment� The developed solution
6.2.1 Client scenario and requirements
In this case study, we make the following assumptions:
� Tivoli Monitoring V6.1 is installed and operational� The data warehouse database is created and populated� The monitoring agents are active and are collecting data
The client requirements, in terms of reporting capabilities, are:
� Possibility to define relative time slots filters: for example, last 24 hours, last week
� Possibility to define reports for a group of servers (and not all)
� Report generation must be scheduler-based; preferred output format is: PDF, HTML
Chapter 6. OPAL solutions and reporting with BIRT 391

6.2.2 Our lab environment
Our test environment consists of three machines, as shown in Figure 6-1.
Figure 6-1 Our test environment
The warehouse database resides on an IBM DB2 Universal Database 8.1.2, and the chosen Application Server is an Apache Tomcat 5.5.20 with Java Developer Kit 1.4. See the Apache Tomcat Web site for specific installation instructions:
http://tomcat.apache.org/index.html
6.2.3 The developed solution
To meet the client’s requirements, we create four BIRT reports, based on UNIX disks, Linux CPU, DB2 table spaces, Tivoli Enterprise Console throughput, and Tivoli Storage Manager usage data.
JavaApplication
Server
desktop PCMicrosoft Windows 2000
berlin.itsc.austin.ibm.comMicrosoft Windows 2003 Server AE
Warehouse
oslo.itsc.austin.ibm.comGNU/Linux 2.6.5-7.97
Birt Report Designer
392 Tivoli Management Services Warehouse and Reporting

Table 6-1 shows the five sample reports.
Table 6-1 Sample reports
To manage timestamp/data selection and visualization, we also developed two specific DB2 functions.
In the following section, we provide detailed instructions to install the BIRT environment, create the DB2 functions, and create the BIRT reports.
Installing the BIRT DesignerYou can install BIRT with existing Eclipse installations. If you currently do not have Eclipse installed or want to have a separate Eclipse installation for BIRT, follow these instructions. All the software you require can be downloaded from:
http://download.eclipse.org/birt/downloads
1. Get the Report Designer Full Eclipse Installation file (Eclipse SDK), extract the package eclipse-SDK-3.2.1-win32.zip, and place it where you want (for example C:\Program Files).
2. Download itext-1.3.jar file and copy it to the directory $INSTALL_DIR\eclipse\plugins\com.lowagie.itext\lib.
Report description Report name Layout type
Detailed CPU usage per host CPU Usage per host Bar chart and table
Daily system disks usage Disk Usage Table
DB2 table spaces usage DB2 Tablespaces Table and line chart
Tivoli Enterprise Console throughput TEC Throughput Line chart
Tivoli Storage Manager usage TSM Usage Bar chart
Note: If you want to implement these scenarios, you can download the rpt design files that we used in our case study from the International Technical Support Organization (ITSO) Web site. For downloading instructions, see Appendix B, “Additional material” on page 521.
Chapter 6. OPAL solutions and reporting with BIRT 393

Installing the BIRT Report ViewerThe BIRT Report Viewer is an applet, which you can use to view reports without having to install the full designer.
1. Get the Report Engine installation file and place it in following directory:
$TOMCAT_INSTALL/webapps/
2. Download itext-1.3.jar file and copy it to the following directory:
$BIRT_INSTALL/WEB-INF/platform/plugins/com.lowagie.itext/lib
Installing the JDBC driversTo connect to the warehouse database, it is necessary to download some Java Database Connectivity (JDBC) drivers (db2jcc.jar and db2jcc_license_cu.jar). In our example, we used IBM DB2 Drivers for JDBC and SQLJ. These drivers can be downloaded from the following Web site:
https://www14.software.ibm.com/webapp/iwm/web/reg/download.do?source=swg-dm-db2jdbcdriver&S_PKG=dl&S_TACT=dm-db2jdbcdriver&lang=it_IT&cp=UTF-8
Setting up drivers for the BIRT DesignerUse the data source editor’s JDBC driver management wizard.
1. To start the wizard, open a BIRT report design, go to the Data Explorer view.
2. Right-click Data Sources and select New Data Source.
3. Choose JDBC Data Source and click Next.
4. In the new dialog box, choose Manage Drivers.
5. This opens the Manage JDBC Drivers dialog box. In the JAR Files tab, click Add to add the JAR file required by your JDBC driver. Go to the Driver tab to confirm that the list of drivers includes the new drivers that are added.
You might also want to assign a display name and URL template for the new drivers in this tab.
Setting up drivers for BIRT ViewerCopy or link the jar files to the following directory:
$BIRT_INSTALL/WEB-INF/platform/plugins/org.eclipse.birt.report.data.oda.jdbc
Creating specific DB2 functionsTo translate the format of the Timestamp field of IBM Tivoli Monitoring tables in a human-readable format, we develop a specific function. See Example 6-1. In this case, follow the SQL statements that are used.
394 Tivoli Management Services Warehouse and Reporting

Example 6-1 Defining DB2 function TWH_TIMESTAMP_FMT
-- This function translate the Timestamp field of ITM tables-- in an human-readable format. E.g-- From : 1061003161020000-- To : 20061003:1610:20000--CREATE FUNCTION TDW_TIMESTAMP_FMT (PARAM VARCHAR(16))RETURNS VARCHAR(20)RETURN '20' || substr(PARAM,2,6) || ':' || substr(PARAM,8,4) || ':' || substr(PARAM,12,5);
We also require three other functions that can manage relative time slots filters (for example, Last week, Last month, and so on). See Example 6-2.
Example 6-2 Defining DB2 functions FIRST_DAY and LAST_DAY
-- Functions first_day and last_day-- based on current date and the input parameter returns a date in char(16) format---- List of possible input parameter :---- L7 Last seven days-- LW Last week-- L14 Last 14 days-- L2W Last two weeks-- L30 Last 30 days-- LM Last month-- L60 Last 60 days-- L2M Last two months-- YTD Year to date-- LY Last year---- The function in DATE_2_TDW_TS convert the date from ITM format CYYMMDDtimestamp
CREATE FUNCTION DATE_2_TDW_TS (PARAM DATE)RETURNS CHAR(16)RETURN ('1' || SUBSTR(CHAR(PARAM,ISO),3,2) || SUBSTR(CHAR(PARAM,ISO),6,2) || SUBSTR(CHAR(PARAM,ISO),9,2) || '000000000');
Chapter 6. OPAL solutions and reporting with BIRT 395

CREATE FUNCTION FIRST_DAY (PARAM VARCHAR(6)) RETURNS CHAR(16) LANGUAGE SQL NO EXTERNAL ACTION DETERMINISTIC RETURN SELECT CASE WHEN PARAM='L7' THEN DATE_2_TDW_TS(current date - 7 DAYS) WHEN PARAM='LW' THEN DATE_2_TDW_TS(current date - (DAYOFWEEK(current date) + 6) DAYS) WHEN PARAM='L14' THEN DATE_2_TDW_TS(current date - 14 DAYS) WHEN PARAM='L2W' THEN DATE_2_TDW_TS(current date - (DAYOFWEEK(current date) + 13) DAYS) WHEN PARAM='L30' THEN DATE_2_TDW_TS(current date - 30 DAYS) WHEN PARAM='LM' THEN DATE_2_TDW_TS(current date - 1 MONTH - DAY(current date) DAYS +1 DAY) WHEN PARAM='L60' THEN DATE_2_TDW_TS(current date - 60 DAYS) WHEN PARAM='L2M' THEN DATE_2_TDW_TS(current date - 2 MONTH - DAY(current date) DAYS +1 DAY) WHEN PARAM='YTD' THEN DATE_2_TDW_TS(current date - (DAYOFYEAR(current date) -1) DAYS) WHEN PARAM='LY' THEN DATE_2_TDW_TS(current date - 1 YEAR - (DAYOFYEAR(current date) -1) DAYS) END FROM sysibm.sysdummy1;
CREATE FUNCTION LAST_DAY (PARAM VARCHAR(6)) RETURNS CHAR(16) LANGUAGE SQL NO EXTERNAL ACTION DETERMINISTIC RETURN SELECT CASE WHEN PARAM IN ('L7','L14','L30','L60','YTD') THEN DATE_2_TDW_TS(current date) WHEN PARAM='LW' THEN DATE_2_TDW_TS(current date - DAYOFWEEK(current date) DAYS) WHEN PARAM='L2W' THEN DATE_2_TDW_TS(current date - DAYOFWEEK(current date) DAYS)
396 Tivoli Management Services Warehouse and Reporting
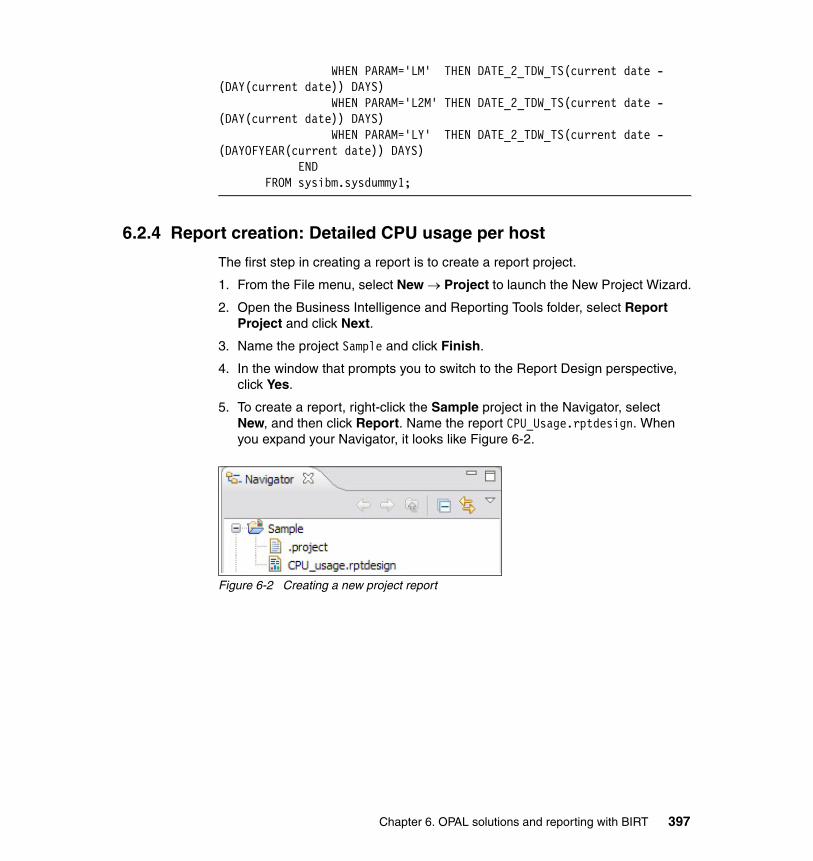
WHEN PARAM='LM' THEN DATE_2_TDW_TS(current date - (DAY(current date)) DAYS) WHEN PARAM='L2M' THEN DATE_2_TDW_TS(current date - (DAY(current date)) DAYS) WHEN PARAM='LY' THEN DATE_2_TDW_TS(current date - (DAYOFYEAR(current date)) DAYS) END FROM sysibm.sysdummy1;
6.2.4 Report creation: Detailed CPU usage per host
The first step in creating a report is to create a report project.
1. From the File menu, select New → Project to launch the New Project Wizard.
2. Open the Business Intelligence and Reporting Tools folder, select Report Project and click Next.
3. Name the project Sample and click Finish.
4. In the window that prompts you to switch to the Report Design perspective, click Yes.
5. To create a report, right-click the Sample project in the Navigator, select New, and then click Report. Name the report CPU_Usage.rptdesign. When you expand your Navigator, it looks like Figure 6-2.
Figure 6-2 Creating a new project report
Chapter 6. OPAL solutions and reporting with BIRT 397

Creating a new data sourceCreate a data source that tells BIRT how to connect to the database. To do so, perform the following steps:
1. In the Data Explorer, right-click Data Sources and click New Data Source.
2. Click JDBC Data Source and name it Sample Data Source. Click Next, as shown in Figure 6-3.
Figure 6-3 Creating a new data source
3. In the resulting page (Figure 6-4), specify the connection string for the data source:
a. Select the driver class com.ibm.db2.jcc.DB2Driver (v2.9).
b. Type the database URL in the format jdbc:db2://hostname:port/dbname (in our environment, it is jdbc:db2://berlin.itsc.austin.ibm.com:50000/warehous).
c. Type your RDBMS user ID and password and test the connection.
d. When the test is successful, click Finish.
398 Tivoli Management Services Warehouse and Reporting

Figure 6-4 Defining a new data source
Creating a new data setTo display data from the data source on the report, you must create data sets for it. A data set represents the data that is available from the database to be put on the report. You can have many data sets for one data source. If your reports are talking to several databases, each one will be a data source, and each query that you want displayed on the report will be a data set for that data source.
To create a data set, perform the following steps:
1. In the Data Explorer, right-click Data Sets and click New Data Set.
2. The New Data Set window opens, as shown in Figure 6-5.
a. Give a name to the new data set (for example, Linux_CPU). b. In the Data Source field, select the newly created data source. c. In the Data Set Type field, select SQL Select Query. d. Click Next.
Chapter 6. OPAL solutions and reporting with BIRT 399

Figure 6-5 Creating a new data set
3. Define an SQL query in the window shown in Figure 6-6. In the right pane of the window, enter the SQL statements or you can compose it by selecting the required tables and fields from the left pane.
Note: Query builder is not fully compatible with the way IBM Tivoli Monitoring set up the warehouse database. The name of the table and the fields has to be in quotation marks, as shown in Figure 6-6.
400 Tivoli Management Services Warehouse and Reporting

In this example, the user-defined db2 function TWH_TIMESTAMP_FMT translates the Timestamp field to a human-readable format. For specific SQL statements that are used to define the functions, see “Creating specific DB2 functions” on page 394.
After you define the function and the query, click Finish.
Figure 6-6 Defining a data set query
Chapter 6. OPAL solutions and reporting with BIRT 401

4. In the left pane of the window, click Preview Results. You see the output of the query, as shown in Figure 6-7. Now you are ready to put the dynamic content into the report.
Figure 6-7 Previewing results
Creating the new report parametersYou can use BIRT report parameters to interactively filter the report’s data to gain deeper insights. To do this, perform the following steps:
1. In the Data Explorer pane, right-click Report Parameters and select New Parameter.
2. The New Parameter window opens, as shown in Figure 6-8. In this widow, you can specify the following basic properties:
– Name: Type a name for the parameter. If you do not specify a value for Prompt text, the report user sees the Name value as the prompt. It is good practice to supply an easily understood name for the parameter in Prompt text and use the suffix Par for the value that you select for Name to help distinguish report parameters from other parameter types, such as data set parameters.
– Type: Select a data type for the parameter. The data type that you select does not have to match the data type of the field in the data source. The data type that you select for the report parameter determines the
402 Tivoli Management Services Warehouse and Reporting
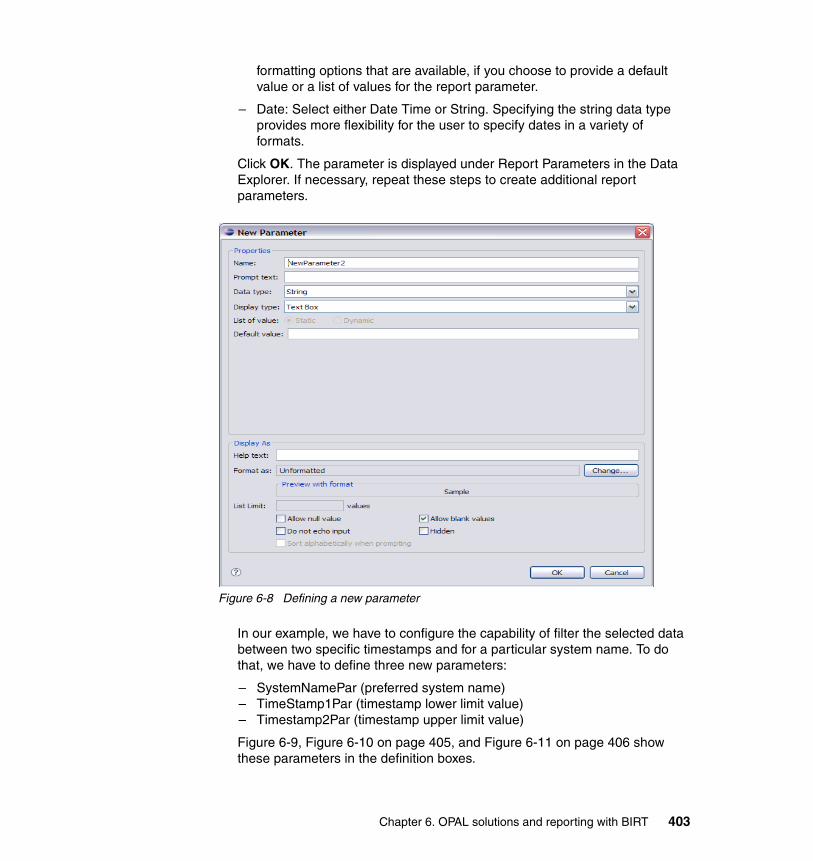
formatting options that are available, if you choose to provide a default value or a list of values for the report parameter.
– Date: Select either Date Time or String. Specifying the string data type provides more flexibility for the user to specify dates in a variety of formats.
Click OK. The parameter is displayed under Report Parameters in the Data Explorer. If necessary, repeat these steps to create additional report parameters.
Figure 6-8 Defining a new parameter
In our example, we have to configure the capability of filter the selected data between two specific timestamps and for a particular system name. To do that, we have to define three new parameters:
– SystemNamePar (preferred system name)– TimeStamp1Par (timestamp lower limit value)– Timestamp2Par (timestamp upper limit value)
Figure 6-9, Figure 6-10 on page 405, and Figure 6-11 on page 406 show these parameters in the definition boxes.
Chapter 6. OPAL solutions and reporting with BIRT 403

Figure 6-9 shows the SystemNamePar parameter definition.
Figure 6-9 Defining the parameter SystemNamePar
404 Tivoli Management Services Warehouse and Reporting

Figure 6-10 shows the Timestamp1Par parameter definition.
Figure 6-10 Defining the parameter Timestamp1Par
Chapter 6. OPAL solutions and reporting with BIRT 405

Figure 6-11 shows the Timestamp2Par parameter definition.
Figure 6-11 Defining the parameter Timestamp2Par
406 Tivoli Management Services Warehouse and Reporting
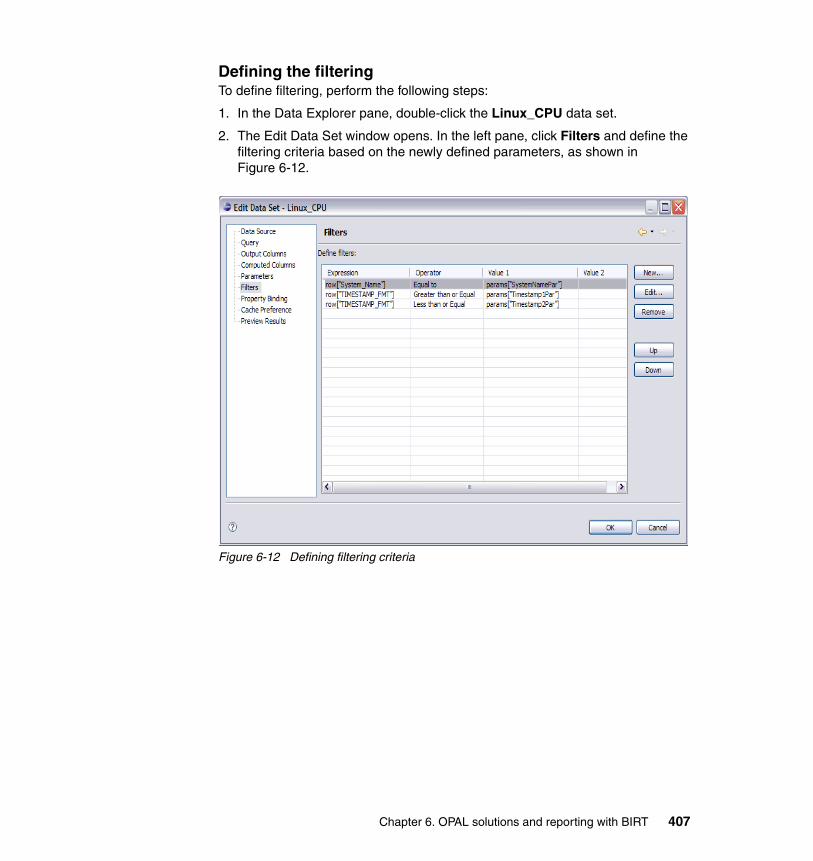
Defining the filteringTo define filtering, perform the following steps:
1. In the Data Explorer pane, double-click the Linux_CPU data set.
2. The Edit Data Set window opens. In the left pane, click Filters and define the filtering criteria based on the newly defined parameters, as shown in Figure 6-12.
Figure 6-12 Defining filtering criteria
Chapter 6. OPAL solutions and reporting with BIRT 407

3. This filtering definition produces a runtime dialog box at report execution, as shown in Figure 6-13. The default values are shown. You can confirm these default values or choose different ones using the text box or with the dynamic list box selections.
Figure 6-13 Parameter dialog box
408 Tivoli Management Services Warehouse and Reporting

Defining the report layoutDrag-and-drop the Linux_CPU data set from the Data Explorer pane to the CPU_Usage.rptdesign pane, and you can obtain a basic table layout, as shown in Figure 6-14. Click the Preview tab to visualize your query.
Figure 6-14 Defining a simple table layout
You see the output shown in Figure 6-15.
Figure 6-15 Previewing query result
Chapter 6. OPAL solutions and reporting with BIRT 409

BIRT Reporting Interface offers various capabilities of report and chart design and configuration. Figure 6-16 shows an example of a bar chart report representation of the extracted data.
Figure 6-16 Bar chart representation
410 Tivoli Management Services Warehouse and Reporting

6.2.5 Report creation: Disk usage
After reading the previous example, we assume that you are now familiar with major BIRT concepts. Therefore, we provide only a high-level overview of our next report creation. The scope of this report is to show the capability to define relative time slot filters and data for a specific group of servers.
Data set definitionThe date range is delimited by the values returned by the DB2 functions FIRST_DAY and LAST_DAY. In our example, the parameter LW filters the data from last Sunday to last Saturday. See Figure 6-17. For specific SQL statements that are used to define the functions, see “Creating specific DB2 functions” on page 394.
Figure 6-17 Data set definition
Chapter 6. OPAL solutions and reporting with BIRT 411

Defining the parametersTo filter data for a specific group of systems, define two parameters that are subsequently applied.
SystemNamePar parameter enables a radio button menu that permits selections between a static list of specified system names or the wildcard character (%), as shown in Figure 6-18.
Figure 6-18 Defining the system name parameter
412 Tivoli Management Services Warehouse and Reporting

Note the difference between the Value and Display Text columns. The Value column represents the real filter value in SQL statements. The Display Text column is the text that is displayed to the user, as shown in Figure 6-19.
Figure 6-19 Defining the system pattern parameter
The SystemPatternPar parameter enables a text box menu that you can use to specify a specific string or pattern.
Chapter 6. OPAL solutions and reporting with BIRT 413

Data set filteringTo perform data set filtering, select the Filters menu, as shown in Figure 6-20.
Figure 6-20 Defining filters
414 Tivoli Management Services Warehouse and Reporting

Based on the parameters definitions, we have to define the two filters’ criteria, which are subsequently applied to the data set. Therefore, the final result is a parameter dialog box similar to Figure 6-21.
Figure 6-21 Runtime parameter box
Figure 6-22 shows a report layout sample.
Figure 6-22 Report layout
Chapter 6. OPAL solutions and reporting with BIRT 415

6.2.6 Report creation: DB2 table spaces
The aim of this report is to show the table spaces usage history for a given database and for a particular day and group of table spaces.
Data set definitionIn this example, the user-defined DB2 function TWH_TIMESTAMP_FMT translates the Timestamp field to a human-readable format. See Figure 6-23. For specific SQL statements that are used to define the functions, see “Creating specific DB2 functions” on page 394.
Figure 6-23 Data set definition
Defining the parametersIn our example, we configured the capability of filtering the selected data for a specific timestamp and for a particular table space pattern (for example, ITM%).
416 Tivoli Management Services Warehouse and Reporting

In Figure 6-24 and Figure 6-25 on page 418, these parameters are shown in the definition boxes. Figure 6-24 shows the timestamp parameter definition.
Figure 6-24 Timestamp parameter definition
Chapter 6. OPAL solutions and reporting with BIRT 417

Figure 6-25 shows the table space parameter definition.
Figure 6-25 Table space parameter definition
Data set filteringFor data set filtering, perform the following steps
1. In the Data Explorer pane, double-click the Linux_CPU data set.
2. The Edit Data Set window opens, as shown in Figure 6-26. In the left pane, click Filters and define the filtering criteria based on the newly defined parameters (Figure 6-18 on page 412 and Figure 6-19 on page 413).
418 Tivoli Management Services Warehouse and Reporting

Figure 6-26 Filtering values
This filtering definition produces a runtime dialog box at report execution, as shown in Figure 6-27. The default values are shown. You can confirm these default values or choose different ones using the text box or with the dynamic list box selections.
Figure 6-27 Runtime parameter window
Chapter 6. OPAL solutions and reporting with BIRT 419

Sample layoutBy combining a table chart and a line chart on the same layout, the report shown in Figure 6-28 is produced.
Figure 6-28 Report layout
420 Tivoli Management Services Warehouse and Reporting

6.2.7 Report creation: Tivoli Enterprise Console throughput
The goal of this report is to show the quantity of event that is processed and received by the IBM Tivoli Enterprise Console in a given time slot period.
Data set definitionThe date range is delimited by the values returned by the DB2 functions FIRST_DAY and LAST_DAY. In our example, the parameter LW filters the data from last Sunday to last Saturday. See Figure 6-29. For specific SQL statements that are used to define the functions refer to the section “Creating specific DB2 functions” on page 394.
Figure 6-29 Data set definition
Chapter 6. OPAL solutions and reporting with BIRT 421

Sample layoutBy combining two line charts on the same layout, the report shown in Figure 6-30 is produced.
Figure 6-30 Tivoli Enterprise Console throughput report
6.2.8 Report creation: Tivoli Storage Manager usage
The goal of this report is to show the amount of data that is saved by Tivoli Storage Manager for a specific group of nodes on a particular date.
Data set definitionIn our example, in the Data Set Definition panel, we filtered the data on a particular group of nodes (see the WHERE clause in Figure 6-31).
422 Tivoli Management Services Warehouse and Reporting
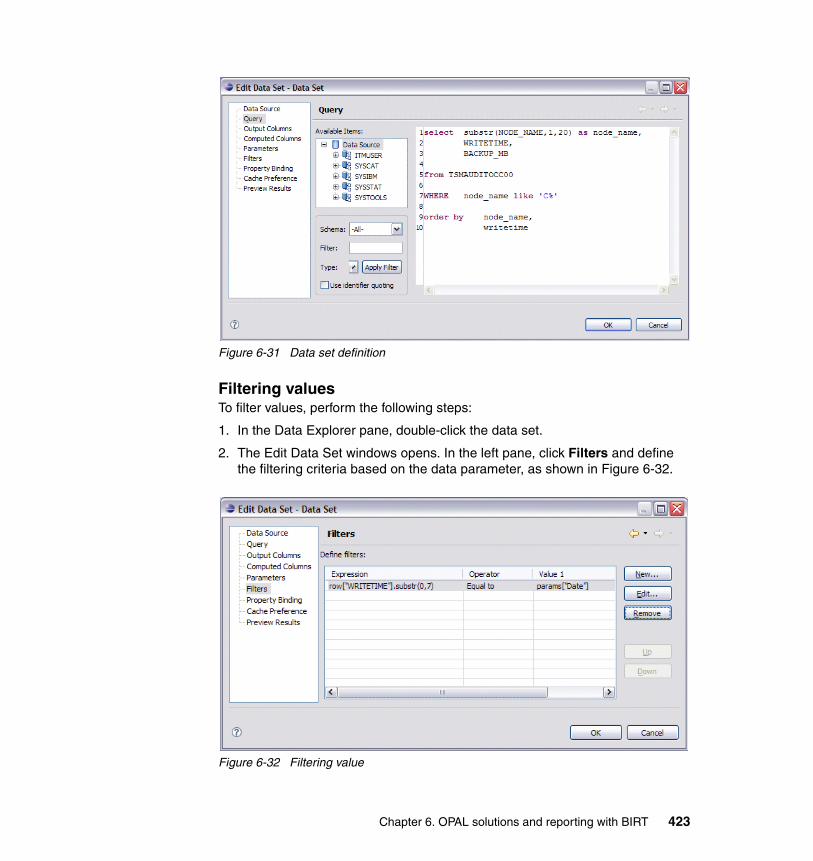
Figure 6-31 Data set definition
Filtering valuesTo filter values, perform the following steps:
1. In the Data Explorer pane, double-click the data set.
2. The Edit Data Set windows opens. In the left pane, click Filters and define the filtering criteria based on the data parameter, as shown in Figure 6-32.
Figure 6-32 Filtering value
Chapter 6. OPAL solutions and reporting with BIRT 423

Sample layoutBy combining the NODE_NAME and BACKUP_KB fields on a table chart, the report shown in Figure 6-33 is produced.
Figure 6-33 Tivoli Storage Manager usage sample layout
6.2.9 Publishing results
You can publish the generated report (.rptdesign file) on your application server. Rptdesign files are located by default in your BIRT Report Designer machine under the directory C:\Documents and Settings\Administrator\workspace.
To publish the report to the application server, copy the .rptdesign file from the desktop where it was designed, to the report directory of the application server. By default, this is the directory where BIRT is installed.
You can view the report by accessing the following link using a Web browser
http://applicationserver:8080/birt/frameset?__report=reportname
424 Tivoli Management Services Warehouse and Reporting

6.2.10 How to schedule a report
You can schedule your report creation at a specific point in time and produce an output that can be placed in a specific directory. This enables users to download reports and view them when they are offline. To do this, you can use the wget command and schedule it in crontab.
In the following example, we use the wget command to produce a report output in HTML format:
wgethttp://applicationserver:8080/birt/run?__report=reportname&__format=format -O filename
Chapter 6. OPAL solutions and reporting with BIRT 425

426 Tivoli Management Services Warehouse and Reporting

Chapter 7. Reporting with Crystal Reports
This chapter describes the best practices for creating Tivoli Data Warehouse reports using the Crystal Reports product from Business Objects.
Note that because Tivoli Data Warehouse data is stored in a relational database management system (RDBMS) database, you have a lot of flexibility in selecting the reporting software to use. Apart from the solutions presented in Chapter 6, “OPAL solutions and reporting with BIRT” on page 387, you can also use any third-party reporting solution to create reports against the Tivoli Data Warehouse data. As an example, we discuss Crystal Reports solution in this chapter.
This chapter discusses the following topics:
� “Crystal Reports” on page 428
� “The developed solution” on page 428
7
© Copyright IBM Corp. 2007. All rights reserved. 427

7.1 Crystal Reports
Crystal Reports is a third-party tool, which you can use to develop reports from your Tivoli Data Warehouse. The report file format is .rpt. You require a licensed copy of the software to use it. For more information, see the following Web site:
http://www.businessobjects.com/products/reporting/crystalreports
We describe a few ways in which you can create a report in Crystal Reports. The version used is Crystal Reports XI. However, we do not cover the usage and availability of Crystal Reports for Eclipse.
Crystal Reports is a free Eclipse plug-in, which you can use to create reports and embed them into your Java applications. It is an add-in that has the capabilities of auto-generating SQL, adding .rpt files to an enterprise platform (.NET, COM, Java), and free form editing of reports, among others. For more information, see the following Web site:
http://www.eclipseplugincentral.com/Web_Links-index-req-viewlink-cid-670.html
7.2 The developed solution
As part of an effort to develop a solution that is relevant to you as a client, we demonstrate how to create useful sample reports for you, based on Linux CPU and UNIX Disks data.
Table 7-1 lists the two sample reports.
Table 7-1 Sample reports
Report title Report description Warehouse tables
CPU Usage by Host Detailed CPU usage by host Linux CPU
Disk Usage Daily system Disk Usage UNIX Disks
Note: It is essential for reporting to be familiar with the tables and their purposes to create more valuable reports. You require this knowledge to create other reports and know the meaning of fields in the existing tables of the warehouse.
428 Tivoli Management Services Warehouse and Reporting

7.2.1 Installing Crystal Reports XI Release 2
You require an authorized copy of the software to be able to use this. See your product’s documentation for more specific details on the following Web site:
http://support.businessobjects.com/documentation/product_guides/default.asp
After you install Crystal Reports on your machine, you can create database connections to the warehouse. The following section provides detailed instructions to create database connections through DB2 Native or Open Database Connectivity (ODBC).
7.2.2 Creating a database connection
There are two options for creating a database connection in your local machine where Crystal Reports and DB2 clients are installed:
� Native DB2: This is directly available in Crystal Reports.
� ODBC: This is found as an administrative tool for Windows environment.
To create a database connection, perform the following steps:
1. Select Settings → Control Panel → Administrative Tools → Data Sources (ODBC).
2. Select the Systems DSN tab. Click Add.
Tip: Most of the tables in the warehouse are designed to have the details required in a single table.
Chapter 7. Reporting with Crystal Reports 429

3. Select IBM DB2 ODBC Driver, and click Finish, as shown in Figure 7-1.
Figure 7-1 Selecting IBM DB2 ODBC Driver
4. Enter the appropriate information for Data source name and Database alias. See Figure 7-2. Click the Add button on the right.
Figure 7-2 Creating ODBC connection
430 Tivoli Management Services Warehouse and Reporting

5. Enter the connection information as shown in Figure 7-3 and Figure 7-4 on page 432.
Figure 7-3 Data Source tab
Chapter 7. Reporting with Crystal Reports 431

After you enter the information, click OK.
Figure 7-4 TCP/IP tab
432 Tivoli Management Services Warehouse and Reporting

Your connection is created like the one shown in Figure 7-5.
Figure 7-5 Successful creation of an ODBC data source
7.2.3 Creating a data source in the report
After you establish a database connection between your local machine and the warehouse, you must let Crystal Reports know your data source.
When you choose to create a new report, a prompt opens and you have to select the data source. You can either select DB2 Unicode or ODBC (RDO), depending on what you chose early on.
Tip: It is a good practice to have consistent data source name (DSN) throughout machines accessing the reports for the same connection. This is to avoid remapping or re-creating database connections in various environments.
Note: Each report requires you to define the data source.
Chapter 7. Reporting with Crystal Reports 433

DB2 UnicodeTo set up the DB2 connection information, perform the following steps:
1. Double-click DB2 Unicode to select this as data source, as shown in Figure 7-6.
Figure 7-6 Selecting DB2 Unicode
434 Tivoli Management Services Warehouse and Reporting

2. Enter the connection information and click Finish, as shown in Figure 7-7.
Figure 7-7 Entering the connection information
Chapter 7. Reporting with Crystal Reports 435

Figure 7-8 shows the successful creation of a native DB2 data source named WAREHOUS.
Figure 7-8 Successful creation of a native DB2 data source named WAREHOUS
436 Tivoli Management Services Warehouse and Reporting

ODBC (RDO)After you create an ODBC connection between your local machine and the warehouse, you have to let Crystal Reports know that this connection exists by identifying it.
1. Select ODBC (RDO) in the window shown in Figure 7-6 on page 434.
2. The ODBC (RDO) window opens, as shown in Figure 7-9. Select the DSN that you created previously.
Figure 7-9 Selecting the DSN that you previously created
Chapter 7. Reporting with Crystal Reports 437

3. Enter the connection information, and click Finish, as shown in Figure 7-10.
Figure 7-10 Entering the connection information
438 Tivoli Management Services Warehouse and Reporting

Figure 7-11 shows the successful creation of an ODBC data source named ITM_reporting.
Figure 7-11 Successful creation of an ODBC data source named ITM_reporting
Tip: After you create your connection, you might want to add it to Favorites. To do this, right-click the connection and select Add to Favorites. This makes your data connection easily accessible.
Chapter 7. Reporting with Crystal Reports 439

7.2.4 Report creation: CPU Usage by Host
In this section, we create a sample report titled CPU Usage by Host.
1. As a continuation after you select a data source (which is a particular warehouse), select the specific table that you want to report from. In this case, select Linux_CPU, as shown in Figure 7-12. Click Next.
Figure 7-12 Expanding tables and selecting Linux_CPU
440 Tivoli Management Services Warehouse and Reporting

2. The window shown in Figure 7-13 opens. Select the fields that you want to display in your report and click Next.
Figure 7-13 Selecting the fields that you want to display in your report
Chapter 7. Reporting with Crystal Reports 441

3. Select the grouping that you want in your report and the sort order, as shown in Figure 7-14. Click Next.
Figure 7-14 Selecting the grouping and sort order
442 Tivoli Management Services Warehouse and Reporting

4. The window shown in Figure 7-15 opens. Select the metrics to be summarized and the aggregation type. Click Next.
Figure 7-15 Selecting the metrics to be summarized and selecting the aggregation type
Chapter 7. Reporting with Crystal Reports 443

5. The group sorting window opens, as shown in Figure 7-16. The grouping order shows three options: None, Top 5 groups, Bottom 5 groups. Select the kind of group ordering that you want and click Next.
Figure 7-16 Group sorting
444 Tivoli Management Services Warehouse and Reporting

6. The chart option window opens, as shown in Figure 7-17. Select the kind of chart that you want and select the appropriate fields. Click Next.
Figure 7-17 Selecting chart options
Chapter 7. Reporting with Crystal Reports 445

7. The window shown in Figure 7-18 opens. Do not set any filter this time. Click Next.
Figure 7-18 Record Selection window
446 Tivoli Management Services Warehouse and Reporting

8. In the window shown in Figure 7-19, you can select No Template for default or select your own template. Click Finish.
Figure 7-19 Selecting the template for the report
Chapter 7. Reporting with Crystal Reports 447

You can see the report that is created, as shown in Figure 7-20.
Figure 7-20 Automatically generated report
The chart in the report is automatically drillable to each SYSTEM_NAME, where a more detailed report of each system is shown under the appropriate system name.
In this case, the TIMESTAMP field is not in a human-readable format, therefore we have to convert this field to a more meaningful and useful field.
Converting TIMESTAMP fieldAt this point, you have created a simple report. To do further reporting based on date, you have to convert the string field TIMESTAMP into a human-readable string or a datetime field.
There are two options for converting the fields in Crystal Reports: One is by creating a Formula Field and the other is SQL Expression Field. The main
448 Tivoli Management Services Warehouse and Reporting

difference between these two is that SQL Expression Field uses database syntax, and Formula Field uses Basic and Crystal Syntax to do more dynamic data manipulation.
In this specific instance, we recommend that you use the SQL Expression Field to create the new TIMESTAMP fields. This will use Crystal Reports’ ability to process data in a page on-demand basis.
To create a new SQL Expression Field, perform the following steps:
1. Select View and select Field Explorer.
2. The window shown in Figure 7-21 opens. Right-click SQL Expression Fields and select New.
Figure 7-21 Selecting new SQL Expression Field
3. Select SQL Expression Fields and enter an SQL that:
a. Converts the string field TIMESTAMP into a human-readable format string
You can use the following sample syntax to convert the TIMESTAMP field into a readable format. This syntax translate the TIMESTAMP field to a human-readable format.
From: 1061024164012000
To: 20061024:1640:12000
'20' || substr("Linux_CPU"."Timestamp",2,6) || ':' || substr("Linux_CPU"."Timestamp",8,4) || ':' || substr("Linux_CPU"."Timestamp",12,5)
b. Converts the string field TIMESTAMP into a datetime
Chapter 7. Reporting with Crystal Reports 449

You can use the following sample syntax to convert the TIMESTAMP field into datetime format. This syntax translate the TIMESTAMP field to datetime format:
From: 1061024164012000
To: 20061024164012 (System default: “10/24/2006 4:40:12PM”)
timestamp('20' || substr("Linux_CPU"."Timestamp",2,6) || substr("Linux_CPU"."Timestamp",8,6) )
After you create these SQL Expression Fields, as shown in Figure 7-22, you can dynamically use these fields according to your requirements.
Depending on what you want to do with TIMESTAMP, a datetime or a string field can prove to be more beneficial. If you want to automatically aggregate or group the field by day, hour, week, and so on, the datetime field does it automatically for you. Alternatively, if want the report to treat your data as is, a string field is more convenient in this case.
Figure 7-22 Two SQL Expression Fields created: Timestamp, Timestamp_STR
450 Tivoli Management Services Warehouse and Reporting

4. Replace the database field Linux_CPU.Timestamp with the SQL expression %Timestamp in the report details. You see the automatic conversion into system default format for datetime, as shown in Figure 7-23.
Figure 7-23 Timestamp as a datetime field automatically formatted into system default format
Adding a filter or a parameter in Crystal ReportsAfter you create the SQL Expression Fields, %Timestamp and %Timestamp_STR, you can now use these as filters or parameters in the report. Filters and Parameters limit the number of records returned to the client while running the report. Filters are defined by the report designers, but the parameters’ value is an input from the user.
In this specific sample, use a filter that limits the record selection to LastFullMonth.
Chapter 7. Reporting with Crystal Reports 451

1. To do this, select Report in the menu and select Select Expert, as shown in Figure 7-24.
Figure 7-24 Filtering record selection using Select Expert to pick the fields to filter
452 Tivoli Management Services Warehouse and Reporting

2. Under Report Fields, select %Timestamp, as shown in Figure 7-25.
Figure 7-25 Selecting Timestamp SQL Expression Field
3. In the Select Expert window, select is in the period and LastFullMonth, as shown in Figure 7-26.
Figure 7-26 %Timestamp is in the period LastFullMonth
This limits the record selection based on the datetime SQL Expression Field %Timestamp LastFullMonth.
Chapter 7. Reporting with Crystal Reports 453

You can find other Crystal built-in time-related commands in help, categorized under Date Ranges Functions, as shown in Figure 7-27.
Figure 7-27 Date ranges functions available in Crystal Reports XI
Showing SQL of the reportTo check and make sure that the data you are selecting is appropriate, you can o check the SQL used by the report. Select Database in the menu and select Show SQL Query. The Show SQL Query opens, as shown in Figure 7-28.
454 Tivoli Management Services Warehouse and Reporting

Figure 7-28 SQL Query of the report
Inserting a group in Crystal ReportsGroups make a report more meaningful by aggregating data in certain ways. In this case, it makes sense to group the data by Linux_CPU.System_Name.
1. To insert a group, click Insert and select Group, as shown in Figure 7-29.
Figure 7-29 Inserting a group in the report
Chapter 7. Reporting with Crystal Reports 455

2. Select a field for grouping, and then select the sort order, as shown in Figure 7-30.
Figure 7-30 Selecting a field for grouping and the sort order
By this time, you have learned how to manually insert a group. You can insert groups as required for your report.
Creating a chartCharts are visual illustration of how your data looks like. These can be dynamically created and tailored based on how you want to see the data. In this example, we create a chart to show %Timestamp_STR on the x-axis and metrics such as User_CPU, Sytem_CPU, and Wait_IO_CPU on the y-axis.
We use %Timestamp_STR to show each interval as it is in the warehouse. We do not want Crystal Reports to recognize it as a datetime or convert to a datetime field. In some cases, it is useful to use the %Timestamp, a datetime field, to do aggregations daily, weekly, monthly, quarterly, or yearly.
1. To insert a chart, click Insert and select Chart. Place this chart in GroupHeader1 area of the Design tab as shown in Figure 7-31.
456 Tivoli Management Services Warehouse and Reporting

Figure 7-31 Group Header #1 area on the right side of the window
2. The Chart Expert window opens. In the Type tab, select Stacked Bar Chart. In the Data tab, select %Timestamp_STR and the appropriate metrics, as shown in Figure 7-32. Click OK.
Figure 7-32 Chart Expert showing %Timestamp_STR and metrics
Chapter 7. Reporting with Crystal Reports 457

Your chart is displayed in the Preview tab, as shown in Figure 7-33.
Figure 7-33 Bar chart representation of data
458 Tivoli Management Services Warehouse and Reporting

7.2.5 Report creation: Disk Usage
In this section, we create a sample report titled Disk Usage.
1. From File → New → Standard Report, you can start to create a new report. Select your data source. For this particular report, we select Disk_D under Tables, as shown in Figure 7-34.
Figure 7-34 Selecting table Disk_D for this report
Chapter 7. Reporting with Crystal Reports 459

2. Select the fields that you want to show in the Details section of the report, as shown in Figure 7-35. These are the columns that you want to see on each row generated by the report. Click Next.
Figure 7-35 Selecting the fields to show in the report
460 Tivoli Management Services Warehouse and Reporting

3. Select the grouping. In this case, we want the data to be grouped by System_Name, by LAT_Mount_Point, and then by WRITETIME, as shown in Figure 7-36.
We also have to convert the WRITETIME field to a readable format. We do this later when we finish this wizard.
Click Next.
Figure 7-36 Inserting groups and sorting in ascending order
Chapter 7. Reporting with Crystal Reports 461

4. In the Summarized Fields, ensure that the appropriate aggregations are selected, as shown in Figure 7-37.
Figure 7-37 Selecting appropriate aggregation for the Summarized Fields
462 Tivoli Management Services Warehouse and Reporting

Go through the steps in the wizard and select the appropriate options by clicking Next, Finish, or both. After you complete the steps, a report is automatically created for you, as shown in Figure 7-38.
Figure 7-38 Disk Usage report
5. At this point, we create an SQL Expression Field to convert WRITETIME to a readable format. To convert WRITETIME field, see “Converting TIMESTAMP field” on page 448.
Chapter 7. Reporting with Crystal Reports 463

When this is successfully done, the Field Explorer shows the SQL Expression Fields, as shown in Figure 7-39.
Figure 7-39 Successful creation of Writetime and Writetime_STR
6. You can now replace the WRITETIME database field in the report with %Writetime, as shown in Figure 7-40.
Figure 7-40 Replacing the database field WRITETIME with %Writetime
464 Tivoli Management Services Warehouse and Reporting

To create a manual grouping for %Writetime, see “Inserting a group in Crystal Reports” on page 455.
7. Select %Writetime and select for each day, as shown in Figure 7-41.
Figure 7-41 Selecting %Writetime and for each day
Instead of selecting for each day, you can also select that by week, month, quarter, or year. This adds to the versatility of your report.
To add a chart, see “Creating a chart” on page 456.
Chapter 7. Reporting with Crystal Reports 465

8. In the Chart Expert window, select the group layout and click OK, as shown in Figure 7-42.
Figure 7-42 Selecting group layout
466 Tivoli Management Services Warehouse and Reporting

9. Edit and format the report as required. A sample report is shown in Figure 7-43.
Figure 7-43 Bar chart representation with text details
Chapter 7. Reporting with Crystal Reports 467

Figure 7-44 shows the details of the generated report.
Figure 7-44 Details of the generated report
468 Tivoli Management Services Warehouse and Reporting

The output of the report is a .rpt file. There are a lot of options to export a report, as shown in Figure 7-45.
Figure 7-45 Export dialog box
We created two sample reports that can be useful for you. For more details about creating reports, see your software version’s User’s Guides documented with your product or available online:
http://support.businessobjects.com/documentation/product_guides/default.asp
Chapter 7. Reporting with Crystal Reports 469

470 Tivoli Management Services Warehouse and Reporting

Chapter 8. Troubleshooting
In this chapter, we discuss troubleshooting of various components of the Tivoli Data Warehouse V2.1. We cover the following topics:
� “Warehouse Proxy agent” on page 472
� “Summarization and Pruning agent” on page 475
� “RDBMS troubleshooting” on page 476
8
© Copyright IBM Corp. 2007. All rights reserved. 471

8.1 Warehouse Proxy agent
The best way to troubleshoot any problems with the Warehouse Proxy agent is to check the log files. It might be necessary to increase the trace level of these files to track down the problem:
� Log files
– Warehouse Proxy agent logs
• hostname_hd_nnnnnnnnnn.log (WPA Agent)• hostname_hd_java_nnnnnnn.log (WPA running on AIX or Linux)• hostname_Warehouse.LG0 (Operation log)
– TEMS log
hostname_ms_nnnnnnnn.log
– Agent log
hostname_pc_nnnnnnnn.log
� Trace levels
– Warehouse Proxy agent RAS1 trace
• No error tracing: -none-
• General error tracing: ERROR
• App state tracing: ERROR (UNIT:khdx STATE ERROR)
• App and Framework ops: ERROR (UNIT:khdx STATE ERROR) (UNIT:kra STATE ERROR)
• Detail error tracing: ERROR (UNIT:khd ALL)
• Maximum error tracing: ERROR (UNIT:khd ALL) (UNIT:kra ALL)
• Maximum error tracing for the Java trace: ERROR (UNIT:khdjdbc1 ALL)
– Binary files RAS1 trace
• Location varies depending on how data collection is configured• TEMS: ERROR (UNIT:kpxhsloc ALL) (UNIT:krabhsco ALL)• Agent: ERROR (UNIT:kra ALL)
472 Tivoli Management Services Warehouse and Reporting

8.1.1 Environments with multiple Warehouse Proxy agents
We provide some tasks to ensure that environments with multiple Warehouse Proxy agents work properly:
� Be sure that all Warehouse Proxy agents are configured to use the hub Tivoli Enterprise Monitoring Server as their parent
� If each Warehouse Proxy agent is only assigned a subset of Tivoli Enterprise Monitoring Server instances, then ensure that the KHD_WAREHOUSE_TEMS_LIST variable is correctly set in the ENV file for the Warehouse Proxy agent (khdenv on Windows and hd.ini for Linux or UNIX)
� To decrease the amount of time that it takes for the Warehouse Proxy agent to determine which Tivoli Enterprise Monitoring Server it is associated with (default is one hour), add the KPX_WAREHOUSE_REGCHK variable to the TEMS ENV file and set it to a number less than 60 minutes.
KPX_WAREHOUSE_REGCHK=5
� To verify that the Warehouse Proxy agent registers with the hub and places the correct entries into the global location broker, use the following RAS1 trace settings for the Warehouse Proxy agent:
RAS1= ERROR (UNIT: khdxrpcr STATE)
This setting prints the value of KHD_WAREHOUSE_TEMS_LIST and shows any errors that are associated with its components.
� To determine which Warehouse Proxy a particular Tivoli Enterprise Monitoring Server selects for its agents, enable the following RAS1 trace:
RAS1=ERROR (UNIT: khxrwhpx STATE)
This setting prints entries in the Tivoli Enterprise Monitoring Server RAS log whenever a registration change occurs and indicates the name of the address of the new Warehouse Proxy agent after the change.
8.1.2 Problems and solutions
This section documents some problems and also some steps to determine the cause and the possible solutions.
Chapter 8. Troubleshooting 473

No historical data collectedThe following list provides some of the things to check if historical data is not being populated into the Tivoli Data Warehouse database:
� Check whether the Warehouse Proxy agent is up and running. You can use the Manage Tivoli Enterprise Monitoring Services window for this purpose. If the Warehouse Proxy agent is not working, right-click the Warehouse Proxy agent and choose Start.
� Check the heartbeat event on the TEMS log.
� On Windows, check the Application log in the Event Viewer.
� Check whether the connection to the warehouse DB is up:
– Warehouse Proxy agent log: hostname_hd_nnnnnnnn.log
• Good entry: Using Datasource: “ITM Warehouse” and Connection with Datasource “ITM Warehouse” successful
• Bad entry: Attempt to connect with ODBC Datasource “ITM Warehouse” User “ITMUser” failed!
� If you are expecting data as a result of a specific situation, check that the situation has started.
� Check that the attribute group is configured for data collection and the collection has started.
� Check data insertion into Warehouse table:
– Warehouse Proxy agent Operational Log file: hostname_Warehouse.LG0
� Check for export errors:
– Agent or TEMS log depending on location of history files:
• Good entry: Export Status 0 Received from Server for object <WTMEMORY> and Export request for object <NT_Memory> is successful.
• Bad entry: Export for object <TCP_Statistics> failed, Status = 73
– Export status return codes:
• 20: ODBCError• 26: Metafile Not Found• 27: Metafile IO Error• 30: History File Not Found• 49: RPC Error• 53: Server Died• 73: Warehouse Proxy Not Registered• 216: ServerTimeout
474 Tivoli Management Services Warehouse and Reporting

Binary file size grows indefinitelyFrom time to time you might notice the sizes of binary files do not decrease:
� Cause: The connection with the Warehouse is not working.
� Solution: The connection is not working because of an error in the Open Database Connectivity (ODBC) driver or ODBC connection.
� Cause: There is an error in the export process from the Tivoli Enterprise Monitoring Server or agent.
� Solution: Reconfigure the ODBC connection.
� Cause: Location of the Warehouse Proxy agent is not known.
� Solution: Reconfigure the Warehouse Proxy agent.
Wait an hour for the location to be provided to the agent.
8.2 Summarization and Pruning agent
The best way to troubleshoot any problems with the Summarization and Pruning agent is to check the log files. It might be necessary to increase the trace level of these files to track down the problem:
� Logs files
– hostname_sy_nnnnnnnnn.log– hostname_sy_java_nnnnnnn.log– KSYRAS1_cfg.log
� Trace levels
– No error tracing: -none-– General error tracing: ERROR– Agent startup errors: ERROR (UNIT:ksz ALL)– Detailed trace level: ERROR (UNIT: ksyn ALL): Where n=1-5
• 1 - Medium level trace for summarization• 2 - Connection level trace• 3 - Statement level trace• 4 - ResultSet level trace• 5 - Column value level trace
Chapter 8. Troubleshooting 475

8.2.1 Problems and solutions
This section documents some problems and their possible solutions:
� Summarized tables are not created in the data warehouse
Cause: This usually means that the application support for the Summarization and Pruning agent is not installed in the Tivoli Enterprise Monitoring Server.
Solution: Add the Summarization and Pruning agent support to the Tivoli Enterprise Monitoring Server:
– Windows: Select Tivoli Enterprise Monitoring Server, right-click, and browse to Advanced → Add application support to the TEMS.
– Linux/AIX: itmcmd support -t tems_name sy
� Summarization and Pruning agent throws an exception when connecting to Tivoli Enterprise Portal Server
Cause: The Summarization and Pruning agent is incorrectly configured to look for the Tivoli Enterprise Portal Server on localhost when, in fact, the Tivoli Enterprise Portal Server is on a different machine.
Solution: Reconfigure the Summarization and Pruning agent. In the Sources tab of the Configure Summarization and Pruning Agent graphical user interface (GUI), enter the correct name in the TEP Server Host field at the bottom (the default port of 1920 is probably fine, but adjust that accordingly, if the Tivoli Enterprise Portal Server is configured to use a different port).
� The Summarization and Pruning agent does not prune data for systems that are no longer managed
Solution: A database administrator has to manually remove the detailed data and summarized data that was collected from removed managed systems from the appropriate Tivoli Data Warehouse tables (looking for _D, _H, and so on).
8.3 RDBMS troubleshooting
In this section, we discuss troubleshooting of DB2, Oracle, and Microsoft SQL Server.
8.3.1 DB2
In this section, we discuss troubleshooting of DB2 including some error messages that you might encounter when you work with DB2.
476 Tivoli Management Services Warehouse and Reporting

Network problemsWhen working with the DB2 database, you might get networking-related messages. Example 8-1 shows one such message.
Example 8-1 Network problems: Example 1
SQL1013N The database alias name or database name "DSNBAT2" could not be found. SQLSTATE=42705
� Cause: The database is not cataloged in the machine trying to connect to the DB2 server or the catalog information that is provided is incorrect.
� Solution: Perform the following steps:
a. Double-check the spelling.
b. Check whether the database name exists in the database directory. You can do this by using the command shown in Example 8-2 to display all database names that are cataloged in the environment:
Example 8-2 List database directory
db2 => list database directory
System Database Directory
Number of entries in the directory = 12
Database 1 entry:
Database alias = MWNCDSNB Database name = MWNCDSNB Node name = NDE7A97E Database release level = a.00 Comment = PDT_PROD Directory entry type = Remote Catalog database partition number = -1 Alternate server hostname = Alternate server port number =...
c. If the database name exists, then double-check whether the database name you gave is the correct one for the server you are trying to access. You can do this by using the command shown in Example 8-3 to display all the nodes that are cataloged in the environment.
Chapter 8. Troubleshooting 477

Example 8-3 List node directory command
db2 => list node directory
Node Directory
Number of entries in the directory = 10
Node 1 entry:
Node name = NDE7A97E Comment = Directory entry type = LOCAL Protocol = TCPIP Hostname = bldbmsa.boulder.ibm.com Service name = 5031
You might encounter a network problem similar to Example 8-4.
Example 8-4 Network problems: Example 2
SQL30081N A communication error has been detected. Communication protocol being used: "TCP/IP". Communication API being used: "SOCKETS". Location where the error was detected: "". Communication function detecting the error: "gethostbyname". Protocol specific error code(s): "*", "11004", "*". SQLSTATE=08001
� Cause: The host name cataloged for that database is not found.
� Solution: Perform the following steps:
a. Ping the server that you are trying to access to determine whether the problem is just a networking problem or is your catalog information.
b. If the ping command shows you that the server is reachable, then you have to double-check the host name provided in the catalog. You can do this by using the command shown in Example 8-5 to display all the nodes that are cataloged in the environment.
Example 8-5 List node directory command
db2 => list node directory
Node Directory
Number of entries in the directory = 10
478 Tivoli Management Services Warehouse and Reporting

Node 1 entry:
Node name = NDE7A97E Comment = Directory entry type = LOCAL Protocol = TCPIP Hostname = bldbmsa.boulder.ibm.com Service name = 5031
Querying problemsWhen you run queries against the DB2 database, you might get a message similar to Example 8-6.
Example 8-6 Querying problems: Example 1
SQL30082N Attempt to establish connection failed with security reason "24" ("USERNAME AND/OR PASSWORD INVALID"). SQLSTATE=08001
� Cause: Typically the error SQL30082 indicates that either the user name is not a recognized user name or that the password is incorrect. However, you must first check the security reason to be sure, because there are 41 different reasons. This task is made easier, because in the error description you can also find the security reason description.
� Solution: Double-check the spelling of your password and user ID, and ensure that you are using the proper case in password, because it is case-sensitive.
Example 8-7 shows another example of a querying problem.
Example 8-7 Querying problems: Example 2
SQL0204N "DENISV.EMPLOYEE2" is an undefined name. SQLSTATE=42704
� Cause: DB2 did not find any table or view named in the implicit schema or the explicit schema name that you gave it.
� Solution: Double-check the spelling of the object, and check with your database administrator (DBA) if the tables were created with mixed case. If so, you have to write the table name between “ ” (quotation marks) just as it was created.
It is a good practice to use the full qualified name that includes the schema name and the table name, because you might be writing the correct table name, but the table does not exist in the implicit schema name, which is the same schema as the user ID logged on.
Chapter 8. Troubleshooting 479

You might encounter the querying problem shown in Example 8-8.
Example 8-8 Querying problems: Example 3
SQL0206N "MANAGER2" is not valid in the context where it is used.SQLSTATE=42703
� Cause: DB2 did not find any column or column’s alias that matches what you wrote in the select statement.
� Solution: Double-check the spelling of the column, and check with your DBA if the table’s columns were created with mixed case. If so, you have to write the column name between “ ” (quotation marks) just as they were created.
You might encounter the querying problem shown in Example 8-9.
Example 8-9 Querying problems: Example 4
SQL1040N The maximum number of applications is already connected to the database. SQLSTATE=57030
� Cause: The DB2 message in Example 8-9 indicates that the value of the DB2 database configuration parameter maxappls has been reached.
� Solution: Check how many applications are connected to your database, and check if they are correct. You can list them using the LIST APPLICATIONS command shown in Example 8-10.
Example 8-10 LIST APPLICATIONS command
DB2 LIST APPLICATIONS
Auth Id Application Appl. Application Id DB # of Name Handle Name Agents------- ----------- ------ ----------------------- ------ -----DENISV db2bp.exe 9 *LOCAL.DB2.061103202432 SAMPLE 1 DENISV db2bp.exe 8 *LOCAL.DB2.061103202251 SAMPLE 1
If the applications are okay, you have to change the MAXAPPLS configuration, you might set a specific number between 1 and 60 000, or just set to automatic, which is the preferred option:
update db cfg for sample using maxappls automatic
You might encounter the querying problem shown in Example 8-11.
480 Tivoli Management Services Warehouse and Reporting

Example 8-11 Querying problems: Example 5
SQL0668N Operation not allowed for reason code reason-code on table table-name. SQLSTATE=57016
� Cause: You have created a materialized query table (MQT) as refresh deferred, and have not refreshed it since the creation of this table.
� Solution: You have to refresh the MQT. To do so, you must use the refresh table command. Example 8-12 shows more details.
Example 8-12 Refreshing an MQT table
select * from mqt.disk_usageResult:
DAY SERVER_NAME DISK_NAME MAX_PERCENT_USED AVG_FREE_MEGABYTES ----- --------------- --------- ---------------- ------------------ Error: SQL0668N Operation not allowed for reason code "1" on table "MQT.DISK_USAGE". SQLSTATE=57016 (State:57016, Native Code: FFFFFD64)
refresh table mqt.disk_usage;
select * from mqt.disk_usageResult:
DAY SERVER_NAME DISK_NAME MAX_PERCENT_USED AVG_FREE_MEGABYTES------- ----------------- --------- ---------------- ------------------1060919 Primary:BERLIN:NT C: 36 24316,83 1060919 Primary:BERLIN:NT C: 36 24318,00
You might encounter the querying problem shown in Example 8-13.
Example 8-13 Querying problems: Example 6
SQL20058N The fullselect specified for the materialized query table table-name is not valid. Reason code = reason-code.
� Cause: The materialized query table definition has specific rules regarding the contents of the fullselect. Therefore, depending on the reason code, you might have to change the MQT definition a lot.
� Solution: Example 8-14 shows that the problem is reason code 4, which states that the fullselect must not contain references to functions that are defined as LANGUAGE SQL, CONTAINS SQL, READS SQL DATA, or
Chapter 8. Troubleshooting 481

MODIFIES SQL DATA. In this case, the only solution is to remove the function from the definition.
Example 8-14 Error while creating a MQT
create table mqt.disk_usage (Day,Server_Name,Disk_Name,Max_Percent_Used,AVG_Free_Megabytes)as (select WRITETIME, "Server_Name", "Disk_Name", "MAX___Used", "AVG_Free_Megabytes" from DENISV.NT_Logical_Disk_D where "Server_Name" in ('Primary:FLORENCE:NT', 'Primary:BERLIN:NT') and writetime > FIRST_DAY('LM'))data initially deferred refresh deferred;
Error: SQL20058N The fullselect specified for the materialized query table "MQT.DISK_USAGE" is not valid. Reason code = "4". SQLSTATE=428EC (State:428EC, Native Code: FFFFB1A6)
Example 8-15 shows another example of a querying problem.
Example 8-15 Querying problems: Example 7
SQL1032N No start database manager command was issued. SQLSTATE=57019
� Cause: The DB2 database server was shut down or was not started.
� Solution: From the command line, you might run the DB2START command.
8.3.2 Oracle
In this section, we discuss troubleshooting of Oracle and some of the error messages that you get when you work with Oracle.
Network problemsYou might get networking-related messages when you work with the Oracle database. Example 8-16 shows one such message.
Example 8-16 Network problems: Example 1
ORA-12154 ``TNS:could not resolve service name"
482 Tivoli Management Services Warehouse and Reporting

� Cause: This error indicates that the service (or TNS alias) specified when trying to connect does not exist. TNS aliases or service names are defined locally on each machine, because of this, different workstations might have a completely different alias to refer to the same database.
� Solution: Double-check the spelling of the alias that you typed against the ones that you have set up on your machine. To do so, look in the TNSNAMES.ORA file.
Example 8-17 shows a network-related message example.
Example 8-17 Network problems: Example 2
ORA-12203 ``TNS:unable to connect to destination"
� Cause: There is something wrong with the host (server) name or IP address that you are connecting to.
� Solution: Double-check the spelling of the alias that you typed against the ones that you have set up on your machine. To do so, look in the TNSNAMES.ORA file, and then double-check if the ADDRESS parameter has all the information required and is correct.
You might encounter the network problem shown in Example 8-18.
Example 8-18 Network problems: Example 3
ORA-12535: TNS:operation timed out
� Cause: There is something wrong with the host (server) name or IP address that you are connecting to.
� Solution: Try to ping the database that you are trying to access using the TNSPING utility. If the output is timeout, try to ping the host name that is provided in the output from the TNSPING utility, using the regular ping utility. If both of the outputs show timeout, then the problem is a networking problem and you have to solve it.
Querying problemsWhen you run queries against the Oracle database, you might get a message similar to Example 8-19.
Example 8-19 Querying problems: Example 1
ORA-01017: Invalid username/password
Chapter 8. Troubleshooting 483

� Cause: Usually this error indicates that either the user name is not a recognized user name or that the password is incorrect.
� Solution:
– The user is not set up to use operating system authentication.
Check that the prefix used when defining the Oracle account is the same as that specified by OS_AUTHENT_PREFIX in the init-ora file. The default is OPS$.
– Check that the initialization parameter REMOTE_OS_AUTHET is explicitly set to TRUE.
– If this error is encountered when a user name, password, or both are specified, then the cause is likely to be one of the following reasons:
• Check that an Oracle account has been created for the specified user name.
• Check that the Oracle account is not ‘OPS$...’. If it is, then Oracle is using operating system authentication for the account. Try logging in without specifying a user name or password. In this case, the NT account name must be the same as the Oracle account name (less the ‘OPS$’).
• If the Oracle account exists and the account is not named 'OPS$...’, then the password must be incorrect.
– If this error is encountered when trying to connect to Oracle as SYSOPER (but connecting as NORMAL works fine), then the account lacks the SYSOPER privilege. To obtain SYSOPER privilege, run Oracle security manager and grant the system privilege SYSOPER to the Oracle account.
You might encounter the querying problem shown in Example 8-20.
Example 8-20 Querying problems: Example 2
ORA-00040: active time limit exceeded - call aborted or ORA-00041: active time limit exceeded - session terminated
Note:
� The database must not be running in parallel server mode and the password file must not be shared.
� If the database is running in parallel server mode or the password file is shared, then only SYS or INTERNAL can have SYSOPER privilege.
484 Tivoli Management Services Warehouse and Reporting

� Cause: The Resource Manager SWITCH_TIME limit was exceeded. This parameter is used to limit how long a session can run without being terminated.
� Solution: Your first option is to try to rewrite the SQL statement so that the now high complex query can be changed to a low complex one. If that is not the case, contact your DBA so that the DBA can be aware of the problem. Work with the DBA and try to set a new limit to this parameter.
You might encounter the querying problem shown in Example 8-21.
Example 8-21 Querying problems: Example 3
ORA-01033: ORACLE initialization or shutdown in progress
� Cause: An attempt was made to log on while Oracle was being started up or shut down.
� Solution: Wait a few minutes, and then retry the operation.
You might encounter the querying problem shown in Example 8-22.
Example 8-22 Querying problems: Example 4
ORA-01037: maximum cursor memory exceeded
� Cause: In this case, the cause is attempting to process a complex SQL statement that consumed all available memory of the cursor.
� Solution: Your first option is to try to rewrite the SQL statement so that the now high complex query can be changed to a low complex one. If that is not the case, contact your DBA so that the DBA can be aware of the problem. Work with the DBA and try to set a new limit.
You might encounter the querying problem shown in Example 8-23.
Example 8-23 Querying problems: Example 5
ORA-101045: User lacks create session privilege; logon denied
� Cause: Your account has not been given create session privileges; even if your user ID has privileges to do selects on tables, it will not be able to connect.
� Solution: Ask your DBA to grant create session privilege to the user ID, otherwise you cannot log on.
You might encounter the querying problem shown in Example 8-24.
Chapter 8. Troubleshooting 485

Example 8-24 Querying problems: Example 6
ORA-00028: your session has been killed
� Cause: A privileged user has killed your session and you are no longer logged on to the database.
� Solution: Log in again if you want to continue working.
You might encounter the querying problem shown in Example 8-25.
Example 8-25 Querying problems: Example 7
ORA-00960: ambiguous column naming in select list
� Cause: A column name in the order-by list matches more than one select list columns.
� Solution: Remove the duplicate column naming in the select list.
You might encounter the querying problem shown in Example 8-26.
Example 8-26 Querying problems: Example 8
ORA-03113 End-of-file on communication channel (Network connection lost)
� Cause: Your connection with the DBMS was lost, probably a networking problem.
� Solution: Try to log in back to gain access again to the database.
You might encounter the querying problem shown in Example 8-27.
Example 8-27 Querying problems: Example 9
ORA-03114 Not connected to ORACLE
� Cause: This usually happens when you try to run a command or SQL statement after your session has been killed or lost.
� Solution: Connect again to gain access to the database and rerun your command.
You might encounter the querying problem shown in Example 8-28.
Example 8-28 Querying problems: Example 10
ORA-00942 Table or view does not exist
486 Tivoli Management Services Warehouse and Reporting

� Cause: Oracle did not find any table or view named in the implicit schema or the explicit schema name that you gave it.
� Solution: Double-check the spelling of the object, and check with your DBA if the tables were created with mixed case. If so, you have to write the table name between “ ” (quotation marks) just as it was created. It is a good practice to use the full qualified name that includes the schema name and the table name, because you might be writing the correct table name, but the table does not exist in the implicit schema name, that is, the same schema as the user ID logged on.
You might encounter the querying problem shown in Example 8-29.
Example 8-29 Querying problems: Example 11
ORA-01035: ORACLE only available to users with RESTRICTED SESSION privilege
� Cause: Logins are disallowed because an instance started in restricted mode. Only users with RESTRICTED SESSION system privilege can log on.
� Solution: Request that Oracle be restarted without the restricted option or obtain the RESTRICTED SESSION system privilege.
8.3.3 Microsoft SQL Server
In this section, we discuss troubleshooting of MS SQL Server and some of the error messages that you might get when working with MS SQL Server.
Network problemsYou might get networking-related messages when you work with the MS SQL Server database. The error messages shown in Example 8-30 through Example 8-33 are generic, therefore we group them all together.
Example 8-30 Network problems: Example 1
General Network Error
Example 8-31 Network problems: Example 2
The specified SQL Server is not found
Example 8-32 Network problems: Example 3
SQL Server does not exist or access denied
Chapter 8. Troubleshooting 487

Example 8-33 Network problems: Example 4
SQL Server is unavailable or does not exist
� Cause: The most common reasons for this error are:
– SQL Server is not running
– SQL Server is not listening on the protocol or port that you are using while trying to connect
– You are using a different protocol on the client other than the one the Server is set up for listening
– The host name that you are trying to connect does not exist
� Solution:
– Check the target server if the SQL Server is installed and running so that it can accept connections.
Then check if the host name is correct and that the server is reachable through the network. You can do this by using the ping utility.
– Check what protocol is set up on the server network utility. This is a tool found on the server that tells the SQL Server what protocol the relational relational database management system (RDBMS) should be listening and in what port. After that check the client machine’s client network utility to see whether the client is using the same protocol and is trying to connect to the correct port.
Querying problemsWhen you run queries against the MS SQL Server, you might get a message similar to Example 8-34.
Example 8-34 Querying problems: Example 1
Msg 916, Level 14, State 1 - The server principal "usera" is not able to access the database "AdventureWorksDW" under the current security context.
� Cause: Your user ID was not granted access to the database that you tried to access.
� Solution: You have to grant access on the specified database to the user trying to access it. To do this, use the following commands:
USE AdventureWorksDWExec sp_grantdbaccess 'usera'
You might encounter the querying problem shown in Example 8-35.
488 Tivoli Management Services Warehouse and Reporting

Example 8-35 Querying problems: Example 2
Msg 229, Level 14, State 5 - SELECT permission denied on object 'DimAccount', database 'AdventureWorksDW', schema 'dbo'.
� Cause: The user ID that is used to access the table lacks the SELECT permission.
� Solution: You have to grant SELECT access to the table where the error message was received. To grant access, use the following command:
GRANT SELECT on DimAccount to UserA
You might encounter the querying problem shown in Example 8-36.
Example 8-36 Querying problems: Example 3
Msg 911, Level 16, State 1 - Could not locate entry in sysdatabases for database 'adventureworksd2'. No entry found with that name. Make sure that the name is entered correctly.
� Cause: The database name written must be incorrect.
� Solution: Double-check the spelling and try again. All the database names can be found in the sysdatabases table under the Master database.
You might encounter the querying problem shown in Example 8-37.
Example 8-37 Querying problems: Example 4
Msg 208, Level 16, State 1 - Invalid object name 'dimaccount2'.
� Cause: SQL Server did not find any table or view named in the implicit schema or the explicit schema name that you gave it.
� Solution: Double-check the spelling of the object, and check with your DBA if the tables were created with mixed case. If so, you have to write the table name between “ ” (quotation marks) just as it was created. It is a good practice to use the full qualified name that includes the schema name and the table name, because you might be writing the correct table name, but the table does not exist in the implicit schema name.
You might encounter the querying problem shown in Example 8-38.
Example 8-38 Querying problems: Example 5
Msg 1105, Level 17, State 2 - Could not allocate space for object 'dbo.teste2' in database 'oi' because the 'PRIMARY' filegroup is full.
Chapter 8. Troubleshooting 489

� Cause: This message indicates that SQL Server cannot allocate space because the filegroup is full.
� Solution: Check if your hard drives that are used by the filegroup are full. If so, create disk space by deleting unnecessary files, dropping unused objects in the filegroup, or adding additional files to the filegroup in different hard drives.
If the hard drive is not full, set the autogrowth parameter on for existing files in the filegroup.
You might encounter the querying problem shown in Example 8-39.
Example 8-39 Querying problems: Example 6
Msg 9002, Level 17, State 4 - The transaction log for database 'oi' is full.
� Cause: Your transaction log file is full, you receive the error message when a transaction log file consumes the available disk space and cannot expand any more, or it has reached the maximum size of the log file, in this case it usually happens because the autogrowth parameter is off.
� Solution: You can set the autogrowth parameter on, if the hard drive where the log file is located still has plenty of storage. If the hard drive is full, you have to add a new log file to your database in another hard drive.
490 Tivoli Management Services Warehouse and Reporting

Appendix A. Example mdl file for the Tivoli Storage Manager Universal Agent scenario
This appendix provides an example mdl file for the Tivoli Storage Manager Universal Agent for the scenario that we described in 5.3, “Warehousing data using IBM Tivoli Monitoring 6.1 Universal Agent (ODBC provider)” on page 348.
A
© Copyright IBM Corp. 2007. All rights reserved. 491

Example mdl file for Tivoli Storage Manager Universal Agent scenario
Example A-1 shows the mdl file, which is used for the scenario that we described in 5.3, “Warehousing data using IBM Tivoli Monitoring 6.1 Universal Agent (ODBC provider)” on page 348.
Example: A-1 Example mdl file
//APPL TSM//NAME ACTLOG S 300 @Server activity log//SOURCE ODBC TSMODBC user=admin pswd=admin//SQL Select * from ACTLOG//ATTRIBUTESDATE_TIME D 28 @Date/TimeMSGNO N 8 @Message numberSEVERITY D 4 @Message severityMESSAGE D 256 @MessageORIGINATOR D 20 @OriginatorNODENAME D 64 @Node NameOWNERNAME D 64 @Owner NameSCHEDNAME D 32 @Schedule NameDOMAINNAME D 32 @Policy Domain NameSESSID N 8 @Sess NumberSERVERNAME D 64 @Server NameSESSION N 8 @SESSIONPROCESS N 8 @PROCESS//NAME ADMINS K 300 @Server administrators//SOURCE ODBC TSMODBC user=admin pswd=admin//SQL Select * from ADMINS//ATTRIBUTESADMIN_NAME D 64 KEY ATOMIC @Administrator NameLASTACC_TIME D 28 @Last Access Date/TimePWSET_TIME D 28 @Password Set Date/TimeCONTACT D 128 @ContactLOCKED D 12 @Locked?INVALID_PW_COUNT C 999999 @Invalid Sign-on CountSYSTEM_PRIV D 80 @System PrivilegePOLICY_PRIV D 100 @Policy PrivilegeSTORAGE_PRIV D 100 @Storage PrivilegeANALYST_PRIV D 80 @Analyst PrivilegeOPERATOR_PRIV D 80 @Operator PrivilegeCLIENT_ACCESS D 256 @Client Access PrivilegeCLIENT_OWNER D 256 @Client Owner PrivilegeREG_TIME D 28 @Registration Date/Time
492 Tivoli Management Services Warehouse and Reporting

REG_ADMIN D 64 @Registering AdministratorPROFILE D 256 @Managing profilePASSEXP N 8 @Password Expiration Period//NAME ADMIN_SCHEDULES K 300 @Administrative command schedules//SOURCE ODBC TSMODBC user=admin pswd=admin//SQL Select * from ADMIN_SCHEDULES//ATTRIBUTESSCHEDULE_NAME D 32 KEY ATOMIC @Schedule NameDESCRIPTION D 256 @DescriptionCOMMAND D 256 @CommandPRIORITY C 999999 @PrioritySTARTDATE D 12 @Start dateSTARTTIME D 8 @Start timeDURATION N 8 @DurationDURUNITS D 20 @Duration unitsPERIOD N 8 @PeriodPERUNITS D 20 @Period unitsDAYOFWEEK D 20 @Day of WeekEXPIRATION D 12 @ExpirationACTIVE D 12 @Active?CHG_TIME D 28 @Last Update Date/TimeCHG_ADMIN D 32 @Last Update by (administrator)PROFILE D 256 @Managing profileSCHED_STYLE D 12 @Schedule StyleENH_MONTH D 52 @MonthDAYOFMONTH D 60 @Day of MonthWEEKOFMONTH D 52 @Week of Month//NAME ARCHIVES S 300 @Client archive files//SOURCE ODBC TSMODBC user=admin pswd=admin//SQL Select * from ARCHIVES//ATTRIBUTESNODE_NAME D 64 @Node NameFILESPACE_NAME D 256 @Filespace NameFILESPACE_ID N 28 @FSIDTYPE D 16 @Object typeHL_NAME D 256 @Client high-level nameLL_NAME D 256 @Client low-level nameOBJECT_ID N 20 @Server object ID for the client objectARCHIVE_DATE D 28 @Date/time that the object was archivedOWNER D 64 @Client object ownerDESCRIPTION D 256 @DescriptionCLASS_NAME D 32 @Mgmt Class Name//NAME AR_COPYGROUPS S 300 @Management class archive copy groups//SOURCE ODBC TSMODBC user=admin pswd=admin//SQL Select * from AR_COPYGROUPS
Appendix A. Example mdl file for the Tivoli Storage Manager Universal Agent scenario 493

//ATTRIBUTESDOMAIN_NAME D 32 @Policy Domain NameSET_NAME D 32 @Policy Set NameCLASS_NAME D 32 @Mgmt Class NameCOPYGROUP_NAME D 32 @Copy Group NameRETVER D 8 @Retain VersionSERIALIZATION D 32 @Copy SerializationDESTINATION D 32 @Copy DestinationCHG_TIME D 28 @Last Update Date/TimeCHG_ADMIN D 32 @Last Update by (administrator)PROFILE D 256 @Managing profileRETINIT D 8 @Retention InitiationRETMIN N 8 @Retain Minimum Days//NAME ASSOCIATIONS S 300 @Client schedule associations//SOURCE ODBC TSMODBC user=admin pswd=admin//SQL Select * from ASSOCIATIONS//ATTRIBUTESDOMAIN_NAME D 32 @Policy Domain NameSCHEDULE_NAME D 32 @Schedule NameNODE_NAME D 64 @Associated NodesCHG_TIME D 28 @Last Update Date/TimeCHG_ADMIN D 32 @Last Update by (administrator)//NAME AUDITOCC K 300 @Server audit occupancy results//SOURCE ODBC TSMODBC user=admin pswd=admin//SQL Select * from AUDITOCC//ATTRIBUTESNODE_NAME D 64 KEY ATOMIC @Node NameBACKUP_MB N 8 @Backup Storage Used (MB)BACKUP_COPY_MB N 8 @Backup Storage Used (MB)ARCHIVE_MB N 8 @Archive Storage Used (MB)ARCHIVE_COPY_MB N 8 @Archive Storage Used (MB)SPACEMG_MB N 8 @Space-Managed Storage Used (MB)SPACEMG_COPY_MB N 8 @Space-Managed Storage Used (MB)TOTAL_MB N 8 @Total Storage Used (MB)//NAME BACKUPS S 300 @Client backup files//SOURCE ODBC TSMODBC user=admin pswd=admin//SQL Select * from BACKUPS//ATTRIBUTESNODE_NAME D 64 @Node NameFILESPACE_NAME D 256 @Filespace NameFILESPACE_ID N 28 @FSIDSTATE D 16 @File state (active, inactive)TYPE D 16 @Object typeHL_NAME D 256 @Client high-level nameLL_NAME D 256 @Client low-level name
494 Tivoli Management Services Warehouse and Reporting

OBJECT_ID N 20 @Server object ID for the client objectBACKUP_DATE D 28 @Date/time that the object was backed upDEACTIVATE_DATE D 28 @Date/time that the object was deactivatedOWNER D 64 @Client object ownerCLASS_NAME D 32 @Mgmt Class Name//NAME BACKUPSETS S 300 @Backup Set//SOURCE ODBC TSMODBC user=admin pswd=admin//SQL Select * from BACKUPSETS//ATTRIBUTESNODE_NAME D 64 @Node NameBACKUPSET_NAME D 256 @Backup Set NameOBJECT_ID N 20 @Server object ID for the client objectDATE_TIME D 28 @Date/TimeRETENTION D 8 @Retention PeriodDESCRIPTION D 256 @DescriptionDEVCLASS D 32 @Device Class Name//NAME BU_COPYGROUPS S 300 @Management class backup copy groups//SOURCE ODBC TSMODBC user=admin pswd=admin//SQL Select * from BU_COPYGROUPS//ATTRIBUTESDOMAIN_NAME D 32 @Policy Domain NameSET_NAME D 32 @Policy Set NameCLASS_NAME D 32 @Mgmt Class NameCOPYGROUP_NAME D 32 @Copy Group NameVEREXISTS D 8 @Versions Data ExistsVERDELETED D 8 @Versions Data DeletedRETEXTRA D 8 @Retain Extra VersionsRETONLY D 8 @Retain Only VersionMODE D 32 @Copy ModeSERIALIZATION D 32 @Copy SerializationFREQUENCY C 999999 @Copy FrequencyDESTINATION D 32 @Copy DestinationTOC_DESTINATION D 32 @Table of Contents (TOC) DestinationCHG_TIME D 28 @Last Update Date/TimeCHG_ADMIN D 32 @Last Update by (administrator)PROFILE D 256 @Managing profile//NAME CLIENTOPTS S 300 @Client Options//SOURCE ODBC TSMODBC user=admin pswd=admin//SQL Select * from CLIENTOPTS//ATTRIBUTESOPTIONSET_NAME D 68 @OptionsetOPTION_NAME D 68 @OptionSEQNUMBER N 8 @Sequence numberOPTION_VALUE D 256 @Option ValueFORCE D 4 @Use Option Set Value (FORCE)
Appendix A. Example mdl file for the Tivoli Storage Manager Universal Agent scenario 495

OBSOLETE D 12 @ObsoleteWHEN_OBSOLETE D 12 @When Obsolete?//NAME CLIENT_SCHEDULES S 300 @Client schedules//SOURCE ODBC TSMODBC user=admin pswd=admin//SQL Select * from CLIENT_SCHEDULES//ATTRIBUTESDOMAIN_NAME D 32 @Policy Domain NameSCHEDULE_NAME D 32 @Schedule NameDESCRIPTION D 256 @DescriptionACTION D 20 @ActionOPTIONS D 256 @OptionsOBJECTS D 256 @ObjectsPRIORITY C 999999 @PrioritySTARTDATE D 12 @Start dateSTARTTIME D 8 @Start timeDURATION N 8 @DurationDURUNITS D 20 @Duration unitsPERIOD N 8 @PeriodPERUNITS D 20 @Period unitsDAYOFWEEK D 20 @Day of WeekEXPIRATION D 12 @ExpirationCHG_TIME D 28 @Last Update Date/TimeCHG_ADMIN D 32 @Last Update by (administrator)PROFILE D 256 @Managing profileSCHED_STYLE D 12 @Schedule StyleENH_MONTH D 52 @MonthDAYOFMONTH D 60 @Day of MonthWEEKOFMONTH D 52 @Week of Month//NAME CLOPTSETS K 300 @Client Option Sets//SOURCE ODBC TSMODBC user=admin pswd=admin//SQL Select * from CLOPTSETS//ATTRIBUTESOPTIONSET_NAME D 68 KEY ATOMIC @OptionsetDESCRIPTION D 256 @DescriptionLAST_UPDATE_BY D 68 @Last Update by (administrator)PROFILE D 256 @Managing profile//NAME COLLOCGROUP S 300 @Collocation groups//SOURCE ODBC TSMODBC user=admin pswd=admin//SQL Select * from COLLOCGROUP//ATTRIBUTESCOLLOCGROUP_NAME D 32 @Collocation Group NameDESCRIPTION D 256 @DescriptionCHG_TIME D 28 @Last Update Date/TimeCHG_ADMIN D 32 @Last Update by (administrator)NODE_NAME D 64 @Node Name
496 Tivoli Management Services Warehouse and Reporting

//NAME CONTENTS S 300 @Storage pool volume contents//SOURCE ODBC TSMODBC user=admin pswd=admin//SQL Select * from CONTENTS//ATTRIBUTESVOLUME_NAME D 256 @Volume NameNODE_NAME D 64 @Node NameTYPE D 20 @TypeFILESPACE_NAME D 64 @Filespace NameFILE_NAME D 256 @Client's Name for FileAGGREGATED D 20 @Aggregated?FILE_SIZE N 20 @Stored SizeSEGMENT D 20 @Segment NumberCACHED D 20 @Cached Copy?FILESPACE_ID N 8 @FSIDFILESPACE_HEXNAME D 64 @Hexadecimal Filespace NameFILE_HEXNAME D 256 @Hexadecimal Client's Name for File//NAME DATAMOVERS K 300 @Data Movers//SOURCE ODBC TSMODBC user=admin pswd=admin//SQL Select * from DATAMOVERS//ATTRIBUTESMOVER_NAME D 64 KEY ATOMIC @Data Mover NameTYPE D 16 @Data Mover TypeHL_ADDRESS D 256 @IP AddressLL_ADDRESS D 256 @TCP/IP Port NumberUSER_NAME D 64 @User NameWWN D 16 @WWNSERIAL D 64 @Serial NumberCOPYTHREADS N 8 @Copy ThreadsDATA_FORMAT D 32 @Storage Pool Data FormatONLINE D 40 @On-LineLAST_UPDATE_BY D 64 @Last Update by (administrator)LAST_UPDATE D 28 @Last Update Date/Time//NAME DB S 300 @Server database information//SOURCE ODBC TSMODBC user=admin pswd=admin//SQL Select * from DB//ATTRIBUTESAVAIL_SPACE_MB N 8 @Available Space (MB)CAPACITY_MB N 8 @Assigned Capacity (MB)MAX_EXTENSION_MB N 8 @Maximum Extension (MB)MAX_REDUCTION_MB N 12 @Maximum Reduction (MB)PAGE_SIZE C 999999 @Page Size (bytes)USABLE_PAGES N 8 @Total Usable PagesUSED_PAGES N 8 @Used PagesPCT_UTILIZED N 4 @Pct UtilMAX_PCT_UTILIZED N 4 @Max. Pct Util
Appendix A. Example mdl file for the Tivoli Storage Manager Universal Agent scenario 497

PHYSICAL_VOLUMES N 8 @Physical VolumesBUFF_POOL_PAGES N 12 @Buffer Pool PagesTOTAL_BUFFER_REQ N 12 @Total Buffer RequestsCACHE_HIT_PCT N 4 @Cache Hit Pct.CACHE_WAIT_PCT N 4 @Cache Wait Pct.BACKUP_RUNNING D 12 @Backup in Progress?BACKUP_TYPE D 20 @Type of Backup In ProgressNUM_BACKUP_INCR C 999999 @Incrementals Since Last FullBACKUP_CHG_MB N 4 @Changed Since Last Backup (MB)BACKUP_CHG_PCT N 4 @Percentage ChangedLAST_BACKUP_DATE D 28 @Last Complete Backup Date/TimeDB_REORG_EST N 8 @Estimate of Recoverable Space (MB)DB_REORG_EST_TIME D 28 @Last Estimate of Recoverable Space (MB)//NAME DBBACKUPTRIGGER S 300 @Database backup trigger information//SOURCE ODBC TSMODBC user=admin pswd=admin//SQL Select * from DBBACKUPTRIGGER//ATTRIBUTESDEVCLASS D 32 @Full Device ClassINCRDEVCLASS D 32 @Incremental Device ClassLOGFULLPCT C 999999 @Log Full PercentageNUMICREMENTAL C 999999 @Incrementals Between FullsCHG_TIME D 28 @Last Update Date/TimeCHG_ADMIN D 64 @Last Update by (administrator)MININTERVAL C 999999 @Minimum Backup Interval (minutes)MINLOGFREE C 999999 @Minimum Log Percentage Freed//NAME DBSPACETRIGGER S 300 @Database space trigger information//SOURCE ODBC TSMODBC user=admin pswd=admin//SQL Select * from DBSPACETRIGGER//ATTRIBUTESFULLPCT C 999999 @DB Full PercentageEXPANSIONPCT C 999999 @DB Space Expansion PercentageEXPANSION_PREFIX D 252 @DB Expansion prefixMAXIMUM_DB_SIZE N 8 @DB Maximum Size (Megabytes)MIRROR_PREFIX_1 D 252 @Mirror Prefix 1MIRROR_PREFIX_2 D 252 @Mirror Prefix 2CHG_TIME D 28 @Last Update Date/TimeCHG_ADMIN D 64 @Last Update by (administrator)//NAME DBVOLUMES S 300 @Database volumes//SOURCE ODBC TSMODBC user=admin pswd=admin//SQL Select * from DBVOLUMES//ATTRIBUTESCOPY1_NAME D 256 @Volume Name (Copy 1)COPY1_STATUS D 20 @Copy StatusCOPY2_NAME D 256 @Volume Name (Copy 2)COPY2_STATUS D 20 @Copy Status
498 Tivoli Management Services Warehouse and Reporting

COPY3_NAME D 256 @Volume Name (Copy 3)COPY3_STATUS D 20 @Copy StatusAVAIL_SPACE_MB N 8 @Available Space (MB)ALLOC_SPACE_MB N 8 @Allocated Space (MB)FREE_SPACE_MB N 8 @Free Space (MB)//NAME DEVCLASSES K 300 @Device Classes//SOURCE ODBC TSMODBC user=admin pswd=admin//SQL Select * from DEVCLASSES//ATTRIBUTESDEVCLASS_NAME D 32 KEY ATOMIC @Device Class NameACCESS_STRATEGY D 12 @Device Access StrategySTGPOOL_COUNT N 8 @Storage Pool CountDEVTYPE D 16 @Device TypeFORMAT D 16 @FormatCAPACITY D 40 @Est/Max CapacityMOUNTLIMIT D 12 @Mount LimitMOUNTWAIT N 8 @Mount Wait (min)MOUNTRETENTION N 8 @Mount Retention (min)PREFIX D 8 @Label PrefixDRIVE D 4 @Drive LetterLIBRARY_NAME D 32 @LibraryDIRECTORY D 256 @DirectorySERVERNAME D 64 @Server NameRETRYPERIOD N 8 @Retry PeriodRETRYINTERVAL N 8 @Retry IntervalTWO_SIDED D 4 @TwosidedSHARED D 4 @SharedHLADDRESS D 256 @HLAddrMINCAPACITY D 40 @Minimum CapacityWORM D 4 @WORMSCALECAPACITY N 8 @Scaled CapacityLAST_UPDATE_BY D 64 @Last Update by (administrator)LAST_UPDATE D 28 @Last Update Date/Time//NAME DISKS S 300 @Disks//SOURCE ODBC TSMODBC user=admin pswd=admin//SQL Select * from DISKS//ATTRIBUTESNODE_NAME D 64 @Node NameDISK_NAME D 64 @Disk NameWWN D 16 @WWNSERIAL D 64 @Serial NumberONLINE D 40 @On-LineLAST_UPDATE_BY D 64 @Last Update by (administrator)LAST_UPDATE D 28 @Last Update Date/Time//NAME DOMAINS K 300 @Policy domains
Appendix A. Example mdl file for the Tivoli Storage Manager Universal Agent scenario 499

//SOURCE ODBC TSMODBC user=admin pswd=admin//SQL Select * from DOMAINS//ATTRIBUTESDOMAIN_NAME D 32 KEY ATOMIC @Policy Domain NameSET_LAST_ACTIVATED D 32 @Activated Policy SetACTIVATE_DATE D 28 @Activation Date/TimeDEFMGMTCLASS D 32 @Activated Default Mgmt ClassNUM_NODES N 8 @Number of Registered NodesBACKRETENTION C 999999 @Backup Retention (Grace Period)ARCHRETENTION C 999999 @Archive Retention (Grace Period)DESCRIPTION D 256 @DescriptionCHG_TIME D 28 @Last Update Date/TimeCHG_ADMIN D 32 @Last Update Date/TimePROFILE D 256 @Managing profile//NAME DRIVES S 300 @Drives//SOURCE ODBC TSMODBC user=admin pswd=admin//SQL Select * from DRIVES//ATTRIBUTESLIBRARY_NAME D 32 @Library NameDRIVE_NAME D 32 @Drive NameDEVICE_TYPE D 16 @Device TypeONLINE D 40 @On-LineREAD_FORMATS D 16 @Read FormatsWRITE_FORMATS D 16 @Write FormatsELEMENT C 999999 @ElementACS_DRIVE_ID D 16 @ACS DriveIdDRIVE_STATE D 40 @Drive StateALLOCATED_TO D 64 @Allocated toLAST_UPDATE_BY D 64 @Last Update by (administrator)LAST_UPDATE D 28 @Last Update Date/TimeCLEAN_FREQ D 12 @Cleaning Frequency (Gigabytes/ASNEEDED/NONE)DRIVE_SERIAL D 64 @Serial NumberVOLUME_NAME D 256 @Volume Name//NAME DRMCSTGPOOLS S 300 @Copy storage pools managed by the disaster recovery manager//SOURCE ODBC TSMODBC user=admin pswd=admin//SQL Select * from DRMCSTGPOOLS//ATTRIBUTESSTGPOOL_NAME D 32 @Storage Pool Name//NAME DRMEDIA S 300 @Physical volumes managed by move drmedia//SOURCE ODBC TSMODBC user=admin pswd=admin//SQL Select * from DRMEDIA//ATTRIBUTESVOLUME_NAME D 256 @Storage pool volumesSTATE D 20 @State
500 Tivoli Management Services Warehouse and Reporting

UPD_DATE D 28 @Last Update Date/TimeLOCATION D 256 @LocationSTGPOOL_NAME D 32 @Storage Pool NameLIB_NAME D 32 @Automated LibNameVOLTYPE D 12 @Volume Type//NAME DRMMACHINE S 300 @Disaster recovery manager machine information//SOURCE ODBC TSMODBC user=admin pswd=admin//SQL Select * from DRMMACHINE//ATTRIBUTESMACHINE_NAME D 64 @Machine NamePRIORITY C 999999 @Machine PriorityBUILDING D 16 @BuildingFLOOR D 16 @FloorROOM D 16 @RoomADSM_SERVER D 4 @Server?DESCRIPTION D 256 @DescriptionCHARACTERISTICS D 4 @Characteristics?RECINSTRUCTIONS D 4 @Recovery Instructions?//NAME DRMMACHINECHARS S 300 @Disaster recovery manager machine characteristics//SOURCE ODBC TSMODBC user=admin pswd=admin//SQL Select * from DRMMACHINECHARS//ATTRIBUTESMACHINE_NAME D 64 @Machine NameCHARACTERISTICS D 256 @Characteristics//NAME DRMMACHINENODE S 300 @Disaster recovery manager machine node associations//SOURCE ODBC TSMODBC user=admin pswd=admin//SQL Select * from DRMMACHINENODE//ATTRIBUTESMACHINE_NAME D 64 @Machine NameNODE_NAME D 64 @Node Name//NAME DRMMACHINERECINST S 300 @Disaster recovery manager machine recovery instructions//SOURCE ODBC TSMODBC user=admin pswd=admin//SQL Select * from DRMMACHINERECINST//ATTRIBUTESMACHINE_NAME D 64 @Machine NameRECINSTRUCTIONS D 256 @Recovery Instructions//NAME DRMMACHINERECMEDIA S 300 @Disaster recovery manager machine recovery media associations//SOURCE ODBC TSMODBC user=admin pswd=admin//SQL Select * from DRMMACHINERECMEDIA//ATTRIBUTESMACHINE_NAME D 64 @Machine Name
Appendix A. Example mdl file for the Tivoli Storage Manager Universal Agent scenario 501

RECMEDIA_NAME D 32 @Recovery Media Name//NAME DRMPSTGPOOLS S 300 @Primary storage pools managed by the disaster recovery manager//SOURCE ODBC TSMODBC user=admin pswd=admin//SQL Select * from DRMPSTGPOOLS//ATTRIBUTESSTGPOOL_NAME D 32 @Storage Pool Name//NAME DRMRECOVERYMEDIA K 300 @Disaster recovery manager recovery media//SOURCE ODBC TSMODBC user=admin pswd=admin//SQL Select * from DRMRECOVERYMEDIA//ATTRIBUTESRECMEDIA_NAME D 32 KEY ATOMIC @Recovery Media NameTYPE D 8 @TypeLOCATION D 256 @LocationDESCRIPTION D 256 @DescriptionPRODUCT D 16 @ProductPRODUCT_INFO D 256 @Product InformationVOLUMES D 256 @Volume Names//NAME DRMSRPF S 300 @Recovery plan files in source server//SOURCE ODBC TSMODBC user=admin pswd=admin//SQL Select * from DRMSRPF//ATTRIBUTESRPF_NAME D 256 @Recovery Plan File NameNODE_NAME D 68 @Node NameDEVCLASS_NAME D 32 @Device Class NameTYPE D 36 @Recovery Plan File TypeMGMTCLASS_NAME D 32 @Mgmt Class NameRPF_SIZE N 12 @Recovery Plan File SizeRPF_DELETE D 20 @Marked For DeletionRPF_DELDATE D 28 @Deletion Date//NAME DRMSTANZA S 300 @Recovery plan file stanza names//SOURCE ODBC TSMODBC user=admin pswd=admin//SQL Select * from DRMSTANZA//ATTRIBUTESSTANZA_NAME D 256 @Stanza Name//NAME DRMSTATUS S 300 @Disaster recovery manager status information//SOURCE ODBC TSMODBC user=admin pswd=admin//SQL Select * from DRMSTATUS//ATTRIBUTESPLANPREFIX D 200 @Recovery Plan PrefixINSTRPREFIX D 200 @Plan Instructions PrefixPLANVPOSTFIX D 4 @Replacement Volume PostfixNONMOUNTNAME D 256 @Not Mountable Location NameCOURIERNAME D 256 @Courier Name
502 Tivoli Management Services Warehouse and Reporting

VAULTNAME D 256 @Vault Site NameDBBEXPIREDAYS N 8 @DB Backup Series Expiration DaysCHECKLABEL D 20 @Check Label?FILEPROCESS D 20 @Process FILE Device Type?CMDFILENAME D 256 @Command File NameRPFEXPIREDAYS N 8 @Recovery Plan File Expiration Days//NAME DRMTRPF S 300 @Recovery plan files in target server//SOURCE ODBC TSMODBC user=admin pswd=admin//SQL Select * from DRMTRPF//ATTRIBUTESRPF_NAME D 256 @Recovery Plan File NameNODE_NAME D 68 @Node NameDEVCLASS_NAME D 32 @Device Class NameTYPE D 36 @Recovery Plan File TypeMGMTCLASS_NAME D 32 @Mgmt Class NameRPF_SIZE N 12 @Recovery Plan File SizeRPF_DELETE D 20 @Marked For DeletionRPF_DELDATE D 28 @Deletion Date//NAME EVENTS S 300 @Scheduled Event Results//SOURCE ODBC TSMODBC user=admin pswd=admin//SQL Select * from EVENTS//ATTRIBUTESSCHEDULED_START D 28 @Scheduled StartACTUAL_START D 28 @Actual StartDOMAIN_NAME D 32 @Policy Domain NameSCHEDULE_NAME D 32 @Schedule NameNODE_NAME D 64 @Node NameSTATUS D 12 @StatusRESULT N 8 @ResultREASON D 80 @Reason//NAME FILESPACES S 300 @Client file spaces//SOURCE ODBC TSMODBC user=admin pswd=admin//SQL Select * from FILESPACES//ATTRIBUTESNODE_NAME D 64 @Node NameFILESPACE_NAME D 256 @Filespace NameFILESPACE_ID N 28 @FSIDFILESPACE_TYPE D 32 @Filespace TypeCAPACITY N 20 @Capacity (MB)PCT_UTIL N 20 @Pct UtilBACKUP_START D 28 @Last Backup Start Date/TimeBACKUP_END D 28 @Last Backup Completion Date/TimeDELETE_OCCURRED D 28 @Deletion occurred in Filespace Date/TimeUNICODE_FILESPACE D 12 @Is Filespace Unicode?FILESPACE_HEXNAME D 256 @Hexadecimal Filespace Name
Appendix A. Example mdl file for the Tivoli Storage Manager Universal Agent scenario 503

//NAME GROUP_MEMBER S 300 @Group Members//SOURCE ODBC TSMODBC user=admin pswd=admin//SQL Select * from GROUP_MEMBER//ATTRIBUTESGROUP_NAME D 64 @Server GroupMEMBER_NAME D 64 @MembersCHG_TIME D 28 @Last Update Date/TimeCHG_ADMIN D 64 @Last Update by (administrator)//NAME LIBRARIES K 300 @Libraries//SOURCE ODBC TSMODBC user=admin pswd=admin//SQL Select * from LIBRARIES//ATTRIBUTESLIBRARY_NAME D 32 KEY ATOMIC @Library NameLIBRARY_TYPE D 12 @Library TypeACS_ID N 8 @ACS IdPRIVATE_CATEGORY N 8 @Private CategorySCRATCH_CATEGORY N 8 @Scratch CategoryEXTERNAL_MGR D 256 @External ManagerRSM_MEDIATYPE D 64 @RSM Media TypeSHARED D 12 @SharedLANFREE D 12 @LanFreeOBEYMOUNTRETENTION D 12 @ObeyMountRetentionPRIMARY_LIB_MGR D 64 @Primary Library ManagerAUTOLABEL D 24 @AutoLabelLAST_UPDATE_BY D 64 @Last Update by (administrator)LAST_UPDATE D 28 @Last Update Date/TimeLIBRARY_SERIAL D 64 @Serial NumberWORMSCRATCH_CAT N 8 @WORM Scratch CategoryRESETDRIVES D 12 @Reset Drives//NAME LIBVOLUMES S 300 @Library volumes//SOURCE ODBC TSMODBC user=admin pswd=admin//SQL Select * from LIBVOLUMES//ATTRIBUTESLIBRARY_NAME D 32 @Library NameVOLUME_NAME D 256 @Volume NameSTATUS D 12 @StatusOWNER D 64 @OwnerLAST_USE D 12 @Last UseHOME_ELEMENT N 20 @Home ElementCLEANINGS_LEFT N 12 @Cleanings LeftDEVTYPE D 4 @Device TypeMEDIATYPE N 12 @Media TypeOLD_STATUS D 12 @Orig Status//NAME LICENSES S 300 @Server feature licenses//SOURCE ODBC TSMODBC user=admin pswd=admin
504 Tivoli Management Services Warehouse and Reporting

//SQL Select * from LICENSES//ATTRIBUTESAUDIT_DATE D 28 @Last License AuditORACLE_ACT N 28 @Number of TDP for Oracle in useORACLE_TRYBUY N 28 @Number of TDP for Oracle in try buy modeMSSQL_ACT N 28 @Number of TDP for MS SQL Server in useMSSQL_TRYBUY N 28 @Number of TDP for MS SQL Server in try buy modeMSEXCH_ACT N 28 @Number of TDP for MS Exchange in useMSEXCH_TRYBUY N 28 @Number of TDP for MS Exchange in try buy modeLNOTES_ACT N 28 @Number of TDP for Lotus Notes in useLNOTES_TRYBUY N 28 @Number of TDP for Lotus Notes in try buy modeDOMINO_ACT N 28 @Number of TDP for Lotus Domino in useDOMINO_TRYBUY N 28 @Number of TDP for Lotus Domino in try buy modeINFORMIX_ACT N 28 @Number of TDP for Informix in useINFORMIX_TRYBUY N 28 @Number of TDP for Informix in try buy modeSAPR3_ACT N 28 @Number of TDP for SAP R/3 in useSAPR3_TRYBUY N 28 @Number of TDP for SAP R/3 in try buy modeESS_ACT N 28 @Number of TDP for ESS in useESS_TRYBUY N 28 @Number of TDP for ESS in try buy modeESSR3_ACT N 28 @Number of TDP for ESS R/3 in useESSR3_TRYBUY N 28 @Number of TDP for ESS R/3 in try buy modeEMCSYMM_ACT N 28 @Number of TDP for EMC Symmetrix in useEMCSYMM_TRYBUY N 28 @Number of TDP for EMC Symmetrix in try buy modeEMCSYMR3_ACT N 28 @Number of TDP for EMC Symmetrix R/3 in useEMCSYMR3_TRYBUY N 28 @Number of TDP for EMC Symmetrix R/3 in try buy modeWAS_ACT N 28 @Number of TDP for WAS in useWAS_TRYBUY N 28 @Number of TDP for WAS in try buy modeDATARET_ACT D 20 @Is IBM System Storage Archive Manager in use ?DATARET_LIC D 20 @Is IBM System Storage Archive Manager licensed ?TSMBASIC_ACT D 20 @Is Tivoli Storage Manager Basic Edition in useTSMBASIC_LIC D 20 @Is Tivoli Storage Manager Basic Edition licensedTSMEE_ACT D 20 @Is Tivoli Storage Manager Extended Edition in useTSMEE_LIC D 20 @Is Tivoli Storage Manager Extended Edition licensedCOMPLIANCE D 20 @Server License Compliance//NAME LICENSE_DETAILS S 300 @License usage details//SOURCE ODBC TSMODBC user=admin pswd=admin//SQL Select * from LICENSE_DETAILS//ATTRIBUTES
Appendix A. Example mdl file for the Tivoli Storage Manager Universal Agent scenario 505

LICENSE_NAME D 12 @License TypeNODE_NAME D 64 @Node NameLAST_USED D 28 @Last Access Date/TimeTRYBUY D 8 @Is Try Buy?//NAME LOG S 300 @Server recovery log information//SOURCE ODBC TSMODBC user=admin pswd=admin//SQL Select * from LOG//ATTRIBUTESAVAIL_SPACE_MB N 8 @Available Space (MB)CAPACITY_MB N 8 @Assigned Capacity (MB)MAX_EXTENSION_MB N 8 @Maximum Extension (MB)MAX_REDUCTION_MB N 8 @Maximum Reduction (MB)PAGE_SIZE C 999999 @Page Size (bytes)USABLE_PAGES N 8 @Total Usable PagesUSED_PAGES N 8 @Used PagesPCT_UTILIZED N 4 @Pct UtilMAX_PCT_UTILIZED N 4 @Max. Pct UtilPHYSICAL_VOLUMES N 8 @Physical VolumesLOG_POOL_PAGES N 8 @Log Pool PagesLOG_POOL_PCT_UTIL N 8 @Log Pool Pct. UtilLOG_POOL_PCT_WAIT N 8 @Log Pool Pct. WaitCONSUMPTION_MB N 20 @Cumulative Consumption (MB)CONSUMPTION_DATE D 28 @Consumption Reset Date/Time//NAME LOGSPACETRIGGER S 300 @Recovery Log space trigger information//SOURCE ODBC TSMODBC user=admin pswd=admin//SQL Select * from LOGSPACETRIGGER//ATTRIBUTESFULLPCT C 999999 @LOG Full PercentageEXPANSIONPCT C 999999 @LOG Space Expansion PercentageEXPANSION_PREFIX D 252 @LOG Expansion prefixMAXIMUM_LOG_SIZE N 8 @LOG Maximum Size (Megabytes)MIRROR_PREFIX_1 D 252 @Mirror Prefix 1MIRROR_PREFIX_2 D 252 @Mirror Prefix 2CHG_TIME D 28 @Last Update Date/TimeCHG_ADMIN D 64 @Last Update by (administrator)//NAME LOGVOLUMES S 300 @Recovery log volumes//SOURCE ODBC TSMODBC user=admin pswd=admin//SQL Select * from LOGVOLUMES//ATTRIBUTESCOPY1_NAME D 256 @Volume Name (Copy 1)COPY1_STATUS D 20 @Copy StatusCOPY2_NAME D 256 @Volume Name (Copy 2)COPY2_STATUS D 20 @Copy StatusCOPY3_NAME D 256 @Volume Name (Copy 3)COPY3_STATUS D 20 @Copy Status
506 Tivoli Management Services Warehouse and Reporting

AVAIL_SPACE_MB N 8 @Available Space (MB)ALLOC_SPACE_MB N 8 @Allocated Space (MB)FREE_SPACE_MB N 8 @Free Space (MB)//NAME MEDIA S 300 @Physical volumes managed by move media//SOURCE ODBC TSMODBC user=admin pswd=admin//SQL Select * from MEDIA//ATTRIBUTESVOLUME_NAME D 256 @Storage pool volumesSTATE D 20 @StateUPD_DATE D 28 @Last Update Date/TimeLOCATION D 256 @LocationSTGPOOL_NAME D 32 @Storage Pool NameLIB_NAME D 32 @Automated LibNameSTATUS D 8 @Volume StatusACCESS D 12 @AccessLRD D 28 @Last Reference Date//NAME MGMTCLASSES S 300 @Management classes//SOURCE ODBC TSMODBC user=admin pswd=admin//SQL Select * from MGMTCLASSES//ATTRIBUTESDOMAIN_NAME D 32 @Policy Domain NameSET_NAME D 32 @Policy Set NameCLASS_NAME D 32 @Mgmt Class NameDEFAULTMC D 20 @Default Mgmt Class ?DESCRIPTION D 256 @DescriptionSPACEMGTECHNIQUE D 80 @Space Management TechniqueAUTOMIGNONUSE C 999999 @Auto-Migrate on Non-UseMIGREQUIRESBKUP D 40 @Migration Requires Backup?MIGDESTINATION D 32 @Migration DestinationCHG_TIME D 28 @Last Update Date/TimeCHG_ADMIN D 32 @Last Update by (administrator)PROFILE D 256 @Managing profile//NAME NODES K 300 @Client nodes//SOURCE ODBC TSMODBC user=admin pswd=admin//SQL Select * from NODES//ATTRIBUTESNODE_NAME D 64 KEY ATOMIC @Node NamePLATFORM_NAME D 16 @PlatformDOMAIN_NAME D 32 @Policy Domain NamePWSET_TIME D 28 @Password Set Date/TimeINVALID_PW_COUNT C 999999 @Invalid Sign-on CountCONTACT D 256 @ContactCOMPRESSION D 8 @CompressionARCHDELETE D 12 @Archive Delete Allowed?BACKDELETE D 12 @Backup Delete Allowed?
Appendix A. Example mdl file for the Tivoli Storage Manager Universal Agent scenario 507

LOCKED D 12 @Locked?LASTACC_TIME D 28 @Last Access Date/TimeREG_TIME D 28 @Registration Date/TimeREG_ADMIN D 64 @Registering AdministratorLASTSESS_COMMMETH D 8 @Last Communication Method UsedLASTSESS_RECVD N 20 @Bytes Received Last SessionLASTSESS_SENT N 20 @Bytes Sent Last SessionLASTSESS_DURATION N 16 @Duration of Last SessionLASTSESS_IDLEWAIT N 16 @Idle Wait Last SessionLASTSESS_COMMWAIT N 16 @Comm. Wait Last SessionLASTSESS_MEDIAWAIT N 16 @Media Wait Last SessionCLIENT_VERSION C 999999 @Client VersionCLIENT_RELEASE C 999999 @Client ReleaseCLIENT_LEVEL C 999999 @Client LevelCLIENT_SUBLEVEL C 999999 @Client Sub-levelCLIENT_OS_LEVEL D 20 @Client OS LevelOPTION_SET D 64 @OptionsetAGGREGATION D 12 @Aggregated?URL D 200 @URLNODETYPE D 8 @Node TypePASSEXP N 8 @Password Expiration PeriodKEEP_MP D 12 @Keep Mount Point?MAX_MP_ALLOWED N 8 @Maximum Mount Points AllowedAUTO_FS_RENAME D 8 @Auto Filespace Rename VALIDATEPROTOCOL D 8 @Validate ProtocolTCP_NAME D 64 @TCP/IP NameTCP_ADDRESS D 64 @TCP/IP AddressGUID D 48 @Globally Unique IDTXNGROUPMAX N 8 @Transaction Group MaxDATAWRITEPATH D 12 @Data Write PathDATAREADPATH D 12 @Data Read PathSESSION_INITIATION D 256 @Session InitiationCLIENT_HLA D 64 @HLADDRESS CLIENT_LLA D 64 @LLADDRESS COLLOCGROUP_NAME D 32 @Collocation Group NamePROXY_TARGET D 256 @Proxynode TargetPROXY_AGENT D 256 @Proxynode Agent//NAME OCCUPANCY S 300 @Client storage occupancy//SOURCE ODBC TSMODBC user=admin pswd=admin//SQL Select * from OCCUPANCY//ATTRIBUTESNODE_NAME D 64 @Node NameTYPE D 20 @TypeFILESPACE_NAME D 64 @Filespace NameSTGPOOL_NAME D 32 @Storage Pool Name
508 Tivoli Management Services Warehouse and Reporting

NUM_FILES N 8 @Number of FilesPHYSICAL_MB N 16 @Physical Space Occupied (MB)LOGICAL_MB N 16 @Logical Space Occupied (MB)FILESPACE_ID N 8 @FSID//NAME OPTIONS S 300 @Server Options//SOURCE ODBC TSMODBC user=admin pswd=admin//SQL Select * from OPTIONS//ATTRIBUTESOPTION_NAME D 40 @Server OptionOPTION_VALUE D 256 @Option Setting//NAME PATHS S 300 @Paths//SOURCE ODBC TSMODBC user=admin pswd=admin//SQL Select * from PATHS//ATTRIBUTESSOURCE_NAME D 64 @Source NameSOURCE_TYPE D 16 @Source TypeDESTINATION_NAME D 132 @Destination NameDESTINATION_TYPE D 16 @Destination TypeLIBRARY_NAME D 64 @LibraryNODE_NAME D 64 @Node NameDEVICE D 64 @DeviceEXTERNAL_MANAGER D 256 @External ManagerLUN D 24 @LUNINITIATOR_ID N 8 @InitiatorDIRECTORY D 128 @DirectoryONLINE D 40 @On-LineLAST_UPDATE_BY D 64 @Last Update by (administrator)LAST_UPDATE D 28 @Last Update Date/Time//NAME POLICYSETS S 300 @Policy sets//SOURCE ODBC TSMODBC user=admin pswd=admin//SQL Select * from POLICYSETS//ATTRIBUTESDOMAIN_NAME D 32 @Policy Domain NameSET_NAME D 32 @Policy Set NameDEFMGMTCLASS D 32 @Default Mgmt Class NameDESCRIPTION D 256 @DescriptionCHG_TIME D 28 @Last Update Date/TimeCHG_ADMIN D 32 @Last Update by (administrator)PROFILE D 256 @Managing profile//NAME PROCESSES S 300 @Client schedule associations//SOURCE ODBC TSMODBC user=admin pswd=admin//SQL Select * from PROCESSES//ATTRIBUTESPROCESS_NUM N 8 @Process NumberPROCESS D 64 @Process Description
Appendix A. Example mdl file for the Tivoli Storage Manager Universal Agent scenario 509

START_TIME D 28 @Start Date/TimeFILES_PROCESSED N 8 @Files ProcessedBYTES_PROCESSED N 20 @Bytes ProcessedSTATUS D 256 @Status//NAME PROFILES S 300 @Profiles//SOURCE ODBC TSMODBC user=admin pswd=admin//SQL Select * from PROFILES//ATTRIBUTESCONFIG_MANAGER D 64 @Configuration managerPROFILE_NAME D 32 @Profile nameLOCKED D 12 @Locked?DESCRIPTION D 256 @Description//NAME PROF_ASSOCIATIONS S 300 @Profile associations//SOURCE ODBC TSMODBC user=admin pswd=admin//SQL Select * from PROF_ASSOCIATIONS//ATTRIBUTESCONFIG_MANAGER D 64 @Configuration managerPROFILE_NAME D 32 @Profile nameASSOC_OBJECT D 16 @Associated object typeOBJECT_NAME D 64 @Object name//NAME RECLAIM_ANALYSIS S 300 @Server reclamation analysis table//SOURCE ODBC TSMODBC user=admin pswd=admin//SQL Select * from RECLAIM_ANALYSIS//ATTRIBUTESCATEGORY D 12 @Analysis categoryNODE_NAME D 64 @Node NameFILESPACE_NAME D 256 @Filespace NameENTRYTYPE D 40 @Analysis file copy typeHL_NAME D 256 @Client high-level nameLL_NAME D 256 @Client low-level nameOBJTYPE D 16 @Object typeID D 100 @Object IdentifierAUDIT_STATE D 40 @Analysis object state//NAME RESTORES S 300 @Client restore operations//SOURCE ODBC TSMODBC user=admin pswd=admin//SQL Select * from RESTORES//ATTRIBUTESSESSION N 8 @Sess NumberRESTORE_STATE D 40 @Restore StateRESTORE_MINUTES N 8 @Elapsed MinutesNODE_NAME D 64 @Node NameFILESPACE_NAME D 256 @Filespace NameFILESPEC D 256 @File SpecFILESPACE_ID N 8 @FSID//NAME SAN S 300 @SAN attached devices
510 Tivoli Management Services Warehouse and Reporting

//SOURCE ODBC TSMODBC user=admin pswd=admin//SQL Select * from SAN//ATTRIBUTESDEVICE_TYPE D 20 @Device TypeVENDOR D 8 @VendorPRODUCT D 16 @ProductSERIAL D 64 @Serial NumberDEVICE D 64 @DeviceIS_DATAMOVER D 12 @Data MoverNODE_WWN D 16 @Node WWNPORT_WWN D 16 @Port WWNLUN N 8 @LUNSCSI_PORT N 8 @SCSI PortSCSI_BUS N 8 @SCSI BusSCSI_TARGET N 8 @SCSI Target//NAME SCRIPTS S 300 @Server Command Scripts//SOURCE ODBC TSMODBC user=admin pswd=admin//SQL Select * from SCRIPTS//ATTRIBUTESNAME D 32 @NameLINE N 8 @Line NumberCOMMAND D 256 @CommandCHG_TIME D 28 @Last Update Date/TimeCHG_ADMIN D 32 @Last Update by (administrator)//NAME SCRIPT_NAMES K 300 @Server Command Script Names//SOURCE ODBC TSMODBC user=admin pswd=admin//SQL Select * from SCRIPT_NAMES//ATTRIBUTESNAME D 32 KEY ATOMIC @NameDESCRIPTION D 256 @DescriptionCHG_TIME D 28 @Last Update Date/TimeCHG_ADMIN D 32 @Last Update by (administrator)PROFILE D 256 @Managing profile//NAME SERVERS K 300 @Remote server nodes//SOURCE ODBC TSMODBC user=admin pswd=admin//SQL Select * from SERVERS//ATTRIBUTESSERVER_NAME D 64 KEY ATOMIC @Server NameCOMMMETH D 8 @Comm. MethodHL_ADDRESS D 200 @High-level AddressLL_ADDRESS D 20 @Low-level AddressDESCRIPTION D 200 @DescriptionALLOWREPLACE D 12 @Allow ReplacementNODE_NAME D 64 @Node NameLASTACC_TIME D 28 @Last Access Date/Time
Appendix A. Example mdl file for the Tivoli Storage Manager Universal Agent scenario 511

LOCKED D 12 @Locked?COMPRESSION D 8 @CompressionARCHDELETE D 12 @Archive Delete Allowed?URL D 200 @URLREG_TIME D 28 @Registration Date/TimeREG_ADMIN D 64 @Registering AdministratorLASTSESS_RECVD N 20 @Bytes Received Last SessionLASTSESS_SENT N 20 @Bytes Sent Last SessionLASTSESS_DURATION N 8 @Duration of Last SessionLASTSESS_IDLEWAIT N 8 @Pct. Idle Wait Last SessionLASTSESS_COMMWAIT N 8 @Pct. Comm. Wait Last SessionLASTSESS_MEDIAWAIT N 8 @Pct. Media Wait Last SessionGRACE_DEL_PERIOD N 8 @Grace Deletion PeriodPROFILE D 256 @Managing profileSERVER_PWD_SET D 12 @Server Password SetSERVER_PWSET_TIME D 28 @Server Password Set Date/TimeSERVER_INVALID_PWC C 999999 @Invalid Sign-on Count for ServerVVNODE_PWD_SET D 12 @Virtual Volume Password SetVVNODE_PWSET_TIME D 28 @Virtual Volume Password Set Date/TimeVVNODE_INVALID_PWC C 999999 @Invalid Sign-on Count for Virtual Volume NodeVALIDATEPROTOCOL D 8 @Validate Protocol//NAME SERVER_GROUP K 300 @Server Groups//SOURCE ODBC TSMODBC user=admin pswd=admin//SQL Select * from SERVER_GROUP//ATTRIBUTESGROUP_NAME D 64 KEY ATOMIC @Server GroupDESCRIPTION D 256 @DescriptionCHG_TIME D 28 @Last Update Date/TimeCHG_ADMIN D 64 @Last Update by (administrator)PROFILE D 256 @Managing profile//NAME SESSIONS S 300 @Active client sessions//SOURCE ODBC TSMODBC user=admin pswd=admin//SQL Select * from SESSIONS//ATTRIBUTESSESSION_ID N 8 @Sess NumberSTART_TIME D 28 @Start Date/TimeCOMMMETHOD D 32 @Comm. MethodSTATE D 32 @Sess StateWAIT_SECONDS N 8 @Wait TimeBYTES_SENT N 20 @Bytes SentBYTES_RECEIVED N 20 @Bytes RecvdSESSION_TYPE D 20 @Sess TypeCLIENT_PLATFORM D 20 @PlatformCLIENT_NAME D 64 @Client Name
512 Tivoli Management Services Warehouse and Reporting

OWNER_NAME D 32 @User NameMOUNT_POINT_WAIT D 256 @Waiting for mount point(s)INPUT_MOUNT_WAIT D 256 @Waiting for mount of input volume(s)INPUT_VOL_WAIT D 256 @Waiting for input volume(s)INPUT_VOL_ACCESS D 256 @Waiting for mount of input volume(s)OUTPUT_MOUNT_WAIT D 256 @Waiting for mount of output volume(s)OUTPUT_VOL_WAIT D 256 @Waiting for output volume(s)OUTPUT_VOL_ACCESS D 256 @Current output volume(s)LAST_VERB D 32 @Last VerbVERB_STATE D 20 @Verb State//NAME SPACEMGFILES S 300 @Client space-managed files//SOURCE ODBC TSMODBC user=admin pswd=admin//SQL Select * from SPACEMGFILES//ATTRIBUTESNODE_NAME D 64 @Node NameFILESPACE_NAME D 64 @Filespace NameSTATE D 16 @File state (active, inactive)EXTOBJID D 128 @Client object ID for the fileOBJID N 20 @Server object ID for the client objectFILE_NAME D 256 @Client's Name for FileINSERT_DATE D 28 @Date/time that object was migratedDELETE_DATE D 28 @Date/time that object was deletedCLASS_NAME D 32 @Mgmt Class Name//NAME STATUS S 300 @Server status//SOURCE ODBC TSMODBC user=admin pswd=admin//SQL Select * from STATUS//ATTRIBUTESSERVER_NAME D 32 @Server NameSERVER_HLA D 64 @Server host name or IP addressSERVER_LLA D 32 @Server TCP/IP port numberSERVER_URL D 200 @Server URLSERVER_PASSSET D 12 @Server Password SetINSTALL_DATE D 28 @Server Installation Date/TimeRESTART_DATE D 28 @Server Restart Date/TimeAUTHENTICATION D 4 @AuthenticationPASSEXP C 999999 @Password Expiration PeriodINVALIDPWLIMIT C 999999 @Invalid Sign-on Attempt LimitMINPWLENGTH C 999999 @Minimum Password LengthWEBAUTHTIMEOUT C 999999 @WEB Admin Authentication Time-out (minutes)REGISTRATION D 8 @RegistrationAVAILABILITY D 20 @AvailabilityACCOUNTING D 4 @AccountingACTLOGRETENTION C 999999 @Activity Log RetentionSUMMARYRETENTION C 999999 @Activity Summary Retention Period
Appendix A. Example mdl file for the Tivoli Storage Manager Universal Agent scenario 513

LICENSEAUDITPERIOD C 999999 @License Audit PeriodLASTLICENSEAUDIT D 28 @Last License AuditLICENSECOMPLIANCE D 52 @Server License ComplianceSCHEDULER D 20 @Central SchedulerMAXSESSIONS C 999999 @Maximum SessionsMAXSCHEDSESSIONS C 999999 @Maximum Scheduled SessionsEVENTRETENTION C 999999 @Event Record Retention PeriodCLIENTACTDURATION C 999999 @Client Action DurationRANDOMIZE C 999999 @Schedule Randomization PercentageQUERYSCHEDPERIOD C 999999 @Query Schedule PeriodMAXCMDRETRIES C 999999 @Maximum Command RetriesRETRYPERIOD C 999999 @Retry PeriodSCHEDMODE D 12 @Scheduling ModesLOGMODE D 12 @Log ModeDBBACKTRIGGER D 40 @Database Backup TriggerACTIVERECEIVERS D 256 @Active ReceiversCONFIG_MANAGER D 12 @Configuration managerREFRESH_INTERVAL C 999999 @Refresh intervalLAST_REFRESH D 28 @Last refresh date/timeCROSSDEFINE D 4 @CrossdefineSUBFILE D 28 @Subfile BackupCONTEXT_MESSAGING D 16 @Context MessagingSERVERFREE_STATUS D 28 @Server-free StatusSERVERFREE_BATCH C 999999 @Server-free Batch SizeTOCLOADRETENTION C 999999 @Table of Contents (TOC) Load RetentionMACHINE_GUID D 48 @Machine GUIDARCHRETPROT D 4 @Archive Retention ProtectionPLATFORM D 32 @PlatformVERSION N 8 @VersionRELEASE N 8 @ReleaseLEVEL N 8 @LevelSUBLEVEL N 8 @Sublevel//NAME STGPOOLS K 300 @Storage pools//SOURCE ODBC TSMODBC user=admin pswd=admin//SQL Select * from STGPOOLS//ATTRIBUTESSTGPOOL_NAME D 32 KEY ATOMIC @Storage Pool NamePOOLTYPE D 32 @Storage Pool TypeDEVCLASS D 32 @Device Class NameEST_CAPACITY_MB N 20 @Estimated CapacityTRIGGER_PCT_UTIL N 4 @Space Trigger UtilPCT_UTILIZED N 4 @Pct UtilPCT_MIGR N 4 @Pct MigrPCT_LOGICAL N 4 @Pct LogicalHIGHMIG C 999999 @High Mig Pct
514 Tivoli Management Services Warehouse and Reporting

LOWMIG C 999999 @Low Mig PctMIGPROCESS C 999999 @Migration ProcessesNEXTSTGPOOL D 32 @Next Storage PoolMAXSIZE N 20 @Maximum Size ThresholdACCESS D 16 @AccessDESCRIPTION D 256 @DescriptionOVFLOCATION D 256 @Overflow LocationCACHE D 4 @Cache Migrated Files?COLLOCATE D 20 @Collocate?RECLAIM C 999999 @Reclamation ThresholdMAXSCRATCH N 8 @Maximum Scratch Volumes AllowedNUMSCRATCHUSED N 8 @Number of Scratch Volumes UsedREUSEDELAY C 999999 @Delay Period for Volume ReuseMIGR_RUNNING D 20 @Migration in Progress?MIGR_MB N 4 @Amount Migrated (MB)MIGR_SECONDS N 8 @Elapsed Migration Time (seconds)RECL_RUNNING D 20 @Reclamation in Progress?CHG_TIME D 28 @Last Update Date/TimeCHG_ADMIN D 32 @Last Update by (administrator)RECLAIMSTGPOOL D 32 @Reclaim Storage PoolMIGDELAY N 8 @Migration DelayMIGCONTINUE D 20 @Migration ContinueDATAFORMAT D 12 @Storage Pool Data FormatCOPYSTGPOOLS D 256 @Copy Storage Pool(s)COPYCONTINUE D 20 @Continue Copy on Error?CRCDATA D 12 @CRC DataRECLAIMPROCESS C 999999 @Reclamation ProcessesOFFSITERCLMLIMIT D 8 @Offsite Reclamation LimitRECLAMATIONTYPE D 12 @Reclamation Type//NAME STGSPACETRIGGER K 300 @Storage Pool space trigger information//SOURCE ODBC TSMODBC user=admin pswd=admin//SQL Select * from STGSPACETRIGGER//ATTRIBUTESFULLPCT C 999999 KEY @STGPOOL Full PercentageEXPANSIONPCT C 999999 @STGPOOL Expansion PercentageEXPANSION_PREFIX D 252 @STGPOOL Expansion prefixSTGPOOL D 32 @STGPOOLCHG_TIME D 28 @Last Update Date/TimeCHG_ADMIN D 64 @Last Update by (administrator)//NAME SUBSCRIPTIONS S 300 @Subscriptions//SOURCE ODBC TSMODBC user=admin pswd=admin//SQL Select * from SUBSCRIPTIONS//ATTRIBUTESCONFIG_MANAGER D 64 @Configuration managerPROFILE_NAME D 32 @Profile name
Appendix A. Example mdl file for the Tivoli Storage Manager Universal Agent scenario 515
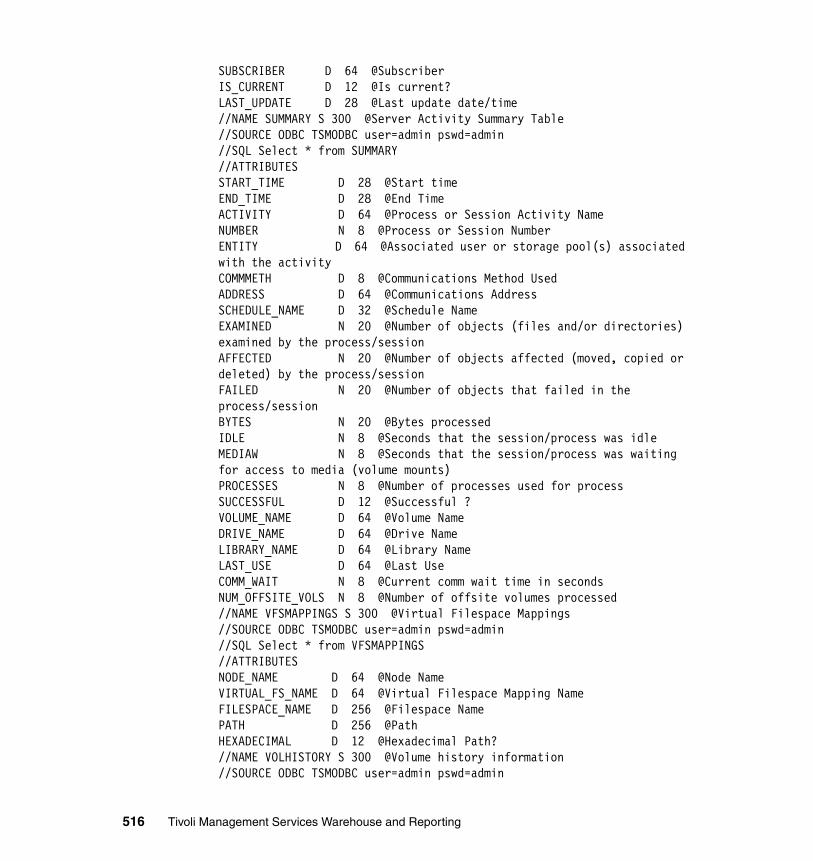
SUBSCRIBER D 64 @SubscriberIS_CURRENT D 12 @Is current?LAST_UPDATE D 28 @Last update date/time//NAME SUMMARY S 300 @Server Activity Summary Table//SOURCE ODBC TSMODBC user=admin pswd=admin//SQL Select * from SUMMARY//ATTRIBUTESSTART_TIME D 28 @Start timeEND_TIME D 28 @End TimeACTIVITY D 64 @Process or Session Activity NameNUMBER N 8 @Process or Session NumberENTITY D 64 @Associated user or storage pool(s) associated with the activityCOMMMETH D 8 @Communications Method UsedADDRESS D 64 @Communications AddressSCHEDULE_NAME D 32 @Schedule NameEXAMINED N 20 @Number of objects (files and/or directories) examined by the process/sessionAFFECTED N 20 @Number of objects affected (moved, copied or deleted) by the process/sessionFAILED N 20 @Number of objects that failed in the process/sessionBYTES N 20 @Bytes processedIDLE N 8 @Seconds that the session/process was idleMEDIAW N 8 @Seconds that the session/process was waiting for access to media (volume mounts)PROCESSES N 8 @Number of processes used for processSUCCESSFUL D 12 @Successful ?VOLUME_NAME D 64 @Volume NameDRIVE_NAME D 64 @Drive NameLIBRARY_NAME D 64 @Library NameLAST_USE D 64 @Last UseCOMM_WAIT N 8 @Current comm wait time in secondsNUM_OFFSITE_VOLS N 8 @Number of offsite volumes processed//NAME VFSMAPPINGS S 300 @Virtual Filespace Mappings//SOURCE ODBC TSMODBC user=admin pswd=admin//SQL Select * from VFSMAPPINGS//ATTRIBUTESNODE_NAME D 64 @Node NameVIRTUAL_FS_NAME D 64 @Virtual Filespace Mapping NameFILESPACE_NAME D 256 @Filespace NamePATH D 256 @PathHEXADECIMAL D 12 @Hexadecimal Path?//NAME VOLHISTORY S 300 @Volume history information//SOURCE ODBC TSMODBC user=admin pswd=admin
516 Tivoli Management Services Warehouse and Reporting

//SQL Select * from VOLHISTORY//ATTRIBUTESDATE_TIME D 28 @Date/TimeUNIQUE N 8TYPE D 20 @Volume TypeBACKUP_SERIES C 999999 @Backup SeriesBACKUP_OPERATION C 999999 @Backup OperationVOLUME_SEQ C 999999 @Volume SeqDEVCLASS D 32 @Device ClassVOLUME_NAME D 256 @Volume NameLOCATION D 256 @Volume LocationCOMMAND D 256 @Command//NAME VOLUMES S 300 @Storage pool volumes//SOURCE ODBC TSMODBC user=admin pswd=admin//SQL Select * from VOLUMES//ATTRIBUTESVOLUME_NAME D 256 @Volume NameSTGPOOL_NAME D 32 @Storage Pool NameDEVCLASS_NAME D 32 @Device Class NameEST_CAPACITY_MB N 20 @Estimated CapacitySCALEDCAP_APPLIED N 8 @Scaled Capacity AppliedPCT_UTILIZED N 4 @Pct UtilSTATUS D 20 @Volume StatusACCESS D 20 @AccessPCT_RECLAIM N 4 @Pct. Reclaimable SpaceSCRATCH D 20 @Scratch Volume?ERROR_STATE D 20 @In Error State?NUM_SIDES C 999999 @Number of Writable SidesTIMES_MOUNTED N 8 @Number of Times MountedWRITE_PASS N 8 @Write Pass NumberLAST_WRITE_DATE D 28 @Approx. Date Last WrittenLAST_READ_DATE D 28 @Approx. Date Last ReadPENDING_DATE D 28 @Date Became PendingWRITE_ERRORS N 8 @Number of Write ErrorsREAD_ERRORS N 8 @Number of Read ErrorsLOCATION D 256 @Volume LocationMVSLF_CAPABLE D 4 @Volume is MVS Lanfree Capable CHG_TIME D 28 @Last Update Date/TimeCHG_ADMIN D 32 @Last Update by (administrator)BEGIN_RCLM_DATE D 28 @Begin Reclaim PeriodEND_RCLM_DATE D 28 @End Reclaim Period
Appendix A. Example mdl file for the Tivoli Storage Manager Universal Agent scenario 517

//NAME VOLUMEUSAGE S 300 @SEQUENTIAL volume usage by client node//SOURCE ODBC TSMODBC user=admin pswd=admin//SQL Select * from VOLUMEUSAGE//ATTRIBUTESNODE_NAME D 64 @Node NameCOPY_TYPE D 16 @TypeFILESPACE_NAME D 64 @Filespace NameSTGPOOL_NAME D 32 @Storage Pool NameVOLUME_NAME D 256 @Volume NameFILESPACE_ID N 8 @FSID//NAME COLUMNS S 300 @SQL Table Column Catalog//SOURCE ODBC TSMODBC user=admin pswd=admin//SQL Select * from COLUMNS//ATTRIBUTESTABSCHEMA D 8 @Table schema name (qualifier)TABNAME D 20 @Table NameCOLNAME D 20 @Column nameCOLNO C 999999 @Column numberINDEX_KEYSEQ C 999999 @Column key sequence numberINDEX_ORDER D 4 @Index key sequence (A - ascending D - descending)TYPENAME D 40 @Column data typeLENGTH N 8 @Column lengthSCALE C 999999 @Columns scale (for decimal or numeric columns)NULLS D 8 @Can column contain NULL values ?REMARKS D 252 @Description//NAME ENUMTYPES K 300 @SQL Enumerated Types Catalog//SOURCE ODBC TSMODBC user=admin pswd=admin//SQL Select * from ENUMTYPES//ATTRIBUTESTYPEINDEX N 8 KEY ATOMIC @Unique index code for enumerated typeTYPENAME D 20 @Declared enumerated type nameVALUECOUNT N 8 @Number of distinct enumeration valuesVALUES D 252 @List of enumeration value names ( ordinal position within type )REMARKS D 252 @Description//NAME TABLES S 300 @SQL Table Catalog//SOURCE ODBC TSMODBC user=admin pswd=admin//SQL Select * from TABLES
518 Tivoli Management Services Warehouse and Reporting

//ATTRIBUTESTABSCHEMA D 8 @Table schema name (qualifier)TABNAME D 20 @Table NameCREATE_TIME D 28 @Date/time of creationCOLCOUNT C 999999 @Number of columns in tableINDEX_COLCOUNT C 999999 @Number of index columnsUNIQUE_INDEX D 8 @Is the index unique ?REMARKS D 252 @Description
Note: The following products are trademarked:
� SAP® R/3� IBM System Storage™� IBM Lotus® Notes®
Appendix A. Example mdl file for the Tivoli Storage Manager Universal Agent scenario 519

520 Tivoli Management Services Warehouse and Reporting

Appendix B. Additional material
This redbook refers to additional material that can be downloaded from the Internet as described below.
Locating the Web materialThe Web material associated with this redbook is available in softcopy on the Internet from the IBM Redbooks Web server. Point your Web browser to:
ftp://www.redbooks.ibm.com/redbooks/SG247290
Alternatively, you can go to the IBM Redbooks Web site at:
ibm.com/redbooks
Select the Additional materials and open the directory that corresponds with the redbook form number, SG247290.
B
© Copyright IBM Corp. 2007. All rights reserved. 521

Using the Web materialThe additional Web material that accompanies this redbook includes the following files:
File name DescriptionSG247290.zip Zipped rpt design files
System requirements for downloading the Web materialThe following system configuration is recommended:
Hard disk space: 10 MB minimumOperating System: Windows/Linux/UNIX
How to use the Web materialCreate a subdirectory (folder) on your workstation, and unzip the contents of the Web material zip file into this folder.
522 Tivoli Management Services Warehouse and Reporting

acronyms
ARM Application Response Measurement
ASFS API, Socket, File, Script
BCM Byte Code Modification
BIRT Business Intelligence and Reporting Tools
CCMDB Change and Configuration Management Database
CICS Customer Information Control System
DBA database administrator
DMS Database Managed Space
DMT Dictionary-managed tablespace
DoS Denial of Service
ECC error correction code
ESS Enterprise Storage Server
HACMP High Availability Cluster Multi-Processing, Enhanced Scalability
IBM International Business Machines Corporation
IMS Information Management System
ITSO International Technical Support Organization
J2EE Java 2 Platform, Enterprise Edition
JDBC Java Database Connectivity
LMT Locally-managed tablespace
MDC Multi-Dimensional Clustering
MQT materialized query table
MSCS Microsoft Cluster Server
NIC networking interface card
ODBC Open Database Connectivity
Abbreviations and
© Copyright IBM Corp. 2007. All rights reserved.
ODI Object Definition Interchange
ODS operational data store
OPAL Open Process Automation Library
PDS partitioned data set
RID row identifier
RPC remote procedure call
SA system administrator
SGA system global area
sheapthres Sort heap threshold
SLA service level agreement
SLM service level management
SMS System Managed Space
SOA Service-Oriented Architecture
SOAP Simple Object Access Protocol
SPA Summarization and Pruning agent
TCAM Tivoli Composite Application Manager
TCO total cost of ownership
TEMA Tivoli Enterprise Monitoring Agent
TEMS Tivoli Enterprise Monitoring Server
TEP Tivoli Enterprise Portal
TEPS Tivoli Enterprise Portal Server
TM Tivoli Monitoring
TME Tivoli Management Environment
TSM Tivoli Storage Manager
523

524 Tivoli Management Services Warehouse and Reporting

Related publications
The publications listed in this section are considered particularly suitable for a more detailed discussion of the topics covered in this redbook.
IBM Redbooks� Deployment Guide Series: IBM Tivoli Monitoring Express Version 6.1,
SG24-7217
PublicationsThese publications are also relevant as further information sources:
� IBM Tivoli Monitoring for Tivoli Enterprise Console, GC32-1959
� IBM Tivoli Monitoring Installation and Setup Guide, GC32-9407
� IBM Tivoli Composite Application Manger for SOA: Installing and Using Project Crystal, GC32-9492
� IBM DB2 UDB Administration Guide: Implementation V8.2, SC09-4820
� IBM Tivoli Service Level Advisor Command Reference v2.1.1, SC32-0833
� Getting Started with IBM Tivoli Service Level Advisor v2.1, SC32-0834
� IBM Tivoli Service Level Advisor Administrator's Guide v2.1.1, SC32-0835
� IBM Tivoli Monitoring Administering Tivoli Monitoring Guide, SC32-9408
� IBM Tivoli Monitoring Universal Agent User's Guide, SC32-9459
© Copyright IBM Corp. 2007. All rights reserved. 525

Online resourcesThese Web sites and URLs are also relevant as further information sources:
� IBM Tivoli Monitoring information center
http://publib.boulder.ibm.com/infocenter/tivihelp/v15r1/index.jsp?toc=/com.ibm.itm.doc/toc.xml
� IBM Tivoli Storage Manager Version 5.3.3 Tivoli Storage Manager ODBC Driver for Windows
http://publib.boulder.ibm.com/infocenter/tivihelp/v1r1/index.jsp?topic=/com.ibm.itsmreadme.doc/WINDOWS/ODBC/README_odbc_enu.htm
� IBM: IBM DB2 Driver for JDBC and SQLJ
https://www14.software.ibm.com/webapp/iwm/web/reg/download.do?source=swg-dm-db2jdbcdriver&S_PKG=dl&S_TACT=dm-db2jdbcdriver&lang=it_IT&cp=UTF-8
� Information about database normalization
http://en.wikipedia.org/wiki/Database_normalization
� Primeur Web site
http://www.primeur.com
� Primeur Quick Reporter for IBM Tivoli Monitoring Web site
http://www.primeur.com/products/system_management/tivoli/qr4itm_v13.html
� Axibase Web site
http://www.axibase.com
� Axibase Warehouse Designer for IBM Tivoli Monitoring V6.1 Web site
http://www.axibase.com/tivoli
� BIRT Web site
http://www.eclipse.org/birt/phoenix/
� BIRT Report Downloads
http://download.eclipse.org/birt/downloads
� Apache Tomcat site for specific installation instructions
http://tomcat.apache.org/index.html
� Web site to download DB2 fix packs
http://www.ibm.com/software/data/db2/udb/support/downloadv8.html
526 Tivoli Management Services Warehouse and Reporting

� Web site to download Oracle ODBC drivers
http://www.oracle.com/technology/software/tech/windows/odbc/htdocs/utilsoft.html
� Crystal Reports Web site
http://www.businessobjects.com/products/reporting/crystalreports
� Crystal Reports for Eclipse Web site
http://www.eclipseplugincentral.com/Web_Links-index-req-viewlink-cid-670.html
� Crystal Reports documentation
http://support.businessobjects.com/documentation/product_guides/default.asp
� JSR-000109 Implementing Enterprise Web Services
http://www.jcp.org/aboutJava/communityprocess/final/jsr109/
� Creating SOAP Message Handlers to Intercept the SOAP Message
http://e-docs.bea.com/wls/docs81/webserv/interceptors.html
� IBM Software - DB2 DataPropagator - Product Overview
http://www-306.ibm.com/software/data/integration/replication
� IBM Software - DB2 Data Warehouse Edition - Product Overview
http://www-306.ibm.com/software/data/db2/dwe/
� IBM Software - WebSphere DataStage - Product Overview
http://www-306.ibm.com/software/data/integration/datastage/
� IBM Tivoli Open Process Automation Library
http://catalog.lotus.com/wps/portal/topal/
Related publications 527

How to get IBM RedbooksYou can search for, view, or download Redbooks, Redpapers, Hints and Tips, draft publications and Additional materials, as well as order hardcopy Redbooks or CD-ROMs, at this Web site:
ibm.com/redbooks
Help from IBMIBM Support and downloads
ibm.com/support
IBM Global Services
ibm.com/services
528 Tivoli Management Services Warehouse and Reporting

Index
Symbols(TCO) total cost of ownership 25.rptdesign file 424.tec_config file 157
Aaccess plan 282Active Correlation Technology (ACT) 152Active Directory 388aggregation behavior characterization attributes
count 67gauge 67low 68pdel 69peak 68property 68samplecount 68state 69
Alphabox 11analytical reporting 8ANSI tuning tips 295Apache Tomcat 392API (application programming interface) 320API Server 318–319API-Socket-File-Script (ASFS) 318–319application design details and SQL tuning 277application internals 319application programming interface (API) 318–320Application Response Measurement (ARM) 16application server 224application-related problems 16ARM (Application Response Measurement) 16ASFS (API-Socket-File-Script) 318attribute group 32, 57, 60, 64, 321, 323–324
attribute list 323binary file 55data redirection 321default 58definitions 63detailed table 60historical data collection 58, 325multiple summarization tables 60object definitions 69
© Copyright IBM Corp. 2007. All rights reserved.
RDBMS 60single-instance 62Tivoli Data Warehouse 150
autogrowth parameter 490availability 48
Bbatch inserts 98batch option 123, 243
Linux/UNIX 243Windows 243
batch processing 243BCM (Byte Code Modification) 203BEA WebLogic 17, 225binary 24-hour data 54binding the package 237BIRT Designer 393BIRT Report Viewer 394BIRT Reporting Interface 410Brio 11buffer cache 268buffer pools 47, 257, 264Business Intelligence 8Business Objects 427Byte Code Modification (BCM) 203
CCCMDB (Change and Configuration Management Database) 4central processing unit (CPU) 253Change and Configuration Management Database (CCMDB) 4Chart Expert 457CICS (Customer Information Control System) 17client-side interception 220cluster 45
overview 45collection
interval 149location 150
commandcommEnv.sh 227KD4configDC 225
529

KD4configDC.sh 225setDomainEnv.sh 227setEnv 227
commEnv.sh 227common communication transports 96Concurrency control and isolation level
serializable 310concurrency control and isolation level 307, 309, 311
read committed 309read-only 309
configure groups 150COUNT parameter 36CPU (central processing unit) 253creation
chart 456nicknames 237server definition 237user mapping 237wrapper 236
crontab 425Crystal Reports 11, 428–429, 448–449, 451, 455
.rpt 428creating a chart 456creating a data source 433Crystal Reports for Eclipse 428Crystal Syntax 449developed solution 428filters 451Formula Field 448groups 455licensed copy 428parameters 451process data on-demand basis 449report file format 428reporting 427showing SQL of the report 454SQL Expression Field 449third-party tool 428TMESTAMP field 449Web site
installing 429sample reports 428
CTIRA_NCSLISTEN environment variable 96cursor stability 307Customer Information Control System (CICS) 17
Ddata collection 318–319, 325data mart 10, 13, 76, 235
departmental control 235primary purpose 235types
better performance 235data provider (DP) 320, 326
right choice 319data source 118, 317, 319, 321, 324, 326data stripe mirroring 49data warehouse 111, 118database
maintenance 260, 271normalization 10specific 307
database tuning 243SQL tuning 277
data-striping 49DB2 60, 253, 307
8.2 Control Center 62catalog 261table spaces 416Unicode 434
defaultattribute groups 29, 58historical data collection 29IP.PIPE port 34proxy agent 126retention configuration 103
degree of clustering 290delta-based aggregation 68dependent data mart 236deployment descriptor 226detailed data 54, 67, 76–77
SUM values 67detailed data, 24 hours 11detailed tables 64dfa register command 173dimension tables 10disk
arrays 49copy 52mirroring 48, 50parity 50
disproportionate distribution of agents 29DISTINCT clause 298DP (data provider) 320dsutil 169
530 Tivoli Management Services Warehouse and Reporting

dsutil utility 168duplexing 50dynamic SQL 263
Eeasier to manipulate 10Eclipse installation 393encryption of the transferred data 96enumeration 69environment file 105Ephemeral Pipe 38–39Error Correction Code 50ETL (extract, transform, and load) 167Event Viewer 474exporter threads 98Extensible Markup Language (XML) 174external ODBC data source 379extract, transform, and load (ETL)
mechanism 167tool 240
Ffact tables 10failover 45, 47
support 45failure 42
disk 48hardware 43media 48scenarios 44
federated database objects 236federated global catalog 237filtering 407firewall
considerations 33restrictions 39
firewall with NATEphemeral Pipe 38partitioning 39
FlashCopy 51Formula Field 448Framework MDist2 architecture 12
GGA (general availability) 33general availability (GA) 33general SQL review process 277
general SQL-ANSI tuning tips 295generated report 424Global Location Broker 37graphical user interface (GUI) 11GUI (graphical user interface) 11
HHACMP (High Availability Cluster Multi-Processing) 45hardware and operating system usage 253
choosing disk drives 255CPU utilization 253I/O utilization 254memory 253network 256recommendations 255
hd.ini 473hd.ini file 98, 243HDR file 60heartbeat monitoring 46high availability 42High-Availability Cluster Multi-Processing (HACMP) 45, 47high-level architecture 20historical data collection 52, 54, 58, 147, 325
architecture 52component flows 54data tables and attributes 57long-term data 53short-term data 52
History Collection Configuration window 137human-readable format 401, 416
IIBM DB2 Data Warehouse Edition 240IBM DB2 DataPropagator 239–240IBM IT Service Management 4
solution 2IBM Tivoli Availability Process Manager 16IBM Tivoli Composite Application Manager 16IBM Tivoli Composite Application Manager for Re-sponse Time Tracking 188
agent configuration steps 192collecting historical data 198configuration
Linux and UNIX systems 196Windows systems 189
response time information 188
Index 531

Tivoli Data Warehouse integration 188workspace examples 199
IBM Tivoli Composite Application Manager for SOA 219–220
agent configuration 221configuring for BEA WebLogic data collector 226Linux and UNIX systems 223Windows systems 221
collecting agent historical data 227configuring for WebSphere Application Server data collector 225directory structure 224integration architecture 220integration with Tivoli Data Warehouse 219KD4configDC 225server-side interception 220workspace examples 229
IBM Tivoli Composite Application Manager for Web-Sphere 201
agent configurationLinux and UNIX systems 211
collecting historical data 213configuration 203J2EE Server log messages 202performance data 201WebSphere Application log messages 202workspace examples 215
IBM Tivoli Enterprise Console 15IBM Tivoli Monitoring 14, 188, 321, 326
V5.x 12V6.1 11
IBM Tivoli Monitoring Agent 317, 321, 324IBM Tivoli Open Process Automation Library (OPAL) 388IBM Tivoli Service Level Advisor 15, 177
configuration steps 168configuring the data source 168database 168dsutil command 169example reports 186maxconnections 169scmd commands 171SLM Administration Server 169SLM Reports 169SLM Server 169troubleshooting information 170
IBM Tivoli Universal Agent 316, 318–319architecture 317
autonomous entity 318collected data 324configuring 327, 348data flow 317data interfaces 317data provider 318deployment scenarios 326manipulating data with TEP 324metafiles 321ODBC provider 348production versions 320thread 318Tivoli Storage Manager scenario 348Universal Agent scenario
configuring 348mdl file 349
when to use 326IBM WebSphere Application Server 225IBM WebSphere applications 17IBM WebSphere Process Server 17idle mode 46idle standby 46implementation differences 10IMS (Information Management System) 17incoming RPC calls 96indexed views 270industry best practices 2Information Management System (IMS) 17installations with firewalls 38Intelligent Remote Agent (IRA) 95IP.PIPE 33–34, 42
protocol 34, 96ip.pipe server/client configuration 96IP.SPIPE protocol 96IRA communication framework 96IT Operational Management 2
products 2IT Service Management platform 2itext-1.3.jar file 394ITMUser 116
JJ2EE environments 16JAR files 122Java Database Connectivity (JDBC)
bridge 98driver files 119driver name 122
532 Tivoli Management Services Warehouse and Reporting
drivers 130, 140, 394JDBC-based clients 103
Java Management Extensions (JMX)JMX (Java Management Extensions) 203
Java Virtual Machine Tool Interface (JVMTI) 203javax.xml.rpc.handler.HandlerInfo 226javax.xml.rpc.handler.HandlerRegistry 226JAX-RPC handler 220JDBC (Java Database Connectivity) 103jdbc.sqlserver 123JNI (Java Native Interface)
JNI (Java Native Interface) 98JVM heap size 108JVMTI (Java Virtual Machine Tool Interface) 203
KKD4configDC command 225KD4configDC options 225KD4configDC.sh 225KD4configDC.sh command 225KDC_DEBUG 39KDC_DEBUG=Y 39KDC_FAMILIES 38KDC_PARTITION 38KDCB0_HOSTNAME 37–38KDEB_INTERFACELIST 37KDSSTART LBDAEMON 38keepalive packets 46key IT processes 2key SOA platforms 17KHD_BATCH_USE=Y 98KHD_CNX_POOL_SIZE 100KHD_EXPORT_THREADS 98, 100KHD_QUEUE_LENGTH 100KHD_SRV_STATUSTIMEOUT 101KHD_STATUSTIMEOUT 101KHD_WAREHOUSE_TEMS_LIST 473khdenv 473khdexp.cfg 100khdxcl1 100KPX_WAREHOUSE_REGCHK 473KSY_MAX_WORKER_THREADS 30, 107ksy610.exe 65KSYENV file 108KUMA_STARTUP_DP 348KUMENV file 320KUMP_DPCONSOLE_PORT 320
Lless secure zone 39Linux OS agent 149Linux_CPU data set 409Linux_Process 59listening ports, default 34load projection spreadsheet 77LoadRunner 16localhost 122locking 308, 310, 313log file 316, 319, 322, 326logs 258, 269long-term data 53
Mmain data warehouse 236Manage Tivoli Enterprise Monitoring Services utility 120managed system 73, 322, 324Manager of Managers 30manual creation of data tables 241
benefits 241files needed 241procedure 241SQL files created 242
massively parallel processor (MPP) 254materialized query table (MQT) 259
creation step 239materialized views 267maxconnections 170MDist2 12MDist2 architecture 12mdl file 332, 349, 373memory 253Mercury LoadRunner 16metafile 316–318, 321, 323
control statement 321APPL 321ATTRIBUTES 322CONFIRM 322INTERNAL 321NAME 321RECORDSET 321SNMP 321SOURCE 321SQL 322SUMMARY 322
example 322
Index 533

metric log files 151Microsoft .NET 17, 219Microsoft Cluster Server 45minconnections 170mirroring 48Mission Critical Linux 45monitoring agent 54, 62, 65monitoring agent for DB2
attribute groups 58binary table name 59
monitoring agent for Linuxattribute groups 58binary table name 59
monitoring agent for UNIXattribute groups 58binary table name 59
monitoring agent for Windows OSattribute groups 58binary table name 59
monitoring server 66monitoring solution 316, 326monitoring tools 264, 268, 274MPP (massively parallel processor) 254MQT (materialized query table) 259MS SQL 111MSCS 45, 47Multi-Computer/ServiceGuard 45multiple network interface cards 37multiple Warehouse Proxies 101, 126mutual takeover 46–47
NNAT (network address translation) 38navigate multiple interfaces 11NCS listen threads 96network address translation (NAT) 35, 38NIC 37nodes 45NT_Memory attribute group 63NT_System table 236NTPROCSSR.hdr 60
OObject Definition Interchange (ODI) 69
file 69–70file, TABLE keyword 70keyword
*ATTR
71*BEHAV
71*OBJECT
71*TABLE
70*TYPE
71ODBC (Open Database Connectivity) 40ODI (Object Definition Interchange) 69OEM (original equipment manufacturer) 13OLAP (online analytical processing) 13online analytical processing (OLAP) 13OPAL (Open Process Automation Library) 388OPAL catalog 388Open Database Connectivity (ODBC) 40
bridge 98connection 40data provider 322, 326mdl file 349
operating system (OS) 316, 319operational database 13Oracle 264, 309, 388original equipment manufacturer (OEM) 13outage 43
Ppartitioned database 47PDS (Persistent Data Storage) 52PDS history data set 53performance 48, 50–51
degradation 46goal 291trends 18
Performance Monitoring Infrastructure (PMI) 201performance tuning
Summarization and Pruning Agent 107PMI (Performance Monitoring Infrastructure) 203prefetch size 290Primeur 388product code 125pruning settings 141, 150
Qquery tuning 309, 311, 314querying the nicknames 238QuickReporter
534 Tivoli Management Services Warehouse and Reporting

for IBM Tivoli Monitoring 388for ITM version 1.3 389
RRAID (Redundant Arrays of Independent Disks) 48RAID-0 49–50RAID-1 49–50RAID-5 49–50RAS log 107raw data 10, 55, 66RDBMS (relational database management system) 60RDBMS troubleshooting 476
DB2Network problems 477Querying problems 479
Microsoft SQL Server 487network problems 487querying problems 488
Oracle 482network problems 482querying problems 483
read stability 307real-time data 20REBIND 263RECORDSET statement 323Redbooks Web site 528
Contact us xxviiiredo logs 265redundancy 49Redundant Arrays of Independent Disks
technologyvariety 49
Redundant Arrays of Independent Disks (RAID) 48array classifications 49classifications 49technology
performance 49reliability 49size 49
refresh deferred option 239refresh status 151relational data
base 326relational database management system (RDBMS) 11, 53, 55, 60, 112remote database 243remote procedure call (RPC) 96
listeners 100remote Tivoli Enterprise Monitoring Server 29repeatable read 307report
file format 428layout 409
report engine installation file 394reporting
better performance 235Crystal Reports 427
reporting strategy 6Response Time Tracking 16restore 45review application SQL for efficiencies 277RIM API 152RIM database 13robust GUI 11rollup process 65row-based schema 10RPC (remote procedure call) 96rpt design files 393RUNSTATS 261
SSAS 11scalability differences 12scalable environment 32schedule a report 425scmd dfa commands 170scmd dfa register 174scmd dfa unregister 174SCSI (Small Computer System Interface) 50secure zone 40selected attribute group
Tivoli Data Warehouse 150server time out 101server-side interception 220service extension 220service level management (SLM) 15ServiceGuard 45setDomainEnv.sh 227setDomainEnv.sh command 227setEnv command 227setup_env.cmd 154setup_env.sh 154short-term binary tables 58short-term data 52show default groups 148, 150
Index 535

showing SQL 454Simple Network Management Protocol (SNMP) 318Simple Object Access Protocol (SOAP) 220single hub monitoring server 126SKIP parameter 36SLM (service level management) 15SLM database 172SLM Reports 169SLM Server 169–170SLMAdmin 170SLMReport 170Small Computer System Interface (SCSI) 50SMF (System Management Facility) 203SMP (symmetric multiprocessor) 254SNMP (Simple Network Management Protocol) 318SOA services 17SOAP (Simple Object Access Protocol) 220SOAP/HTTP(S) 17SOAP/JMS 17sockets 42specific DB2 functions 393split mirror 45, 51SQL
statement 323tuning scenario 292
SQL (Structured Query Language) 16SQL Expression Field 448SQL Select 318SQL Server 311standby 45
machine 45mode 46
star schema 10, 13, 92Start Collection 150Static SQL 264Steeleye 45Stop Collection 151Structured Query Language (SQL) 16summarization 150Summarization and Pruning agent 65, 129, 131, 139, 141, 160–162, 193–196, 207–211, 222
configuring 128data processing sessions 106environment file 105historical data retention 103internals 103JVM 106
logs files 475metadata 105performance tuning 107problems and solutions 476scheduling 106step by step 105trace levels 475troubleshooting 475
data is not pruned for systems that are no longer managed 476exception is thrown when connecting to TEP Server 476summarized tables are not created 476
summarized data 11Sun Cluster 45symmetric multiprocessor (SMP) 254System Management Facility (SMF) 203
Ttable scan (relation scan) 290table schema 64table space 153, 290TAIL 322tec_log_metric_dir 153–154tec_log_metrics 153tec_max_log_entries 153tec_reception_sample_period 153tec_rule_sample_class_size 154tec_rule_sample_period 153TEMS ENV file 473TEP Desktop Client 329TEP Server
client 147TEP Web client 147, 329test database connection 140time slot filters 411time zone 136, 145time-based categories 103timespan function 55timestamp 60, 63–64TIMESTAMP field 449Tivoli Composite Application Manager 16Tivoli Composite Application Manager for Internet Service Monitoring 16Tivoli Composite Application Manager for J2EE Op-erations 17Tivoli Composite Application Manager for SOA 17Tivoli Composite Application Manager for Web-
536 Tivoli Management Services Warehouse and Reporting

Sphere 17Tivoli Data Warehouse 111, 188Tivoli Data Warehouse V1.x 11
architecture 11Tivoli Data Warehouse V2.1
components 22detailed list 63differences with V.1.X 9
implementation differences 10scalability differences 12usability differences 11
firewall considerations 33best practices 38communications protocol selection 33default port usage 34installations with firewalls 38multiple network interface cards 37running out of sockets 34special cases 38
high availability considerations 42clustering and failover support 45disk mirroring 48failure behavior 43RAID technology 48recommendations 44
high level architecture 20integration with Tivoli Enterprise Portal 20key features 20load projection spreadsheet 77NT_Memory tables 62supported platforms 22
Tivoli Enterprise Consoleagent historical workspace 165components 153configuration 154event database 158event server 154fixes 152reception component 154rule 154
Tivoli Enterprise Monitoring Agent 317Tivoli Enterprise Monitoring Server 320–321, 325Tivoli Enterprise Portal 25
Server 148Tivoli Enterprise Portal (TEP) 11, 316–318, 324–325, 329, 370
object 324Tivoli Enterprise Portal Server
host 131, 140
Tivoli Framework architecture 12Tivoli Storage Manager 348
database 348server 348Universal Agent scenario 348
Tivoli Warehouse Proxyarchitecture
exporter threads 95work queue 95
components 95hub TEMS 114installation 111internals 95multiple Warehouse Proxies 101scalability 100step by step 99
TMZDIFF 64total cost of ownership (TCO) 25TTL value 323tuning data movement 12
UUA (Universal Agent) 318UDP communication 33UDP protocol 33uncommitted read 307unconfigure groups 150Universal Agent (UA) 317–318UNIX Agent 65UNIX Disk
attribute group 63table 64
UNIX file systems 62UNIX OS 65, 69usability differences 11user ID 116
VVERITAS Cluster Server 45virtual tunnel 38Visual Explain 293
Wwagtinit 152–153, 155WAREHOUS 122Warehouse
table 474
Index 537

warehousetraffic 41
Warehouse Driver field 122warehouse interval 150, 335, 376Warehouse Proxy 24, 99, 111–112, 114
configuration 115data source configuration window 117installation 111
Warehouse Proxy agent 100, 106, 115–116, 118, 126–127, 150, 162, 196, 211, 223
troubleshooting 472application log 474binary file size grows indefinitely 475log files 472multiple Warehouse Proxy agents 473no historical data collected 474problems and solutions 473RAS1 trace 472return codes 474trace levels 472
WAREHOUSEID table 71WAREHOUSELOG table 105Web Health Console 11–12Web Response Monitor 16WebLogic server 219Web-publishing with BIRT case study 391
Apache Tomcat 392client requirements 391client scenario 391creating specific DB2 functions 394daily system disks usage 393define the filtering 407define the report layout 409detailed CPU usage per host 393developed solution 392installing the BIRT Designer 393installing the BIRT Report Viewer 394installing the DBC drivers 394new data set 399new data source 398new report parameters 402our lab environment 392publishing results 424report creation 397sample reports 393scheduling report 425
web-services.xml 226WebSphere Administrative Console 170WebSphere Application Server 17
Service Integration Bus 17well-known port 35wesvragt 152wesvragt utility 152wget command 425what you see is what you get 10WHERE statement 236Windows docknt ODI file 69Windows OS
agent 65monitoring 63
Wolfpack 47work queue 97workspaces 165WRAPPER 236WRITETIME 64
XX Window System 138XML (Extensible Markup Language) 174
Zz/OS PDS facility 53
538 Tivoli Management Services Warehouse and Reporting

(1.0” spine)0.875”<
->1.498”
460 <->
788 pages
Tivoli Managem
ent Services W
arehouse and Reporting


®
SG24-7290-00 ISBN 0738494666
INTERNATIONAL TECHNICALSUPPORTORGANIZATION
BUILDING TECHNICALINFORMATION BASED ONPRACTICAL EXPERIENCE
IBM Redbooks are developed by the IBM International Technical Support Organization. Experts from IBM, Customers and Partners from around the world create timely technical information based on realistic scenarios. Specific recommendations are provided to help you implement IT solutions more effectively in your environment.
For more information:ibm.com/redbooks
Tivoli Management Services Warehouseand Reporting
Insider’s guide to Tivoli warehousing and reporting
Tuning Tivoli Data Warehouse for best performance
BIRT-based reporting solution included
As the amount of management data that is gathered continues to grow, the data is not being used effectively for IT business-relevant decisions. IBM Tivoli Data Warehouse helps solve this problem by being the central repository in which you can store historical data about your IT infrastructure. This includes network devices and connections, desktops, hardware, software, events, and other information. Stored data is subsequently analyzed and used to produce reports about the behavior of IT components and services.
This IBM Redbook discusses all aspects of IBM Tivoli Data Warehouse V2.1 (the version that is shipped with IBM Tivoli Monitoring V6.1) including deployment best practices, scalability, performance optimization, external data integration, reporting, and troubleshooting. As part of the book, we provide a reporting solution for Tivoli Data Warehouse data, which is based on the Business Intelligence and Reporting Tools (BIRT) technology. BIRT is a free, Eclipse-based reporting tool.
We also provide an example of a commercial reporting solution: The Crystal Reports solution from Business Objects. We also discuss two solutions that are published on IBM OPAL Web site: QuickReporter for IBM Tivoli Monitoring from Primeur and Warehouse Designer for IBM Tivoli Monitoring 6.1 from Axibase. Both products are IBM certified solutions, specifically designed for IBM Tivoli Monitoring.
This book is a reference for IT professionals who implement and use a Tivoli Data Warehouse environment.
Back cover