tmus q4 2016 investor factbook
TRANSCRIPT

2
T-Mobile US, Inc.Investor FactbookT-Mobile US Reports Fourth Quarter and Full-Year 2016 Results
11% Growth in Service Revenue, 31% in Net Income, 12% in Adjusted EBITDA, 2.1 Million Customer Net Additions and Record-Low Fourth Quarter Churn of 1.28% in Q4
Fourth Quarter and Full-Year 2016 Highlights:Industry-leading customer growth:
• 2.1 million total net additions in Q4 2016 - 8.2 million in 2016• 1.2 million total branded postpaid net additions - 4.1 million in 2016• 933,000 branded postpaid phone net additions in Q4 2016 - 3.3 million in 2016• 541,000 branded prepaid net additions in Q4 2016 - 2.5 million in 2016• 1.28% branded postpaid phone churn in Q4 2016, down 18 bps from Q4 2015 - 1.30% in 2016, down 9 bps
from 2015
Industry-leading financial growth (all percentages year-over-year):• $7.2 billion service revenues, up 11% in Q4 2016 - up 12% to $27.8 billion in 2016• $10.2 billion total revenues, up 23% in Q4 2016 - up 16% to $37.2 billion in 2016• $390 million net income, up 31% in Q4 2016 - up 99% to $1.5 billion in 2016• $0.45 EPS, up 32% in Q4 2016 - $1.69 EPS, up 106% in 2016• $2.5 billion Adjusted EBITDA(1), up 12% in Q4 2016 - up 41% to $10.4 billion in 2016
Strong outlook for 2017:• Guidance range for branded postpaid net additions of 2.4 to 3.4 million• Net income is not available on a forward looking basis(2)
• Adjusted EBITDA target of $10.4 to $10.8 billion, which excludes spectrum gains and includes leasing revenues of $0.8 to $0.9 billion. The impact from Data Stash is expected to be immaterial.
• Cash capital expenditures guidance of $4.8 to $5.1 billion, excluding capitalized interest• Net cash provided by operating activities three-year compound annual growth rate (CAGR) is expected to be
between 15% and 18%• Free Cash Flow three-year CAGR is expected to be between 45% and 48%(1)
__________________________________(1) Adjusted EBITDA is a non-GAAP financial measure and Free Cash Flow is a non-GAAP financial metric. These
non-GAAP financial items should be considered in addition to, but not as a substitute for, the information provided in accordance with GAAP. Reconciliations for these non-GAAP financial items to the most directly comparable GAAP financial items are provided in the financial tables.
(2) T-Mobile is not able to forecast net income on a forward looking basis without unreasonable efforts due to the high variability and difficulty in predicting certain items that affect GAAP net income including, but not limited to, income tax expense, stock based compensation expense, interest expense and interest income.
3
Total Branded Postpaid Net Additions(in thousands)
Branded Postpaid Phone Churn
CUSTOMER METRICSBranded Postpaid Customers
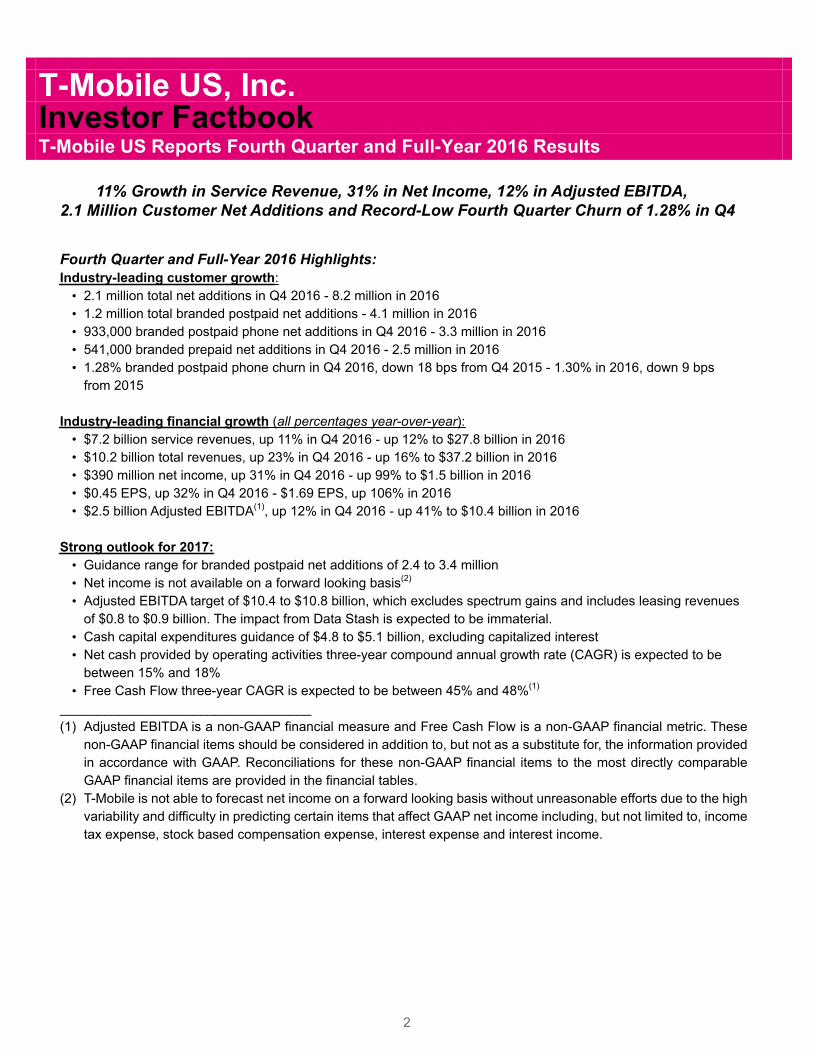
Branded postpaid phone net customer additions were 933,000 in Q4 2016 compared to 851,000 in Q3 2016 and 917,000 in Q4 2015. This marks the 12th consecutive quarter that T-Mobile led the industry in branded postpaid phone net customer additions.
The sequential increase was primarily due to higher gross additions from holiday promotional activity, the introduction of T-Mobile ONE rate plans and decreased churn, partially offset by lower branded prepaid customer migrations to branded postpaid plans.
The year-over-year increase was primarily due to lower churn.
Branded postpaid mobile broadband net customer additions were 264,000 in Q4 2016, compared to 118,000 in Q3 2016 and 375,000 in Q4 2015.
Branded postpaid net customer additions were 1,197,000 in Q4 2016 compared to 969,000 in Q3 2016 and 1,292,000 in Q4 2015.
Branded postpaid phone churn was 1.28% in Q4 2016, down 4 basis points from 1.32% in Q3 2016 and down 18 basis points from 1.46% in Q4 2015. Branded postpaid phone churn was a record-low for a fourth quarter.
On September 1, 2016, T-Mobile sold its marketing and distribution rights to a certain existing T-Mobile co-branded customers to a current MVNO partner (the MVNO Transaction). The MVNO Transaction resulted in a re-categorization of 1.365 million branded postpaid phone customers and 326,000 branded prepaid customers to wholesale customers in Q3 2016. The reported branded postpaid phone and branded prepaid churn figures reflect the transfer of the MVNO Transaction customers prospectively from September 1, 2016.
The sequential decrease in branded postpaid phone churn was primarily due to the MVNO Transaction, partially offset by seasonality.
Year-over-year, branded postpaid phone churn was lower primarily as a result of the MVNO Transaction.

4
Total Branded Prepaid Net Additions(in thousands)
For the full-year 2016, branded postpaid phone net customer additions were 3,307,000 compared to 3,511,000 in 2015 due to lower gross customer additions and higher deactivations on a growing customer base, partially offset by a lower churn rate and higher migrations of branded prepaid customers to branded postpaid plans. T-Mobile captured all of the industry’s postpaid phone growth in 2016 for the third consecutive year.
For the full-year 2016, branded postpaid net customer additions were 4,097,000 compared to 4,510,000 in 2015. Full-year 2016 branded postpaid net customer additions exceeded the high end of the guidance range of 3.7 to 3.9 million provided in connection with Q3 2016 earnings.
Branded postpaid phone churn was 1.30% for the full-year 2016, down 9 basis points compared to 1.39% in 2015 primarily due to the MVNO Transaction as well as increased customer satisfaction and loyalty from ongoing improvements to network quality, customer service and the overall value of our offerings in the marketplace.
Branded Prepaid CustomersBranded prepaid net customer additions were 541,000 in Q4 2016, compared to 684,000 in Q3 2016 and 469,000 in Q4 2015. T-Mobile once again led the industry in branded prepaid net customer additions in Q4 2016.
The sequential decrease was primarily due to optimizing T-Mobile's third-party distribution and exiting less profitable channels in favor of MetroPCS branded distribution channels.
The year-over-year increase was primarily driven by continued success of the MetroPCS brand, continued growth in new markets and distribution expansion, partially offset by the optimization of T-Mobile's third-party distribution.
Migrations to branded postpaid plans reduced branded prepaid net customer additions in Q4 2016 by approximately 210,000, down from 250,000 in Q3 2016 and flat compared to 210,000 in Q4 2015.
5
Branded Prepaid Churn
Total Branded Net Additions(in thousands)
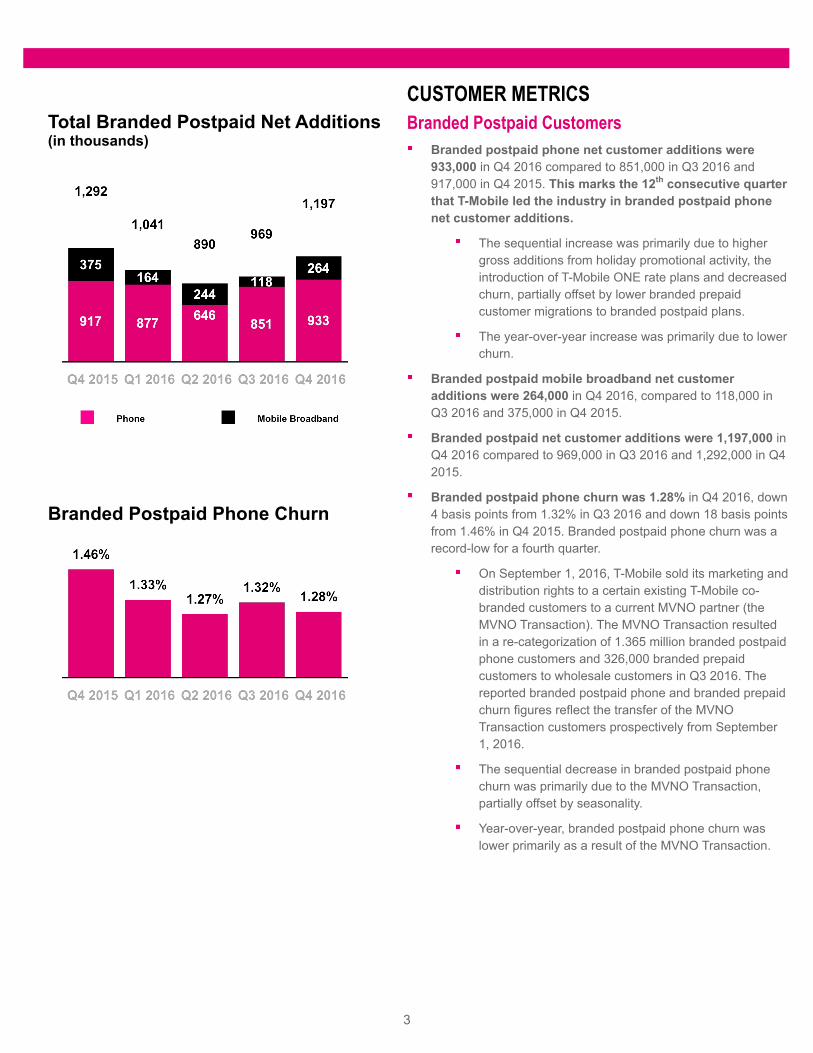
Branded prepaid churn was 3.94% in Q4 2016, compared to 3.82% in Q3 2016 and 4.20% in Q4 2015.
The sequential increase was primarily due to typical seasonality, partially offset by the MVNO Transaction.
The year-over-year decline was primarily due to the MVNO Transaction as well as the strong performance of the MetroPCS brand, increased customer satisfaction and loyalty from ongoing improvements to network quality, customer service and the overall value of our offerings in the marketplace.
For the full-year 2016, branded prepaid net customer additions were 2,508,000 compared to 1,315,000 in 2015 primarily due to the continued success of the MetroPCS brand, continued growth in new markets and distribution expansion, partially offset by an increase in the number of qualified branded prepaid customers migrating to branded postpaid plans as well as the optimization of T-Mobile's third-party distribution channels.
Branded prepaid churn was 3.88% for the full-year 2016, down 57 basis points compared to 4.45% in 2015 due to a decrease in certain customers, which have a higher rate of prepaid churn, the strong performance of the MetroPCS brand and a methodology change in Q3 2015. The methodology change had no impact on our reported branded prepaid ending customers or net customer additions, but resulted in computationally lower gross customer additions and deactivations. Revision of prior periods was not practicable because certain historical data was no longer available.
Total Branded CustomersTotal branded net customer additions were 1,738,000 in Q4 2016, compared to 1,653,000 in Q3 2016 and 1,761,000 in Q4 2015. This was the 12th consecutive quarter in which branded net customer additions surpassed the one million milestone.
For the full-year 2016, total branded net customer additions were 6,605,000 compared to 5,825,000 in 2015.
6
Wholesale Net Additions(in thousands)
Total Net Additions(in thousands)
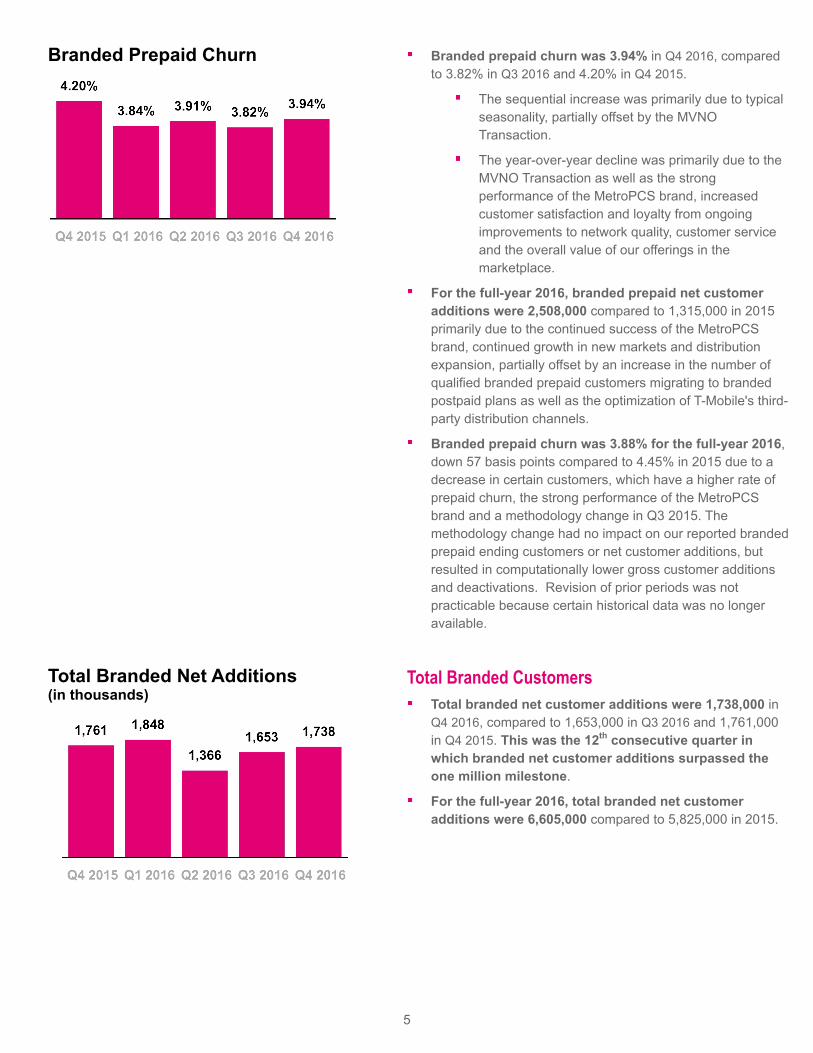
Wholesale CustomersWholesale net customer additions were 363,000 in Q4 2016 compared to 317,000 in Q3 2016 and 301,000 in Q4 2015.
For the full-year 2016, wholesale net customer additions were 1,568,000 compared to 2,439,000 in 2015.
Going forward T-Mobile expects wholesale net additions to be significantly lower in 2017, as the Company’s MVNO partners deemphasize Lifeline in favor of higher ARPU customer categories.
Total CustomersTotal net customer additions were 2,101,000 in Q4 2016 compared to 1,970,000 in Q3 2016 and 2,062,000 in Q4 2015. This was the 15th consecutive quarter in which total net customer additions exceeded one million.
T-Mobile ended 2016 with 71.5 million total customers.
For the full-year 2016, total net customer additions were 8,173,000 compared to 8,264,000 in 2015. This was the third consecutive year in which total net customer additions exceeded 8 million.
T-Mobile Average Spectrum Ownership, Top 25 Markets(Band, in MHz)
NETWORKNetwork Transformation Update
T-Mobile continues to increase the depth, breadth and functionality of the nation’s densest LTE network by adding new spectrum to increase coverage, and re-farming existing spectrum and implementing new technology to augment capacity. Collectively, these network advancements help provide improved network performance and reliability for T-Mobile's customers.
Spectrum GrowthAt the end of Q4 2016, T-Mobile owned or had agreements to own an average of 86 MHz of spectrum across the top 25 markets in the U.S. The spectrum is comprised of an average of 12 MHz in the 700 MHz band, 30 MHz in the 1900 MHz PCS band and 44 MHz in the AWS band.
In Q4 2016, T-Mobile closed on the previously announced transaction for 700 MHz A-Block spectrum in Chicago. In Q1
7
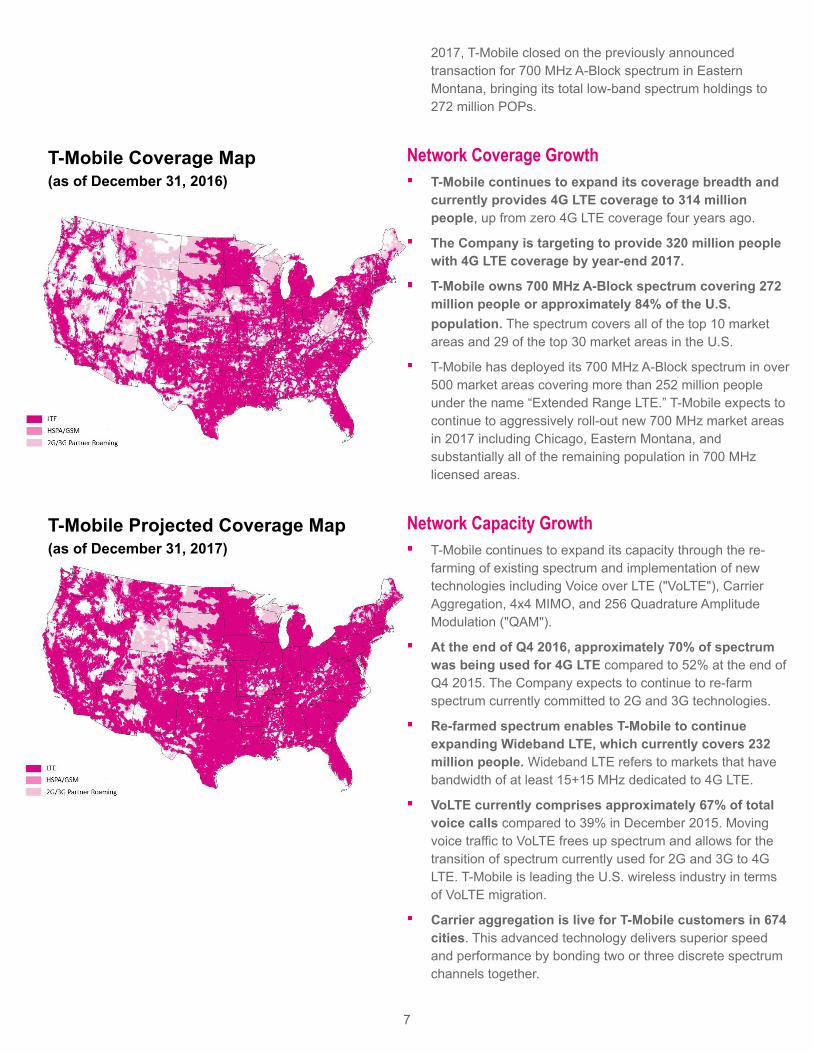
T-Mobile Coverage Map(as of December 31, 2016)
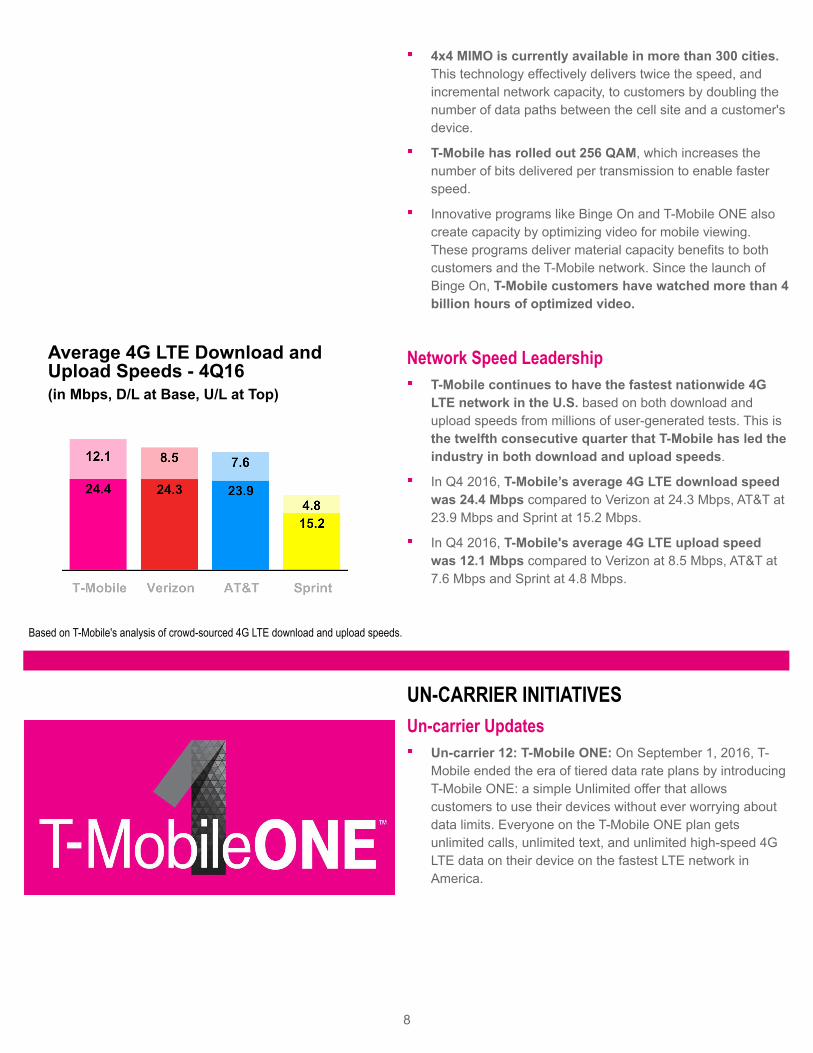
T-Mobile Projected Coverage Map(as of December 31, 2017)
2017, T-Mobile closed on the previously announced transaction for 700 MHz A-Block spectrum in Eastern Montana, bringing its total low-band spectrum holdings to 272 million POPs.
Network Coverage GrowthT-Mobile continues to expand its coverage breadth and currently provides 4G LTE coverage to 314 million people, up from zero 4G LTE coverage four years ago.
The Company is targeting to provide 320 million people with 4G LTE coverage by year-end 2017.
T-Mobile owns 700 MHz A-Block spectrum covering 272 million people or approximately 84% of the U.S. population. The spectrum covers all of the top 10 market areas and 29 of the top 30 market areas in the U.S.
T-Mobile has deployed its 700 MHz A-Block spectrum in over 500 market areas covering more than 252 million people under the name “Extended Range LTE.” T-Mobile expects to continue to aggressively roll-out new 700 MHz market areas in 2017 including Chicago, Eastern Montana, and substantially all of the remaining population in 700 MHz licensed areas.
Network Capacity GrowthT-Mobile continues to expand its capacity through the re-farming of existing spectrum and implementation of new technologies including Voice over LTE ("VoLTE"), Carrier Aggregation, 4x4 MIMO, and 256 Quadrature Amplitude Modulation ("QAM").
At the end of Q4 2016, approximately 70% of spectrum was being used for 4G LTE compared to 52% at the end of Q4 2015. The Company expects to continue to re-farm spectrum currently committed to 2G and 3G technologies.
Re-farmed spectrum enables T-Mobile to continue expanding Wideband LTE, which currently covers 232 million people. Wideband LTE refers to markets that have bandwidth of at least 15+15 MHz dedicated to 4G LTE.
VoLTE currently comprises approximately 67% of total voice calls compared to 39% in December 2015. Moving voice traffic to VoLTE frees up spectrum and allows for the transition of spectrum currently used for 2G and 3G to 4G LTE. T-Mobile is leading the U.S. wireless industry in terms of VoLTE migration.
Carrier aggregation is live for T-Mobile customers in 674 cities. This advanced technology delivers superior speed and performance by bonding two or three discrete spectrum channels together.
8
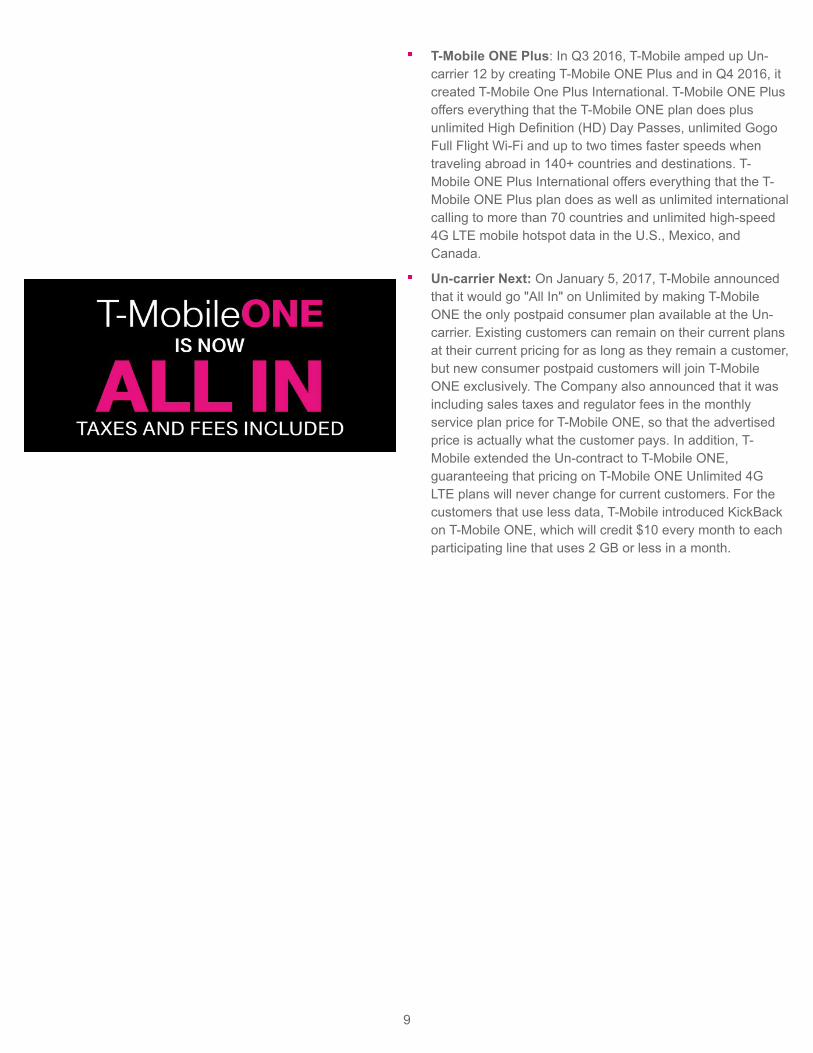
Average 4G LTE Download and Upload Speeds - 4Q16(in Mbps, D/L at Base, U/L at Top)
Based on T-Mobile's analysis of crowd-sourced 4G LTE download and upload speeds.
4x4 MIMO is currently available in more than 300 cities. This technology effectively delivers twice the speed, and incremental network capacity, to customers by doubling the number of data paths between the cell site and a customer's device.
T-Mobile has rolled out 256 QAM, which increases the number of bits delivered per transmission to enable faster speed.
Innovative programs like Binge On and T-Mobile ONE also create capacity by optimizing video for mobile viewing. These programs deliver material capacity benefits to both customers and the T-Mobile network. Since the launch of Binge On, T-Mobile customers have watched more than 4 billion hours of optimized video.
Network Speed LeadershipT-Mobile continues to have the fastest nationwide 4G LTE network in the U.S. based on both download and upload speeds from millions of user-generated tests. This is the twelfth consecutive quarter that T-Mobile has led the industry in both download and upload speeds.
In Q4 2016, T-Mobile’s average 4G LTE download speed was 24.4 Mbps compared to Verizon at 24.3 Mbps, AT&T at 23.9 Mbps and Sprint at 15.2 Mbps.
In Q4 2016, T-Mobile's average 4G LTE upload speed was 12.1 Mbps compared to Verizon at 8.5 Mbps, AT&T at 7.6 Mbps and Sprint at 4.8 Mbps.
UN-CARRIER INITIATIVESUn-carrier Updates
Un-carrier 12: T-Mobile ONE: On September 1, 2016, T-Mobile ended the era of tiered data rate plans by introducing T-Mobile ONE: a simple Unlimited offer that allows customers to use their devices without ever worrying about data limits. Everyone on the T-Mobile ONE plan gets unlimited calls, unlimited text, and unlimited high-speed 4G LTE data on their device on the fastest LTE network in America.
9
T-Mobile ONE Plus: In Q3 2016, T-Mobile amped up Un-carrier 12 by creating T-Mobile ONE Plus and in Q4 2016, it created T-Mobile One Plus International. T-Mobile ONE Plus offers everything that the T-Mobile ONE plan does plus unlimited High Definition (HD) Day Passes, unlimited Gogo Full Flight Wi-Fi and up to two times faster speeds when traveling abroad in 140+ countries and destinations. T-Mobile ONE Plus International offers everything that the T-Mobile ONE Plus plan does as well as unlimited international calling to more than 70 countries and unlimited high-speed 4G LTE mobile hotspot data in the U.S., Mexico, and Canada.
Un-carrier Next: On January 5, 2017, T-Mobile announced that it would go "All In" on Unlimited by making T-Mobile ONE the only postpaid consumer plan available at the Un-carrier. Existing customers can remain on their current plans at their current pricing for as long as they remain a customer, but new consumer postpaid customers will join T-Mobile ONE exclusively. The Company also announced that it was including sales taxes and regulator fees in the monthly service plan price for T-Mobile ONE, so that the advertised price is actually what the customer pays. In addition, T-Mobile extended the Un-contract to T-Mobile ONE, guaranteeing that pricing on T-Mobile ONE Unlimited 4G LTE plans will never change for current customers. For the customers that use less data, T-Mobile introduced KickBack on T-Mobile ONE, which will credit $10 every month to each participating line that uses 2 GB or less in a month.
10
Devices Sold or Leased(in million units)
Q4 2015 Q3 2016 Q4 2016Total CompanySmartphones 10.0 8.7 9.9Non-Smartphones 0.3 0.1 0.1Mobile Broadband Devices 0.5 0.4 0.5Total Company 10.8 9.2 10.5
DEVICESTotal devices sold or leased were 10.5 million units in Q4 2016 compared to 9.2 million units in Q3 2016 and 10.8 million units in Q4 2015.
Total smartphones sold or leased were 9.9 million units in Q4 2016 compared to 8.7 million units in Q3 2016 and 10.0 million units in Q4 2015.
The upgrade rate for branded postpaid customers was approximately 10% in Q4 2016 compared to approximately 7% in Q3 2016 and approximately 10% in Q4 2015. The sequential increase in upgrade rate was primarily due to the continued success of the iPhone 7 launch and the timing of order fulfillment based on inventory availability.
During the year ended December 31, 2016, a handset Original Equipment Manufacturer (“OEM”) announced recalls on certain of its smartphone devices. As a result, T-Mobile recorded no revenue associated with the device sales to customers and impaired the devices to their net realizable value. The OEM has agreed to reimburse T-Mobile for direct and indirect costs associated with the recall. As such, we have recorded an amount due from the OEM as an offset to the loss recorded in Cost of equipment sales and the costs incurred within Selling, general and administrative in our Consolidated Statements of Comprehensive Income and a reduction to Accounts payable and accrued liabilities in our Consolidated Balance Sheets.
Device unit volumes in 2016 exclude all the recalled devices sold or leased during the periods.
11
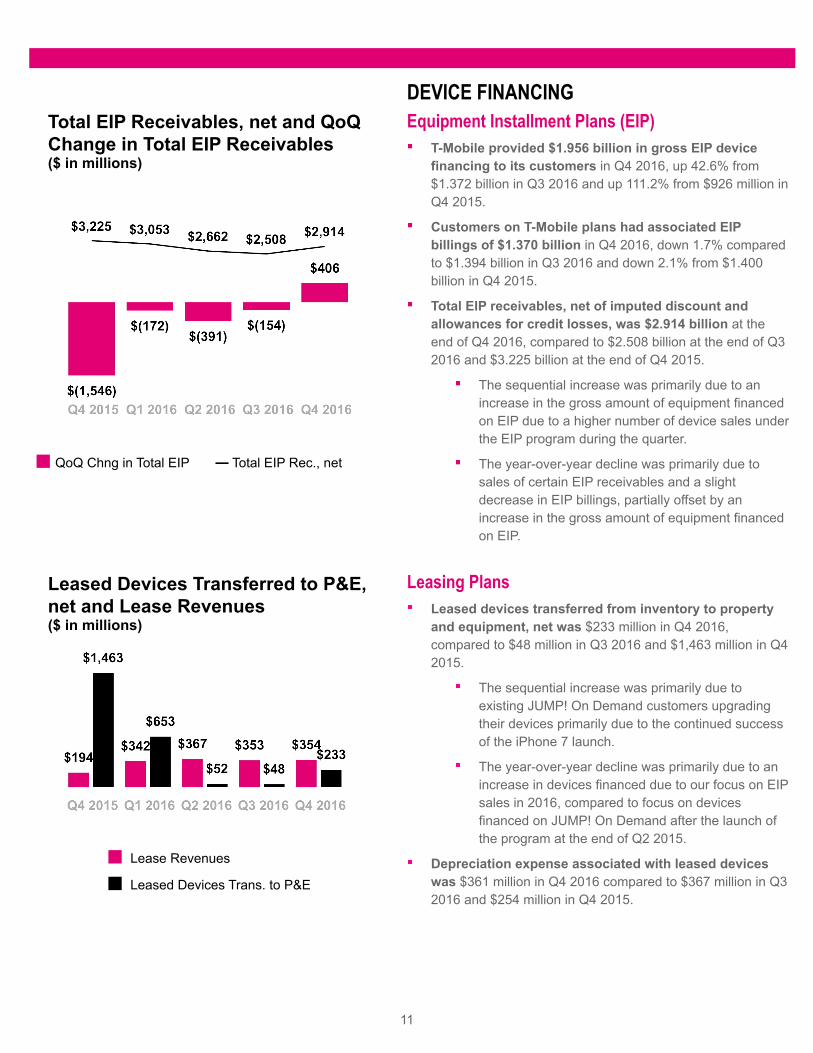
Total EIP Receivables, net and QoQChange in Total EIP Receivables($ in millions)
QoQ Chng in Total EIP — Total EIP Rec., net
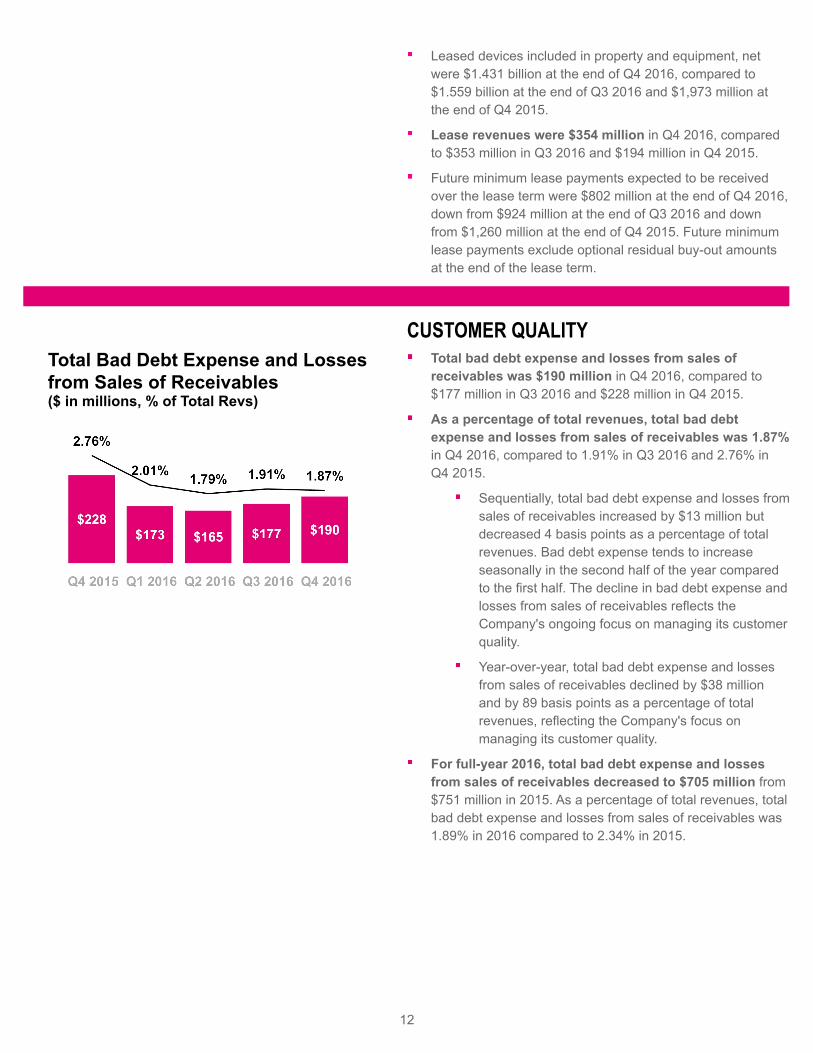
Leased Devices Transferred to P&E,net and Lease Revenues($ in millions)
Lease Revenues
Leased Devices Trans. to P&E
DEVICE FINANCINGEquipment Installment Plans (EIP)
T-Mobile provided $1.956 billion in gross EIP device financing to its customers in Q4 2016, up 42.6% from $1.372 billion in Q3 2016 and up 111.2% from $926 million in Q4 2015.
Customers on T-Mobile plans had associated EIP billings of $1.370 billion in Q4 2016, down 1.7% compared to $1.394 billion in Q3 2016 and down 2.1% from $1.400 billion in Q4 2015.
Total EIP receivables, net of imputed discount and allowances for credit losses, was $2.914 billion at the end of Q4 2016, compared to $2.508 billion at the end of Q3 2016 and $3.225 billion at the end of Q4 2015.
The sequential increase was primarily due to an increase in the gross amount of equipment financed on EIP due to a higher number of device sales under the EIP program during the quarter.
The year-over-year decline was primarily due to sales of certain EIP receivables and a slight decrease in EIP billings, partially offset by an increase in the gross amount of equipment financed on EIP.
Leasing PlansLeased devices transferred from inventory to property and equipment, net was $233 million in Q4 2016, compared to $48 million in Q3 2016 and $1,463 million in Q4 2015.
The sequential increase was primarily due to existing JUMP! On Demand customers upgrading their devices primarily due to the continued success of the iPhone 7 launch.
The year-over-year decline was primarily due to an increase in devices financed due to our focus on EIP sales in 2016, compared to focus on devices financed on JUMP! On Demand after the launch of the program at the end of Q2 2015.
Depreciation expense associated with leased devices was $361 million in Q4 2016 compared to $367 million in Q3 2016 and $254 million in Q4 2015.
12
Leased devices included in property and equipment, net were $1.431 billion at the end of Q4 2016, compared to $1.559 billion at the end of Q3 2016 and $1,973 million at the end of Q4 2015.
Lease revenues were $354 million in Q4 2016, compared to $353 million in Q3 2016 and $194 million in Q4 2015.
Future minimum lease payments expected to be received over the lease term were $802 million at the end of Q4 2016, down from $924 million at the end of Q3 2016 and down from $1,260 million at the end of Q4 2015. Future minimum lease payments exclude optional residual buy-out amounts at the end of the lease term.
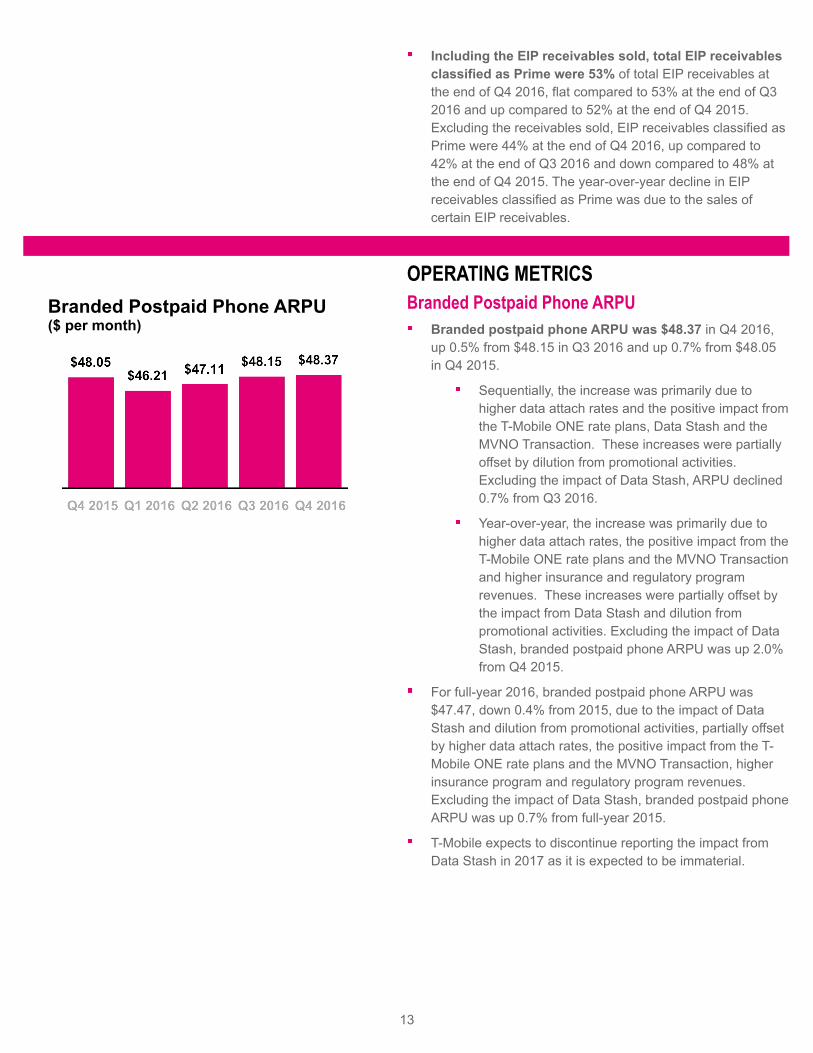
Total Bad Debt Expense and Losses from Sales of Receivables($ in millions, % of Total Revs)
CUSTOMER QUALITYTotal bad debt expense and losses from sales of receivables was $190 million in Q4 2016, compared to $177 million in Q3 2016 and $228 million in Q4 2015.
As a percentage of total revenues, total bad debt expense and losses from sales of receivables was 1.87% in Q4 2016, compared to 1.91% in Q3 2016 and 2.76% in Q4 2015.
Sequentially, total bad debt expense and losses from sales of receivables increased by $13 million but decreased 4 basis points as a percentage of total revenues. Bad debt expense tends to increase seasonally in the second half of the year compared to the first half. The decline in bad debt expense and losses from sales of receivables reflects the Company's ongoing focus on managing its customer quality.
Year-over-year, total bad debt expense and losses from sales of receivables declined by $38 million and by 89 basis points as a percentage of total revenues, reflecting the Company's focus on managing its customer quality.
For full-year 2016, total bad debt expense and losses from sales of receivables decreased to $705 million from $751 million in 2015. As a percentage of total revenues, total bad debt expense and losses from sales of receivables was 1.89% in 2016 compared to 2.34% in 2015.
13
Including the EIP receivables sold, total EIP receivables classified as Prime were 53% of total EIP receivables at the end of Q4 2016, flat compared to 53% at the end of Q3 2016 and up compared to 52% at the end of Q4 2015. Excluding the receivables sold, EIP receivables classified as Prime were 44% at the end of Q4 2016, up compared to 42% at the end of Q3 2016 and down compared to 48% at the end of Q4 2015. The year-over-year decline in EIP receivables classified as Prime was due to the sales of certain EIP receivables.
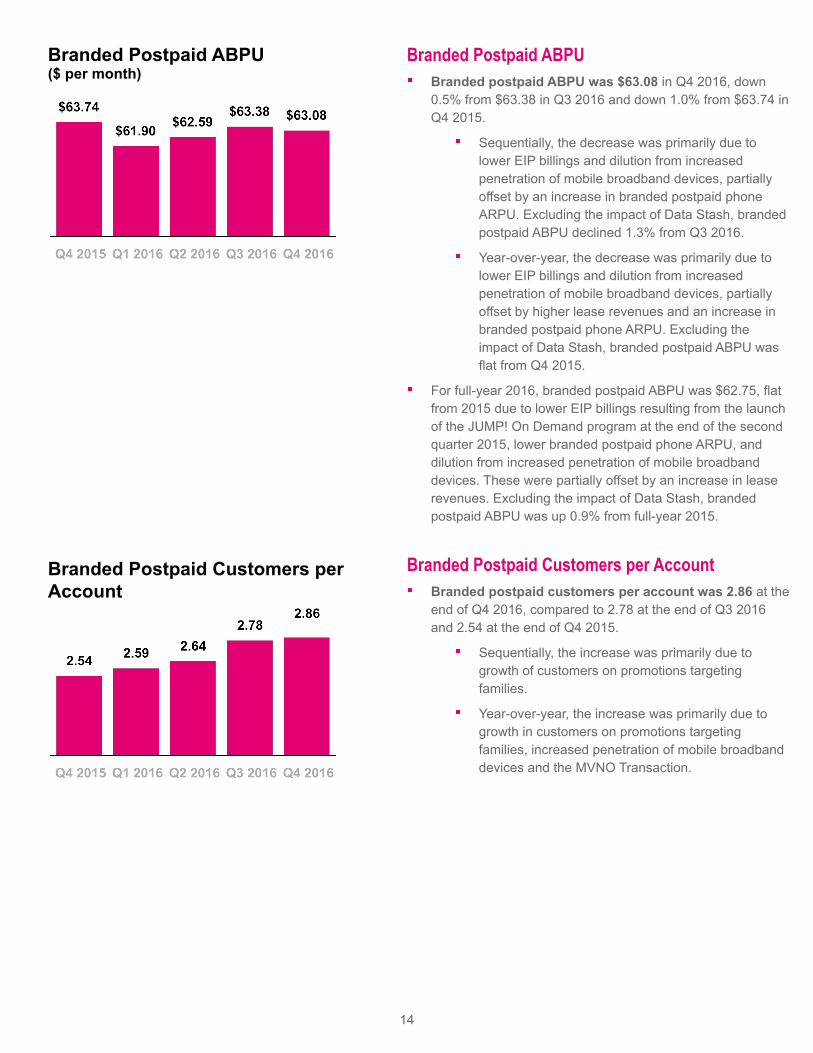
Branded Postpaid Phone ARPU($ per month)
OPERATING METRICSBranded Postpaid Phone ARPU
Branded postpaid phone ARPU was $48.37 in Q4 2016, up 0.5% from $48.15 in Q3 2016 and up 0.7% from $48.05 in Q4 2015.
Sequentially, the increase was primarily due to higher data attach rates and the positive impact from the T-Mobile ONE rate plans, Data Stash and the MVNO Transaction. These increases were partially offset by dilution from promotional activities. Excluding the impact of Data Stash, ARPU declined 0.7% from Q3 2016.
Year-over-year, the increase was primarily due to higher data attach rates, the positive impact from the T-Mobile ONE rate plans and the MVNO Transaction and higher insurance and regulatory program revenues. These increases were partially offset by the impact from Data Stash and dilution from promotional activities. Excluding the impact of Data Stash, branded postpaid phone ARPU was up 2.0% from Q4 2015.
For full-year 2016, branded postpaid phone ARPU was $47.47, down 0.4% from 2015, due to the impact of Data Stash and dilution from promotional activities, partially offset by higher data attach rates, the positive impact from the T-Mobile ONE rate plans and the MVNO Transaction, higher insurance program and regulatory program revenues. Excluding the impact of Data Stash, branded postpaid phone ARPU was up 0.7% from full-year 2015.
T-Mobile expects to discontinue reporting the impact from Data Stash in 2017 as it is expected to be immaterial.
14
Branded Postpaid ABPU($ per month)
Branded Postpaid Customers per Account
Branded Postpaid ABPUBranded postpaid ABPU was $63.08 in Q4 2016, down 0.5% from $63.38 in Q3 2016 and down 1.0% from $63.74 in Q4 2015.
Sequentially, the decrease was primarily due to lower EIP billings and dilution from increased penetration of mobile broadband devices, partially offset by an increase in branded postpaid phone ARPU. Excluding the impact of Data Stash, branded postpaid ABPU declined 1.3% from Q3 2016.
Year-over-year, the decrease was primarily due to lower EIP billings and dilution from increased penetration of mobile broadband devices, partially offset by higher lease revenues and an increase in branded postpaid phone ARPU. Excluding the impact of Data Stash, branded postpaid ABPU was flat from Q4 2015.
For full-year 2016, branded postpaid ABPU was $62.75, flat from 2015 due to lower EIP billings resulting from the launch of the JUMP! On Demand program at the end of the second quarter 2015, lower branded postpaid phone ARPU, and dilution from increased penetration of mobile broadband devices. These were partially offset by an increase in lease revenues. Excluding the impact of Data Stash, branded postpaid ABPU was up 0.9% from full-year 2015.
Branded Postpaid Customers per AccountBranded postpaid customers per account was 2.86 at the end of Q4 2016, compared to 2.78 at the end of Q3 2016 and 2.54 at the end of Q4 2015.
Sequentially, the increase was primarily due to growth of customers on promotions targeting families.
Year-over-year, the increase was primarily due to growth in customers on promotions targeting families, increased penetration of mobile broadband devices and the MVNO Transaction.

15
Branded Prepaid ARPU($ per month)
Branded Prepaid ARPUBranded prepaid ARPU was $38.20 in Q4 2016, up 0.5% from $38.01 in Q3 2016 and up 1.5% compared to $37.63 in Q4 2015.
Sequentially, the increase was primarily due to the MVNO Transaction and higher data attach rates, partially offset by dilution from promotional activities.
Year-over-year, the increase was primarily due to the MVNO Transaction and higher data attach rates, partially offset by dilution from promotional activities.
Service Revenue Growth at Wireless Peers(YoY % Growth)
Service Revenues($ in millions)
REVENUESService Revenues
T-Mobile once again led the industry in year-over-year service revenue percentage growth in Q4 2016. This marks the eleventh consecutive quarter that T-Mobile has led the industry in this measure.
Service revenues were $7.245 billion in Q4 2016, up 1.6% from $7.133 billion in Q3 2016 and up 10.5% from $6.556 billion in Q4 2015.
Sequentially, the increase was primarily due to growth in the Company's customer base in existing and expansion markets, and the impact from Data Stash. These increases were partially offset by the MVNO Transaction.
Year-over-year, the increase was primarily due to growth in the Company's customer base in existing and expansion markets as well as higher device insurance program revenues. These increases were partially offset by the MVNO Transaction and the impact from Data Stash.
For the full-year 2016, service revenues were $27.844 billion, up 12.2% compared to $24.821 billion in 2015. The increase was primarily due to growth in the Company's customer base in existing and expansion markets as well as higher device insurance program revenues, and higher regulatory program revenues, partially offset by the MVNO transaction and the higher non-cash net revenue deferral from Data Stash.

16
Equipment Revenues($ in millions)
Total Revenues($ in millions)
Equipment RevenuesEquipment revenues were $2.740 billion in Q4 2016, up 40.7% from $1.948 billion in Q3 2016 and up 78.4% from $1.536 billion in Q4 2015. Equipment revenues in Q4 2016 were comprised of lease revenues of $354 million and non-lease revenues of $2.386 billion.
Sequentially, the increase was due to higher average revenue per device sold primarily due to the continued success of the iPhone 7 launch and an increase in the number of devices sold.
Year-over-year, the increase was primarily due to an increase in device sales revenues driven by a higher average revenue per device sold and an increase in the number of devices sold due to the Company's renewed focus on EIP sales. Under EIP, device sales revenue is recognized at the time of sale.
For the full-year 2016, equipment revenues were $8.727 billion, up 29.9% compared to $6.718 billion in 2015. The increase was due to an increase in lease revenues resulting from the launch of the JUMP! On Demand program at the end of Q2 2015 and an increase in device sales revenues primarily due to an increase in the number of devices sold. Revenues associated with leased devices are recognized over the lease term.
Total RevenuesT-Mobile once again led the industry in year-over-year total revenue percentage growth in Q4 2016. This marks the 14th time in the past fifteen quarters that T-Mobile has led the industry in year-over-year total revenue percentage growth.
Total revenues were $10.175 billion in Q4 2016, up 10.0% from $9.246 billion in Q3 2016 and up 23.4% from $8.247 billion in Q4 2015.
For the full-year 2016, total revenues were $37.242 billion, up 16.2% compared to $32.053 billion in 2015. This marks the third consecutive year that T-Mobile has led the industry in total revenue percentage growth.
17
Cost of Services($ in millions, % of Service Revs)
Cost of Equipment Sales($ in millions, % of Equipment Revs)
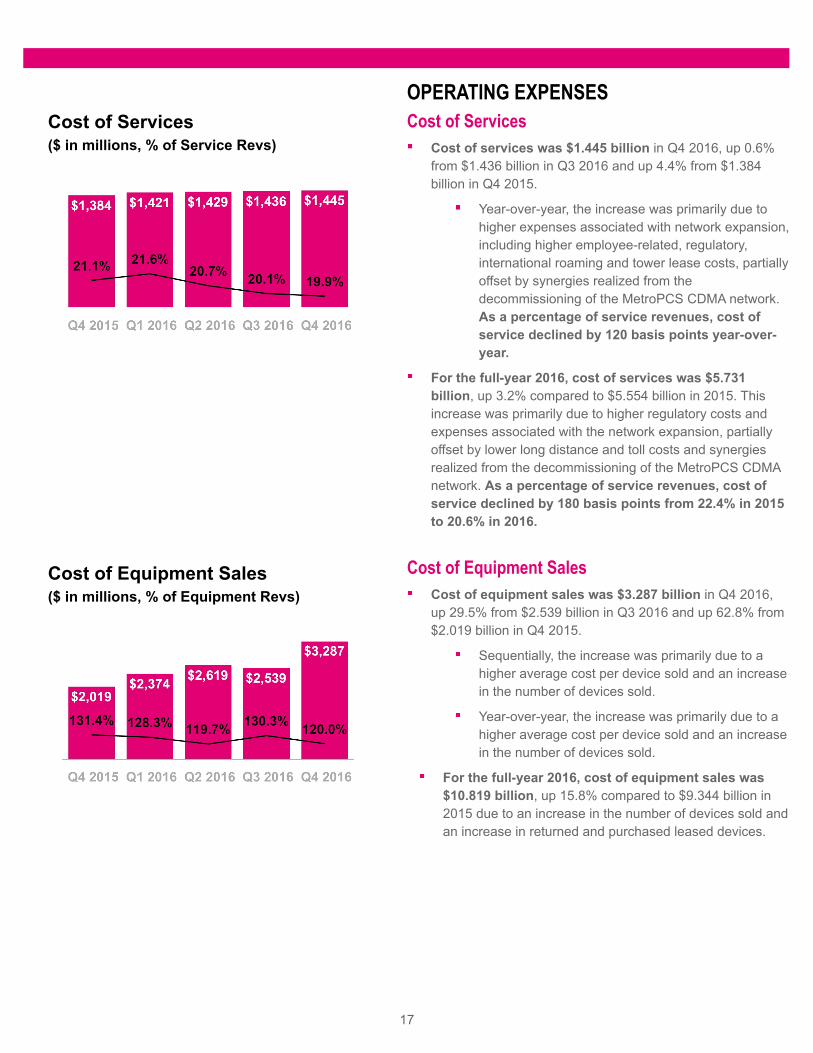
OPERATING EXPENSESCost of Services
Cost of services was $1.445 billion in Q4 2016, up 0.6% from $1.436 billion in Q3 2016 and up 4.4% from $1.384 billion in Q4 2015.
Year-over-year, the increase was primarily due to higher expenses associated with network expansion, including higher employee-related, regulatory, international roaming and tower lease costs, partially offset by synergies realized from the decommissioning of the MetroPCS CDMA network. As a percentage of service revenues, cost of service declined by 120 basis points year-over-year.
For the full-year 2016, cost of services was $5.731 billion, up 3.2% compared to $5.554 billion in 2015. This increase was primarily due to higher regulatory costs and expenses associated with the network expansion, partially offset by lower long distance and toll costs and synergies realized from the decommissioning of the MetroPCS CDMA network. As a percentage of service revenues, cost of service declined by 180 basis points from 22.4% in 2015 to 20.6% in 2016.
Cost of Equipment SalesCost of equipment sales was $3.287 billion in Q4 2016, up 29.5% from $2.539 billion in Q3 2016 and up 62.8% from $2.019 billion in Q4 2015.
Sequentially, the increase was primarily due to a higher average cost per device sold and an increase in the number of devices sold.
Year-over-year, the increase was primarily due to a higher average cost per device sold and an increase in the number of devices sold.
For the full-year 2016, cost of equipment sales was $10.819 billion, up 15.8% compared to $9.344 billion in 2015 due to an increase in the number of devices sold and an increase in returned and purchased leased devices.
18
SG&A Expense($ in millions, % of Service Revs)
D&A Expense($ in millions, % of Total Revs)
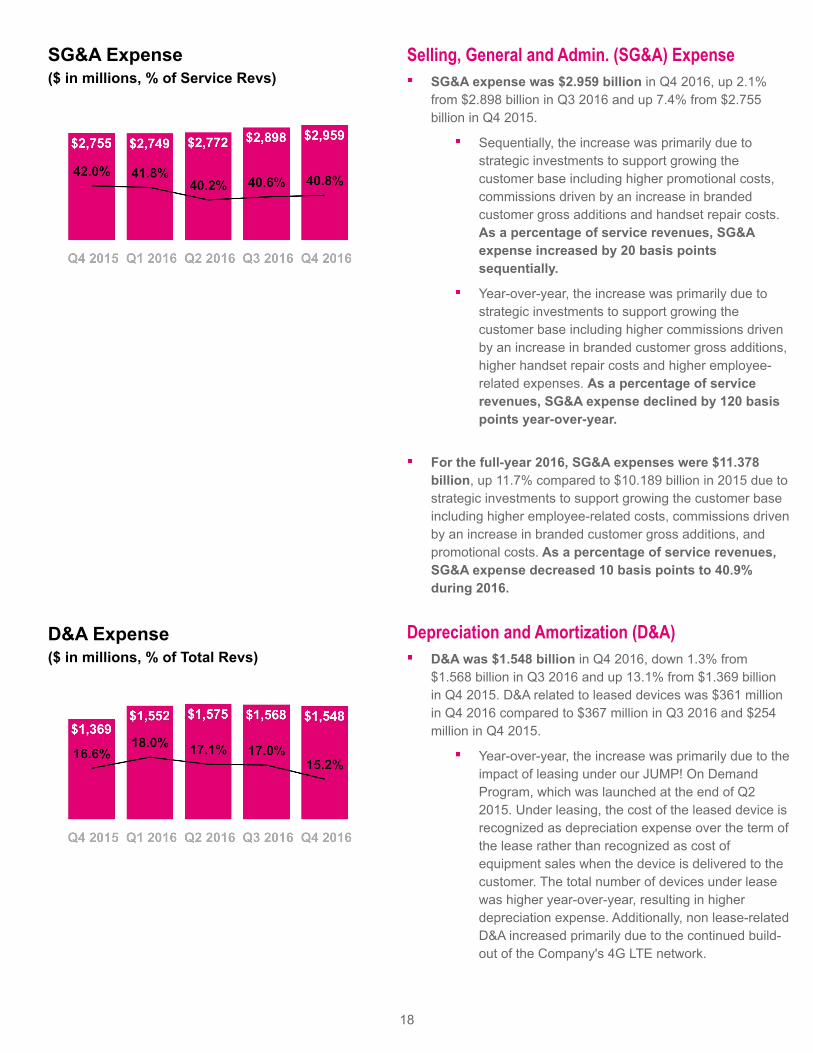
Selling, General and Admin. (SG&A) ExpenseSG&A expense was $2.959 billion in Q4 2016, up 2.1% from $2.898 billion in Q3 2016 and up 7.4% from $2.755 billion in Q4 2015.
Sequentially, the increase was primarily due to strategic investments to support growing the customer base including higher promotional costs, commissions driven by an increase in branded customer gross additions and handset repair costs. As a percentage of service revenues, SG&A expense increased by 20 basis points sequentially.
Year-over-year, the increase was primarily due to strategic investments to support growing the customer base including higher commissions driven by an increase in branded customer gross additions, higher handset repair costs and higher employee-related expenses. As a percentage of service revenues, SG&A expense declined by 120 basis points year-over-year.
For the full-year 2016, SG&A expenses were $11.378 billion, up 11.7% compared to $10.189 billion in 2015 due to strategic investments to support growing the customer base including higher employee-related costs, commissions driven by an increase in branded customer gross additions, and promotional costs. As a percentage of service revenues, SG&A expense decreased 10 basis points to 40.9% during 2016.
Depreciation and Amortization (D&A)D&A was $1.548 billion in Q4 2016, down 1.3% from $1.568 billion in Q3 2016 and up 13.1% from $1.369 billion in Q4 2015. D&A related to leased devices was $361 million in Q4 2016 compared to $367 million in Q3 2016 and $254 million in Q4 2015.
Year-over-year, the increase was primarily due to the impact of leasing under our JUMP! On Demand Program, which was launched at the end of Q2 2015. Under leasing, the cost of the leased device is recognized as depreciation expense over the term of the lease rather than recognized as cost of equipment sales when the device is delivered to the customer. The total number of devices under lease was higher year-over-year, resulting in higher depreciation expense. Additionally, non lease-related D&A increased primarily due to the continued build-out of the Company's 4G LTE network.
19
For the full-year 2016, D&A was $6.243 billion, up 33.2% compared to $4.688 billion in 2015 primarily due to the impact of leasing. D&A related to leased devices was $1.528 billion for the full-year 2016 compared to $312 million for the full-year 2015. The total number of devices under lease was higher year-over-year, resulting in higher depreciation expense. Additionally, non lease-related D&A increased primarily due to the continued build-out of the Company's 4G LTE network.
Net Income($ in millions)
Earnings Per Share
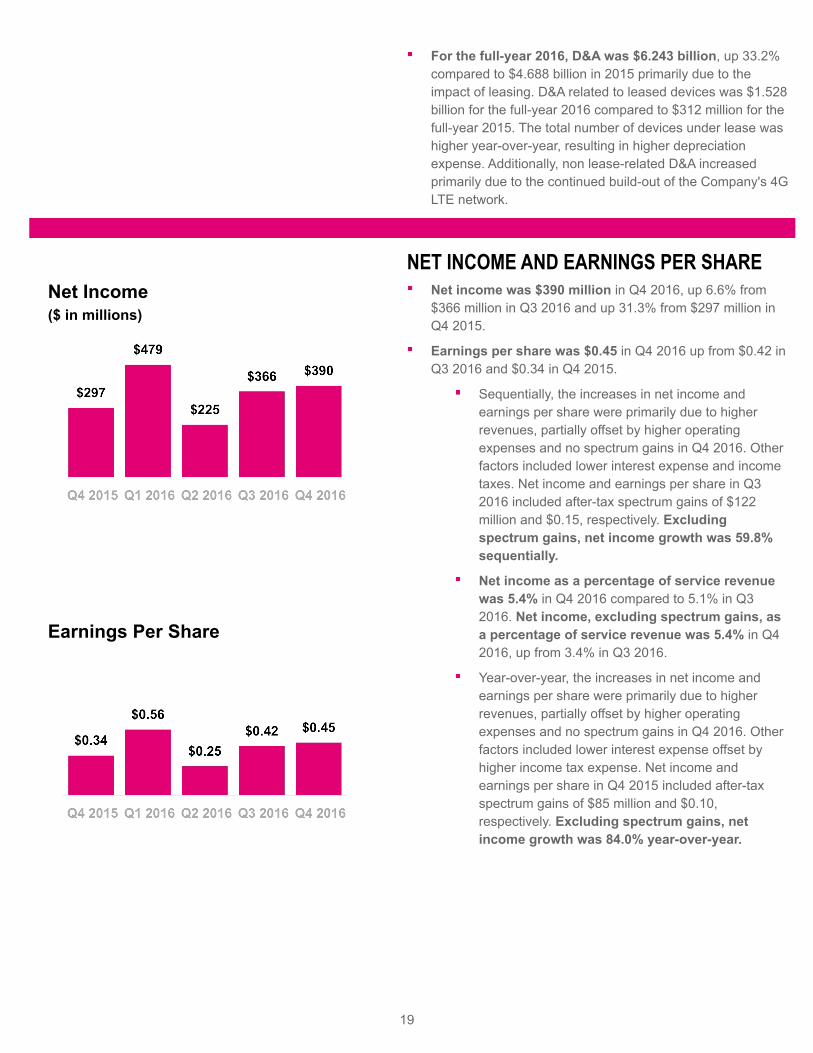
NET INCOME AND EARNINGS PER SHARENet income was $390 million in Q4 2016, up 6.6% from $366 million in Q3 2016 and up 31.3% from $297 million in Q4 2015.
Earnings per share was $0.45 in Q4 2016 up from $0.42 in Q3 2016 and $0.34 in Q4 2015.
Sequentially, the increases in net income and earnings per share were primarily due to higher revenues, partially offset by higher operating expenses and no spectrum gains in Q4 2016. Other factors included lower interest expense and income taxes. Net income and earnings per share in Q3 2016 included after-tax spectrum gains of $122 million and $0.15, respectively. Excluding spectrum gains, net income growth was 59.8% sequentially.
Net income as a percentage of service revenue was 5.4% in Q4 2016 compared to 5.1% in Q3 2016. Net income, excluding spectrum gains, as a percentage of service revenue was 5.4% in Q4 2016, up from 3.4% in Q3 2016.
Year-over-year, the increases in net income and earnings per share were primarily due to higher revenues, partially offset by higher operating expenses and no spectrum gains in Q4 2016. Other factors included lower interest expense offset by higher income tax expense. Net income and earnings per share in Q4 2015 included after-tax spectrum gains of $85 million and $0.10, respectively. Excluding spectrum gains, net income growth was 84.0% year-over-year.

20
Net income as a percentage of service revenue was 5.4% in Q4 2016 compared to 4.5% in Q4 2015. Net income, excluding spectrum gains, as a percentage of service revenue was 5.4% in Q4 2016, up from 3.2% in Q4 2015.
For the full-year 2016, net income was $1,460 million up 99% from $733 million in 2015.
For the full-year 2016, earnings per share was $1.69 up from $0.82 in 2015.
For the full-year, the increases in net income and earnings per share were primarily due to higher revenues, higher spectrum gains and lower decommissioning costs from the MetroPCS business combination, partially offset by higher operating expenses. Other factors included higher non-operating expenses such as higher income taxes, interest expense and lower interest income. Net income included after-tax spectrum gains of $509 million and $100 million for full-year 2016 and 2015, respectively. The impact on EPS of the spectrum gains was $0.62 and $0.12, respectively. Excluding spectrum gains, net income growth was 50.2% in full-year 2016.
Net income as a percentage of service revenue was 5.2% in 2016 compared to 3.0% in 2015. Net income, excluding spectrum gains, as a percentage of service revenue was 3.4% in full-year 2016 compared to 2.6% in full-year 2015.
21
Adjusted EBITDA($ in millions)
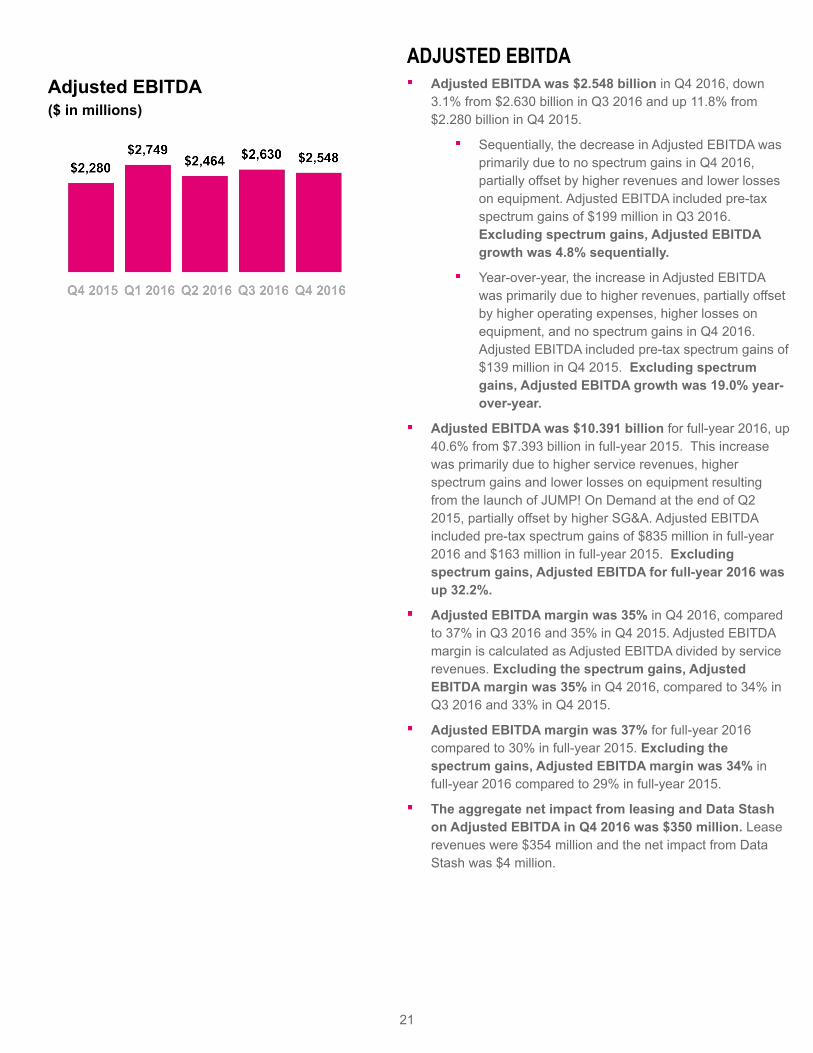
ADJUSTED EBITDAAdjusted EBITDA was $2.548 billion in Q4 2016, down 3.1% from $2.630 billion in Q3 2016 and up 11.8% from $2.280 billion in Q4 2015.
Sequentially, the decrease in Adjusted EBITDA was primarily due to no spectrum gains in Q4 2016, partially offset by higher revenues and lower losses on equipment. Adjusted EBITDA included pre-tax spectrum gains of $199 million in Q3 2016. Excluding spectrum gains, Adjusted EBITDA growth was 4.8% sequentially.
Year-over-year, the increase in Adjusted EBITDA was primarily due to higher revenues, partially offset by higher operating expenses, higher losses on equipment, and no spectrum gains in Q4 2016. Adjusted EBITDA included pre-tax spectrum gains of $139 million in Q4 2015. Excluding spectrum gains, Adjusted EBITDA growth was 19.0% year-over-year.
Adjusted EBITDA was $10.391 billion for full-year 2016, up 40.6% from $7.393 billion in full-year 2015. This increase was primarily due to higher service revenues, higher spectrum gains and lower losses on equipment resulting from the launch of JUMP! On Demand at the end of Q2 2015, partially offset by higher SG&A. Adjusted EBITDA included pre-tax spectrum gains of $835 million in full-year 2016 and $163 million in full-year 2015. Excluding spectrum gains, Adjusted EBITDA for full-year 2016 was up 32.2%.
Adjusted EBITDA margin was 35% in Q4 2016, compared to 37% in Q3 2016 and 35% in Q4 2015. Adjusted EBITDA margin is calculated as Adjusted EBITDA divided by service revenues. Excluding the spectrum gains, Adjusted EBITDA margin was 35% in Q4 2016, compared to 34% in Q3 2016 and 33% in Q4 2015.
Adjusted EBITDA margin was 37% for full-year 2016 compared to 30% in full-year 2015. Excluding the spectrum gains, Adjusted EBITDA margin was 34% in full-year 2016 compared to 29% in full-year 2015.
The aggregate net impact from leasing and Data Stash on Adjusted EBITDA in Q4 2016 was $350 million. Lease revenues were $354 million and the net impact from Data Stash was $4 million.
22
The aggregate net impact from leasing and Data Stash on Adjusted EBITDA in full-year 2016 was $1.127 billion. Lease revenues were $1.416 billion and the net impact from Data Stash was $289 million. For full-year 2015, the aggregate net impact from leasing and Data Stash on Adjusted EBITDA was $158 million. Lease revenues were $224 million and the net impact from Data Stash was $66 million.
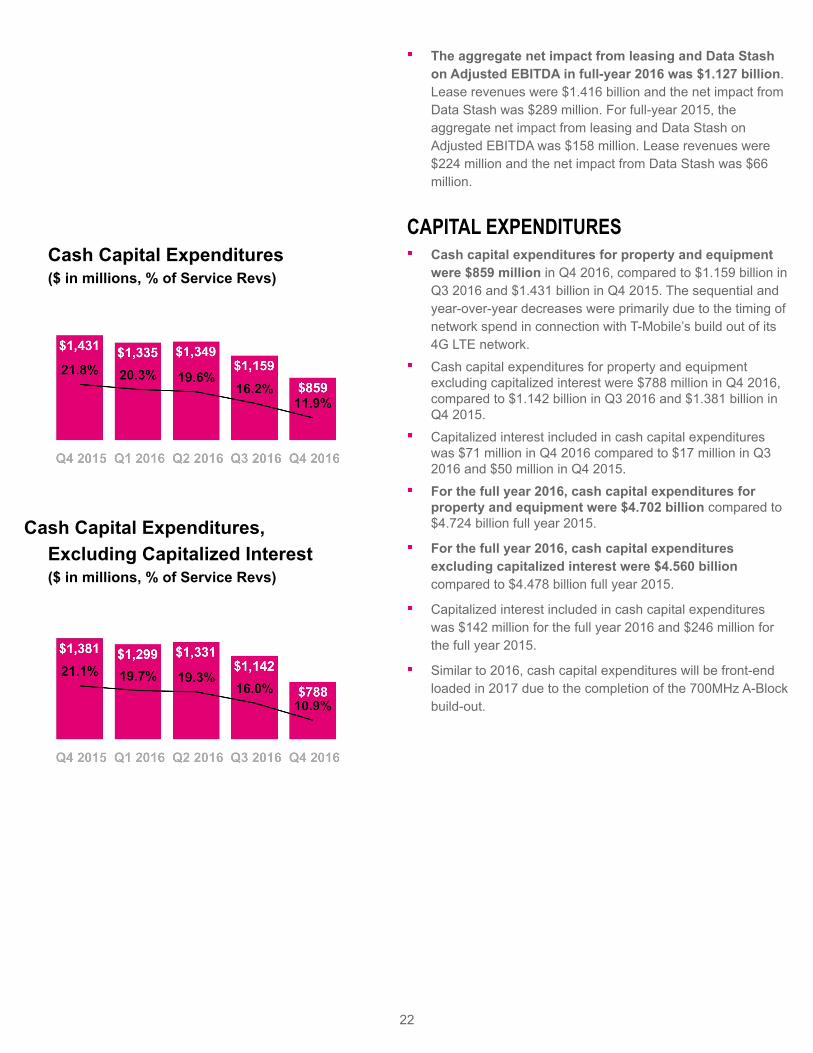
Cash Capital Expenditures($ in millions, % of Service Revs)
Cash Capital Expenditures,Excluding Capitalized Interest($ in millions, % of Service Revs)
CAPITAL EXPENDITURESCash capital expenditures for property and equipment were $859 million in Q4 2016, compared to $1.159 billion in Q3 2016 and $1.431 billion in Q4 2015. The sequential and year-over-year decreases were primarily due to the timing of network spend in connection with T-Mobile’s build out of its 4G LTE network.
Cash capital expenditures for property and equipment excluding capitalized interest were $788 million in Q4 2016, compared to $1.142 billion in Q3 2016 and $1.381 billion in Q4 2015.
Capitalized interest included in cash capital expenditures was $71 million in Q4 2016 compared to $17 million in Q3 2016 and $50 million in Q4 2015.
For the full year 2016, cash capital expenditures for property and equipment were $4.702 billion compared to $4.724 billion full year 2015.
For the full year 2016, cash capital expenditures excluding capitalized interest were $4.560 billion compared to $4.478 billion full year 2015.
Capitalized interest included in cash capital expenditures was $142 million for the full year 2016 and $246 million for the full year 2015.
Similar to 2016, cash capital expenditures will be front-end loaded in 2017 due to the completion of the 700MHz A-Block build-out.
23
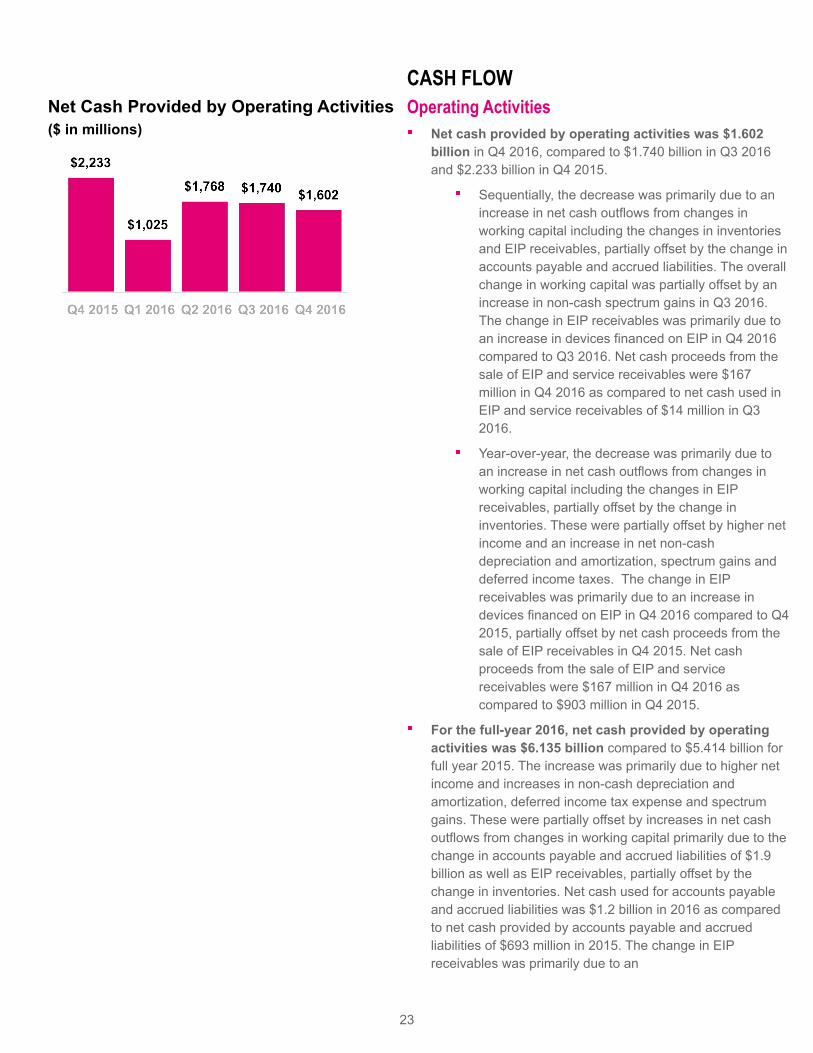
Net Cash Provided by Operating Activities($ in millions)
CASH FLOWOperating Activities
Net cash provided by operating activities was $1.602 billion in Q4 2016, compared to $1.740 billion in Q3 2016 and $2.233 billion in Q4 2015.
Sequentially, the decrease was primarily due to an increase in net cash outflows from changes in working capital including the changes in inventories and EIP receivables, partially offset by the change in accounts payable and accrued liabilities. The overall change in working capital was partially offset by an increase in non-cash spectrum gains in Q3 2016. The change in EIP receivables was primarily due to an increase in devices financed on EIP in Q4 2016 compared to Q3 2016. Net cash proceeds from the sale of EIP and service receivables were $167 million in Q4 2016 as compared to net cash used in EIP and service receivables of $14 million in Q3 2016.
Year-over-year, the decrease was primarily due to an increase in net cash outflows from changes in working capital including the changes in EIP receivables, partially offset by the change in inventories. These were partially offset by higher net income and an increase in net non-cash depreciation and amortization, spectrum gains and deferred income taxes. The change in EIP receivables was primarily due to an increase in devices financed on EIP in Q4 2016 compared to Q4 2015, partially offset by net cash proceeds from the sale of EIP receivables in Q4 2015. Net cash proceeds from the sale of EIP and service receivables were $167 million in Q4 2016 as compared to $903 million in Q4 2015.
For the full-year 2016, net cash provided by operating activities was $6.135 billion compared to $5.414 billion for full year 2015. The increase was primarily due to higher net income and increases in non-cash depreciation and amortization, deferred income tax expense and spectrum gains. These were partially offset by increases in net cash outflows from changes in working capital primarily due to the change in accounts payable and accrued liabilities of $1.9 billion as well as EIP receivables, partially offset by the change in inventories. Net cash used for accounts payable and accrued liabilities was $1.2 billion in 2016 as compared to net cash provided by accounts payable and accrued liabilities of $693 million in 2015. The change in EIP receivables was primarily due to an
24
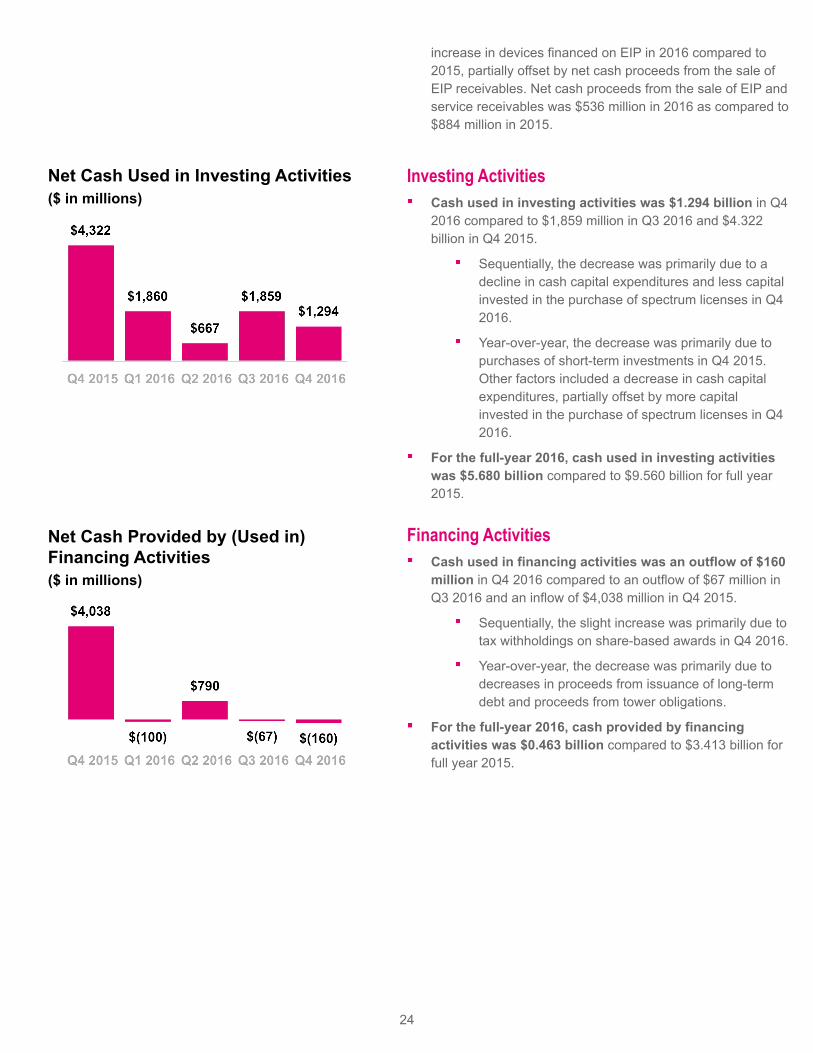
Net Cash Used in Investing Activities($ in millions)
Net Cash Provided by (Used in) Financing Activities($ in millions)
increase in devices financed on EIP in 2016 compared to 2015, partially offset by net cash proceeds from the sale of EIP receivables. Net cash proceeds from the sale of EIP and service receivables was $536 million in 2016 as compared to $884 million in 2015.
Investing Activities Cash used in investing activities was $1.294 billion in Q4 2016 compared to $1,859 million in Q3 2016 and $4.322 billion in Q4 2015.
Sequentially, the decrease was primarily due to a decline in cash capital expenditures and less capital invested in the purchase of spectrum licenses in Q4 2016.
Year-over-year, the decrease was primarily due to purchases of short-term investments in Q4 2015. Other factors included a decrease in cash capital expenditures, partially offset by more capital invested in the purchase of spectrum licenses in Q4 2016.
For the full-year 2016, cash used in investing activities was $5.680 billion compared to $9.560 billion for full year 2015.
Financing Activities Cash used in financing activities was an outflow of $160 million in Q4 2016 compared to an outflow of $67 million in Q3 2016 and an inflow of $4,038 million in Q4 2015.
Sequentially, the slight increase was primarily due to tax withholdings on share-based awards in Q4 2016.
Year-over-year, the decrease was primarily due to decreases in proceeds from issuance of long-term debt and proceeds from tower obligations.
For the full-year 2016, cash provided by financing activities was $0.463 billion compared to $3.413 billion for full year 2015.
25
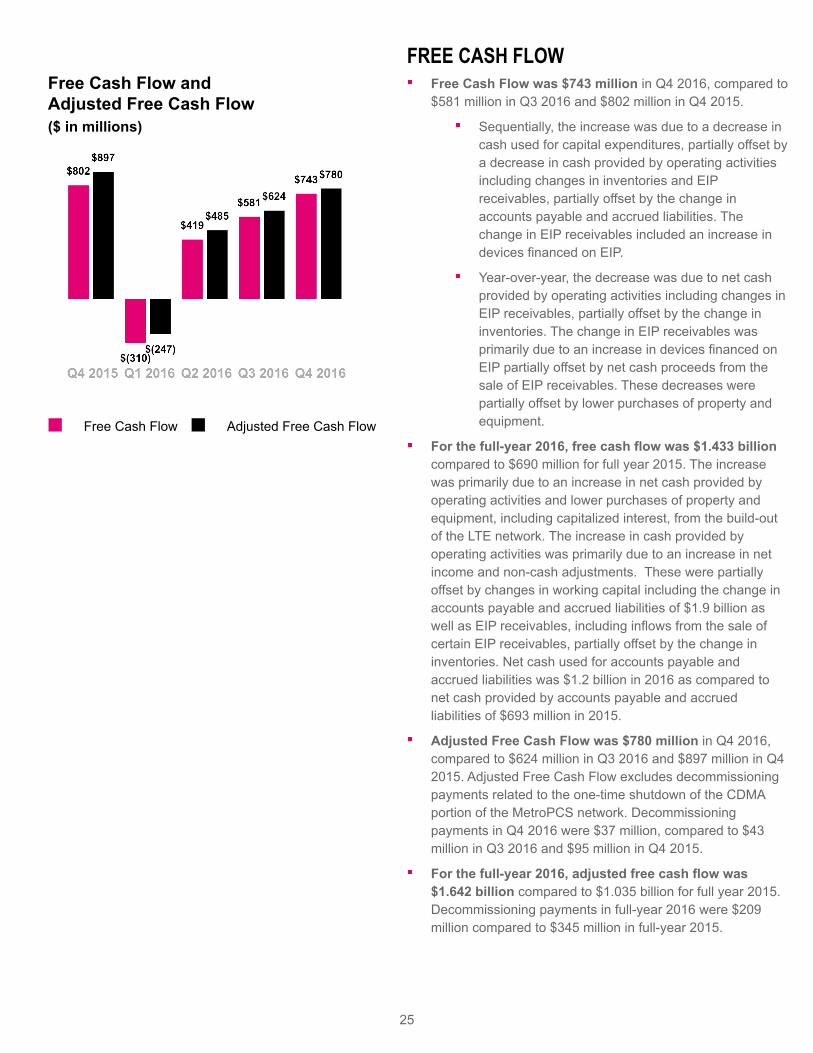
Free Cash Flow and Adjusted Free Cash Flow($ in millions)
Free Cash Flow Adjusted Free Cash Flow
FREE CASH FLOWFree Cash Flow was $743 million in Q4 2016, compared to $581 million in Q3 2016 and $802 million in Q4 2015.
Sequentially, the increase was due to a decrease in cash used for capital expenditures, partially offset by a decrease in cash provided by operating activities including changes in inventories and EIP receivables, partially offset by the change in accounts payable and accrued liabilities. The change in EIP receivables included an increase in devices financed on EIP.
Year-over-year, the decrease was due to net cash provided by operating activities including changes in EIP receivables, partially offset by the change in inventories. The change in EIP receivables was primarily due to an increase in devices financed on EIP partially offset by net cash proceeds from the sale of EIP receivables. These decreases were partially offset by lower purchases of property and equipment.
For the full-year 2016, free cash flow was $1.433 billion compared to $690 million for full year 2015. The increase was primarily due to an increase in net cash provided by operating activities and lower purchases of property and equipment, including capitalized interest, from the build-out of the LTE network. The increase in cash provided by operating activities was primarily due to an increase in net income and non-cash adjustments. These were partially offset by changes in working capital including the change in accounts payable and accrued liabilities of $1.9 billion as well as EIP receivables, including inflows from the sale of certain EIP receivables, partially offset by the change in inventories. Net cash used for accounts payable and accrued liabilities was $1.2 billion in 2016 as compared to net cash provided by accounts payable and accrued liabilities of $693 million in 2015.
Adjusted Free Cash Flow was $780 million in Q4 2016, compared to $624 million in Q3 2016 and $897 million in Q4 2015. Adjusted Free Cash Flow excludes decommissioning payments related to the one-time shutdown of the CDMA portion of the MetroPCS network. Decommissioning payments in Q4 2016 were $37 million, compared to $43 million in Q3 2016 and $95 million in Q4 2015.
For the full-year 2016, adjusted free cash flow was $1.642 billion compared to $1.035 billion for full year 2015. Decommissioning payments in full-year 2016 were $209 million compared to $345 million in full-year 2015.

26
T-Mobile does not expect decommissioning costs to be material in 2017 and will no longer report Adjusted Free Cash Flow after Q4 2016.
Total Debt and Net Debt (excl. Tower Obligations)($ in billions, Net Debt to LTM Adj. EBITDA)
Total Debt (excl. Tower Obligations)
Net Debt (excl. Tower Obligations)
— Net Debt to LTM Adj. EBITDA
CAPITAL STRUCTURETotal debt, excluding tower obligations, at the end of Q4 2016 was $27.786 billion and was comprised of short-term debt of $354 million, long-term debt to affiliates of $5.600 billion and long-term debt of $21.832 billion.
Net debt, excluding tower obligations, at the end of Q4 2016 was $22.286 billion.
The ratio of net debt, excluding tower obligations, to Adjusted EBITDA for the trailing last twelve month (“LTM”) period was 2.1x at the end of Q4 2016 compared to 2.2x at the end of Q3 2016 and 2.5x at the end of Q4 2015.
T-Mobile’s cash position remains strong with $5.5 billion in cash and cash equivalents at the end of Q4 2016.
On December 29, 2016, the company completed the following transactions with Deutsche Telekom:
Terminated a $500 million unsecured revolving credit facility;
Entered into a $1.5 billion secured revolving credit facility;
Entered into a $1.0 billion unsecured revolving credit facility;
Entered into a $660 million secured term loan commitment; and
In January 2017, T-Mobile delivered a notice of redemption on $1.0 billion aggregate principal amount of our 6.625% Senior Notes due 2020. The notes were redeemed on February 10, 2017 at a redemption price equal to 102.208% of the principal amount of the notes (plus accrued and unpaid interest thereon).
In January 2017, T-Mobile USA borrowed $4.0 billion (which included $660 million from the December 29, 2016 commitment) under a secured term loan facility (“Incremental Term Loan Facility) with Deutsche Telekom to refinance $1.98 billion of outstanding secured term loans under its Term Loan Credit Agreement dated November 9, 2015, with the remaining net proceeds from the transaction intended to be used to redeem callable high yield debt.
27
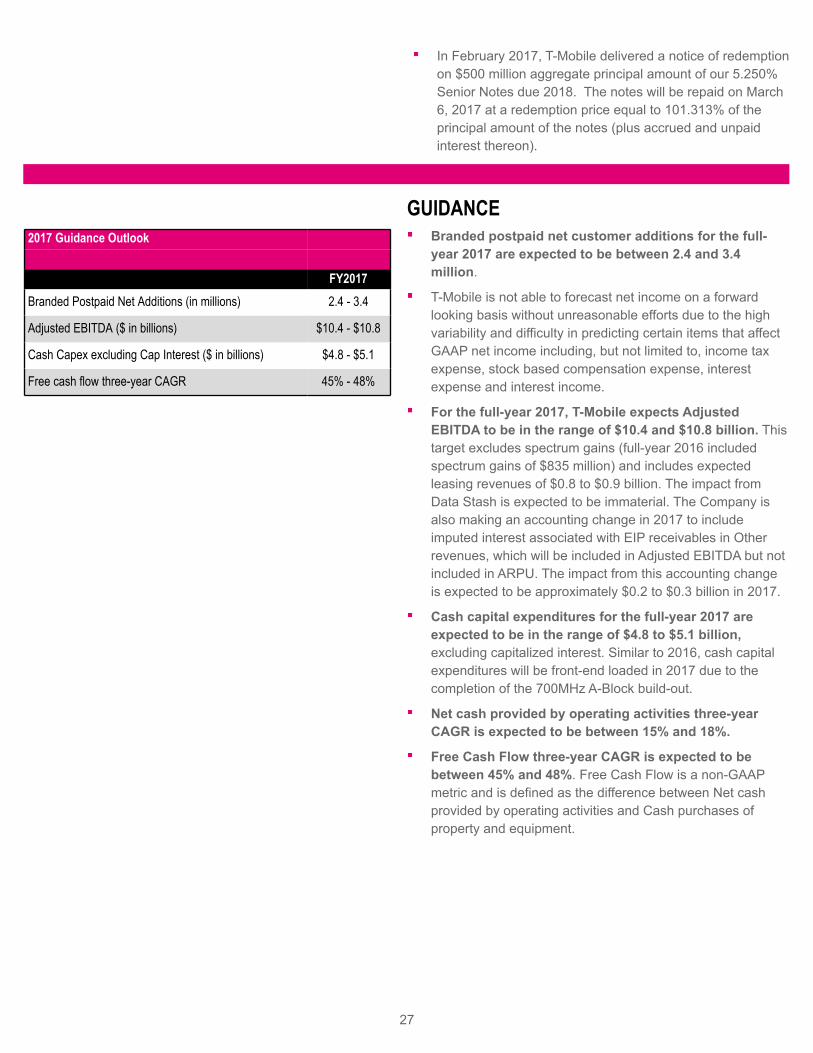
In February 2017, T-Mobile delivered a notice of redemption on $500 million aggregate principal amount of our 5.250% Senior Notes due 2018. The notes will be repaid on March 6, 2017 at a redemption price equal to 101.313% of the principal amount of the notes (plus accrued and unpaid interest thereon).
2017 Guidance Outlook
FY2017Branded Postpaid Net Additions (in millions) 2.4 - 3.4
Adjusted EBITDA ($ in billions) $10.4 - $10.8
Cash Capex excluding Cap Interest ($ in billions) $4.8 - $5.1
Free cash flow three-year CAGR 45% - 48%
GUIDANCEBranded postpaid net customer additions for the full-year 2017 are expected to be between 2.4 and 3.4 million.
T-Mobile is not able to forecast net income on a forward looking basis without unreasonable efforts due to the high variability and difficulty in predicting certain items that affect GAAP net income including, but not limited to, income tax expense, stock based compensation expense, interest expense and interest income.
For the full-year 2017, T-Mobile expects Adjusted EBITDA to be in the range of $10.4 and $10.8 billion. This target excludes spectrum gains (full-year 2016 included spectrum gains of $835 million) and includes expected leasing revenues of $0.8 to $0.9 billion. The impact from Data Stash is expected to be immaterial. The Company is also making an accounting change in 2017 to include imputed interest associated with EIP receivables in Other revenues, which will be included in Adjusted EBITDA but not included in ARPU. The impact from this accounting change is expected to be approximately $0.2 to $0.3 billion in 2017.
Cash capital expenditures for the full-year 2017 are expected to be in the range of $4.8 to $5.1 billion, excluding capitalized interest. Similar to 2016, cash capital expenditures will be front-end loaded in 2017 due to the completion of the 700MHz A-Block build-out.
Net cash provided by operating activities three-year CAGR is expected to be between 15% and 18%.
Free Cash Flow three-year CAGR is expected to be between 45% and 48%. Free Cash Flow is a non-GAAP metric and is defined as the difference between Net cash provided by operating activities and Cash purchases of property and equipment.

28
UPCOMING EVENTS (All dates and attendance tentative)
Morgan Stanley Technology, Media and Telecom Conference, February 27 - March 2, 2017, San Francisco, CA
Deutsche Bank 25th Annual Media & Telecom Conference, March 6 - 8, 2017, Palm Beach, FL
Citi 17th Annual European & Emerging Markets Telecoms Conference, March 21 -23, 2017, London, England
CONTACT INFORMATIONPress: Media Relations T-Mobile US, [email protected] http://newsroom.t-mobile.com
Investor Relations:Nils Paellmann, [email protected] Barrett, [email protected] Perachio, [email protected] Dunkin, [email protected]
877-281-TMUS or [email protected]://investor.t-mobile.com

29
T-Mobile US, Inc.Consolidated Balance Sheets
(Unaudited)
(in millions, except share and per share amounts)December 31,
2016December 31,
2015AssetsCurrent assets
Cash and cash equivalents $ 5,500 $ 4,582Short-term investments — 2,998Accounts receivable, net of allowances of $102 and $116 1,896 1,788Equipment installment plan receivables, net 1,930 2,378Accounts receivable from affiliates 40 36Inventories 1,111 1,295Asset purchase deposit 2,203 —Other current assets 1,537 1,813
Total current assets 14,217 14,890Property and equipment, net 20,943 20,000Goodwill 1,683 1,683Spectrum licenses 27,014 23,955Other intangible assets, net 376 594Equipment installment plan receivables due after one year, net 984 847Other assets 674 444
Total assets $ 65,891 $ 62,413Liabilities and Stockholders' EquityCurrent liabilities
Accounts payable and accrued liabilities $ 7,152 $ 8,084Payables to affiliates 125 135Short-term debt 354 182Deferred revenue 986 717Other current liabilities 405 410
Total current liabilities 9,022 9,528Long-term debt 21,832 20,461Long-term debt to affiliates 5,600 5,600Tower obligations 2,621 2,658Deferred tax liabilities 4,938 4,061Deferred rent expense 2,616 2,481Other long-term liabilities 1,026 1,067
Total long-term liabilities 38,633 36,328Commitments and contingencies Stockholders' equity
5.50% Mandatory Convertible Preferred Stock Series A, par value $0.00001 per share, 100,000,000 shares authorized; 20,000,000 and 20,000,000 shares issued and outstanding; $1,000 and $1,000 aggregate liquidation value — —Common Stock, par value $0.00001 per share, 1,000,000,000 shares authorized; 827,768,818 and 819,773,724 shares issued, 826,357,331 and 818,391,219 shares outstanding — —Additional paid-in capital 38,846 38,666Treasury stock, at cost, 1,411,487 and 1,382,505 shares issued (1) —Accumulated other comprehensive income (loss) 1 (1)Accumulated deficit (20,610) (22,108)
Total stockholders' equity 18,236 16,557Total liabilities and stockholders' equity $ 65,891 $ 62,413
30
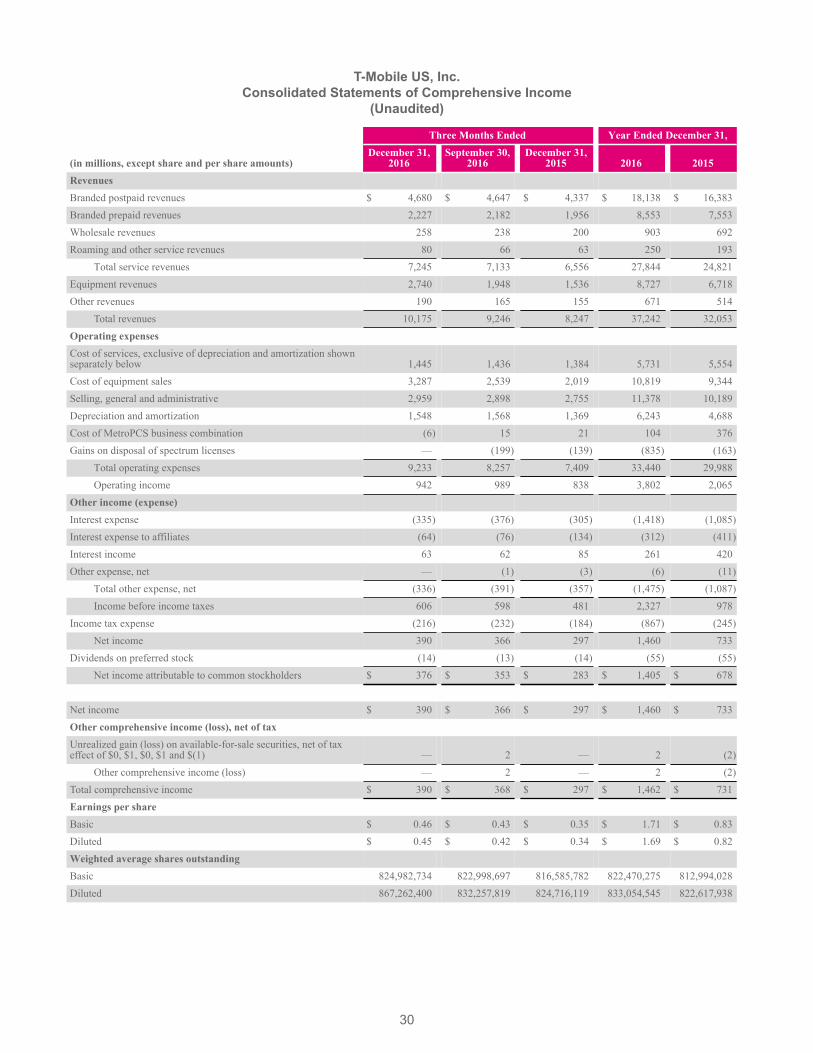
T-Mobile US, Inc.Consolidated Statements of Comprehensive Income
(Unaudited)
Three Months Ended Year Ended December 31,
(in millions, except share and per share amounts)December 31,
2016September 30,
2016December 31,
2015 2016 2015RevenuesBranded postpaid revenues $ 4,680 $ 4,647 $ 4,337 $ 18,138 $ 16,383Branded prepaid revenues 2,227 2,182 1,956 8,553 7,553Wholesale revenues 258 238 200 903 692Roaming and other service revenues 80 66 63 250 193
Total service revenues 7,245 7,133 6,556 27,844 24,821Equipment revenues 2,740 1,948 1,536 8,727 6,718Other revenues 190 165 155 671 514
Total revenues 10,175 9,246 8,247 37,242 32,053Operating expensesCost of services, exclusive of depreciation and amortization shownseparately below 1,445 1,436 1,384 5,731 5,554Cost of equipment sales 3,287 2,539 2,019 10,819 9,344Selling, general and administrative 2,959 2,898 2,755 11,378 10,189Depreciation and amortization 1,548 1,568 1,369 6,243 4,688Cost of MetroPCS business combination (6) 15 21 104 376Gains on disposal of spectrum licenses — (199) (139) (835) (163)
Total operating expenses 9,233 8,257 7,409 33,440 29,988Operating income 942 989 838 3,802 2,065
Other income (expense)Interest expense (335) (376) (305) (1,418) (1,085)Interest expense to affiliates (64) (76) (134) (312) (411)Interest income 63 62 85 261 420Other expense, net — (1) (3) (6) (11)
Total other expense, net (336) (391) (357) (1,475) (1,087)Income before income taxes 606 598 481 2,327 978
Income tax expense (216) (232) (184) (867) (245)Net income 390 366 297 1,460 733
Dividends on preferred stock (14) (13) (14) (55) (55)Net income attributable to common stockholders $ 376 $ 353 $ 283 $ 1,405 $ 678
Net income $ 390 $ 366 $ 297 $ 1,460 $ 733Other comprehensive income (loss), net of taxUnrealized gain (loss) on available-for-sale securities, net of tax effect of $0, $1, $0, $1 and $(1) — 2 — 2 (2)
Other comprehensive income (loss) — 2 — 2 (2)Total comprehensive income $ 390 $ 368 $ 297 $ 1,462 $ 731Earnings per shareBasic $ 0.46 $ 0.43 $ 0.35 $ 1.71 $ 0.83Diluted $ 0.45 $ 0.42 $ 0.34 $ 1.69 $ 0.82Weighted average shares outstandingBasic 824,982,734 822,998,697 816,585,782 822,470,275 812,994,028Diluted 867,262,400 832,257,819 824,716,119 833,054,545 822,617,938
31
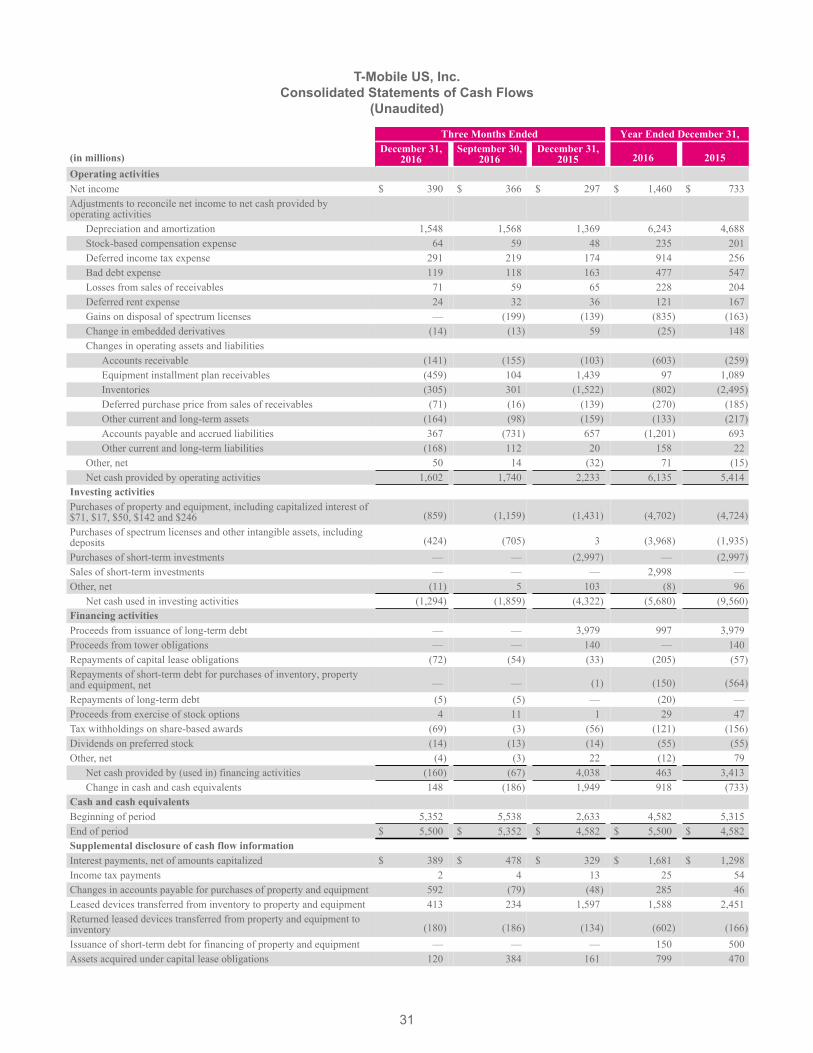
T-Mobile US, Inc.Consolidated Statements of Cash Flows
(Unaudited)
Three Months Ended Year Ended December 31,
(in millions)December 31,
2016September 30,
2016December 31,
2015 2016 2015Operating activitiesNet income $ 390 $ 366 $ 297 $ 1,460 $ 733Adjustments to reconcile net income to net cash provided by operating activities
Depreciation and amortization 1,548 1,568 1,369 6,243 4,688Stock-based compensation expense 64 59 48 235 201Deferred income tax expense 291 219 174 914 256Bad debt expense 119 118 163 477 547Losses from sales of receivables 71 59 65 228 204Deferred rent expense 24 32 36 121 167Gains on disposal of spectrum licenses — (199) (139) (835) (163)Change in embedded derivatives (14) (13) 59 (25) 148Changes in operating assets and liabilities
Accounts receivable (141) (155) (103) (603) (259)Equipment installment plan receivables (459) 104 1,439 97 1,089Inventories (305) 301 (1,522) (802) (2,495)Deferred purchase price from sales of receivables (71) (16) (139) (270) (185)Other current and long-term assets (164) (98) (159) (133) (217)Accounts payable and accrued liabilities 367 (731) 657 (1,201) 693Other current and long-term liabilities (168) 112 20 158 22
Other, net 50 14 (32) 71 (15)Net cash provided by operating activities 1,602 1,740 2,233 6,135 5,414
Investing activitiesPurchases of property and equipment, including capitalized interest of $71, $17, $50, $142 and $246 (859) (1,159) (1,431) (4,702) (4,724)Purchases of spectrum licenses and other intangible assets, including deposits (424) (705) 3 (3,968) (1,935)Purchases of short-term investments — — (2,997) — (2,997)Sales of short-term investments — — — 2,998 —Other, net (11) 5 103 (8) 96
Net cash used in investing activities (1,294) (1,859) (4,322) (5,680) (9,560)Financing activitiesProceeds from issuance of long-term debt — — 3,979 997 3,979Proceeds from tower obligations — — 140 — 140Repayments of capital lease obligations (72) (54) (33) (205) (57)Repayments of short-term debt for purchases of inventory, propertyand equipment, net — — (1) (150) (564)Repayments of long-term debt (5) (5) — (20) —Proceeds from exercise of stock options 4 11 1 29 47Tax withholdings on share-based awards (69) (3) (56) (121) (156)Dividends on preferred stock (14) (13) (14) (55) (55)Other, net (4) (3) 22 (12) 79
Net cash provided by (used in) financing activities (160) (67) 4,038 463 3,413Change in cash and cash equivalents 148 (186) 1,949 918 (733)
Cash and cash equivalentsBeginning of period 5,352 5,538 2,633 4,582 5,315End of period $ 5,500 $ 5,352 $ 4,582 $ 5,500 $ 4,582Supplemental disclosure of cash flow informationInterest payments, net of amounts capitalized $ 389 $ 478 $ 329 $ 1,681 $ 1,298Income tax payments 2 4 13 25 54Changes in accounts payable for purchases of property and equipment 592 (79) (48) 285 46Leased devices transferred from inventory to property and equipment 413 234 1,597 1,588 2,451Returned leased devices transferred from property and equipment to inventory (180) (186) (134) (602) (166)Issuance of short-term debt for financing of property and equipment — — — 150 500Assets acquired under capital lease obligations 120 384 161 799 470
32
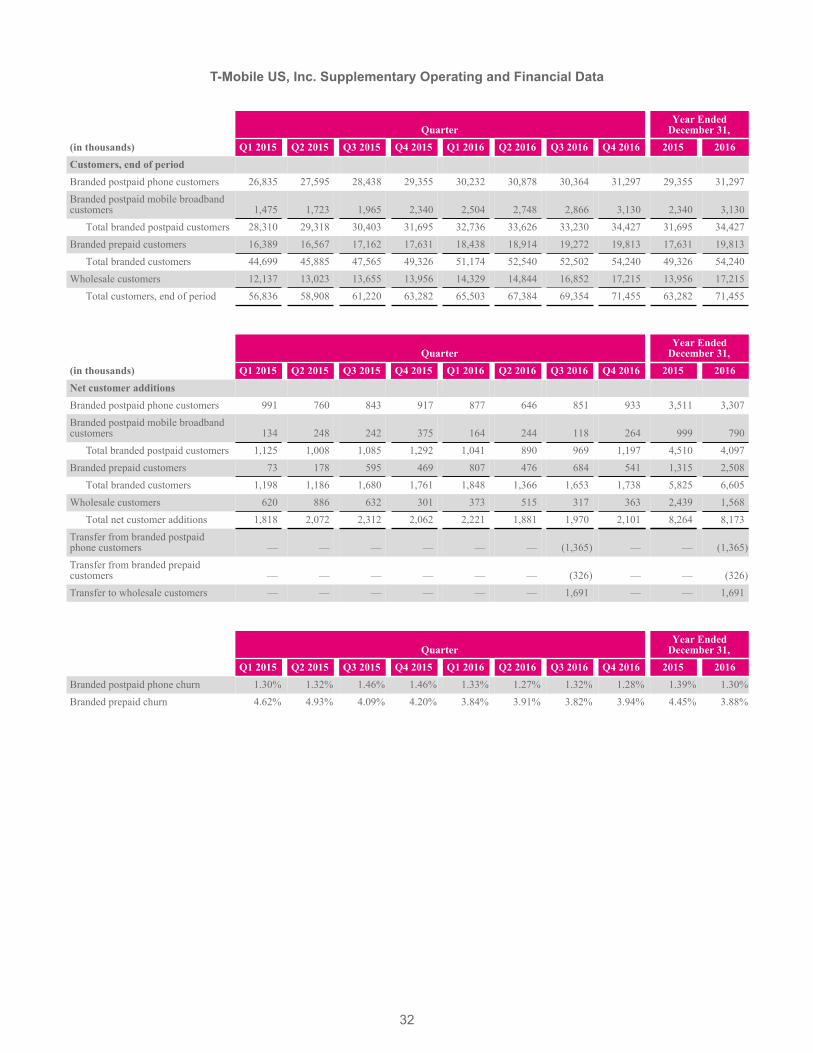
T-Mobile US, Inc. Supplementary Operating and Financial Data
QuarterYear Ended
December 31,(in thousands) Q1 2015 Q2 2015 Q3 2015 Q4 2015 Q1 2016 Q2 2016 Q3 2016 Q4 2016 2015 2016Customers, end of periodBranded postpaid phone customers 26,835 27,595 28,438 29,355 30,232 30,878 30,364 31,297 29,355 31,297Branded postpaid mobile broadbandcustomers 1,475 1,723 1,965 2,340 2,504 2,748 2,866 3,130 2,340 3,130
Total branded postpaid customers 28,310 29,318 30,403 31,695 32,736 33,626 33,230 34,427 31,695 34,427Branded prepaid customers 16,389 16,567 17,162 17,631 18,438 18,914 19,272 19,813 17,631 19,813
Total branded customers 44,699 45,885 47,565 49,326 51,174 52,540 52,502 54,240 49,326 54,240Wholesale customers 12,137 13,023 13,655 13,956 14,329 14,844 16,852 17,215 13,956 17,215
Total customers, end of period 56,836 58,908 61,220 63,282 65,503 67,384 69,354 71,455 63,282 71,455
QuarterYear Ended
December 31,(in thousands) Q1 2015 Q2 2015 Q3 2015 Q4 2015 Q1 2016 Q2 2016 Q3 2016 Q4 2016 2015 2016Net customer additionsBranded postpaid phone customers 991 760 843 917 877 646 851 933 3,511 3,307Branded postpaid mobile broadbandcustomers 134 248 242 375 164 244 118 264 999 790
Total branded postpaid customers 1,125 1,008 1,085 1,292 1,041 890 969 1,197 4,510 4,097Branded prepaid customers 73 178 595 469 807 476 684 541 1,315 2,508
Total branded customers 1,198 1,186 1,680 1,761 1,848 1,366 1,653 1,738 5,825 6,605Wholesale customers 620 886 632 301 373 515 317 363 2,439 1,568
Total net customer additions 1,818 2,072 2,312 2,062 2,221 1,881 1,970 2,101 8,264 8,173Transfer from branded postpaid phone customers — — — — — — (1,365) — — (1,365)Transfer from branded prepaid customers — — — — — — (326) — — (326)Transfer to wholesale customers — — — — — — 1,691 — — 1,691
QuarterYear Ended
December 31,Q1 2015 Q2 2015 Q3 2015 Q4 2015 Q1 2016 Q2 2016 Q3 2016 Q4 2016 2015 2016
Branded postpaid phone churn 1.30% 1.32% 1.46% 1.46% 1.33% 1.27% 1.32% 1.28% 1.39% 1.30%Branded prepaid churn 4.62% 4.93% 4.09% 4.20% 3.84% 3.91% 3.82% 3.94% 4.45% 3.88%
33
T-Mobile US, Inc. Supplementary Operating and Financial Data (continued)
QuarterYear Ended
December 31,Q1 2015 Q2 2015 Q3 2015 Q4 2015 Q1 2016 Q2 2016 Q3 2016 Q4 2016 2015 2016
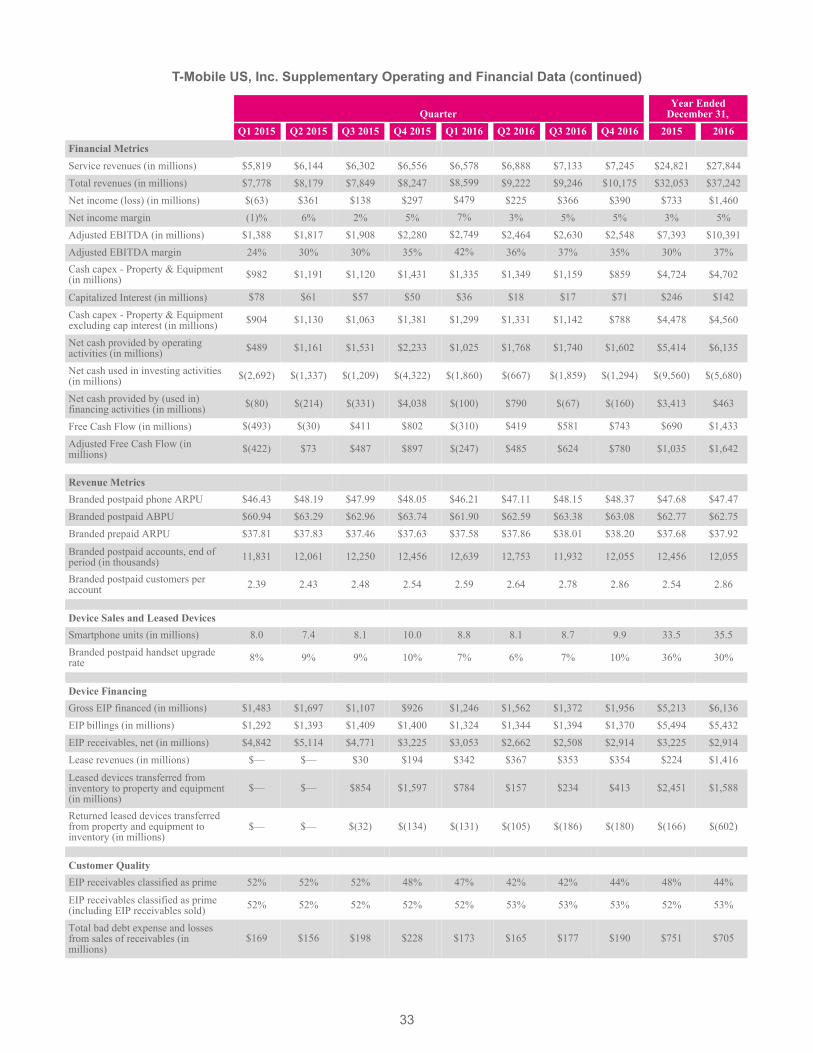
Financial MetricsService revenues (in millions) $5,819 $6,144 $6,302 $6,556 $6,578 $6,888 $7,133 $7,245 $24,821 $27,844Total revenues (in millions) $7,778 $8,179 $7,849 $8,247 $8,599 $9,222 $9,246 $10,175 $32,053 $37,242Net income (loss) (in millions) $(63) $361 $138 $297 $479 $225 $366 $390 $733 $1,460Net income margin (1)% 6% 2% 5% 7% 3% 5% 5% 3% 5%Adjusted EBITDA (in millions) $1,388 $1,817 $1,908 $2,280 $2,749 $2,464 $2,630 $2,548 $7,393 $10,391Adjusted EBITDA margin 24% 30% 30% 35% 42% 36% 37% 35% 30% 37%Cash capex - Property & Equipment(in millions) $982 $1,191 $1,120 $1,431 $1,335 $1,349 $1,159 $859 $4,724 $4,702
Capitalized Interest (in millions) $78 $61 $57 $50 $36 $18 $17 $71 $246 $142
Cash capex - Property & Equipmentexcluding cap interest (in millions) $904 $1,130 $1,063 $1,381 $1,299 $1,331 $1,142 $788 $4,478 $4,560
Net cash provided by operatingactivities (in millions) $489 $1,161 $1,531 $2,233 $1,025 $1,768 $1,740 $1,602 $5,414 $6,135
Net cash used in investing activities(in millions) $(2,692) $(1,337) $(1,209) $(4,322) $(1,860) $(667) $(1,859) $(1,294) $(9,560) $(5,680)
Net cash provided by (used in)financing activities (in millions) $(80) $(214) $(331) $4,038 $(100) $790 $(67) $(160) $3,413 $463
Free Cash Flow (in millions) $(493) $(30) $411 $802 $(310) $419 $581 $743 $690 $1,433
Adjusted Free Cash Flow (in millions) $(422) $73 $487 $897 $(247) $485 $624 $780 $1,035 $1,642
Revenue MetricsBranded postpaid phone ARPU $46.43 $48.19 $47.99 $48.05 $46.21 $47.11 $48.15 $48.37 $47.68 $47.47Branded postpaid ABPU $60.94 $63.29 $62.96 $63.74 $61.90 $62.59 $63.38 $63.08 $62.77 $62.75Branded prepaid ARPU $37.81 $37.83 $37.46 $37.63 $37.58 $37.86 $38.01 $38.20 $37.68 $37.92
Branded postpaid accounts, end ofperiod (in thousands) 11,831 12,061 12,250 12,456 12,639 12,753 11,932 12,055 12,456 12,055
Branded postpaid customers peraccount 2.39 2.43 2.48 2.54 2.59 2.64 2.78 2.86 2.54 2.86
Device Sales and Leased DevicesSmartphone units (in millions) 8.0 7.4 8.1 10.0 8.8 8.1 8.7 9.9 33.5 35.5Branded postpaid handset upgraderate 8% 9% 9% 10% 7% 6% 7% 10% 36% 30%
Device FinancingGross EIP financed (in millions) $1,483 $1,697 $1,107 $926 $1,246 $1,562 $1,372 $1,956 $5,213 $6,136EIP billings (in millions) $1,292 $1,393 $1,409 $1,400 $1,324 $1,344 $1,394 $1,370 $5,494 $5,432EIP receivables, net (in millions) $4,842 $5,114 $4,771 $3,225 $3,053 $2,662 $2,508 $2,914 $3,225 $2,914Lease revenues (in millions) $— $— $30 $194 $342 $367 $353 $354 $224 $1,416
Leased devices transferred frominventory to property and equipment(in millions)
$— $— $854 $1,597 $784 $157 $234 $413 $2,451 $1,588
Returned leased devices transferredfrom property and equipment toinventory (in millions)
$— $— $(32) $(134) $(131) $(105) $(186) $(180) $(166) $(602)
Customer QualityEIP receivables classified as prime 52% 52% 52% 48% 47% 42% 42% 44% 48% 44%
EIP receivables classified as prime(including EIP receivables sold) 52% 52% 52% 52% 52% 53% 53% 53% 52% 53%
Total bad debt expense and lossesfrom sales of receivables (inmillions)
$169 $156 $198 $228 $173 $165 $177 $190 $751 $705

34
T-Mobile US, Inc.Reconciliation of Non-GAAP Financial Measures to GAAP Financial Measures
(Unaudited)
This Investor Factbook includes non-GAAP financial measures. The non-GAAP financial measures should be considered in addition to, but not as a substitute for, the information provided in accordance with GAAP. Reconciliations for the non-GAAP financial measures to the most directly comparable GAAP financial measures are provided below. T-Mobile is not able to forecast net income on a forward looking basis without unreasonable efforts due to the high variability and difficulty in predicting certain items that affect GAAP net income including, but not limited to, income tax expense, stock based compensation expense, interest expense and interest income. The Company is making an accounting change in 2017 to include imputed interest associated with EIP receivables in Other revenues which will be included in Adjusted EBITDA.
Adjusted EBITDA is reconciled to net income (loss) as follows:
QuarterYear Ended
December 31,(in millions) Q1 2015 Q2 2015 Q3 2015 Q4 2015 Q1 2016 Q2 2016 Q3 2016 Q4 2016 2015 2016Net income (loss) $ (63) $ 361 $ 138 $ 297 $ 479 $ 225 $ 366 $ 390 $ 733 $ 1,460Adjustments:
Interest expense 261 257 262 305 339 368 376 335 1,085 1,418Interest expense to affiliates 64 92 121 134 79 93 76 64 411 312Interest income (112) (114) (109) (85) (68) (68) (62) (63) (420) (261)Other expense (income), net 8 (1) 1 3 2 3 1 — 11 6Income tax expense (benefit) (41) 2 100 184 272 147 232 216 245 867
Operating income 117 597 513 838 1,103 768 989 942 2,065 3,802Depreciation and amortization 1,087 1,075 1,157 1,369 1,552 1,575 1,568 1,548 4,688 6,243Cost of MetroPCS businesscombination 128 34 193 21 36 59 15 (6) 376 104Stock-based compensation (1) 56 71 43 52 53 61 57 64 222 235Other, net (1) — 40 2 — 5 1 1 — 42 7
Adjusted EBITDA $ 1,388 $ 1,817 $ 1,908 $ 2,280 $ 2,749 $ 2,464 $ 2,630 $ 2,548 $ 7,393 $ 10,391
(1) Stock-based compensation includes payroll tax impacts and may not agree to stock-based compensation expense in the condensed consolidated financial statements. Other, net may not agree to the Consolidated Statements of Comprehensive Income primarily due to certain non-routine operating activities, such as other special items that would not be expected to reoccur, and are therefore excluded in Adjusted EBITDA.
Net debt (excluding Tower Obligations) to last twelve months adjusted EBITDA ratio is calculated as follows:
(in millions, except net debt ratio)Mar 31,
2015Jun 30,
2015Sep 30,
2015Dec 31,
2015Mar 31,
2016Jun 30,
2016Sep 30,
2016Dec 31,
2016Short-term debt $ 467 $ 386 $ 114 $ 182 $ 365 $ 258 $ 325 $ 354Long-term debt to affiliates 5,600 5,600 5,600 5,600 5,600 5,600 5,600 5,600Long-term debt (1) 16,248 16,373 16,430 20,461 20,505 21,574 21,825 21,832Less: Cash and cash equivalents (3,032) (2,642) (2,633) (4,582) (3,647) (5,538) (5,352) (5,500)Less: Short-term investments — — — (2,998) (2,925) — — —
Net Debt (excluding Tower Obligations) $ 19,283 $ 19,717 $ 19,511 $ 18,663 $ 19,898 $ 21,894 $ 22,398 $ 22,286Divided by: Last twelve months Adjusted EBITDA $ 5,936 $ 6,302 $ 6,864 $ 7,393 $ 8,754 $ 9,401 $ 10,123 $ 10,391
Net Debt (excluding Tower Obligations) to Last Twelve Months Adjusted EBITDA Ratio 3.2 3.1 2.8 2.5 2.3 2.3 2.2 2.1
(1) Long-term debt as of March 31, 2015 through December 31, 2015 has been restated for the adoption of Accounting Standards Update 2015-03, “Simplifying the Presentation of Debt Issuance Costs” in Q1 2016. The impact to the Net Debt (excluding Tower Obligations) to Last Twelve Months Adjusted EBITDA Ratio was not significant.
35
T-Mobile US, Inc.Reconciliation of Non-GAAP Financial Measures to GAAP Financial Measures (continued)
(Unaudited)
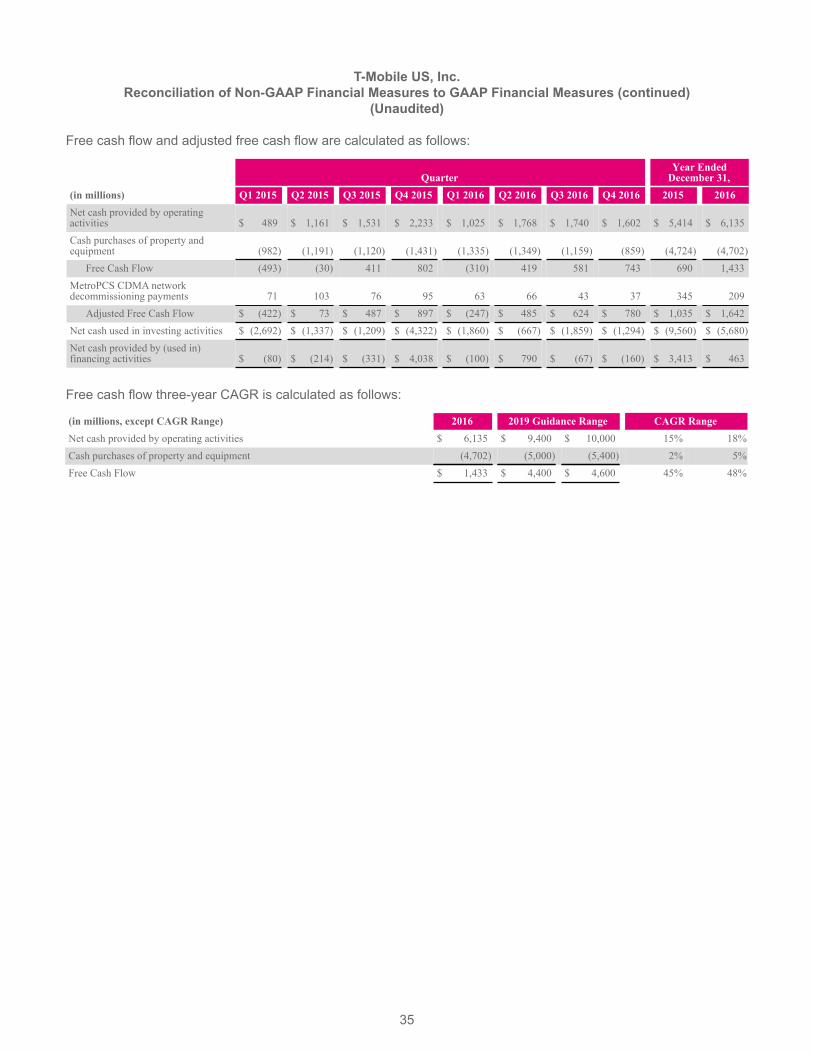
Free cash flow and adjusted free cash flow are calculated as follows:
QuarterYear Ended
December 31,(in millions) Q1 2015 Q2 2015 Q3 2015 Q4 2015 Q1 2016 Q2 2016 Q3 2016 Q4 2016 2015 2016Net cash provided by operating activities $ 489 $ 1,161 $ 1,531 $ 2,233 $ 1,025 $ 1,768 $ 1,740 $ 1,602 $ 5,414 $ 6,135Cash purchases of property and equipment (982) (1,191) (1,120) (1,431) (1,335) (1,349) (1,159) (859) (4,724) (4,702)
Free Cash Flow (493) (30) 411 802 (310) 419 581 743 690 1,433MetroPCS CDMA network decommissioning payments 71 103 76 95 63 66 43 37 345 209
Adjusted Free Cash Flow $ (422) $ 73 $ 487 $ 897 $ (247) $ 485 $ 624 $ 780 $ 1,035 $ 1,642Net cash used in investing activities $ (2,692) $ (1,337) $ (1,209) $ (4,322) $ (1,860) $ (667) $ (1,859) $ (1,294) $ (9,560) $ (5,680)Net cash provided by (used in)financing activities $ (80) $ (214) $ (331) $ 4,038 $ (100) $ 790 $ (67) $ (160) $ 3,413 $ 463
Free cash flow three-year CAGR is calculated as follows:
(in millions, except CAGR Range) 2016 2019 Guidance Range CAGR RangeNet cash provided by operating activities $ 6,135 $ 9,400 $ 10,000 15% 18%Cash purchases of property and equipment (4,702) (5,000) (5,400) 2% 5%Free Cash Flow $ 1,433 $ 4,400 $ 4,600 45% 48%
36
T-Mobile US, Inc.Reconciliation of Operating Measures to Branded Postpaid Service Revenues
(Unaudited)
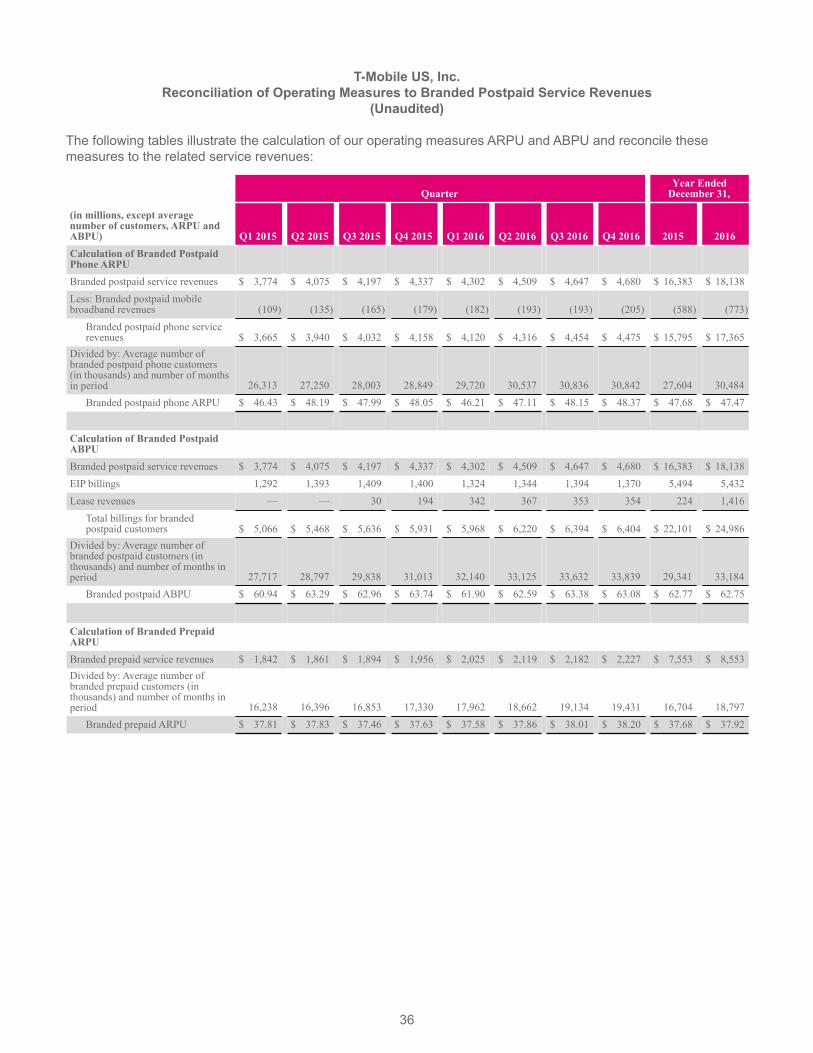
The following tables illustrate the calculation of our operating measures ARPU and ABPU and reconcile these measures to the related service revenues:
QuarterYear Ended
December 31,
(in millions, except average number of customers, ARPU and ABPU) Q1 2015 Q2 2015 Q3 2015 Q4 2015 Q1 2016 Q2 2016 Q3 2016 Q4 2016 2015 2016Calculation of Branded Postpaid Phone ARPUBranded postpaid service revenues $ 3,774 $ 4,075 $ 4,197 $ 4,337 $ 4,302 $ 4,509 $ 4,647 $ 4,680 $ 16,383 $ 18,138Less: Branded postpaid mobile broadband revenues (109) (135) (165) (179) (182) (193) (193) (205) (588) (773)
Branded postpaid phone service revenues $ 3,665 $ 3,940 $ 4,032 $ 4,158 $ 4,120 $ 4,316 $ 4,454 $ 4,475 $ 15,795 $ 17,365
Divided by: Average number of branded postpaid phone customers (in thousands) and number of months in period 26,313 27,250 28,003 28,849 29,720 30,537 30,836 30,842 27,604 30,484
Branded postpaid phone ARPU $ 46.43 $ 48.19 $ 47.99 $ 48.05 $ 46.21 $ 47.11 $ 48.15 $ 48.37 $ 47.68 $ 47.47
Calculation of Branded Postpaid ABPUBranded postpaid service revenues $ 3,774 $ 4,075 $ 4,197 $ 4,337 $ 4,302 $ 4,509 $ 4,647 $ 4,680 $ 16,383 $ 18,138EIP billings 1,292 1,393 1,409 1,400 1,324 1,344 1,394 1,370 5,494 5,432Lease revenues — — 30 194 342 367 353 354 224 1,416
Total billings for branded postpaid customers $ 5,066 $ 5,468 $ 5,636 $ 5,931 $ 5,968 $ 6,220 $ 6,394 $ 6,404 $ 22,101 $ 24,986
Divided by: Average number of branded postpaid customers (in thousands) and number of months in period 27,717 28,797 29,838 31,013 32,140 33,125 33,632 33,839 29,341 33,184
Branded postpaid ABPU $ 60.94 $ 63.29 $ 62.96 $ 63.74 $ 61.90 $ 62.59 $ 63.38 $ 63.08 $ 62.77 $ 62.75
Calculation of Branded Prepaid ARPUBranded prepaid service revenues $ 1,842 $ 1,861 $ 1,894 $ 1,956 $ 2,025 $ 2,119 $ 2,182 $ 2,227 $ 7,553 $ 8,553Divided by: Average number of branded prepaid customers (in thousands) and number of months in period 16,238 16,396 16,853 17,330 17,962 18,662 19,134 19,431 16,704 18,797
Branded prepaid ARPU $ 37.81 $ 37.83 $ 37.46 $ 37.63 $ 37.58 $ 37.86 $ 38.01 $ 38.20 $ 37.68 $ 37.92
37
Definitions of Terms
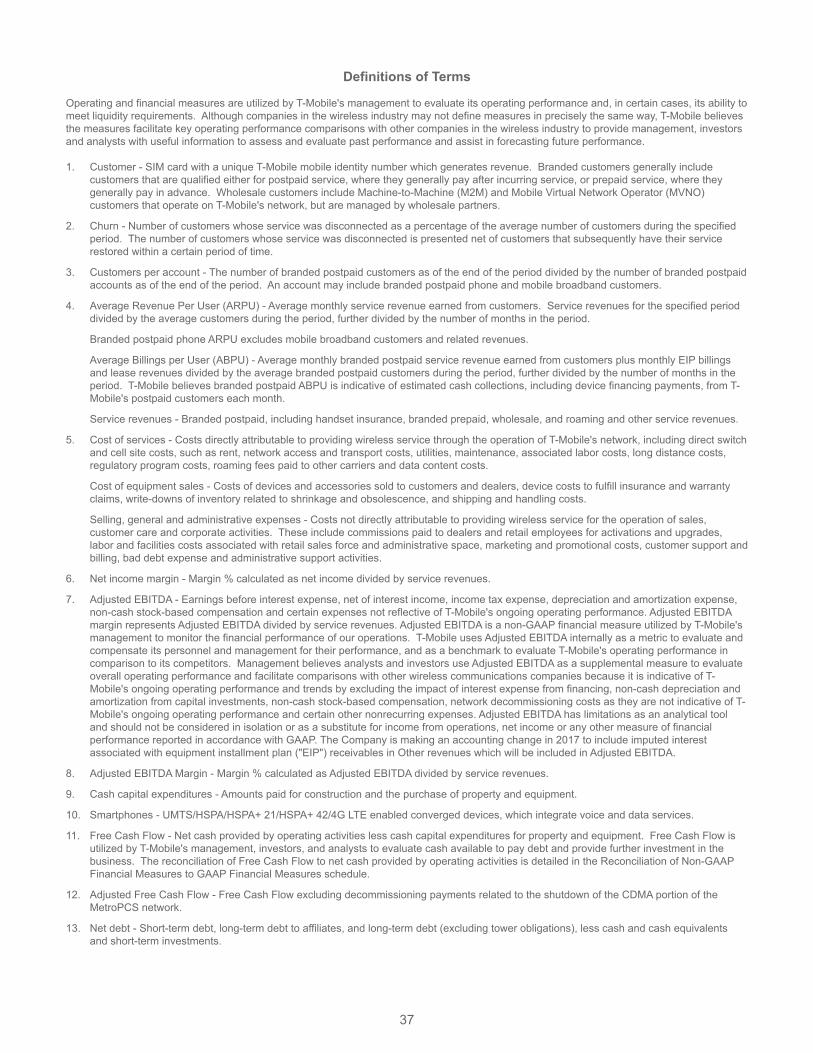
Operating and financial measures are utilized by T-Mobile's management to evaluate its operating performance and, in certain cases, its ability to meet liquidity requirements. Although companies in the wireless industry may not define measures in precisely the same way, T-Mobile believes the measures facilitate key operating performance comparisons with other companies in the wireless industry to provide management, investors and analysts with useful information to assess and evaluate past performance and assist in forecasting future performance. 1. Customer - SIM card with a unique T-Mobile mobile identity number which generates revenue. Branded customers generally include
customers that are qualified either for postpaid service, where they generally pay after incurring service, or prepaid service, where they generally pay in advance. Wholesale customers include Machine-to-Machine (M2M) and Mobile Virtual Network Operator (MVNO) customers that operate on T-Mobile's network, but are managed by wholesale partners.
2. Churn - Number of customers whose service was disconnected as a percentage of the average number of customers during the specified period. The number of customers whose service was disconnected is presented net of customers that subsequently have their service restored within a certain period of time.
3. Customers per account - The number of branded postpaid customers as of the end of the period divided by the number of branded postpaid accounts as of the end of the period. An account may include branded postpaid phone and mobile broadband customers.
4. Average Revenue Per User (ARPU) - Average monthly service revenue earned from customers. Service revenues for the specified period divided by the average customers during the period, further divided by the number of months in the period.
Branded postpaid phone ARPU excludes mobile broadband customers and related revenues.
Average Billings per User (ABPU) - Average monthly branded postpaid service revenue earned from customers plus monthly EIP billings and lease revenues divided by the average branded postpaid customers during the period, further divided by the number of months in the period. T-Mobile believes branded postpaid ABPU is indicative of estimated cash collections, including device financing payments, from T-Mobile's postpaid customers each month.
Service revenues - Branded postpaid, including handset insurance, branded prepaid, wholesale, and roaming and other service revenues.
5. Cost of services - Costs directly attributable to providing wireless service through the operation of T-Mobile's network, including direct switch and cell site costs, such as rent, network access and transport costs, utilities, maintenance, associated labor costs, long distance costs, regulatory program costs, roaming fees paid to other carriers and data content costs.
Cost of equipment sales - Costs of devices and accessories sold to customers and dealers, device costs to fulfill insurance and warranty claims, write-downs of inventory related to shrinkage and obsolescence, and shipping and handling costs.
Selling, general and administrative expenses - Costs not directly attributable to providing wireless service for the operation of sales, customer care and corporate activities. These include commissions paid to dealers and retail employees for activations and upgrades, labor and facilities costs associated with retail sales force and administrative space, marketing and promotional costs, customer support and billing, bad debt expense and administrative support activities.
6. Net income margin - Margin % calculated as net income divided by service revenues.
7. Adjusted EBITDA - Earnings before interest expense, net of interest income, income tax expense, depreciation and amortization expense, non-cash stock-based compensation and certain expenses not reflective of T-Mobile's ongoing operating performance. Adjusted EBITDA margin represents Adjusted EBITDA divided by service revenues. Adjusted EBITDA is a non-GAAP financial measure utilized by T-Mobile's management to monitor the financial performance of our operations. T-Mobile uses Adjusted EBITDA internally as a metric to evaluate and compensate its personnel and management for their performance, and as a benchmark to evaluate T-Mobile's operating performance in comparison to its competitors. Management believes analysts and investors use Adjusted EBITDA as a supplemental measure to evaluate overall operating performance and facilitate comparisons with other wireless communications companies because it is indicative of T-Mobile's ongoing operating performance and trends by excluding the impact of interest expense from financing, non-cash depreciation and amortization from capital investments, non-cash stock-based compensation, network decommissioning costs as they are not indicative of T-Mobile's ongoing operating performance and certain other nonrecurring expenses. Adjusted EBITDA has limitations as an analytical tool and should not be considered in isolation or as a substitute for income from operations, net income or any other measure of financial performance reported in accordance with GAAP. The Company is making an accounting change in 2017 to include imputed interest associated with equipment installment plan ("EIP") receivables in Other revenues which will be included in Adjusted EBITDA.
8. Adjusted EBITDA Margin - Margin % calculated as Adjusted EBITDA divided by service revenues.
9. Cash capital expenditures - Amounts paid for construction and the purchase of property and equipment.
10. Smartphones - UMTS/HSPA/HSPA+ 21/HSPA+ 42/4G LTE enabled converged devices, which integrate voice and data services.
11. Free Cash Flow - Net cash provided by operating activities less cash capital expenditures for property and equipment. Free Cash Flow is utilized by T-Mobile's management, investors, and analysts to evaluate cash available to pay debt and provide further investment in the business. The reconciliation of Free Cash Flow to net cash provided by operating activities is detailed in the Reconciliation of Non-GAAP Financial Measures to GAAP Financial Measures schedule.
12. Adjusted Free Cash Flow - Free Cash Flow excluding decommissioning payments related to the shutdown of the CDMA portion of the MetroPCS network.
13. Net debt - Short-term debt, long-term debt to affiliates, and long-term debt (excluding tower obligations), less cash and cash equivalents and short-term investments.
38
Forward-Looking Statements
This Investor Factbook includes "forward-looking statements" within the meaning of the U.S. federal securities laws. Any statements made herein that are not statements of historical fact, including statements about T-Mobile's plans, outlook, beliefs, opinion, projections, guidance, strategy, expected network modernization and other advancements, are forward-looking statements. Generally, forward-looking statements may be identified by words such as "anticipate," "expect," "suggests," "plan," “project,” "believe," "intend," "estimates," "targets," "views," "may," "will," "forecast," and other similar expressions. The forward-looking statements speak only as of the date made, are based on current assumptions and expectations, and involve a number of risks and uncertainties. Important factors that could affect future results and cause those results to differ materially from those expressed in the forward-looking statements include, among others, the following: adverse economic or political conditions in the U.S. and international markets; competition in the wireless services market, including new competitors entering the industry as technologies converge; the effects any future merger or acquisition involving us, as well as the effects of mergers or acquisitions in the technology, media and telecommunications industry; challenges in implementing our business strategies or funding our wireless operations, including payment for additional spectrum or network upgrades; the possibility that we may be unable to renew our spectrum licenses on attractive terms or acquire new spectrum licenses at reasonable costs and terms; difficulties in managing growth in wireless data services, including network quality; material changes in available technology; the timing, scope and financial impact of our deployment of advanced network and business technologies; the impact on our networks and business from major technology equipment failures; breaches of our and/or our third party vendors’ networks, information technology and data security; natural disasters, terrorist attacks or similar incidents; existing or future litigation; any changes in the regulatory environments in which we operate, including any increase in restrictions on the ability to operate our networks; any disruption or failure of our third parties’ or key suppliers’ provisioning of products or services; material adverse changes in labor matters, including labor campaigns, negotiations or additional organizing activity, and any resulting financial, operational and/or reputational impact; the ability to make payments on our debt or to repay our existing indebtedness when due; adverse change in the ratings of our debt securities or adverse conditions in the credit markets; changes in accounting assumptions that regulatory agencies, including the Securities and Exchange Commission (“SEC”), may require, which could result in an impact on earnings; and changes in tax laws, regulations and existing standards and the resolution of disputes with any taxing jurisdictions; and other risks described in our filings with the SEC, including those described in our most recently filed Annual Report on Form 10-K. You should not place undue reliance on these forward-looking statements. We do not undertake to update forward-looking statements, whether as a result of new information, future events or otherwise, except as required by law.
About T-Mobile US, Inc.
As America's Un-carrier, T-Mobile US, Inc. (NASDAQ: TMUS) is redefining the way consumers and businesses buy wireless services through leading product and service innovation. The Company's advanced nationwide 4G LTE network delivers outstanding wireless experiences to 71.5 million customers who are unwilling to compromise on quality and value. Based in Bellevue, Washington, T-Mobile US provides services through its subsidiaries and operates its flagship brands, T-Mobile and MetroPCS. For more information, please visit http://www.T-Mobile.com or join the conversation on Twitter using $TMUS.