to achieve them, the increase of the thrust- to-power...
TRANSCRIPT
IEPC-97-092 578
Effects of Propellant Feed and Magnetic Field on Ion Thruster Performance
Han&i TAKEGAHARA*, Yasushi OKAWA**, Takeru IKEDA** and lun TAKAHASHI** Department of Aerospace Engineering, Tokyo Metropolitan Institute of Technology
Asahigaoka 6-6, Hino, Tokyo 19 1, Japan
Abstract
The effects of the propellant feed method and the magnetic field configuration on the ion thruster performance have been studied experimentally. The thruster used in this study has the beam exhausting diameter of 30 cm and the cusped magnetic field, and xenon was used as a propellant. The features of this thruster are two main propellant feed paths as the forward feed path and the reverse feed path, and an optional discharge chamber length from 150 mm to 220 mm. As a result of experiments, it was found chat (1) the discharge voltage and the ion production cost were reduced by supplying the propellant via both the forward path and the reverse path simultaneously, (2) the discharge voltage decreased with the longer discharge chamber length, and (3) the direction of magnets located near the grid had effects on the extracted ion beam cumznt and the ion production cost. The nominal performances of the thruster were the thrust of 153 mN, the specific impulse of 37 10 s and the ion production cost of 152 eV/ion at the propellant utilization efficiency o‘f93.5 96. -
Nomenclature
c CA”
= gas conductance of accelerator grid, l/s
CL
= ion production cost, eV/ion = gas conductance of screen grid, l/s
c = accelerator grid current, mA
4 = beam current, A
4 = discharge current, A
ISP = specific impulse, s
mB = propellant back flow rate, SCCM
m c = main cathode flow rate, SCCM
mf = forward propellant flow rate, SCCM
ml = reverse propellant flow rate, SCCM
p” = total propellant flow rate (q, + m, + me), SCCM
$
= vacuum facility pressure (back pressure), Torr = anode side area of field free region, cm2
> = grid side area of field free region, cm2 = thrust, mN
T/P = thrust to power ratio, mN/kW V = volume of field free region, cm3
v. = accelerator grid voltage, V
% = heam voltage, V
V, = discharge voltage, V W = total power consumption, kW
% = thrusta efficiency, 46
‘I. = propellant utilization efficiency, %
* Associate Proffessor ** Graduate Student
Copyright 1997 by the Electric Rocket Propulsion Society. All rights reserved.
1. Introduction
In recent years, planetary missions and orbit-raising missions using electric prop&ions have been discussed concretely. These missions require a large velocity increment, and to achieve them, the increase of the thrust- to-power ratio of the thruster with P high specific impulse is necessary. The large-sizing of the ion thruster can meet this requirement.
There have been a lot of studies of large-sized ion thrustas in Japan, USA and EuropeQ 2).3). In those studies, various types of discharge chambers, ion optics and other components have been examined, and high performances have been obtained. However, it is also necessary to investigate the fundamental phenomena on the plasma production/confinement, the ion extraction and the beam neutralization in detail for further improvements of the thruster performance. To examine these phenomena, TMIT has started the experimental research of the 30 cm cusped ion thruster.
The primary objective of this study is to evaluate the effects of the propellant feed method and the magnetic field configuration on the thruster performance. Although several studies have already been conducted’)* 9. I, there seem to be a lot of interesting phenomena concerning these problems. The thruster used in this study has hvo different propellant feed paths and a length changeable discharge chamber, and the experiments were performed at various configurations of the propellant feed and the discharge chamber.
2. Apparatus 2.1 Ion Thruster
Schematics of the ion thruster used in the present study are shown in Figs. 1 and 2. The thruster has a beam exhausting diameter of 30 cm, and a ring cusp designed magnetic field.
The cylindrical shaped discharge chamber is 320 mm

IEPC-97-092 579
Fig. 1 30 cm Cusped Ion Thruster
Fig. 2 Side View of 30 cm Cusped Ion Thruster
in diameter, and from 150 mm to 220 mm in length. The movable end wall enables to have an optional chamber length, 30 various magnetic field configurations in the discharge chamber can be examined. There are three rings of samarium cobalt magnets (Smt-Cos) to form the cusped
field, one on the end wall and two on the side wall. The ring shaped end wall magnet is located near the cathode and 18 bar shaped magnets are arranged inside the side wall (center and downstream end). The magnets produce the magnetic flux density of approximately 0.3 Tesla at the surface. The aluminum covers were set on the side wall center magnets to avoid the thermal demagnetization.
The propellant feed system consists of two main propellant feed paths as the forward feed path and the reverse feed path, and a main cathode feed path. Figure 3 shows the outline of the propellant feed system. The distributor ring of the forward feed is located on the end wall and the one of the reverse feed is located on 53 mm upstream from the downstream end of the discharge chamber. Both distributors have 6 orifices of 0.5 mm diameter.
Ions are extracted using the dished grid system, a screen and an accelerator arid. They are made of molybdenum. The beam exhaust&g diameter is 300 mm, and the open area fraction of a screen grid and an accelerator grid are 0.71 and 0.26, respectively. The nominal grid-to-grid spacing is 0.4 mm.
2.2 Test Facility Figure 4 shows the space chamber used in the
performance tests of this study. This chamber is 1.6 m in diameter by 3.2 m in length. A turbo molecular pump and two cryo pumps are used for high vacuum pumping, and the total pumping speed is 56200 l/s for N2. The ultimate pressure is 6.7~10~ Pa (5.0x1Q7 Torr), and the pressures during the thruster operations were generally lower than 7.1x10-’ Pa (5.3~10-~ Torr) for Xe. This space chamber has an interesting feature that it czm be isolated elecnkally from the ground potential, so it is able to be used for the accurate evaluation of the beam neutralization phenomena. In this study, however, the space chamber was used in ground potential because the neuhalizer was not operated.
3. Results and Discussions
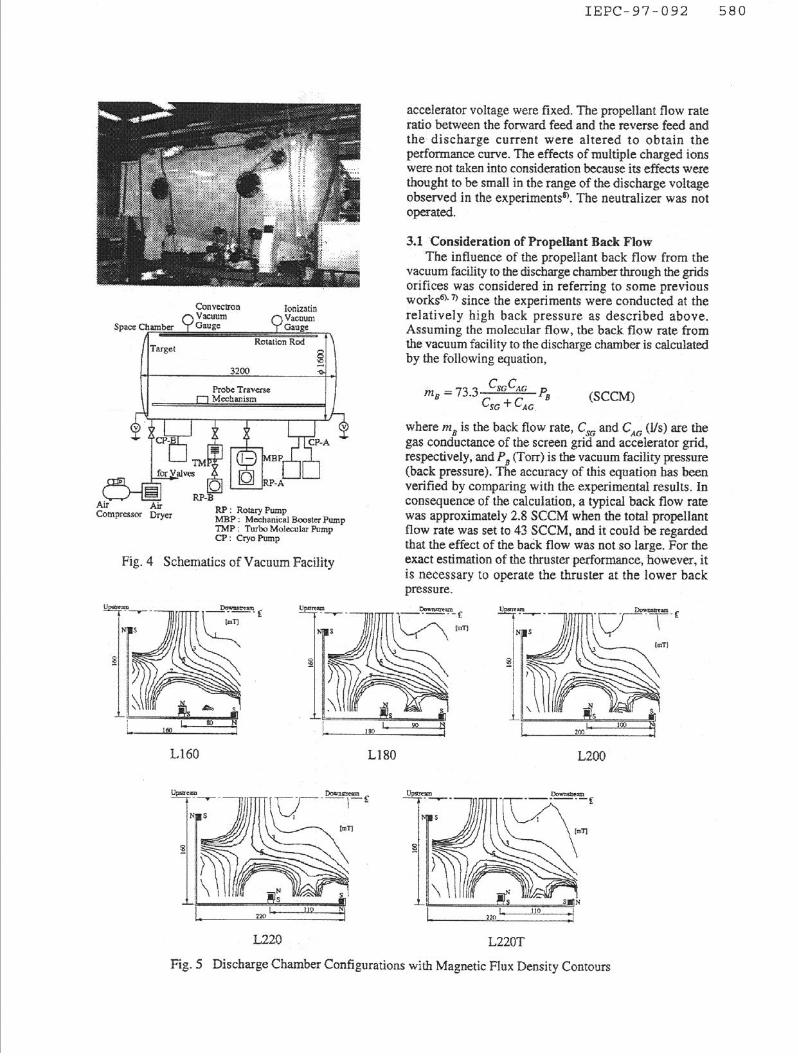
The experiments to evaluate the effects of the propellant feed method and the magnetic field configuration on the thruster performance were performed. Figure 5 shows the discharge chamber configurations examined in this study with the calculated magnetic flux density contours. It has been validated that the calculated magnetic flux density has agreed well with the experimental one. The length of the discharge chamber was set from 160 mm to 220 mm as L160, L180, L200 and L220, and the side wall downstream end magnets were rotated at L22OT. In all configurations, the side wall center magnets were located
FC& on the middle of the side wall. In the operation, the total propellant flow rate, the
Fig. 3 Outline of Propellant Feed System cathode propellant flow rate, the beam voltage and the
IEPC-97-092 580
Ionizstin
Air Aii Com~msor Dryer FtP : Rotary Pump
MBP : Mechanicd Barstcr Pump TMP : Turba Molfular Pmnp CP: CryoPump
Fig. 4 Schematics of Vacuum Facility
accelerator voltage were fixed. The propellant flow rate ratio between the forward feed and the reverse feed and the discharge current were altered to obtain the performance curve. The effects of multiple charged ions were not taken into consideration because its effects were thought to be small in the range of the discharge voltage observed in the experiments*). The neutralizer was not operated.
3.1 Consideration of Propellant Back Flow The influence of the propel&m back flow from the
vacuum facility to the discharge chamber through the grids orifices was considered in referring to some previous works6).‘) since the experiments were conducted at the relatively high back pressure as described above. Assuming the molecular flow, the back flow rate from the vacuum facility to the discharge chamber is calculated by the following equation,
?ns = 73.3 cs&4G PB cSG + cAG
(SCCM)
where ms is the back flow rate, cso and C,, (Us) are the gas conductance of the screen gnd and accelerator grid, respectively, and P, (l’orr) is the vacuum facility pressure (back pressure). The accuracy of this equation has been verified by comparing with the experimental results. In consequence of the calculation, a typical back flow rate was approximately 2.8 SCCM when the total propellant flow rate was set to 43 SCCM, and it could be regarded that the effect of the back flow was not so large. For the exact estimation of the thruster performance, however, it is necessary to operate the thruster at the lower back pressure.
/ Ilo
L220 L22OT
Fig. 5 Discharge Chamber Configurations with Magnetic Flux Density Contours
IEPC-97-092 581
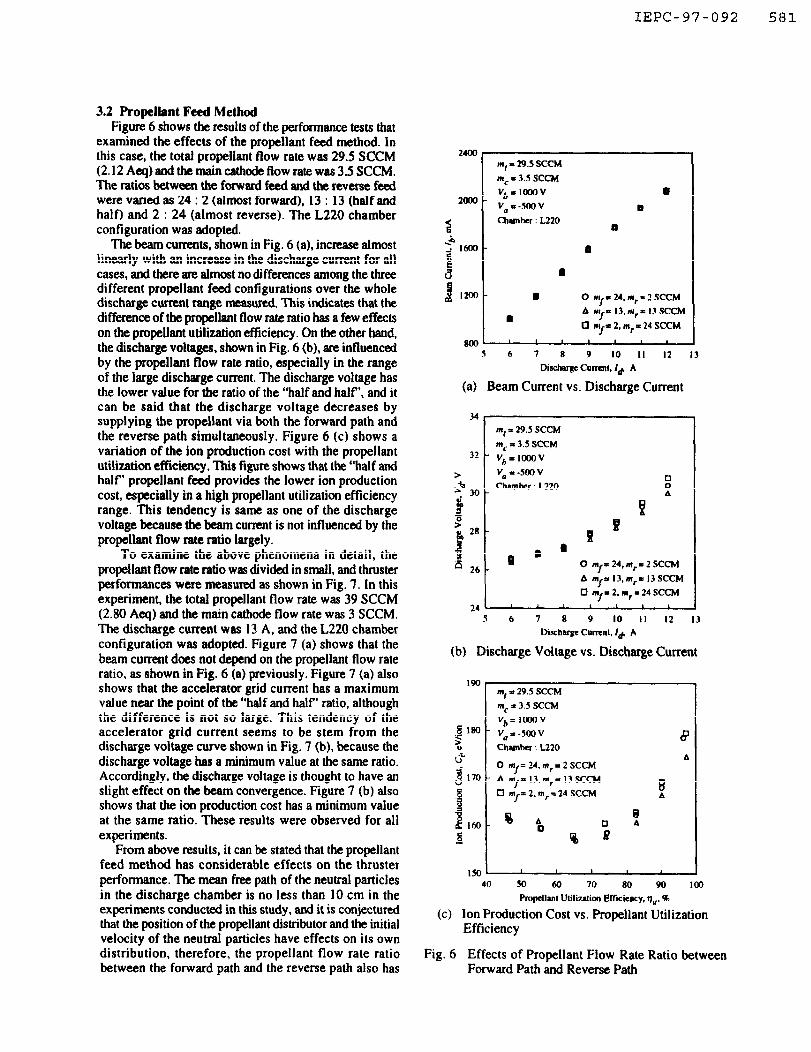
3.2 Propellant Feed Method Figure 6 shows the results of the performance tests that
examined the effects of the propellant feed method. In this case, the total propellant flow rate was 29.5 SCCM (2.12 Aeq) and the main cathode flow rate was 3.5 SCCM. The ratios between the forward feed and the reverse feed were varied as 24 : 2 (almost forward), 13 : 13 (half and half) and 2 : 24 (almost reverse). The L220 chamber configuradon was adopted.
The beam cunents, shown in Fig. 6 (a), increase almost linearly with an increase in the discharge current for all cases, and there are almost no differences among the three different propellant feed configurations over the whole discharge current range measured. This indicates that the difference of the propellant flow rate ratio has a few effects on the propellant utilization efficiency. On the other hand, the discharge voltages, shown in Fig. 6 (b), are influenced by the propellant flow rate ratio, especklly in the range of the large discharge current. The discharge voltage has the lower value for the ratio of the “half and half’, and it can be said that the discharge voltage decreases by supplying the propellant via both the forward path and the reverse path simultaneously. Figure 6 (c) shows a variation of the ion production cost with the propellant utilization effkiency. This figure shows that the “half and half’ propellant feed provides the lower ion production cost, especially in a high propellant utilization efficiency range. This tendency is same as one of the discharge voltage because the beam current is not influenced by the propellant flow rate ratio largely.
To examine the above phenomena in detail, the propellant flow rate ratio was divided in small, and thruster performances were measured as shown in Fig. 7. In this experiment, the total propellant flow rate was 39 SCCM (2.80 Aeq) and the main cathode flow rate was 3 SCCM, The discharge current was 13 A, and the L220 chamber configuration was adopted. Figure 7 (a) shows that the beam current does not depend on the propellant flow rate ratio, as shown in Fig. 6 (a) previously. Figure 7 (a) also shows that the accelerator grid current has a maximum value near the point of the “half and half’ ratio, although the difference is not so large. This tendency of the accelerator grid current seems to be stem from the discharge voltage curve shown in Fig. 7 (b), because the discharge voltage has a minimum value at the same ratio. Accordingly, the discharge voltage is thought to have an slight effect on the beam convergence. Figure 7 (b) also shows that the ion production cost has a minimum value at the same ratio. These results were observed for all experiments.
From above results, it can be stated that the propellant feed method has considerable effects on the thruster performance. The mean free path of the neutral particles in the discharge chamber is no less than 10 cm in the experiments conducted in this study, and it is conjectured that the position of the propellant distributor and the initial velocity of the neutral particles have effects on its own distribution, therefore, the propellant flow rate ratio between the forward path and the reverse path also has
v,~lcoov
Var-500v
Chamber : L220
I
D
1
I
0
II
I
0 ny 24, = 2 I* SCCM
A MI,* 13.m,= 13 SCCM
0 rnf’ 2, 24 my= SCCM
Eool ’ I 1 I I I s 6 7 8 9 IO 11 12 13
Discharge Cumnl. /& A
(a) Beam Current vs. Discharge Current
34
m, = 29.5 SCCM
32 m, = 3.5 SCCM
- v,=lOOOv
> va P -500 v
f E 30 Chamber : L220 -
’ 9 ’ 26 0 24, 2 SCCM - m,= mr=
A m,= 13. 13 SCCM mr=
0 mf= 2, = 24 SCCh4 m, 24 1 I L 1
5 6 7 8 9 IO II 12 13
D&huge Current. I,+ A
(b) Discharge Voltage vs. Discharge Current
m, - 29.5 SCCM
mc s 3.5 SCCM
v*= ICOOV
v. = -500 v
Chamhu : L220
0 m,= 24. m, = 2 SCCM
A m = I3.m,= I3 SCCM J q mJ=2,m,=24SCCM
8
A
P
8 A e
0 0 A
0 *
40 SO 60 70 80 90 IO0
Pmpellml Utiliulion Effaciency. vu. %
(c) Ion Production Cost vs. Propellant Utilization Efficiency
Fig. 6 Effects of Propellant Flow Rate Ratio between Forward Path and Reverse Path
IEPC-97-092 582
- 2550 ‘b 53 0 0 0 0 0 0 0 0 0
51 2swJ 3
49 3
A A A A
m, = 39 SCCM
- mc=3SCCM
Vb’IGQOV
v,=-SOOV
c Id=13A
Chamber : L220
A A A - 47
A d - A 4s rJ
“e ‘ud - 43 CJ
5 -41 f
- 39 -s y
-I 37
2200 1 ’ a ’ ‘35 34 : 2 26 : IO 18 : 18 10 : 26 2:34
PropcIlmc Flow Rate Ratio (Forwad : Rcverxc). SCCM
(a) Beam Current and Acclerator Grid Current
t
vb= moov
> vu = -500 v
._y% 29.5
ldU13A
Q 2 ClulntKr : L220 0
9 0 0
A
A
0
A
- - ‘d
158 0 8
i’
?I 0 - 156 i;-
i A 0 8
A - 154 .I
A ci 4
A f
- 152 3
28.5 1 1 I I I
34:2 26: 10 18: I6 IO:26 2 : 34
Propellant Flow Rate Raio (Forwad : Reverse). SCCM
(b) Discharge Voltage and Ion Production Cost
Fig.7 Effects of Propellant Flow Rate Ratio (Against Forward Path to Reverse Path Ratio)
effects on the thruster performance. It would appear that the propellant was supplied effectively into the plasma production region by feeding the propellant via both the forward path and the reverse path simultaneously on the conditions we experimented. The theoretical approach to investigate these effects of propellant feed method has been conducted in our laboratory for the RF ion thruster’) discharge chamber, and same efforts will be performed for the electron bombardment thrusters, in addition to the plasma diagnostics approach.
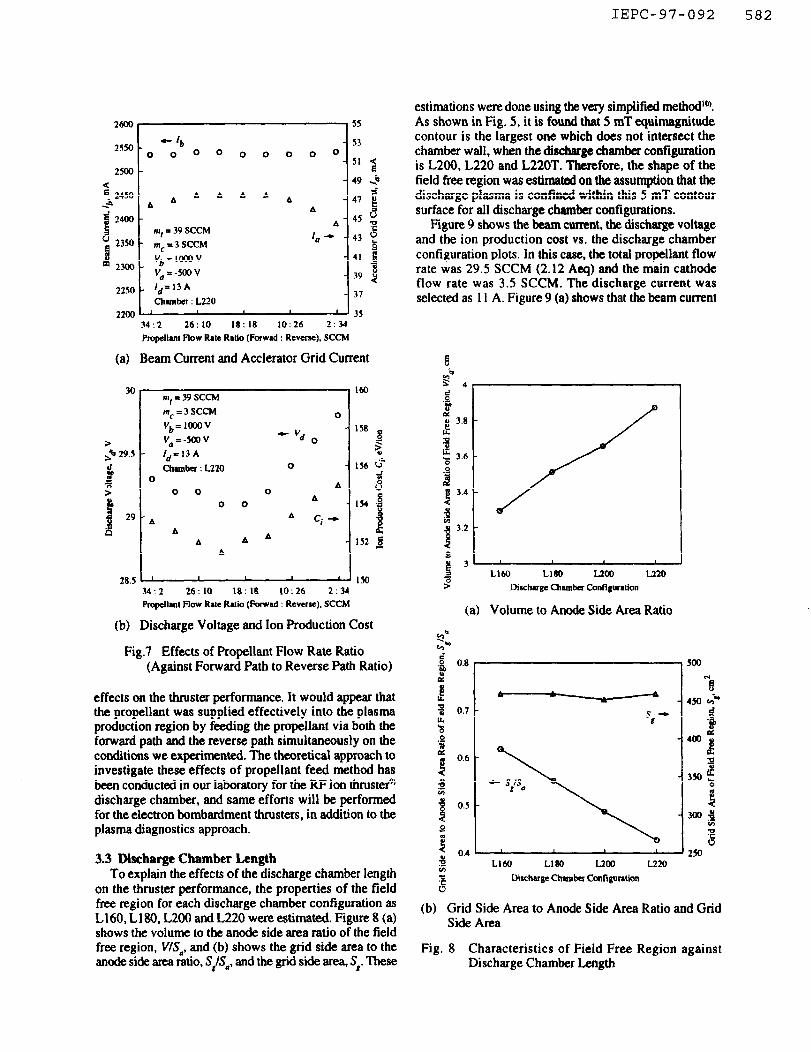
3.3 Discharge Chamber Length To explain the effects of the discharge chamber length
on the thruster performance, the properties of the field free region for each discharge chamber configuration as L160, L180, L200 and L220 were estimated. Figure 8 (a) shows the volume to the anode side area ratio of the field free region, V/Se, and (b) shows the grid side area to the anode side area ratio, S,/S*, and the grid side area, S,. These
estimations were done using the very simplified method*@. As shown in Fig. 5, it is found that 5 mT equimagnitude contour is the largest one which does not intersect the chamber wall, when the discharge chamber configuration is L200, L220 and L22OT. Therefore, the shape of the field free region was estimated on the assuqtion that the discharge plasma is confined within this 5 mT contour surface for all discharge chamber configurations.
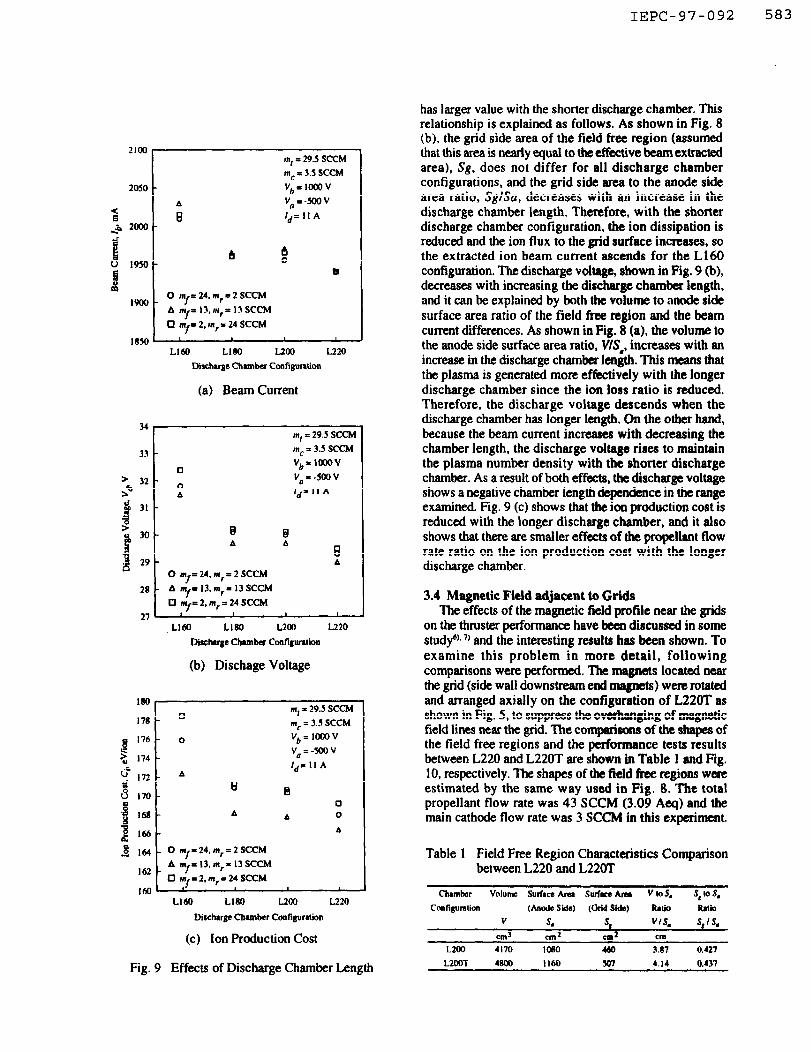
Figure 9 shows the beam current, the discharge voltage and the ion production cost vs. the discharge chamber configuration plots. In this case, the total propellant flow rate was 29.5 SCCM (2.12 Aeq) and the main cathode flow rate was 3.5 SCCM. The discharge current was selected as 11 A. Figure 9 (a) shows that the beam current
; 3- 3 L160 LlfJO L200 L220 8 Discharge chamber Configuration
(a) Volume to Anode Side Area Ratio
I I I ,
L160 L180 L200 L2m
Discharge Chamber Configuration
(b) Grid Side Area to Anode Side Area Ratio and Grid Side Area
Fig. 8 Characteristics of Field Free Region against Discharge Chamber Length
IEPC-97-092 583
2100 HI, = 29.5 SCCM
nlc I3.5 SCCM
2050 - v,=looov
A
2
v”~-5oov
B _,+a 2O@J -
ld= II A
I900 - 0 In,’ 24. In,= 2 SCCM
A M = I3.w,= 13SCCM J q In,’ 2, m, = 24 SCCM
Ll60 LIB0 LZOO L220
Discharge Chamber Configuration
(a) Beam Current
_
t
,“, = 29.5 SCCM
33 mc - 3.5 SCCM
0 Vbl IOOOV
> 32
s+ :
v,=.500v
Id= II A
(b) Dischage Voltage
g 176 -
2 174-
4 172 -
8 im-
j 168-
E 166 -
e
A
Vb’ looov
vu=-5oov
I,,= 11 A
B 0
A 0
A
Ll60 LIRO I.200 L220
Discharge Chamber Configuration
(c) Ion Production Cost
Fig. 9 Effects of Discharge Chamber Length
has larger value with the shorter discharge chamber. This relationship is explained as follows. As shown in Fig. 8 (b), the grid side area of the field free region (assumed that this area is nearly equal to the effective beam extracted area), Sg, does not differ for all discharge chamber configurations, and the grid side area to the anode side area ratio, SglSa, decreases with an increase in the discharge chamber length. Therefore, with the shorter discharge chamber configuration, the ion dissipation is reduced and the ion flux to the grid surface increases, so the extracted ion beam current ascends for the L160 configuration. The discharge voltage, shown in Fig. 9 (b), decreases with increasing the discharge chamber length, and it can be explained by both the volume to anode side surface area ratio of the field free region and the beam current differences. As shown in Fig. 8 (a), the volume to the anode side surface area ratio, V/Sa, increases with an increase in the discharge chamber length. This means that the plasma is generated mote effectively with the longer discharge chamber since the ion loss ratio is reduced. Therefore, the discharge voltage descends when the discharge chamber has longer length. On the other hand, because the beam current increases with decreasing the chamber length, the discharge voltage rises to maintain the plasma number density with the shorter discharge chamber. As a result of both effects, the discharge voltage shows a negative chamber length dependence in the range examined. Fig. 9 (c) shows that the ion production cost is reduced with the longer discharge chamber, and it also shows that there are smaller effects of the propellant flow rate ratio on the ion production cost with the longer discharge chamber.
3.4 Magnetic Field adjacent to Grids The effects of the magnetic field profile near the grids
on the thruster performance have been discussed in some study)- ‘1 and the interesting results has been shown. To examine this problem in more detail, following comparisons were performed. The magnets located near the grid (side wall downstream end magnets) were rotated and arranged axially on the configuration of L22OT as shown in Fig. 5, to suppress the overhanging of magnetic field lines near the grid. The comparisona of the shapes of the field free regions and the performance tests results between L220 and L22OT are shown in Table 1 and Fig. 10, respectively. The shapes of the field free regions were estimated by the same way used in Fig. 8. The total propellant flow rate was 43 SCCM (3.09 Aeq) and the main cathode flow rate was 3 SCCM in this experiment.
Table 1 Field Free Region Characteristics Comparison between L220 and L22tYT
Chrmkr Volume Surface Arca Surfwe Amr vtos. S, 10 S.
ConRpmlion (Anode Side) @id Side) RIliO lzrlio
V s, s, VtS, SC’S‘
cm’ cm2 cm2 cm
L200 4170 10110 460 3.87 0.427
LZOOT 4800 1160 xn 4.14 0.437

IEPC-97-092 584
.._I
‘“, = 43 SCCM A 0
2m _ wl,=20SCCM
,,,,=20 SCCM A
0 2m _ mc=3 SCCM
2 Vb’ 1ooov A 0
;o 24~ _ I’,=-6SOV 0 ; A
E d 2200 - 0
9 10 I1 12 13 14 I5 16 17
Direhuge Cumnl. ‘,,t A
(a) Beam Current vs. Discharge Current
30 m, = 43 SCCM
5’ 20 SCCM A 29 - “lr=20SCCM 0
> ,nc i 3 SCCM 2 A
d 28 V,=laooV 0 -
s” Va = -630 V
A E 0
27 .
26 .
A ’
0 A 0
: 0 L220 AL22OT
1-2 ~
9 10 II 12 13 14 15 16 17
Discharge Cumnl. f, A
(b) Discharge Voltage vs. Discharge Current
170 , tn, E 43 SCCM
HI,’ 20 SCCM 0 .8 m, * 20 scCh4
5
l6dJ -
mc = 3 SCCM 0 .L
u Vb’ IOOOV
tb rs
Va = -650 V 0 A
150 - 0 .; 0
j,,_ A”AoA A
A
3 0 L220 A L2207
130 I 1 1 1 I
40 50 60 70 no 90 loo
Pfopcllnnl Ulilization Efficiency. tl,,, *a
(c) Ion Production Cost vs. Propellant Utilization Efficiency
Fig. 10 Effects of Downstream End Magnet Direction
The beam current for L22OT configuration, illustrated in Fig. IO (a), shows rapid rises against the discharge current compared with the one for L220 configuration. This difference of the beam currents between L220 and L22oT is attributable to the difference of the grid side surface area of the field free region, Sg, as shown in Table 1. For instance, the grid side surface area for L220T rises by 10.2 % compared with one for L220, and the beam current increment between L22OT and L220 is 8.5 96 at the point of the discharge current of 15 A, so it can be said that these figures show good agreement with each other. This fact indicates that the overhanging of the magnetic field near the grids is suppressed, and the effective beam extracted area is enlarged by rotating the side wall downstream end magnets. In addition to the increase of the beam current, the expansion of the beam extracted area seems to have the favorable effect that the partial erosion of the screen grid is reduced since the uniformity of the beam current density distribution is improved. Fig. 10 (b) presents that the discharge voltage shows the rapid increase with an increase in the discharge current for L22OT than L220. This tendency seems to be caused by the large increase of the beam current for L22OT. Although the volume to the anode side area ratio of the field free region is larger for L22OT than L220, the total ion flux toward the anode and the grid is enlarged for L22OT because the beam current increase at the same time, so the discharge voltage ascends to keep up the plasma number density. To discuss these things in detail, there are needs to measure the ion current distribution in the discharge chamber. As a result of the trade-off between the beam current and the discharge voltage, the ion production cost is reduced considerably for L22OT as shown in Fig. 10 (c), therefore, it can be said that the thruster performance is improved by suppressing the overhanging of magnetic field lines near the grids.
3.5 Thruster Performance As a result of above discussions, it is suggested that
the thruster used in the present study has a better operating point with certain configuration as; (1) the propellant should be supplied via the forward path and the reverse path simultaneously, (2) the discharge chamber should have a longer length, and (3) the side wall downstream end magnets should be located axially. Table 2 shows the typical thruster performances with this configuration. It was obtained that the thrust of 153 mN, the specific impulse of 37 10 s and the ion production cost of 152 eV/ ion at the propellant utilization efficiency of 93.5 96 for the present time.

IEPC-97-092 585
Table 2 Typical Thruster Performance References
Forward Propellant Flow Rate
Reverse Propellant Flow Rate
Main Cathode Flow Rate
Discharge Chamber Configuration
Beam Voltage
Beam Cunent
Acclemtor Grid Voltage
Accelerator Grid Current
Discharge Voltage
Discharge Current
ThNSl
Specific Impulse
Ion Produaion Cost
Propellant utillzadon Efnciency
Thruster Efficiency
Total Power Consumpdon
Thrust to Power Ratio
“‘I “1,
“1,
v, f*
v, 1.
v,
c
T
ISP
ci 11.
rl,
W
TIP
20 SCCM
20 SCCM
3 SCCM
L22u-r
IOOOV
2.94 A
-65OV
55 mA
29.3 V
l5A
153 mN
3710 s
I52 eV/ion
93.5 ‘Ib
79.6 %
3.45 kW
44.3 mlVkW
The effects of the back pressure is not considered.
4. Conclusions
The experimental studies to evaluate the effects of the propellant feed method and the magnetic field configuration on the thruster performance were conducted by using the 30 cm cusped ion thruster, and the following conclusions were derived. 1. The discharge voltage and the ion production cost were
reduced by supplying the propellant via the forward path and the reverse path simultaneously.
’ The beam current increased with the shorter discharge chamber configuration, and the discharge voltage decreased with the longer discharge chamber configuration. They were explained by the relationship between the volume and the surface area of the field free region. The beam current increased, and the ion production cost was reduced by locating the side wall downstream end magnets axially, and it was attributed to the increase of the effective beam extracting area. The thrust of 153 mN, the specific impulse of 3710 s and the ion production cost of 152 eV/ion at the propellant utilization efficiency of 93.5 % were obtained as the nominal thruster performance.
Acknowledgment
We thank MELCO (Mitsubishi Electric Corp.) for help and advice to advance the present work.
1) Yoshida, H., Kawauchi, H., Takama. S., Maeda, T., Higuchi, T., Akai, K., Hayakawa, Y., Miyazaki, K., Kitamura, S. and Nagano, H., “Performance Characteristics of a 35-cm Diameter Xenon Ion Thruster,” AIAA-96-27 14, 32nd Joint Propulsion Conference, Orlando, FL, July 1996.
2) Aston, G. and Aston M. B., “50-cm Ion Engine Operation with Annular Ion Accelerator System,” AIAA- 95-3069, 3 1st Joint Propulsion Conference, San Diego, CA, July 1995.
3) Groh, Klaus H. and Loeb, Horst W., “Radio- Frequency Ion Thruster Activities at Gissen University,” 96-a-3-2 1, 20th International Symposium on Space Technology and Science, Gifu, Japan, May 1996.
4) Beattie, John R. and Willbur Paul J.. “Cusped Magnetic Field Mercury Ion Thruster,” Journal of Spacecraft and Rockets, Vol. 14, No. 12, December 1977, pp. 747-755.
5) Steiner, G., “Development of a Large Inert Gas Ion Thruster,” AIAA-82-1927, 16th International Electric Propulsion Conference, New Orleans, LA, November 1982.
6) Yoshida, H., Komuro, M., Sugawara, T., Takeshita, Y., Kawauchi, H., Miyazaki, D., Higuchi, T., Hayakawa, Y., Miyazaki, K., Kitamura, S. and Nakamura, Y., “Investigation on a 13-cm Xenon Cusp Ion Thruster,” AIAA-87-1030, 19th International Electric Propulsion Conference, Colorado Springs, CO, May 1987.
7) Sovey, J. S., “Improved Ion Containment Using a Ring-Cusp Ion Thruster,” Journal of Spacecraft and Rockets, Vol. 21, No. 5, September-October 1984, pp. 488-495.
8) Takegahara, H., Kasai, Y., Gotoh, Y ., Miyazaki, K., Hayakawa, Y., Kitamura., S., Nagano, H. and Nakamaru, K., “Beam Characteristics Evaluation of ETS-VI Xenon Ion Thruster,” IEPC-93-235,23rd International Electric Propulsion Conference, Seattk, WA, September 1993.
9) lwata, T. and Takegahara, H., “Effects of Discharge Chamber Configuration on RF Plasma Properties,” IEPC- 97- 142,25th International Electric Propulsion Conference, Cleveland, OH, August 1997.
10) Kitamura, S., Miyazaki, K., Hayakawa, Y., Takama, S., Akai, K. and Yoshida, H., “Perf ormance Characteristics of a 30 cm Diameter Xenon Ion Thruster,” AIAA-94-2850, 30th Joint Propulsion Conference, Indianapolis, IN, June 1994.