to my fellow stockholders, - · pdf fileto my fellow stockholders, ... or $2.11 per diluted...
TRANSCRIPT


To my fellow stockholders,Fiscal 2011 was an exciting and rewarding year for OmniVision as major tasks were accomplished andmany performance records were set.
Our key objectives in fiscal 2011 were threefold:
• Continue the successful ramp of our OmniBSI� devices,
• Continue the development and implementation of our OmniBSI-2� technology, and
• Capitalize on the growth and expansion opportunities presented by the image sensor marketswith our advanced proprietary technology.
We believe we have accomplished these goals, and are now resolved to maintain the momentum wehave achieved.
Fiscal Year Financial Results
In fiscal 2011, revenues reached $956.5 million, approaching the $1 billion mark for the first time inour company history. Our net income for fiscal 2011 was $124.5 million, or $2.11 per diluted share. Allof these financial metrics showed significant, if not record, improvement over fiscal 2010.
Our balance sheet further demonstrated our focus on financial performance and the company’s overallstrength in a competitive market. We ended the year with cash, cash equivalents and short-terminvestments of $466.9 million.
Technology Achievements
OmniVision takes great pride in its successful record of innovation. Specifically, our expertise inimplementing the OmniBSI technology has positioned OmniVision as a leading component supplier,providing image sensors to a wealth of products, including high-end smartphones, notebooks, webcams,portable multi-media devices and even commercial enterprise applications. Our portfolio of imagesensors now extends from VGA up to 14 megapixels, all meeting demanding performance standards. Itis this wide range of offerings, as well as the depth of our expertise, that enabled the company to shipmore than 680 million CMOS image sensors last year. This is a record which gives us considerablepride, and upon which we intend to build.
Our success has been validated by a leading research house, Techno Systems Research, Inc., whosereport indicates that OmniVision continues to remain the market leader in CMOS image sensor unitshipments, with a market share of 29 percent in calendar 2010.
While our OmniBSI technology established its leadership position in the market, we continued todevelop our second generation technology, OmniBSI-2, which is our first pixel architecture built on300 mm wafers using a copper process. The new process enables a number of substantial improvementsover OmniBSI technology’s already impressive performance, including improved pixel layout, betterisolation, and significantly reduced crosstalk. OmniBSI-2 technology also incorporates a more advancedpixel and provides us with added flexibility in next-generation sensor designs.
Expanding Markets
Industry analysts’ projections for a number of our target markets suggest that demand for CMOS-basedimaging solutions will triple or quadruple over the next few years. The common denominator amongthese markets is the demand for high-sensitivity image sensors that can capture high-quality images andvideos.
With our competitive lead in advanced image capturing technology, we were able to capitalize on theexponential demand growth in many of our target markets. Three markets in particular drove ourfinancial performance in fiscal 2011: the mobile phone market, the notebook market and theentertainment market. In the mobile phone market, we believe we have benefited from our significant

6AUG201018423149
share position in smartphones, which is a rapidly growing product category in the overall mobile phonemarket. Within the notebook market, we enjoyed an increase in penetration rate for image sensors,particularly as video conferencing becomes more prevalent in consumer as well as business applications.Lastly, the entertainment market has exhibited continuing strength due to customers’ demand for newproduct features that involve image capturing. Familiar products within the entertainment categoryinclude tablets, portable multimedia players, TV applications that feature gesture recognition, as well astelepresence.
Other Key Events
At OmniVision, we take great pride in our manufacturing, engineering and sales presence worldwide.Our global presence promotes closer working relationships with customers and suppliers alike. Tomaximize this advantage, in fiscal 2011, we expanded our functional resources across all areas ofexpertise including a substantial increase in research and development personnel at our new facilities inShanghai, China.
To further differentiate OmniVision at the R&D level, the company purchased approximately 850patents and applications from the Eastman Kodak Company. This acquisition nearly doubled the sizeof our CMOS image sensor patent portfolio. Our comprehensive image sensor IP portfolio gives us theability to further innovate and maintain our technology leadership.
Finally, in fiscal 2011, we welcomed back Hasan Gadjali to the position of Vice President of WorldwideMarketing and Business Development. In his previous role with OmniVision, Hasan led our businessunit that focused our efforts on many of the emerging markets where we are experiencing successtoday, such as entertainment and automotive.
In Closing
The image sensor markets present us with opportunities that are expanding each and every day. As anR&D company, we have the drive and passion to capitalize on these opportunities. We produce uniqueand high-performance image sensors that only the best engineering teams can develop. We willcontinue to work daily to translate our advanced technologies into product solutions that meet theneeds of our customers in all targeted market segments.
We appreciate the support we have received from our employees, our customers, our partners and ourstockholders over the past year. I believe the energy and innovative talent of our employees hasuniquely positioned OmniVision to continue to deliver on the promise of high-quality,high-performance products that our customers deserve, along with the shareholder value that ourstockholders expect.
Sincerely,
SHAW HONG
President and Chief Executive Officer

UNITED STATESSECURITIES AND EXCHANGE COMMISSION
Washington, D.C. 20549
FORM 10-K(Mark One)
� ANNUAL REPORT PURSUANT TO SECTION 13 OR 15(d) OF THE SECURITIESEXCHANGE ACT OF 1934
For the fiscal year ended April 30, 2011
� TRANSITION REPORT PURSUANT TO SECTION 13 OR 15(d) OF THE SECURITIESEXCHANGE ACT OF 1934
For the transition period from to
Commission file number: 0-29939
OMNIVISION TECHNOLOGIES, INC.(Exact name of registrant as specified in its charter)
Delaware 77-0401990(State or other jurisdiction (I.R.S. Employer
of incorporation or organization) Identification Number)
4275 Burton Drive, Santa Clara, California 95054(Address of principal executive offices) (Zip Code)
Registrant’s telephone number, including area code: (408) 567-3000
Securities registered pursuant to Section 12(b) of the Act:
Title of each class Name of each exchange on which registered
Common Stock, $0.001 par value The Nasdaq Stock Market LLC(Including associated Preferred Stock Purchase Rights) (Nasdaq Global Market)
Securities registered pursuant to Section 12(g) of the Act: None
Indicate by check mark if the registrant is a well-known seasoned issuer, as defined in Rule 405 of the Securities Act. Yes � No �
Indicate by check mark if the registrant is not required to file reports pursuant to Section 13 or Section 15(d) of the Act.Yes � No �
Indicate by check mark whether the registrant (1) has filed all reports required to be filed by Section 13 or 15(d) of the SecuritiesExchange Act of 1934 during the preceding 12 months (or for such shorter period that the Registrant was required to file such reports),and (2) has been subject to such filing requirements for the past 90 days. Yes � No �
Indicate by check mark whether the registrant has submitted electronically and posted on its corporate Web site, if any, everyInteractive Data File required to be submitted and posted pursuant to Rule 405 of Regulation S-T (§232.405 of this chapter) during thepreceding 12 months (or for such shorter period that the registrant was required to submit and post such files). Yes � No �
Indicate by check mark if disclosure of delinquent filers pursuant to Item 405 of Regulation S-K (§ 229.405 of this chapter) is notcontained herein, and will not be contained, to the best of the Registrant’s knowledge, in definitive proxy or information statementsincorporated by reference in Part III of this Form 10-K or any amendment to this Form 10-K. �
Indicate by check mark whether the registrant is a large accelerated filer, an accelerated filer, a non-accelerated filer, or a smallerreporting company. See the definitions of ‘‘large accelerated filer,’’ ‘‘accelerated filer’’ and ‘‘smaller reporting company’’ in Rule 12b-2 ofthe Exchange Act.
Large accelerated filer � Accelerated filer � Non-accelerated filer � Smaller reporting company �(Do not check if a
smaller reporting company)
Indicate by check mark whether the registrant is a shell company (as defined in Rule 12b-2 of the Exchange Act). Yes � No �
As of October 31, 2010, the last business day of Registrant’s most recently completed second fiscal quarter, there were 45,974,265shares of Registrant’s common stock outstanding, and the aggregate market value of such shares held by non-affiliates of registrant (basedupon the closing sale price of such shares on the NASDAQ Global Market on October 31, 2010) was approximately $1.2 billion. Shares ofRegistrant’s common stock held by the Registrant’s executive ‘officers and directors and by each entity that owns five percent or more ofRegistrant’s outstanding common stock have been excluded in that such persons may be deemed to be affiliates. This determination ofaffiliate status is not necessarily a conclusive determination for other purposes.
As of June 24, 2011, 58,590,572 shares of common stock of the Registrant were outstanding, exclusive of 12,541,000 shares of treasurystock.
DOCUMENTS INCORPORATED BY REFERENCE
The Registrant has incorporated by reference into Part III of this Annual Report on Form 10-K portions of its Proxy Statement forthe 2011 Annual Meeting of Stockholders.

OMNIVISION TECHNOLOGIES, INC.
INDEX TO
ANNUAL REPORT ON FORM 10-K
FOR YEAR ENDED APRIL 30, 2011
PART I . . . . . . . . . . . . . . . . . . . . . . . . . . . . . . . . . . . . . . . . . . . . . . . . . . . . . . . . . . . . . . . . . . 3
Item 1. Business . . . . . . . . . . . . . . . . . . . . . . . . . . . . . . . . . . . . . . . . . . . . . . . . . . . . . . . . 3Item 1A. Risk Factors . . . . . . . . . . . . . . . . . . . . . . . . . . . . . . . . . . . . . . . . . . . . . . . . . . . . . 18Item 1B. Unresolved Staff Comments . . . . . . . . . . . . . . . . . . . . . . . . . . . . . . . . . . . . . . . . . . 37Item 2. Properties . . . . . . . . . . . . . . . . . . . . . . . . . . . . . . . . . . . . . . . . . . . . . . . . . . . . . . . 37Item 3. Legal Proceedings . . . . . . . . . . . . . . . . . . . . . . . . . . . . . . . . . . . . . . . . . . . . . . . . . 38Item 4. Removed and Reserved . . . . . . . . . . . . . . . . . . . . . . . . . . . . . . . . . . . . . . . . . . . . . 40
PART II . . . . . . . . . . . . . . . . . . . . . . . . . . . . . . . . . . . . . . . . . . . . . . . . . . . . . . . . . . . . . . . . . 41
Item 5. Market for Registrant’s Common Equity, Related Stockholder Matters and IssuerPurchases of Equity Securities . . . . . . . . . . . . . . . . . . . . . . . . . . . . . . . . . . . . . . 41
Item 6. Selected Financial Data . . . . . . . . . . . . . . . . . . . . . . . . . . . . . . . . . . . . . . . . . . . . . 43Item 7. Management’s Discussion and Analysis of Financial Condition and Results of
Operations . . . . . . . . . . . . . . . . . . . . . . . . . . . . . . . . . . . . . . . . . . . . . . . . . . . . 45Item 7A. Quantitative and Qualitative Disclosures About Market Risk . . . . . . . . . . . . . . . . . . 68Item 8. Consolidated Financial Statements and Supplementary Data . . . . . . . . . . . . . . . . . . 70Item 9. Changes in and Disagreements with Accountants on Accounting and Financial
Disclosure . . . . . . . . . . . . . . . . . . . . . . . . . . . . . . . . . . . . . . . . . . . . . . . . . . . . . 118Item 9A. Controls and Procedures . . . . . . . . . . . . . . . . . . . . . . . . . . . . . . . . . . . . . . . . . . . . 119Item 9B. Other Information . . . . . . . . . . . . . . . . . . . . . . . . . . . . . . . . . . . . . . . . . . . . . . . . . 120
PART III . . . . . . . . . . . . . . . . . . . . . . . . . . . . . . . . . . . . . . . . . . . . . . . . . . . . . . . . . . . . . . . . . 121
Item 10. Directors, Executive Officers of the Registrant and Corporate Governance . . . . . . . . 121Item 11. Executive Compensation . . . . . . . . . . . . . . . . . . . . . . . . . . . . . . . . . . . . . . . . . . . . 121Item 12. Security Ownership of Certain Beneficial Owners and Management and Related
Stockholder Matters . . . . . . . . . . . . . . . . . . . . . . . . . . . . . . . . . . . . . . . . . . . . . . 121Item 13. Certain Relationships and Related Transactions and Director Independence . . . . . . . 121Item 14. Principal Accounting Fees and Services . . . . . . . . . . . . . . . . . . . . . . . . . . . . . . . . . 121
PART IV . . . . . . . . . . . . . . . . . . . . . . . . . . . . . . . . . . . . . . . . . . . . . . . . . . . . . . . . . . . . . . . . . 122
Item 15. Exhibits and Financial Statement Schedules . . . . . . . . . . . . . . . . . . . . . . . . . . . . . . 122
Signatures . . . . . . . . . . . . . . . . . . . . . . . . . . . . . . . . . . . . . . . . . . . . . . . . . . . . . . . . . . . . . . . . 127
2

PART I
ITEM 1. BUSINESS
The following information should be read in conjunction with our audited consolidated financialstatements and the notes thereto included in Item 8 of this Annual Report on Form 10-K. This AnnualReport on Form 10-K contains forward-looking statements, within the meaning of Section 27A of theSecurities Act of 1933 and Section 21E of the Securities Exchange Act of 1934, which involve risks anduncertainties. Forward-looking statements generally include words such as ‘‘anticipates,’’ ‘‘believes,’’‘‘expects,’’ ‘‘intends,’’ ‘‘may,’’ ‘‘outlook,’’ ‘‘plans,’’ ‘‘seeks,’’ ‘‘will’’ and words of similar import as well as thenegative of those terms. In addition, any statements that refer to expectations, projections or othercharacterizations of future events or circumstances, including any underlying assumptions, are forward-looking statements. All forward-looking statements included in this Annual Report on Form 10-K, including,but not limited to, statements regarding our projected results of operations for future reporting periods, theextent of future sales through original equipment manufacturers, or OEMs, and distributors, future growthtrends and opportunities in certain markets, the capabilities of new products, the increasing competition inour industry, the effect of supply constraints, the continued importance of the mobile phone market to ourbusiness, the continued concentration of manufacturers in the mobile phone market, continued pricecompetition and the consequent reduction in the average selling prices of our products, anticipated benefitsof our joint ventures and alliances, the ability of our new products to mitigate declines in our average sellingprices, the development of our business and manufacturing capacity, future expenses we expect to incur, ourfuture investments, our future working capital requirements, the effect of a change in market interest rates,the geographic distribution of our sales and end users of our products, the continued improvement ofgeneral global and domestic economic conditions and the sufficiency of our available cash, cash equivalentsand short-term investments are based on current expectations and are subject to important factors that couldcause actual results to differ materially from those projected in the forward-looking statements. Suchimportant factors include, but are not limited to, those set forth in Part I under the caption ‘‘Item 1A. RiskFactors,’’ beginning on page 18 of this Annual Report and elsewhere in this Annual Report and in otherdocuments we file with the U.S. Securities and Exchange Commission, or SEC. All subsequent written andoral forward-looking statements by or attributable to us or persons acting on our behalf are expresslyqualified in their entirety by such factors.
OmniVision, the OmniVision logo, OmniPixel and TrueFocus are registered trademarks of OmniVisionTechnologies, Inc., CameraChip, CameraCube, OmniBSI, OmniBSI-2, OmniPixel2, OmniPixel3,OmniPixel3-HS, OmniQSP and SquareGA are trademarks of OmniVision Technologies, Inc. WavefrontCoded is a registered trademark of OmniVision CDM Optics, Inc., a wholly-owned subsidiary ofOmniVision Technologies, Inc. Wavefront Coding is a trademark of OmniVision CDM Optics, Inc.
Corporate Information
OmniVision Technologies, Inc., a Delaware corporation, was incorporated in May 1995 inCalifornia, and reincorporated in Delaware in March 2000. Our executive offices are located at4275 Burton Drive, Santa Clara, California 95054 and our telephone number is (408) 567-3000. Copiesof our Annual Reports on Form 10-K, Quarterly Reports on Form 10-Q, Proxy Statement for ourannual stockholders’ meeting and Current Reports on Form 8-K, as well as any amendments to thesereports, are available through our website as soon as reasonably practicable after we electronically filesuch material with, or furnish it to, the SEC. Information about our company is available on theInternet at www.ovt.com. The information in, or that can be accessed through, our website is not partof this report.
3

Overview
We design, develop and market high-performance, highly integrated and cost-efficientsemiconductor image-sensor devices. Our main products, image-sensing devices which we refer to asCameraChip� image sensors, capture an image electronically and are used in a number of consumerand commercial mass-market applications. Our CameraChip image sensors are manufactured using thecomplementary metal oxide semiconductor, or CMOS, fabrication process and are predominantlysingle-chip solutions that integrate several distinct functions including image capture, image processing,color processing, signal conversion and output of a fully processed image or video stream. We have alsointegrated our CameraChip image sensors with wafer-level optics, which we refer to as CameraCube�imaging devices. Our CameraCube imaging device is a small footprint, total camera solution that webelieve will enable the further miniaturization of camera products. We believe that our highlyintegrated image sensors and imaging devices enable camera device manufacturers to build high qualitycamera products that are smaller, less complex, more reliable, more cost-effective and more power-efficient than cameras using traditional charge-coupled devices, or CCDs.
Current Economic Environment
We operate in a challenging economic environment that has undergone significant changes intechnology and in patterns of global trade. We remain a leader in the development and marketing ofimage sensing devices based on the CMOS fabrication process and have benefited from the growingmarket demand for and acceptance of this technology.
Beginning with the second half of our fiscal 2009, general domestic and global economic conditionswere negatively impacted by several factors. These economic conditions resulted in our facing one ofthe most challenging periods in our history.
During the latter part of fiscal 2010 and throughout fiscal 2011, we saw indications that suggestcertain major economies are returning to positive growth. Our quarterly sales improved in fiscal 2011,as compared to fiscal 2010 and fiscal 2009. We believe that demand for our products will continue toremain strong for fiscal 2012. However, it is uncertain whether the current resumption of economicgrowth will be sustained. If the economic recovery slows down or even dissipates, our business, financialcondition, results of operations and cash flows could be materially and adversely affected.
Market Environment
We sell our products worldwide directly to original equipment manufacturers, or OEMs, whichinclude branded customers and contract manufacturers, and value added resellers, or VARs, andindirectly through distributors. In order to ensure that we address all available markets for our imagesensors, we organize our marketing efforts into end-use market groups, each of which concentrates ona particular product or, in some cases, customer within a product group. Thus we have marketingteams that address the mobile phone market, the notebook and webcam market, the digital stillcamera, or DSC, market, the security and surveillance market, the entertainment market, and theautomotive and medical markets.
In the mobile phone market in particular, future revenues depend to a large extent on design winswhere, on the basis of an exhaustive evaluation of available products, a particular mobile phone makerdetermines which image sensor to design into one or more specific models. The time lag betweendesign win and volume shipments varies from as little as three months to as much as 12 months, whichcould cause an unexpected delay in generating revenues, especially during periods of producttransitions. Design wins are also an important driver in the many other markets that we address, and insome cases, such as automotive or medical applications, the time lag between a particular design winand revenue generation can be longer than one year.
4

The overwhelming majority of our sales depend on decisions by the engineering designers formanufacturers of products that incorporate image sensors to specify one of our products rather thanone made by a competitor. In most cases, the decision to specify a particular image sensor requiresconforming other specifications of the product to the chosen image sensor and makes subsequentchanges both difficult and expensive. Accordingly, the ability to timely produce and deliver reliableproducts in large quantities is a key competitive differentiator. Since our inception, we have shippedmore than 2.5 billion image sensors, including approximately 680 million in fiscal 2011. We believe thatthese quantities demonstrate the continuing capabilities of our production system, including our sourcesof offshore fabrication.
We outsource the wafer fabrication and packaging of our image-sensor products to third parties.We outsource the color filter and micro-lens phases of production to VisEra TechnologiesCompany, Ltd., or VisEra, our joint venture with Taiwan Semiconductor Manufacturing CompanyLimited, or TSMC. This approach allowed us to focus our resources on the design, development,marketing and testing of our products and to significantly reduce our capital requirements.
With our CameraCube products, we collaborate with the industry’s leading wafer-level lenssuppliers and outsource the assembly process to VisEra. We recently entered into an agreement withVisEra to acquire from VisEra its wafer-level lens production operations to enhance our CameraCubeproduction capabilities.
To increase and enhance our production capabilities, we work closely with TSMC, our principalwafer supplier and one of the largest wafer fabrication companies in the world, to increase, asnecessary, the number of its fabrication facilities at which our products can be produced. Ourinvestments in VisEra and three other key back-end packaging suppliers are part of a broad strategy toensure that we have sufficient back-end capacity for the processing of our image sensors in the variousformats required by our customers.
We currently perform the final testing of the majority of our products at our own facility in China.As necessary, we will make further investments to expand our testing and production capacity, as wellas our overall capability to design additional custom products for our customers.
Since our end-user customers market and sell their products worldwide, our revenues bygeographic location are not necessarily indicative of the geographic distribution of end-user sales, butrather indicate where the products and/or their components are manufactured or sourced. Therevenues we report by geography are based on the country or region in which our customers issue theirpurchase orders to us.
Many of the products using our image sensors, such as mobile phones, notebook and webcams,DSCs and cameras for entertainment applications, are consumer electronics goods. These mass-marketcamera devices generally have seasonal cycles which historically have caused the sales of our customersto fluctuate quarter-to-quarter. In addition, since a very large number of the manufacturers who useour products are located in China, Hong Kong and Taiwan, the pattern of demand for our imagesensors has been increasingly influenced by the timing of the extended lunar or Chinese New Yearholiday, a period in which the factories which use our image sensors generally close. Consequently,demand for our image sensors has historically been stronger in the second and third quarters of ourfiscal year and weaker in the first and fourth quarters of our fiscal year. However, due to the globaleconomic downturn, we experienced weaker than normal conditions in all of our markets in the thirdand fourth quarters of fiscal 2009. With the return to profitability in our business since the secondfiscal quarter of 2010, we believe the historical seasonal cycle to our business has returned.
We believe that the market opportunity represented by mobile phones remains very large, althoughthe opportunities presented could be deferred because of the uncertainty surrounding the sustainabilityof the current global economic recovery. We also believe that, like the DSC market, mobile phone,
5

notebook, tablet and webcam demand will not only continue to shift toward higher resolutions, but alsowill increasingly fragment into multiple market segments with differing product attributes. For example,we see the further expansion of the smartphone segment within the mobile phone market. In addition,there is increased demand for customization, and several different interface standards are coming tomaturity. All of these trends will require the development of an increasing variety of products.
As the markets for image sensors have grown, we have experienced competition frommanufacturers of CMOS and CCD image sensors. Our principal competitors in the market for CMOSimage sensors include Aptina Imaging, Samsung, Sharp, Sony, STMicroelectronics and Toshiba. Weexpect to see continued price competition in the image-sensor market for mobile phones, notebooksand webcams, security and surveillance systems, digital still and video cameras, entertainment devices,automotive and medical imaging systems as those markets continue to grow. Although we believe thatwe currently compete effectively in those markets, our competitive position could be impaired bycompanies that have greater financial, technical, marketing, manufacturing and distribution resources,broader product lines, better access to large customer bases, greater name recognition, longer operatinghistories and more established strategic and financial relationships than we do. Such companies may beable to adapt more quickly to new or emerging technologies and customer requirements or devotegreater resources to the promotion and sale of their products. Many of these competitors own andoperate their own fabrication facilities, which in certain circumstances may give them the ability toprice their products more aggressively than we can or may allow them to respond more rapidly than wecan to changing market opportunities.
In addition, from time to time, other companies enter the CMOS image-sensor market by usingobsolete and available manufacturing equipment. While these efforts have rarely had any long-termsuccess, the new entrants do sometimes manage to gain market share in the short-term by pricing theirproducts significantly below current market levels which puts additional downward pressure on theprices we can obtain for our products.
In common with many other semiconductor products and as a response to competitive pressures,the average selling prices, or ASPs, of image-sensor products have declined steadily since theirintroduction, and we expect ASPs to continue to decline in the future. Some of this ASP decline maybe offset by the adoption of some of our newer and higher resolution products. We introduced ourCameraCube products in February 2009. Depending on the adoption rate and unit volume, we believethese products may also mitigate the rate of ASP decline. In order to maintain our gross margins, weand our suppliers must work continuously to lower our manufacturing costs and increase ourproduction yields, and in order to maintain or grow our revenues, we need to increase the number ofunits we sell by a large enough amount to offset the effect of declining ASPs. In addition, if we areunable to timely introduce new products that can take advantage of smaller process geometries or newproducts that incorporate more advanced technology and include more advanced features that can besold at higher ASPs, our gross margin may decline.
Recently, the entire semiconductor industry, including us, has experienced supply constraints. Dueto the lack of availability of products, supply constraints have forced companies in the industry to beunable to meet the product demands of their customers and to take certain actions such as allocatingavailable products among their customers or, in some cases, increasing the prices of their products.This results in harm to customer relations, the loss of sales to customers and, in some cases, the loss offuture business with those customers. We have faced, and continue to face, these same challenges as weseek to meet our customers’ increasing demand for more of our products. Despite these challenges,through careful strategic planning relating to our products and the technologies that we deliver tomarket, we have been able to achieve revenue growth and unit growth. However, if our customers’demand remains at current levels or continues to increase, we will experience even greater challengesrelated to supply constraints and may be unable to achieve future growth, which could result in ourrevenues, gross margins and other financial results being materially and adversely affected.
6

Given the rapidly changing nature of our technology, there can be no assurance that we will notencounter delays or other unexpected yield issues with future products. During the early stages ofproduction, production yields and gross margins for new products are typically lower than those ofestablished products. We can encounter unexpected manufacturing issues, such as unexpected back-endyield problems. In addition, in preparation for new product introductions, we gradually decreaseproduction of established products. Due to our 12-14 week production cycle, it is extremely difficult topredict precisely how many units of established products we will need. It is also difficult to accuratelypredict the speed of the ramp of new products. Given the current economic uncertainty, the visibility ofour business outlook is extremely limited and forecasting is even more difficult than under normalmarket conditions. As a result, it is possible that we could suffer from shortages of certain products andbuild inventories in excess of demand for other products. We carefully consider the risk that ourinventories may be in excess of expected future demand and record appropriate reserves. If, assometimes happens, we are subsequently able to sell these reserved products, the sales have little or noassociated cost and consequently, they have a favorable impact on gross margins.
Technology
In February 2008, we announced the introduction of our OmniPixel3-HS� architecture. It is ourmost advanced generation of front side illumination, or FSI, OmniPixel� architecture. WithOmniPixel3-HS, light is captured on the front side of the chip, and it forms the basis of our 1.75 �mFSI imaging pixel.
In May 2008, we announced a new approach to CMOS image sensor design we call OmniBSI�technology. OmniBSI technology is based on an idea called back side illumination, or BSI. Our firstOmniBSI product, an 8-megapixel image sensor, is built using an advanced 1.4 �m imaging pixel. Webelieve we are the first image sensor company to announce a viable process for the mass production ofBSI sensors.
All traditionally designed CMOS image sensors capture light on the front side of the chip, so thephoto-sensitive portion has to share the surface of the image sensor with the metal wiring of thetransistors in the imaging pixel and the metal wiring acts to limit the amount of image light thatreaches the photo-sensitive portion of the image sensor. With our OmniBSI architecture, the imagesensor receives light through the back side of the chip. As a result, there is no metal wiring to blockthe image light, and the entire backside of the image sensor can be photo-sensitive. Not only does thisenable us to produce a superior image, it also permits the front of the chip surface area to be devotedentirely to processing, and permits an increase in the number of metal layers, both of which result ingreater functionality. Capturing light on the back side of the image sensor also allows us to reduce thedistance the light has to travel to the imaging pixels, and thus provide a wider angle of lightacceptance. Widening the angle of acceptance in turn makes it possible to reduce the height of thecamera module, and thus the height of the device which incorporates the camera.
In February 2009, we announced the introduction of our CameraCube technology. This is a three-dimensional, reflowable, total camera solution that combines the full functionality of our CameraChipimage sensors and wafer-level optics in one compact, small-footprint package. Our CameraCube devicescan be soldered directly to printed circuit boards, with no socket or insertion requirements. We believeour CameraCube solution can streamline the mobile phone manufacturing process, thus resulting inlower cost and faster time-to-market for our customers. Although currently our customers primarily useour Camera Cube devices as secondary cameras in mobile handsets, going forward we anticipate thatthey will be used as the primary camera in mobile handsets.
In February 2010, we announced the introduction of our new OmniBSI-2� architecture built onthe advanced 300 mm copper process at TSMC. The OmniBSI-2 architecture represents our second-generation BSI technology and enables us to design imaging pixels as small as 1.1 �m in dimension.
7

Product Design
Mixed Analog/Digital Circuit and CMOS Image Sensor Design
We have the in-house expertise to design complex analog and digital semiconductor circuits. Thisin-house expertise enables us to process video data in both analog and digital domains, which hasallowed us to optimize each aspect of analog and digital chip design. We have also developed in-houseexpertise in the mixing of analog and digital signals in the same semiconductor design without sufferingthe common problems of interference from noise caused by heat or cross-talk. Our in-housesemiconductor design engineers are skilled in the design of high speed, low power, and mixed analog/digital image sensors with advanced pixel cell structures. We use advanced design techniques to develophigh-speed, highly integrated semiconductors which can be fabricated using standard CMOS processes.The result has been a combination of improved image quality coupled with a reduction in unwantedelectrical noise.
Advanced Image Processing
We have developed a broad range of proprietary technologies for image processing. For example,our Wavefront Coding technology combines optics and electronics to increase the depth of field of animage without changing the aperture of or reducing the amount of light reaching the lens and caneliminate the need for a mechanical auto-focus system. Wavefront Coding technology changes the phaseof light as it traverses a specialized element in the lens and deliberately blurs all points in any image toan identical degree. Powerful algorithms then remove the system-dependent image blur to produce asharp and clear image from the intermediate coded image.
Integrated Camera Solutions
We have also developed significant in-house expertise in applied optical science with theproprietary technology to integrate our image sensors with wafer-level optics. We now offer totalcamera solutions that are tailored to our customers’ specific imaging requirements. We recently enteredinto an agreement with VisEra to acquire from VisEra its wafer-level lens production operations toenhance our CameraCube production capabilities.
Image Projection Technology
In March 2010, we acquired Aurora Systems, Inc., or Aurora, a privately-held companyincorporated in California. Aurora is a supplier of liquid crystal on silicon, or LCoS, devices for use inmobile projection applications and high definition home theater projection systems. With theacquisition of Aurora, we acquired advanced image projection technology to capitalize on trends in theemerging video-centric consumer market.
8

Products
Our main products, CameraChip image-sensing devices, are used to capture images electronicallyand are used in a number of consumer and commercial mass-market applications. Our image-sensorproducts have a variety of features, including:
Product Features
CMOS CameraChip image sensors . . Color or black and white
Illumination Technique . . . . . . . . . . . Front side illumination or back side illumination
Resolutions . . . . . . . . . . . . . . . . . . . CIF (352 � 288 pixels) to 14.6-megapixels (4,416 � 3,312pixels)
Output signal . . . . . . . . . . . . . . . . . . Analog and digital
Operating voltage . . . . . . . . . . . . . . . 5 volt to 1.2 volt
Optical lens/array size . . . . . . . . . . . . 1/18 to 1/2 inch formats
Companion chips . . . . . . . . . . . . . . . For connecting to computers and other devices
In addition, we design and develop another category of products which we refer to as CameraCubeimaging devices. They are image sensors with integrated wafer-level optics. We also supply companionchips used to connect our image sensors to various interfaces, including the universal serial bus, orUSB, a connection which allows add-on devices to be connected to notebook and webcams and otherindustry standard interfaces such as the Mobile Industry Processor Interface, or MIPI, and low-voltagedifferential signaling, or LVDS. In addition, we provide companion digital signal processors, or DSP,that perform compression in standardized still photo and digital video formats.
We also design and develop standard software drivers for Linux, Mac OSX and MicrosoftWindows, as well as for embedded operating systems such as Android, Blackberry OS, Palm OS,Symbian, Windows CE, Windows Embedded and Windows Mobile. These software drivers accept theimage data being received from the USB, provide data decompression, if required, and manageinterface protocols with the camera. We have designed these drivers for speed and flexibility and toallow easy customization of the user interface. We do not record any revenue from this software, whichwe provide to our customers as an element of customer support.
New Products
In May 2010, we introduced the OV2720, the world’s first 1/6-inch, native 1080p high definition, orHD, CMOS image sensor designed for notebook, netbook, webcam and video conferencingapplications. Based on OmniVision’s 1.4 �m OmniBSI technology, the new 1080p sensor capturesvideoconference quality HD video in a form factor that meets the module size and height requirementsof advanced thin notebook designs.
In June 2010, we announced the OV5640, a one-quarter inch 5-megapixel system-on-chip, or SOC,sensor built on our 1.4 �m OmniBSI technology. The device offers a cost-optimized, complete camerasolution with excellent imaging pixel performance for 5-megapixel photography and 720p or 1080p HDvideo for camera phones. The sensor’s embedded autofocus control with voice coil motor driver offersfurther cost savings to the end customer.
In June 2010, we also announced the high-speed OV7735 VGA sensor providing one of thethinnest VGA camera solutions available at less than 3-mm in height. The OV7735 is designed forportable applications, including digital video cameras, portable media players, as well as gaming devicesand webcams.
9

In August 2010, we introduced the OV7727, an advanced VGA sensor for the high-end ultra-thinnotebook market. The 1/13-inch OV7727 is the first VGA sensor built with our OmniBSI technology. Itcombines high performance and sensitivity with an ultra-compact form factor, enabling cameraintegration with sub-2 mm liquid crystal displays for next-generation notebooks, netbooks and tabletcomputers.
In August 2010, we also introduced the OV9740, a 1/6.5-inch SOC CMOS image sensor designedfor video applications in portable media players, home entertainment devices and notebooks. Becauseall image quality tuning and processing is done on-chip, the OV9740 enables customers to simplifyproduct development and accelerate time-to-market. The OV9740 combines our 1.75-�m OmniBSIimaging pixel architecture and our proprietary high-end image signal processor to deliver 720p nativeHD video.
In September 2010, we introduced two new SOC CMOS image sensors, the OV2643 and OV2659.Both sensors are designed to address the increased demand for 2-megapixel resolution cameras in themid- to low-end feature phone segment. The two new SOC sensors with advanced image signalprocessing offer quality and functionality comparable to many high-performance digital still cameras,including 720p native HD video at 30 frames per second, or FPS, excellent sensitivity and high qualityimage capture.
In November 2010, we introduced the OV8820, a 1/3.2-inch 8-megapixel raw CMOS image sensorbased on our 1.4-�m OmniBSI pixel architecture. The sensor delivers high frame rate 1080p/30 and720p/60 HD video with electronic image stabilization and full horizontal field of view designedspecifically to meet the demands of the smart phone markets. The OV8820 also offers advanced videocapabilities designed for video-centric camera phones.
Also in November 2010, we announced the initiation of mass production of the ultra-compact,high-performance OV6930. With a packaged footprint of only 1.8 � 1.8 mm, the OV6930 is designedfor applications favoring a small profile and is well suited to serve a broad range of medical endoscopyapplications.
In January 2011, we introduced the OV10810, a 10-megapixel CMOS image sensor built on ourhighly optimized 1.4-�m OmniBSI pixel architecture. The 1/2.5-inch OV10810 is designed to offercomplete convergence between high-resolution still photography and full HD video by combining10-megapixel burst photography at 30 FPS with full 1080p HD video in a native 16:9 aspect ratio. TheOV10810 is designed for digital still and video camera hybrids and high-end smart phones.
In February 2011, we introduced the OV3660, our first 3-megapixel CMOS image sensor based onour advanced 1.4-�m OmniBSI pixel architecture. The OV3660 extends our portfolio of BSI sensorsand offers high-performance imaging, including 720p HD video recording, in an ultra-compact 1/5-inchoptical format, designed for entry-level and mainstream smart phones. The OV3660 supports 720p HDvideo recording at 30 FPS with cropping and scaling, as well as 4:3 image capture for snapshots,allowing users to capture and share both video and still images.
In February 2011, we also introduced the OV8830, our most advanced 8-megapixel image sensor todate, and the first to use OmniVision’s second generation OmniBSI-2 pixel architecture. Implementingthe latest developments in BSI pixel technology, the OV8830 combines low power consumption, smalldie size and best-in-class pixel performance with advanced image processing features. This combinationallows the OV8830 to support enhanced, fast frame rate image capture and 1080p or 720p HD videorecording, making it highly suitable for feature rich smart phones. OmniBSI-2 technology is our firstpixel architecture built on 300 mm wafers using a copper process with 65 nm design rules which enablea number of improvements over OmniBSI technology’s performance, including improved pixel layout,better isolation, and reduced crosstalk.
10
In April 2011, we launched a 12.6-megapixel RAW CMOS image sensor for advanced mobileapplications. The new OV12825 offers high-resolution still photography and 1080p HD video at 60 FPSwith electronic image stabilization. These features make it an attractive solution for high-end featureand smart phone manufacturers. The new OV12825 is built on OmniVision’s proven 1.4-�m OmniBSI�pixel architecture.
Strategic Investments and Acquisitions
Joint Venture with TSMC
On October 29, 2003, we entered into an agreement with TSMC, to form VisEra, a joint venturein Taiwan, for the purposes of providing certain manufacturing and automated final testing servicesrelated to CMOS image sensors. In August 2005, under an amendment to the original 2003 joint-venture agreement, we and TSMC formed VisEra Holding Company, or VisEra Cayman, a companyincorporated in the Cayman Islands, and VisEra became a subsidiary of VisEra Cayman. We andTSMC have equal interests in VisEra Cayman.
Through April 2007, our contribution to VisEra and VisEra Cayman totaled approximately$51.6 million, effectively meeting our commitment under the terms of a January 2007 amendment tothe joint-venture agreement, in which we and TSMC have agreed to commit a total of $112.9 million tothe joint venture. We have not made any subsequent contributions into VisEra and VisEra Cayman.
We initially accounted for our investment in VisEra under the equity method. Between August 1,2005 and December 31, 2006, under the applicable authoritative accounting guidance for a variableinterest entity, or VIE, VisEra was considered a VIE, and we were the primary beneficiary.Accordingly, we consolidated VisEra’s operating results. On January 1, 2007, VisEra ceased to meet thedefinition of a VIE. Consequently, we deconsolidated VisEra on January 1, 2007, and since then haveaccounted for our investment in VisEra under the equity method. See Note 5—‘‘Long-TermInvestments’’ and Note 17—‘‘Related Party Transactions’’ to our consolidated financial statements.
Joint Venture with Powerchip Technology Corporation
In May 2004, we entered into an agreement with Powerchip Technology Corporation, or PTC,formerly Powerchip Semiconductor Corporation, a Taiwan based company that produces memory chipsand provides semiconductor foundry services, to establish Silicon Optronics, Inc., or SOI, a jointventure in Taiwan. We contributed approximately $2.1 million to SOI in exchange for an ownershippercentage of 49.0%. Between March 2005 and May 2010, we controlled the board of directors of SOIand we consolidated SOI during this period. The purpose of SOI was to manufacture, market and sellcertain of our legacy products. Toward the end of fiscal 2010, SOI began to ship niche products intoother markets, including touch panels that track touches with optical sensors and linear sensors. In thethree months ended January 31, 2011, we sold all of our interest in SOI. Our ownership percentage was43.7% at the time of sale. Consequently, as of April 30, 2011, we had no continuing investment in SOI.See Note 5—‘‘Long-Term Investments’’ and Note 17—‘‘Related Party Transactions’’ to our consolidatedfinancial statements.
Acquisition of Aurora
In March 2010, we acquired Aurora. Aurora designed, marketed and sold LCoS based microdisplaypanels. These microdisplay panels are used for projection applications in consumer electronics,industrial, aerospace and mobile viewing platforms. We believe there is an emerging trend for video-centric applications in the consumer market. The advanced image projection technology we acquiredthrough Aurora is intended to enable us to capitalize on this trend. Our closing consideration for theacquisition was approximately $5.6 million in cash. Of the $5.6 million purchase price, $0.5 million wasplaced in escrow at the time of the close and was released to the selling stockholders of Aurora during
11

the fourth quarter of fiscal 2011. There are no additional contingent considerations associated with thisacquisition.
Acquisition of Kodak Patents
In March 2011, we acquired certain image sensor-related patents and patent applications fromEastman Kodak Company, or Kodak, for cash consideration of $65.0 million. In connection with theacquisition, we granted to Kodak world-wide, non-exclusive royalty-free licenses, without the right tosublicense, to use the purchased patents to manufacture and sell current image-sensor products andother Kodak products incorporating image sensors. Of the purchase price, $5.5 million was retained byus at the closing of the acquisition and will be available until December 31, 2011 to satisfy anyindemnification claims we may be entitled to receive from Kodak under the terms of the acquisition. Inaddition, we initially retained $1.0 million of the purchase price in connection with efforts to record theownership of the purchased patents in our name with the United States Patent and Trademark Officeor international equivalents. We released this $1.0 million to Kodak in June 2011.
Industry Background
Image Sensor Technologies
Digital imaging enables the capture of still or moving images without the use of photographic orchemical-based films. The two most common electronic image sensors, both developed in the late1960s, are CCD and CMOS image sensors. Both image sensors are silicon-based semiconductor devicesthat convert light to an electric charge for display or storage.
CMOS image sensors are typically less expensive to produce and consume significantly less powerthan CCDs. When originally introduced, the quality of CMOS image sensors lagged behind that ofCCDs, but in recent years, advances in semiconductor manufacturing processes and design techniqueshave led to significant improvements in CMOS image sensor performance and image quality. Smallercircuits and better current control made it possible to design CMOS image sensors that provide imagequality comparable to that of CCDs of comparable resolution. As a result, CMOS image sensors arenow widely used in camera-equipped mobile phones, notebook and webcams, DSCs, security andsurveillance systems, entertainment applications, and increasingly in automotive and medicalapplications, all areas where high image quality, low power consumption, small size and low cost areimportant considerations.
Most current CMOS image sensors operate on FSI technology, in which the image sensor captureslight on the front side of the chip, so the photo-sensitive portion has to share the surface of the imagesensor with the metal wiring of the transistors in the pixel. In May 2008, we introduced a newarchitecture based on BSI technology in which, as its name implies, the image sensor captures light onthe back side of the chip. The advantages of BSI technology over conventional FSI technology arediscussed in more detail under the sub-heading ‘‘Technology’’ on page 6 above.
CMOS Image Sensors versus CCD Image Sensors
One of the critical differences between CCD and CMOS image sensors is the way in which eachprocesses an electrical charge, or a signal. Cameras employing CCDs require an additional integratedcircuit called an analog-to-digital converter to convert a signal from analog to digital format. Incontrast, image sensors based on the CMOS manufacturing process are able to integrate a number offunctions on one device, enabling all of the conversion circuitry to be incorporated in a single imagesensor chip. This high level of integration reduces the overall number of components and systemcomplexity, and reduces the space required for them.
12

Market Opportunity
Demand for CMOS image sensors for use in mobile phones continued to account for a substantialportion of our revenue in fiscal 2011. Other applications and markets that we are currently serving orthat are developing include embedded applications for notebook and webcams, security andsurveillance, entertainment applications, DSCs, and automotive and medical applications. As devicemanufacturers become increasingly aware of the numerous advantages associated with single chipCMOS image sensor solutions, such as high image quality, accelerated time to market, efficient designand manufacturability, smaller size, lower power consumption and reduced cost, we believe thesemarkets offer significant additional opportunities for mass-market applications for CMOS imagesensors.
Customers
We sell directly to OEMs and VARs and indirectly through distributors. OEMs include brandedcamera device manufacturers and contract manufacturers. During fiscal 2011, we shipped approximately680 million image sensors, an increase of 43.1% from approximately 475 million image sensors in fiscal2010.
In fiscal 2011, we derived approximately 75.3% of our revenues from sales to OEMs and VARsand approximately 24.7% of our revenues from sales through distributors. The one OEM customer thataccounted for 10% or more of our revenues in fiscal 2011 was LG Innotek Co., Ltd., which accountedfor approximately 17.6% of our revenues. The one distributor that accounted for 10% or more of ourrevenues in fiscal 2011 was World Peace Industrial Group, or World Peace, which accounted forapproximately 13.8% of our revenues. No other OEM, VAR or distributor accounted for 10.0% ormore of our fiscal 2011 revenues.
Sales and Marketing
We sell our products through a direct sales force and indirectly through distributors. As ofApril 30, 2011, our sales and marketing organization had a total of 185 full-time employees. We alsohad eleven independent distributors, nine of which are located outside the United States.
Sales outside of the United States represented approximately 93.3%, 99.4% and 98.3% of ourrevenues in fiscal 2009, 2010 and 2011, respectively. We expect that sales outside of the United Stateswill continue to account for a very large proportion of our revenues. We use distributors outside theUnited States principally to facilitate the logistics of the transactions in question and provide credit toend-user customers. These distributors also assume responsibility for collections, product returns andcustomer support. In addition to our standard product marketing, we also participate in tradeshows andother industry events to promote our image-sensor solutions.
Research and Development
We have designed the internal structure of our CMOS CameraChip and CameraCube imagesensors in a modular fashion. The major functions, such as image capture, image sensor control logic,color processing, analog output, digital output and programming control, are stand-alone circuits thatwe can rapidly modify for use in new product developments. We design circuit improvements so that wecan transfer them readily to other CameraChip image sensor products to help reduce totaldevelopment time and cost for new products. In fiscal 2009, we also introduced the CameraCubeimaging devices by integrating our image sensors with wafer-level optics. We developed our wafer-leveloptical technology with scalability and manufacturability in mind, enabling us to introduce a largerportfolio of CameraCube products in the future. As of April 30, 2011, we had a total of 477 full-timeemployees engaged in research and development.
13

Intellectual Property
Our success and future revenue growth will depend, in part, on our ability to protect ourintellectual property. We rely on a combination of patents, copyrights, trademarks and trade secrets, aswell as nondisclosure agreements and other methods, to protect various aspects of our CameraChip andCameraCube image sensors. As of April 30, 2011, we have been issued 401 United States patents whichexpire between May 2011 and June 2029. We have also received 430 foreign patents which expirebetween September 2011 and December 2027. As of April 30, 2011, we have 261 additional UnitedStates patent applications pending, of which 12 have been allowed, and we have 769 foreign patentapplications pending, of which seven have been allowed.
In March 2011, we acquired certain image sensor-related patents and patent applications fromKodak. We are currently in the process of recording the ownership of the purchased patents in ourname with the United States Patent and Trademark Office or international equivalents. These patentsand patent applications are included in the numbers reported in the paragraph above.
We have in the past been, currently are and may in the future be, subject to legal proceedings andclaims with respect to our intellectual property, including such matters as trade secrets, patents, productliabilities and other actions arising out of the normal course of business. These claims may increase asour intellectual property portfolio becomes larger or more valuable. Intellectual property claims againstus, and any resulting lawsuit, may cause us to incur significant expenses, subject us to liability fordamages and invalidate our proprietary rights. Any potential intellectual property litigation against uswould likely be time-consuming and expensive to resolve and would divert management’s time andattention.
Manufacturing
Wafer Fabrication
Our semiconductor products are fabricated using standard CMOS processes, which permit us toengage independent wafer foundries to manufacture our semiconductors. We outsource our wafermanufacturing for image sensors to TSMC and PTC. Our image sensor products are currentlyfabricated using standard line geometries processes at 65 nm, 0.11 �m, 0.13 �m, 0.18 �m and 0.25 �m.In addition, TSMC fabricates our companion DSP and interface chips.
Color Filter Application
The majority of our fiscal 2011 image sensor sales were color image sensors, which, in addition toa micro-lens, require a color filter to be applied to the wafer before packaging. The color filterapplication uses a series of masks to place red, green and blue dyes on the individual pixels in anindustry-standard Bayer pattern. In the final step, a micro lens is applied to each pixel. We outsourcethese manufacturing steps to VisEra.
Wafer Probe Testing
Wafers that are designated for chip-on-board, or COB, packaging are tested using a process calledwafer probe testing. We outsource wafer probe testing to King Yuan Electronics Co., Ltd. and TongHsing Electronic Industries, Ltd., or Tong Hsing, an investee company.
CameraCube Assembly
We introduced the CameraCube imaging devices near the end of fiscal 2009. To manufacture theCameraCube imaging devices, it is necessary for us to stack wafer-level optics onto our image sensors.We outsource this manufacturing procedure to VisEra. We recently entered into an agreement with
14

VisEra to acquire from VisEra its wafer-level lens production operations to enhance our CameraCubeproduction capabilities.
Packaging
In the case of chip scale packaged, or CSP, products, after wafer fabrication, color filterapplication, if required, and micro-lens application, the wafers are packaged and then diced into chips.With the exception of CSP products, the wafers are diced first and then packaged. We design ourproducts to use standard packaging that is widely used for optical image sensor chips. These packageshave a glass lid to allow light to pass through to the image sensor array. For a portion of our productlines, we rely on Lingsen Precision Industries Co., Ltd. and Tong Hsing for substantially all of ourceramic chip packaging. We rely on XinTec Inc., or XinTec, an investee company, for our CSPproducts, which are generally designed for the smallest form factor applications. In the case of COBpackaging, we rely on Tong Hsing to prepare good die for use in a delivery format referred to asreconstructed wafers. See Note 5—‘‘Long-Term Investments’’ to our consolidated financial statements fora further description of our relationships with XinTec and Tong Hsing.
Final Testing
High volume final product testing is a critical element in the production of our image sensors andCameraCube imaging devices. Having this capability is a substantial barrier to entry for potentialcompetitors. Production final testing instruments designed for conventional CMOS devices are notsufficient for testing image sensors, because an optical image must be captured and checked in additionto checking the standard logic and electrical functions.
We have installed and are currently expanding high-throughput automated final test equipmentbuilt to our specifications at our testing facility in Shanghai, China. The final test equipment haveautomated handling capability, a lighting and lens system, a changeable image source and automatedoutput sorting by functionality. The system is programmable so that testing criteria and methodologycan be changed easily to accommodate new products or special testing requirements.
Product Quality Assurance
We focus on product quality through all stages of the design and manufacturing process. Wesubmit all our designs to in-depth circuit simulation before we commit them to silicon. Before wecommit a new product to production, we fabricate test wafers, package test chips and test the finalproduct. We keep initial production runs to a minimum until sufficient products have completed theentire manufacturing and testing process and are delivered to and approved by customers. We committo full production runs after final customer approval.
We qualify each of our subcontractors through a series of industry standard environmental productstress tests, as well as through an audit and an analysis of the subcontractor’s quality system andmanufacturing capability. We also participate in quality and reliability monitoring through each stage ofthe production cycle by reviewing electrical parametric data from our foundries and othersubcontractors.
15

Competition
We operate in an industry characterized by intense competition, rapid technological changes,evolving industry standards, declining ASPs and rapid product obsolescence. Our competition comesboth from CMOS and CCD image sensor manufacturers:
• CMOS Image Sensor Manufacturers. Image sensor manufacturers using CMOS technologyinclude a number of well established companies such as Aptina Imaging, Samsung, Sharp, Sony,STMicroelectronics and Toshiba.
• CCD Image Sensor Manufacturers. Image sensor manufacturers using CCD technology include anumber of well-established companies, particularly vertically integrated camcorder andhigh-resolution DSC manufacturers. Our main competition from CCD manufacturers comesfrom Panasonic, Sharp and Sony.
Our competitors include many large domestic and international companies that have greaterpresence in key markets, greater access to advanced wafer foundry capacity, substantially greaterfinancial, technical, marketing, manufacturing, distribution and other resources, better access to largecustomer bases, greater name recognition, longer operating histories and more established strategic andfinancial relationships than we do. As a result, they may be able to adapt more quickly to new oremerging technologies and customer requirements or devote greater resources to the promotion andsale of their products.
We believe that the principal factors affecting our competition in our markets include relationshipswith key OEMs that incorporate image sensors into mass-market applications, relationships with keydistributors, relationships with semiconductor foundries and other participants in the semiconductormanufacturing chain, time to market, quality, total system design cost, product performance, customersupport and supplier reputation. We believe that we compete effectively with respect to these factors.
Backlog
Sales are generally made pursuant to standard purchase orders. Our backlog includes onlyaccepted customer orders with assigned shipment dates within the upcoming 12 months. As of April 30,2010 and 2011, our backlog was approximately $156.8 million and $259.5 million, respectively. Theincrease in our backlog reflects, in part, an increase in product demand. Our current backlog is subjectto cancellation or changes in delivery schedules, and may not necessarily be an indication of futurerevenue.
Employees
As of April 30, 2011, we had a total of 1,465 full-time employees, 388 located in the United States,and 1,077 in China, Finland, Germany, Japan, Singapore, South Korea, Taiwan, Sweden and the UnitedKingdom. Our future success will depend, in part, on our ability to continue to attract, retain andmotivate highly qualified technical and management personnel. None of our employees is representedby a collective bargaining agreement, and we have never experienced any material work stoppage. Webelieve that our employee relations are good.
Financial Information About Geographic Areas
For information about revenues and long-lived assets by geographic region/country, see Note 15—‘‘Segment and Geographic Information’’ in Part II, Item 8 of this Form 10-K and ‘‘Management’sDiscussion and Analysis of Financial Condition and Results of Operations’’ in Part II, Item 7 of thisForm 10-K.
16

Executive Officers of the Registrant
The following persons are our executive officers as of the filing date of this report:
Name Age Position
Shaw Hong . . . . . . . . . . . . . . . . . 73 Chief Executive Officer, President and DirectorAnson Chan . . . . . . . . . . . . . . . . . 42 Vice President of Finance and Chief Financial OfficerY. Vicky Chou . . . . . . . . . . . . . . . 48 Vice President of Global Management and General CounselRay Cisneros . . . . . . . . . . . . . . . . 48 Vice President of Worldwide SalesHasan Gadjali . . . . . . . . . . . . . . . 48 Vice President of Marketing and Business DevelopmentJohn Li . . . . . . . . . . . . . . . . . . . . 43 Vice President of System TechnologiesHenry Yang . . . . . . . . . . . . . . . . . 46 Vice President of Engineering and Director
Shaw Hong, one of our cofounders, has served as one of our directors and as our Chief ExecutiveOfficer and President since May 1995. Mr. Hong holds a B.S. degree in electrical engineering from JiaoTong University in China and an M.S. degree in electrical engineering from Oregon State University.
Anson Chan has served as our Vice President of Finance and Chief Financial Officer sinceOctober 2008 at which time he assumed the additional position of Chief Financial Officer. FromFebruary 2007 to present, Mr. Chan has served as our Vice President of Finance. From July 2006 toFebruary 2007, Mr. Chan served as our Vice President of Business Strategy. From September 1997 toJuly 2006, Mr. Chan served in various positions with PricewaterhouseCoopers, LLP, a public accountingfirm, most recently as a Senior Manager. Mr. Chan holds a B.S. degree in economics and a B.S. degreein engineering from the University of Pennsylvania and an M.B.A. degree in business strategy andoperations management from the University of Chicago. Mr. Chan is also a Certified PublicAccountant licensed in the State of California.
Y. Vicky Chou has served as our Vice President of Global Management and General Counsel sinceAugust 2009. From June 2003 to August 2009, Ms. Chou served as our Vice President of Legal andGeneral Counsel. From February 2003 to June 2003, Ms. Chou served as our Corporate Counsel. FromAugust 1999 to January 2003, Ms. Chou was an attorney at Heller Ehrman White & McAuliffe LLP.From June 1997 to July 1999, Ms. Chou was an attorney/corporate specialist at Coudert Brothers LLP.Ms. Chou received a B.S. degree in anthropology from Temple University, an M.B.A. degree fromSt. Joseph’s University and a J.D. degree from Santa Clara University.
Ray Cisneros has served as our Vice President of Worldwide Sales since August 2009. FromSeptember 2006 to August 2009, Mr. Cisneros served as our Vice President of Sales. From December2004 to September 2006, Mr. Cisneros served as our Director of Sales and Marketing for NorthAmerican Sales. Prior to December 2004, Mr. Cisneros held various sales positions since joining ourcompany in October 2002 including key account management, regional management and salesoperations roles. Prior to joining our company, Mr. Cisneros held various senior management positionsin the area of sales and marketing for companies in the fiber optics and semiconductor industries,including Sagitta, Inc., a provider of manufacturing equipment solutions for the fiber-optics industry,UMC, a semiconductor foundry, and Novellus Systems, Inc., a provider of manufacturing equipment forthe semiconductor industry. Mr. Cisneros holds a B.S. in Metallurgical Engineering from IllinoisInstitute of Technology and an M.B.A. from Golden Gate University.
Hasan Gadjali has served as our Vice President of Marketing and Business Development sinceApril 2011. From July 2007 to March 2011, Mr. Gadjali served as Vice President of Sales and BusinessDevelopment at 3DLabs Semiconductor, a subsidiary of Creative Technology Limited, an innovator andsupplier of 3D-graphics technology for PCs. Prior to joining 3DLabs Semiconductor, Mr. Gadjali wasemployed for six years by our company where he held various positions, including Vice President of theAdvanced Products Business Unit and Director of Marketing for Advanced Products. Prior to joiningour company, Mr. Gadjali held various senior design and technical positions at Winbond Electronics
17

Corporation, Chromatic Research, Inc., Creative Labs, Inc., a subsidiary of Creative TechnologyLimited, and Sharp Microelectronics, a subsidiary of Sharp Electronics Corporation. Mr. Gadjali holdsa B.S.E.E. degree from the University of California, San Diego and an M.S.E.E. degree with anemphasis on image and video coding technology from San Diego State University.
John Li has served as our Vice President of System Technologies since August 2009. FromNovember 2004 to August 2009, Mr. Li served as our Senior Director of Applications Engineering.Prior to November 2004, Mr. Li held various senior engineering positions subsequent to joining ourcompany in February 1997. Prior to joining our company, Mr. Li held various electrical engineeringpositions with companies in the semiconductor and electronics industries, including HuaKoElectronics Co. Ltd in Hong Kong, a manufacturer of semiconductor devices, and Fudan University inChina. Mr. Li specialized in electrical engineering while attending Fudan University.
Dr. Henry Yang has served as our Vice President of Engineering since February 2007. In addition,Dr. Yang has served as one of our directors since his appointment in February 2010. From February2003 to January 2007, Dr. Yang served as our Director of Engineering. Prior to February 2003,Dr. Yang held various engineering positions since joining our company in April 1996. Dr. Yang holdsB.E., M.E. and Ph.D. degrees in Electrical Engineering from the Tsinghua University in China.
ITEM 1A. RISK FACTORS
This Annual Report on Form 10-K, including Management’s Discussion and Analysis of FinancialCondition and Results of Operations, contains forward-looking statements. These forward-looking statementsare subject to substantial risks and uncertainties that could cause our future business, financial condition orresults of operations to differ materially from our historical results or currently anticipated results, includingthose set forth below.
Risks Related to Our Business
For the majority of our revenues, we depend on a few key customers and, the loss of one or more of our keycustomers, or their key end user customers, could significantly reduce our revenues.
A relatively small number of OEMs, VARs and distributors account for a significant portion of ourrevenues. These OEMs, VARs and distributors may rely upon one or more key end user customers fora significant portion of their revenue. Any material delay, cancellation or reduction of purchase ordersfrom one or more of our major customers or distributors, or their key end user customers, could resultin our failure to achieve anticipated revenue for a particular period. In addition, if we are unable toretain one or more of our largest OEM, VAR or distributor customers, if we are unable to maintainour current level of revenues from one or more of these significant customers, or if our OEM, VAR ordistributor customers are unable to retain one or more of their key end user customers, our businessand results of operation would be impaired and our stock price could decrease, potentially significantly.Such a delay, cancellation or reduction of purchase orders or our inability to retain a key customer orseveral of our smaller customers could be caused by, among other things, failure to meet ourcustomers’, including their key end user customers’, demand for our products. This has become evenmore challenging as our customers’, including their key end user customers’, demand has continued toincrease. In fiscal 2010 and 2011, approximately 60.0% and 55.0%, respectively, of our revenues camefrom sales to our top five customers. In addition, in fiscal 2011, one OEM customer accounted forapproximately 17.6% of our revenues, and one distributor customer accounted for approximately 13.8%of our revenues. Our business, financial condition, results of operations and cash flows will continue todepend significantly on our ability to retain our current key customers and to attract new customers, aswell as on the financial condition and success of our OEMs, VARs and distributors, including theirability to retain their key end user customers and attract new customers.
18

We face intense competition in our markets from CMOS and CCD image-sensor manufacturers, and if weare unable to compete successfully we may not be able to maintain or grow our business.
The image-sensor market is intensely competitive, and we expect competition in this industry tocontinue to increase. This competition has resulted in rapid technological change, evolving standards,reductions in product selling prices and rapid product obsolescence. If we are unable to successfullymeet these competitive challenges, we may be unable to maintain and grow our business. Any inabilityon our part to compete successfully would also adversely affect our results of operations and impair ourfinancial condition.
Our image-sensor products face competition from other companies that sell CMOS image sensorsand from companies that sell CCD image sensors. Many of our competitors have longer operatinghistories, greater presence in key markets, greater name recognition, larger customer bases, moreestablished strategic and financial relationships and significantly greater financial, sales and marketing,distribution, technical and other resources than we do. Many of them also have their ownmanufacturing facilities, which may give them a competitive advantage. As a result, they may be able toadapt more quickly to new or emerging technologies and customer requirements or devote greaterresources to the promotion and sale of their products. Our competitors include established CMOSimage-sensor manufacturers such as Aptina Imaging, Samsung, Sharp, Sony, STMicroelectronics andToshiba as well as CCD image-sensor manufacturers such as Panasonic, Sharp and Sony. Many of thesecompetitors own and operate their own fabrication facilities, which in certain circumstances may givethem the ability to price their products more aggressively than we can, respond more rapidly than wecan to changing market opportunities or more easily meet increased demands for their products. Inaddition, we compete with a large number of smaller CMOS manufacturers that has required, and inthe future may require, us to reduce our prices. For instance, we have seen increased competition inthe markets for VGA image-sensor products with resulting pressures on product pricing. Downwardpressure on pricing could result both in decreased revenues and lower gross margins, which wouldadversely affect our profitability. From time to time, other companies enter the CMOS image-sensormarket by using obsolete and available manufacturing equipment. These new entrants gain marketshare in the short term by pricing their products significantly below current market levels, which putsadditional downward pressure on the prices we can obtain for our products.
Our competitors may acquire or enter into strategic or commercial agreements or arrangementswith foundries or providers of color filter processing, assembly or packaging services. These strategicarrangements between our competitors and third party service providers could involve preferential orexclusive arrangements for our competitors. Such strategic alliances could impair our ability to securesufficient capacity from foundries and service providers to meet our demand for wafer manufacturing,color filter processing, assembly or packaging services, adversely affecting our ability to meet customerdemand for our products. In addition, competitors may enter into exclusive relationships withdistributors, which could reduce available distribution channels for our products and impair our abilityto sell our products and grow our business. Further, some of our customers could also becomedevelopers of image sensors, and this could potentially adversely affect our results of operations,business and prospects.
Reductions in our average selling prices may lower our revenues and, as a result, may reduce our grossmargins.
We have experienced and expect to continue to experience pressure to reduce the selling prices ofour products, and our ASPs have declined as a result. Competition in our product markets is intenseand as this competition continues to intensify, we anticipate that these pricing pressures will increase.We expect that the ASPs for many of our products will continue to decline over time. Unless we canincrease unit sales sufficiently to offset these declines in our ASPs, our revenues will decline.Reductions in our ASPs have adversely affected our gross margins, and unless we can reduce
19

manufacturing costs to compensate, additional reductions in our ASPs will continue to adversely affectour gross margins and could materially and adversely affect our operating results and impair ourfinancial condition. Although we may decrease our research, development and related expenses in theshort-term from time-to-time, historically we have increased and are likely to continue to increase ourresearch, development and related expenses in the long-term to continue the development of newimage-sensor products that can be sold at higher selling prices and/or manufactured at lower cost. If weare unable to timely introduce new products that incorporate more advanced technology and includemore advanced features that can be sold at higher ASPs, or if we are unable to successfully developmore cost-effective technologies, our financial results could be adversely affected.
Sales of our image-sensor products for mobile phones, including smart phones, account for a large portionof our revenues, and any decline in sales to the mobile phone market or failure of this market and otheremerging markets to continue to grow as expected could adversely affect our results of operations.
Sales to the mobile phone market, including smart phones, account for a large portion of ourrevenues. Although we can only estimate the percentages of our products that are used in the mobilephone market due to the significant number of our image-sensor products that are sold to modulemakers or through distributors and VARs, we believe that the mobile phone market accounted forapproximately 60% and 65% of our revenues in fiscal 2010 and 2011, respectively. We expect thatrevenues from sales of our image-sensor products to the mobile phone market will continue to accountfor a significant portion of our revenues during the remainder of fiscal 2012 and beyond. Any factorsadversely affecting the demand for our image sensors in this market could cause our business to sufferand adversely affect our financial condition, operating results and cash flows. The digital image-sensormarket for mobile phones is extremely competitive, and we expect to face increased competition in thismarket in the future. In addition, we continue to believe the market for mobile phones is also relativelyconcentrated and the top five producers account for approximately 75% of the annual sales of theseproducts. If we do not continue to achieve design wins with key mobile phone manufacturers, ourmarket share or revenues could decrease. The mobile phone image-sensor market is also subject torapid technological change. In order to compete successfully in this market, we will have to correctlyforecast customer demand for technological improvements and be able to deliver such products on atimely basis at competitive prices. If we fail to do this, our results of operations, business and prospectswould be materially and adversely affected. In the past, we have experienced problems accuratelyforecasting customer demand in other markets. In addition, current domestic and global economicconditions could negatively affect the mobile phone market if consumers and/or businesses deferpurchases in this market in response to tighter credit, negative financial news, and/or decreasedcorporate or consumer spending.
We also expect that image sensors will become of greater importance in the notebook andwebcam, entertainment, security, medical and automotive industries. As image sensors begin to fill agreater role in these other markets, the challenges and risks that we face in these other markets couldincrease and could be similar to some of the challenges and risks that we face in the mobile phonemarket. If our sales to the mobile phone market and other emerging markets do not increase and/orthe mobile phone market and other emerging markets do not grow as expected, our results ofoperations, business and prospects would be materially adversely affected.
Our future success depends on the timely development, introduction, marketing and selling of new products,which we might not be able to achieve.
Our failure to successfully develop new products that achieve market acceptance in a timelyfashion could adversely affect our ability to grow our business and improve our operating results. Thedevelopment, introduction and market acceptance of new products is critical to our ability to sustainand grow our business. Any failure to successfully develop, introduce, market and sell new products
20
could materially adversely affect our business and operating results. The development of new productsis highly complex, and we have in the past experienced delays in completing the development andintroduction of new products. From time to time, we have also encountered unexpected manufacturingproblems as we increase the production of new products. Consumers continue to expect thesophistication of image sensors in consumer products to increase, and the number of consumerproducts that use image sensors has continued to grow. This results in a requirement for us to continueto build and develop image sensors with advanced technologies that can be used in a variety ofconsumer products. As our products integrate new and more advanced technologies and functions, theybecome more complex and increasingly difficult to design, debug and produce. Successful productdevelopment and introduction depends on a number of factors, including:
• accurate prediction of market requirements and evolving standards, including imaging pixelresolution, output interface standards, power requirements, optical lens size, input standards andoperating systems for webcams and other platforms;
• development of advanced technologies and capabilities, including our CameraCube, OmniBSIand new OmniBSI-2 technologies;
• definition, timely completion and introduction of new CMOS image sensors that satisfy customerrequirements;
• development of products that maintain a technological advantage over the products of ourcompetitors, including our advantages with respect to the functionality and imaging pixelcapability of our image-sensor products and our proprietary testing processes; and
• market acceptance of the new products.
Accomplishing all of these steps is difficult, time consuming and expensive. We may be unable todevelop new products or product enhancements in time to capture market opportunities or achievesignificant or sustainable acceptance in new and existing markets. In addition, our products couldbecome obsolete sooner than anticipated because of a rapid change in one or more of the technologiesrelated to our products or the reduced life cycles of consumer products.
Design wins are a key determinant of future revenues, and failure to obtain design wins adversely affectsour revenues and impairs our ability to grow our business.
Our success has been, and will continue to be, dependent upon manufacturers designing ourimage-sensor products into their products. To achieve design wins, which are decisions bymanufacturers to design our products into their systems, we must define and deliver cost effective andinnovative image-sensor solutions on a timely basis that satisfy the manufacturers’ requirements. Ourability to achieve design wins is subject to numerous risks including competitive pressures as well astechnological risks. If we do not achieve a design win with a prospective customer, it may be difficult tosell our image-sensor products to such prospective customer in the future because once a manufacturerhas designed a supplier’s products into its systems, the manufacturer may be reluctant to change itssource of components due to the significant costs, time, effort and risk associated with qualifying a newsupplier and modifying its design platforms. Accordingly, if we fail to achieve design wins with keydevice manufacturers that embed image sensors in their products, our market share or revenues coulddecrease. Furthermore, to the extent that our competitors secure design wins, our ability to grow ourbusiness in the future will be impaired.
We depend on a limited number of third party wafer foundries, which reduces our ability to control ourmanufacturing process.
Unlike some of our larger competitors, we do not own or operate a semiconductor fabricationfacility. Instead, we rely on TSMC, PTC and other subcontract foundries to produce all of our wafers.
21

Historically, we have relied on TSMC to provide us with a substantial majority of our wafers. As a partof our joint venture agreement with TSMC, TSMC has agreed to commit substantial wafermanufacturing capacity to us in exchange for our commitment to purchase a substantial portion of ourwafers from TSMC, subject to pricing and technology requirements.
In addition, we have entered into a foundry manufacturing agreement with PTC pursuant to whichwe and PTC have agreed to jointly develop certain imaging pixel-related process technology and forPTC to process certain of our CMOS image sensors at PTC’s facilities in accordance with thescheduled development approved by both parties.
Under the terms of these supply agreements, we secure manufacturing capacity in any particularperiod on a purchase order basis. The foundries have no obligation to supply products to us for anyspecific period, in any specific quantity or at any specific price, except as set forth in a particularpurchase order. In general, our reliance on third party foundries involves a number of significant risks,including:
• reduced control over delivery schedules, quality assurance, manufacturing yields and productioncosts;
• lack of guaranteed production capacity or product supply;
• unavailability of, or delayed access to, next generation or key process technologies; and
• financial difficulties or disruptions in the operations of third party foundries due to causesbeyond our control.
If our unit sales continue to increase during the remainder of fiscal 2012 as they did in fiscal 2011,the size of the orders we place with our foundries will increase as well. Because our foundries provideservices to a number of companies, in the event they receive increased orders from us or one or moreof the other companies that they service, they may be unable to provide us with the requested quantityof products, may subordinate our request to the requests of other larger companies or may increase theprices they charge us. Recently, the entire semiconductor industry, including us, has experienced supplyconstraints. Due to the lack of availability of products, supply constraints have forced companies in theindustry to be unable to meet customers’ product demands and to take certain actions such asallocating available products among their customers or, in some cases, increasing the prices of theirproducts. These actions result in harm to customer relations, the loss of sales to customers and, insome cases, the loss of future business with those customers. We have faced, and continue to face,these same challenges as we seek to meet our customers’ increasing demand for more of our products.If our customers’ demand remains at current levels or continues to increase or if for any reason ourfoundries are unable to provide a sufficient number of products to us on a timely basis and atacceptable yields and cost, we will experience even greater challenges related to supply constraints andmay be unable to achieve future growth, which could result in our revenues, gross margins and otherfinancial results being materially and adversely affected.
The current global economic conditions could materially affect our foundries and cause them to beunable to provide necessary services to us. If TSMC, PTC, or any of our other foundries were unableto continue manufacturing our wafers in the required quantities, at acceptable quality, yields and costs,or in a timely manner, we would have to identify and qualify substitute foundries, which would be timeconsuming and difficult, and could increase our costs or result in unforeseen manufacturing problems.In addition, if competition for foundry capacity increases we may be required to pay increased amountsfor manufacturing services. We are also exposed to additional risks if we transfer our production ofsemiconductors from one foundry to another, as such transfer could interrupt our manufacturingprocess. Further, some of our foundries may also develop their own image-sensor products and if oneor more of our other foundries were to decide not to fabricate our companion DSP chips forcompetitive or other reasons, we would have to identify and qualify other sources for these products.
22

We rely on a joint venture company for color filter application and on third party service providers forpackaging and other back-end services, which reduces our control over delivery schedules, product qualityand cost, and could adversely affect our ability to deliver products to customers.
We rely on VisEra for the color filter application of our completed wafers and the assembly of ourCameraCube imaging devices. In addition, we rely on Advanced Semiconductor Engineering, Inc. andon ImPac Technology Co., Ltd., or ImPac, our former equity investee, for substantially all of ourceramic chip packages. In December 2009, Tong Hsing acquired ImPac and assumed control of itsoperations. We rely on XinTec, an investee company, for chip scale packages, which are generally usedin our products designed for the smallest form factor applications. We rely on several specializedservice providers, one of which is Tong Hsing, to perform the necessary wafer probe tests and preparegood die for use in chip-on-board packaging, a delivery format referred to as reconstructed wafer. Ifthe current global economic conditions do not continue to improve or remain stable, these serviceproviders’ ability to continue to fulfill our packaging, color filter processing and related requirementscould be adversely affected. If for any reason one or more of these service providers were to becomeunable or unwilling to continue to provide services of acceptable quality, at acceptable costs or in atimely manner, our ability to deliver our products to our customers could be severely impaired. Wewould have to identify and qualify substitute service providers, which could be time consuming anddifficult and could result in unforeseen operational problems. Substitute service providers might not beavailable or, if available, might be unwilling or unable to offer services on acceptable terms.
In addition, if competition for color filter application, packaging, capacity or other back-endservices increases, we may be required to pay or invest significant amounts to secure access to theseservices, which could adversely impact our operating results. The number of companies that providethese services is limited and some of them have limited operating histories and financial resources. Inthe event our current providers refuse or are unable to continue to provide these services to us, wemay be unable to procure services from alternate service providers. Furthermore, if customer demandfor our products increases, we may be unable to secure sufficient additional capacity from our currentservice providers on commercially reasonable terms, if at all. These factors may cause unforeseenproduct shortages or may increase our costs of manufacturing, assembling or testing of our products,which would adversely affect our operating results and cash flows.
If we do not forecast customer demand correctly, our business could be impaired and our stock price maydecline.
Our sales are generally made on the basis of purchase orders rather than long-term purchasecommitments; however, we manufacture products and build inventory based on our estimates ofcustomer demand. Accordingly, we must rely on multiple assumptions to forecast customer demand. Inaddition, external factors that are outside of our control can make it difficult to accurately make suchforecasts. For example, the domestic and global economic conditions that existed during fiscal 2009 andfiscal 2010 made it extremely challenging to accurately predict customer demand because demanddemonstrated increased volatility. Although customer demand for our products steadily increasedduring fiscal 2011, there is no guarantee that such demand will continue to increase or remain atcurrent levels. If customer demand continues to be volatile, historical models for predicting customerdemand may no longer be reliable. If we overestimate customer demand, we may manufacture productsthat we may be unable to sell, or we may have to sell at lower prices. This could materially andadversely affect our results of operations and financial condition. In addition, our customers may cancelor defer orders at any time by mutual written consent. We have experienced problems with accuratelyforecasting customer demand in the past. For example, there was a significant decline in productdemand in the third quarter of fiscal 2009, and as a result our inventories at the end of the thirdquarter of fiscal 2009 were higher than we intended them to be. We need to accurately predictcustomer demand because we must often place noncancelable orders with our manufacturers to have
23

products manufactured before we receive firm purchase orders from our customers. Conversely, if weunderestimate customer demand, we may be unable to manufacture sufficient products quickly enoughto meet actual demand, which could damage our reputation, impair our relationships with ourcustomers, cause us to lose one or more customers and impair our ability to grow our business. Inpreparation for new product introductions, we gradually ramp down production of established products.With our 12-14 week production cycle, it is extremely difficult to predict precisely how many units ofestablished products we will need. It is also difficult to accurately predict the speed of the ramp of ournew products and the impact on inventory levels presented by the shorter life cycles of end-userproducts. The shorter product life cycle is a result of an increase in competition and the growth ofvarious consumer-product applications for image sensors. Under these circumstances, it is possible thatwe could suffer from shortages of certain products and, if we underestimate market demand, we facethe risk of being unable to fulfill customer orders. We also face the risk of excess inventory andproduct obsolescence if we overestimate market demand for our products and build inventories inexcess of demand. Our ability to accurately forecast sales is also a critical factor in our ability to meetanalyst expectations for our quarterly and annual operating results. Any failure to meet theseexpectations would likely lead to a substantial decline in our stock price.
Fluctuations in our quarterly operating results have caused volatility in the market price of our commonstock and also make it difficult to predict our future operating results.
Our quarterly operating results have varied significantly from quarter to quarter in the past andare likely to vary significantly in the future based on a number of factors, many of which are beyondour control. These factors and other industry risks, many of which are more fully discussed in our otherrisk factors, include, but are not limited to:
• adverse changes in domestic or global economic conditions, including the current economiccrisis;
• the volume and mix of our product sales;
• competitive pricing pressures;
• our ability to accurately forecast demand for our products;
• our ability to achieve acceptable wafer manufacturing or back-end processing yields;
• our gain or loss of a large customer;
• our ability to manage our product transitions;
• the availability of production capacity at the suppliers that manufacture our products or processour products;
• the growth of the market for products and applications using CMOS image sensors;
• the timing and size of orders from our customers;
• the volume of our product returns;
• the seasonal nature of customer demand for our products;
• the deferral of customer orders in anticipation of new products, product designs orenhancements;
• the announcement and introduction of products and technologies by our competitors;
• the fair value of our interest rate swaps;
• the impairment of our intangible assets or other long-lived assets;
24

• the level of our operating expenses; and
• fluctuations in our effective tax rate from quarter to quarter.
Our introduction of new products and our product mix have affected, and may continue to affect,our quarterly operating results. Changes in our product mix could adversely affect our operating results,because some products provide higher margins than others. We typically experience lower yields whenmanufacturing new products through the initial production phase, and consequently our gross marginson new products have historically been lower than our gross margins on our more established products.We also anticipate that the rate of orders from our customers may vary significantly from quarter toquarter. Our operating expenses are relatively fixed in the short-term, and our inventory levels arebased on our expectations of future revenues. Consequently, if we do not achieve the revenues weexpect in any quarter, expenses and inventory levels could be disproportionately high, adverselyimpacting our operating results and cash flows for that quarter, and potentially in future quarters.
All of these factors are difficult to forecast and could result in fluctuations in our quarterlyoperating results. Our operating results in a given quarter could be substantially less than anticipated,and, if we fail to meet market analysts’ expectations, a substantial decline in our stock price couldresult. Fluctuations in our quarterly operating results could adversely affect the price of our commonstock in a manner unrelated to our long-term operating performance.
Our use of derivative financial instruments to reduce interest rate risk may result in added volatility in ourquarterly operating results
We do not hold or issue derivative financial instruments for trading purposes. However, we doutilize derivative financial instruments to reduce interest rate risk. We have a variable rate mortgageand term loans that totaled $29.3 million as of April 30, 2011. To manage the related interest rate risk,we entered into two interest rate swap agreements, effectively converting our mortgage loan into afixed rate loan. Under generally accepted accounting principles, the fair values of the swap contracts,which will either be amounts receivable from or payable to counterparties, are reflected as either assetsor liabilities on our Consolidated Balance Sheets. We record their fair value changes in ourConsolidated Statements of Operations, in ‘‘Other income (expense), net.’’ The associated impact onour quarterly operating results is directly related to changes in prevailing interest rates. If interest ratesincrease, we would have a non-cash gain on the swap, and vice versa. Consequently, these swapcontracts will introduce volatility to our operating results.
We are also exposed to credit loss in the event of non-performance by the counterparties to theinterest rate swap agreements. However, we do not anticipate non-performance by the counterparties.
Our business is subject to seasonal fluctuations which may in turn cause fluctuations in our results ofoperations and cash flows from period to period.
Many of the products using our image sensors, such as mobile phones, notebooks, tablets,webcams, DSCs and cameras for entertainment applications, are consumer electronics goods. Thesemass-market camera devices generally have seasonal cycles which historically have caused the sales ofour customers to fluctuate quarter-to-quarter. In addition, since a very large number of themanufacturers who use our products are located in China and Taiwan, the pattern of demand for ourimage sensors has been influenced by the timing of the extended lunar or Chinese New Year holiday, aperiod in which the factories which use our image sensors generally close. Consequently, demand forour image sensors has historically been stronger in the second and third quarters of our fiscal year andweaker in the first and fourth quarters of our fiscal year. However, due to the global economicdownturn, we experienced weaker than normal conditions in all of our markets in the third and fourthquarters of fiscal 2009. With the return to profitability in our business since the second quarter of fiscal2010, we believe the historical seasonal cycle to our business has returned. If this seasonal cycle
25

continues in future years, it could result in the fluctuation of our results of operations and cash flowsfrom period to period. Alternatively, if we experience future events, such as the recent global economicdownturn or other events outside of our control, our historical seasonal cycle could be disrupted andour results of operations and cash flows could differ from our historical seasonal cycles.
Problems with wafer manufacturing and/or back-end processing yields could result in higher product costsand could impair our ability to meet customer demand for our products.
If the foundries manufacturing the wafers used in our products cannot achieve the yields weexpect, we could incur higher unit costs and reduced product availability. Foundries that supply ourwafers have experienced problems in the past achieving acceptable wafer manufacturing yields. Waferyields are a function of both our design technology and the particular foundry’s manufacturing processtechnology. These risks increase with our introduction of more advanced and novel products andtechnology, as well as with increased customer demand that requires these new products to beproduced more quickly and in greater quantities than our historical volume. Certain risks are inherentin the introduction of new products and technology. Low yields may result from design errors ormanufacturing failures in new or existing products. During the early stages of production, productionyields for new products are typically lower than those of established products. Unlike many othersemiconductor products, optical products can be effectively tested only when they are complete.Accordingly, we perform final testing of our products only after they are assembled. As a result, yieldproblems may not be identified until our products are well into the production process. The risksassociated with low yields could be increased because we rely on third party offshore foundries for ourwafers, which can increase the effort and time required to identify, communicate and resolvemanufacturing yield problems. In addition to wafer manufacturing yields, our products are subject toyield loss in subsequent manufacturing steps, often referred to as back-end processing, such as theapplication of color filters and micro-lenses, dicing (cutting the wafer into individual devices, or die)and packaging. Any of these potential problems with wafer manufacturing and/or back-end processingyields could result in a reduction in our gross margins and/or our ability to timely deliver products tocustomers, which could adversely affect our customer relations and make it more difficult to sustainand grow our business.
We depend on the increased acceptance of mass-market image-sensor applications to grow our business andincrease our revenues.
Our business strategy depends in large part on the continued growth of the various markets intowhich we sell our image-sensor products, including the markets for mobile phones, notebook, tablets,webcams, digital still and video cameras, commercial and security and surveillance applications,entertainment devices, automotive and medical applications. If these markets do not grow and developas we anticipate, we may be unable to sustain or grow the sales of our products. Each of these marketshas already been, and may continue to be, adversely impacted by current global economic conditionswhere consumers and businesses have deferred purchases of products in these markets as a result oftighter credit, negative financial news, and decreased corporate or consumer spending. Such conditionshave negatively affected, and may continue to negatively affect, our business.
In addition, the market price of our common stock may be adversely affected if certain of thesenew markets do not emerge or develop as expected. Securities analysts may already factor revenuefrom such new markets into their future estimates of our financial performance and should suchmarkets not develop as expected by such securities analysts the trading price of our common stockcould be adversely affected.
26

Our lengthy manufacturing, packaging and assembly cycle, in addition to our customers’ design cycle, mayresult in uncertainty and delays in generating revenues.
The production of our image sensors requires a lengthy manufacturing, packaging and assemblyprocess, typically lasting approximately 12-14 weeks. Additional time may pass before a customercommences taking volume shipments of products that incorporate our image sensors. Even when amanufacturer decides to design our image sensors into its products, the manufacturer may never shipfinal products incorporating our image sensors. Given this lengthy cycle, we experience a delay betweenthe time we incur expenditures for research and development and sales and marketing efforts and thetime we generate revenue, if any, from these expenditures. This delay makes it more difficult toforecast customer demand, which adds uncertainty to the manufacturing planning process and couldadversely affect our operating results. In addition, the product life cycle for certain of our image-sensorproducts designed for use in certain applications can be relatively short. If we fail to appropriatelymanage the manufacturing, packaging and assembly process, our products may become obsolete beforethey can be incorporated into our customers’ products and we may never realize a return on investmentfor the expenditures we incur in developing and producing these products.
Our ability to deliver products that meet customer demand is dependent upon our ability to meet new andchanging requirements for color filter application and image-sensor packaging.
We expect that as we develop new products to meet technological advances and new and changingindustry and customer demands, our color filter application and ceramic, plastic and chip scalepackaging requirements will also evolve. Our ability to continue to profitably deliver products that meetcustomer demand is dependent upon our ability to obtain third party services that meet these newrequirements on a cost-effective basis. There can be no assurances that any of these parties will be ableto develop enhancements to the services they provide to us to meet these new and changing industryand customer requirements. Furthermore, even if these service providers are able to develop theirservices to meet new and evolving requirements, these services may not be available at a cost thatenables us to sustain our profitability.
The high level of complexity and integration of our products increases the risk of latent defects, which coulddamage customer relationships and increase our costs.
Our products are based upon evolving technology, and because we integrate many functions on asingle chip, are highly complex. The integration of additional functions into already complex productscould result in a greater risk that customers or end users could discover latent defects or subtle faultsafter we have already shipped significant quantities of a product. Although we test our products, wehave in the past and may in the future encounter defects or errors. For example, in the third quarter offiscal 2005, we recorded a provision of $2.7 million related to the possible replacement of products thatdid not meet a particular customer’s standards. Delivery of products with defects or reliability, qualityor compatibility problems may damage our reputation and ability to retain existing customers andattract new customers. In addition, product defects and errors could result in additional developmentcosts, diversion of technical resources, delayed product shipments, increased product returns, productwarranty costs for recall and replacement and product liability claims against us which may not be fullycovered by insurance.
Recent domestic and worldwide economic conditions adversely affected and could have future adverse effectson our business, results of operations, financial condition and cash flows.
Beginning with the second half of our fiscal 2009, general domestic and global economic conditionswere negatively impacted by several factors. These economic conditions resulted in our facing one ofthe most challenging periods in our history.
27

Although during the latter part of fiscal 2010 and throughout fiscal 2011, we have seen indicationsthat suggest that certain major economies are returning to positive growth, it is uncertain whether suchresumption of growth will be sustained. If the economic recovery slows down or even dissipates, ourbusiness, financial condition, results of operations and cash flows could be materially and adverselyaffected.
We may be required to record a significant charge to earnings if our goodwill, intangible assets or long-terminvestments become impaired.
Under generally accepted accounting principles, we are required to review our intangible assets forimpairment when events or changes in circumstances indicate the carrying value may not berecoverable. Factors that may be considered a change in circumstances indicating that the carryingvalue of our intangible assets may not be recoverable include a decline in stock price and marketcapitalization, and slower growth rates in our industry.
We may be required to record a significant charge to earnings in our financial statements duringthe period in which we determine that our intangible assets or long-term investments have beenimpaired. Any such charge would adversely impact our results of operations. As of April 30, 2011, ourgoodwill totaled approximately $1.1 million, our intangible assets totaled approximately $69.9 millionand our long-term investments totaled approximately $104.6 million.
We maintain a backlog of customer orders that is subject to cancellation or delay in delivery schedules, andany cancellation or delay may result in lower than anticipated revenues.
Our sales are generally made pursuant to standard purchase orders. We include in our backlogonly those customer orders for which we have accepted purchase orders and assigned shipment dateswithin the upcoming 12 months. Orders constituting our current backlog are subject to cancellation orchanges in delivery schedules, and backlog may not necessarily be an indication of future revenue. Anycancellation or delay in orders which constitute our current or future backlog may result in lower thanexpected revenues.
If we are unable to maintain processes and procedures to sustain effective internal control over ourfinancial reporting, our ability to provide reliable and timely financial reports could be harmed and thiscould have a material adverse effect on our stock price.
We are required to comply with the rules promulgated under Section 404 of the Sarbanes-OxleyAct of 2002, or Sarbanes-Oxley Act. Section 404 requires that we prepare an annual managementreport assessing the effectiveness of our internal control over financial reporting, and requires a reportby our independent registered public accounting firm addressing the effectiveness of our internalcontrol over financial reporting.
We have in the past discovered, and may in the future discover, areas of our internal control thatneed improvement. For example, we restated our financial statements for the first, second and thirdquarters of fiscal 2004. If these or similar types of issues were to arise with respect to our internalcontrols in future periods, they could impair our ability to produce accurate and timely financialreports.
As our business changes, ongoing compliance with the provisions of Section 404 of the Sarbanes-Oxley Act and maintenance of effective internal control over financial reporting may require that wehire additional qualified finance and accounting personnel. Because other businesses face similarchallenges, there is significant competition for such personnel, and there can be no assurance that wewill be able to attract and/or retain suitably qualified employees.
28

Corporate governance regulations have increased our compliance costs and could further increase ourexpenses if changes occur within our business.
We are subject to corporate governance laws and regulations affecting public companies, includingthe provisions of the Sarbanes-Oxley Act and the Dodd-Frank Act of 2010, that impose certainrequirements on us and on our officers, directors, attorneys and independent registered publicaccounting firm. In order to comply with these rules, we added internal resources and have utilizedadditional outside legal, accounting and advisory services, which increased our operating expenses. Weexpect to incur ongoing operating expenses as we maintain compliance with Section 404. In addition, ifwe undergo significant modifications to our structure through personnel or system changes, acquisitions,or otherwise, it may be increasingly difficult to maintain compliance with the existing and evolvingcorporate governance regulations.
We hold a significant amount of marketable securities which are subject to general market risks over whichwe have no control.
As of April 30, 2011, we held cash and cash equivalents totaling $379.4 million, and short-terminvestments totaling $87.5 million. These assets are managed on our behalf by unrelated third parties inaccordance with a cash management policy that has been approved by our board of directors andrestricts our investments to a maximum maturity of 18 months and to investment-grade instruments. Asof April 30, 2011, we did not hold any illiquid investments and we have not realized any losses.However, ongoing uncertainties in global capital markets associated with a repricing of risk have causeddisruptions in the orderly function of markets which are ordinarily characterized by virtually unlimitedliquidity. If we were to make a future investment in certain illiquid securities that are dependent on theorderly functioning of the capital markets, and if we were required to liquidate these types of securitiesat short notice, such liquidation could result in losses of principal, which would have a negative impacton our results of operations and cash flows.
There are risks associated with our operations in China.
In December 2000, we established OmniVision Semiconductor (Shanghai) Co. Ltd., or OSC, aspart of our efforts to streamline our manufacturing process and reduce the costs and working capitalassociated with the testing of our image-sensor products, and relocated our automated image testingequipment from the United States to China. We are currently expanding our testing capabilities withadditional automated testing equipment, which will also be located in China. Through our wholly-owned subsidiary, OmniVision Technologies (Shanghai) Co. Ltd., or OTC, we have also constructedresearch facilities in Shanghai. There are certain administrative, legal and governmental risks tooperating in China that could result in increased operating expenses or could hamper us in thedevelopment of our operations in China. The risks from operating in China that could increase ouroperating expenses and adversely affect our operating results, financial condition and ability to deliverour products and grow our business include, without limitation:
• difficulties in staffing and managing foreign operations, particularly in attracting and retainingpersonnel qualified to design, sell, test and support our products;
• difficulties in managing employee relations;
• implications of the ongoing general labor disputes in China;
• increases in the value of the Chinese Yuan, or CNY;
• difficulties in coordinating our operations in China with those in California;
• difficulties in enforcing contracts in China;
• difficulties in protecting intellectual property;
29

• diversion of management attention;
• imposition of burdensome governmental regulations;
• difficulties in maintaining uniform standards, controls, procedures and policies across our globaloperations, including inventory management and financial consolidation;
• political and economic instability, which could have an adverse impact on foreign exchange ratesin Asia and could impair our ability to conduct our business in China; and
• inadequacy of the local infrastructure to support our operations.
We may experience integration or other problems with potential future acquisitions, which could have anadverse effect on our business or results of operations. New acquisitions could dilute the interests of existingstockholders, and the announcement of new acquisitions could result in a decline in the price of ourcommon stock.
We may acquire, or invest in, businesses that offer products, services and technologies that webelieve would complement our products, including CMOS image-sensor manufacturers. We may alsomake acquisitions of, or investments in, businesses that we believe could expand our distributionchannels. Even if we were to announce an acquisition, we may not be able to complete it. In addition,any future acquisition or substantial investment could present numerous risks, including:
• difficulty in realizing the potential technological benefits of the transaction;
• difficulty in integrating the technology, operations or work force of the acquired business withour existing business;
• unanticipated expenses related to technology integration;
• disruption of our ongoing business;
• difficulty in realizing the potential financial or strategic benefits of the transaction;
• difficulty in maintaining uniform standards, controls, procedures and policies;
• possible impairment of relationships with employees, customers, suppliers and strategic partnersas a result of integration of new businesses and management personnel;
• reductions in our future operating results from amortization of intangible assets;
• impairment of resulting goodwill; and
• potential unknown or unexpected liabilities associated with acquired businesses.
We expect that any future acquisitions could include consideration to be paid in cash, shares of ourcommon stock or a combination of cash and our common stock. If and when consideration for atransaction is paid in common stock, it will result in dilution to our existing stockholders.
We may not achieve continued benefits from our joint venture with TSMC.
In October 2003, together with TSMC, we formed VisEra, a joint venture in Taiwan, for thepurposes of providing manufacturing services. Since its formation, TSMC and we have expanded thescope of VisEra’s activities through the provision of additional funding.
In January 2006, VisEra acquired certain color filter application equipment from TSMC andassumed direct responsibility for providing the color filter application services that had previously beenprovided to us by TSMC. We expect that VisEra will be able to provide us with a committed supply ofhigh quality manufacturing services at competitive prices. However, there are significant legal,governmental and relationship risks to managing the business scope of VisEra, and we cannot ensure
30

that we will continue to receive the expected benefits from the joint venture. For example, VisEra maynot be able to provide manufacturing services that have competitive technology or prices, which couldadversely affect our product offerings and our ability to meet customer requirements for our products.In addition, the existence of VisEra may also make it more difficult for us to secure dependableservices from competing merchant vendors who provide similar manufacturing services.
We may not achieve all of the anticipated benefits of our alliances with, and strategic investments in, thirdparties.
We expect to develop our business partly through forming alliances or joint ventures with andmaking strategic investments in other companies, some of which may be companies at a relatively earlystage of development. For example, in April 2003, we made an investment in XinTec, a company thatprovides chip scale packaging services, and in June 2003 we made an investment in ImPac, a packagingservice company. In December 2005, VisEra, our joint venture with TSMC, completed the acquisitionof additional shares of XinTec. In May 2007, we acquired a portion of the registered capital of ChinaWLCSP Limited, or WLCSP, a company that also provides chip scale packaging services. In December2009, Tong Hsing acquired ImPac in a stock-for-stock exchange and we now hold shares in Tong Hsing.
Our investments in these and other companies may negatively impact our operating results,because, under certain circumstances, we are required to recognize our portion of any loss recorded byeach of these companies or to consolidate them into our operating results. We expect to continue toutilize partnerships, strategic alliances and investments, particularly those that enhance ourmanufacturing capacity and those that provide manufacturing services and testing capability. Theseinvestments and partnering arrangements are crucial to our ability to grow our business and meet theincreasing demands of our customers. However, we cannot ensure that we will achieve the benefits weexpect from these alliances. For example, we may not be able to obtain acceptable quality and/or wafermanufacturing yields from these companies, which could result in higher operating costs and couldimpair our ability to meet customer demand for our products. In addition, certain of these investmentsor partnering relationships may place restrictions on the scope of our business, the geographic areas inwhich we can sell our products and the types of products that we can manufacture and sell. Forexample, our agreement with TSMC provides that we may not engage in business that will directlycompete with the business of VisEra. This type of non-competition provision may impact our ability togrow our business and to meet the demands of our customers.
Changes in our relationships with our joint venture and/or companies in which we hold less than amajority interest could change the way we account for such interests in the future.
As part of our strategy, we have formed a joint venture with one of our foundry partners, and wehold equity interests in two other companies from which we purchase certain manufacturing services.For the investments that we account for under the equity method, we record as part of income orexpense our share of the increase or decrease in the equity of the companies in which we haveinvested. It is possible that, in the future, our relationships and/or our interests in or with our jointventure or other investees could change. Such changes have resulted in the past, and could result in thefuture, in deconsolidation or consolidation of such entities, as the case may be, which could result inchanges in our reported results.
We may be unable to adequately protect our intellectual property, and therefore we may lose some of ourcompetitive advantage.
We rely on a combination of patent, copyright, trademark and trade secret laws as well asnondisclosure agreements and other methods to protect our proprietary technologies. We have beenissued patents and have a number of pending United States and foreign patent applications. However,we cannot provide assurance that any patent will be issued as a result of any applications or, if issued,
31

that any claims allowed will be sufficiently broad to protect our technology. It is possible that existingor future patents may be challenged, invalidated or circumvented. For example, in August 2002, weinitiated a patent infringement action in Taiwan, Republic of China against IC Media Corporation ofSan Jose, California for infringement of a Taiwanese patent that had been issued to us. In response toour patent infringement action, in October 2002, IC Media Corporation initiated a cancellationproceeding in the Taiwan Intellectual Property Office with respect to our patent. In July 2003, theTaiwan Intellectual Property Office made an initial determination to grant the cancellation of thesubject patent, which decision was upheld by the Taiwan Ministry of Economic Affairs and the HighAdministrative Court. We decided not to appeal such decision by the May 31, 2005 deadline. Althoughwe do not believe the cancellation of the Taiwanese patent at issue in the dispute described above hashad a material adverse effect on our business or prospects, there may be other situations where ourinability to adequately protect our intellectual property rights could materially and adversely affect ourcompetitive position and operating results. If a third party can copy or otherwise obtain and use ourproducts or technology without authorization, develop corresponding technology independently ordesign around our patents, this could materially adversely affect our business and prospects. Effectivepatent, copyright, trademark and trade secret protection may be unavailable or limited in foreigncountries. Any disputes over our intellectual property rights, whatever the ultimate resolution of suchdisputes, may result in costly and time-consuming litigation or require the license of additionalelements of intellectual property for a fee.
Litigation regarding intellectual property could divert management attention, be costly to defend and preventus from using or selling the challenged technology.
In recent years, there has been significant litigation in the United States involving intellectualproperty rights, including in the semiconductor industry. We have in the past been, currently are andmay in the future be, subject to legal proceedings and claims with respect to our intellectual property,including such matters as trade secrets, patents, product liabilities and other actions arising out of thenormal course of business. These claims may increase as our intellectual property portfolio becomeslarger or more valuable. Intellectual property claims against us, and any resulting lawsuit, may cause usto incur significant expenses, subject us to liability for damages and invalidate our proprietary rights.Any potential intellectual property litigation against us would likely be time-consuming and expensiveto resolve and would divert management’s time and attention and could also force us to take actionssuch as:
• ceasing the sale or use of products or services that incorporate the infringed intellectualproperty;
• obtaining from the holder of the infringed intellectual property a license to sell or use therelevant technology, which license may not be available on acceptable terms, if at all; or
• redesigning those products or services that incorporate the disputed intellectual property, whichcould result in substantial unanticipated development expenses and delay and prevent us fromselling the products until the redesign is completed, if at all.
If we are subject to a successful claim of infringement and we fail to develop non-infringingintellectual property or license the infringed intellectual property on acceptable terms and on a timelybasis, we may be unable to sell some or all of our products, and our operating results could beadversely affected. We may in the future initiate claims or litigation against third parties forinfringement of our intellectual property rights or to determine the scope and validity of ourproprietary rights or the proprietary rights of competitors. These claims could also result in significantexpense and the diversion of technical and management attention.
32

The use of our image sensors in end user products in the medical and automotive industries could result inus being named as a defendant in product liability claims, which could adversely affect our business andreputation.
Our image sensors have been incorporated into certain end user products in the medical andautomotive industries, and we expect that they will continue to increase as a percentage of our overallbusiness. The use of the medical and automotive industry products into which our image sensors aredesigned could result in an unsafe condition, injury, or even death as a result of, among other factors,component failures, manufacturing flaws, design defects or inadequate disclosure of product-relatedrisks or product-related information. These factors could result in product liability claims seekingdamages for personal injury, and we could be named as a defendant in such claims. Because theoutcome of product liability claims is not predictable and is difficult to assess or quantify, we cannotprovide assurance that such claims will not materially adversely affect our business or damage thereputation of our products or our company.
If we do not effectively manage our growth, our ability to increase our revenues and improve our earningscould be adversely affected.
Our growth has placed, and will continue to place, a significant strain on our management andother resources. To manage our growth effectively, we must, among other things:
• continuously improve our operational, financial and accounting systems;
• train, manage and maintain good relations with our existing employee base in both our U.S. andinternational locations;
• attract and retain qualified personnel with relevant experience; and
• effectively manage accounts receivable and inventory.
For example, our failure to effectively manage our inventory levels could result either in excessinventories, which could adversely affect our gross margins and operating results, or lead to an inabilityto fill customer orders, which would result in lower sales and could harm our relationships with existingand potential customers.
We must also manage multiple relationships with customers, business partners and other thirdparties, such as our foundries and process and assembly vendors. Moreover, future growth couldsignificantly overburden our management and financial systems and other resources. We may not makeadequate allowances for the costs and risks associated with our expansion. In addition, our systems,procedures or controls may not be adequate to support our operations, and we may not be able toexpand quickly enough to capitalize on potential market opportunities. Our future operating results willalso depend, in part, on our ability to expand sales and marketing, research and development,accounting, finance and administrative support.
Our future tax rates and tax payments could be higher than we anticipate and may harm our results ofoperations.
As a multinational corporation, we conduct our business in many countries and are subject totaxation in many jurisdictions. The taxation of our business is subject to the application of multiple andsometimes conflicting tax laws and regulations as well as multinational tax conventions. The applicationof tax law is subject to legal and factual interpretation, judgment and uncertainty, and tax lawsthemselves are subject to change. Consequently, taxing authorities may impose tax assessments orjudgments against us that could result in a significant charge to our earnings.
A number of other factors will also affect our future tax rate, and certain of these factors couldincrease our effective tax rate in future periods, which could adversely impact our operating results.
33

These factors include changes in non-deductible share-based compensation, changes in tax laws or theinterpretation of tax laws, changes in the proportion and geographic mix of our revenue or earnings,changes in the valuation of our deferred tax assets and liabilities, changes in available tax credits andthe repatriation of non-U.S. earnings for which we have not previously provided for U.S. taxes.
Our sales through distributors increase the complexity of our business and may reduce our ability toforecast revenues.
During fiscal 2010 and fiscal 2011, approximately 48.5% and 24.7%, respectively, of our revenuescame from sales through distributors. We expect that revenues from sales through distributors will varyfrom year to year, but will continue to represent a significant proportion of our total revenues. Sellingthrough distributors reduces our ability to accurately forecast sales and increases the complexity of ourbusiness, requiring us to, among other matters:
• manage a more complex supply chain;
• manage the level of inventory at each distributor;
• provide for credits, return rights and price protection;
• estimate the impact of credits, return rights, price protection and unsold inventory atdistributors; and
• monitor the financial condition and creditworthiness of our distributors.
Any failure to manage these challenges could cause us to inaccurately forecast sales and carryexcess or insufficient inventory, thereby adversely affecting our operating results and cash flows.
We face foreign business, political and economic risks, because a majority of our products and those of ourcustomers are manufactured and sold outside of the United States.
We face difficulties in managing our third party foundries, color filter application service providers,packaging and other manufacturing service providers and our foreign distributors, most of whom arelocated in Asia. In addition, our presence in Asia presents the challenge of managing foreignoperations and maintaining good relations with our employees located there. Any political andeconomic instability in Asia might have an adverse impact on foreign exchange rates and could causeservice disruptions for our vendors and distributors and adversely affect our customers.
Sales outside of the United States accounted for substantially all of our revenues for fiscal 2010and 2011. We anticipate that sales outside of the United States will continue to account for asubstantial portion of our revenues in future periods. Dependence on sales to foreign customersinvolves certain risks, including:
• longer payment cycles;
• the adverse effects of tariffs, duties, price controls or other restrictions that impair trade;
• decreased visibility as to future demand;
• difficulties in accounts receivable collections; and
• burdens of complying with a wide variety of foreign laws and labor practices.
Sales of our products have to date been denominated principally in U.S. dollars. Over the lastseveral years, the U.S. dollar has weakened against most other currencies. Future increases in the valueof the U.S. dollar, if any, would increase the price of our products in the currency of the countries inwhich our customers are located. This may result in our customers seeking lower-priced suppliers,which could adversely impact our operating results. If a larger portion of our international revenues
34

were to be denominated in foreign currencies in the future, we would be subject to increased risksassociated with fluctuations in foreign currency exchange rates.
Our business could be harmed if we lose the services of one or more members of our senior managementteam, or if we are unable to attract and retain qualified personnel.
The loss of the services of one or more of our executive officers or key employees, which hasoccurred from time to time, or the decision of one or more of these individuals to join a competitor,could adversely affect our business and harm our operating results and financial condition. Our successdepends to a significant extent on the continued service of our senior management and certain otherkey technical personnel. None of our senior management is bound by an employment ornon-competition agreement. We do not maintain key man life insurance on any of our employees.
Our success also depends on our ability to identify, attract and retain qualified sales, marketing,finance, management and technical personnel. We have experienced, and may continue to experience,difficulty in hiring and retaining candidates with appropriate qualifications. If we do not succeed inhiring and retaining candidates with appropriate qualifications, our revenues, operations and productdevelopment efforts could be harmed.
We substantially completed the implementation of a new enterprise resource planning system, a processwhich presents a number of significant operational risks.
As our business grows and becomes more complex, it is necessary that we expand and upgrade ourenterprise resource planning system, or ERP, and other management information systems which arecritical to the operational, accounting and financial functions of our company. We evaluated alternativesolutions, both short-term and long-term, to meet the operating, administrative and financial reportingrequirements of our business. During the three months ended July 31, 2008, we substantially completedthe implementation of a new ERP based on a suite of application software developed by OracleCorporation. We have made and will continue to make further enhancements and upgrades to the ERP,as necessary. Significant management attention and resources have been used and extensive planninghas occurred to support effective implementation of the new ERP system, however, suchimplementation carries certain risks, including the risk of significant design errors that could materiallyand adversely affect our operating results and impact our ability to manage our business. As a result,there is a risk that deficiencies may exist in the future and that they could constitute significantdeficiencies, or, in the aggregate, a material weakness in internal control over financial reporting.
Our operations may be impaired as a result of disasters, business interruptions or similar events.
Disasters and business interruptions such as earthquakes, water, fire, electrical failure, accidentsand epidemics affecting our operating activities, major facilities, and employees’ and customers’ healthcould materially and adversely affect our operating results and financial condition. In particular, ourAsian operations and most of our third party service providers involved in the manufacturing of ourproducts are located within relative close proximity. Therefore, any disaster that strikes within or closeto that geographic area, such as the earthquake and flooding that occurred in China, could beextremely disruptive to our business and could materially and adversely affect our operating results andfinancial condition. We are currently developing and implementing a disaster recovery plan.
Acts of war and terrorist acts may seriously harm our business and revenue, costs and expenses andfinancial condition.
Acts of war or terrorist acts, wherever they occur around the world, may cause damage ordisruption to our business, employees, facilities, suppliers, distributors or customers, which couldsignificantly impact our revenue, costs, expenses and financial condition. In addition, as a company with
35

significant operations and major distributors and customers located in Asia, we may be adverselyimpacted by heightened tensions and acts of war that occur in locations such as the Korean Peninsula,Taiwan and China. The potential for future terrorist attacks, the national and international responses toterrorist attacks or perceived threats to national security, and other acts of war or hostility have createdmany economic and political uncertainties that could adversely affect our business and results ofoperations in ways that cannot presently be predicted. We are uninsured for losses and interruptionscaused by terrorist acts and acts of war.
Risks Related to the Securities Markets and Ownership of Our Common Stock
Provisions in our charter documents and Delaware law, as well as our stockholders’ rights plan, couldprevent or delay a change in control of our company and may reduce the market price of our commonstock.
Provisions of our certificate of incorporation and bylaws may discourage, delay or prevent a mergeror acquisition that a stockholder may consider favorable. These provisions include:
• adjusting the price, rights, preferences, privileges and restrictions of preferred stock withoutstockholder approval;
• providing for a classified board of directors with staggered, three-year terms;
• requiring supermajority voting to amend some provisions in our certificate of incorporation andbylaws;
• limiting the persons who may call special meetings of stockholders; and
• prohibiting stockholder actions by written consent.
Provisions of Delaware law also may discourage, delay or prevent another company from acquiringor merging with us. Our board of directors adopted a preferred stock rights agreement in August 2001.Pursuant to the rights agreement, our board of directors declared a dividend of one right to purchaseone one-thousandth share of our Series A Participating Preferred Stock for each outstanding share ofour common stock. The dividend was paid on September 28, 2001 to stockholders of record as of theclose of business on that date. Each right entitles the registered holder to purchase from us oneone-thousandth of a share of Series A Preferred at an exercise price of $176.00, subject to adjustment.The exercise of the rights could have the effect of delaying, deferring or preventing a change of controlof our company, including, without limitation, discouraging a proxy contest or making more difficult theacquisition of a substantial block of our common stock. The rights agreement could also limit the pricethat investors might be willing to pay in the future for our common stock.
Our stock has been and will likely continue to be subject to substantial price and volume fluctuations due toa number of factors, many of which are beyond our control that may prevent our stockholders from sellingour common stock at a profit.
The market price of our common stock has fluctuated substantially, and there can be no assurancethat such volatility will not continue. Since the beginning of fiscal 2002 through June 24, 2011, theclosing sales price of our common stock has ranged from a high of $36.42 per share to a low of $1.26per share. The closing sales price of our common stock on June 24, 2011 was $31.07 per share. Thesecurities markets have experienced significant price and volume fluctuations in the past, and themarket prices of the securities of semiconductor companies have been especially volatile. This marketvolatility, as well as general economic, market or political conditions, including the current globaleconomic situation, could reduce the market price of our common stock in spite of our operating
36

performance. The market price of our common stock may fluctuate significantly in response to anumber of factors, including:
• actual or anticipated fluctuations in our operating results;
• changes in expectations as to our future financial performance;
• changes in financial estimates of securities analysts;
• release of lock-up or other transfer restrictions on our outstanding shares of common stock orsales of additional shares of common stock;
• sales or the perception in the market of possible sales of shares of our common stock by ourdirectors, officers, employees or principal stockholders;
• changes in market valuations of other technology companies; and
• announcements by us or our competitors of significant technical innovations, design wins,contracts, standards or acquisitions.
Due to these factors, the price of our stock may decline and investors may be unable to resell theirshares of our stock for a profit. In addition, the stock market experiences extreme volatility that oftenis unrelated to the performance of particular companies. These market fluctuations may cause ourstock price to decline regardless of our performance.
ITEM 1B. UNRESOLVED STAFF COMMENTS
None.
ITEM 2. PROPERTIES
Our principal offices are located in a complex of four buildings in Santa Clara County, California,or the Santa Clara Property, totaling approximately 207,000 square feet which we purchased for anaggregate price of approximately $37.5 million. Please see ‘‘Item 7—Management’s Discussion andAnalysis of Financial Condition and Results of Operations—Liquidity and Capital Resources—Liquidity’’on page 63 below for a description of the Loan and Security Agreement, Deed of Trust, Assignment ofRents and Leases, Security Agreement and Fixture, and Stock Pledge Agreement that we entered intoin connection with the purchase of this property.
In January 2007, we entered into a Land-Use-Right Purchase Agreement, or the PurchaseAgreement, with the Construction and Transportation Commission of the Pudong New District,Shanghai through our wholly-owned subsidiary, OTC. The Purchase Agreement has an effective date ofDecember 31, 2006. Under the terms of the Purchase Agreement, we agreed to pay an aggregateamount of approximately $0.6 million, or the Purchase Price, in exchange for the right to useapproximately 323,000 square feet of land located in Shanghai for a period of 50 years. As of April 30,2011, the construction of a research facility on the land was complete, in accordance with the PurchaseAgreement. The Company obtained a fixed asset loan in the principal amount of approximately$20.5 million based on the exchange rate in effect at the time of the loan origination, or theConstruction Loan, to finance the construction. (See Note 8—‘‘Borrowing Arrangements and RelatedDerivative Instruments’’.)
In December 2000, our Chinese subsidiary, OSC, entered into an agreement to lease 447,400square feet of land in Shanghai, China on which we have built a facility that is currently used forproduct testing and may possibly be used for other activities in the future. This lease agreement expiresin December 2051.
37

We believe that our existing or readily available facilities are suitable and adequate for our presentpurposes.
ITEM 3. LEGAL PROCEEDINGS
From time to time, we have been subject to legal proceedings and claims with respect to suchmatters as patents, product liabilities and other actions arising out of the normal course of business.
On November 29, 2001, a complaint captioned McKee v. OmniVision Technologies, Inc., et. al., CivilAction No. 01 CV 10775, was filed in the United States District Court for the Southern District of NewYork against us, some of our directors and officers, and various underwriters for our initial publicoffering. Plaintiffs generally allege that the defendants violated federal securities laws because theprospectus related to our offering failed to disclose, and contained false and misleading statementsregarding, certain commissions purported to have been received by the underwriters, and otherpurported underwriter practices in connection with their allocation of shares in our offering. Thecomplaint seeks unspecified damages on behalf of a purported class of purchasers of our common stockbetween July 14, 2000 and December 6, 2000. Substantially similar actions have been filed concerningthe initial public offerings for more than 300 different issuers, and the cases have been coordinated asIn re Initial Public Offering Securities Litigation, 21 MC 92. On February 19, 2003, the Court issued anorder dismissing all claims against us except for a claim brought under Section 11 of the Securities Actof 1933.
The parties have reached a global settlement of the coordinated litigation. Under the settlement,the insurers will pay the full amount of settlement share allocated to us, and we will bear no financialliability. Our company and the other defendants will receive complete dismissals from the case. In 2009,the Court entered an order granting final approval of the settlement. Certain objectors filed appeals. Anumber of those appeals were dismissed. In May 2011, the appellate court issued an order remandingthe remaining appeals to the district court for further determinations. If for any reason the settlementdoes not become effective, and litigation against us proceeds, we believe that we have meritoriousdefenses to plaintiffs’ claims and intend to defend the action vigorously.
On October 12, 2007, a purported stockholder of ours filed a complaint against certain of ourunderwriters for our initial public offering. The complaint, Vanessa Simmonds v. Bank of AmericaCorporation, et al., Case No. C07-1668, filed in District Court for the Western District of Washington,makes similar allegations to those made in In re Initial Public Offering Securities Litigation and seeks therecovery of short-swing trading profits under Section 16(b) of the Securities Exchange Act of 1934. Weare named as a nominal defendant, and no recovery was sought from it. The plaintiff filed an amendedcomplaint in February 2008. On March 12, 2009, the Court granted the motion to dismiss withoutprejudice, filed by 30 of the issuer defendants and the motion to dismiss with prejudice, filed by all ofthe underwriter defendants, which included the suit against us. The plaintiff timely appealed theCourt’s Order to the United States Court of Appeals for the Ninth Circuit. On December 3, 2010, theNinth Circuit entered its opinion and order in this matter. The Court affirmed the dismissal of the suitsagainst the 30 moving issuer defendants on the grounds that the demand letters sent to those issuerswere inadequate under Delaware law, and converted the dismissals from without prejudice to withprejudice. The Court also reversed the dismissal of the suits against the remaining 24 issuer defendants,including us, but is allowing those issuer defendants, including us, to challenge the adequacy of thedemand letters that the plaintiff sent to the issuers before filing suit. On January 24, 2011, theunderwriter defendants filed a motion to stay the Ninth Circuit’s mandate pending its filing of apetition for a writ of certiorari in the United States Supreme Court. On January 25, 2011, the NinthCircuit granted the motion and entered an Order staying the mandate for ninety days. On January 26,2011, plaintiff also filed a motion to join the underwriters’ motion to stay the Ninth Circuit’s mandateon the grounds that plaintiff also will be filing a petition for a writ of certiorari in the United States
38

Supreme Court. The petitions for a writ of certiorari have not yet been filed with the United StatesSupreme Court. No discovery has taken place.
At the end of May 2009, plaintiff sent a Demand for Inspection of Books and Records to certainof the nominal defendants named in the Section 16(b) litigation seeking the companies to produce anytolling agreements entered into with the companies’ respective underwriters. Plaintiff’s counsel hasagreed to an open-ended extension for certain nominal defendants who received such a demand. As ofthe date of this filing, we have not received a demand for inspection of books and records from theplaintiff.
On March 6, 2009, Panavision Imaging, LLC, or Panavision, filed a complaint against us allegingpatent infringement in the District Court for the Central District of California. The case is entitledPanavision Imaging, LLC v. OmniVision Technologies, Inc., Canon U.S.A., Inc., Micron Technology, Inc.and Aptina Imaging Corporation, Case No. CV09-1577. In its complaint, Panavision asserts that wemake, have made, use, sell and/or import products that infringe U.S. Patent Nos. 6,818,877(‘‘Pre-charging a Wide Analog Bus for CMOS Image Sensors’’), 6,663,029 (‘‘Video Bus for High SpeedMulti-resolution Imagers and Method Thereof’’) and 7,057,150 (‘‘Solid State Imager with ReducedNumber of Transistors per Pixel’’). The complaint seeks unspecified monetary damages, fees andexpenses and injunctive relief against us. On April 19, 2010, the court stayed the case pendingreexamination of all of the asserted patents, as the U.S. Patent and Trademark Office has grantedreexamination requests for all of the asserted claims of the asserted patents. On October 22, 2010, theU.S. Patent and Trademark Office issued an Action Closing Prosecution of the inter partesreexamination of U.S. Patent No. 6,818,877 and confirmed the four claims submitted for inter partesreexamination by co-defendants Micron Technology, Inc. and Aptina Imaging Corporation. OnDecember 13, 2010, the Court lifted the stay as to U.S. Patent No. 6,818,877. On February 7, 2011, theCourt issued a Markman order with respect to U.S. Patent No. 6,818,877, and granted summaryjudgment of invalidity for indefiniteness for all of the asserted claims of U.S. Patent No. 6,818,877. OnFebruary 22, 2011, Panavision filed its Final Infringement Contentions, conceding that our products donot infringe U.S. Patent No. 6,818,877 because every claim contains what the Court has held to be anindefinite term. On April 11, 2011, the Court directed the parties to file supplemental briefs regardingwhether all of the asserted claims of U.S. Patent No. 6,818,877 are invalid for indefiniteness. OnMay 31, 2011, the Court conducted a hearing on the invalidity issue to determine whether it shouldreconsider its order of summary judgment of invalidity.
As to the two remaining asserted patents, on November 29, 2010, the U.S. Patent and TrademarkOffice issued an Action Closing Prosecution of the inter partes reexamination of U.S. PatentNo. 7,057,150 and rejected all of the claims submitted for inter partes reexamination. On January 5,2011, the U.S. Patent and Trademark Office issued an Action Closing Prosecution of the inter partesreexamination of U.S. Patent No. 6,663,029 and rejected all of the claims submitted for inter partesreexamination. As a result, all of the asserted claims of the asserted patents are held to be invalid bythe Court or the U.S. Patent and Trademark Office. At this time, we cannot estimate any possible lossor predict whether this matter will result in any material expense to us.
On December 6, 2010, Ziptronix, Inc., or Ziptronix, filed a complaint alleging patent infringementagainst us in the District Court for the Northern District of California. The case is entitledZiptronix, Inc. v. OmniVision Technologies, Inc., Taiwan Semiconductor Manufacturing Company Ltd., andTSMC North America Corp., Case No. CV10-05525. In its complaint, Ziptronix asserts that we havemade, used, offered to sell, sold and/or imported into the United States image sensors that infringeU.S. Patent Nos. 7,387,944 (‘‘Method for Low Temperature Bonding and Bonded Structure’’), 7,335,572(‘‘Method for Low Temperature Bonding and Bonded Structure’’), 7,553,744 (‘‘Method for LowTemperature Bonding and Bonded Structure’’), 7,037,755 (‘‘Three Dimensional Device IntegrationMethod and Integrated Device’’), 6,864,585 (‘‘Three Dimensional Device Integration Method andIntegrated Device’’), and 7,807,549 (‘‘Method for Low Temperature Bonding and Bonded Structure’’).
39

The complaint seeks unspecified monetary damages, enhanced damages, interest, fees, expenses, costs,and injunctive relief against us. We answered the complaint on May 4, 2011 and denied each ofZiptronix’s infringement claims against us. We expect to vigorously defend ourselves against Ziptronix’sallegations. At this time, we cannot estimate any possible loss or predict whether this matter will resultin any material expense to us.
ITEM 4. Removed and Reserved.
40
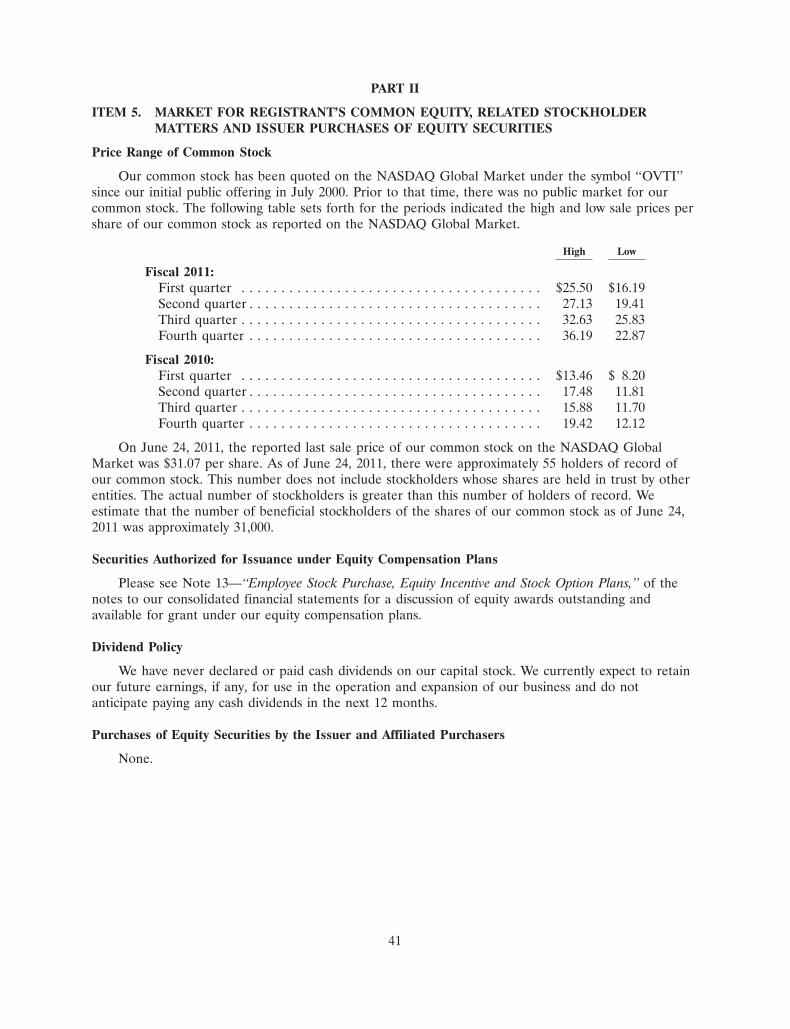
PART II
ITEM 5. MARKET FOR REGISTRANT’S COMMON EQUITY, RELATED STOCKHOLDERMATTERS AND ISSUER PURCHASES OF EQUITY SECURITIES
Price Range of Common Stock
Our common stock has been quoted on the NASDAQ Global Market under the symbol ‘‘OVTI’’since our initial public offering in July 2000. Prior to that time, there was no public market for ourcommon stock. The following table sets forth for the periods indicated the high and low sale prices pershare of our common stock as reported on the NASDAQ Global Market.
High Low
Fiscal 2011:First quarter . . . . . . . . . . . . . . . . . . . . . . . . . . . . . . . . . . . . . . $25.50 $16.19Second quarter . . . . . . . . . . . . . . . . . . . . . . . . . . . . . . . . . . . . . 27.13 19.41Third quarter . . . . . . . . . . . . . . . . . . . . . . . . . . . . . . . . . . . . . . 32.63 25.83Fourth quarter . . . . . . . . . . . . . . . . . . . . . . . . . . . . . . . . . . . . . 36.19 22.87
Fiscal 2010:First quarter . . . . . . . . . . . . . . . . . . . . . . . . . . . . . . . . . . . . . . $13.46 $ 8.20Second quarter . . . . . . . . . . . . . . . . . . . . . . . . . . . . . . . . . . . . . 17.48 11.81Third quarter . . . . . . . . . . . . . . . . . . . . . . . . . . . . . . . . . . . . . . 15.88 11.70Fourth quarter . . . . . . . . . . . . . . . . . . . . . . . . . . . . . . . . . . . . . 19.42 12.12
On June 24, 2011, the reported last sale price of our common stock on the NASDAQ GlobalMarket was $31.07 per share. As of June 24, 2011, there were approximately 55 holders of record ofour common stock. This number does not include stockholders whose shares are held in trust by otherentities. The actual number of stockholders is greater than this number of holders of record. Weestimate that the number of beneficial stockholders of the shares of our common stock as of June 24,2011 was approximately 31,000.
Securities Authorized for Issuance under Equity Compensation Plans
Please see Note 13—‘‘Employee Stock Purchase, Equity Incentive and Stock Option Plans,’’ of thenotes to our consolidated financial statements for a discussion of equity awards outstanding andavailable for grant under our equity compensation plans.
Dividend Policy
We have never declared or paid cash dividends on our capital stock. We currently expect to retainour future earnings, if any, for use in the operation and expansion of our business and do notanticipate paying any cash dividends in the next 12 months.
Purchases of Equity Securities by the Issuer and Affiliated Purchasers
None.
41

28JUN201100331646
Performance Graph
Notwithstanding any statement to the contrary in any of our previous or future filings with theSEC, the following information relating to the price performance of our common stock shall not bedeemed ‘‘filed’’ with the SEC or ‘‘Soliciting Material’’ under the Securities Exchange Act of 1934, asamended, or subject to Regulation 14A or 14C, or to liabilities of Section 18 of the Exchange Actexcept to the extent we specifically request that such information be treated as soliciting material or tothe extent we specifically incorporate this information by reference.
The following is a line graph comparing the cumulative total return to stockholders of ourcommon stock at April 30, 2011 since April 30, 2006, to the cumulative total return over such period of(i) The NASDAQ Composite Index and (ii) the S&P Semiconductors Index.
COMPARISON OF 5 YEAR CUMULATIVE TOTAL RETURN*Among OmniVision Technologies, Inc., the NASDAQ Composite Index
and the S&P Semiconductors Index
$0
$20
$40
$60
$80
$100
$120
$140
4/06 4/07 4/08 4/09 4/10 4/11
OmniVision Technologies, Inc. NASDAQ Composite S&P Semiconductors
*$100 invested on 4/30/06 in stock or index, including reinvestment of dividends. Fiscal yearsended April 30.
4/06 4/07 4/08 4/09 4/10 4/11
OmniVision Technologies, Inc. . . . . . . . . . . . . . . . 100.00 46.54 55.22 32.74 60.44 115.63NASDAQ Composite . . . . . . . . . . . . . . . . . . . . . . 100.00 111.24 107.01 75.98 109.83 129.57S&P Semiconductors . . . . . . . . . . . . . . . . . . . . . . 100.00 98.63 91.26 64.39 96.10 113.03
* Assumes that $100.00 was invested on April 30, 2006 in our common stock and in the NASDAQComposite Index and the S&P Semiconductor Index, and that all dividends were reinvested. Nodividends have been declared on our common stock. Stockholder returns over the indicated periodshould not be considered indicative of future stockholder returns.
42

ITEM 6. SELECTED FINANCIAL DATAYear Ended April 30,
2011 2010 2009(1) 2008(1)(2) 2007(1)(3)
(in thousands, except per share data)
Consolidated Statements of Operations data:Revenues . . . . . . . . . . . . . . . . . . . . . . . . . . . . $956,476 $602,991 $507,316 $799,628 $528,143Cost of revenues . . . . . . . . . . . . . . . . . . . . . . 678,459 457,646 389,434 593,377 372,776
Gross profit . . . . . . . . . . . . . . . . . . . . . . . . 278,017 145,345 117,882 206,251 155,367
Operating expenses:Research, development and related . . . . . . . 88,519 77,311 84,881 79,369 67,570Selling, general and administrative . . . . . . . . 62,817 61,549 62,585 62,228 58,674Amortization of acquired patent portfolio . . 774 — — — —Goodwill impairment . . . . . . . . . . . . . . . . . — — 7,541 — —Litigation settlement, net of recovery of
$13,000 . . . . . . . . . . . . . . . . . . . . . . . . . . — — — — 3,300
Total operating expenses . . . . . . . . . . . . . 152,110 138,860 155,007 141,597 129,544
Income (loss) from operations . . . . . . . . . . . . 125,907 6,485 (37,125) 64,654 25,823Interest income (expense), net . . . . . . . . . . . . (1,150) (774) 2,069 12,128 14,580Other income (expense), net . . . . . . . . . . . . . . 3,918 4,575 (3,171) (691) (1,285)
Income (loss) before income taxes . . . . . . . . . . 128,675 10,286 (38,227) 76,091 39,118Provision for (benefit from) income taxes . . . . 4,225 3,883 (158) 11,049 9,392
Net income (loss) . . . . . . . . . . . . . . . . . . . . . . 124,450 6,403 (38,069) 65,042 29,726Net income (loss) attributable to
noncontrolling interest . . . . . . . . . . . . . . . . (32) (321) (746) (33) 5,753
Net income (loss) attributable to OmniVisionTechnologies, Inc. . . . . . . . . . . . . . . . . . . . . $124,482 $ 6,724 $(37,323) $ 65,075 $ 23,973
Net income (loss) per share attributable toOmniVision Technologies, Inc. commonstockholders:Basic . . . . . . . . . . . . . . . . . . . . . . . . . . . . . $ 2.25 $ 0.13 $ (0.74) $ 1.20 $ 0.44
Diluted . . . . . . . . . . . . . . . . . . . . . . . . . . . $ 2.11 $ 0.13 $ (0.74) $ 1.19 $ 0.43
Shares used in computing net income (loss)per share attributable to OmniVisionTechnologies, Inc. common stockholders:Basic . . . . . . . . . . . . . . . . . . . . . . . . . . . . . 55,324 51,080 50,523 54,401 54,706
Diluted . . . . . . . . . . . . . . . . . . . . . . . . . . . 59,106 52,689 50,523 54,767 55,234
43

April 30,
2011 2010 2009 2008 2007
(in thousands)
Consolidated Balance Sheet data:Cash and cash equivalents . . . . . . . . . . . . . . $ 379,379 $234,023 $257,808 $217,340 $190,878Working capital . . . . . . . . . . . . . . . . . . . . . . 582,052 433,262 380,303 413,696 357,027Total assets . . . . . . . . . . . . . . . . . . . . . . . . . 1,034,158 797,693 666,931 718,346 688,059Total current liabilities . . . . . . . . . . . . . . . . . 148,919 119,940 52,351 86,355 158,685Long-term income taxes payable . . . . . . . . . . 87,526 90,626 81,266 78,031 —Non-current portion of long-term debt . . . . . 41,916 45,428 32,867 32,830 27,576Retained earnings . . . . . . . . . . . . . . . . . . . . 394,735 270,253 263,529 300,852 240,084Total OmniVision Technologies, Inc.
stockholders’ equity(1) . . . . . . . . . . . . . . . $ 751,325 $533,582 $488,841 $509,731 $490,456
(1) On May 1, 2009, we adopted the provisions of authoritative guidance for noncontrolling interests.All prior periods have been retrospectively adjusted due to the adoption.
(2) On May 1, 2007, we adopted the provisions of authoritative guidance to account for uncertainty inincome taxes.
(3) On May 1, 2006, we adopted the provisions of authoritative guidance for recording stock-basedcompensation.
44
ITEM 7. MANAGEMENT’S DISCUSSION AND ANALYSIS OF FINANCIAL CONDITION ANDRESULTS OF OPERATIONS
The following information should be read in conjunction with our audited consolidated financialstatements and the notes thereto included in Item 8 of this Annual Report on Form 10-K.
Overview
We design, develop and market high performance, highly integrated and cost-efficientsemiconductor image-sensor devices. Our main products, image-sensing devices which we refer to asCameraChip image sensors, capture an image electronically and are used in a number of consumer andcommercial mass-market applications. Our CameraChip image sensors are manufactured using theCMOS fabrication process and are predominantly single-chip solutions that integrate several distinctfunctions including image capture, image processing, color processing, signal conversion and output of afully processed image or video stream. We have also integrated our image sensors with wafer-leveloptics, which we refer to as CameraCube imaging devices. Our CameraCube imaging device is a smallfootprint, total camera solution that we believe will enable the further miniaturization of cameraproducts. We believe that our highly integrated image sensors and imaging devices enable cameradevice manufacturers to build high quality camera products that are smaller, less complex, morereliable, more cost-effective and more power-efficient than cameras using traditional CCDs.
Current Economic Environment
We operate in a challenging economic environment that has undergone significant changes intechnology and in patterns of global trade. We remain a leader in the development and marketing ofimage sensing devices based on the CMOS fabrication process and have benefited from the growingmarket demand for and acceptance of this technology.
Beginning with the second half of our fiscal 2009, general domestic and global economic conditionswere negatively impacted by several factors. These economic conditions resulted in our facing one ofthe most challenging periods in our history.
During the latter part of fiscal 2010 and throughout fiscal 2011, we saw indications that suggestcertain major economies are returning to positive growth. Our quarterly sales improved throughoutfiscal 2011 as compared to fiscal 2010 and fiscal 2009. We believe that demand for our products willcontinue to remain strong for fiscal 2012. However, it is uncertain whether the current resumption ofeconomic growth will be sustained. If the economic recovery slows down or even dissipates, ourbusiness, financial condition, results of operations and cash flows could be materially and adverselyaffected.
Market Environment
We sell our products worldwide directly to OEMs which include branded customers and contractmanufacturers, and VARs and indirectly through distributors. In order to ensure that we address allavailable markets for our image sensors, we organize our marketing efforts into end-use market groups,each of which concentrates on a particular product or, in some cases, customer within a product group.Thus we have marketing teams that address the mobile phone market, the notebook and webcammarket, the DSC market, the security and surveillance market, the entertainment market, and theautomotive and medical markets.
In the mobile phone market in particular, future revenues depend to a large extent on design winswhere, on the basis of an exhaustive evaluation of available products, a particular mobile phone makerdetermines which image sensor to design into one or more specific models. The time lag between
45

ITEM 7. MANAGEMENT’S DISCUSSION AND ANALYSIS OF FINANCIAL CONDITION ANDRESULTS OF OPERATIONS—(Continued)
design win and volume shipments varies from as little as three months to as much as 12 months, whichcould cause an unexpected delay in generating revenues, especially during periods of producttransitions. Design wins are also an important driver in the many other markets that we address, and insome cases, such as automotive or medical applications, the time lag between a particular design winand revenue generation can be longer than one year.
The overwhelming majority of our sales depend on decisions by the engineering designers formanufacturers of products that incorporate image sensors to specify one of our products rather thanone made by a competitor. In most cases, the decision to specify a particular image sensor requiresconforming other specifications of the product to the chosen image sensor and makes subsequentchanges both difficult and expensive. Accordingly, the ability to timely produce and deliver reliableproducts in large quantities is a key competitive differentiator. Since our inception, we have shippedmore than 2.5 billion image sensors, including approximately 680 million in fiscal 2011. We believe thatthese quantities demonstrate the continuing capabilities of our production system, including our sourcesof offshore fabrication.
We outsource the wafer fabrication and packaging of our image-sensor products to third parties.We outsource the color filter and micro-lens phases of production to an investee joint venturecompany. With our CameraCube products, we also collaborated with the industry’s leading wafer-levellens suppliers, and outsourced the assembly process. This approach allows us to focus our resources onthe design, development, marketing and testing of our products and significantly reduces our capitalrequirements.
To increase and enhance our production capabilities, we work closely with TSMC, our principalwafer supplier and one of the largest wafer fabrication companies in the world, to increase, asnecessary, the number of its fabrication facilities at which our products can be produced. VisEra, ourjoint venture with TSMC, and our investments in three key back-end packaging suppliers are part of abroad strategy to ensure that we have sufficient back-end capacity for the processing of our imagesensors in the various formats required by our customers.
We currently perform the final testing of the majority of our products at our own facility in China.As necessary, we will make further investments to expand our testing and production capacity, as wellas our overall capability to design additional custom products for our customers.
Since our end-user customers market and sell their products worldwide, our revenues bygeographic location are not necessarily indicative of the geographic distribution of end-user sales, butrather indicate where the products and/or their components are manufactured or sourced. Therevenues we report by geography are based on the country or region in which our customers issue theirpurchase orders to us.
Many of the products using our image sensors, such as mobile phones, notebook and webcams,DSCs and cameras for entertainment applications, are consumer electronics goods. These mass-marketcamera devices generally have seasonal cycles which historically have caused the sales of our customersto fluctuate quarter-to-quarter. In addition, since a very large number of the manufacturers who useour products are located in China, Hong Kong and Taiwan, the pattern of demand for our imagesensors has been increasingly influenced by the timing of the extended lunar or Chinese New Yearholiday, a period in which the factories which use our image sensors generally close. Consequently,demand for our image sensors has historically been stronger in the second and third quarters of ourfiscal year and weaker in the first and fourth quarters of our fiscal year. However, due to the globaleconomic downturn, we experienced weaker than normal conditions in all of our markets in the third
46

ITEM 7. MANAGEMENT’S DISCUSSION AND ANALYSIS OF FINANCIAL CONDITION ANDRESULTS OF OPERATIONS—(Continued)
and fourth quarters of fiscal 2009. With the return to profitability in our business since the secondfiscal quarter of 2010, we believe the historical seasonal cycle to our business has returned.
We believe that the market opportunity represented by mobile phones remains very large, althoughthe opportunities presented could be deferred because of the uncertainty surrounding the sustainabilityof the current global economic recovery. We also believe that, like the DSC market, mobile phone,notebook, tablet and webcam demand will not only continue to shift toward higher resolutions, but alsowill increasingly fragment into multiple market segments with differing product attributes. For example,we see the further expansion of the smartphone segment within the mobile phone market. In addition,there is increased demand for customization, and several different interface standards are coming tomaturity. All of these trends will require the development of an increasing variety of products.
As the markets for image sensors have grown, we have experienced competition frommanufacturers of CMOS and CCD image sensors. Our principal competitors in the market for CMOSimage sensors include Aptina Imaging, Samsung, Sharp, Sony, STMicroelectronics and Toshiba. Weexpect to see continued price competition in the image-sensor market for mobile phones, notebooksand webcams, security and surveillance systems, digital still and video cameras, entertainment devices,automotive and medical imaging systems as those markets continue to grow. Although we believe thatwe currently compete effectively in those markets, our competitive position could be impaired bycompanies that have greater financial, technical, marketing, manufacturing and distribution resources,broader product lines, better access to large customer bases, greater name recognition, longer operatinghistories and more established strategic and financial relationships than we do. Such companies may beable to adapt more quickly to new or emerging technologies and customer requirements or devotegreater resources to the promotion and sale of their products. Many of these competitors own andoperate their own fabrication facilities, which in certain circumstances may give them the ability toprice their products more aggressively than we can or may allow them to respond more rapidly than wecan to changing market opportunities.
In addition, from time to time, other companies enter the CMOS image-sensor market by usingobsolete and available manufacturing equipment. While these efforts have rarely had any long-termsuccess, the new entrants do sometimes manage to gain market share in the short-term by pricing theirproducts significantly below current market levels which puts additional downward pressure on theprices we can obtain for our products.
In common with many other semiconductor products and as a response to competitive pressures,the ASPs of image-sensor products have declined steadily since their introduction, and we expect ASPsto continue to decline in the future. Some of this ASP decline may be offset by the adoption of someof our newer and higher resolution products. We introduced our CameraCube products in February2009. Depending on the adoption rate and unit volume, we believe these products may also mitigatethe rate of ASP decline. In order to maintain our gross margins, we and our suppliers must workcontinuously to lower our manufacturing costs and increase our production yields, and in order tomaintain or grow our revenues, we need to increase the number of units we sell by a large enoughamount to offset the effect of declining ASPs. In addition, if we are unable to timely introduce newproducts that can take advantage of smaller process geometries or new products that incorporate moreadvanced technology and include more advanced features that can be sold at higher ASPs, our grossmargin may decline.
Recently, the entire semiconductor industry, including us, has experienced supply constraints. Dueto the lack of availability of products, supply constraints have forced companies in the industry to beunable to meet the product demands of their customers and to take certain actions such as allocating
47

ITEM 7. MANAGEMENT’S DISCUSSION AND ANALYSIS OF FINANCIAL CONDITION ANDRESULTS OF OPERATIONS—(Continued)
available products among their customers or, in some cases, increasing the prices of their products.This results in harm to customer relations, the loss of sales to customers and, in some cases, the loss offuture business with those customers. We have faced, and continue to face, these same challenges as weseek to meet our customers’ increasing demand for more of our products. Despite these challenges,through careful strategic planning relating to our products and the technologies that we deliver tomarket, we have been able to achieve revenue growth and unit growth. However, if our customers’demand remains at current levels or continues to increase, we will experience even greater challengesrelated to supply constraints and may be unable to achieve future growth, which could result in ourrevenues, gross margins and other financial results being materially and adversely affected.
Given the rapidly changing nature of our technology, there can be no assurance that we will notencounter delays or other unexpected yield issues with future products. During the early stages ofproduction, production yields and gross margins for new products are typically lower than those ofestablished products. We can encounter unexpected manufacturing issues, such as unexpected back-endyield problems. In addition, in preparation for new product introductions, we gradually decreaseproduction of established products. Due to our 12-14 week production cycle, it is extremely difficult topredict precisely how many units of established products we will need. It is also difficult to accuratelypredict the speed of the ramp of new products. Given the current economic uncertainty, the visibility ofour business outlook is extremely limited and forecasting is even more difficult than under normalmarket conditions. As a result, it is possible that we could suffer from shortages of certain products andbuild inventories in excess of demand for other products. We carefully consider the risk that ourinventories may be in excess of expected future demand and record appropriate reserves. If, assometimes happens, we are subsequently able to sell these reserved products, the sales have little or noassociated cost and consequently, they have a favorable impact on gross margins.
Strategy
Our strategic goal is to provide and deliver improved image-centric technologies and solutions toour customers, and to develop and make available a full range of innovative and cross-functionalimaging products to all the markets. The most important elements of our strategy are the following:
Maintain Technology Leadership. We intend to maintain our position as a leader in CMOS image-sensor technology by continuing to develop our expertise in mixed-signal implementation, advancedpixel design, feature integration, and manufacturing processes and controls, including automatedtesting. Our image sensor integrates both the image sensor and the signal processor into a single chip,often eliminating the requirement for a separate DSP. As a result, our CameraChip image sensors offercamera device manufacturers advantages in terms of size, power consumption, cost and ease of design.For example, in May 2008, we announced our OmniBSI architecture, which is the enabling technologybehind our current 1.4 �m pixel. In February 2010, we announced our OmniBSI-2 architecture, whichforms the basis of our even smaller and more advanced 1.1 �m pixel. We are continuing to developproducts using still narrower geometries. We have successfully developed image sensor technology from100,000 pixels to 14.6 megapixels, underscoring our ability to deliver a wide range of solutions toaddress changing market demands. We are committed to continue increasing image quality and toreducing the overall size of the image sensor’s array.
The OmniBSI and OmniBSI-2 architectures are based on BSI technology. All traditionallydesigned CMOS image sensors capture light on the front side of the chip, so the photo-sensitiveportion has to share the surface of the sensor with the metal wiring of the transistors in the pixel. Withour OmniBSI and OmniBSI-2 architectures, the sensor receives light through the back side of the chip.
48

ITEM 7. MANAGEMENT’S DISCUSSION AND ANALYSIS OF FINANCIAL CONDITION ANDRESULTS OF OPERATIONS—(Continued)
Not only does this enable us to produce a superior image, it also permits the front of chip surface areato be devoted entirely to processing, and permits an increase in the number of metal layers, both ofwhich result in greater functionality. Another advantage of capturing light on the back side of theimage sensor is that we reduce the distance the light has to travel to the pixels, and thus provide awider angle of light acceptance. Widening the angle of acceptance in turn makes it possible to reducethe height of the camera module, and thus the height of the device which incorporates the camera.
Our introduction of wafer-level optics to our product offerings is another example of our intentionto continue to develop new and innovative technologies. Our CameraCube technology is a three-dimensional, reflowable, total camera solution that combines the full functionality of our image sensorswith wafer-level optics in one compact, small-footprint package. We recently entered into an agreementwith VisEra to acquire from VisEra its wafer-level lens production operations to enhance ourCameraCube production capabilities.
Our commitment to maintaining our technology leadership is also reflected in our acquisition of aCMOS sensor patent portfolio from Kodak in March 2011. We effectively doubled the size of ourpatent portfolio. As of April 30, 2011, we have been issued 401 United States patents and 430 foreignpatents.
Leverage Expertise Across Multiple Mass-Market Applications. We intend to continue to focus ondeveloping our image sensors for multiple mass-market applications. To date we have shipped morethan two billion image sensors. As the demand for camera functionality increases in our principalmarkets and becomes a standard feature in a wider variety of consumer, commercial and industrialapplications, we expect that additional markets will emerge. In the past, we have leveraged ourexpertise in certain end-markets to expand into emerging mass-market applications for our imagesensors. For example, we used the expertise we developed in mobile phone markets to develop imagesensors for notebook computers. Other markets and applications we are focusing on include securityand surveillance, entertainment devices, and the multiple opportunities in automotive and medicalapplications.
Increase Our Market Presence. We intend to increase our visibility and penetration into newproduct designs by collaborating with OEMs, VARs and distributors and by entering into partnershipswith other companies that offer complementary and supporting technologies. In certain instances wewill provide design services to our contract manufacturing partners, enabling them to increase theiroverall value added through the production of highly tailored end products, which we believe willincrease the likelihood that they will recommend the use of our products to branded manufacturers. Inaddition, we will partner with companies that offer complementary and supporting technologies tointegrate our products with theirs for use in the reference designs that they promote to manufacturers.As a result, we believe that we are able to provide our customers with valuable design and marketingreferences. We also see a developing trend for video-centric applications in the consumer markets.Consequently, we acquired Aurora and its advanced image projection technology, which we believe wecan leverage to offer innovative and comprehensive imaging solutions to OEMs as they design theirnext generation products.
Further Develop Close Customer Relationships. We intend to enhance our customer relationshipsby continuing to collaborate with our customers on the design and specification of their products. Wework with customers during various stages of their product development cycles, including strategicdecision-making, new product design and replacement design to help them develop a logical technologymigration path and to ensure that our products meet their future design needs. By working closely with
49

ITEM 7. MANAGEMENT’S DISCUSSION AND ANALYSIS OF FINANCIAL CONDITION ANDRESULTS OF OPERATIONS—(Continued)
our customers, we believe we can better anticipate their future design needs and increase the likelihoodthat they will incorporate our image sensors into their products.
Our Solution
We specifically design our highly integrated image sensors to be cost-effective and to provide highimage quality. By integrating a number of distinct functions onto a single CMOS chip, including imagecapture, image processing, color processing, signal conversion and output of images for either digital oranalog equipment, our image sensors offer camera device manufacturers a number of benefits,including:
High Image Quality and Resolution. We have developed a number of proprietary methods forenhancing image quality by increasing our image sensors’ sensitivity to light and significantly improvingtheir signal to noise ratio. These methods allow us to reduce the size of each individual pixel andthereby increase the number of pixels in an image sensor of a given size. The result is a currentportfolio of several high resolution image sensors ranging up to a 14.6-megapixel product. In addition,we are able to produce image sensors at lower resolutions with smaller pixel arrays, which serve toreduce the overall cost of the image sensor and its supporting components, such as lenses.
Lower Cost. The highly integrated design of our image sensor enables us to deliver image sensorsto our customers at a cost which makes the cameras they are part of increasingly less expensive. Thiscost saving is driven, in large part, by our ability to achieve a high level of functionality in a single chipwhile continually reducing the overall size of the device. Similarly, we believe our CameraCube imagingdevices, as compact total camera solutions that can be reflowed onto circuit boards directly, canstreamline the camera device manufacturers process, yielding further cost savings to our customers.
Accelerated Time to Market. The highly integrated nature of our image sensor simplifies thedesign of cameras and allows our customers to shorten their product design cycles. We believe ourCameraCube devices further shorten the design cycle by offering a complete imaging solution from thevery beginning. These factors provide our mobile phone and consumer electronics customers withcritical competitive advantages, as time to market is typically a major determinant of product successand longevity. We also work closely with our customers to accelerate product development cycles byproviding camera reference designs, engineering design review services and customer productevaluation, testing and debugging services. In addition, we have designed our manufacturing andproduction processes to allow us to quickly ramp production volumes to meet increased customerdemand, which is particularly important in the high volume markets in which we participate.
Streamlined Manufacturing and Production. Our image sensors are well suited for production usingthe relatively simple, low cost and large-scale wafer fabrication processes developed for othersemiconductor products that use the CMOS process. We work closely with our foundry partners andwith all the other providers of the manufacturing services we require to produce our final products torefine their processes in order to optimize image sensor performance and yields.
Ease of Use. Our single-chip CMOS design outputs video in industry standard formats directlyfrom the chip. These formats include the National Television System Committee, or NTSC, formatand/or the Phase Alternating Line, or PAL, format for analog video. For digital video, our sensorsoutput unprocessed data called RGB and/or a standard signal color encoding system known as YUV.As a result, our image sensors can be quickly and easily integrated into products targeted at numerousmass-markets.
50

ITEM 7. MANAGEMENT’S DISCUSSION AND ANALYSIS OF FINANCIAL CONDITION ANDRESULTS OF OPERATIONS—(Continued)
Capital Resources
As of April 30, 2011, we held approximately $379.4 million in cash and cash equivalents andapproximately $87.5 million in short-term investments. To mitigate market risk related to short-terminvestments, we have an investment policy designed to preserve the value of capital and to generateinterest income from these investments without material exposure to market fluctuations. Market risk isthe potential loss due to the change in value of a financial instrument as a result of changes in interestrates or bond prices, and changes in market liquidity and in the pricing of risk. Our policy is to investin financial instruments with short maturities, limiting interest rate exposure, and to measureperformance against comparable benchmarks. We maintain our portfolio of cash equivalents andshort-term investments in a variety of securities, including both government and corporate obligationswith ratings of ‘‘A’’ or better and money market funds. We do not believe that the value of our cashand short-term investments will be significantly affected by current instability in the global financialmarkets.
Sources of Revenues
We generate almost all our revenue by selling our products directly to OEMs and VARs andindirectly through distributors. For accounting purposes, we treat sales to OEMs and VARs as onesource of revenue, and sales to distributors as another and our revenue recognition policies for the twogroups are different. See ‘‘Critical Accounting Policies and Estimates—Revenue Recognition’’ below foradditional information regarding recognition of revenue.
Critical Accounting Policies and Estimates
The preparation of financial statements in conformity with accounting principles generally acceptedin the United States requires management to make estimates and assumptions that affect the reportedamounts of assets and liabilities and disclosure of contingent assets and liabilities at the date of thefinancial statements and the reported amounts of revenues and expenses during the reporting period.By their nature, these estimates and judgments are subject to an inherent degree of uncertainty. On anongoing basis we re-evaluate our judgments and estimates including those related to product returns,bad debts, inventories, long-lived assets, income taxes, litigation and contingencies. We base ourestimates and judgments on our historical experience, knowledge of current conditions and our beliefsof what could occur in the future considering available information. Actual results could differ fromthose estimates, and material effects on our operating results and financial position may result. Oursignificant accounting policies are more fully described in Note 2—‘‘Summary of Significant AccountingPolicies’’ to the consolidated financial statements included in this Annual Report on Form 10-K. Ourestimates reflect the following critical accounting policies:
Revenue Recognition
For shipments to customers without agreements that allow for returns or credits, principallyOEMs and VARs, we recognize revenue using the ‘‘sell-in’’ method. Under this method, we recognizerevenue when title passes to the customer provided that we have received a signed purchase order, theprice is fixed or determinable, title and risk of loss has transferred to the customer, collection ofresulting receivables is considered reasonably assured, product returns are reasonably estimable, thereare no customer acceptance requirements and there are no remaining material obligations. We providefor future returns of potentially defective products based on historical experience at the time werecognize revenue. For cash consideration given to customers that is primarily in the form of rebates,
51

ITEM 7. MANAGEMENT’S DISCUSSION AND ANALYSIS OF FINANCIAL CONDITION ANDRESULTS OF OPERATIONS—(Continued)
and for which we do not receive a separately identifiable benefit or cannot reasonably estimate fairvalue, we record the amounts as reductions of revenue.
For shipment of products sold to distributors under agreements allowing for returns or credits, titleand the risk of ownership to the products transfer to the distributor upon shipment, and the distributoris obligated to pay for the products whether or not the distributor has sold them at the time payment isdue. Under the terms of our agreements with such distributors and subject to our prior approval,distributors are entitled to reclaim from us as price adjustments the difference, if any, between theprices at which we sold the product to the distributors and the prices at which the product issubsequently sold by the distributor. In addition, distributors have limited rights to return inventory thatthey determine is in excess of their requirements, and accordingly, in determining the appropriate levelof provision for excess and obsolete inventory, we take into account the inventories held by ourdistributors. For these reasons, prices and revenues are not fixed or determinable until the distributorresells the products to our end-user customers and the distributor notifies us in writing of the details ofsuch sales transactions. Accordingly, we recognize revenue using the ‘‘sell-through’’ method. Under the‘‘sell-through’’ method, we defer the revenue, adjustments to revenue and the related costs of revenueuntil the final resale of such products to end customers. The amounts billed to these distributors andadjustments to revenue and the cost of inventory shipped to, but not yet sold by, the distributors areshown net on the Consolidated Balance Sheets as ‘‘Deferred revenues, less cost of revenues.’’
In order to determine whether collection is probable, we assess a number of factors, including ourpast transaction history with the customer and the creditworthiness of the customer. If we determinethat collection is not reasonably assured, we defer the recognition of revenue until collection becomesreasonably assured or upon receipt of payment.
Allowance for Doubtful Accounts
We undertake credit evaluations for all major sale transactions before we release product forshipment. Normal payment terms apply upon transfer of risk of loss. On an ongoing basis, we analyzethe payment history of customer accounts, including recent customer purchases. We evaluate aged itemsin accounts receivable and provide allowances for doubtful accounts. Customer creditworthiness andeconomic conditions may change and increase the risk of collectibility and may require additionalallowances, which would negatively impact our operating results. As of April 30, 2011 and 2010, ourallowance for doubtful accounts represented approximately 1.2% and 0.9%, respectively, of totalaccounts receivable.
Allowance for Sales Returns and Warranties
Based on historical sales returns and other known factors, we provide for estimated sales returns inthe same period we record the related revenues. To estimate our allowance for sales returns, weanalyze potential customer-specific product application issues, potential quality and reliability issues andhistorical returns. We evaluate quarterly the adequacy of the allowance for sales returns. This allowanceis reflected as a reduction to accounts receivable in our consolidated balance sheets. Increases to theallowance are recorded as a reduction to net revenues. Because the allowance for sales returns is basedon our judgments and estimates, particularly as to product application, quality and reliability issues, ourallowances may not be adequate to cover actual sales returns and other allowances. If our allowancesare not adequate, our net revenues could be adversely affected. We warrant to our customers that ourproducts will work in accordance with each product’s specifications. Due to the cost and othercomplexities associated with rectifying any product defects, we do not repair any defective products. If
52

ITEM 7. MANAGEMENT’S DISCUSSION AND ANALYSIS OF FINANCIAL CONDITION ANDRESULTS OF OPERATIONS—(Continued)
a product is defective, the customer notifies us and, with our approval, returns the defective product.We then send replacement products to the customer. Accordingly, we account for any exposure relatedto defective products as a portion of our allowance for sales returns. The net change in our allowancefor sales returns balance in fiscal 2011 was approximately 0.1% of revenues, and the allowance wasapproximately 1.6% of total accounts receivable at April 30, 2011.
Excess and Obsolete Inventory and Effect on Gross Margin
We regularly monitor inventory quantities on hand and record provisions for excess and obsoleteinventories based primarily on historical usage rates and our forecast of future demand for ourproducts. We record provisions for the cost of inventories when the number of units on hand exceedsthe number of units that we forecast will be sold over a certain period of time, generally 12 months.When we recognize the provisions, a new, lower-cost basis for that inventory is established, andsubsequent changes in facts and circumstances do not result in the restoration of or increase in thatnewly established cost basis.
We may subsequently sell some of these excess and obsolete inventories. Even though we may sellthese products at a price that was less than our original cost, sales of these products improve ourcurrent period gross margins because the inventory was previously written down.
We attempt to control our inventory levels so that we do not hold inventories in excess of demandfor the succeeding three months. However, because we need to place non-cancelable orders withsignificant lead time and because it is difficult to estimate product demand, it is possible that we willbuild inventories in excess of demand for future periods. If we have inventories in excess of estimatedproduct demand, we will record a provision, which could have a material adverse effect on ourreported results of operations and financial position. In preparation for new product introductions, wegradually decrease production of established products, while preparing for production of newerproducts. Given our 12-14 week production cycle, it is extremely difficult to predict precisely how manyunits of established products we need. It is also difficult to accurately predict the speed of the ramp ofnew products or the projected life cycles of new products which have continued to shorten in duration.Under these circumstances, it is possible that we could suffer from shortages of certain products andalso build inventories in excess of demand for other products.
Stock-Based Compensation Expense
The authoritative guidance for stock-based compensation requires all share-based payments toemployees, including grants of employee stock options and employee stock purchases under ouremployee stock purchase plan, to be recognized in our financial statements based on their respectivegrant date fair values. We use the Black-Scholes option pricing model to estimate the fair value of ourshare-based payment awards. The Black-Scholes option pricing model requires the use of highlysubjective and complex assumptions, including our stock price, expected volatility, expected term,risk-free interest rate and expected dividend yield. For expected volatility, we use an average betweenthe historical volatility of our common stock, and the implied volatility of traded options on ourcommon stock. The expected term of the awards is based on historical data regarding our employees’option exercise behaviors. The risk-free interest rate assumption is based on observed interest ratesappropriate for the terms of our awards. The dividend yield assumption is based on our history andexpectation of dividend payouts. In addition to the requirement for fair value estimates, authoritativeguidance for stock-based compensation also requires the recording of expense that is net of ananticipated forfeiture rate. Only expenses associated with awards that are ultimately expected to vestare included in our financial statements. Our forfeiture rate is determined based on our historicaloption cancellation experience.
53

ITEM 7. MANAGEMENT’S DISCUSSION AND ANALYSIS OF FINANCIAL CONDITION ANDRESULTS OF OPERATIONS—(Continued)
We evaluate the Black-Scholes assumptions that we use to value our awards on a quarterly basis.With respect to the forfeiture rate, we will revise the rate, if necessary, in subsequent periods if actualforfeitures differ from our estimates. If factors change and we employ different assumptions, stock-based compensation expense related to future stock-based payments may differ significantly fromestimates recorded in prior periods.
We elected to use the long-form method to establish the beginning balance of, and to determinethe subsequent impact on, the additional paid-in capital pool. For the tax effects of share-basedpayment awards, we use the ‘‘with and without’’ approach in determining the order in which taxattributes are utilized. As a result, we will recognize a tax benefit from stock-based awards in additionalpaid-in capital only if an incremental tax benefit is realized after all other tax attributes currentlyavailable to us have been utilized. In addition, we account for the indirect effects of stock-based awardson other tax attributes, such as research and development tax credits, through the ConsolidatedStatements of Operations.
In September 2007, our stockholders approved the 2007 Equity Incentive Plan, or the 2007 Plan.See Note 13—‘‘Employee Stock Purchase, Equity Incentive and Stock Option Plans’’ to our consolidatedfinancial statements. The 2007 Plan allows the grant of, among other things, performance share awardsto employees. Under the authoritative guidance for stock-based compensation, when we record thestock-based compensation expense for such awards that carry performance contingencies, we have toestimate the probable outcome at the end of the performance period. Furthermore, we have to adjustthe cumulative compensation expense recorded when probable outcome for the performance-basedshares is subsequently updated for changes in facts and circumstances.
Valuation of Long-Lived Assets
Whenever events or changes in circumstances indicate that the carrying value of identifiableintangibles and long-lived assets, including property, plant and equipment and prepaid wafer credits,may not be recoverable, we assess whether the value of such asset or asset group has been impaired.Impairment evaluations involve management estimates of assets’ useful lives and future cash flows. Ifsuch events occur, we would estimate the undiscounted future cash flows expected to result from theuse of the asset and its eventual disposition. If the undiscounted expected future cash flows were lessthan the carrying amount of the asset, we would recognize an impairment loss. Actual useful lives andcash flows could be different from those estimated by our management. This could have a materialeffect on our operating results and financial position. Factors we consider important that could triggeran impairment review include the following:
• operating losses;
• significant negative industry trends;
• significant underutilization of the assets; and
• significant changes in how we use the assets or our plans for their use.
Valuation of Financial Instruments
The authoritative guidance for fair value measurements specifies a hierarchy of valuationtechniques based upon whether the inputs to those valuation techniques reflect assumptions othermarket participants would use based upon market data obtained from independent sources (observableinputs) or reflect our own assumption of market participant valuation (unobservable inputs).
54

ITEM 7. MANAGEMENT’S DISCUSSION AND ANALYSIS OF FINANCIAL CONDITION ANDRESULTS OF OPERATIONS—(Continued)
We use inputs such as quoted prices in active markets, broker/dealer quotes and other similar datafrom independent sources to determine the fair value of our financial assets and liabilities. For quotedprices from active markets, we do not make any material adjustments. For quoted prices in marketsthat are not active, or other observable and market-corroborated inputs, we review the inputs forreasonableness, and may further adjust the fair value based on market indices or other information thatmanagement deems material to the fair value estimates.
As of April 30, 2011, the fair value of our financial instruments measured at fair value on arecurring basis included $181.1 million of assets, and $3.9 million of liabilities. Of the $181.1 million ofassets, $80.6 million were classified as Level 1, most of which were investments in money market funds.The remaining $100.5 million of investments were classified as Level 2, representing investments indebt securities issued by the U.S. government and its agencies, and other corporate securities. The$3.9 million of liabilities were classified as Level 2, and consisted of interest rate swaps that we enteredinto in conjunction with a mortgage loan in fiscal 2007 and a term loan in fiscal 2009. The fair value ofthe interest rate swaps included the effect of our credit risk. We did not classify any financialinstruments as Level 3 under the fair value hierarchy.
Accounting for Income Taxes
In accordance with the authoritative guidance for income taxes, we make certain estimates andjudgments in determining the income tax expense for financial statement purposes. These estimates andjudgments occur in the calculation of tax credits, benefits, and deductions, and in the calculation ofcertain tax assets and liabilities, which arise from differences in the timing of recognition of revenueand expense for tax and financial statement purposes, as well as the interest and penalties relating tothese uncertain tax positions. Significant changes to these estimates may increase or decrease our taxprovision in a subsequent period. Similarly, for tax liabilities denominated in a currency other than theU.S. dollar, changes in the value of the denominated currency will increase or decrease our taxprovision in a subsequent period.
In addition, the calculation of our tax liabilities involves the assessment of uncertainties in theapplication of complex tax regulations. We recognize liabilities for uncertain tax positions based on atwo-step process. In the first step, recognition, we determine whether it is more-likely-than-not that atax position will be sustained upon examination, including resolution of any related appeals or litigationprocesses, based on the technical merits of the position. The second step addresses measurement of atax position that meets the more-likely-than-not criterion. The tax position is measured at the largestamount of benefit that has a greater than 50 percent likelihood of being realized upon ultimatesettlement. Because we are required to determine the probability of various possible outcomes, suchestimates are inherently difficult and subjective. We reevaluate these uncertain tax positions on aquarterly basis. This re-evaluation is based on factors including, but not limited to, changes in facts orcircumstances, and changes in tax law. A change in recognition or measurement would result either inthe recognition of a tax benefit or in an additional charge to the tax provision for the period.
We also have to assess the likelihood that we will be able to realize our deferred tax assets. Ifrealization is not likely, we are required to increase our provision for taxes by recording a valuationallowance against the deferred tax assets that we estimate we will not ultimately realize. We believethat we will ultimately realize a substantial majority of the deferred tax assets recorded on ourConsolidated Balance Sheets. However, should there be a change in our ability to realize our deferredtax assets, our tax provision would increase in the period in which we determined that it is more likelythan not that the benefit of our deferred tax assets will not be realized.
55

ITEM 7. MANAGEMENT’S DISCUSSION AND ANALYSIS OF FINANCIAL CONDITION ANDRESULTS OF OPERATIONS—(Continued)
As of April 30, 2011, we have recorded a valuation allowance of $8.1 million to offset Californiaresearch and development tax credit carryovers. We believe that it is more likely than not that we willnot realize these carryovers. In the future, if the credit is utilized and the valuation allowance isreleased, the release of valuation allowance will be accounted for as a reduction of the income taxexpense in the period such event occurs. For fiscal 2011, 2010 and 2009, our income tax provisionreflected effective tax rates of 3.3%, 37.8% and 0.4%, respectively. These rates are less than thecombined U.S. federal and state statutory rate of approximately 40% principally because we earn aportion of our profits in jurisdictions where tax rates are lower than the combined U.S. federal andstate statutory rate.
Litigation and Contingencies
From time to time, we have been subject to legal proceedings and claims with respect to suchmatters as patents and other actions arising out of the normal course of business, as well as othermatters identified in ‘‘Legal Proceedings’’ in Part I, Item 3 of this Annual Report.
It is possible that other companies might pursue litigation with respect to any claims suchcompanies purport to have against us. The results of any litigation are inherently uncertain. In theevent of an adverse result in any litigation with respect to intellectual property rights relevant to ourproducts that could arise in the future, we could be required to obtain licenses to the infringedtechnology, pay substantial damages under applicable law, including treble damages if we are held tohave willfully infringed, cease the manufacture, use and sale of infringing products or to expendsignificant resources to develop non-infringing technology. Litigation frequently involves substantialexpenditures and can require significant management attention, even if we ultimately prevail.
Given the uncertainties associated with litigation, if our assessments prove to be wrong, or ifadditional information becomes available such that we estimate that there is a probable loss orprobable range of loss associated with these contingencies, then we would record the minimumestimated liability, which could materially impact our results of operations, financial position or cashflows.
56

ITEM 7. MANAGEMENT’S DISCUSSION AND ANALYSIS OF FINANCIAL CONDITION ANDRESULTS OF OPERATIONS—(Continued)
Results of Operations
The following table sets forth the results of our operations as a percentage of revenues for theperiods indicated. Our historical operating results are not necessarily indicative of the results we canexpect for any future period.
Year Ended April 30,
2011 2010 2009
Revenues . . . . . . . . . . . . . . . . . . . . . . . . . . . . . . . . . . . . . . . . . . . . . . . . . . . . 100.0% 100.0% 100.0%Cost of revenues . . . . . . . . . . . . . . . . . . . . . . . . . . . . . . . . . . . . . . . . . . . . . . 70.9 75.9 76.8
Gross margin . . . . . . . . . . . . . . . . . . . . . . . . . . . . . . . . . . . . . . . . . . . . . . . 29.1 24.1 23.2
Operating expenses:Research, development and related . . . . . . . . . . . . . . . . . . . . . . . . . . . . . . . 9.2 12.8 16.7Selling, general and administrative . . . . . . . . . . . . . . . . . . . . . . . . . . . . . . . . 6.6 10.2 12.3Goodwill impairment . . . . . . . . . . . . . . . . . . . . . . . . . . . . . . . . . . . . . . . . . — — 1.5Amortization of acquired patent portfolio . . . . . . . . . . . . . . . . . . . . . . . . . . 0.1 — —
Total operating expenses . . . . . . . . . . . . . . . . . . . . . . . . . . . . . . . . . . . . . 15.9 23.0 30.5
Income (loss) from operations . . . . . . . . . . . . . . . . . . . . . . . . . . . . . . . . . . . . 13.2 1.1 (7.3)Interest income (expense), net . . . . . . . . . . . . . . . . . . . . . . . . . . . . . . . . . . . . (0.1) (0.1) 0.4Other income (expense), net . . . . . . . . . . . . . . . . . . . . . . . . . . . . . . . . . . . . . . 0.4 0.7 (0.6)
Income (loss) before income taxes . . . . . . . . . . . . . . . . . . . . . . . . . . . . . . . . . . 13.5 1.7 (7.5)Provision for (benefit from) income taxes . . . . . . . . . . . . . . . . . . . . . . . . . . . . 0.5 0.6 —
Net income (loss) . . . . . . . . . . . . . . . . . . . . . . . . . . . . . . . . . . . . . . . . . . . . . . 13.0 1.1 (7.5)Net loss attributable to noncontrolling interest . . . . . . . . . . . . . . . . . . . . . . . . . — — (0.1)
Net income (loss) attributable to OmniVision Technologies, Inc. . . . . . . . . . . . 13.0% 1.1% (7.4)%
Revenues
We derive substantially all of our revenues from the sale of our image-sensor products that areused in a wide variety of consumer and commercial mass-market applications including mobile phones,notebooks and personal computers, security and surveillance cameras, DSCs, entertainment devices,automotive and medical products. Revenues increased by 58.6% to $956.5 million in fiscal 2011 from$603.0 million in fiscal 2010. Revenues increased by 18.9% to $603.0 million in fiscal 2010 from$507.3 million in fiscal 2009. The increase in revenues in fiscal 2011 was primarily due to a 43.1%increase in unit sales of our image-sensor products, reflecting a continuing recovery in product demandfrom the prior year period and improvements in our product mix, which resulted in a 10.9% increase inASPs.
Revenues from Sales to OEMs and VARs as Compared to Distributors
We sell our image-sensor products either directly to OEMs and VARs or indirectly throughdistributors. The percentage of revenues from sales to OEMs and VARs was higher in fiscal 2011 thanin fiscal 2010 and fiscal 2009. We expect that the percentage of revenues from sales through OEMs andVARs will vary from year to year in response to changes in the composition of our customer list, andthat it may continue to represent a majority of our revenues. The gross margin that we earn on sales toOEMs and VARs or through distributors is not significantly different.
57

ITEM 7. MANAGEMENT’S DISCUSSION AND ANALYSIS OF FINANCIAL CONDITION ANDRESULTS OF OPERATIONS—(Continued)
The following table shows the percentage of revenues from sales to OEMs and VARs anddistributors for the periods indicated :
Year Ended April 30,
2011 2010 2009
OEMs and VARs . . . . . . . . . . . . . . . . . . . . . . . . . . . . . . . . 75.3% 51.5% 58.0%Distributors . . . . . . . . . . . . . . . . . . . . . . . . . . . . . . . . . . . . . 24.7 48.5 42.0
Total . . . . . . . . . . . . . . . . . . . . . . . . . . . . . . . . . . . . . . . . 100.0% 100.0% 100.0%
OEMs and VARs. The one OEM customer that accounted for 10% or more of our revenues infiscal 2011 was LG Innotek Co., Ltd., which accounted for approximately 17.6% of our revenues. Theone OEM customer that accounted for 10% or more of our revenues in fiscal 2010 and 2009 wasFoxconn, which accounted for approximately 11.2% and 10.4% of our revenues, respectively. For fiscal2011, 2010 and 2009, no other OEM or VAR customer accounted for 10% or more of our revenues.
Distributors. The one distributor that accounted for 10% or more of our revenues in fiscal 2011,2010 and 2009 was World Peace, which accounted for approximately 13.8%, 27.0% and 22.4% of ourrevenues, respectively. For fiscal 2011, 2010 and 2009, no other distributor accounted for 10% or moreof our revenues.
Revenues from Domestic Sales as Compared to Foreign Sales
The following table shows the percentage of our revenues derived from sales of our image-sensorproducts to domestic customers, as compared to foreign customers for the periods indicated:
Year Ended April 30,
2011 2010 2009
Domestic sales . . . . . . . . . . . . . . . . . . . . . . . . . . . . . . . . . . 1.7% 0.6% 6.7%Foreign sales . . . . . . . . . . . . . . . . . . . . . . . . . . . . . . . . . . . . 98.3 99.4 93.3
Total . . . . . . . . . . . . . . . . . . . . . . . . . . . . . . . . . . . . . . . . 100.0% 100.0% 100.0%
We derive the majority of our foreign sales from customers in Asia and, to a lesser extent, inEurope. Over time, our sales to Asia-Pacific customers have increased primarily as a result of thecontinuing trend of outsourcing the production of consumer electronics products to Asia-Pacificmanufacturers and facilities and to the increasing markets in Asia for consumer products. Because ofthe preponderance of Asia-Pacific manufacturers and the fact that virtually all products incorporatingour image-sensor products are sold globally, we believe that the geographic distribution of our salesdoes not accurately reflect the geographic distribution of sales into end-user markets of products whichincorporate our image sensors.
Gross Profit
Comparison of Fiscal 2011 and Fiscal 2010
Our gross margin in fiscal 2011 was 29.1%, an increase from 24.1% for fiscal 2010. The principalcontributors to the year-over-year increase in gross margin included: a reduction in production costsresulting from increased efficiencies due to substantial increases in production volume; a 10.9%increase in our ASPs resulting from improvements in product mix and a decline in the write-down of
58

ITEM 7. MANAGEMENT’S DISCUSSION AND ANALYSIS OF FINANCIAL CONDITION ANDRESULTS OF OPERATIONS—(Continued)
inventories which totaled approximately $18.3 million, as compared to $19.2 million during the priorfiscal year. We recorded approximately $2.0 million in stock-based compensation expense to cost ofrevenues in fiscal 2011, as compared to $2.7 million in the prior fiscal year.
Comparison of Fiscal 2010 and Fiscal 2009
Our gross margin in fiscal 2010 was 24.1%, an increase from 23.2% for fiscal 2009. The principalcontributor to the year-over-year increase in gross margin reflected: a decline in the write-down ofinventories which totaled approximately $19.2 million, as compared to $22.1 million during the priorfiscal year; an increase in the sales of previously written-down products in fiscal 2010, which totaled$14.6 million, as compared to $9.8 million during the same period in the prior fiscal year; and areduction in production costs. The year-over-year increase was partially offset by the 15.8% decrease inour ASPs as a result of competitive pricing pressures and, in part, an increase in the proportion of salesrepresented by bare die, often referred to as chip-on-board, or COB, products, rather than packagedproducts. We recorded approximately $2.7 million in stock-based compensation expense to cost ofrevenues in fiscal 2010, as compared to $3.1 million in the prior fiscal year.
Research, Development and Related
Research, development and related expenses consist primarily of compensation and personnel-related expenses, non-recurring engineering costs related principally to the costs of the masks we buywhen we release new product designs to the manufacturing foundry, costs for purchased materials,designs, tooling, depreciation of computers and workstations, and amortization of acquired intangibleintellectual property and computer aided design software. Research, development and related expensesmay fluctuate significantly as the number of new designs we release to the foundry can fluctuate fromperiod to period. Research, development and related expenses for fiscal 2011, 2010 and 2009 wereapproximately $88.5 million, $77.3 million and $84.9 million, respectively. As a percentage of revenues,research, development and related expenses for fiscal 2011, 2010 and 2009 represented 9.2%, 12.8%and 16.7%, respectively.
Comparison of Fiscal 2011 and Fiscal 2010
The increase in research, development and related expenses of approximately $11.2 million, or14.5%, in fiscal 2011, as compared to fiscal 2010 resulted primarily from: a $8.6 million increase insalary and payroll-related expenses; a $4.9 million increase in non-recurring engineering expensesrelated to new product development; a $1.6 million increase in legal expenses primarily related topatent registration activities and a $296,000 increase in office and facility expenses. These increaseswere partially offset by: a $3.8 million decrease in depreciation and amortization expenses and a$0.7 million decrease in stock-based compensation expense. We anticipate that research, developmentand related expenses will increase for our first quarter of fiscal 2012, reflecting expenses we anticipateincurring as we develop and introduce new products, including those employing our CameraCube,OmniBSI and OmniBSI-2 technologies and as we develop other new imaging technologies.
Comparison of Fiscal 2010 and Fiscal 2009
The decrease in research, development and related expenses of approximately $7.6 million, or8.9%, in fiscal 2010, as compared to fiscal 2009 resulted primarily from a $2.0 million decrease innon-recurring engineering expenses related to new product development, a $1.9 million decrease in
59

ITEM 7. MANAGEMENT’S DISCUSSION AND ANALYSIS OF FINANCIAL CONDITION ANDRESULTS OF OPERATIONS—(Continued)
office and facility expenses, a $1.8 million decrease in stock-based compensation expense and a$1.7 million decrease in legal expenses primarily related to patent registration activities.
Selling, General and Administrative
Selling, general and administrative expenses consist primarily of compensation and personnelrelated expenses, commissions paid to distributors and manufacturers’ representatives and insuranceand legal expenses. Selling, general and administrative expenses for fiscal 2011, 2010 and 2009 wereapproximately $62.8 million, $61.5 million and $62.6 million, respectively. As a percentage of revenues,selling, general and administrative expenses for fiscal 2011, 2010 and 2009 represented 6.6%, 10.2%and 12.3%, respectively.
Comparison of Fiscal 2011 and Fiscal 2010
The increase in selling, general and administrative expenses of approximately $1.3 million, or 2.1%,for fiscal 2011 from fiscal 2010 resulted primarily from: a $3.1 million increase in fees for outsideservices primarily due to one-time transaction costs incurred in association with the Kodak patentpurchase; a $2.2 million increase in salary and payroll-related expenses; a $0.7 million increase in officeand facility expenses; a $414,000 increase in travel-related expenses; a $409,000 increase in bad debtexpense and a $161,000 increase in marketing expenses. These increases were partially offset by: a$2.2 million decrease in stock-based compensation expense; a $1.6 million decrease in legal expensesrelated to patent defense; a $1.4 million decrease in commission expenses paid primarily to distributorsand sales representatives and a $449,000 decrease in other tax expenses. We anticipate that our selling,general and administrative expenses will decrease for the first quarter of fiscal 2012, as compared tothe fourth quarter of fiscal 2011, in the absence of the one-time transaction costs noted above.
Comparison of Fiscal 2010 and Fiscal 2009
The decrease in selling, general and administrative expenses of approximately $1.0 million, or1.7%, for fiscal 2010 from fiscal 2009 resulted primarily from: a $1.8 million decrease in fees foroutside services, a $0.8 million decrease in travel-related expenses, a $0.7 million decrease in marketingexpenses, a $0.7 million decrease in stock-based compensation expense, a $477,000 decrease in officeand facility expenses, a $280,000 decrease in software expenses and a $269,000 decrease in bad debtexpense. These decreases were partially offset by a $2.8 million increase in legal expenses related topatent defense, a $0.6 million increase in depreciation expenses, a $0.5 million increase in commissionexpenses paid primarily to distributors and sales representatives and a $0.5 million increase in salaryand payroll-related expenses.
Goodwill Impairment
During the second quarter of fiscal 2009, based on a combination of factors, including thesignificant decline in our market capitalization and the global economic downturn, we concluded thatthere were sufficient factual circumstances for interim impairment analyses. By comparing the fair valueto net assets other than goodwill, we recorded a non-cash goodwill impairment charge of $7.5 million,or 1.5% of revenues, which we included in Goodwill impairment for fiscal 2009. There was no similargoodwill impairment charge in fiscal 2011 and 2010.
60

ITEM 7. MANAGEMENT’S DISCUSSION AND ANALYSIS OF FINANCIAL CONDITION ANDRESULTS OF OPERATIONS—(Continued)
Amortization of Acquired Patent Portfolio
In March 2011, we purchased certain sensor-related patents and patent applications from Kodak ina cash transaction. As a result, we recorded $65.0 million in additions to intangible assets, which webegan amortizing during the three months ended April 30, 2011. Consequently, amortization ofacquired patent portfolio totaled approximately $0.8 million for fiscal 2011. We did not incur anycomparable charges in fiscal 2010 or 2009.
Interest Income (Expense), Net
We invest our cash, cash equivalents and short-term investments in interest-bearing accountsconsisting primarily of money market funds, commercial paper, certificates of deposit, high-gradecorporate securities and government bonds. Additionally, we have obtained funds under certainlong-term borrowing facilities comprised of a variable rate mortgage, a construction loan and termloans. Interest income (expense), net, for fiscal 2011, 2010 and 2009 was approximately $(1.2 million),$(0.8 million) and $2.1 million, respectively. Between fiscal 2010 and 2011, the $376,000 decline ininterest income (expense), net, resulted from a $420,000 increase in interest expense primarilyassociated with long-term borrowings in fiscal 2011, partially offset by a $44,000 increase in interestincome, as compared to the prior year. The increase in interest income was the result of higherbalances in interest-bearing accounts than in the prior year. Between fiscal 2009 and 2010, the$2.8 million decline in interest income (expense), net, resulted from a $2.5 million reduction in interestincome and a $300,000 increase in interest expense primarily associated with long-term borrowings infiscal 2010 as compared to the prior year. The decline in interest income was the result of lowerinterest rates on interest-bearing accounts than in the prior year.
Other Income (Expense), Net
Our portion of the income recorded under the equity method of accounting is included in Otherincome (expense), net. (See Note 5—‘‘Long-term Investments’’ of the Notes to our consolidatedfinancial statements.) Other income (expense), net, for fiscal 2011 totaled $3.9 million, as compared to$4.6 million and $(3.2 million) in fiscal 2010 and 2009, respectively. Other income (expense), net, forfiscal 2011 included a $3.1 million gain that represented our portion of the net income recorded byWLCSP; a $1.6 million gain that represented the difference between the fair value of our ownershipinterest in SOI and the carrying value of SOI’s net assets and noncontrolling interest before thedeconsolidation, partially offset by a $0.7 million loss on foreign exchange, a $242,000 loss on theinterest rate swap agreements related to the mortgage on the Santa Clara Property; a $241,000 loss thatrepresented our portion of the net loss recorded by SOI and a $72,000 loss on the sale of SOI. In thethree months ended January 31, 2011, we sold our remaining 43.7% interest in SOI. Consequently, asof April 30, 2011, we had no continuing interest in SOI.
Other income (expense), net, for fiscal 2010 included a $2.2 million gain that represented thedifference between 996,250 shares of common stock of Tong Hsing, that we received in connection withTong Hsing’s acquisition of ImPac and the carrying value of our investment in ImPac, a $2.0 milliongain that represented our portion of the net income recorded by WLCSP and a $0.8 million gain onthe interest rate swap agreements related to the mortgage on the Santa Clara Property, and a$0.8 million loss that represented our portion of the net loss recorded by ImPac, prior to its acquisitionby Tong Hsing.
Other income (expense), net, for fiscal 2009 totaled $3.2 million. Other income (expense), net, forfiscal 2009 included a $2.2 million loss on interest rate swap agreements related to the mortgage on the
61

ITEM 7. MANAGEMENT’S DISCUSSION AND ANALYSIS OF FINANCIAL CONDITION ANDRESULTS OF OPERATIONS—(Continued)
Santa Clara Property, a $1.1 million loss that represented our portion of the net loss recorded byImPac, and a $0.9 million exchange loss, partially offset by a gain of $0.7 million, representing ourportion of the net income recorded by WLCSP.
Provision for Income Taxes
We generated approximately $128.7 million and $10.3 million in income before income taxes forfiscal 2011 and 2010, respectively, and approximately $38.2 million in loss before income taxes for fiscal2009. We recorded a provision for income taxes of approximately $4.2 million and $3.9 million for fiscal2011 and 2010, respectively, and a benefit from income taxes of approximately $0.2 million for fiscal2009. For fiscal 2011, 2010 and 2009, our effective tax rates were 3.3%, 37.8% and 0.4%, respectively.These rates were less than the combined U.S. federal and state statutory rate of approximately 40.0%because we earn a portion of our income in jurisdictions where tax rates are lower than the combinedU.S. federal and state statutory rates. We expect that our consolidated effective tax rate in fiscal 2012will continue to be less than the combined U.S. federal and state statutory rates. The extent of thedifference is principally contingent upon the amount of non-deductible stock based compensationexpenses and the proportion and geographic mix of our total pre-tax income. See Note 9—‘‘IncomeTaxes’’ of the Notes to our consolidated financial statements for the reconciliation of how our provisionfor (benefit from) income taxes differs from the amount computed by applying the U.S. federal incometax rate of 35.0% to income (loss) before income taxes.
Net Loss Attributable to Noncontrolling Interest
Net loss attributable to noncontrolling interest for fiscal 2011 was $32,000, which represented the56.3% ownership interest in SOI that we did not own in the net loss of SOI, as recorded by SOI fromthe beginning of our fiscal year through May 2010. We deconsolidated the entity in June 2010. (SeeNote 5—‘‘Long-term Investments’’ to our consolidated financial statements.) Net loss attributable tononcontrolling interest for fiscal 2010 and 2009 was $321,000 and $0.7 million, respectively. The net lossattributable to noncontrolling interest for fiscal 2010 and 2009 represents the respective 56.2% and56.1% interest that we did not own in the net loss of SOI.
Liquidity and Capital Resources
Our principal sources of liquidity at April 30, 2011 consisted of cash, cash equivalents andshort-term investments of $466.9 million.
Liquidity
Our working capital increased by $148.8 million to $582.1 million as of April 30, 2011, ascompared to $433.3 million as of April 30, 2010. Our working capital increased as a result of: a$145.4 million increase in cash and cash equivalents primarily due to operating cash flows; a$68.3 million increase in accounts receivable, net, resulting from a revenue increase of $353.5 millionfor fiscal 2011 from fiscal 2010; and a $2.9 million increase in prepaid and deferred income taxes.These increases in working capital were partially offset by: a $27.1 million decrease in inventories dueto fiscal 2011 revenue growth; a $17.0 million increase in accounts payable resulting from an increase inproduction activities; a $12.1 million decrease in short-term investments; a $6.0 million increase inaccrued expenses and other current liabilities, and a $5.9 million increase in deferred revenues, lesscost of revenues.
Cash balances are held throughout the world, including substantial amounts held outside of theU.S. Most of the amounts held outside of the U.S. could be repatriated to the U.S., but under thecurrent law, would be subject to U.S. federal income taxes, less applicable foreign tax credits.
62

ITEM 7. MANAGEMENT’S DISCUSSION AND ANALYSIS OF FINANCIAL CONDITION ANDRESULTS OF OPERATIONS—(Continued)
In March 2007, we purchased the Santa Clara Property. In connection with the purchase, weobtained from a domestic bank a mortgage loan with a principal amount of $27.9 million, or theMortgage Loan, and a term loan with a principal amount of $12.0 million, or the Term Loan. As ofApril 30, 2011, the principal amounts outstanding under the Mortgage Loan and Term Loan were$25.3 million and $4.0 million, respectively. At April 30, 2011, the variable interest rates under theMortgage Loan and the Term Loan were 1.1% and 1.5%, respectively. See Note 8—‘‘BorrowingArrangements and Related Derivative Instruments’’ of the Notes to our consolidated financial statements.
In order to secure the obligations, we also entered into a Deed of Trust, Assignment of Rents andLeases, Security Agreement and Fixture for the benefit of the domestic bank and a Stock PledgeAgreement between us and the domestic bank.
The Loan and Security Agreement requires us to comply with certain affirmative covenantsincluding, but not limited to, meeting certain minimum financial standards, as well as certain negativecovenants limiting our ability to take certain actions without the prior written consent of the domesticbank including, but not limited to, selling or leasing the Santa Clara Property or merging orconsolidating with another entity. In addition, the Loan and Security Agreement provides that upon theoccurrence of certain events of default our obligations under the Loan and Security Agreement maybecome immediately due and payable, or the domestic bank may cease making additional advancesunder the Term Loan or otherwise extending credit to us under the Loan and Security Agreement. Asof April 30, 2011, we were in compliance with the financial covenants of the Loan and Securityagreement.
Concurrent with the Mortgage Loan, we also entered into an interest rate swap with the bank tohelp manage interest rate risk. The swap is for a period of ten years, and the notional amount of theswap approximates the principal outstanding under the Mortgage Loan. We are the fixed rate payerunder the swap with a fixed rate of approximately 5.3% per annum, and the effective rate on theMortgage Loan is fixed at approximately 6.2%. In July 2008, in connection with the Term Loan, weentered into a second interest rate swap with the bank to effectively convert the variable interest ratedescribed above to a fixed rate. This second swap is for a period of four years. We are the fixed ratepayer and the rate is fixed at 4.3% per annum and the effective rate on the Term Loan is fixed atapproximately 5.5%. We measure the swap at fair value and record it as either an asset or a liability,depending on whether the fair value is a gain or loss to us.
In August 2009, in order to finance costs associated with the construction of a research center forour wholly-owned subsidiary in Shanghai, OmniVision Technologies (Shanghai) Co. Ltd., or OTC, weentered into a fixed asset loan agreement with a bank in China. The agreement provides for a fixedasset loan in the principal amount of approximately $20.5 million based on the exchange rate in effectat the time of the loan origination, or the Construction Loan. We completed the construction of theresearch center during the three months ended October 31, 2010 and do not expect to draw down anyfurther amount from the Construction Loan. As of April 30, 2011, the principal amount outstandingunder the Construction Loan was $16.9 million at an interest rate of 5.3%.
Cash Flows from Operating Activities
For fiscal 2011, net cash provided by operating activities totaled approximately $137.3 million, ascompared to $48.3 million for fiscal 2010. The principal components of the current year amount were:net income of approximately $124.5 million for fiscal 2011; adjustments for non-cash charges of$20.6 million in depreciation and amortization, $19.8 million in stock-based compensation and$18.3 million in write-down of inventories; a $18.7 million increase in accounts payable; a $5.9 million
63

ITEM 7. MANAGEMENT’S DISCUSSION AND ANALYSIS OF FINANCIAL CONDITION ANDRESULTS OF OPERATIONS—(Continued)
increase in deferred revenues, less cost of revenues; a $5.6 million decrease in inventories; a$5.6 million decrease in prepaid and deferred income taxes; and a $3.2 million decrease in prepaidexpenses and other assets. These increases were partially offset by: a $68.4 million increase in accountsreceivable, net; $13.2 million in gains on equity investments; a $2.7 million decrease in income taxespayable and a $1.0 million decrease in deferred tax liabilities. The $68.4 million increase in accountsreceivable, net, reflects the increased level of revenues during the fourth quarter of fiscal 2011, asreflected in days of sales outstanding which increased to 49 days as of April 30, 2011 from 42 days asof April 30, 2010. The $5.6 million decrease in inventories resulted from an increase in sales activityduring fiscal 2011. The decrease in inventories relative to fourth quarter revenues resulted in anincrease in annualized inventory turns to 6.7 as of April 30, 2011 from 3.5 as of April 30, 2010. The$18.7 million increase in accounts payable reflected the increase in cost of sales associated with thesubstantial increase in sales activity.
For fiscal 2010, net cash provided by operating activities totaled approximately $48.3 million, ascompared to $45.2 million for fiscal 2009. The principal components of the current year amount were:net income of approximately $6.4 million for fiscal 2010; adjustments for non-cash charges of$23.5 million in stock-based compensation, $22.7 million in depreciation and amortization, $19.2 millionin write-down of inventories, $7.0 million in gains on equity investments and $0.8 million in gains oninterest rate swaps; a $51.9 million increase in accounts payable; a $7.4 million increase in income taxespayable; a $3.5 million increase in deferred revenues, less cost of revenues; and a $2.4 million increasein accrued expenses and other current liabilities. These increases were partially offset by: a$30.3 million increase in accounts receivable, net; a $45.2 million increase in inventories; a $2.7 millionincrease in prepaid and deferred income taxes and a $2.6 million decrease in deferred tax liabilities.The $30.3 million increase in accounts receivable, net, reflects the increased level of revenues duringfiscal 2010, partially offset by faster collection, as reflected in days of sales outstanding which declinedto 42 days as of April 30, 2010 from 44 days as of April 30, 2009. The $45.2 million increase ininventories resulted from the need to support an anticipated increase in sales activity during fiscal 2011.The increase in inventories relative to fourth quarter revenues resulted in an increase in annualizedinventory turns to 3.5 as of April 30, 2010 from 2.8 as of April 30, 2009. The $51.9 million increase inaccounts payable resulted from the increase in inventory purchases required to support the anticipatedrise in future sales activity. The $3.5 million increase in deferred revenues, less cost of revenues, wasdue to an increase in sales to distributors during fiscal 2010.
Cash Flows from Investing Activities
For fiscal 2011, our cash used in investing activities totaled $64.7 million, as compared to cash usedin investing activities of approximately $101.5 million for fiscal 2010, due primarily to: $63.5 million inpurchases of intangible and other assets principally associated with the purchase of intellectual propertyfrom Kodak and $10.3 million in purchases of property, plant and equipment, partially offset by$8.4 million in net sales or maturities of short-term investments.
For fiscal 2010, our cash used in investing activities totaled $101.5 million, as compared to cashprovided by investing activities of approximately $1.1 million for fiscal 2009, due primarily to:$82.9 million in net purchases of short-term investments, $13.5 million in purchases of property, plantand equipment and $5.1 million in a long-term investment in Aurora.
64

ITEM 7. MANAGEMENT’S DISCUSSION AND ANALYSIS OF FINANCIAL CONDITION ANDRESULTS OF OPERATIONS—(Continued)
Cash Flows from Financing Activities
For fiscal 2011, net cash provided by financing activities totaled approximately $72.0 million, ascompared to $29.3 million during fiscal 2010. This increase was due primarily to: $76.2 million inproceeds from the exercise of stock options and employee purchases through our employee stockpurchase plan, partially offset by $4.3 million in payments of long-term borrowings.
For fiscal 2010, net cash provided by financing activities totaled approximately $29.3 million, ascompared to net cash used in financing activities of approximately $5.7 million during fiscal 2009. Thischange was due primarily to: $15.9 million in proceeds from the exercise of stock options and employeepurchases through our employee stock purchase plan, and $13.3 million in net proceeds from long-termborrowings.
Capital Commitments and Resources
During the three months ended October 31, 2008, we formed Shanghai OmniVision SemiconductorTechnology Co. Ltd, or OST, a wholly-owned subsidiary in Shanghai, China, for the purpose ofexpanding its testing capabilities. As of April 30, 2011, we had contributed $1.5 million, as requiredunder the terms of our $10.0 million capital commitment. We are required to contribute the remaining$8.5 million by October 2011, which represents a one-year extension from the original due date ofOctober 2010.
During the three months ended April 30, 2011, we formed OmniVision OptoelectronicsTechnologies (Shanghai) Co. Ltd., or OOC, a wholly-owned subsidiary in Shanghai, China, for thepurpose of expanding our manufacturing capabilities for CameraCube production. We contributed$3.8 million of the committed $25.0 million registered capital in June 2011. In addition, we are requiredto contribute the remaining $21.2 million by April 2013. See Note 16—‘‘Commitments andContingencies’’ to our consolidated financial statements.
We currently expect our available cash, cash equivalents and short-term investments, together withcash that we anticipate generating from operating activities, will be sufficient to satisfy our capitalrequirements over approximately the next 12 months. Other than normal working capital requirements,we expect our capital requirements totaling approximately $70.0 million over approximately the next12 months will consist primarily of funding capital investments in our wholly-owned subsidiaries.
Our ability to generate cash from operations is subject to substantial risks described above underthe caption Part I Item 1A. ‘‘Risk Factors.’’ We encourage you to review these risks carefully.
65

ITEM 7. MANAGEMENT’S DISCUSSION AND ANALYSIS OF FINANCIAL CONDITION ANDRESULTS OF OPERATIONS—(Continued)
Contractual Obligations and Commercial Commitments
The following summarizes our contractual obligations and commercial commitments as of April 30,2011 and the effect such obligations and commitments are expected to have on our liquidity and cashflows in future periods (in thousands):
Payments Due by Period
Less than More thanTotal 1 Year 1 - 3 Years 3 - 5 Years 5 Years
Contractual Obligations:Operating leases . . . . . . . . . . . . . . . . . . . . . $ 8,069 $ 4,343 $ 3,661 $ 65 $ —Debt obligations(1) . . . . . . . . . . . . . . . . . . . 46,239 4,323 6,724 10,340 24,852Purchase obligations(2) . . . . . . . . . . . . . . . . 246,666 246,666 — — —
Total contractual obligations . . . . . . . . . . . 300,974 255,332 10,385 10,405 24,852
Other Commercial Commitments:OST(3) . . . . . . . . . . . . . . . . . . . . . . . . . . . 8,500 8,500 — — —OOC(4) . . . . . . . . . . . . . . . . . . . . . . . . . . . 25,000 3,750 21,250 — —
Total commercial commitments . . . . . . . . . 33,500 12,250 21,250 — —
Total contractual obligations andcommercial commitments . . . . . . . . . . . $334,474 $267,582 $31,635 $10,405 $24,852
(1) In March 2007, we entered into the Mortgage Loan with a domestic bank in the amount of$27.9 million. In March 2008, we borrowed $6.0 million under the Term Loan for buildingimprovement of the Santa Clara Property. We drew down the remaining $6.0 million under theTerm Loan in July 2008. In August 2009, we entered into the Construction Loan with a bank inChina to finance costs associated with the construction of a research center for OTC. As ofApril 30, 2011, we borrowed approximately $17.7 million under the Construction Loan. SeeNote 8—‘‘Borrowing Arrangements and Related Derivative Instruments’’ to our consolidated financialstatements.
(2) Purchase obligations represent outstanding purchase orders that we have placed with our suppliersat period-ends. The lead time for delivery is long, typically 12 to 14 weeks, and suppliers mustprepare unique materials for us at the beginning of the fabrication process. Accordingly, we areprecluded from cancelling our orders once placed and the production process has begun.
(3) During the three months ended October 31, 2008, we formed OST, a wholly-owned subsidiary inShanghai, China, for the purpose of expanding our testing capabilities. We contributed $1.5 millionin January 2009, as required under the terms of our capital commitment. We are required tocontribute the remaining $8.5 million of a $10.0 million commitment by October 16, 2011, whichrepresents a one-year extension from the original due date of October 16, 2010. See Note 16—‘‘Commitments and Contingencies’’ to our consolidated financial statements.
(4) During the three months ended April 30, 2011, we formed OOC, a wholly-owned subsidiary inShanghai, China, for the purpose of expanding our manufacturing capabilities. We contributed$3.8 million of the committed $25.0 million registered capital in June 2011. In addition, we arerequired to contribute the remaining $21.2 million by April 2013. See Note 16—‘‘Commitments andContingencies’’ to our consolidated financial statements.
66

ITEM 7. MANAGEMENT’S DISCUSSION AND ANALYSIS OF FINANCIAL CONDITION ANDRESULTS OF OPERATIONS—(Continued)
As of April 30, 2011, the long-term income taxes payable, including estimated interest andpenalties, was $87.5 million. We are unable to make a reasonably reliable estimate of the timing ofpayments in individual years beyond 12 months due to uncertainties in the timing of tax audit, if any,or their outcomes. Accordingly, we have excluded this obligation from the schedule summarizing oursignificant obligations to make future payments under contractual obligations as of April 30, 2011presented above.
Off-Balance Sheet Arrangements
We did not have any material off-balance sheet arrangements during the periods covered by thisAnnual Report on Form 10-K.
Recent Accounting Pronouncements
In October 2009, the FASB revised the authoritative guidance for revenue recognition forarrangements with multiple deliverables. The new guidance modifies the requirements for determiningwhether a deliverable can be treated as a separate unit of accounting by removing the criteria thatverifiable and objective evidence of fair value exists for the undelivered elements. In allocatingtransaction consideration among the deliverables, the guidance also introduced the concept of usingmanagement’s best estimate of a standalone selling price as an alternate basis for allocation. Theguidance is effective in fiscal years beginning on or after June 15, 2010, and we are required to adoptthis guidance in our first quarter of fiscal 2012. We do not expect the adoption of this guidance to haveany material impact on our financial position, results of operations or cash flows.
In October 2009, the FASB issued authoritative guidance addressing certain revenue arrangementsthat include software elements. This guidance states that tangible products with hardware and softwarecomponents that work together to deliver the product functionality are considered non-softwareproducts, and the accounting guidance under the revenue arrangements with multiple deliverables is tobe followed. The guidance is effective in fiscal years beginning on or after June 15, 2010, and we arerequired to adopt this guidance in our first quarter of fiscal 2012. We do not expect the adoption ofthis guidance to have any material impact on our financial position, results of operations or cash flows.
In December 2010, the FASB issued additional guidance for entities with reporting units that havecarrying amounts equal to zero or are negative. These entities are required to assess whether it is morelikely than not that the reporting units’ goodwill is impaired. If it is determined that it is more likelythan not that the goodwill of one or more of its reporting units is impaired, then Step 2 of the goodwillimpairment test for those reporting unit(s) should be performed. The effective date for this guidance isfor fiscal years, and interim periods within those years, beginning after December 15, 2010. Earlyadoption is not permitted. We do not expect the adoption of this guidance to have any material impacton our financial position, results of operations or cash flows.
In May 2011, the FASB issued new guidance for fair value measurements to provide a consistentdefinition of fair value and ensure that the fair value measurement and disclosure requirements aresimilar between accounting principles generally accepted in the United States of America (‘‘GAAP’’)and International Financial Reporting Standards. The guidance changes certain fair value measurementprinciples and enhances the disclosure requirements particularly for level 3 fair value measurements.The guidance is effective for us prospectively beginning in the first quarter of fiscal 2012. We arecurrently evaluating the impact this guidance may have on our financial position, results of operationsand cash flows.
67

ITEM 7A. QUANTITATIVE AND QUALITATIVE DISCLOSURES ABOUT MARKET RISK
Foreign Currency Exchange Risk
We sell our products globally, in particular to OEMs, VARs and distributors in China, Japan,Korea and Taiwan.
The great majority of our transactions with our customers and vendors are denominated in U.S.dollars. The expenses we incur in currencies other than U.S. dollars affect gross profit, research,development and related expenses, selling, general and administrative expenses and income taxes, andare primarily incurred in China, where the Chinese Yuan, or CNY, is the local currency and in Taiwan,where the New Taiwan dollar is the local currency.
As of April 30, 2011, the functional currency of all of our wholly-owned subsidiaries is the U.S.dollar. Transaction gains and losses resulting from transactions denominated in currencies other thanthe respective functional currencies are included in ‘‘Other income (expense), net’’ for the periodspresented. The amounts of transaction gains and losses for fiscal 2011, 2010 and 2009 were notmaterial.
Given that the operating expenses which we incur in currencies other than U.S. dollars have notbeen a significant percentage of our revenues, we do not believe that our foreign currency exchangerate fluctuation risk is significant. Consequently, we do not believe that a 10% change in foreigncurrency exchange rates would have a significant effect on our future net income or cash flows.
In August 2009, in order to finance costs associated with the construction of a research center forOTC, we entered into the Construction Loan with a bank in China. The Construction Loan isdenominated in CNY and provides for a fixed asset loan in the principal amount of approximately$20.5 million based on the exchange rate in effect at the time of the loan origination. As of April 30,2011, the principal amount outstanding under the Construction Loan was $16.9 million. As of April 30,2011, a hypothetical 10% weakening of the U.S. dollar against CNY would result in approximately$1.7 million of additional remeasurement losses. As of April 30, 2011, a hypothetical 10% strengtheningof the U.S. dollar against CNY would result in approximately $1.7 million of additional remeasurementgains.
We have not hedged exposures denominated in foreign currencies or used any other derivativefinancial instruments. Although we transact the overwhelming majority of our business in U.S. dollars,future fluctuations in the value of the U.S. dollar may affect the competitiveness of our products andthus may impact our results of operations.
Market Interest Rate Risk
Our cash equivalents and short-term investments are exposed to financial market risk due tofluctuation in interest rates, which may affect our interest income and, from time to time, the fairmarket value of our investments. We manage our exposure to financial market risk by performingongoing evaluations of our investment portfolio. We presently invest in money market funds, certificatesof deposit issued by banks, commercial paper, high-grade corporate securities and government bondsmaturing approximately 18 months or less from the date of purchase.
Due to the short maturities of our investments, the carrying value should approximate the fairmarket value. In addition, we do not use our investments for trading or other speculative purposes.Due to the short duration of our investment portfolio, we do not expect that an immediate 10% changein interest rates would have a material effect on the fair market value of our portfolio. Therefore, wewould not expect our operating results or cash flows to be affected to any significant degree by the
68

ITEM 7A. QUANTITATIVE AND QUALITATIVE DISCLOSURES ABOUT MARKET RISK—(Continued)
effect of a sudden change in market interest rates. We do not believe that the recent instability inglobal financial markets has significantly affected the value of our cash and short-term investments.
During fiscal 2007, we financed the purchase of the Santa Clara Property with a $27.9 millionmortgage loan. The mortgage loan is a variable rate loan which bears interest at LIBOR plus 90 basispoints and changes in the interest rate affect our interest payments. However, concurrent with themortgage loan, we also entered into an interest rate swap with a notional amount that approximatesthe principal outstanding under the mortgage loan. We are the fixed rate payer under the swap with afixed rate of 5.3%. By July 2008, we drew down the total available amount of $12.0 million under arelated term loan. Concurrent with the term loan, we also entered into an interest rate swap with anotional amount that approximates the principal outstanding under the term loan. We are the fixedrate payer under the swap with a fixed rate of 4.3%. Consequently, although we are required to markthe value of the swaps to market at each balance sheet date and record the associated non-cash cost orbenefit as part of ‘‘Other income (expense), net,’’ a hypothetical 10% change in LIBOR would nothave a material effect on our interest expense for fiscal 2011.
As to the Construction Loan, the interest rate is based on an indicative rate as published by theChinese government, and will be adjusted every September to the then current published rate. Interestrate under the Construction Loan was 5.3% at April 30, 2011. We do not hedge against the risk ofinterest rate changes for the Construction Loan. However, since the current interest rate is publishedby the Chinese government and will not be adjusted until September 2011, any hypothetical 10% shiftsin yield will not cause a significant adverse impact to our results of operations, cash flows or to ourfinancial position for fiscal 2011.
69

ITEM 8. FINANCIAL STATEMENTS AND SUPPLEMENTARY DATA
OMNIVISION TECHNOLOGIES, INC.
INDEX TO CONSOLIDATED FINANCIAL STATEMENTS
Page
Report of Independent Registered Public Accounting Firm . . . . . . . . . . . . . . . . . . . . . . . . . . . . 71Consolidated Balance Sheets . . . . . . . . . . . . . . . . . . . . . . . . . . . . . . . . . . . . . . . . . . . . . . . . . . 72Consolidated Statements of Operations . . . . . . . . . . . . . . . . . . . . . . . . . . . . . . . . . . . . . . . . . . 73Consolidated Statements of Stockholders’ Equity and Comprehensive Income (Loss) . . . . . . . . . 74Consolidated Statements of Cash Flows . . . . . . . . . . . . . . . . . . . . . . . . . . . . . . . . . . . . . . . . . . 75Notes to Consolidated Financial Statements . . . . . . . . . . . . . . . . . . . . . . . . . . . . . . . . . . . . . . . 76Supplementary Data . . . . . . . . . . . . . . . . . . . . . . . . . . . . . . . . . . . . . . . . . . . . . . . . . . . . . . . . 118
70

REPORT OF INDEPENDENT REGISTERED PUBLIC ACCOUNTING FIRM
To the Board of Directors and Stockholders of OmniVision Technologies, Inc.:
In our opinion, the consolidated financial statements listed in the accompanying index presentfairly, in all material respects, the financial position of OmniVision Technologies, Inc. and itssubsidiaries at April 30, 2011 and April 30, 2010, and the results of their operations and their cashflows for each of the three years in the period ended April 30, 2011 in conformity with accountingprinciples generally accepted in the United States of America. In addition, in our opinion, the financialstatement schedule listed in the accompanying index appearing under Item 15(a)(2) presents fairly, inall material respects, the information set forth therein when read in conjunction with the relatedconsolidated financial statements. Also in our opinion, the Company maintained, in all materialrespects, effective internal control over financial reporting as of April 30, 2011, based on criteriaestablished in Internal Control—Integrated Framework issued by the Committee of SponsoringOrganizations of the Treadway Commission (COSO). The Company’s management is responsible forthese financial statements and financial statement schedule, for maintaining effective internal controlover financial reporting and for its assessment of the effectiveness of internal control over financialreporting, included in Management’s Report on Internal Control over Financial Reporting appearingunder Item 9A. Our responsibility is to express opinions on these financial statements, on the financialstatement schedule, and on the Company’s internal control over financial reporting based on ourintegrated audits. We conducted our audits in accordance with the standards of the Public CompanyAccounting Oversight Board (United States). Those standards require that we plan and perform theaudits to obtain reasonable assurance about whether the financial statements are free of materialmisstatement and whether effective internal control over financial reporting was maintained in allmaterial respects. Our audits of the financial statements included examining, on a test basis, evidencesupporting the amounts and disclosures in the financial statements, assessing the accounting principlesused and significant estimates made by management, and evaluating the overall financial statementpresentation. Our audit of internal control over financial reporting included obtaining an understandingof internal control over financial reporting, assessing the risk that a material weakness exists, andtesting and evaluating the design and operating effectiveness of internal control based on the assessedrisk. Our audits also included performing such other procedures as we considered necessary in thecircumstances. We believe that our audits provide a reasonable basis for our opinions.
A company’s internal control over financial reporting is a process designed to provide reasonableassurance regarding the reliability of financial reporting and the preparation of financial statements forexternal purposes in accordance with generally accepted accounting principles. A company’s internalcontrol over financial reporting includes those policies and procedures that (i) pertain to themaintenance of records that, in reasonable detail, accurately and fairly reflect the transactions anddispositions of the assets of the company; (ii) provide reasonable assurance that transactions arerecorded as necessary to permit preparation of financial statements in accordance with generallyaccepted accounting principles, and that receipts and expenditures of the company are being made onlyin accordance with authorizations of management and directors of the company; and (iii) providereasonable assurance regarding prevention or timely detection of unauthorized acquisition, use, ordisposition of the company’s assets that could have a material effect on the financial statements.
Because of its inherent limitations, internal control over financial reporting may not prevent ordetect misstatements. Also, projections of any evaluation of effectiveness to future periods are subjectto the risk that controls may become inadequate because of changes in conditions, or that the degreeof compliance with the policies or procedures may deteriorate.
/s/ PRICEWATERHOUSECOOPERS LLP
San Jose, CaliforniaJune 29, 2011
71

OMNIVISION TECHNOLOGIES, INC.
CONSOLIDATED BALANCE SHEETS(In thousands, except share and per share data)
April 30,
2011 2010
ASSETSCurrent assets:
Cash and cash equivalents . . . . . . . . . . . . . . . . . . . . . . . . . . . . . . . . . . . . . . . $ 379,379 $ 234,023Short-term investments . . . . . . . . . . . . . . . . . . . . . . . . . . . . . . . . . . . . . . . . . 87,505 99,555Accounts receivable, net of allowances for doubtful accounts and sales returns . . 142,606 74,261Inventories . . . . . . . . . . . . . . . . . . . . . . . . . . . . . . . . . . . . . . . . . . . . . . . . . . 106,873 133,993Prepaid and deferred income taxes . . . . . . . . . . . . . . . . . . . . . . . . . . . . . . . . . 4,937 1,990Prepaid expenses and other current assets . . . . . . . . . . . . . . . . . . . . . . . . . . . . 9,671 9,380
Total current assets . . . . . . . . . . . . . . . . . . . . . . . . . . . . . . . . . . . . . . . . . . . 730,971 553,202Property, plant and equipment, net . . . . . . . . . . . . . . . . . . . . . . . . . . . . . . . . . . . 115,446 121,547Long-term investments . . . . . . . . . . . . . . . . . . . . . . . . . . . . . . . . . . . . . . . . . . . 104,616 92,121Goodwill . . . . . . . . . . . . . . . . . . . . . . . . . . . . . . . . . . . . . . . . . . . . . . . . . . . . . 1,122 439Intangibles, net . . . . . . . . . . . . . . . . . . . . . . . . . . . . . . . . . . . . . . . . . . . . . . . . . 69,892 4,891Other long-term assets . . . . . . . . . . . . . . . . . . . . . . . . . . . . . . . . . . . . . . . . . . . 12,111 25,493
Total assets . . . . . . . . . . . . . . . . . . . . . . . . . . . . . . . . . . . . . . . . . . . . . . . $1,034,158 $ 797,693
LIABILITIES AND EQUITYCurrent liabilities:
Accounts payable . . . . . . . . . . . . . . . . . . . . . . . . . . . . . . . . . . . . . . . . . . . . . $ 102,519 $ 85,487Accrued expenses and other current liabilities . . . . . . . . . . . . . . . . . . . . . . . . . 25,483 19,506Deferred revenues, less cost of revenues . . . . . . . . . . . . . . . . . . . . . . . . . . . . . 16,594 10,661Current portion of long-term debt . . . . . . . . . . . . . . . . . . . . . . . . . . . . . . . . . . 4,323 4,286
Total current liabilities . . . . . . . . . . . . . . . . . . . . . . . . . . . . . . . . . . . . . . . . 148,919 119,940
Long-term liabilities:Long-term income taxes payable . . . . . . . . . . . . . . . . . . . . . . . . . . . . . . . . . . . 87,526 90,626Non-current portion of long-term debt . . . . . . . . . . . . . . . . . . . . . . . . . . . . . . 41,916 45,428Other long-term liabilities . . . . . . . . . . . . . . . . . . . . . . . . . . . . . . . . . . . . . . . 4,472 4,727
Total long-term liabilities . . . . . . . . . . . . . . . . . . . . . . . . . . . . . . . . . . . . . . 133,914 140,781
Total liabilities . . . . . . . . . . . . . . . . . . . . . . . . . . . . . . . . . . . . . . . . . . . . . . 282,833 260,721
Commitments and contingencies (Note 16)Equity:
OmniVision Technologies, Inc. stockholders’ equity:Common stock, $0.001 par value; 100,000,000 shares authorized; 70,515,450
shares issued and 57,974,450 outstanding at April 30, 2011 and 64,615,897shares issued and 52,074,897 outstanding at April 30, 2010, respectively . . . . 71 65
Additional paid-in capital . . . . . . . . . . . . . . . . . . . . . . . . . . . . . . . . . . . . . . 533,776 441,077Accumulated other comprehensive income . . . . . . . . . . . . . . . . . . . . . . . . . . 1,426 870Treasury stock, 12,541,000 at April 30, 2011 and 2010, respectively . . . . . . . . . (178,683) (178,683)Retained earnings . . . . . . . . . . . . . . . . . . . . . . . . . . . . . . . . . . . . . . . . . . . 394,735 270,253
Total OmniVision Technologies, Inc. stockholders’ equity . . . . . . . . . . . . . . 751,325 533,582Noncontrolling interest . . . . . . . . . . . . . . . . . . . . . . . . . . . . . . . . . . . . . . . . . — 3,390
Total equity . . . . . . . . . . . . . . . . . . . . . . . . . . . . . . . . . . . . . . . . . . . . . . . . 751,325 536,972
Total liabilities and equity . . . . . . . . . . . . . . . . . . . . . . . . . . . . . . . . . . . . $1,034,158 $ 797,693
The accompanying notes are an integral part of these consolidated financial statements.
72

OMNIVISION TECHNOLOGIES, INC.
CONSOLIDATED STATEMENTS OF OPERATIONS(in thousands, except per share amounts)
Year Ended April 30,
2011 2010 2009
Revenues . . . . . . . . . . . . . . . . . . . . . . . . . . . . . . . . . . . . . . . . . . . . $956,476 $602,991 $507,316Cost of revenues . . . . . . . . . . . . . . . . . . . . . . . . . . . . . . . . . . . . . . . 678,459 457,646 389,434
Gross profit . . . . . . . . . . . . . . . . . . . . . . . . . . . . . . . . . . . . . . . . . 278,017 145,345 117,882
Operating expenses:Research, development and related . . . . . . . . . . . . . . . . . . . . . . . . 88,519 77,311 84,881Selling, general and administrative . . . . . . . . . . . . . . . . . . . . . . . . 62,817 61,549 62,585Amortization of acquired patent portfolio . . . . . . . . . . . . . . . . . . . 774 — —Goodwill impairment . . . . . . . . . . . . . . . . . . . . . . . . . . . . . . . . . . — — 7,541
Total operating expenses . . . . . . . . . . . . . . . . . . . . . . . . . . . . . . 152,110 138,860 155,007
Income (loss) from operations . . . . . . . . . . . . . . . . . . . . . . . . . . . . . 125,907 6,485 (37,125)Interest income (expense), net . . . . . . . . . . . . . . . . . . . . . . . . . . . . . (1,150) (774) 2,069Other income (expense), net . . . . . . . . . . . . . . . . . . . . . . . . . . . . . . 3,918 4,575 (3,171)
Income (loss) before income taxes . . . . . . . . . . . . . . . . . . . . . . . . . . 128,675 10,286 (38,227)Provision for (benefit from) income taxes . . . . . . . . . . . . . . . . . . . . . 4,225 3,883 (158)
Net income (loss) . . . . . . . . . . . . . . . . . . . . . . . . . . . . . . . . . . . 124,450 6,403 (38,069)Net loss attributable to noncontrolling interest . . . . . . . . . . . . . . . . . (32) (321) (746)
Net income (loss) attributable to OmniVision Technologies, Inc. . $124,482 $ 6,724 $(37,323)
Net income (loss) per share attributable to OmniVisionTechnologies, Inc. common stockholders:Basic . . . . . . . . . . . . . . . . . . . . . . . . . . . . . . . . . . . . . . . . . . . . . . $ 2.25 $ 0.13 $ (0.74)
Diluted . . . . . . . . . . . . . . . . . . . . . . . . . . . . . . . . . . . . . . . . . . . . $ 2.11 $ 0.13 $ (0.74)
Shares used in computing net income (loss) per share attributable toOmniVision Technologies, Inc. common stockholders:Basic . . . . . . . . . . . . . . . . . . . . . . . . . . . . . . . . . . . . . . . . . . . . . . 55,324 51,080 50,523
Diluted . . . . . . . . . . . . . . . . . . . . . . . . . . . . . . . . . . . . . . . . . . . . 59,106 52,689 50,523
The accompanying notes are an integral part of these consolidated financial statements.
73

OMNIVISION TECHNOLOGIES, INC.
CONSOLIDATED STATEMENTS OF STOCKHOLDERS’ EQUITYAND COMPREHENSIVE INCOME (LOSS)
(in thousands, except share data)
TotalAccumulated OmniVision
Additional Other Technologies, Inc.Common StockPaid-in Comprehensive Treasury Retained Stockholders’ Noncontrolling Comprehensive
Shares Amount Capital Income Stock Earnings Equity Interest Total Income (Loss)
Balance at May 1, 2008 . . . . 51,046,369 $62 $373,024 $1,561 $(165,768) $300,852 $509,731 $ 4,444 $514,175 $ 61,462Exercise of common stock
options . . . . . . . . . . . 72,348 — 340 — — — 340 — 340Employee stock purchase
plan . . . . . . . . . . . . 508,067 1 4,125 — — — 4,126 — 4,126Purchases of stock for
treasury . . . . . . . . . . (1,577,500) — — — (12,915) — (12,915) — (12,915)Employee stock-based
compensation. . . . . . . . — — 26,287 — — — 26,287 — 26,287Write-off of employee stock-
based compensationrelated deferred tax assets . — — (617) — — — (617) — (617)
Affiliate cash dividend paidto noncontrolling interest . — — — — — — — (201) (201)
Translation losses . . . . . . — — — (730) — — (730) — (730) $ (730)Unrealized losses on
available-for-sale securities,net . . . . . . . . . . . . . — — — (58) — — (58) — (58) (58)
Net loss . . . . . . . . . . . — — — — — (37,323) (37,323) (746) (38,069) (37,323)
Balance at April 30, 2009 . . . 50,049,284 63 403,159 773 (178,683) 263,529 488,841 3,497 492,338 $(38,111)
Exercise of common stockoptions . . . . . . . . . . . 1,128,065 2 11,247 — — — 11,249 — 11,249
Employee stock purchaseplan . . . . . . . . . . . . 897,548 — 4,630 — — — 4,630 — 4,630
Employee stock-basedcompensation. . . . . . . . — — 23,467 — — — 23,467 — 23,467
Write-off of employee stock-based compensationrelated deferred tax assets . — — (1,426) — — — (1,426) — (1,426)
Cash contribution bynoncontrolling interest . . . — — — — — — — 34 34
Translation gains . . . . . . . — — — 176 — — 176 180 356 $ 176Unrealized losses on
available-for-sale securities,net . . . . . . . . . . . . . — — — (79) — — (79) — (79) (79)
Net income (loss) . . . . . . — — — — — 6,724 6,724 (321) 6,403 6,724
Balance at April 30, 2010 . . . 52,074,897 65 441,077 870 (178,683) 270,253 533,582 3,390 536,972 $ 6,821
Exercise of common stockoptions . . . . . . . . . . . 5,396,391 5 70,811 — — — 70,816 — 70,816
Employee stock purchaseplan . . . . . . . . . . . . 503,162 1 5,372 — — — 5,373 — 5,373
Withholding tax deduction onrestricted stock units . . . . — — (2,268) — — — (2,268) — (2,268)
Employee stock-basedcompensation. . . . . . . . — — 19,846 — — — 19,846 — 19,846
Tax benefits from stockdeduction . . . . . . . . . — — 609 — — — 609 — 609
Write-off of employee stock-based compensationrelated deferred tax assets . — — (1,671) — — — (1,671) — (1,671)
Translation losses . . . . . . — — — (62) — — (62) (70) (132) $ (62)Unrealized gains on
available-for-sale securities,net . . . . . . . . . . . . . — — — 618 — — 618 — 618 618
Net income (loss) . . . . . . — — — — — 124,482 124,482 (32) 124,450 124,482Deconsolidation of SOI . . . — — — — — — — (3,288) (3,288) —
Balance at April 30, 2011 . . . 57,974,450 $71 $533,776 $1,426 $(178,683) $394,735 $751,325 $ — $751,325 $125,038
The accompanying notes are an integral part of these consolidated financial statements.
74

OMNIVISION TECHNOLOGIES, INC.
CONSOLIDATED STATEMENTS OF CASH FLOWS(In thousands)
Year Ended April 30,
2011 2010 2009
Cash flows from operating activities:Net income (loss) . . . . . . . . . . . . . . . . . . . . . . . . . . . . . . . . . . . . . . . . . . . . . . . . . . . . . . . $ 124,450 $ 6,403 $(38,069)
Adjustments to reconcile net income (loss) to net cash provided by operating activities:Depreciation and amortization . . . . . . . . . . . . . . . . . . . . . . . . . . . . . . . . . . . . . . . . . . . . . 20,564 22,711 19,053Change in fair value of interest rate swap . . . . . . . . . . . . . . . . . . . . . . . . . . . . . . . . . . . . . . . 242 (776) 2,234Stock-based compensation . . . . . . . . . . . . . . . . . . . . . . . . . . . . . . . . . . . . . . . . . . . . . . . 19,846 23,467 26,287Tax effect from stock-based compensation . . . . . . . . . . . . . . . . . . . . . . . . . . . . . . . . . . . . . . 609 — —(Gain) loss on equity investments, net . . . . . . . . . . . . . . . . . . . . . . . . . . . . . . . . . . . . . . . . . (13,186) (7,016) 382Write-down of inventories . . . . . . . . . . . . . . . . . . . . . . . . . . . . . . . . . . . . . . . . . . . . . . . 18,250 19,249 22,085Excess tax benefits from stock-based compensation . . . . . . . . . . . . . . . . . . . . . . . . . . . . . . . . . (100) — —Loss on disposal of property, plant and equipment . . . . . . . . . . . . . . . . . . . . . . . . . . . . . . . . . 26 111 550Goodwill impairment . . . . . . . . . . . . . . . . . . . . . . . . . . . . . . . . . . . . . . . . . . . . . . . . . . — — 7,541Changes in assets and liabilities:
Accounts receivable, net . . . . . . . . . . . . . . . . . . . . . . . . . . . . . . . . . . . . . . . . . . . . . . . (68,435) (30,258) 61,350Inventories . . . . . . . . . . . . . . . . . . . . . . . . . . . . . . . . . . . . . . . . . . . . . . . . . . . . . . . 5,578 (45,194) (10,573)Prepaid and deferred income taxes . . . . . . . . . . . . . . . . . . . . . . . . . . . . . . . . . . . . . . . . . 5,611 (2,658) (3,396)Prepaid expenses and other assets . . . . . . . . . . . . . . . . . . . . . . . . . . . . . . . . . . . . . . . . . . 3,203 (274) 341Accounts payable . . . . . . . . . . . . . . . . . . . . . . . . . . . . . . . . . . . . . . . . . . . . . . . . . . . 18,682 51,903 (36,662)Accrued expenses and other current liabilities . . . . . . . . . . . . . . . . . . . . . . . . . . . . . . . . . . . (151) 2,397 (5,086)Income taxes payable . . . . . . . . . . . . . . . . . . . . . . . . . . . . . . . . . . . . . . . . . . . . . . . . . (2,718) 7,357 1,304Deferred revenues, less cost of revenues . . . . . . . . . . . . . . . . . . . . . . . . . . . . . . . . . . . . . . 5,863 3,476 (1,054)Deferred tax liabilities . . . . . . . . . . . . . . . . . . . . . . . . . . . . . . . . . . . . . . . . . . . . . . . . (1,040) (2,599) (1,049)
Net cash provided by operating activities . . . . . . . . . . . . . . . . . . . . . . . . . . . . . . . . . . . . 137,294 48,299 45,238
Cash flows from investing activities:Purchases of short-term investments . . . . . . . . . . . . . . . . . . . . . . . . . . . . . . . . . . . . . . . . . . . (161,886) (135,004) (59,210)Proceeds from sales or maturities of short-term investments . . . . . . . . . . . . . . . . . . . . . . . . . . . . . 170,247 52,149 93,876Purchases of property, plant and equipment, net of sales . . . . . . . . . . . . . . . . . . . . . . . . . . . . . . . (10,313) (13,516) (32,227)Purchases of long-term investments . . . . . . . . . . . . . . . . . . . . . . . . . . . . . . . . . . . . . . . . . . . (282) — (1,376)Purchase of intangible and other assets . . . . . . . . . . . . . . . . . . . . . . . . . . . . . . . . . . . . . . . . . (63,500) — —Proceeds from sale of SOI . . . . . . . . . . . . . . . . . . . . . . . . . . . . . . . . . . . . . . . . . . . . . . . . 3,844 — —Deconsolidation of SOI . . . . . . . . . . . . . . . . . . . . . . . . . . . . . . . . . . . . . . . . . . . . . . . . . . (2,816) — —Payment for the acquisition of Aurora, net of cash acquired . . . . . . . . . . . . . . . . . . . . . . . . . . . . . — (5,109) —
Net cash provided by (used in) investing activities . . . . . . . . . . . . . . . . . . . . . . . . . . . . . . . (64,706) (101,480) 1,063
Cash flows from financing activities:Proceeds from long-term borrowings . . . . . . . . . . . . . . . . . . . . . . . . . . . . . . . . . . . . . . . . . . . — 16,847 6,000Repayment of long-term borrowings . . . . . . . . . . . . . . . . . . . . . . . . . . . . . . . . . . . . . . . . . . . (4,303) (3,555) (2,926)Payment of capital lease obligations . . . . . . . . . . . . . . . . . . . . . . . . . . . . . . . . . . . . . . . . . . . — — (133)Cash contribution by noncontrolling interest . . . . . . . . . . . . . . . . . . . . . . . . . . . . . . . . . . . . . . — 34 —Affiliate cash dividend paid to noncontrolling interest . . . . . . . . . . . . . . . . . . . . . . . . . . . . . . . . . — — (201)Proceeds from exercise of stock options and employee stock purchase plan . . . . . . . . . . . . . . . . . . . . . 76,189 15,936 4,466Excess tax benefits from stock-based compensation . . . . . . . . . . . . . . . . . . . . . . . . . . . . . . . . . . 100 — —Payments for repurchases of common stock . . . . . . . . . . . . . . . . . . . . . . . . . . . . . . . . . . . . . . . — — (12,915)
Net cash provided by (used in) financing activities . . . . . . . . . . . . . . . . . . . . . . . . . . . . . . . 71,986 29,262 (5,709)
Effect of exchange rate changes on cash and cash equivalents . . . . . . . . . . . . . . . . . . . . . . . . . . . . . . 782 134 (124)
Net increase (decrease) in cash and cash equivalents . . . . . . . . . . . . . . . . . . . . . . . . . . . . . . . . . . . 145,356 (23,785) 40,468Cash and cash equivalents at beginning of period . . . . . . . . . . . . . . . . . . . . . . . . . . . . . . . . . . . . . 234,023 257,808 217,340
Cash and cash equivalents at end of period . . . . . . . . . . . . . . . . . . . . . . . . . . . . . . . . . . . . . . . . $ 379,379 $ 234,023 $257,808
Supplemental cash flow information:Taxes paid, net . . . . . . . . . . . . . . . . . . . . . . . . . . . . . . . . . . . . . . . . . . . . . . . . . . . . . . . $ 1,411 $ 3,307 $ 3,096
Interest paid, net of amount capitalized . . . . . . . . . . . . . . . . . . . . . . . . . . . . . . . . . . . . . . . . . $ 2,834 $ 2,119 $ 1,832
Supplemental schedule of non-cash investing and financing activities:Additions to property, plant and equipment included in accounts payable and accrued expenses and other
current liabilities . . . . . . . . . . . . . . . . . . . . . . . . . . . . . . . . . . . . . . . . . . . . . . . . . . . . . $ 2,550 $ 4,739 $ 7,728
Capitalized interest and other costs . . . . . . . . . . . . . . . . . . . . . . . . . . . . . . . . . . . . . . . . . . . $ — $ 103 $ 183
Write-off of employee stock-based compensation-related deferred tax assets . . . . . . . . . . . . . . . . . . . . $ 1,671 $ 1,426 $ 617
Purchase of intangible assets included in accrued expenses and other current liabilities . . . . . . . . . . . . . . $ 6,500 $ — $ —
The accompanying notes are an integral part of these consolidated financial statements.
75

OMNIVISION TECHNOLOGIES, INC.
NOTES TO CONSOLIDATED FINANCIAL STATEMENTSFor the Years Ended April 30, 2011, 2010 and 2009
Note 1—Basis of Presentation
The Company
OmniVision Technologies, Inc. and its subsidiaries (‘‘OmniVision’’ or the ‘‘Company’’) design,develop, manufacture and market image-sensor devices. The Company’s main product, a semiconductorimage-sensing device called the CameraChip�, is used to capture images electronically and is used in anumber of consumer and commercial mass-market applications. The Company’s CameraChip imagesensor is manufactured using the complementary metal oxide semiconductor (‘‘CMOS’’) fabricationprocess. The Company has also integrated its CameraChip image sensor with wafer-level optics, andmarketed the integrated device as a CameraCube� imaging device. The Company was incorporated inCalifornia in May 1995 and reincorporated in Delaware in March 2000.
The results of operations for the fiscal year ended April 30, 2011 are not necessarily indicative ofthe results that may be expected for the fiscal year ending April 30, 2012 or any other future period.
Use of Estimates
The preparation of financial statements in conformity with accounting principles generally acceptedin the United States of America (‘‘GAAP’’) requires management to make estimates and assumptionsthat affect the reported amounts of assets and liabilities, the disclosure of contingent assets andliabilities at the date of the financial statements and the reported amounts of revenues and expensesduring the reporting period. The Company bases its estimates and judgments on its historicalexperience, knowledge of current conditions and beliefs of what could occur in the future consideringavailable information. Actual results could differ from these estimates.
Note 2—Summary of Significant Accounting Policies
Principles of Consolidation
The consolidated financial statements include the accounts of the Company, its wholly-ownedsubsidiaries and its consolidated affiliate. All significant inter-company accounts and transactions havebeen eliminated.
Foreign Currency Translation
Certain of the Company’s subsidiaries have functional currencies other than the U.S. dollar andthe assets and liabilities of the subsidiaries are translated into U.S. dollars at the rates of exchangeprevailing on the balance sheet date. Revenue and expense items are translated into U.S. dollars at theaverage rate of exchange for the period. Unrealized gains and losses from foreign currency translationare included in ‘‘Accumulated other comprehensive income,’’ a component of stockholders’ equity. Forsubsidiaries with the U.S. dollar as the functional currency, and with assets or liabilities denominated incurrencies other than the U.S. dollar, non-monetary assets are remeasured into U.S. dollars usinghistorical rates of exchange. Monetary assets and liabilities are remeasured into U.S. dollars usingexchange rates prevailing on the balance sheet date. The remeasurement gains or losses are included in‘‘Other income (expense), net.’’ For fiscal 2011 and 2010, the Company recorded remeasurement gainsof $1.4 million and $289,000, respectively, in ‘‘Other income (expense), net.’’ For fiscal 2009, theCompany recorded remeasurement losses of $0.9 million in ‘‘Other income (expense), net.’’
76

OMNIVISION TECHNOLOGIES, INC.
NOTES TO CONSOLIDATED FINANCIAL STATEMENTS—(Continued)For the Years Ended April 30, 2011, 2010 and 2009
Note 2—Summary of Significant Accounting Policies—(Continued)
Cash and Cash Equivalents
The Company considers all highly liquid investments purchased with a maturity at the date ofpurchase of three months or less to be cash equivalents. Cash equivalents consist principally ofcertificates of deposit and money market funds. (See Note 4.)
The Company maintains the majority of its cash and cash equivalent balances with major financialinstitutions in the United States, Cayman Islands and Hong Kong. These balances are subject to aconcentration of credit risk and only a small proportion of these balances are covered by FederalDeposit Insurance Corporation (‘‘FDIC’’) insurance. The Company places its cash investments ininstruments that meet high credit quality standards, as specified in the Company’s investment policyguidelines.
Short-Term Investments
The Company’s short-term investments, which are classified as available-for-sale securities, areinvested in high-grade corporate securities, municipal bonds and notes and U.S. government debt andagencies securities with a final maturity of eighteen months or less from the date of purchase.
Short-term investments are reported at fair value at April 30, 2011 and 2010. Unrealized gains orlosses are recorded in stockholders’ equity and included in ‘‘Accumulated other comprehensiveincome.’’ Short-term investments with declines in value which are judged to be other than temporary,of which there were none in the periods presented, would be written down to their fair values, at thetime such judgment is made.
Accounts Receivable
Accounts receivable are recorded at invoiced amounts and do not bear interest. The Companyperforms ongoing credit evaluations of its customers’ financial condition and, generally, requires nocollateral from its customers. Allowances for doubtful accounts and sales returns are established basedon various factors including credit profiles of the Company’s customers, contractual terms andconditions, historical payments, returns and discounts experience, and current economic trends. TheCompany reviews its allowance for doubtful accounts quarterly by assessing individual accountsreceivable over a specific aging and amount, and all other balances on a pooled basis based onhistorical collection experience and economic risk assessment. Accounts receivable are written off on acase-by-case basis, net of any amounts that may be collected. The Company determines its allowancefor sales returns through evaluation of historical sales returns and other known factors and provides forestimated sales returns in the same period it records the related revenues. To estimate the allowancefor sales returns, the Company analyzes potential customer specific product application issues, potentialquality and reliability issues and historical returns. The Company evaluates the adequacy of theallowance for sales returns on a quarterly basis. This allowance is reflected as a reduction to accountsreceivable in the Company’s consolidated balance sheets. Increases to the allowance are recorded as areduction to revenues.
77

OMNIVISION TECHNOLOGIES, INC.
NOTES TO CONSOLIDATED FINANCIAL STATEMENTS—(Continued)For the Years Ended April 30, 2011, 2010 and 2009
Note 2—Summary of Significant Accounting Policies—(Continued)
Fair Value of Financial Instruments
Due to their short maturities, the reported amounts of the Company’s financial instruments,including cash and cash equivalents, short-term investments, accounts receivable, accounts payable andother current liabilities approximate fair value.
The fair values of the Company’s mortgage loan, term loan and construction loan approximatebook value as the underlying interest rates are based on risk-adjusted market rates. (See Note 8.)
Related to the mortgage debt, the Company has also entered into two interest rate swaparrangements. For such derivative instruments, the Company recognizes them at the reporting date aseither an asset or liability in its Consolidated Balance Sheets measured at fair value. The accounting forchanges in fair value of a derivative depends on the intended use of the derivative and the associatedhedging designation. The Company has designated the swaps as economic hedges and records thechanges in fair value in ‘‘Other income (expense), net.’’ (See Note 8.)
Property, Plant and Equipment
Property, plant and equipment, including land-use rights, is stated at cost less accumulateddepreciation and amortization. Depreciation is computed using the straight-line method over theestimated useful lives of the assets as follows:
Buildings . . . . . . . . . . . . . . . . . . . . . . . . . . . . . 40 yearsBuilding/leasehold improvements . . . . . . . . . . . Shorter of 20 years or life of leaseMachinery and equipment . . . . . . . . . . . . . . . . 3 - 10 yearsFurniture and fixtures . . . . . . . . . . . . . . . . . . . 3 - 7 yearsLand-use rights . . . . . . . . . . . . . . . . . . . . . . . . Life of right, currently 50 years
Construction in progress includes project costs paid to third parties that are clearly associated withthe acquisition, development, and construction of an asset and are capitalized as a cost of that projectprior to the use of the asset. Such costs include the costs of materials, interest, legal, and escrowservices. These capitalized project costs are not subject to depreciation until the assets to which theyare related are placed into production.
One of the Company’s wholly-owned subsidiary, OmniVision Semiconductor (Shanghai) Co. Ltd.(‘‘OSC’’), formerly Hua Wei Semiconductor (Shanghai) Co. Ltd., holds a ‘‘land use right’’ that wasacquired from the local Chinese government in December 2000 for approximately $0.8 million, andentitles the Company to use the land for 50 years. The cost of the land use right was recorded as acomponent of property, plant and equipment and is being depreciated over 50 years, the useful life ofthe right.
In addition, in January 2007, the Company, through its wholly-owned subsidiary, OmniVisionTechnologies (Shanghai) Co. Ltd. (‘‘OTC’’), formerly Shanghai OmniVision IC Design Co. Ltd.,entered into a Land-Use-Right Purchase Agreement (the ‘‘Purchase Agreement’’) with theConstruction and Transportation Commission of the Pudong New District, Shanghai. The PurchaseAgreement has an effective date of December 31, 2006. Under the terms of the Purchase Agreement,the Company paid an aggregate amount of approximately $0.6 million in exchange for the right to useapproximately 323,000 square feet of land located in Shanghai, China, for a period of 50 years. The
78

OMNIVISION TECHNOLOGIES, INC.
NOTES TO CONSOLIDATED FINANCIAL STATEMENTS—(Continued)For the Years Ended April 30, 2011, 2010 and 2009
Note 2—Summary of Significant Accounting Policies—(Continued)
cost of the land use right was recorded as a component of property, plant and equipment and is beingdepreciated over 50 years, the useful life of the right.
Long-Lived Assets
The Company reviews its long-lived assets, including intangible assets, for impairment wheneverevents or changes in circumstances indicate that the carrying amount of an asset might not berecoverable. When such an event occurs, the Company estimates the future cash flows expected toresult from the use of the asset and its eventual disposition. If the undiscounted expected future cashflows are less than the carrying amount of the asset, an impairment loss is recognized in order towrite-down the carrying value of the asset to its estimated fair market value. To date, the Company hasnot recognized any impairment losses.
Inventories
Inventories are stated at the lower of cost, determined on a first-in, first-out (‘‘FIFO’’) basis, ormarket.
The Company records a provision to reduce the carrying value of inventories to their net realizablevalue when the Company believes that the net realizable value is less than cost. The Company alsorecords a provision for the cost of inventories when the number of units on hand exceeds the numberof units that the Company forecasts will be sold over a certain period of time, generally 12 months.Where necessary, these provisions take into account the inventories owned and not yet sold by certainof the Company’s distributors. The recording of these provisions establishes a new and lower cost basisfor each specifically identified inventory item, and the Company does not restore the cost basis to itsoriginal level regardless of any subsequent changes in facts or circumstances. Recoveries are onlyrecognized upon the sale of previously written-down inventories.
Goodwill
The Company records goodwill when the consideration paid for an acquisition exceeds the fairvalue of net tangible and intangible assets acquired, including related tax effects. Goodwill is notamortized; instead goodwill is tested for impairment on an annual basis, or more frequently if theCompany believes indicators of impairment exist. The performance of the test involves a two-stepprocess. The first step requires comparing the fair value of the reporting unit to its net book value,including goodwill. A potential impairment exists if the fair value of the reporting unit is lower than itsnet book value. The second step of the process, which is performed only if a potential impairmentexists, involves determining the difference between the fair value of the reporting unit’s net assets otherthan goodwill and the fair value of the reporting unit. If this difference is less than the net book valueof goodwill, an impairment exists and is recorded. During the second quarter of fiscal 2009, based on acombination of factors, including the significant decline in the Company’s market capitalization and theglobal economic downturn then, the Company concluded that there were sufficient factualcircumstances for interim impairment analyses. Based on the analyses, the Company wrote off thecarrying value of goodwill and recorded an impairment charge of $7.5 million, which was included in‘‘Goodwill impairment’’ for fiscal 2009. (See Note 7.)
79

OMNIVISION TECHNOLOGIES, INC.
NOTES TO CONSOLIDATED FINANCIAL STATEMENTS—(Continued)For the Years Ended April 30, 2011, 2010 and 2009
Note 2—Summary of Significant Accounting Policies—(Continued)
Warranty for Defective Products
The Company warrants to its customers that its products will work in accordance with eachproduct’s specifications. Due to the cost and other complexities associated with rectifying any productdefects, the Company does not repair any defective products. If a product is defective, the customernotifies the Company and, with the Company’s approval, returns the defective product. The Companythen sends replacement products to the customer. Accordingly, the Company accounts for any exposurerelated to defective products as a portion of its allowance for sales returns.
Treasury Stock
The Company accounts for treasury stock under the cost method and includes treasury stock as acomponent of stockholders’ equity.
Revenue Recognition
For shipments to customers without agreements that allow for returns or credits, principallyoriginal equipment manufacturers (‘‘OEMs’’) and value added resellers (‘‘VARs’’), the Companyrecognizes revenue using the ‘‘sell-in’’ method. Under this method, the Company recognizes revenueupon the shipment of products to the customer provided that the Company has received a signedpurchase order, the price is fixed or determinable, title and risk of loss has transferred to the customer,collection of resulting receivables is considered reasonably assured, product returns are reasonablyestimable, there are no customer acceptance requirements and there are no remaining materialobligations. At the time revenue is recognized, the Company provides for future returns of potentiallydefective product based on historical experience. For cash consideration given to customers, that isprimarily in the form of rebates and for which the Company does not receive a separately identifiablebenefit or cannot reasonably estimate fair value, the Company records the amounts as reductions ofrevenue.
For shipment of products sold to distributors under agreements allowing for returns or credits, titleand the risk of ownership to the products transfer to the distributor upon shipment, and the distributoris obligated to pay for the products whether or not the distributor has sold them at the time payment isdue. Under the terms of the Company’s agreements with such distributors and subject to theCompany’s prior approval, distributors are entitled to reclaim from the Company as price adjustmentsthe difference, if any, between the prices at which the Company sold the product to the distributorsand the prices at which the product is subsequently sold by the distributor. In addition, distributorshave limited rights to return inventory that they determine is in excess of their requirements, andaccordingly, in determining the appropriate level of provision for excess and obsolete inventory, theCompany takes into account the inventories held by its distributors. For these reasons, prices andrevenues are not fixed or determinable until the distributor resells the products to the Company’send-user customers and the distributor notifies the Company in writing of the details of such salestransactions. Accordingly, the Company recognizes revenue using the ‘‘sell-through’’ method. Under the‘‘sell-through’’ method, the Company defers the revenue, adjustments to revenue and the related costsof revenue until the final resale of such products to end customers. The amounts billed to thesedistributors and adjustments to revenue and the cost of inventory shipped to, but not yet sold by, the
80

OMNIVISION TECHNOLOGIES, INC.
NOTES TO CONSOLIDATED FINANCIAL STATEMENTS—(Continued)For the Years Ended April 30, 2011, 2010 and 2009
Note 2—Summary of Significant Accounting Policies—(Continued)
distributors are shown net on the Consolidated Balance Sheets as ‘‘Deferred revenues, less cost ofrevenues.’’
Research, Development and Related
The Company recognizes the costs associated with the internal development of intellectualproperty rights as expense when incurred. Also included in ‘‘Research, Development and Related’’ areexpenses associated with patent, copyright, trademark and trade secrets. The Company recorded thefollowing research and development expenses for the periods presented (in thousands):
Year Ended April 30,
2011 2010 2009
Research and development expenses . . . . . . . . . . . . . . $85,739 $76,103 $81,965
Amortization of Acquired Patent Portfolio
The Company recognizes amortization charge associated with the patent portfolio acquired fromEastman Kodak Company (‘‘Kodak’’) as ‘‘Amortization of acquired patent portfolio.’’ (See Note 7.)
Advertising
All of the Company’s advertising costs are expensed as incurred.
Income Taxes
The Company accounts for deferred income taxes using the liability method, under which itrecognizes as deferred tax assets and liabilities the expected future tax consequences of timingdifferences between the book and tax basis of assets and liabilities. The Company establishes valuationallowances to reduce deferred tax assets as necessary when management estimates, based on availableobjective evidence, that it is more likely than not that the Company will not realize the benefit of itsdeferred tax assets.
The Company recognizes in its consolidated financial statements the impact of a tax position that,based on the technical merits of the position, is more likely than not to be sustained upon examination.The evaluation of a tax position in accordance with this interpretation is a two-step process. In the firststep, recognition, the Company determines whether it is more-likely-than-not that a tax position will besustained upon examination, including resolution of any related appeals or litigation processes, basedon the technical merits of the position. The second step addresses measurement of a tax position thatmeets the more-likely-than-not criterion. The tax position is measured at the largest amount of benefitthat has a greater than 50 percent likelihood of being realized upon ultimate settlement. Tax positionsthat previously failed to meet the more-likely-than-not recognition threshold will be recognized in thefirst subsequent financial reporting period in which that threshold is met. Previously recognized taxpositions that no longer meet the more-likely-than-not recognition threshold will be de-recognized inthe first subsequent financial reporting period in which that threshold is no longer met.
81

OMNIVISION TECHNOLOGIES, INC.
NOTES TO CONSOLIDATED FINANCIAL STATEMENTS—(Continued)For the Years Ended April 30, 2011, 2010 and 2009
Note 2—Summary of Significant Accounting Policies—(Continued)
Stock-Based Compensation
The Company recognizes in its consolidated financial statements all share-based payments toemployees, including grants of employee stock options and of other stock-based compensation underthe 2000 Stock Plan and the 2007 Equity Incentive Plan, and employee stock purchases under the 2000Employee Stock Purchase Plan and the 2009 Employee Stock Purchase Plan, based on their respectivegrant date fair values. The 2007 Equity Incentive Plan replaced the 2000 Stock Plan, and the 2009Employee Stock Purchase Plan replaced the 2000 Employee Stock Purchase Plan.
Stock-based compensation is measured at the grant date, based on the fair value of the awardusing the Black-Scholes option pricing model (‘‘Black-Scholes’’), and is recognized as expense over therequisite service period of the award. The Company has chosen to recognize stock-based compensationexpense using the straight-line attribution method. Black-Scholes requires the use of highly subjective,complex assumptions, including the expected term and the price volatility of the Company’s stock. TheCompany is required to estimate forfeiture rates at the time of grant and revise such estimates, ifnecessary, in subsequent periods if actual forfeitures differ from initial estimates. Stock-basedcompensation expense was recorded net of estimated forfeitures such that expense was recorded onlyfor those stock-based awards that are expected to vest.
The Company elected to use the long-form method to establish the beginning balance of, and todetermine the subsequent impact on, the additional paid-in capital pool. The Company has also electedto use the ‘‘with and without’’ approach in determining the order in which tax attributes are utilized. Asa result, the Company will recognize a tax benefit from stock-based awards in additional paid-in capitalonly if an incremental tax benefit is realized after all other tax attributes currently available to theCompany have been utilized. In addition, the Company has elected to account for the indirect effectsof stock-based awards on other tax attributes, such as research and development tax credits, throughthe Consolidated Statements of Operations.
Comprehensive Income (Loss)
Comprehensive income (loss) is defined as the change in the equity of a company during a periodfrom transactions and other events and circumstances excluding transactions resulting from investmentsby owners and distributions to owners. Comprehensive income for fiscal 2011 was $125.0 million andincluded net income, net unrealized gains from available-for-sale securities and translation losses fromforeign subsidiaries. Comprehensive income for fiscal 2010 was $6.8 million and included net income,net unrealized losses from available-for-sale securities and translation gains from foreign subsidiaries.Comprehensive loss for fiscal 2009 was $38.1 million and included net loss, the impact of the initialadoption of uncertain tax position accounting standard on retained earnings, net unrealized loss onavailable-for-sale securities and foreign currency translation losses from foreign subsidiaries.
Basic and Diluted Net Income (Loss) Per Share
The Company computes net income (loss) per share in accordance with authoritative guidance forearnings per share, under the provisions of which basic income (loss) per share is computed by dividingthe income (loss) available to holders of common stock for the period by the weighted average numberof shares of common stock outstanding during the period. The calculation of diluted income (loss) pershare excludes potential common stock if the effect of such stock is antidilutive. Potential common
82

OMNIVISION TECHNOLOGIES, INC.
NOTES TO CONSOLIDATED FINANCIAL STATEMENTS—(Continued)For the Years Ended April 30, 2011, 2010 and 2009
Note 2—Summary of Significant Accounting Policies—(Continued)
stock consists of incremental common shares issuable upon the exercise of stock options, purchases viaemployee stock purchase plans, and vesting of restricted stock units.
Noncontrolling Interest
Noncontrolling interest in the Company’s consolidated financial statements results from theaccounting for the ownership interests in Silicon Optronics, Inc. (‘‘SOI’’) held by parties other than theCompany. In fiscal 2011, 2010 and 2009, the Company recorded approximately $32,000, $321,000 and$0.7 million, respectively, as net loss attributable to noncontrolling interest, representing a respective56.3%, 56.2% and 56.1% interest that the Company did not own in the net loss of SOI. In the threemonths ended January 31, 2011, the Company sold its remaining 43.7% interest in SOI for netproceeds of $3.8 million. Consequently, as of April 30, 2011, the Company had no continuinginvestment in SOI. (See Note 5.)
Recent Accounting Pronouncements
In October 2009, the FASB revised the authoritative guidance for revenue recognition forarrangements with multiple deliverables. The new guidance modifies the requirements for determiningwhether a deliverable can be treated as a separate unit of accounting by removing the criteria thatverifiable and objective evidence of fair value exists for the undelivered elements. In allocatingtransaction consideration among the deliverables, the guidance also introduced the concept of usingmanagement’s best estimate of a standalone selling price as an alternate basis for allocation. Theguidance is effective in fiscal years beginning on or after June 15, 2010, and the Company is requiredto adopt this guidance in its first quarter of fiscal 2012. The Company does not expect the adoption ofthis guidance to have any material impact on its financial position, results of operations or cash flows.
In October 2009, the FASB issued authoritative guidance addressing certain revenue arrangementsthat include software elements. This guidance states that tangible products with hardware and softwarecomponents that work together to deliver the product functionality are considered non-softwareproducts, and the accounting guidance under the revenue arrangements with multiple deliverables is tobe followed. The guidance is effective in fiscal years beginning on or after June 15, 2010, and theCompany is required to adopt this guidance in its first quarter of fiscal 2012. The Company does notexpect the adoption of this guidance to have any material impact on its financial position, results ofoperations or cash flows.
In December 2010, the FASB issued additional guidance for entities with reporting units that havecarrying amounts equal to zero or are negative. These entities are required to assess whether it is morelikely than not that the reporting units’ goodwill is impaired. If it is determined that it is more likelythan not that the goodwill of one or more of its reporting units is impaired, then Step 2 of the goodwillimpairment test for those reporting unit(s) should be performed. The effective date for this guidance isfor fiscal years, and interim periods within those years, beginning after December 15, 2010. Earlyadoption is not permitted. The Company does not expect the adoption of this guidance to have anymaterial impact on its financial position, results of operations or cash flows.
In May 2011, the FASB issued new guidance for fair value measurements to provide a consistentdefinition of fair value and ensure that the fair value measurement and disclosure requirements aresimilar between GAAP and International Financial Reporting Standards. The guidance changes certain
83

OMNIVISION TECHNOLOGIES, INC.
NOTES TO CONSOLIDATED FINANCIAL STATEMENTS—(Continued)For the Years Ended April 30, 2011, 2010 and 2009
Note 2—Summary of Significant Accounting Policies—(Continued)
fair value measurement principles and enhances the disclosure requirements particularly for level 3 fairvalue measurements. The guidance is effective for the Company prospectively beginning in the firstquarter of fiscal 2012. The Company is currently evaluating the impact this guidance may have on itsfinancial position, results of operations and cash flows.
Note 3—Short-Term Investments
Available-for-sale securities as of the dates presented were as follows (in thousands):
As of April 30, 2011
Gross GrossAmortized Unrealized Unrealized Fair
Cost Gains Losses Value
Certificates of deposit . . . . . . . . . . . . . . . . . . . . . . . . . . . . $ 1,500 $ 3 $ — $ 1,503U.S. government debt securities with maturities less than
one year . . . . . . . . . . . . . . . . . . . . . . . . . . . . . . . . . . . . 61,862 11 (7) 61,866U.S. government debt securities with maturities over one
year . . . . . . . . . . . . . . . . . . . . . . . . . . . . . . . . . . . . . . . 718 1 — 719Commercial paper and bond funds . . . . . . . . . . . . . . . . . . 23,412 10 (5) 23,417
$87,492 $25 $(12) $87,505
Contractual maturity dates, less than one year . . . . . . . . . . $82,721Contractual maturity dates, one year to two years . . . . . . . . 4,784
$87,505
As of April 30, 2010
Gross GrossAmortized Unrealized Unrealized Fair
Cost Gains Losses Value
Certificates of deposit . . . . . . . . . . . . . . . . . . . . . . . . . . . . $ 2,285 $— $ — $ 2,285U.S. government debt securities with maturities less than
one year . . . . . . . . . . . . . . . . . . . . . . . . . . . . . . . . . . . . 77,128 12 — 77,140U.S. government debt securities with maturities over one
year . . . . . . . . . . . . . . . . . . . . . . . . . . . . . . . . . . . . . . . 8,145 5 — 8,150Commercial paper and bond funds . . . . . . . . . . . . . . . . . . 11,999 (19) 11,980
$99,557 $17 $(19) $99,555
Contractual maturity dates, less than one year . . . . . . . . . . $91,405Contractual maturity dates, one year to two years . . . . . . . . 8,150
$99,555
The Company sold available-for-sale investments, primarily marketable debt instruments, forproceeds of approximately $45.5 million, zero and zero in fiscal 2011, 2010 and 2009, respectively. TheCompany employs the specific-identification method in the determination of any applicable gain or losson the sale of the investment.
84

OMNIVISION TECHNOLOGIES, INC.
NOTES TO CONSOLIDATED FINANCIAL STATEMENTS—(Continued)For the Years Ended April 30, 2011, 2010 and 2009
Note 4—Supplemental Balance Sheet Account Information (in thousands)
April 30,
2011 2010
Cash and cash equivalents:Cash . . . . . . . . . . . . . . . . . . . . . . . . . . . . . . . . . . . . . . . . . . . . . . . . . . . . . . $272,481 $183,393Money market funds, certificates of deposit and U.S. government bonds . . . . . . . . . . . . . 106,898 50,630
$379,379 $234,023
Accounts receivable, net:Accounts receivable . . . . . . . . . . . . . . . . . . . . . . . . . . . . . . . . . . . . . . . . . . . . . $146,745 $ 75,908Less: Allowance for doubtful accounts . . . . . . . . . . . . . . . . . . . . . . . . . . . . . . . . . . (1,834) (711)
Allowance for sales returns . . . . . . . . . . . . . . . . . . . . . . . . . . . . . . . . . . . . . . . (2,305) (936)
$142,606 $ 74,261
Inventories:Work in progress . . . . . . . . . . . . . . . . . . . . . . . . . . . . . . . . . . . . . . . . . . . . . . . $ 62,393 $ 76,845Finished goods . . . . . . . . . . . . . . . . . . . . . . . . . . . . . . . . . . . . . . . . . . . . . . . . 44,480 57,148
$106,873 $133,993
Prepaid expenses and other current assets:Prepaid expenses . . . . . . . . . . . . . . . . . . . . . . . . . . . . . . . . . . . . . . . . . . . . . . . $ 4,102 $ 6,398Deposits and other . . . . . . . . . . . . . . . . . . . . . . . . . . . . . . . . . . . . . . . . . . . . . . 4,699 2,686Interest receivable . . . . . . . . . . . . . . . . . . . . . . . . . . . . . . . . . . . . . . . . . . . . . . 870 296
$ 9,671 $ 9,380
Property, plant and equipment, net:Land . . . . . . . . . . . . . . . . . . . . . . . . . . . . . . . . . . . . . . . . . . . . . . . . . . . . . . $ 13,000 $ 13,000Buildings and land use right . . . . . . . . . . . . . . . . . . . . . . . . . . . . . . . . . . . . . . . . 58,781 37,877Buildings/leasehold improvements . . . . . . . . . . . . . . . . . . . . . . . . . . . . . . . . . . . . . 21,902 19,148Machinery and equipment . . . . . . . . . . . . . . . . . . . . . . . . . . . . . . . . . . . . . . . . . 68,710 64,894Furniture and fixtures . . . . . . . . . . . . . . . . . . . . . . . . . . . . . . . . . . . . . . . . . . . . 4,817 4,810Software . . . . . . . . . . . . . . . . . . . . . . . . . . . . . . . . . . . . . . . . . . . . . . . . . . . . 6,387 5,873Construction in progress . . . . . . . . . . . . . . . . . . . . . . . . . . . . . . . . . . . . . . . . . . 4,932 23,419
178,529 169,021Less: Accumulated depreciation and amortization . . . . . . . . . . . . . . . . . . . . . . . . . . . (63,083) (47,474)
$115,446 $121,547
Other long-term assets:Deferred income tax assets—non-current . . . . . . . . . . . . . . . . . . . . . . . . . . . . . . . . $ 9,879 $ 20,440Prepaid wafer credits . . . . . . . . . . . . . . . . . . . . . . . . . . . . . . . . . . . . . . . . . . . . — 2,826Long-term employee loan receivable . . . . . . . . . . . . . . . . . . . . . . . . . . . . . . . . . . . — 1,000Other long-term assets . . . . . . . . . . . . . . . . . . . . . . . . . . . . . . . . . . . . . . . . . . . 2,232 1,227
$ 12,111 $ 25,493
Accrued expenses and other current liabilities:Employee compensation . . . . . . . . . . . . . . . . . . . . . . . . . . . . . . . . . . . . . . . . . . $ 9,605 $ 7,490Third party commissions . . . . . . . . . . . . . . . . . . . . . . . . . . . . . . . . . . . . . . . . . . 694 1,004Professional services . . . . . . . . . . . . . . . . . . . . . . . . . . . . . . . . . . . . . . . . . . . . . 1,912 2,383Noncancelable purchase commitments . . . . . . . . . . . . . . . . . . . . . . . . . . . . . . . . . . 2,100 4,689Rebates . . . . . . . . . . . . . . . . . . . . . . . . . . . . . . . . . . . . . . . . . . . . . . . . . . . . 2,951 1,871Other . . . . . . . . . . . . . . . . . . . . . . . . . . . . . . . . . . . . . . . . . . . . . . . . . . . . . . 8,221 2,069
$ 25,483 $ 19,506
Other long-term liabilities:Deferred income tax liabilities—non-current . . . . . . . . . . . . . . . . . . . . . . . . . . . . . . $ 293 $ 1,040Interest rate swaps . . . . . . . . . . . . . . . . . . . . . . . . . . . . . . . . . . . . . . . . . . . . . . 3,929 3,687Other . . . . . . . . . . . . . . . . . . . . . . . . . . . . . . . . . . . . . . . . . . . . . . . . . . . . . . 250 —
$ 4,472 $ 4,727
85

OMNIVISION TECHNOLOGIES, INC.
NOTES TO CONSOLIDATED FINANCIAL STATEMENTS—(Continued)For the Years Ended April 30, 2011, 2010 and 2009
Note 5—Long-Term Investments
Long-term investments as of the dates indicated consisted of the following (in thousands):
April 30,
2011 2010
VisEra . . . . . . . . . . . . . . . . . . . . . . . . . . . . . . . . . . . . . . . . . . $ 81,258 $72,170WLCSP . . . . . . . . . . . . . . . . . . . . . . . . . . . . . . . . . . . . . . . . . 14,042 11,819XinTec . . . . . . . . . . . . . . . . . . . . . . . . . . . . . . . . . . . . . . . . . . 4,661 4,661Tong Hsing . . . . . . . . . . . . . . . . . . . . . . . . . . . . . . . . . . . . . . . 4,655 3,471
Total . . . . . . . . . . . . . . . . . . . . . . . . . . . . . . . . . . . . . . . . . . $104,616 $92,121
VisEra Technologies Company, Ltd.
On October 29, 2003, the Company and Taiwan Semiconductor Manufacturing Company Limited(‘‘TSMC’’) entered into an agreement to form VisEra Technologies Company, Ltd. (‘‘VisEra’’), a jointventure in Taiwan, for the purposes of providing certain manufacturing and automated final testingservices related to complementary metal oxide semiconductor (‘‘CMOS’’) image sensors. In August2005, under an amendment to the original 2003 joint-venture agreement, the Company and TSMCformed VisEra Holding Company (‘‘VisEra Cayman’’), a company incorporated in the Cayman Islands,and VisEra became a subsidiary of VisEra Cayman. The Company and TSMC have equal interests inVisEra Cayman. As of April 30, 2011, the Company owned 49.1% of VisEra Cayman.
Through April 2007, the Company’s contributions to VisEra and VisEra Cayman totaled$51.6 million, effectively meeting its commitment under the terms of a January 2007 amendment to thejoint-venture agreement, in which the Company and TSMC have agreed to commit a total of$112.9 million to the joint venture. The Company has not made any subsequent contributions intoVisEra or VisEra Cayman.
The Company initially accounted for its investment in VisEra under the equity method. BetweenAugust 1, 2005 and December 31, 2006, VisEra was considered a variable interest entity (‘‘VIE’’), andthe Company was the primary beneficiary, as defined under the accounting guidance for VIEs.Accordingly, the Company consolidated VisEra’s operating results. On January 1, 2007, VisEra ceasedto meet the definition of a VIE. Consequently, the Company deconsolidated VisEra on January 1,2007, and has since accounted for its investment in VisEra under the equity method. (See Note 17.)
The following table presents equity income (loss) recorded by the Company for the periodsindicated in ‘‘Cost of revenues,’’ consisting of its portion of the net income (loss) recorded by VisEraduring the periods presented (in thousands) (See Note 17):
Year Ended April 30,
2011 2010 2009
Equity income (loss) . . . . . . . . . . . . . . . . . . . . . . . . . . . $8,887 $4,251 $(1,275)
86

OMNIVISION TECHNOLOGIES, INC.
NOTES TO CONSOLIDATED FINANCIAL STATEMENTS—(Continued)For the Years Ended April 30, 2011, 2010 and 2009
Note 5—Long-Term Investments—(Continued)
China WLCSP Limited
China WLCSP Limited (‘‘WLCSP’’) is in the business of designing, manufacturing, packaging andselling certain wafer level chip scale packaging related services. In May 2007, the Company acquired4,500,000 units of WLCSP’s equity interests, or 20.0% of WLCSP’s registered capital on a fully-dilutedbasis, for an aggregate purchase amount of $9.0 million. The Company has appointed a member toWLCSP’s board of directors and a supervisor.
At the date of the transaction, the Company’s $9.0 million investment in WLCSP exceeded itsshare of the book value of WLCSP’s assets by $5.7 million. Of this $5.7 million difference, $4.1 millionrepresents equity method goodwill that is not subject to amortization. This amount is recorded as aportion of the Company’s investment in WLCSP. The Company is amortizing the remaining basisdifference of $1.6 million, which is attributable to intangible assets of WLCSP, over various periods upto a maximum of five years. As of April 30, 2011, the Company owned 18.7% of WLCSP.
The Company received the following dividend payments from WLCSP during the periodspresented (in thousands):
Year Ended April 30,
2011 2010 2009
Dividend payments received from WLCSP . . . . . . . . . . . . . . . . $585 $585 $—
The Company accounts for its investment in WLCSP under the equity method. The following tablepresents equity income recorded by the Company for the periods indicated in ‘‘Other income (loss),net,’’ consisting of its portion of the net income recorded by WLCSP during the periods presented, andequity method investment adjustments (in thousands) (See Note 17.):
Year Ended April 30,
2011 2010 2009
Equity income . . . . . . . . . . . . . . . . . . . . . . . . . . . . . . . . . $3,076 $1,993 $703
XinTec, Inc.
XinTec, Inc. (‘‘XinTec’’) is a Taiwan-based supplier of chip scale packaging services. The Companyfirst made investments in XinTec in April 2003, for $2.8 million. As of April 30, 2011, the Company’sdirect ownership percentage in XinTec was 4.2%. Separately, VisEra Cayman owns a 16.0% interest inXinTec. Consequently, the Company’s beneficial ownership percentage in XinTec was approximately12.0%. The Company accounts for XinTec as a cost method investment.
Tong Hsing Electronic Industries, Limited
Tong Hsing Electronic Industries, Limited (‘‘Tong Hsing’’) is a Taiwan-based public companyprincipally engaged in the development and production of microelectronic packaging. In December2009, the Company obtained 0.8% of the outstanding shares of common stock of Tong Hsing, or996,250 shares, when Tong Hsing acquired ImPac Technology Co., Ltd. (‘‘ImPac’’) in a stock-for-stockexchange. Prior to the exchange, the Company owned 25.7% of ImPac. As a result of the exchange, the
87

OMNIVISION TECHNOLOGIES, INC.
NOTES TO CONSOLIDATED FINANCIAL STATEMENTS—(Continued)For the Years Ended April 30, 2011, 2010 and 2009
Note 5—Long-Term Investments—(Continued)
Company recorded a gain of approximately $2.2 million in ‘‘Other income (expense), net,’’ which wasthe difference between the fair value of the Tong Hsing’s shares the Company received onDecember 31, 2009, and the carrying value of the Company’s investment in ImPac on the same day. InJune 2010, the Company participated in Tong Hsing’s secondary offering and purchased an additional95,570 shares for approximately $282,000. As of April 30, 2011, the Company’s ownership in TongHsing was approximately 0.8%.
As the shares of Tong Hsing are traded on the Taiwan Stock Exchange and the share price isreadily determinable, the Company reported the shares on a mark-to-market basis, net of deferredtaxes. For the periods indicated, the Company recorded the following unrealized holding gains in‘‘Accumulated other comprehensive income’’ (in thousands):
Year Ended April 30,
2011 2010 2009
Unrealized holding gains . . . . . . . . . . . . . . . . . . . . . . . . . . . . . . $608 $— $—
Silicon Optronics, Inc.
In May 2004, the Company entered into an agreement with Powerchip Technology Corporation(‘‘PTC’’), formerly Powerchip Semiconductor Corporation, a Taiwan based company that producesmemory chips and provides semiconductor foundry services, to establish Silicon Optronics, Inc.(‘‘SOI’’), a joint venture in Taiwan. The Company contributed approximately $2.1 million to SOI inexchange for an ownership percentage of 49.0%. In March 2005, the Company assumed control of theboard of directors of SOI and the Company consolidated SOI from April 30, 2005 through May 2010.The purpose of SOI was to manufacture, market and sell certain of the Company’s legacy products.Toward the end of fiscal 2010, SOI began to ship niche products into other markets, including touchpanels that track touches with optical sensors, and linear sensors.
In June 2010, SOI held its annual meeting of stockholders and new board directors were elected.As a result, the Company no longer held the majority representation on the board of directors of SOI,and was required to deconsolidate SOI. The authoritative guidance for deconsolidation required theCompany to record its retained interest in SOI at fair value. Pursuant to the guidance, the Companyrecorded a gain of approximately $1.6 million in ‘‘Other income (expense), net,’’ which was thedifference between the fair value of the Company’s retained interest in SOI of $4.1 million, and thecarrying value of SOI’s net assets and noncontrolling interest before the deconsolidation of $2.5 million.After the deconsolidation, the Company owned 43.8% of SOI, which the Company accounted for underthe equity method.
In the three months ended January 31, 2011, the Company sold its remaining 43.7% interest inSOI for net proceeds of $3.8 million, at which time the Company recorded a loss on sale of $72,000 to‘‘Other income (expense), net.’’ For the period from November 1, 2010 through the date of the sale,the Company recorded $26,000 for its share of the equity income of SOI. Consequently, as of April 30,2011, the Company’s ownership in SOI was zero percent and the Company had no continuinginvestment in SOI.
88

OMNIVISION TECHNOLOGIES, INC.
NOTES TO CONSOLIDATED FINANCIAL STATEMENTS—(Continued)For the Years Ended April 30, 2011, 2010 and 2009
Note 5—Long-Term Investments—(Continued)
Noncontrolling interest represented ownership interests in SOI held by parties other than theCompany. The following table reconciles equity attributable to noncontrolling interest for the periodsindicated (in thousands):
Year Ended April 30,
2011 2010 2009
Noncontrolling interest, May 1 . . . . . . . . . . . . . . . . . . . . $ 3,390 $3,497 $4,444Cash contribution by noncontrolling interest . . . . . . . . . . — 34 —Affiliate cash dividend paid to noncontrolling interest . . . — — (201)Net loss attributable to noncontrolling interest . . . . . . . . (32) (321) (746)Translation gain (loss) . . . . . . . . . . . . . . . . . . . . . . . . . . (70) 180 —Deconsolidation . . . . . . . . . . . . . . . . . . . . . . . . . . . . . . (3,288) — —
Noncontrolling interest, April 30 . . . . . . . . . . . . . . . . . $ — $3,390 $3,497
The following table presents the summary combined financial information of the Company’sinvestee companies, as derived from their respective financial statements for the periods indicated andas of April 30, 2011 and 2010. Fiscal 2011 represents the combined operating results of SOI, VisEraand WLCSP. Fiscal 2010 represents the combined operating results of ImPac, VisEra and WLCSP.Fiscal 2009 represents the combined operating results of ImPac, VisEra and WLCSP. Each investeefinancial statement was prepared under GAAP (in thousands):
Year Ended April 30,
2011 2010 2009
Operating data:Revenues . . . . . . . . . . . . . . . . . . . . . . . . . . . . . . $165,904 $119,282 $87,615Gross profit . . . . . . . . . . . . . . . . . . . . . . . . . . . . 51,422 25,971 10,287Income (loss) from operations . . . . . . . . . . . . . . . 31,277 11,363 (2,083)Net income (loss) . . . . . . . . . . . . . . . . . . . . . . . . $ 31,644 $ 13,273 $ (259)
April 30,
2011 2010
Balance sheet data:Current assets . . . . . . . . . . . . . . . . . . . . . . . . . . . . . . . . . . $127,921 $ 85,621Long-term assets . . . . . . . . . . . . . . . . . . . . . . . . . . . . . . . . 195,221 184,525Current liabilities . . . . . . . . . . . . . . . . . . . . . . . . . . . . . . . . 48,465 30,620Long-term liabilities . . . . . . . . . . . . . . . . . . . . . . . . . . . . . . $ 349 $ 2,162
The Company’s share of undistributed earnings of investees accounted for by the equity method asof the dates indicated were as follows (in thousands):
April 30,
2011 2010
Undistributed earnings of investees . . . . . . . . . . . . . . . . . . . . . . $27,509 $20,806
89

OMNIVISION TECHNOLOGIES, INC.
NOTES TO CONSOLIDATED FINANCIAL STATEMENTS—(Continued)For the Years Ended April 30, 2011, 2010 and 2009
Note 6—Acquisition of Aurora Systems, Inc.
In March 2010, the Company acquired all of the outstanding common and preferred stock ofAurora Systems, Inc. (‘‘Aurora’’), pursuant to the Agreement and Plan of Merger dated February 11,2010 (the ‘‘Agreement’’). Aurora is a privately-held company incorporated in California that designs andmarkets liquid crystal on silicon based microdisplay panels. These microdisplay panels are used forprojection applications in consumer electronics, industrial, aerospace, and mobile viewing platforms.Under the terms of the Agreement, the closing consideration was $5.6 million in cash, with noadditional contingent consideration.
The Company allocated the purchase consideration to tangible assets, intangible assets andliabilities based on their estimated fair values. The excess purchase price over the value of the nettangible and identifiable intangible assets was recorded as goodwill. The $439,000 in goodwill resultedprimarily from the Company’s expected synergies from the integration of Aurora’s technology into theCompany’s future product offerings. The fair values assigned to acquired intangible assets were basedon discounting to present values all relevant expected future cash flows that reflect managementdetermined estimates and assumptions These estimates include, but are not limited to, estimated coststo complete, utilization of patents and core technology, and the markets served. The cash flows werediscounted at rates ranging from 19% to 25%.
The amount of revenues and net loss of Aurora included in the Company’s consolidated statementof operations from the acquisition date to April 30, 2010, the end of fiscal 2010, and pro formafinancial information on the acquisition as if the transaction had occurred as of the beginning of fiscal2010 were not significant.
Note 7—Goodwill and Intangible Assets
Goodwill
The change to the carrying value of the Company’s goodwill during fiscal 2011 and 2010 isreflected below (in thousands):
Year EndedApril 30,
2011 2010
Beginning balance, May 1 . . . . . . . . . . . . . . . . . . . . . . . . . . . . . . . . $ 439 $ —Business acquisitions . . . . . . . . . . . . . . . . . . . . . . . . . . . . . . . . . . 683 439
Ending balance, April 30 . . . . . . . . . . . . . . . . . . . . . . . . . . . . . . . . $1,122 $439
Intangible Assets
In March 2011, the Company purchased certain sensor-related patents and patent applicationsfrom Kodak in a cash transaction. As a result, the Company recorded $65.0 million in additions tointangible assets, which the Company began amortizing over an estimated life of seven years during thethree months ended April 30, 2011.
90

OMNIVISION TECHNOLOGIES, INC.
NOTES TO CONSOLIDATED FINANCIAL STATEMENTS—(Continued)For the Years Ended April 30, 2011, 2010 and 2009
Note 7—Goodwill and Intangible Assets—(Continued)
Intangible assets as of the dates indicated consisted of the following (in thousands):
April 30, 2011
Accumulated Net BookCost Amortization Value
Acquired patent portfolio . . . . . . . . . . . . . . . . . . . $ 65,000 $ 774 $64,226Core technology . . . . . . . . . . . . . . . . . . . . . . . . . 24,410 19,474 4,936Patents and licenses . . . . . . . . . . . . . . . . . . . . . . . 13,460 13,423 37Trademarks and tradenames . . . . . . . . . . . . . . . . . 1,400 1,400 —Customer relationships . . . . . . . . . . . . . . . . . . . . 340 137 203In-process research and development . . . . . . . . . . 490 — 490
Intangible assets, net . . . . . . . . . . . . . . . . . . . . $105,100 $35,208 $69,892
April 30, 2010
Accumulated Net BookCost Amortization Value
Core technology . . . . . . . . . . . . . . . . . . . . . . . . . . $21,010 $17,856 $3,154Patents and licenses . . . . . . . . . . . . . . . . . . . . . . . . 13,487 12,477 1,010Trademarks and tradenames . . . . . . . . . . . . . . . . . . 1,400 1,400 —Customer relationships . . . . . . . . . . . . . . . . . . . . . 340 103 237In-process research and development . . . . . . . . . . . 490 — 490
Intangible assets, net . . . . . . . . . . . . . . . . . . . . . $36,727 $31,836 $4,891
The following table presents the amortization of intangibles recorded by the Company for theperiods indicated (in thousands):
Year Ended April 30,
2011 2010 2009
Amortization of intangible assets . . . . . . . . . . . . . . . . . . . $2,626 $6,445 $6,532
Amortization of acquired patent portfolio . . . . . . . . . . . . $ 774 $ — $ —
The total expected future annual amortization of these intangible assets is as follows (inthousands):
Years Ending April 30,
2012 . . . . . . . . . . . . . . . . . . . . . . . . . . . . . . . . . . . . . . . . . . . . . . . . . . . . $11,2642013 . . . . . . . . . . . . . . . . . . . . . . . . . . . . . . . . . . . . . . . . . . . . . . . . . . . . 11,1882014 . . . . . . . . . . . . . . . . . . . . . . . . . . . . . . . . . . . . . . . . . . . . . . . . . . . . 10,0512015 . . . . . . . . . . . . . . . . . . . . . . . . . . . . . . . . . . . . . . . . . . . . . . . . . . . . 9,6622016 . . . . . . . . . . . . . . . . . . . . . . . . . . . . . . . . . . . . . . . . . . . . . . . . . . . . 9,621Thereafter . . . . . . . . . . . . . . . . . . . . . . . . . . . . . . . . . . . . . . . . . . . . . . . 18,106
Total . . . . . . . . . . . . . . . . . . . . . . . . . . . . . . . . . . . . . . . . . . . . . . . . . . $69,892
91

OMNIVISION TECHNOLOGIES, INC.
NOTES TO CONSOLIDATED FINANCIAL STATEMENTS—(Continued)For the Years Ended April 30, 2011, 2010 and 2009
Note 8—Borrowing Arrangements and Related Derivative Instruments
The following table sets forth the Company’s debt as of the dates indicated (in thousands):
April 30,
2011 2010
Mortgage loan . . . . . . . . . . . . . . . . . . . . . . . . . . . . . . . . . . . . . $25,314 $25,867Term loan . . . . . . . . . . . . . . . . . . . . . . . . . . . . . . . . . . . . . . . . 4,000 7,000Construction loan . . . . . . . . . . . . . . . . . . . . . . . . . . . . . . . . . . . 16,925 16,847
46,239 49,714Less: amount due within one year . . . . . . . . . . . . . . . . . . . . . . . (4,323) (4,286)
Non-current portion of long-term debt . . . . . . . . . . . . . . . . . . $41,916 $45,428
At April 30, 2011, aggregate debt maturities were as follows (in thousands):
Mortgageand Term Construction
Years Ending April 30, Loans Loan Total
2012 . . . . . . . . . . . . . . . . . . . . . . . . . . . . . . . . . . . $ 3,554 $ 769 $ 4,3232013 . . . . . . . . . . . . . . . . . . . . . . . . . . . . . . . . . . . 1,554 1,539 3,0932014 . . . . . . . . . . . . . . . . . . . . . . . . . . . . . . . . . . . 554 3,077 3,6312015 . . . . . . . . . . . . . . . . . . . . . . . . . . . . . . . . . . . 554 3,077 3,6312016 . . . . . . . . . . . . . . . . . . . . . . . . . . . . . . . . . . . 554 6,155 6,709Thereafter . . . . . . . . . . . . . . . . . . . . . . . . . . . . . . 22,544 2,308 24,852
Total . . . . . . . . . . . . . . . . . . . . . . . . . . . . . . . . . $29,314 $16,925 $46,239
Mortgage Loan and Term Loan
On March 16, 2007, the Company entered into a Loan and Security Agreement with a domesticbank for the purchase of a complex of four buildings located in Santa Clara, California (the ‘‘SantaClara Property’’). The Loan and Security Agreement provides for a mortgage loan in the principalamount of $27.9 million (the ‘‘Mortgage Loan’’) and a secured line of credit with an aggregatemaximum principal amount of up to $12.0 million (the ‘‘Term Loan’’). In March 2008, the Companyborrowed $6.0 million under the Term Loan to finance improvements to the Santa Clara Property. TheCompany drew down the remaining $6.0 million under the Term Loan in July 2008.
Borrowings under the Mortgage Loan accrue interest at the London Interbank Borrowing Rate(‘‘LIBOR’’) plus 90 basis points. Borrowings under the Term Loan accrue interest at the LIBOR rateplus 125 basis points. The Mortgage and Term Loans mature on March 31, 2017 and July 31, 2012,respectively. The Company was in compliance with the financial covenants of the Loan and SecurityAgreement as of April 30, 2011.
92

OMNIVISION TECHNOLOGIES, INC.
NOTES TO CONSOLIDATED FINANCIAL STATEMENTS—(Continued)For the Years Ended April 30, 2011, 2010 and 2009
Note 8—Borrowing Arrangements and Related Derivative Instruments—(Continued)
Interest rates under the Mortgage Loan and the Term Loan for the dates indicated are set forthbelow:
April 30,
2011 2010
Mortgage Loan . . . . . . . . . . . . . . . . . . . . . . . . . . . . . . . . . . . . . . . . . . 1.1% 1.2%Term Loan . . . . . . . . . . . . . . . . . . . . . . . . . . . . . . . . . . . . . . . . . . . . . 1.5 1.5
In conjunction with the Mortgage Loan, the Company entered into an interest rate swap with thesame bank to effectively convert the variable interest rate described above to a fixed rate. The swap isfor a period of ten years, and the notional amount of the swap approximates the principal outstandingunder the Mortgage Loan. The Company is the fixed rate payer under the swap and the rate is fixed at5.3% per annum and the effective rate on the Mortgage Loan is fixed at approximately 6.2%. In July2008, in connection with the Term Loan, the Company entered into a second interest rate swap withthe bank to effectively convert the variable interest rate described above to a fixed rate. This secondswap is for a period of four years. The Company is the fixed rate payer and the rate is fixed at 4.3%per annum and the effective rate on the Term Loan is fixed at approximately 5.5%.
Construction Loan
On August 3, 2009, OmniVision Technologies (Shanghai) Co., Ltd., a wholly-owned subsidiary ofthe Company, entered into a Fixed Assets Loan Agreement with a bank in China (the ‘‘ConstructionLoan’’). The purpose of the Construction Loan is to construct a research center for the Company inPudong Development Zone, the Zhang Jiang Science Park in Shanghai, China. The loan amount isChinese Yuan 140.0 million or approximately $20.5 million based on exchange rate in effect at the timeof the loan origination. As of April 30, 2011, the Company has borrowed Chinese Yuan 115.0 million,or approximately $17.7 million, under the Construction Loan. The Construction Loan matures onJune 30, 2016.
The interest rate under the Construction Loan is based on an indicative rate as published by theChinese government, and will be adjusted every September to the then current published rate. Theinterest rate under the Construction Loan was 5.3% at April 30, 2011. The Company was in compliancewith the financial covenants of the Fixed Assets Loan Agreement as of April 30, 2011.
Derivative Instruments and Hedging Activities
As indicated above, the Company holds two separate interest rate swaps in connection with theMortgage Loan and the Term Loan. The Company utilizes the swaps to reduce the effect of interestrate variability on the two loans’ interest payments. The Company has not designated the two interestrate swaps as hedging instruments. Consequently, the Company remeasures the two interest rate swapsat fair value at each balance sheet date, and immediately recognizes any changes to the fair values inearnings. On the consolidated balance sheet, the Company records the swaps as either assets orliabilities, depending on whether the fair value represents net gains or net losses. (See Note 11.)
93

OMNIVISION TECHNOLOGIES, INC.
NOTES TO CONSOLIDATED FINANCIAL STATEMENTS—(Continued)For the Years Ended April 30, 2011, 2010 and 2009
Note 8—Borrowing Arrangements and Related Derivative Instruments—(Continued)
The table below presents the location of the swaps on the Consolidated Statements of Operationsand Consolidated Balance Sheets, and the related effects on the Company’s results of operations andfinancial positions for the periods indicated (in thousands):
Year Ended April 30,
2011 2010 2009
Location of amounts recognized in Consolidated Statements ofOperations and amount of gains (losses):Other income (expense), net . . . . . . . . . . . . . . . . . . . . . $(242) $776 $(2,234)
April 30,
2011 2010
Location of amounts on Consolidated Balance Sheets and fair values:Other long-term liabilities . . . . . . . . . . . . . . . . . . . . . . . . . . . . . $3,929 $3,687
Note 9—Income Taxes
The provision for (benefit from) income taxes consists of the following (in thousands):
Year Ended April 30,
2011 2010 2009
Current:Federal . . . . . . . . . . . . . . . . . . . . . . . . . . . . . . . . . $(6,231) $(2,396) $ (279)State . . . . . . . . . . . . . . . . . . . . . . . . . . . . . . . . . . . 9 (42) 2Foreign . . . . . . . . . . . . . . . . . . . . . . . . . . . . . . . . . 5,829 11,641 4,463
Total current . . . . . . . . . . . . . . . . . . . . . . . . . . . . (393) 9,203 4,186
Deferred:Federal . . . . . . . . . . . . . . . . . . . . . . . . . . . . . . . . . 4,191 (5,022) (6,017)State . . . . . . . . . . . . . . . . . . . . . . . . . . . . . . . . . . . 427 (234) (343)Foreign . . . . . . . . . . . . . . . . . . . . . . . . . . . . . . . . . — (64) 2,016
Total deferred . . . . . . . . . . . . . . . . . . . . . . . . . . . 4,618 (5,320) (4,344)
Total provision (benefit) . . . . . . . . . . . . . . . . . . . . $ 4,225 $ 3,883 $ (158)
Income (losses) before provision for income taxes consisted of (in thousands):
Year Ended April 30,
2011 2010 2009
United States . . . . . . . . . . . . . . . . . . . . . . . . . . . . $ 19,558 $(26,121) $(39,550)International . . . . . . . . . . . . . . . . . . . . . . . . . . . . . 109,117 36,407 1,323
Total . . . . . . . . . . . . . . . . . . . . . . . . . . . . . . . . . $128,675 $ 10,286 $(38,227)
94

OMNIVISION TECHNOLOGIES, INC.
NOTES TO CONSOLIDATED FINANCIAL STATEMENTS—(Continued)For the Years Ended April 30, 2011, 2010 and 2009
Note 9—Income Taxes—(Continued)
The provision for (benefit from) income taxes differs from the amount computed by applying theU.S. federal income tax rate of 35.0% to ‘‘Income (loss) before income taxes’’ as a result of thefollowing (in thousands):
Year Ended April 30,
2011 2010 2009
Provision based on statutory federal income tax . . . . $ 45,036 $ 3,600 $(13,379)State income tax expense (benefit), net of federal tax
benefit . . . . . . . . . . . . . . . . . . . . . . . . . . . . . . . . 381 (169) (395)Foreign rate differential . . . . . . . . . . . . . . . . . . . . . . (37,809) (2,976) 6,312Non-deductible stock-based compensation . . . . . . . . . 1,807 4,053 6,450Tax credits . . . . . . . . . . . . . . . . . . . . . . . . . . . . . . . (5,078) (706) (1,469)Non-deductible goodwill impairment loss . . . . . . . . . — — 2,640Other . . . . . . . . . . . . . . . . . . . . . . . . . . . . . . . . . . . (112) 81 (317)
Tax provision (benefit) . . . . . . . . . . . . . . . . . . . . . $ 4,225 $ 3,883 $ (158)
The effective tax rates for fiscal 2011, 2010 and 2009 are less than the combined U.S. federal andstate statutory rate of approximately 40%, principally because the Company earns a portion of itsprofits in jurisdictions where tax rates are lower than the combined U.S. federal and state statutoryrate. In fiscal 2011, the Company included in the amount of foreign rate differential the tax benefitfrom a $10.6 million reduction of unrecognized tax benefits due to lapses of applicable statute oflimitations and a $5.0 million income tax expense accrued for certain non-U.S. earnings that werepreviously considered to be indefinitely reinvested.
The Tax Relief, Unemployment Insurance Reauthorization, and Job Creation Act of 2010, whichwas signed into law on December 17, 2010, retroactively extended the U.S. Federal Research andDevelopment tax credit (‘‘Federal R&D Credit’’) from January 1, 2010 to December 31, 2011. Thisenacted tax law change resulted in the incremental tax benefit in fiscal 2011 from the retroactivelyextended Federal R&D Credit.
95

OMNIVISION TECHNOLOGIES, INC.
NOTES TO CONSOLIDATED FINANCIAL STATEMENTS—(Continued)For the Years Ended April 30, 2011, 2010 and 2009
Note 9—Income Taxes—(Continued)
The components of net deferred tax assets included in the consolidated balance sheets for thefiscal years indicated were (in thousands):
April 30,
2011 2010
Deferred tax assets:Tax credits . . . . . . . . . . . . . . . . . . . . . . . . . . . . . . . . . . . . . . $ 17,911 $10,750Net operating loss . . . . . . . . . . . . . . . . . . . . . . . . . . . . . . . . 1,805 1,196Reserves . . . . . . . . . . . . . . . . . . . . . . . . . . . . . . . . . . . . . . . 945 2,998Stock-based compensation expenses . . . . . . . . . . . . . . . . . . . 7,109 10,738Unrealized loss on interest rate swap . . . . . . . . . . . . . . . . . . 1,466 1,407Accruals and other . . . . . . . . . . . . . . . . . . . . . . . . . . . . . . . . 3,903 2,006
Gross deferred tax assets . . . . . . . . . . . . . . . . . . . . . . . . . 33,139 29,095Valuation allowance . . . . . . . . . . . . . . . . . . . . . . . . . . . . . . . (8,058) (5,264)
Deferred tax assets . . . . . . . . . . . . . . . . . . . . . . . . . . . . . . 25,081 23,831
Deferred tax liabilities:Fixed assets . . . . . . . . . . . . . . . . . . . . . . . . . . . . . . . . . . . . . (707) (1,301)Undistributed earnings of non-US equity investees not
permanently reinvested . . . . . . . . . . . . . . . . . . . . . . . . . . . (9,938) (1,040)Other . . . . . . . . . . . . . . . . . . . . . . . . . . . . . . . . . . . . . . . . . — (100)
Deferred tax liabilities . . . . . . . . . . . . . . . . . . . . . . . . . . . (10,645) (2,441)
Net deferred tax assets . . . . . . . . . . . . . . . . . . . . . . . . . . . $ 14,436 $21,390
The Company has elected to derecognize both the gross deferred income tax assets and theoffsetting valuation allowance pertaining to net operating loss and tax credit carryforwards thatrepresent excess tax benefits from stock-based awards. Recognition of a deferred tax asset for excess taxbenefits due to stock-based compensation deductions that have not yet been realized through areduction in income taxes payable is prohibited. Such unrecognized deferred tax benefits totaled$20.2 million and $10.1 million as of April 30, 2011 and 2010, respectively, and, if and when realizedthrough a reduction in income taxes payable, will be accounted for as a credit to additional paid-incapital.
Management regularly assesses the realizability of deferred tax assets recorded based upon theweight of available evidence, including such factors as recent earnings history and expected futuretaxable income on a jurisdiction by jurisdiction basis. Deferred tax assets in the amount of $8.1 millionand $5.3 million at April 30, 2011 and 2010, respectively, primarily pertain to California research anddevelopment tax credit carryovers that the Company believes it is more likely than not that theCompany will not realize; therefore, a valuation allowance has been established against such deferredtax assets. In the future, if the credit is utilized and the valuation allowance is released, the release ofvaluation allowance will be accounted for as a reduction of the income tax expense in the year suchevent occurs.
96

OMNIVISION TECHNOLOGIES, INC.
NOTES TO CONSOLIDATED FINANCIAL STATEMENTS—(Continued)For the Years Ended April 30, 2011, 2010 and 2009
Note 9—Income Taxes—(Continued)
As of April 30, 2011, the Company has U.S. federal and state net operating loss (‘‘NOL’’)carryforwards of $32.4 million and $18.3 million, respectively. If not utilized, the U.S. federal NOL willbegin to expire in fiscal 2028 and the state NOL will begin to expire in fiscal 2032. The Company hasU.S. federal and state tax credits of $20.2 million and $22.4 million, respectively. If not utilized, theU.S. federal tax credits will begin to expire in fiscal 2025 and the U.S. state tax credits will be carriedover indefinitely.
The Company has not provided U.S. federal and state income taxes, as well as foreign withholdingtaxes, on approximately $333.9 million of undistributed earnings for certain non-U.S. subsidiaries andequity investee companies, because such earnings are intended to be indefinitely reinvested.Determination of the amount of unrecognized deferred tax liability for temporary differences related toinvestment in these non-U.S. subsidiaries and equity investee companies that are essentially permanentin duration is not practicable.
The Company is subject to income taxes in the U.S. and numerous foreign jurisdictions. Significantjudgment is required in evaluating the tax positions and determining the provision for income taxes.During the ordinary course of business, there are many transactions and calculations for which theultimate tax determination is uncertain. The Company establishes reserves for tax-related uncertaintiesbased on estimates of whether, and the extent to which, additional taxes will be due. These reserves areestablished when the Company believes that certain positions might be challenged despite theCompany’s belief that the tax return positions are fully supportable. The Company adjusts thesereserves in light of changing facts and circumstances, such as lapses of the relevant statute oflimitations. The provision for income taxes includes the impact of reserve provisions and changes toreserves that are considered appropriate.
A reconciliation of the beginning balance and the ending balance of gross unrecognized taxbenefits, excluding interest and penalties, is as follows (in thousands):
April 30,
2011 2010 2009
Balance at beginning of fiscal year . . . . . . . . . . . . . . . $83,613 $77,133 $71,229Increases in balances related to tax positions taken
during current year . . . . . . . . . . . . . . . . . . . . . . . . 6,273 4,000 6,215Decreases as a result of a lapse of the applicable
statute of limitations . . . . . . . . . . . . . . . . . . . . . . . . (6,821) — —Increases in balances related to tax positions taken
during prior years . . . . . . . . . . . . . . . . . . . . . . . . . . 3,251 3,094 2,051Decreases in balances related to tax positions taken
during prior years . . . . . . . . . . . . . . . . . . . . . . . . . . (582) (614) (2,362)
Balance at end of fiscal year . . . . . . . . . . . . . . . . . . . $85,734 $83,613 $77,133
97

OMNIVISION TECHNOLOGIES, INC.
NOTES TO CONSOLIDATED FINANCIAL STATEMENTS—(Continued)For the Years Ended April 30, 2011, 2010 and 2009
Note 9—Income Taxes—(Continued)
A reconciliation of the gross unrecognized tax benefits, including interest and penalties, aspresented on the Consolidated Balance Sheets is as follows (in thousands):
April 30,
2011 2010
Recorded as a decrease in deferred income taxes—non-current . . $11,784 $ 8,586Recorded as a decrease in other receivables . . . . . . . . . . . . . . . . 300 300Income taxes payable—non-current . . . . . . . . . . . . . . . . . . . . . . 87,526 90,626
Balance at end of fiscal year . . . . . . . . . . . . . . . . . . . . . . . . . . . $99,610 $99,512
The Company includes interest, penalties and foreign exchange gain or loss related tounrecognized tax benefits within the provision for income taxes on the Consolidated Statements ofOperations. The Company recognized the following net amounts of interest and penalties and therelated foreign exchange gain or loss for the periods presented (in thousands):
Year Ended April 30,
2011 2010 2009
Recognized interest and penalties, net . . . . . . . . . . . . . . $(2,022) $2,199 $1,818
Included in the fiscal 2011 net amount of interest and penalties is a benefit of $3.8 million,primarily due to the reversal of accrued interest and penalties related to the reductions to unrecognizedtax benefits as a result of lapses of the statute of limitations.
The Company had cumulatively accrued the following amounts for potential interest and penaltiesas of the dates indicated (in thousands):
April 30,
2011 2010
Balance at end of fiscal year . . . . . . . . . . . . . . . . . . . . . . . . . . . $13,876 $15,898
The total amount of unrecognized tax benefits, net of federal benefit for the deduction of suchitems as interest that, if recognized, would affect the effective tax rate is $95.4 million as of April 30,2011. One or more of these unrecognized tax benefits could be subject to a valuation allowance if andwhen recognized in a future period, which could impact the timing of any related effective tax ratebenefit.
The Company files U.S. federal and state, as well as foreign, tax returns. For such returns, theCompany is generally no longer subject to tax examinations for years prior to fiscal 2003. The Companyis currently under tax examination in a foreign jurisdiction for the fiscal years ended April 30, 2004through April 30, 2009. It is possible that this tax examination may be concluded in the next 12 months.During fiscal 2012, the Company will continue to review its tax positions and provide for, or reverse,unrecognized tax benefits as issues arise. At this time, the Company anticipates that the balance ofgross unrecognized tax benefits will decrease by $3.3 million due to lapses of statute of limitation incertain jurisdictions over the next 12 months.
98

OMNIVISION TECHNOLOGIES, INC.
NOTES TO CONSOLIDATED FINANCIAL STATEMENTS—(Continued)For the Years Ended April 30, 2011, 2010 and 2009
Note 10—Net Income (Loss) Per Share Attributable to OmniVision Technologies, Inc. CommonStockholders
Basic net income (loss) per share attributable to OmniVision common stockholders is computed bydividing net income (loss) attributable to OmniVision by the weighted average number of commonshares outstanding during the period.
Diluted net income per share attributable to OmniVision common stockholders is computedaccording to the treasury stock method using the weighted average number of common and potentiallydilutive common shares outstanding during the period. Potentially dilutive common shares represent theeffect of stock options, purchases via employee stock purchase plans and restricted stock units. Thefollowing table sets forth the number of stock options that were excluded from the calculation ofdiluted net income per share because they were antidilutive for the periods indicated :
Year Ended April 30,
2011 2010 2009
Antidilutive common stock subject to outstanding options . . — 6,722,000 *
(*) For the fiscal year ended April 30, 2009, the Company excluded all options, purchases viaemployee stock purchase plans and restricted stock units outstanding as the Companyrecorded a net loss of $37.3 million.
99

OMNIVISION TECHNOLOGIES, INC.
NOTES TO CONSOLIDATED FINANCIAL STATEMENTS—(Continued)For the Years Ended April 30, 2011, 2010 and 2009
Note 10—Net Income (Loss) Per Share Attributable to OmniVision Technologies, Inc. CommonStockholders—(Continued)
The following table sets forth the computation of basic and diluted earnings (loss) per share forthe periods indicated (in thousands, except per share data):
Year Ended April 30,
2011 2010 2009
Basic:Numerator:
Net income (loss) attributable to OmniVision Technologies, Inc. . . . $124,482 $ 6,724 $(37,323)
Denominator:Weighted average common shares for net income (loss) per share
attributable to OmniVision Technologies, Inc. commonstockholders . . . . . . . . . . . . . . . . . . . . . . . . . . . . . . . . . . . . . . . . 55,324 51,080 50,523
Basic net income (loss) per share attributable to OmniVisionTechnologies, Inc. common stockholders . . . . . . . . . . . . . . . . . . . . . $ 2.25 $ 0.13 $ (0.74)
Diluted:Numerator:
Net income (loss) attributable to OmniVision Technologies. Inc. . . . $124,482 $ 6,724 $(37,323)
Denominator:Denominator for basic net income (loss) per share attributable to
OmniVision Technologies, Inc. common stockholders . . . . . . . . . . 55,324 51,080 50,523Weighted average effect of dilutive securities:Stock options, restricted stock units and employee stock purchase
plan shares . . . . . . . . . . . . . . . . . . . . . . . . . . . . . . . . . . . . . . . . . 3,782 1,609 —
Weighted average common shares for diluted net income (loss) pershare . . . . . . . . . . . . . . . . . . . . . . . . . . . . . . . . . . . . . . . . . . . . . 59,106 52,689 50,523
Diluted net income (loss) per share attributable to OmniVisionTechnologies, Inc. common stockholders . . . . . . . . . . . . . . . . . . . . . $ 2.11 $ 0.13 $ (0.74)
Note 11—Fair Value Measurements
The authoritative guidance for fair value measurements specifies a hierarchy of valuationtechniques based upon whether the inputs to those valuation techniques reflect assumptions othermarket participants would use based upon market data obtained from independent sources (observableinputs) or reflect the Company’s own assumption of market participant valuation (unobservable inputs).The fair value hierarchy consists of the following three levels:
• Level 1—Inputs are quoted prices in active markets for identical assets or liabilities.
• Level 2—Inputs are quoted prices for similar assets or liabilities in an active market, quotedprices for identical or similar assets or liabilities in markets that are not active, inputs other than
100

OMNIVISION TECHNOLOGIES, INC.
NOTES TO CONSOLIDATED FINANCIAL STATEMENTS—(Continued)For the Years Ended April 30, 2011, 2010 and 2009
Note 11—Fair Value Measurements—(Continued)
quoted prices that are observable and market-corroborated inputs which are derived principallyfrom or corroborated by observable market data.
• Level 3—Inputs are derived from valuation techniques in which one or more significant inputs orvalue drivers are unobservable.
Assets and Liabilities Measured and Recorded at Fair Value on a Recurring Basis
The following table presents the Company’s financial assets and liabilities that are measured at fairvalue on a recurring basis which were comprised of the following types of instruments as of the dateindicated (in thousands):
April 30, 2011
Total Level 1 Level 2 Level 3
Money market funds . . . . . . . . . . . . . . . . . $ 75,966 $75,966 $ — $—Debt securities issued by U.S. government
and U.S. government agencies . . . . . . . . . 67,593 — 67,593 —Corporate debt securities/commercial paper . 32,896 — 32,896 —Equity investment in Tong Hsing . . . . . . . . 4,655 4,655 — —
Total assets . . . . . . . . . . . . . . . . . . . . . . $181,110 $80,621 $100,489 $—
Interest rate swaps . . . . . . . . . . . . . . . . . . . $ (3,929) $ — $ (3,929) $—
Total liabilities . . . . . . . . . . . . . . . . . . . . $ (3,929) $ — $ (3,929) $—
The following table presents the Company’s financial assets and liabilities that are measured at fairvalue on a recurring basis which were presented on the Company’s Consolidated Balance Sheets as ofthe date indicated (in thousands):
April 30, 2011
Total Level 1 Level 2 Level 3
Cash equivalents . . . . . . . . . . . . . . . . . . . . $ 90,453 $75,966 $ 14,487 $—Short-term investments . . . . . . . . . . . . . . . . 86,002 — 86,002 —Long-term investments . . . . . . . . . . . . . . . . 4,655 4,655 — —
Total assets . . . . . . . . . . . . . . . . . . . . . . $181,110 $80,621 $100,489 $—
Interest rate swaps . . . . . . . . . . . . . . . . . . . $ (3,929) $ — $ (3,929) $—
Total liabilities . . . . . . . . . . . . . . . . . . . . $ (3,929) $ — $ (3,929) $—
101

OMNIVISION TECHNOLOGIES, INC.
NOTES TO CONSOLIDATED FINANCIAL STATEMENTS—(Continued)For the Years Ended April 30, 2011, 2010 and 2009
Note 11—Fair Value Measurements—(Continued)
The following table presents the Company’s financial assets and liabilities that are measured at fairvalue on a recurring basis which were comprised of the following types of instruments as of the dateindicated (in thousands):
April 30, 2010
Total Level 1 Level 2 Level 3
Money market funds . . . . . . . . . . . . . . . . . . $ 41,211 $41,211 $ — $—Debt securities issued by U.S. government
and U.S. government agencies . . . . . . . . . . 85,290 — 85,290 —Corporate debt securities/commercial paper . 11,980 — 11,980 —Equity investment in Tong Hsing . . . . . . . . . 3,471 3,471 — —
Total assets . . . . . . . . . . . . . . . . . . . . . . . $141,952 $44,682 $97,270 $—
Interest rate swaps . . . . . . . . . . . . . . . . . . . . $ (3,687) $ — $(3,687) $—
Total liabilities . . . . . . . . . . . . . . . . . . . . . $ (3,687) $ — $(3,687) $—
The following table presents the Company’s financial assets and liabilities that are measured at fairvalue on a recurring basis which were presented on the Company’s Consolidated Balance Sheets as ofthe date indicated (in thousands):
April 30, 2010
Total Level 1 Level 2 Level 3
Cash equivalents . . . . . . . . . . . . . . . . . . . . . $ 41,211 $41,211 $ — $—Short-term investments . . . . . . . . . . . . . . . . 97,270 — 97,270 —Long-term investments . . . . . . . . . . . . . . . . . 3,471 3,471 — —
Total assets . . . . . . . . . . . . . . . . . . . . . . . $141,952 $44,682 $97,270 $—
Interest rate swaps . . . . . . . . . . . . . . . . . . . . $ (3,687) $ — $(3,687) $—
Total liabilities . . . . . . . . . . . . . . . . . . . . . $ (3,687) $ — $(3,687) $—
Certificates of deposit recorded as cash equivalents and short-term investments are not measuredat fair value on a recurring basis and as such are not included in the tables above. The following tablesets forth the carrying value of certificates of deposit recorded as cash equivalents and short-terminvestments for the dates presented (in thousands):
April 30,
2011 2010
Certificates of deposit recorded as cash equivalents . . . . . . . . . . . $16,445 $9,419
Certificates of deposit recorded as short-term investments . . . . . . $ 1,503 $2,285
For the Company’s interest rate swaps, the Company obtains fair value quotes from the issuingbank and assesses the quotes for reasonableness by comparing them to the present values of expectedcash flows. The present value approach is based on observable market interest rate curves that are
102

OMNIVISION TECHNOLOGIES, INC.
NOTES TO CONSOLIDATED FINANCIAL STATEMENTS—(Continued)For the Years Ended April 30, 2011, 2010 and 2009
Note 11—Fair Value Measurements—(Continued)
commensurate with the terms of the interest rate swaps. The carrying value represents the fair value ofthe swaps, as adjusted for any non-performance risk associated with the Company.
Due to their short maturities, the reported amounts of the Company’s financial instruments,including cash and cash equivalents, short-term investments, accounts receivable, accounts payable andother current liabilities approximate fair value. The fair values of the Mortgage Loan, Term Loan andConstruction Loan approximate book values as the underlying interest rates are based on risk-adjustedmarket rates.
Assets Measured and Recorded at Fair Value on a Non-Recurring Basis
The following table presents the Company’s financial assets that were measured and recorded atfair value on a non-recurring basis during fiscal 2011, and the gain recorded on the assets during thesame period (in thousands):
Carrying Gain forFair Value Measured andValue Fiscal YearRecorded UsingApril 30, Ended2011 Level 1 Level 2 Level 3 April 30, 2011
Equity investment in SOI . . . . . . . . . . . . . . . . . . . . . $— $— $— $— $1,648
Total gain . . . . . . . . . . . . . . . . . . . . . . . . . . . . . . . $1,648
The Company did not have any assets or liabilities that were measured at fair value on anon-recurring basis during fiscal 2010. For the Company’s equity investment in SOI, the authoritativeguidance for deconsolidation required the Company to record its retained interest in SOI at fair valuein June 2010, when the Company no longer held the majority representation on SOI’s board. TheCompany classified the fair value measurement as Level 3 as the Company used unobservable inputsfor the valuation methodologies that were significant to the fair value measurements. The Companydetermined the fair value of its retained interest in SOI by using the market and income approaches.The market approach included the use of financial metrics from comparable public companies. Theselection of comparable companies required management judgment and was based on a number offactors, including comparable companies’ sizes, industries, and other relevant factors. The incomeapproach included the use of a discounted cash flow model that required significant estimates for SOI,including revenues, costs, risk adjusted discount rates and other relevant projections. In the threemonths ended January 31, 2011, the Company sold its remaining 43.7% interest in SOI for netproceeds of $3.8 million (See Note 5.)
Note 12—Common Stock
The Company is authorized to issue up to 100,000,000 shares of common stock. As of April 30,2011 and 2010, approximately 57,974,000 and 52,075,000 shares were outstanding, respectively. As ofApril 30, 2011 and 2010, 12,541,000 shares, respectively were held as treasury stock. There were noactive stock repurchase programs as of April 30, 2011. In addition, as of April 30, 2011, approximately8,658,000 and 1,997,000 shares of common stock have been reserved for issuance under the Company’semployee equity incentive plans and employee stock purchase plan, respectively.
103

OMNIVISION TECHNOLOGIES, INC.
NOTES TO CONSOLIDATED FINANCIAL STATEMENTSFor the Years Ended April 30, 2011, 2010 and 2009—(Continued)
Note 13—Employee Stock Purchase, Equity Incentive and Stock Option Plans
2007 Equity Incentive Plan
In September 2007, on the recommendation of the Company’s board of directors, the stockholdersof the Company approved the 2007 Equity Incentive Plan (the ‘‘2007 Plan’’). The 2007 Plan replacedthe Company’s 2000 Stock Plan. The Company has reserved 6,000,000 shares of common stock forissuance under the 2007 Plan. The 2007 Plan provides for the grant of the following types of incentiveawards: (i) stock options; (ii) stock appreciation rights; (iii) restricted stock; (iv) restricted stock units;(v) performance shares and performance units; and (vi) other stock or cash awards. In general, stockoption and stock appreciation right awards under the 2007 Plan will be granted at a price not less than100% of the fair market value of the Company’s common stock on the date of grant. With the approvalof the Company’s stockholders in September 2009, the Company modified certain terms of the 2007Plan. Under the modified 2007 Plan, the Company’s stock option awards generally have a maximumcontractual term of seven years and vest over four years. Restricted stock units granted under the 2007Plan generally vest over three years. The 2007 Plan also covers grants of equity-based compensation tothe Company’s directors.
The Company’s equity incentive and stock-based compensation plans as of April 30, 2011 aresummarized as follows (in thousands):
Shares Restricted PerformanceShares Available Options Stock Units Shares
Name of Plan Authorized for Grant Outstanding Outstanding Outstanding
2000 Stock Plan . . . . . . . . . . . . . . . . . . . . — — 2,766 — —2000 Director Option Plan . . . . . . . . . . . . . — — 100 — —2007 Plan . . . . . . . . . . . . . . . . . . . . . . . . . 6,000 2,717 1,070 2,005 —
Total . . . . . . . . . . . . . . . . . . . . . . . . . . . 6,000 2,717 3,936 2,005 —
2009 Employee Stock Purchase Plan
The 2009 Employee Stock Purchase Plan (the ‘‘2009 Purchase Plan’’) was adopted by the board ofdirectors in July 2009 and was approved by the stockholders of the Company in September 2009. The2009 Purchase Plan replaced the Company’s 2000 Employee Stock Purchase Plan in December 2009.The board of directors has reserved a total of 2,500,000 shares of common stock for issuance under the2009 Purchase Plan. Each offering period under the 2009 Purchase Plan will have a duration ofapproximately 24 months, commencing on the first trading day on or after June 1 and December 1 ofeach year and terminating on the last trading day in the period ending 24 months later. Each offeringperiod will generally consist of four six-month purchase periods in which shares may be purchased on aparticipant’s behalf. The purchase price will be 85% of the lesser of the fair market value of thecommon stock on the first trading day of the offering period or on the last day of the purchase period.If the fair market value of the common stock on the last day of the purchase period is lower than thefair market value of the common stock on the enrollment date of the associated offering period, allparticipants in such offering period will automatically be rolled over to the immediately followingoffering period. Employees may end their participation in an offering period at any time, and theirparticipation ends automatically on termination of employment with the Company. The first offeringperiod under the 2009 Purchase Plan began on December 1, 2009.
104

OMNIVISION TECHNOLOGIES, INC.
NOTES TO CONSOLIDATED FINANCIAL STATEMENTSFor the Years Ended April 30, 2011, 2010 and 2009—(Continued)
Note 13—Employee Stock Purchase, Equity Incentive and Stock Option Plans—(Continued)
Stock Option Exchange
At the Company’s annual meeting of stockholders held on September 24, 2009, the stockholders ofthe Company approved a one-time stock option exchange program for employees to exchange eligiblestock options for restricted stock units. Under the option exchange program, eligible employees wereable to exchange their outstanding options granted before November 1, 2008 under the Company’s2000 Stock Plan or the 2007 Plan with an exercise price greater than or equal to $23.01 per share, fornew restricted stock units. The Company issued one restricted stock unit for every 3.4 stock optionstendered for exchange. The vesting schedule for these restricted stock units was determined by theremaining vesting period of the exchanged options. The option exchange program commenced onNovember 18, 2009, and expired on December 16, 2009. The Company accepted for exchange optionsto purchase 3,566,192 shares of the Company’s common stock. All surrendered options were cancelled,and immediately thereafter, the Company issued a total of 1,048,707 restricted stock units in exchange.One share of the Company’s common stock is issuable upon the vesting of each restricted stock unit.The fair value of the restricted stock units issued was measured as the total of the unrecognizedcompensation cost of the options surrendered and the incremental value of the restricted stock unitsissued, measured as the excess of the fair value of the restricted stock units over the fair value of theoptions tendered immediately before the exchange. The incremental cost of the restricted stock unitswas $1.5 million. The value of the restricted stock units, totaling $3.9 million, will be amortized over aweighted average vesting period of two years.
2000 Employee Stock Purchase Plan
The 2000 Employee Stock Purchase Plan (the ‘‘2000 Purchase Plan’’) was adopted by the board ofdirectors in February 2000 and was approved by the shareholders in March 2000. The 2000 PurchasePlan became effective upon the closing of the Company’s initial public offering. Under the 2000Purchase Plan, 3,000,000 shares of common stock were initially reserved for issuance together with anannual increase in the number of shares reserved thereunder beginning on the first day of the fiscalyear commencing May 1, 2001 in an amount equal to the lesser of: 2,000,000 shares, or four percent ofthe Company’s outstanding common stock on the last day of the prior fiscal year, or an amountdetermined by the Company’s board of directors. The offering periods under this plan are the periodsof approximately 24 months commencing on the first trading day on or after June 1 and December 1 ofeach year and terminating on the last trading day in the periods ending twenty-four months later.Depending on the fair market value of the common stock, the offer periods can be consecutive oroverlapping. The purchase period under the 2000 Purchase Plan begins on the first trading day on orafter June 1 and December 1 of each year and ends six months later. The purchase price of thecommon stock under this plan is 85% of the lesser of the fair market value per share on the firsttrading day of the offering period or on the last trading day of the purchase period. Employees mayend their participation in an offering period at any time, and their participation ends automatically ontermination of employment with the Company. The 2000 Purchase Plan was replaced by the 2009Purchase Plane and terminated in February 2010. As of April 30, 2010, 3,555,000 shares had beenpurchased under the 2000 Purchase Plan.
2000 Stock Plan
In February 2000, the Company adopted the 2000 Stock Plan under which 6,000,000 shares ofcommon stock were initially reserved for issuance together with an annual increase in the number of
105

OMNIVISION TECHNOLOGIES, INC.
NOTES TO CONSOLIDATED FINANCIAL STATEMENTSFor the Years Ended April 30, 2011, 2010 and 2009—(Continued)
Note 13—Employee Stock Purchase, Equity Incentive and Stock Option Plans—(Continued)
shares reserved thereunder beginning on the first day of the Company’s fiscal year, commencing May 1,2002, in an amount equal to the lesser of: 3,000,000 shares, or 6% of outstanding shares of commonstock on the last day of the prior fiscal year, or an amount determined by the Company’s board ofdirectors. The 2000 Stock Plan provided for grants of incentive stock options to its employees includingofficers and employees, directors and nonstatutory stock options to its consultants includingnonemployee directors. Incentive stock options were granted at a price not less than 100% of the fairmarket value of the Company’s common stock and at a price not less than 110% of the fair marketvalue for grants to any person who owned more than 10% of the voting power of all classes of stock onthe date of grant. Nonstatutory stock options were granted at a price not less than 85.0% of the fairmarket value of the common stock and at a price not less than 110% of the fair market value forgrants to a person who owned more than 10% of the voting power of all classes of stock on the date ofthe grant. Options granted under the 2000 Stock Plan have been at fair market value on the date ofthe grant and generally vest over four years and are exercisable up to ten years (five years for grants toany person who owned more than 10% of the voting power of all classes of stock on the date of thegrant).
With the adoption of the 2007 Plan, no additional equity awards will be issued under the 2000Stock Plan. As of April 30, 2011, options to purchase approximately 2,766,000 shares of common stockwere outstanding under the 2000 Stock Plan.
2000 Director Option Plan
The 2000 Director Option Plan was adopted by the board of directors in February 2000 andapproved by the shareholders in March 2000. Under this plan 500,000 shares of common stock wereinitially reserved for issuance together with an annual increase in the number of shares reservedthereunder beginning on the first day of the Company’s fiscal year commencing May 1, 2002 equal tothe lesser of 150,000 shares, or 0.25% of the outstanding shares of the common stock on the last day ofthe prior fiscal year, or an amount determined by the board of directors. The 2000 Director OptionPlan provided for an initial grant to the nonemployee director to purchase 40,000 shares of commonstock. Subsequent to the initial grants, each nonemployee director was granted an option to purchase20,000 shares of common stock at the next meeting of the board of directors following the annualmeeting of stockholders, if on the date of the annual meeting the director had served on the board ofdirectors for not less than six months. The contractual term of options granted under the 2000 DirectorOption Plan was ten years, but the options expire three months following the termination of theoptionee’s status as a director or twelve months if the termination is due to death or disability. Theinitial 40,000 share grants were exercisable at a rate of one-fourth of the shares on the first anniversaryof the grant date and at a rate of 1/16th of the shares per quarter thereafter. The subsequent 20,000share grants were exercisable at the rate of 1/16th of the shares per quarter. The exercise price of all ofthese options is 100% of the fair market value of the common stock on the date of grant.
In November 2007, the Company’s board of directors approved the termination of the Company’s2000 Director Option Plan. The 2007 Plan will also cover all future grants of equity-basedcompensation to directors. As of April 30, 2011, options to purchase approximately 100,000 shares ofcommon stock were outstanding under the 2000 Director Option Plan.
106

OMNIVISION TECHNOLOGIES, INC.
NOTES TO CONSOLIDATED FINANCIAL STATEMENTSFor the Years Ended April 30, 2011, 2010 and 2009—(Continued)
Note 13—Employee Stock Purchase, Equity Incentive and Stock Option Plans—(Continued)
Stock-Based Compensation Award Activity
The following table summarizes the equity award activities under the 2000 Stock Plan, the 2000Director Option Plan and the 2007 Plan, for the three fiscal years ended April 30, 2011:
RestrictedStock
Restricted Performance Units andStock Units Shares Performance
Options Outstanding Outstanding Outstanding Shares
WeightedWeighted Average
Shares Average Grant DateAvailable Exercise Fair Market
For Number Price Number of Number of ValueGrant of Shares Per Share Shares Shares Per Share
(in thousands) (in thousands) (in thousands) (in thousands)Balance at May 1, 2008 . . . . . . . . . . . . . . . . . . . . 5,846 13,807 $18.18 — — $ —Stock options granted . . . . . . . . . . . . . . . . . . . . . (496) 496 11.95 — — —Stock options exercised . . . . . . . . . . . . . . . . . . . . — (72) 4.70 — — —Stock options expired or forfeited . . . . . . . . . . . . . . 66 (730) 19.03 — — —
Restricted stock units granted(1) . . . . . . . . . . . . . . (1,111) — — 555 — 11.40Restricted stock units expired or forfeited(1) . . . . . . . 71 — — (35) — 11.88
Performance shares granted(1) . . . . . . . . . . . . . . . . (391) — — — 196 11.95Performance shares expired or forfeited(1) . . . . . . . . 391 — — — (196) 11.95
Balance at April 30, 2009 . . . . . . . . . . . . . . . . . . . 4,376 13,501 17.98 520 — 11.37Stock options granted . . . . . . . . . . . . . . . . . . . . . (413) 413 10.41 — — —Stock options exercised . . . . . . . . . . . . . . . . . . . . — (964) 11.73 — — —Stock options cancelled in stock option exchange . . . . 3,378 (3,566) 24.76 — — —Stock options expired or forfeited . . . . . . . . . . . . . . 98 (1,243) 17.15 — — —
Restricted stock units granted(1) . . . . . . . . . . . . . . (1,541) — — 782 — 10.76Restricted stock units issued in stock option
exchange(1) . . . . . . . . . . . . . . . . . . . . . . . . . . (1,678) — — 1,049 — 12.60Restricted stock units vested(1) . . . . . . . . . . . . . . . — — — (170) — 10.94Restricted stock units expired or forfeited(1) . . . . . . . 215 — — (108) — 10.53
Balance at April 30, 2010 . . . . . . . . . . . . . . . . . . . 4,435 8,141 15.49 2,073 — 11.80Stock options granted . . . . . . . . . . . . . . . . . . . . . (468) 468 21.84 — — —Stock options exercised . . . . . . . . . . . . . . . . . . . . — (4,593) 15.42 — — —Stock options expired or forfeited . . . . . . . . . . . . . . 40 (80) 15.75 — — —
Restricted stock units granted(1) . . . . . . . . . . . . . . (1,644) — — 1,028 — 22.50Restricted stock units vested(1) . . . . . . . . . . . . . . . — — — (890) — 11.98Restricted stock units expired or forfeited(1) . . . . . . . 354 — — (206) — 15.60
Balance at April 30, 2011—shares available for grant . . 2,717 — — — — —
Balance at April 30, 2011—options . . . . . . . . . . . . . 3,936 16.31 — — —
Balance at April 30, 2011—restricted stock units . . . . . — — — 2,005 — 16.81
Balance at April 30, 2011—performance shares . . . . . — — — — — —
Exercisable at April 30, 2011 . . . . . . . . . . . . . . . . . — 3,846 $16.25 — — —
Vested and expected to vest at April 30, 2011—options . — 3,020 $16.09 — — —
Vested and expected to vest at April 30, 2011—restricted stock units . . . . . . . . . . . . . . . . . . . . — — — 1,797 — $16.81
Vested and expected to vest at April 30, 2011—performance shares . . . . . . . . . . . . . . . . . . . . . — — — — — $ —
(1) Shares subject to awards granted for less than fair market value on the date of grant count against the share reserve as two sharesfor every one share subject to such an award. When a share is returned to the plan, two shares will be credited back to the reserve.With the approval of the Company’s stockholders in September 2009, the Company modified certain terms of the 2007 Plan.Specifically, for restricted stock units granted after September 2009, the grant will count against the share reserve as 1.6 shares forevery one share granted. When a share is returned to the plan which was granted after September 2009, 1.6 shares will be creditedback to the reserve.
107

OMNIVISION TECHNOLOGIES, INC.
NOTES TO CONSOLIDATED FINANCIAL STATEMENTSFor the Years Ended April 30, 2011, 2010 and 2009—(Continued)
Note 13—Employee Stock Purchase, Equity Incentive and Stock Option Plans—(Continued)
As of April 30, 2011 and 2010, options to purchase 3,020,000 and 6,742,000 shares, respectively,were vested. Information regarding the options outstanding as of April 30, 2011 is summarized below:
Options Outstanding Options Exercisable
Weighted WeightedAverage Weighted Average Weighted
Remaining Average Aggregate Options Remaining Average AggregateOptions Contractual Exercise Intrinsic Vested and Contractual Exercise Intrinsic
Range of Exercise Prices Outstanding Life Price Value Exercisable Life Price Value
(in thousands) (in years) (in thousands) (in thousands) (in years) (in thousands)
$ 2.25 - $14.60 . . . . . . . . 796 $10.33 485 $10.14$14.61 - $14.93 . . . . . . . . 875 14.93 767 14.93$14.94 - $16.69 . . . . . . . . 849 16.57 849 16.57$16.70 - $19.38 . . . . . . . . 652 17.62 622 17.58$19.39 - $25.56 . . . . . . . . 764 22.74 297 24.24
$ 2.25 - $25.56 . . . . . . . . 3,936 5.36 $16.31 $68,000 3,020 4.94 $16.09 $52,863
The aggregate intrinsic value in the table above represents the total pretax intrinsic value (theaggregate difference between the closing stock price of the Company’s common stock on April 30, 2011of $33.59 and the exercise price of in-the-money options) that would have been received by the optionholders had all option holders exercised their options as of that date. The total number of shares ofcommon stock underlying in-the-money options exercisable as of April 30, 2011 was 3,020,000.
The total intrinsic value of options exercised, the total intrinsic value of restricted stock unitsvested and the total cash received from employees as a result of employee stock option exercises duringthe periods indicated were as follows (in thousands):
April 30,
2011 2010
Total intrinsic value of options exercised . . . . . . . . . . . . . . . . . . $55,363 $ 4,912Total intrinsic value of restricted stock units vested . . . . . . . . . . . 23,173 1,853Total cash received from employees as a result of employee stock
option exercises . . . . . . . . . . . . . . . . . . . . . . . . . . . . . . . . . . $70,817 $11,307
Unrecognized compensation expense and the weighted average period over which the Companyexpects to recognize such compensation as of the dates indicated were as follows (dollars in thousands):
April 30,
2011 2010
Unvested stock options:Unrecognized compensation expense, net of forfeitures . . . . . . . $ 5,383 $8,179Weighted average period (years) . . . . . . . . . . . . . . . . . . . . . . . 2.2 1.7
Unvested restricted stock units:Unrecognized compensation expense, net of forfeitures . . . . . . . $18,289 $9,512Weighted average period (years) . . . . . . . . . . . . . . . . . . . . . . . 1.5 1.8
2009 Purchase Plan:Unrecognized compensation expense . . . . . . . . . . . . . . . . . . . . $ 976 $2,840Weighted average period (years) . . . . . . . . . . . . . . . . . . . . . . . 0.8 1.1
108

OMNIVISION TECHNOLOGIES, INC.
NOTES TO CONSOLIDATED FINANCIAL STATEMENTSFor the Years Ended April 30, 2011, 2010 and 2009—(Continued)
Note 13—Employee Stock Purchase, Equity Incentive and Stock Option Plans—(Continued)
The Company’s current policy is to issue new shares to settle the exercise of stock options andprospectively, the vesting of restricted stock units.
Valuation Assumptions
The authoritative guidance for stock-based compensation requires companies to estimate the fairvalue of stock-based compensation awards on the grant date. The value of the portion of the awardthat is ultimately expected to vest is recognized as expense over the requisite service period in theCompany’s Consolidated Statements of Operations.
For restricted stock unit awards, the per-share fair value is the closing market price of theCompany’s common stock as reported on the NASDAQ Global Market (‘‘NASDAQ’’) on the grantdate. For stock option awards and rights issued under the Company’s employee stock purchase plans,the Company measures the fair value using the Black-Scholes option pricing model. Black-Scholes wasdeveloped to estimate the fair value of freely tradable, fully transferable options without vestingrestrictions. These assumptions differ significantly from the characteristics of the Company’s stock-based compensation awards. Black-Scholes also requires the use of highly subjective, complexassumptions, including expected term and the price volatility of the Company’s stock.
The fair value for these options was estimated using the Black-Scholes option pricing model. Theper share weighted average estimated grant date fair value for employee options granted during theperiods indicated was as follows:
Year Ended April 30,
2011 2010 2009
Per share weighted average estimated grant date fair value . . $9.89 $4.74 $5.02
The following weighted average assumptions are included in the estimated fair value calculationsfor stock options granted in the periods indicated:
Employee Stock Employee StockOption Plans Purchase Plan
Year Ended April 30, Year Ended April 30,
2011 2010 2009 2011 2010 2009
Risk-free interest rate . . . . . . . . . . . . . . . . . . . . . . . . . . . 1.4% 2.0% 3.0% 0.2% 1.4% 3.3%Expected term of options (in years) . . . . . . . . . . . . . . . . . 4.1 4.2 4.1 0.5 0.5 0.5Expected volatility . . . . . . . . . . . . . . . . . . . . . . . . . . . . . 57% 56% 50% 50% 63% 46%Expected dividend yield . . . . . . . . . . . . . . . . . . . . . . . . . 0% 0% 0% 0% 0% 0%
Using Black-Scholes, the per share weighted average estimated fair value of rights issued pursuantto the Company’s employee stock purchase plans during the periods indicated was as follows:
Year Ended April 30,
2011 2010 2009
Per share weighted average estimated fair value of rightsissued . . . . . . . . . . . . . . . . . . . . . . . . . . . . . . . . . . . . . . . $4.81 $3.26 $3.63
109

OMNIVISION TECHNOLOGIES, INC.
NOTES TO CONSOLIDATED FINANCIAL STATEMENTS—(Continued)
For the Years Ended April 30, 2011, 2010 and 2009
Note 13—Employee Stock Purchase, Equity Incentive and Stock Option Plans—(Continued)
The methodologies for determining the above values were as follows:
• Expected term: The expected term represents the period that the Company’s stock-based awardsare expected to be outstanding and is estimated based on historical experience.
• Risk-free interest rate: The risk-free interest rate assumption is based upon observed interest ratesappropriate for the expected term of the Company’s stock-based awards.
• Expected volatility: The Company determines expected volatility based on an average betweenthe historical volatility of the Company’s common stock and the implied volatility based on theCompany’s traded options with lives of six months or more. Averaging two data sources mayprovide a better proxy to what market place participants would use to value the Company’soptions.
• Dividend yield: The dividend yield assumption reflects the Company’s intention not to pay a cashdividend under its dividend policy.
• Estimated pre-vesting forfeitures: When estimating pre-vesting forfeitures, the Company considersforfeiture behavior based on actual historical information.
Note 14—Risks and Uncertainties
Financial instruments which potentially subject the Company to concentrations of credit riskconsist principally of cash and cash equivalents, short-term investments, trade receivables and theinterest rate swaps.
The Company maintains cash and cash equivalents and short-term investments with variousfinancial institutions, located in several different jurisdictions. The majority of the cash and cashequivalents balances are held in U.S. Cayman Islands and Hong Kong. The short-term investments areprimarily held in U.S. and Cayman Islands. Deposits held with banks may generally be redeemed upondemand and may exceed the limit of insurance provided on such deposits. All these deposits and otherfinancial instruments including our interest rate swaps are maintained with financial institutions ofreputable credit and therefore bear minimal credit risk. The Company has not sustained credit lossesfrom instruments held at financial institutions.
The Company’s products are primarily sold to OEMs, VARs and to distributors. The Company’ssales to significant customers as a percentage of revenues for the periods indicated were as follows:
Year Ended April 30,
2011 2010 2009
Percentage of revenues:Customer A . . . . . . . . . . . . . . . . . . . . . . . . . . . . . . . . . . . . 13.8% 27.0% 22.4%Customer B . . . . . . . . . . . . . . . . . . . . . . . . . . . . . . . . . . . . 17.6 * *Customer C . . . . . . . . . . . . . . . . . . . . . . . . . . . . . . . . . . . . *% 11.2% 10.4%
* Less than ten percent of revenues.
110

OMNIVISION TECHNOLOGIES, INC.
NOTES TO CONSOLIDATED FINANCIAL STATEMENTS—(Continued)
For the Years Ended April 30, 2011, 2010 and 2009
Note 14—Risks and Uncertainties—(Continued)
The Company performs ongoing credit evaluations of its customers and maintains an allowance fordoubtful accounts. Significant customer account receivables as a percentage of net accounts receivablefor the periods indicated were as follows:
April 30,
2011 2010
Percentage of accounts receivable, net:Customer A . . . . . . . . . . . . . . . . . . . . . . . . . . . . . . . . . . . . . . . . . 30.4% *%Customer B . . . . . . . . . . . . . . . . . . . . . . . . . . . . . . . . . . . . . . . . . . 12.3 27.3Customer C . . . . . . . . . . . . . . . . . . . . . . . . . . . . . . . . . . . . . . . . . . 12.2 *Customer D . . . . . . . . . . . . . . . . . . . . . . . . . . . . . . . . . . . . . . . . . * 11.4Customer E . . . . . . . . . . . . . . . . . . . . . . . . . . . . . . . . . . . . . . . . . . *% 10.1%
* Less than ten percent of accounts receivable, net.
Certain of the Company’s wafer, color filter application and packaging services are obtained froma single source or a limited group of suppliers. The partial or complete loss of one or more of thesesources could have at least a temporary adverse effect on the Company’s consolidated results ofoperations.
Note 15—Segment and Geographic Information
For all periods presented, the Company operated in a single reportable business segment.
The Company sells its image-sensor products either directly to OEMs and VARs or indirectlythrough distributors. The following table illustrates the percentage of revenues from sales to OEMs andVARs and to distributors for the periods indicated, respectively:
Year Ended April 30,
2011 2010 2009
OEMs and VARs . . . . . . . . . . . . . . . . . . . . . . . . . . . . . . . 75.3% 51.5% 58.0%Distributors . . . . . . . . . . . . . . . . . . . . . . . . . . . . . . . . . . . 24.7 48.5 42.0
Total . . . . . . . . . . . . . . . . . . . . . . . . . . . . . . . . . . . . . . . 100.0% 100.0% 100.0%
Since the Company’s end-user customers market and sell their products worldwide, its revenues bygeographic location are not necessarily indicative of the geographic distribution of end-user sales, butrather indicate where their components are sourced. The revenues by geography in the following table
111

OMNIVISION TECHNOLOGIES, INC.
NOTES TO CONSOLIDATED FINANCIAL STATEMENTS—(Continued)
For the Years Ended April 30, 2011, 2010 and 2009
Note 15—Segment and Geographic Information—(Continued)
are based on the country or region in which the Company’s customers issue their purchase orders forthe periods presented (in thousands):
Year Ended April 30,
2011 2010 2009
China . . . . . . . . . . . . . . . . . . . . . . . . . . . . . . . . . $614,891 $504,940 $383,875Taiwan . . . . . . . . . . . . . . . . . . . . . . . . . . . . . . . . . 32,908 51,095 41,154Malaysia . . . . . . . . . . . . . . . . . . . . . . . . . . . . . . . 66,827 21,890 36,358South Korea . . . . . . . . . . . . . . . . . . . . . . . . . . . . . 199,747 5,406 4,670United States . . . . . . . . . . . . . . . . . . . . . . . . . . . . 16,203 3,513 33,912All other . . . . . . . . . . . . . . . . . . . . . . . . . . . . . . . 25,900 16,147 7,347
Total . . . . . . . . . . . . . . . . . . . . . . . . . . . . . . . . $956,476 $602,991 $507,316
The Company’s long-lived assets, including its long-term investments, are located in the followingcountries as of the dates indicated (in thousands):
April 30,
2011 2010
Taiwan . . . . . . . . . . . . . . . . . . . . . . . . . . . . . . . . . . . . . . . . . $ 98,001 $ 92,092China . . . . . . . . . . . . . . . . . . . . . . . . . . . . . . . . . . . . . . . . . . 67,218 64,558United States . . . . . . . . . . . . . . . . . . . . . . . . . . . . . . . . . . . . 56,428 59,602All other . . . . . . . . . . . . . . . . . . . . . . . . . . . . . . . . . . . . . . . 646 928
Total . . . . . . . . . . . . . . . . . . . . . . . . . . . . . . . . . . . . . . . . . $222,293 $217,180
Note 16—Commitments and Contingencies
Commitments
The Company maintains a wholly-owned subsidiary in Shanghai, China, OmniVision Technologies(Shanghai) Co. Ltd. (‘‘OTC’’) which provides assistance to the Company in various product designprojects and in marketing and sales support. On January 10, 2007, OTC entered into a Land-Use-RightPurchase Agreement (the ‘‘Purchase Agreement’’) with the Construction and TransportationCommission of the Pudong New District, Shanghai. The Purchase Agreement has an effective date ofDecember 31, 2006. Under the terms of the Purchase Agreement, the Company agreed to pay anaggregate amount of approximately $0.6 million (the ‘‘Purchase Price’’) in exchange for the right to useapproximately 323,000 square feet of land located in Shanghai for a period of 50 years. The Companymay use the land solely for the purposes of industrial use and/or scientific research. As of April 30,2011, the construction of a research facility on the land was complete, in accordance with the PurchaseAgreement. The Company obtained a Construction Loan to finance the construction. (See Note 8.)
During the three months ended October 31, 2008, the Company formed Shanghai OmniVisionSemiconductor Technology Co. Ltd. (‘‘OST’’), a wholly-owned subsidiary in Shanghai, China, for thepurpose of expanding its testing capabilities. As of April 30, 2011, the Company had contributed$1.5 million, as required under the terms of its $10.0 million capital commitment. The Company is
112

OMNIVISION TECHNOLOGIES, INC.
NOTES TO CONSOLIDATED FINANCIAL STATEMENTS—(Continued)
For the Years Ended April 30, 2011, 2010 and 2009
Note 16—Commitments and Contingencies—(Continued)
required to contribute the remaining $8.5 million by October 2011, which represents a one-yearextension from the original due date of October 2010.
During the three months ended April 30, 2011, the Company formed OmniVision OptoelectronicsTechnologies (Shanghai) Co. Ltd. (‘‘OOC’’), a wholly-owned subsidiary in Shanghai, China, for thepurpose of expanding its manufacturing capabilities. The Company contributed $3.8 million of thecommitted $25.0 million registered capital in June 2011. In addition, the Company is required tocontribute the remaining $21.2 million by April 2013.
The Company leases certain facilities and software under non-cancelable operating leaseagreements. The non-cancelable operating leases expire at various dates through fiscal 2016. AtApril 30, 2011, future minimum lease commitments under operating leases are as follows (inthousands):
Years Ended April 30,
2012 . . . . . . . . . . . . . . . . . . . . . . . . . . . . . . . . . . . . . . . . . . . . . . . . . . . . . $4,3432013 . . . . . . . . . . . . . . . . . . . . . . . . . . . . . . . . . . . . . . . . . . . . . . . . . . . . . 2,8892014 . . . . . . . . . . . . . . . . . . . . . . . . . . . . . . . . . . . . . . . . . . . . . . . . . . . . . 7722015 . . . . . . . . . . . . . . . . . . . . . . . . . . . . . . . . . . . . . . . . . . . . . . . . . . . . . 472016 . . . . . . . . . . . . . . . . . . . . . . . . . . . . . . . . . . . . . . . . . . . . . . . . . . . . . 18
Total . . . . . . . . . . . . . . . . . . . . . . . . . . . . . . . . . . . . . . . . . . . . . . . . . . . $8,069
The following table presents rental expenses under all operating leases during the periodspresented (in thousands):
Year Ended April 30,
2011 2010 2009
Rental expenses under operating leases . . . . . . . . . . . . . . $7,204 $6,875 $7,905
Litigation
From time to time, the Company has been subject to legal proceedings and claims with respect tosuch matters as patents, product liabilities and other actions arising out of the normal course ofbusiness.
On November 29, 2001, a complaint captioned McKee v. OmniVision Technologies, Inc., et. al., CivilAction No. 01 CV 10775, was filed in the United States District Court for the Southern District of NewYork against OmniVision, some of the Company’s directors and officers, and various underwriters forthe Company’s initial public offering. Du1978Plaintiffs generally allege that the defendants violatedfederal securities laws because the prospectus related to the Company’s offering failed to disclose, andcontained false and misleading statements regarding, certain commissions purported to have beenreceived by the underwriters, and other purported underwriter practices in connection with theirallocation of shares in the Company’s offering. The complaint seeks unspecified damages on behalf of apurported class of purchasers of the Company’s common stock between July 14, 2000 and December 6,2000. Substantially similar actions have been filed concerning the initial public offerings for more than
113

OMNIVISION TECHNOLOGIES, INC.
NOTES TO CONSOLIDATED FINANCIAL STATEMENTS—(Continued)
For the Years Ended April 30, 2011, 2010 and 2009
Note 16—Commitments and Contingencies—(Continued)
300 different issuers, and the cases have been coordinated as In re Initial Public Offering SecuritiesLitigation, 21 MC 92. On February 19, 2003, the Court issued an order dismissing all claims against theCompany except for a claim brought under Section 11 of the Securities Act of 1933.
The parties have reached a global settlement of the coordinated litigation. Under the settlement,the insurers will pay the full amount of settlement share allocated to the Company, and the Companywill bear no financial liability. The Company and the other defendants will receive complete dismissalsfrom the case. In 2009, the Court entered an order granting final approval of the settlement. Certainobjectors filed appeals. A number of those appeals were dismissed. In May 2011, the appellate courtissued an order remanding the remaining appeals to the district court for further determinations. If forany reason the settlement does not become effective, and litigation against the Company proceeds, theCompany believes that it has meritorious defenses to plaintiffs’ claims and intends to defend the actionvigorously.
On October 12, 2007, a purported OmniVision stockholder filed a complaint against certain of theCompany’s underwriters for its initial public offering. The complaint, Vanessa Simmonds v. Bank ofAmerica Corporation, et al., Case No. C07-1668, filed in District Court for the Western District ofWashington, makes similar allegations to those made in In re Initial Public Offering Securities Litigationand seeks the recovery of short-swing trading profits under Section 16(b) of the Securities ExchangeAct of 1934. The Company is named as a nominal defendant, and no recovery was sought from it. Theplaintiff filed an amended complaint in February 2008. On March 12, 2009, the Court granted themotion to dismiss without prejudice, filed by 30 of the issuer defendants and the motion to dismiss withprejudice, filed by all of the underwriter defendants, which included the suit against the Company. Theplaintiff timely appealed the Court’s Order to the United States Court of Appeals for the NinthCircuit. On December 3, 2010, the Ninth Circuit entered its opinion and order in this matter. TheCourt affirmed the dismissal of the suits against the 30 moving issuer defendants on the grounds thatthe demand letters sent to those issuers were inadequate under Delaware law, and converted thedismissals from without prejudice to with prejudice. The Court also reversed the dismissal of the suitsagainst the remaining 24 issuer defendants, including the Company, but is allowing those issuerdefendants, including the Company, to challenge the adequacy of the demand letters that the plaintiffsent to the issuers before filing suit. On January 24, 2011, the underwriter defendants filed a motion tostay the Ninth Circuit’s mandate pending its filing of a petition for a writ of certiorari in the UnitedStates Supreme Court. On January 25, 2011, the Ninth Circuit granted the motion and entered anOrder staying the mandate for ninety days. On January 26, 2011, plaintiff also filed a motion to jointhe underwriters’ motion to stay the Ninth Circuit’s mandate on the grounds that plaintiff also will befiling a petition for a writ of certiorari in the United States Supreme Court. The petitions for a writ ofcertiorari have not yet been filed with the United States Supreme Court. No discovery has taken place.
At the end of May 2009, plaintiff sent a Demand for Inspection of Books and Records to certainof the nominal defendants named in the Section 16(b) litigation seeking the companies to produce anytolling agreements entered into with the companies’ respective underwriters. Plaintiff’s counsel hasagreed to an open-ended extension for certain nominal defendants who received such a demand. As ofthe date of this filing, the Company has not received a demand for inspection of books and recordsfrom the plaintiff.
114

OMNIVISION TECHNOLOGIES, INC.
NOTES TO CONSOLIDATED FINANCIAL STATEMENTS—(Continued)
For the Years Ended April 30, 2011, 2010 and 2009
Note 16—Commitments and Contingencies—(Continued)
On March 6, 2009, Panavision Imaging, LLC (‘‘Panavision’’) filed a complaint against the Companyalleging patent infringement in the District Court for the Central District of California. The case isentitled Panavision Imaging, LLC v. OmniVision Technologies, Inc., Canon U.S.A., Inc., MicronTechnology, Inc. and Aptina Imaging Corporation, Case No. CV09-1577. In its complaint, Panavisionasserts that the Company makes, has made, uses, sells and/or imports products that infringe U.S. PatentNos. 6,818,877 (‘‘Pre-charging a Wide Analog Bus for CMOS Image Sensors’’), 6,663,029 (‘‘Video Busfor High Speed Multi-resolution Imagers and Method Thereof’’) and 7,057,150 (‘‘Solid State Imagerwith Reduced Number of Transistors per Pixel’’). The complaint seeks unspecified monetary damages,fees and expenses and injunctive relief against the Company. On April 19, 2010, the court stayed thecase pending reexamination of all of the asserted patents, as the U.S. Patent and Trademark Office hasgranted reexamination requests for all of the asserted claims of the asserted patents. On October 22,2010, the U.S. Patent and Trademark Office issued an Action Closing Prosecution of the inter partesreexamination of U.S. Patent No. 6,818,877 and confirmed the four claims submitted for inter partesreexamination by co-defendants Micron Technology, Inc. and Aptina Imaging Corporation. OnDecember 13, 2010, the Court lifted the stay as to U.S. Patent No. 6,818,877. On February 7, 2011, theCourt issued a Markman order with respect to U.S. Patent No. 6,818,877, and granted summaryjudgment of invalidity for indefiniteness for all of the asserted claims of U.S. Patent No. 6,818,877. OnFebruary 22, 2011, Panavision filed its Final Infringement Contentions, conceding that OmniVision’sproducts do not infringe U.S. Patent No. 6,818,877 because every claim contains what the Court hasheld to be an indefinite term. On April 11, 2011, the Court directed the parties to file supplementalbriefs regarding whether all of the asserted claims of U.S. Patent No. 6,818,877 are invalid forindefiniteness. On May 31, 2011, the Court conducted a hearing on the invalidity issue to determinewhether it should reconsider its order of summary judgment of invalidity.
As to the two remaining asserted patents, on November 29, 2010, the U.S. Patent and TrademarkOffice issued an Action Closing Prosecution of the inter partes reexamination of U.S. PatentNo. 7,057,150 and rejected all of the claims submitted for inter partes reexamination. On January 5,2011, the U.S. Patent and Trademark Office issued an Action Closing Prosecution of the inter partesreexamination of U.S. Patent No. 6,663,029 and rejected all of the claims submitted for inter partesreexamination. As a result, all of the asserted claims of the asserted patents are held to be invalid bythe Court or the U.S. Patent and Trademark Office. At this time, the Company cannot estimate anypossible loss or predict whether this matter will result in any material expense to the Company.
On December 6, 2010, Ziptronix, Inc. (‘‘Ziptronix’’) filed a complaint alleging patent infringementagainst the Company in the District Court for the Northern District of California. The case is entitledZiptronix, Inc. v. OmniVision Technologies, Inc., Taiwan Semiconductor Manufacturing Company Ltd., andTSMC North America Corp., Case No. CV10-05525. In its complaint, Ziptronix asserts that the Companyhas made, used, offered to sell, sold and/or imported into the United States image sensors that infringeU.S. Patent Nos. 7,387,944 (‘‘Method for Low Temperature Bonding and Bonded Structure’’), 7,335,572(‘‘Method for Low Temperature Bonding and Bonded Structure’’), 7,553,744 (‘‘Method for LowTemperature Bonding and Bonded Structure’’), 7,037,755 (‘‘Three Dimensional Device IntegrationMethod and Integrated Device’’), 6,864,585 (‘‘Three Dimensional Device Integration Method andIntegrated Device’’), and 7,807,549 (‘‘Method for Low Temperature Bonding and Bonded Structure’’).The complaint seeks unspecified monetary damages, enhanced damages, interest, fees, expenses, costs,and injunctive relief against the Company. The Company answered the complaint on May 4, 2011 and
115

OMNIVISION TECHNOLOGIES, INC.
NOTES TO CONSOLIDATED FINANCIAL STATEMENTS—(Continued)
For the Years Ended April 30, 2011, 2010 and 2009
Note 16—Commitments and Contingencies—(Continued)
denied each of Ziptronix’s infringement claims against it. The Company expects to vigorously defenditself against Ziptronix’s allegations. At this time, the Company cannot estimate any possible loss orpredict whether this matter will result in any material expense to it.
Note 17—Related Party Transactions
The following table presents the amounts paid for services provided by related parties and thebalances payable for the periods indicated (in thousands):
Year Ended April 30,
Related Party Description 2011 2010 2009
VisEra . . . . . . . . . . . Purchases of color filter and othermanufacturing services . . . . . . . . . . . . . . . . . $110,872 $74,718 $52,215
Balance payable at year end, net . . . . . . . . . . . $ 17,839 $15,006 $ 2,403
The following table summarizes the transactions that the Company’s equity method investees, SOIand VisEra, engaged with related parties for the periods indicated (in thousands):
Year Ended April 30,
2011 2010 2009
SOI(1) transactions with:ImPac:
Purchases of manufacturing services . . . . . . . . . . . . . $ — $ 305 $ 616Balance payable at year end, net . . . . . . . . . . . . . . . . — — 86
PTC:Purchases of wafers . . . . . . . . . . . . . . . . . . . . . . . . . 1,346 791 2,648Rent and other services . . . . . . . . . . . . . . . . . . . . . . 67 88 70Balance payable at year end, net . . . . . . . . . . . . . . . . — 45 44
VisEra:Purchases of manufacturing services . . . . . . . . . . . . . 201 158 35Balance payable at year end . . . . . . . . . . . . . . . . . . . — 19 16
VisEra transactions with:TSMC:
Sales to TSMC . . . . . . . . . . . . . . . . . . . . . . . . . . . . 1,887 1,294 1,537Purchase manufacturing services . . . . . . . . . . . . . . . . 171 31 5Balance payable at year end, net . . . . . . . . . . . . . . . . 16 — —Balance receivable at year end, net . . . . . . . . . . . . . . 238 239 155
SOI(1):Sales to SOI . . . . . . . . . . . . . . . . . . . . . . . . . . . . . . 201 158 35Balance receivable at year end, net . . . . . . . . . . . . . . $ — $ 19 $ 16
(1) In the three months ended January 31, 2011, the Company sold its ownership interest inSOI. (See Note 5.)
116

OMNIVISION TECHNOLOGIES, INC.
NOTES TO CONSOLIDATED FINANCIAL STATEMENTS—(Continued)
For the Years Ended April 30, 2011, 2010 and 2009
Note 17—Related Party Transactions—(Continued)
The Company purchases a substantial portion of its wafers from TSMC. The Company alsopurchases a portion of its wafers from PTC.
Note 18—Subsequent Event
On June 20, 2011, the Company entered into an agreement with VisEra to acquire from VisEra itswafer-level lens production operations to enhance the Company’s CameraCube production capabilities.The cash consideration for the operation is $45.0 million and the Company anticipates to close thetransaction in the second quarter of fiscal 2012.
117

Supplementary Data (Unaudited)Three Months Ended
July 31, October 31, January 31, April 30,2010 2010 2011 2011
(in thousands, except per share data)
Revenues . . . . . . . . . . . . . . . . . . . . . . . . . . . . . . . . . . . $193,071 $239,460 $265,677 $258,268Cost of revenues . . . . . . . . . . . . . . . . . . . . . . . . . . . . . 141,116 172,013 186,464 178,866Gross profit . . . . . . . . . . . . . . . . . . . . . . . . . . . . . . . . . 51,955 67,447 79,213 79,402Net income (loss) attributable to OmniVision
Technologies, Inc. . . . . . . . . . . . . . . . . . . . . . . . . . . . $ 16,938 $ 28,867 $ 44,718 $ 33,959Net income (loss) per share attributable to OmniVision
Technologies, Inc. common stockholders:Basic(1) . . . . . . . . . . . . . . . . . . . . . . . . . . . . . . . . . . $ 0.32 $ 0.53 $ 0.80 $ 0.59
Diluted(1) . . . . . . . . . . . . . . . . . . . . . . . . . . . . . . . . $ 0.30 $ 0.50 $ 0.75 $ 0.56
Shares used in computing net income (loss) per shareattributable to OmniVision Technologies, Inc. commonstockholders:Basic . . . . . . . . . . . . . . . . . . . . . . . . . . . . . . . . . . . . 53,214 54,235 56,174 57,674
Diluted . . . . . . . . . . . . . . . . . . . . . . . . . . . . . . . . . . . 56,572 57,680 59,936 60,939
Three Months Ended
July 31, October 31, January 31, April 30,2009 2009 2010 2010
(in thousands, except per share data)
Revenues . . . . . . . . . . . . . . . . . . . . . . . . . . . . . . . . . . . $105,560 $183,344 $156,935 $157,152Cost of revenues . . . . . . . . . . . . . . . . . . . . . . . . . . . . . 81,890 139,382 118,396 117,978Gross profit . . . . . . . . . . . . . . . . . . . . . . . . . . . . . . . . . 23,670 43,962 38,539 39,174Net income (loss) attributable to OmniVision
Technologies, Inc. . . . . . . . . . . . . . . . . . . . . . . . . . . . $ (9,856) $ 8,084 $ 4,950 $ 3,546Net income (loss) per share attributable to OmniVision
Technologies, Inc. common stockholders:Basic(1) . . . . . . . . . . . . . . . . . . . . . . . . . . . . . . . . . . $ (0.19) $ 0.16 $ 0.10 $ 0.07
Diluted(1) . . . . . . . . . . . . . . . . . . . . . . . . . . . . . . . . $ (0.19) $ 0.16 $ 0.09 $ 0.07
Shares used in computing net income (loss) per shareattributable to OmniVision Technologies, Inc. commonstockholders:Basic . . . . . . . . . . . . . . . . . . . . . . . . . . . . . . . . . . . . 50,574 50,763 51,273 51,711
Diluted . . . . . . . . . . . . . . . . . . . . . . . . . . . . . . . . . . . 50,574 51,769 52,554 53,949
(1) Net income (loss) per share attributable to OmniVision Technologies, Inc. common stockholders iscomputed independently for each of the quarters presented. Therefore, the sum of quarterly basicand diluted per share information may not equal annual basic and diluted earnings per share.
ITEM 9. CHANGES IN AND DISAGREEMENTS WITH ACCOUNTANTS ON ACCOUNTING ANDFINANCIAL DISCLOSURE
None.
118

ITEM 9A. CONTROLS AND PROCEDURES
Disclosure Controls and Procedures
Evaluation of Disclosure Controls and Procedures (‘‘Disclosure Controls’’). We evaluated theeffectiveness of the design and operation of our Disclosure Controls, as defined by the rules andregulations of the SEC (the ‘‘Evaluation’’), as of the end of the period covered by this Report. ThisEvaluation was performed under the supervision and with the participation of management, includingour Chief Executive Officer (the ‘‘CEO’’), as principal executive officer, and Chief Financial Officer(the ‘‘CFO’’), as principal financial officer.
Attached as Exhibits 31.1 and 31.2 of this Report are the certifications of the CEO and the CFO,respectively, in compliance with Section 302 of the Sarbanes-Oxley Act of 2002 (the ‘‘Certifications’’).This section of the Report provides information concerning the Evaluation referred to in theCertifications and should be read in conjunction with the Certifications.
Disclosure Controls are controls and procedures designed to ensure that information required tobe disclosed in the reports filed or submitted under the Securities Exchange Act of 1934, as amended,is recorded, processed, summarized and reported within the time periods as specified in the SEC’srules and forms. In addition, Disclosure Controls are designed to ensure the accumulation andcommunications of information required to be disclosed in reports filed or submitted under theSecurities Exchange Act of 1934, as amended, to our management, including the CEO and CFO, toallow timely decisions regarding required disclosure.
Based on the Evaluation, our CEO and CFO have concluded that our Disclosure Controls areeffective at the reasonable assurance level as of the end of fiscal year 2011.
Inherent Limitations on the Effectiveness of Disclosure Controls
Our management, including the CEO and CFO, does not expect that the Disclosure Controls willprevent all errors and all fraud. Disclosure Controls, no matter how well conceived, managed, utilizedand monitored, can provide only reasonable assurance that the objectives of such controls are met.Therefore, because of the inherent limitation of Disclosure Controls, no evaluation of such controls canprovide absolute assurance that all control issues and instances of fraud, if any, within us have beendetected.
Management’s Annual Report on Internal Control over Financial Reporting
Management is responsible for establishing and maintaining adequate internal control overfinancial reporting. Management conducted an assessment of our internal control over financialreporting as of April 30, 2011 based on the framework established by the Committee of SponsoringOrganizations of the Treadway Commission in Internal Control—Integrated Framework. Based on thisassessment, management concluded that, as of April 30, 2011, our internal control over financialreporting was effective. The independent registered public accounting firm,PricewaterhouseCoopers LLP, has issued an attestation report on our internal control over financialreporting. The report on the audit of internal control over financial reporting appears on page 60 ofthis Annual Report on Form 10-K.
Internal control over financial reporting cannot provide absolute assurance of achieving financialreporting objectives because of its inherent limitations. Internal control over financial reporting is aprocess that involves human diligence and compliance, and is subject to lapses in judgment andbreakdowns resulting from human failures. Internal control over financial reporting also can becircumvented by collusion or improper management override. Because of such limitations, there is arisk that material misstatements may not be prevented or detected on a timely basis by internal controlover financial reporting. However, these inherent limitations are known features of the financial
119

reporting process. Therefore it is possible to design into the process safeguards to reduce, though noteliminate, this risk.
Changes in Internal Control over Financial Reporting
There were no changes in our internal control over financial reporting that occurred during thethree months ended April 30, 2011, that have materially affected, or are reasonably likely to materiallyaffect, our internal control over financial reporting.
ITEM 9B. OTHER INFORMATION
None.
120

PART III
ITEM 10. DIRECTORS, EXECUTIVE OFFICERS OF THE REGISTRANT AND CORPORATEGOVERNANCE
The information required by this item concerning our directors is incorporated by reference to thesections captioned ‘‘Proposal One—Election of Class II Directors’’ and ‘‘Corporate Governance’’contained in our proxy statement related to our 2011 Annual Meeting of Stockholders, to be filed withthe SEC within 120 days of the end of our fiscal year pursuant to General Instruction G(3) ofForm 10-K (the ‘‘Proxy Statement’’). The information required by this item concerning compliance withSection 16(a) of the Exchange Act is incorporated by references to the section captioned ‘‘Section 16(a)Beneficial Ownership Reporting Compliance’’ in our Proxy Statement. Certain information required bythis item concerning executive officers is set forth in Part I of this Report in Item 1. ‘‘Business’’ underthe heading ‘‘Executive Officers of the Registrant.’’
Code of Ethics
We have a code of ethics that applies to all of our employees, including our principal executiveofficer, principal financial officer and principal accounting officer. This code of ethics is posted on ourInternet website. The Internet address for our website is http://www.ovt.com, and the code of ethicsmay be found on the ‘‘Corporate Governance’’ section of our ‘‘Investors’’ webpage.
We intend to satisfy the disclosure requirement under Item 5.05 of Form 8-K regarding anyamendment to, or waiver from, a provision of this code of ethics by posting such information on ourwebsite, at the address and location specified above, or as otherwise required by the NASDAQ GlobalMarket.
ITEM 11. EXECUTIVE COMPENSATION
The information required by this item is incorporated by reference to the sections captioned‘‘Executive Compensation’’ contained in the Proxy Statement.
ITEM 12. SECURITY OWNERSHIP OF CERTAIN BENEFICIAL OWNERS AND MANAGEMENTAND RELATED STOCKHOLDER MATTERS
The information required by this item is incorporated by reference to the sections captioned‘‘Security Ownership of Certain Beneficial Owners and Management’’ contained in the Proxy Statement.
ITEM 13. CERTAIN RELATIONSHIPS AND RELATED TRANSACTIONS AND DIRECTORINDEPENDENCE
The information required by this item is incorporated by reference to the section captioned‘‘Related Party Transactions’’ contained in the Proxy Statement.
ITEM 14. PRINCIPAL ACCOUNTING FEES AND SERVICES
The information required by this item is incorporated by reference to the section captioned‘‘Proposal Two—Ratification of Appointment of Independent Registered Public Accounting Firm’’ containedin the Proxy Statement.
121

PART IV
ITEM 15. EXHIBITS AND FINANCIAL STATEMENT SCHEDULES
(a) The following documents are filed as part of this Report:
1. Consolidated Financial Statements. Refer to the financial statements filed as a part of thisReport under ‘‘Item 8—Financial Statements and Supplementary Data.’’
2. Financial Statement Schedules. The following financial schedule is filed as part of this Reportunder ‘‘Schedule II—Valuation and Qualifying Accounts for the Years Ended April 30, 2011, 2010and 2009.’’ All other schedules called for by Form 10-K have been omitted because they arenot applicable or are not required or the information required to be set forth therein isincluded in the consolidated financial statements or notes thereto.
3. Exhibits.
ExhibitNumber Description
3.1(1) Restated Certificate of Incorporation
3.2(1) Bylaws of the Registrant
3.2.1(14) Certificate of Amendment of the Bylaws of the Registrant effective as of November 27,2007
4.1(1) Specimen Common Stock Certificate
4.2(1) Amended and Restated Registration Rights Agreement, dated as of May 20, 1998, byand among the Registrant and certain stockholders of the Registrant
4.3(3) Preferred Stock Rights Agreement, dated August 21, 2001, between the Registrant andEquiserve Trust Company, N.A., including the Certificate of Designation, the form ofRights Certificate and Summary of Rights attached thereto as Exhibits A, B and C,respectively
4.4(6) Amendment to Preferred Stock Rights Agreement, dated August 21, 2001, between theRegistrant and EquiServe Trust Company, N.A., effective June 7, 2004
10.1(1) Form of Indemnification Agreement between the Registrant and each of its directorsand officers
10.2(1) 2000 Stock Plan and form of option agreement
10.3(1) 2000 Employee Stock Purchase Plan and form of subscription agreement
10.4(1) 2000 Director Stock Option Plan and form of option agreement
*10.6(1) Non-exclusive Distributor Agreement between the Registrant and World PeaceIndustrial Co., Ltd. dated January 1, 1998
10.7(2) Agreement on Construction of Complete Municipal Facilities, Shanghai SongjiangExport Processing Zone between OmniView Technology International Ltd. andShanghai Songjiang Export Processing Zone Administrative Committee datedDecember 28, 2000
10.8(2) Shanghai Songjiang Export Processing Zone Administrative Committee Official Replyto the Feasibility Study Report and Articles of Association of Foreign Solely-fundedOmni View Electronics (Shanghai) Co., Ltd. dated December 19, 2000
122

ExhibitNumber Description
10.9(2) Contract on the Transfer of Shanghai State-owned Land Use Right between OmniViewTechnology International Ltd. and Shanghai Songjiang District Building and LandAdministrative Bureau dated December 28, 2000
*10.10(b)(5) Letter of Comfort, dated October 29, 2003, by and between the Registrant and TaiwanSemiconductor Manufacturing Company Limited
10.11(7) Executive Officer Profit Sharing/Bonus Plan
10.12(9) Amended and Restated Shareholders’ Agreement dated August 12, 2005, by andbetween the Registrant, Taiwan Semiconductor Manufacturing Company Limited andcertain other parties
10.15(12) Land-Use-Right Purchase Agreement by and between the Registrant and theConstruction and Transportation Commission of the Pudong New District, Shanghai,dated December 31, 2006
10.16(12) First Amendment to the Amended and Restated Shareholders’ Agreement by andbetween the Registrant and Taiwan Semiconductor Manufacturing Company Limiteddated December 31, 2006
*10.17(13) Foundry Manufacturing Agreement by and between OmniVision InternationalHolding Ltd. and Powerchip Semiconductor Corporation, dated February 27, 2007
10.18(13) Loan and Security Agreement by and between the Registrant and Citibank, N.A., datedMarch 16, 2007
10.18.1(16) First Amendment to Loan and Security Agreement dated March 16, 2007, by andbetween the Registrant and Citibank, N.A., dated October 31, 2008
10.19(13) Deed of Trust, Assignment of Rents and Leases, Security Agreement and Fixture Filingmade as of March 20, 2007 by the Registrant, as trustor, to First American TitleInsurance Company, as trustee, for the benefit of Citibank, N.A., as beneficiary
10.20(13) Stock Pledge Agreement entered into as of March 16, 2007 by the Registrant, aspledgor, in favor of Citibank, N.A., as secured party
10.21(13) Promissory Note Secured by Deed of Trust (Term Loan) issued by the Registrant toCitibank, N.A., dated March 16, 2007
10.22(13) Promissory Note Secured by Deed of Trust (Mortgage Loan) by the Registrant toCitibank, N.A., dated March 16, 2007
10.23(13) Investment Agreement by and between the OmniVision Trading (Hong Kong)Company Limited and China WLCSP Limited, dated April 6, 2007
10.24(13) Equity Interests Transfer Agreement by and among OmniVision Trading (Hong Kong)Company Limited, China WLCSP Limited and Infinity-CSVC Venture CapitalEnterprise, dated April 6, 2007
10.25(13) Letter Agreement by and between the Registrant and Citibank, N.A., dated March 20,2007
10.26(18) 2007 Equity Incentive Plan (as amended on July 30, 2009)
10.27(14) Form of Non-Employee Director Stock Option Agreement
10.28(14) Form of Employee/Consultant Stock Option Agreement
123

ExhibitNumber Description
10.29(15) Form of Restricted Stock Unit Agreement (Global) under the 2007 Equity IncentivePlan
10.30(15) Form of Restricted Stock Unit Agreement (Net Issuance) under the 2007 EquityIncentive Plan
10.31(15) Form of Restricted Stock Unit Agreement (China) and Addenda for certain otherforeign jurisdictions under the 2007 Equity Incentive Plan
10.32(15) Form of Performance Shares Agreement under the 2007 Equity Incentive Plan
10.33(17) Fixed Assets Loan Agreement dated August 27, 2009, by and between OmniVisionTechnologies (Shanghai) Co., Ltd., a wholly owned subsidiary of the Registrant, andIndustrial and Commercial Bank of China Ltd.
10.34(17) Mortgage Agreement dated August 27, 2009, by and between OmniVision Technologies(Shanghai) Co., a wholly owned subsidiary of the Registrant, and Industrial andCommercial Bank of China Ltd.
10.35(18) 2009 Employee Stock Purchase Plan
10.36+ Patent Assignment Agreement dated March 30, 2011 between the Registrant andEastman Kodak Company
21.1 Subsidiaries of the Registrant
23.1 Consent of Independent Registered Public Accounting Firm
24.1 Power of Attorney (included on page 127)
31.1 Certification of Chief Executive Officer pursuant to Section 302 of Sarbanes-Oxley Actof 2002
31.2 Certification of Chief Financial Officer pursuant to Section 302 of Sarbanes-Oxley Actof 2002
32 Certification of Chief Executive Officer and Chief Financial Officer pursuant to 18U.S.C. Section 1350, as adopted pursuant to Section 906 of Sarbanes-Oxley Act of 2002
* Portions of this agreement have been omitted pursuant to a request for confidential treatment andthe omitted portions have been filed separately with the Securities and Exchange Commission.
+ Schedules, exhibits and similar attachments to this exhibit have been omitted pursuant toItem 6.01(b)(2) of Regulation S-K. The registrant will furnish supplementally a copy of anyomitted schedule, exhibit or similar attachment to the Securities and Exchange Commission uponits request.
(1) Incorporated by reference to exhibits filed with Registrant’s Registration Statement on Form S-1(File No. 333-31926) as declared effective by the Securities and Exchange Commission on July 13,2000.
(2) Incorporated by reference to exhibits filed with Registrant’s Quarterly Report on Form 10-Q forthe quarter ended January 31, 2001.
(3) Incorporated by reference to exhibits filed with Registrant’s Registration Statement on Form 8-A(Reg. No. 000-29939) as declared effective by the Securities and Exchange Commission onSeptember 12, 2001.
124

(4) Intentionally omitted.
(5) Incorporated by reference to exhibits filed with Registrant’s Quarterly Report on Form 10-Q forthe quarter ended October 31, 2003.
(6) Incorporated by reference to exhibits filed with Registrant’s Quarterly Report on Form 10-Q forthe quarter ended July 31, 2004.
(7) Incorporated by reference to exhibits filed with Registrant’s Current Report on Form 8-K filedwith the Securities and Exchange Commission March 31, 2005.
(8) Intentionally omitted.
(9) Incorporated by reference to an exhibit filed with Registrant’s Quarterly Report on Form 10-Q forthe quarter ended July 31, 2005.
(10) Intentionally omitted.
(11) Intentionally omitted.
(12) Incorporated by reference to exhibits filed with Registrant’s Quarterly Report on Form 10-Q forthe quarter ended January 31, 2007.
(13) Incorporated by reference to exhibits filed with Registrant’s Annual Report on Form 10-K for thefiscal year ended April 30, 2007.
(14) Incorporated by reference to exhibits filed with Registrant’s Current Report on Form 8-K filedwith the Securities and Exchange Commission on November 30, 2007.
(15) Incorporated by reference to exhibits filed with Registrant’s Annual Report on Form 10-K for thefiscal year ended April 30, 2008.
(16) Incorporated by reference to exhibits filed with Registrant’s Quarterly Report on Form 10-Q forthe quarter ended October 31, 2008.
(17) Incorporated by reference to exhibits filed with Registrant’s Quarterly Report on Form 10-Q forthe quarter ended July 31, 2009.
(18) Incorporated by reference to exhibits filed with Registrant’s Quarterly Report on Form 10-Q forthe quarter ended October 31, 2009.
125

SCHEDULE II
OMNIVISION TECHNOLOGIES, INC.
VALUATION AND QUALIFYING ACCOUNTS
For the Years Ended April 30, 2011, 2010 and 2009(In thousands)
Balance at Additions Write-offsBeginning of and Charges and Balance at
Description Year to Expenses Deductions End of Year
Allowance for doubtful accounts:Fiscal year ended April 30, 2011 . . . . . . . . . . . . . . $ 711 $ 1,123 $ — $1,834
Fiscal year ended April 30, 2010 . . . . . . . . . . . . . . $ 691 $ 20 $ — $ 711
Fiscal year ended April 30, 2009 . . . . . . . . . . . . . . $1,080 $ (267) $ 122 $ 691
Deferred tax valuation allowance:Fiscal year ended April 30, 2011 . . . . . . . . . . . . . . $5,264 $ 2,794 $ — $8,058
Fiscal year ended April 30, 2010 . . . . . . . . . . . . . . $4,495 $ 769 $ — $5,264
Fiscal year ended April 30, 2009 . . . . . . . . . . . . . . $4,191 $ 1,098 $ 794 $4,495
Allowance for sales returns:Fiscal year ended April 30, 2011 . . . . . . . . . . . . . . $ 936 $ 3,654 $2,285 $2,305
Fiscal year ended April 30, 2010 . . . . . . . . . . . . . . $3,436 $(1,498) $1,002 $ 936
Fiscal year ended April 30, 2009 . . . . . . . . . . . . . . $3,034 $ 3,218 $2,816 $3,436
126

SIGNATURES
Pursuant to the requirements of Section 13 or 15(d) of the Securities Exchange Act of 1934, asamended, the Registrant has duly caused this Report to be signed on its behalf by the undersigned,thereunto duly authorized.
OMNIVISION TECHNOLOGIES, INC.
By: /s/ SHAW HONG
Shaw HongPresident and Chief Executive Officer
Date: June 29, 2011
POWER OF ATTORNEY
KNOW ALL PERSONS BY THESE PRESENTS, that each person whose signature appearsbelow constitutes and appoints Shaw Hong and Anson Chan, and each of them, his true and lawfulattorneys-in-fact and agents, with full power of substitution and resubstitution, to sign any and allamendments (including post-effective amendments) to this Annual Report on Form 10-K and to filethe same, with all exhibits thereto and other documents in connection therewith, with the Securitiesand Exchange Commission, granting unto each of said attorneys-in-fact and agents, full power andauthority to do and perform each and every act and thing requisite and necessary to be done inconnection therewith, as fully to all intents and purposes as he or she might or could do in person,hereby ratifying and confirming all that each of said attorneys-in-facts and agents, or his substitute orsubstitutes, or any of them, shall do or cause to be done by virtue hereof.
Pursuant to the requirements of the Securities Exchange Act of 1934, as amended, this Report hasbeen signed below by the following persons on behalf of the Registrant and in the capacities and onthe dates indicated:
Signature Title Date
/s/ SHAW HONG Chief Executive Officer, President and June 29, 2011Director (Principal Executive Officer)Shaw Hong
/s/ ANSON CHAN Chief Financial Officer (Principal June 29, 2011Financial and Accounting Officer)Anson Chan
/s/ HENRY YANG Vice President of Engineering and June 29, 2011DirectorHenry Yang
/s/ WILLIAM HSUDirector June 29, 2011
William Hsu
/s/ JOSEPH JENGDirector June 29, 2011
Joseph Jeng
/s/ DWIGHT STEFFENSENDirector June 29, 2011
Dwight Steffensen
127

Board of Directors
SHAW HONG
Chief Executive Officer, President and Director
HENRY YANG
Vice President of Engineering and Director
WEN-LIANG WILLIAM HSU
Director
JOSEPH JENG
Director
DWIGHT STEFFENSEN
Director
Executive Officers
SHAW HONG
Chief Executive Officer and President
ANSON CHAN
Vice President of Finance and Chief Financial Officer
Y. VICKY CHOU
Vice President of Global Management and General Counsel
HENRY YANG
Vice President of Engineering
RAY CISNEROS
Vice President of Worldwide Sales
HASAN GADJALI
Vice President of Worldwide Marketing and Business Development
JOHN LI
Vice President of System Technologies

Corporate Headquarters Annual Meeting
OmniVision Technologies, Inc. Thursday, September 29, 20114275 Burton Drive 10:00 a.m. PDTSanta Clara, California 95054 Principal executive officesPhone: (408) 567-3000Fax: (408) 567-3001Investor Relations: [email protected] site: www.ovt.com
Annual Report on Form 10-K
The Company’s Annual Report on Form 10-K filed with the Securities and Exchange Commission(excluding exhibits) is available at no charge upon written request to OmniVision’s Investor Relationsdepartment.
Stock Listing
The common stock of OmniVision Technologies, Inc. has traded on the NASDAQ Global Marketunder the symbol ‘‘OVTI’’ since its initial public offering on July 14, 2000. The following table setsforth the high and low sale prices for the common stock in the periods indicated, as reported by theNASDAQ Global Market.
High Low
Fiscal year ending April 30, 2012First quarter . . . . . . . . . . . . . . . . . . . . . . . . . . . . . . . . . . . . . . $36.42 $28.75Second quarter (through August 12, 2011) . . . . . . . . . . . . . . . . . 30.85 22.44
Fiscal year ended April 30, 2011First quarter . . . . . . . . . . . . . . . . . . . . . . . . . . . . . . . . . . . . . . $25.50 $16.19Second quarter . . . . . . . . . . . . . . . . . . . . . . . . . . . . . . . . . . . . . 27.13 19.41Third quarter . . . . . . . . . . . . . . . . . . . . . . . . . . . . . . . . . . . . . . 32.63 25.83Fourth quarter . . . . . . . . . . . . . . . . . . . . . . . . . . . . . . . . . . . . . 36.19 22.87
Fiscal year ended April 30, 2010First quarter . . . . . . . . . . . . . . . . . . . . . . . . . . . . . . . . . . . . . . $13.46 $ 8.20Second quarter . . . . . . . . . . . . . . . . . . . . . . . . . . . . . . . . . . . . . 17.48 11.81Third quarter . . . . . . . . . . . . . . . . . . . . . . . . . . . . . . . . . . . . . . 15.88 11.70Fourth quarter . . . . . . . . . . . . . . . . . . . . . . . . . . . . . . . . . . . . . 19.42 12.12
Independent Registered Public Accounting Firm Corporate Counsel
PricewaterhouseCoopers LLP Wilson Sonsini Goodrich & Rosati, P.C.San Jose, California Palo Alto, California
Stock Transfer AgentComputer Share Trust Company, N.A.250 Royall StreetCanton, Massachusetts 02021Phone: (800) 736-3001www.computershare.com
