to: vancouver senate re: student evaluation of teaching
TRANSCRIPT
Office of the Senate
Brock Hall | 2016 - 1874 East Mall
Vancouver, BC V6T 1Z1
Phone 604 822 5239
Fax 604 822 5945
www.senate.ubc.ca
27 May 2020
To: Vancouver Senate
From: Senate Teaching and Learning Committee
Re: Student Evaluation of Teaching (SEoT) Working Group – Final report
A Student Evaluation of Teaching Working Group was formed at UBC in Spring 2019, with
membership from both UBCV and UBCO. It is co-chaired by faculty members from Vancouver
and Okanagan, and the work undertaken has been deeply collaborative across both campuses.
In January 2020, the Committee provided to Senate the Working Group’s interim report. The
report included the Working Group’s guiding principles relating to student evaluations and
emerging recommendations. The recommendations presented at that time have since been further
developed and refined. Through a six-month consultation period, stakeholder groups have had
the opportunity to broadly discuss, ask questions and provide feedback about the group’s work
and recommendations.
The Senate Teaching and Learning Committee has reviewed the Student Evaluations of Teaching
Working Group final report and is pleased to endorse the recommendations presented.
The Committee recommends to Senate:
Motion: That Senate endorse the recommendations of the Student Evaluations of
Teaching Working Group as recommended by the Senate Teaching & Learning
Committee (Vancouver) and the Senate Learning & Research Committee (Okanagan)
and direct the committees to prepare appropriate follow-up on implementation plans
and revisions to Senate policy for consideration by the Senates.
Respectfully submitted,
Dr. André Ivanov, Chair
Senate Teaching and Learning Committee
Office of the Senate
Brock Hall | 2016 - 1874 East Mall
Vancouver, BC V6T 1Z1
Phone 604 822 5239
Fax 604 822 5945
www.senate.ubc.ca

Student Evaluation of Teaching Working Group Report 2020
1
Student Evaluation of Teaching Working Group
Report to Vancouver and Okanagan Senates
May 2020
Student Evaluation of Teaching Working Group Report 2020
2
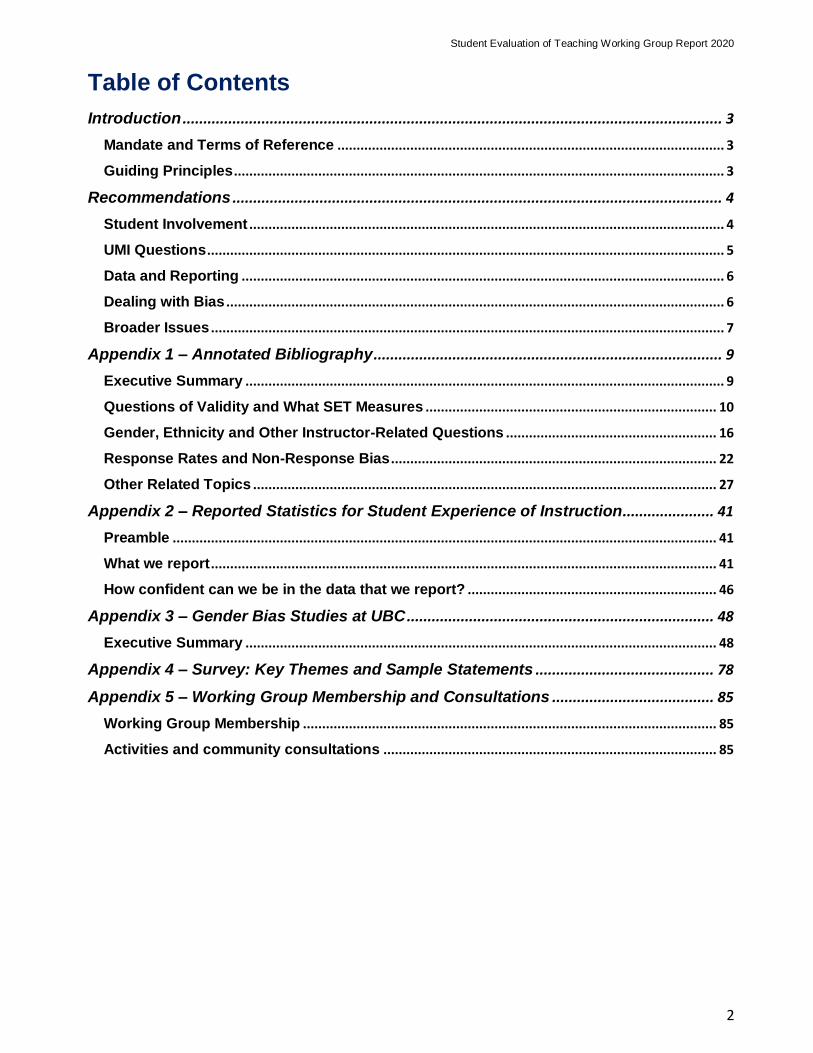
Table of Contents
Introduction .................................................................................................................................. 3
Mandate and Terms of Reference ..................................................................................................... 3
Guiding Principles ................................................................................................................................ 3
Recommendations ...................................................................................................................... 4
Student Involvement ............................................................................................................................ 4
UMI Questions ....................................................................................................................................... 5
Data and Reporting .............................................................................................................................. 6
Dealing with Bias .................................................................................................................................. 6
Broader Issues ...................................................................................................................................... 7
Appendix 1 – Annotated Bibliography .................................................................................... 9
Executive Summary ............................................................................................................................. 9
Questions of Validity and What SET Measures ............................................................................ 10
Gender, Ethnicity and Other Instructor-Related Questions ....................................................... 16
Response Rates and Non-Response Bias ..................................................................................... 22
Other Related Topics ......................................................................................................................... 27
Appendix 2 – Reported Statistics for Student Experience of Instruction...................... 41
Preamble .............................................................................................................................................. 41
What we report .................................................................................................................................... 41
How confident can we be in the data that we report? ................................................................. 46
Appendix 3 – Gender Bias Studies at UBC .......................................................................... 48
Executive Summary ........................................................................................................................... 48
Appendix 4 – Survey: Key Themes and Sample Statements ........................................... 78
Appendix 5 – Working Group Membership and Consultations ....................................... 85
Working Group Membership ............................................................................................................ 85
Activities and community consultations ....................................................................................... 85

Student Evaluation of Teaching Working Group Report 2020
3
Introduction A Senate Policy on Student Evaluation of Teaching (SEoT) has been in place for UBC-Vancouver (UBC-V) since May 2007. In parallel, SEoT processes were implemented at UBC-Okanagan (UBC-O) in 2005 and procedures at UBC-O largely mirror those of UBC-V, with different core university-wide questions. Across North America, SEoT are the most common form (and sometimes the only form) of data used to assess the quality of teaching in higher education. A large body of literature surrounds such evaluations, which has grown significantly in the last 20 years, investigating their use, as well as their reliability and validity as evaluation instruments. There are serious concerns around the potential impact of various biases, particularly gender and ethnicity, as well as instrument design, reporting metrics, interpretation of data, consideration of context, and lack of integration with other forms of data on the effectiveness of teaching.
Mandate and Terms of Reference The Vancouver Senate Teaching and Learning Committee requested a Working Group of primarily faculty and students to undertake a re-examination of our approach to student evaluations. Subsequent discussions on the Okanagan campus broadened this to a UBC-wide working group, which was formed in February 2019. This cross-campus working group was tasked with surveying recent SEoT literature and UBC data, reviewing the University-wide SEoT questions, consulting broadly on both campuses and working with ‘resource experts’ to deliver a common report by the end of the 2019-20 academic year. Specifically, the mandate as set out in the Working Group’s terms of reference were to:
1. Interrogate anonymized UBC data, to determine if there is evidence of potential biases.
2. Review and assess the recent literature on the effectiveness of SEoT, with particular reference to potential sources of bias in evaluations.
3. Review the University questions (UMI) used in SEoT in light of the data and available literature, recommending changes where appropriate.
4. Propose recommendations for appropriate metrics, effective analysis and presentation of data to support SEoT as a component of teaching evaluation.
5. Consider the implications any proposed changes may have on other components of teaching evaluation.
A formal re-evaluation of the UBC-V Senate Policy on Student Evaluations of Teaching1, which covers matters of implementation of the SEoT process, how result data is accessed, disseminated and used, and stakeholder responsibilities, was out of scope.
Guiding Principles The Working Group began with some a priori assumptions about student participation in the
evaluation of teaching. Those assumptions have been affirmed through meetings with a wide range of stakeholders, open forums and examination of various policy statements, and research literature, such that they can now be offered as guiding principles. Some are restatements of those in the
current Senate policy; others address additional elements. 1. Evaluation of teaching should include students’ voices.
Students have a right to provide feedback on their experience of instruction. As well, student
1 https://senate.ubc.ca/vancouver/policies/student-evaluation-teaching
Student Evaluation of Teaching Working Group Report 2020
4
feedback on instruction can be a valuable source of data that enables faculty members and departments to reflect on their teaching and the broader curriculum, promoting development and enhancement of practice and courses.
2. Student feedback is important data in the process of evaluating teaching, but must be considered along with other forms of data.
(see: recommendation 10)
3. Context is critical when evaluating teaching and should be documented.
Context matters – be it the level of a course, small or large group of students, elective or required course, time of day, or the first time taught by an instructor. Data related to the evaluation of teaching (from students, peers, and other sources) must be examined and interpreted within the specific context in which the teaching and learning takes place.
4. Student feedback on teaching, as with self and peer review of teaching, is never completely free of bias. (see: recommendations 13 & 14)
Recommendations The sixteen recommendations outlined below are a result of more than a year’s work by the Working Group and extensive consultations with the UBC community (see Appendix 5 for details). While some of the recommendations were established early on in the Working Group ’s deliberations, the majority emerged after extensive discussions and consultations. A set of initial recommendations was drafted in November 2019 and refined through further Working Group discussion and consultation. Consultations included student groups, open forums of faculty, and interim presentations to Senates on both campuses.
Student Involvement 1. Evaluation of teaching should include student feedback.
Students have a unique and valuable perspective from which to provide feedback on teaching at UBC. Student feedback on teaching is one of several sources of data that should be used for making personnel decisions and for the improvement of teaching.
2. The name of the process by which student feedback is gathered should be changed from
‘Student Evaluation of Teaching’ to ‘Student Experience of Instruction’.
Evaluation of teaching is a complex process, whether for formative or summative purposes. To do it effectively requires input from multiple perspectives and sources (students, peers, self) integrated across time. As noted in (1) above, students have an important perspective that should be part of that. However, students should be asked to focus on their experience, rather than to ‘evaluate’ teaching writ large.
3. Questions asked of students should focus on elements of instruction based on their experience with instructor(s) in specific contexts and relationships.
In line with a recent statement from the American Sociological Association (Article, Sept 2019) questions for students should focus on their experiences and be framed as an opportunity for students to provide feedback, rather than positioning the request as a formal and global evaluation of the teacher.
4. Student leadership on both campuses should be actively engaged in raising the profile of student feedback on instruction.
Gathering and considering feedback on teaching and learning from students is a responsibility shared between faculty and students. Student leadership should play an active and visible role in raising awareness of the purposes for, and ways in which, this feedback can improve

Student Evaluation of Teaching Working Group Report 2020
5
instruction. Student leadership should also be part of efforts to raise awareness of comments that are not appropriate and/or counter-productive in the context of an anonymous survey.
UMI Questions 5. UMI-6 (Overall the instructor was an effective teacher) should be retained in the core
question set, but modified.
The Working Group had extensive discussions about the inclusion or deletion of this item. Analysis of UBC data indicates that UMI-6 scores are able to be predicted to a high degree of confidence based on a weighted linear combination of other UMI questions (except UMI-4). However, in its current form, UMI-6 asks students to directly evaluate the ‘overall effectiveness of the teacher’. As we have argued above, students are not in a position to be able to make sweeping, all-inclusive judgments about the effectiveness of instruction. On balance, the Working Group recommends retaining UMI-6, but rewording it as ‘Overall, this instructor was effective in helping me learn’. This centres the question on the individual experience of the
student.
6. Minor changes in wording of other UMI questions are suggested to better reflect the focus on each student’s experience of instruction. The instructor made it clear what students were expected to learn, to be changed to The instructor made it clear what I was expected to learn The instructor helped inspire interest in learning the subject matter, to be changed to The instructor engaged me in the subject matter
The instructor communicated the subject matter effectively to be changed to I think that the instructor communicated the subject matter effectively.
The instructor showed concern for student learning to be changed to I think that the instructor showed concern for student learning
The latter two questions are phrased so as to balance first person perceptions with overall cohort experience and classroom climate.
7. UMI-4 (Overall, evaluation of student learning was fair) should be removed from the common set
UMI-4 is something of an outlier in the current UMI set used in Vancouver campus surveys. It is consistently answered by fewer students. It is also problematic because the concept of ‘fairness’ is highly ambiguous. Student consultations have indicated they are often unsure how to interpret what ‘fairness’ means.
8. A new UMI item, pertaining to the usefulness of feedback, should be trialled. Whilst the working group recommends removal of the previous UMI-4 item, on fairness of assessment (see recommendation 4), there was a strong sense that, given the importance of timely and effective feedback in the learning process, this should be reflected in the core UMI questions. We recommend a question worded as follows: “I have received feedback that supported my learning”. However, this question should be piloted in a limited set of courses in 2020/21 to
ensure that we understand how responses might be influenced by variables such as class size, etc. It is certainly the case that the opportunity to provide feedback, and indeed the nature of that feedback (e.g., written and / or numerical), will look very different in a seminar class of 20 compared to a large introductory lecture of 200. We should collect data from a pilot to better understand how this question is understood and responded to before including it in the core UMI
Student Evaluation of Teaching Working Group Report 2020
6
set. The results of the pilot could be included in the 2020/21 Report to Senates and a decision taken on how to proceed.
9. There should be a common set of UMI questions asked across both campuses
There should be a commonly-used core set of five or six questions across both campuses. Modular approaches to constructing feedback surveys may be appropriate (university-wide items plus Faculty, Department and course-specific items). However, units should be mindful that most students complete several surveys per semester, potentially causing ‘feedback fatigue’ and reducing rates of participation. Therefore, units should be mindful of the overall length of feedback surveys students are being asked to complete. Units should also explore other ways to gather specific feedback as the course progresses.
Data and Reporting
10. Units should be supported to adopt a scholarly and integrative approach to evaluation of teaching.
Because teaching is complex and contextually dependent, departments and units should be supported to adopt an integrative and scholarly approach to evaluation that synthesizes multiple data sources (e.g., students, peers, historical patterns, and self-reflection documentation) for a holistic picture, without over-reliance on any single data source. This approach will necessarily look different in different units but should include both in-kind support from units such as CTLT/CTL and funding for department leaders to accomplish the work proposed. When used for personnel decisions, the unit’s approach, strategy, and norms can then be communicated to all levels of review, along with the file. The VPAs on both campuses should work with the Senior Appointments Committee (SAC) to identify and disseminate anonymous examples of effective ways to integrate, synthesize and reconcile multiple perspectives on teaching effectiveness.
11. Reporting of quantitative data should include an appropriate measure of centrality,
distributions, response rates and sample sizes, explained in a way that is accessible to all stakeholders, regardless of quantitative expertise.
The interpolated median should be used as the measure of centrality, with the dispersion index as a measure of spread. Reports should include distributions of responses, response rates and sample sizes, clearly flagging where response rates do not meet minimum requirements for validity and accuracy. Visualizations of comparative (anonymous) data should be developed, along with an on-going program of consultation and dissemination to different groups (faculty, staff and administrators).
12. UBC should prioritize work to extract information from text/open comments submitted as
part of the feedback process.
Many faculty members report the free-text student comments as sources of rich data to support reflection and enhancement of their course and teaching. It is recommended that a pilot investigation be undertaken, with one or more Faculties, to investigate the potential of automated approaches to extract useful information from large volumes of text submissions. The pilot should engage with appropriate research expertise in Faculties in these areas, and aim initially for formative purposes. There is an opportunity for UBC to take a lead among institutions in providing balance and insight when combining quantitative and qualitative data. Failing to do this continues to privilege quantitative over qualitative data about teaching.
Dealing with Bias 13. UBC needs additional and regularized analysis of our own data to answer questions
related to potential bias, starting with instructor ethnicity, as it is frequently highlighted as a potential source of bias in the literature on student evaluation of teaching.
An analysis of UBC-V data with respect to instructor and student gender over the last decade reveals no systematic differences in aggregate data of ratings received by female vs. male
Student Evaluation of Teaching Working Group Report 2020
7
instructors. Variables tested for (including instructor and student gender) indicate aggregate differences at the level of approximately +/- 0.1 on a 5-point scale, in other words, very small effects. Course-specific effects (e.g., subject discipline, course level) demonstrate larger effects (typically +/- 0.3 on the same scale). An analysis of UBC-O data across 2015-16 and 2018 academic year revealed mixed results, as are detailed in Appendix 3. For both campuses, it is important to note that this is an analysis of aggregate data and, as such, will mask variation on an individual level. The lived experience of individual instructors may be quite different from this aggregate view. However, holistic evaluations of a person’s teaching (see: Recommendation 15) can be used to contextualize individual instructors’ experience. We cannot stress enough the importance of a holistic evaluation that allows individual lived experiences to be heard, particularly if their lived experience runs counter to the aggregate data. Given that studies have presented evidence of bias on the basis of instructor ethnicity, it would seem both appropriate and timely that the same analysis be brought to bear in checking the UBC data for bias. This work comes with privacy and ethical implications. We recommend developing a process that would allow instructor ethnicity data to be accessed confidentially for regular investigation of bias. We have not been able to address this analysis during the timescale of this working group and thus recommend a follow-on activity to investigate this, reporting back to Senates during the 2020-2021 academic year. The follow-on report would also be in a position to recommend regularized analysis and mitigation strategies to address any systematic biases found, particularly related to gender and/or ethnicity.
14. The work of collecting, integrating, interpreting and using feedback on teaching should mitigate against bias, but should not presume the complete removal of bias.
As with most other forms of surveys, student feedback on instruction cannot be completely free from bias. Bias can be explicitly discriminatory and perpetuating of stereotypes. But bias can also be implicit, where respondents are not consciously aware of how their attitudes influence their responses. Implicit biases have been shown to occur in many domains and the general approach at UBC (e.g., on hiring committees) has been one of mitigation through education and awareness raising. This recommendation is supported by an analysis of the voluminous literature on the topic of student evaluations of teaching, and interrogation of the UBC dataset at multiple points in the last 10 years. The research literature reports studies on a wide variety of instruments and processes, with considerable variation in the scope of data collected. Individual studies are often reported in the mainstream academic press, sometimes with extrapolation beyond the context and the effects found in the initial study. Studies investigating a variety of instructor effects (e.g. age, gender, ethnicity) vary in whether they show bias, no bias or bias toward (rather than against) female instructors. In the subset of published studies where biases are found, and enough detail is provided to be able to discern the effect size, those effect sizes on aggregate are small.
Broader Issues 15. The Vancouver Senate should review the policy on Student Evaluations of Teaching and
consider a broader policy on the evaluation of teaching writ large. The Okanagan Senate should develop a similar policy for the Okanagan campus.
Student feedback, both quantitative and qualitative, should be integrated with other forms of data to estimate the effectiveness of a faculty member’s teaching. The current policy (2007) says little about how student feedback should be integrated with other forms of data before making judgments about the effectiveness of teaching. Therefore, it is appropriate to revisit the UBC-V Senate Policy on Student Evaluation of Teaching and consider adding or replacing it with a policy that sets forth a broader and more scholarly approach to the evaluation of

Student Evaluation of Teaching Working Group Report 2020
8
teaching. Similar processes should be applied and governed by either a joint Senate policy, or aligned policies for each campus.
16. Senate should commit to support the ongoing work of implementing policies related to
the evaluation of teaching. Career advancement decisions are made on the recommendation of Departmental, Faculty and a system-wide Senior Appointments Committee, each of whom is tasked to evaluate teaching effectiveness as a component of every case. It is imperative that UBC commit to providing the necessary resources and training, including administrative and technological support, to implement Senate policies on evaluating teaching (see Recommendation 15). Faculty members must be given the tools, resources, and support to effectively present a scholarly case for their teaching effectiveness. Likewise, evaluators at all levels must be adept at appropriately interpreting and contextualizing the kinds of data offered across diverse disciplinary and teaching contexts, with due consideration to multiple sources of data and the limitations of each.
Student Evaluation of Teaching Working Group Report 2020
9
Appendix 1 – Annotated Bibliography
Executive Summary The goal of this annotated bibliography is to review up-to-date research on bias in student evaluations of teaching (SET):
types of bias (gender, class size, etc.)
prevalence of bias
practices that mitigate bias
Two literature reviews on bias in student evaluations have been completed at UBC. The first review, Review of Variables that Influence Students Evaluation of Teaching (pdf), was completed in early 2013, examining 55 published studies on the factors that were hypothesized to influence student evaluation of teaching. The most consistent findings were small effects of student grades, average course grades (which could also be interpreted as a measure of students’ effective learning experiences), and field of study on student evaluation ratings. The effect sizes (where they exist or can be calculated) were small, and a large proportion of the variability in teaching evaluations remained unpredicted by the factors investigated. Presented in this report is a second review of literature, limited to studies published in peer-reviewed journals from 2013 to 2019, meeting keywords (“teaching evaluation” or “evaluation of teaching”) AND (“biased” or “biases”), across the entire EBSCO set of databases. It was completed by a UBC PhD student in Measurement, Evaluation and Research Methodology, and takes the form of an annotated bibliography. The bibliography is categorized as follows:
Questions of Validity and What SET Measures;
Gender, Ethnicity and Other Related Questions;
Response Rates and Non-Response Bias;
Other Related Topics
Key Results
1. A 5-point Likert scale (strongly disagree, disagree, neutral, agree, strongly agree) is enough to capture variations in ratings; only minimal information is gained by stretching the scale to 7 or 9 points.
2. Effects of class size and instructor gender on response rates are negligible in aggregate. 3. Online evaluations, for which class time was provided but were also accessible outside of
class, resulted in higher response rates than courses that did not provide in-class time. 4. The use of language that encourages students to be aware of potential instructor-gender
biases when filling out SETs for instructors may reduce gender bias; however, it is difficult to decipher if the effects of the added language counteracted implicit bias or made students overcompensate because they were worried about implicit bias.
5. Relationships between student and instructor characteristics (for example, the gender of the students and the gender of their instructor) are inconsistent and at times contradictory. Some studies find no evidence of bias, and those that report statistically significant bias show small effect sizes.
6. Few studies include instructor ethnicity; those that do, show inconsistent results.
Student Evaluation of Teaching Working Group Report 2020
10
Questions of Validity and What SET Measures
Spooren, P., Brockx, B., & Mortelmans, D. (2013). On the validity of student evaluation of teaching: The state of the art. Review of Educational Research, 83(4), 598–642. https://doi-org.ezproxy.library.ubc.ca/10.3102/0034654313496870
This paper attempts to provide a systematic overview of the recent literature on SET since 2000, using what it calls ‘the meta-validity model’ for assessing the score validity of SET designed by Onwuegbuzie et al. (2009). This seems to be just a way of assessing validity of SETs on multiple levels.
Sample: After their systematic search, they found 160 pieces to be reviewed.
Content-Related validity - Perspectives of the different stakeholders (administrators, teachers, students) differ on what effective teaching entails. This threatens to undermine the idea that the SET instruments provide adequate and complete representations of particular content areas. Establishing a common conceptual framework for effective teaching would help test builders test their validity.
Construct related Validity
Structural Validity - Finds that many SET instruments have never been tested continue to be used for administrative decision-making. Recommends testing the validity whenever used in a newer context. Also recommends that as institutional teaching changes, tests should be validated again.
Convergent validity - No consensus regarding the correlation between SET and student achievement. Has much to do with the measure of learning used in the literature. Mentions that the more objective the learning is measured, the lower the association will be. Suggests though that there needs to be greater agreement in this area as to what constitutes student achievement.
Discriminant and Divergent Validity - Findings about relationships between SET, and the characteristics of students, courses, and teachers to not give any conclusive idea of factors that could potentially bias the scores. There are varying results due to varying methods and it makes generalizability of the results difficult.
Outcome Validity - Both students and teachers don’t think that the SET scores will lead to better teaching. Teachers agree with the use of SET for personnel decisions and to demonstrate the quality of education, even though they make little use of them to improve teaching. Recommends that teachers count on peers, colleagues, and administrators when interpreting their results. Also notes that SET administrators should be trained in both statistics and educational theory, in addition to being informed about the SET literature. Notes that an administrator skilled in this way can remove many concerns teachers have regarding the SET. Paper also advocates for a more holistic method of evaluating teachers.
Generalizability - Makes note that generalizability of studies are limited because in each case the instrument was designed for the particular institution, rather than instruments validated across institutions. Also, there are different implementation practices per institution which affects the ways in which students receive and answer the questionnaires.
Criterion Related Validity
Positive correlation between SET scores and other indicators of teaching quality such as student learning outcomes, alumni ratings, and self-ratings. Little is known, however, about whether the well-validated SET instruments yield similar results when adopted in identical SET settings.
Student Evaluation of Teaching Working Group Report 2020
11
The article advocates for a more uniform and consistent understanding of what constitutes effective
teaching, suggesting that will increase the validity of SETs. [Note: While that may increase validity
of SETs, it could also have an undesired effect of promoting a single universal conception of
effective teaching. There is ample evidence to argue against such a ‘one-size-fits-all’ conception of
effective teaching.]
Please note that the STANDARDS from AERA upholds a unitary view of validity, no longer seeing
validity as properties of tests, but properties of claims. Establishing the “validity of the SET”
somewhere and expecting SET to be “valid” in all other scenarios, which is what the authors did, is
no longer considered a good practice by the STANDARDS. Validation needs to happen every time
the SET is introduced to a new situation.
Dodeen, H. (2013). Validity, reliability, and potential bias of short forms of students’ evaluation of teaching: The case of UAE University. Educational Assessment, 18(4), 235–250. https://doi-org.ezproxy.library.ubc.ca/10.1080/10627197.2013.846670
Description:
The study evaluated the validity and reliability of a 5-item short form (reduced from their standard 27-item form) used at the University of United Arab Emirates with a representative sample of 3,661 undergraduates from 8 colleges (out of a 15,000-student base).
More details below (direct quote):
The five items that evaluate instructors are (a) the instructor made the content easy to understand, (b) the instructor actively involved students in learning, (c) the instructor’s methods of evaluating students were based on course objectives, (d) the instructor made effective use of class time, and (e) the instructor’s presentations were clear and understandable. The five items were stated in the positive direction using a 5-point Likert scale that ranges from 1 (strongly disagree) to 5 (strongly agree). The overall question is “Overall, how would you grade your instructor for this course?” This question used a scale of 5 points with the following values: 0=F, 1=D, 2=C, 3=B, and 4=A. The purpose of this study was to psychometrically assess the UAEU SET form as a model of short SET forms. This included assessing validity, reliability, the overall question, and potential biasing.
Results are summarized as follows:
Validity indices considered include:
Content validity: whether students’ perception of the 5-item form content matches that of their perception of the content of their standard 27-item form. The author concluded “no content validity” because “obviously, there are many items in the original instrument that are not covered in the short SET form.”
Structure validity: The author showed a discrepancy between the factor structures of the short form (which showed only one dimension) and the original form (which had 5 dimensions), thus concluding that there was no structure validity.
Criterion validity: The author recruited a random 288 subsample of students to complete a 37-item version of student evaluation of teaching (used by the University of United Arab Emirates before the year 2006) of the same instructor and reported a .64 Pearson correlation between the two
Student Evaluation of Teaching Working Group Report 2020
12
measures. The author claimed that since the two scales are supposed to measure the same construct, .64 was not high enough to establish criterion validity.
Reliability indices included:
Stability over time: A random subsample of 193 students did the same short form a second time within two weeks from the first time, and the correlation was .68 between those two times. The author was expecting a higher correlation than .68.
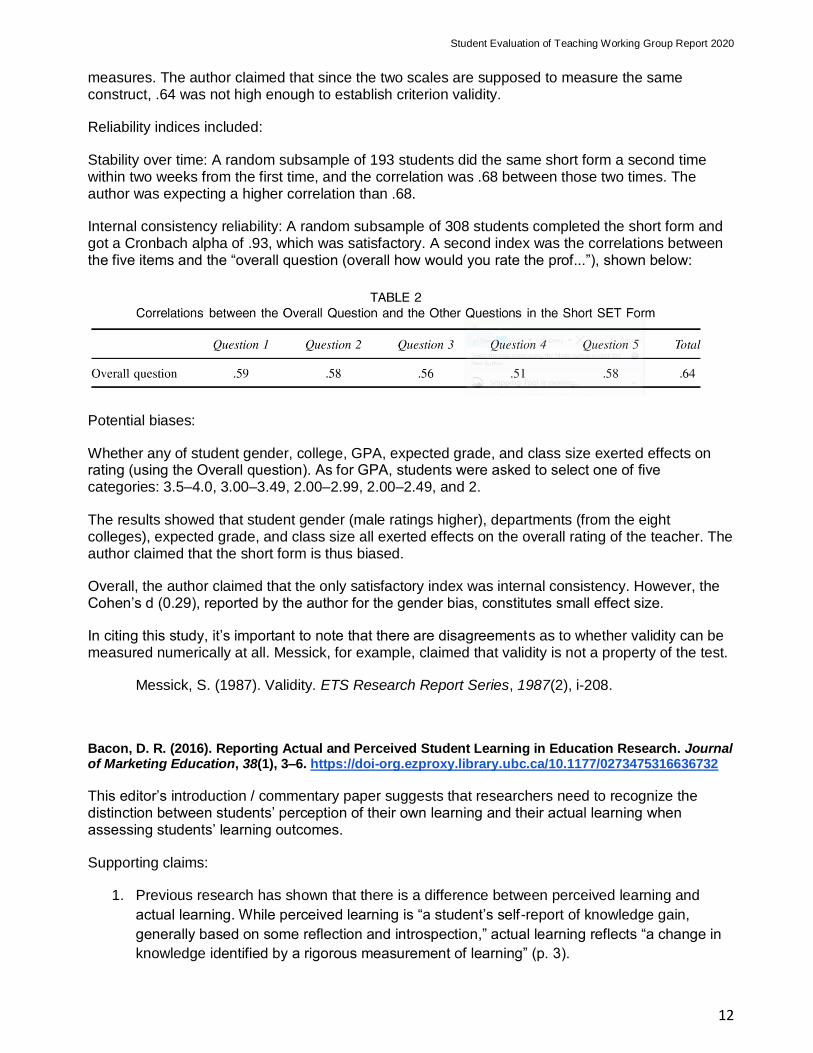
Internal consistency reliability: A random subsample of 308 students completed the short form and got a Cronbach alpha of .93, which was satisfactory. A second index was the correlations between the five items and the “overall question (overall how would you rate the prof...”), shown below:
Potential biases:
Whether any of student gender, college, GPA, expected grade, and class size exerted effects on rating (using the Overall question). As for GPA, students were asked to select one of five categories: 3.5–4.0, 3.00–3.49, 2.00–2.99, 2.00–2.49, and 2.
The results showed that student gender (male ratings higher), departments (from the eight colleges), expected grade, and class size all exerted effects on the overall rating of the teacher. The author claimed that the short form is thus biased.
Overall, the author claimed that the only satisfactory index was internal consistency. However, the Cohen’s d (0.29), reported by the author for the gender bias, constitutes small effect size.
In citing this study, it’s important to note that there are disagreements as to whether validity can be measured numerically at all. Messick, for example, claimed that validity is not a property of the test.
Messick, S. (1987). Validity. ETS Research Report Series, 1987(2), i-208.
Bacon, D. R. (2016). Reporting Actual and Perceived Student Learning in Education Research. Journal of Marketing Education, 38(1), 3–6. https://doi-org.ezproxy.library.ubc.ca/10.1177/0273475316636732
This editor’s introduction / commentary paper suggests that researchers need to recognize the distinction between students’ perception of their own learning and their actual learning when assessing students’ learning outcomes.
Supporting claims:
1. Previous research has shown that there is a difference between perceived learning and
actual learning. While perceived learning is “a student’s self-report of knowledge gain,
generally based on some reflection and introspection,” actual learning reflects “a change in
knowledge identified by a rigorous measurement of learning” (p. 3).
Student Evaluation of Teaching Working Group Report 2020
13
2. Methodologically, “direct measures” can be used to assess actual learning while “indirect
measures” can be used to assess perceived learning. (This part is based on the author’s
previous research.)
○ Direct measures are based on “scoring a student’s task performance or
demonstration as it relates to the achievement of a specific learning goal,” rather
than based on students’ introspection or self-reports. Indirect measures are based on
students' self-reports.
3. Failing to distinguish between perceived learning and actual learning “causes confusion in
literature reviews and in our understanding of research results” (p. 4). Furthermore, readers
may not know whether an intervention only changes students’ perceived learning or whether
it in fact improves students’ actual learning.
The paper thus asks all contributors to the journal to “examine their own measures and carefully label them clearly as measures of actual learning or measures of perceived learning,” to “carefully distinguish in their literature reviews between findings related to actual learning and findings related to perceived learning,” and to “discourage their schools from labeling student evaluations of teaching as measures of teaching effectiveness, and instead ask that they be referred to simply as SET.”
Nguyen, T., & Foster, K. A. (2018). Research Note—Multiple Time Point Course Evaluation and Student Learning Outcomes in an MSW Course. Journal of Social Work Education, 54(4), 715–723. https://doi-org.ezproxy.library.ubc.ca/10.1080/10437797.2018.1474151
The paper redefined course evaluation as student self-assessments of learning, rather than just satisfaction with the course (i.e. rating the teacher). It examined the possibility of response shift bias, a bias where students underrate their competencies in the pre-test and overrate their competencies in the post-test because their “perceptions of measured constructs regarding their competencies” do not remain the same during a course. This bias usually happens in the two time point measurement (pre-test and post-test).
The final sample was 48 students from the Master of Social Work at the University of South Carolina. The measurement was self-evaluations on the 19 core competencies in social work. Importantly, for each core competency, the student was tested two time, on three indices:
Pre-test: filled out before the course/practicum, how good do you think you are at x
Post-test: filled out after the course/practicum, how good do you think you are at x
Retrospective: filled out AFTER the course/practicum, how good do you think you were at x before the course/practicum [Now that students have learned the content, do they understand the questions differently?]
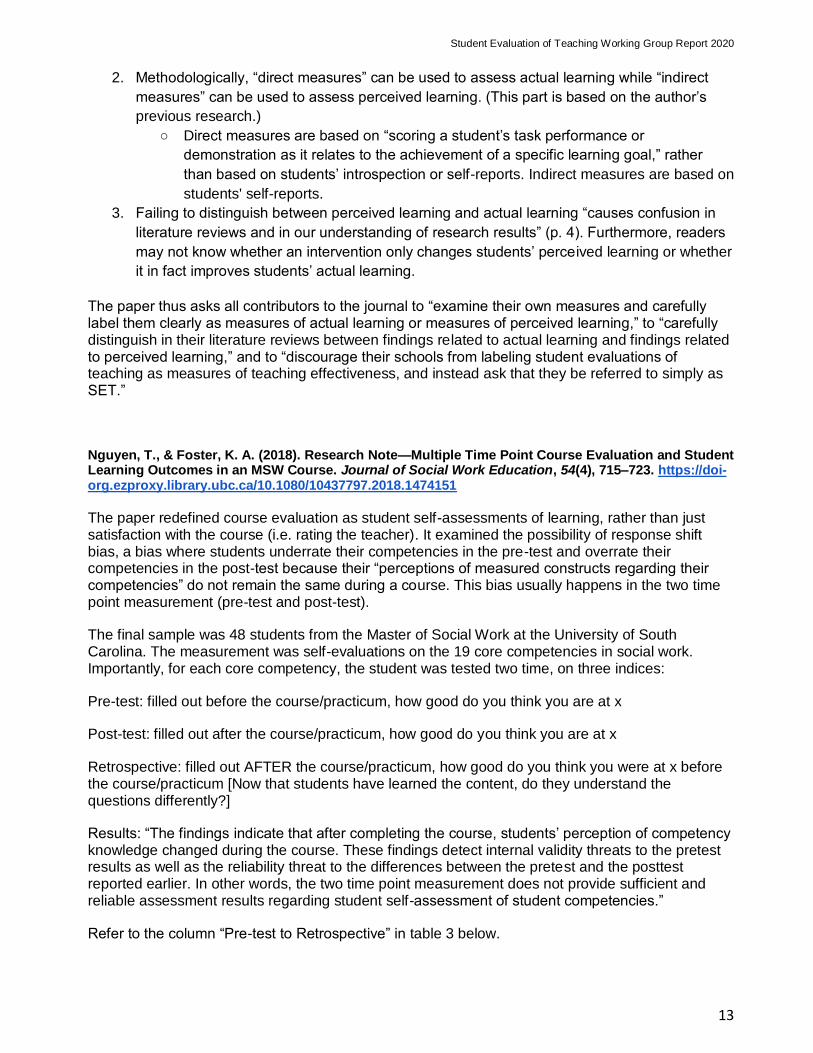
Results: “The findings indicate that after completing the course, students’ perception of competency knowledge changed during the course. These findings detect internal validity threats to the pretest results as well as the reliability threat to the differences between the pretest and the posttest reported earlier. In other words, the two time point measurement does not provide sufficient and reliable assessment results regarding student self-assessment of student competencies.”
Refer to the column “Pre-test to Retrospective” in table 3 below.
Student Evaluation of Teaching Working Group Report 2020
14
The authors acknowledge that the small sample size and limited demographic information about
participants are limitations of the study. They also recommended the use of multiple time point
assessment (i.e. include retrospective)
The statistical model did pairwise comparisons on each question (competencies), however, the authors did not correct for family-wise errors (i.e., an additional statistical problem affecting this literature broadly).
Finally, the concern that respondents might be perceiving the constructs asked differently across the two time-points “pre-test” and “post-test” is sometimes addressed using Differential Item Functioning analysis.
Uttl, B., White, C. A., & Gonzalez, D. W. (2017). Meta-analysis of faculty’s teaching effectiveness: Student evaluation of teaching ratings and student learning are not related. Studies in Educational Evaluation, 54, 22–42. https://doi-org.ezproxy.library.ubc.ca/10.1016/j.stueduc.2016.08.007
Description:
SET ratings used to evaluate faculty’s teaching effectiveness are based on the belief that students learn more from highly rated professors. The authors focused on meta-analyses of multisection studies that attempt to correlate SETs and student achievements). In multisection studies, students are randomly assigned to sections of the same course, taught by different instructors.
The underlying assumption is that a “high correlation between SET and some measures of learning” is an indication that SET is a valid tool to access teaching effectiveness.
The authors re-analyzed the meta-analyses and found that the findings were an artifact of small sample sized studies and publication bias. Small sample studies showed large and moderate correlations, large sample studies showed no or minimal correlation. (In general, with some caveats about sampling, larger samples offer better estimates of the true scores.)
Notes that all the previously published meta-analyses of SET/learning correlations had not adequately considered the possibility that the correlations may be an artifact of small sample sizes.
The aims of this meta-analysis were as follows: (1) expand the set of multisection studies by including all studies published to date (2) estimate SET/learning correlations in these studies while

Student Evaluation of Teaching Working Group Report 2020
15
considering the presence of small study size effects (3) Examine if correlations were smaller in studies that controlled versus did not control for prior learning/ability. (4) Examine correlations for overall instructor ratings used in previous meta-analyses and an average of correlations reported in each study.
The criteria used for inclusion in this meta-analysis were: (1) study had to report correlations or other associations between SET and learning/achievement in college and university settings (2) each study had to involve multiple sections of the same rather than different courses (3) the SET and measures of learning had to be common for all sections within the study (4) Learning measures had to be objective (5) correlations had to be calculated using section means rather than individual students’ scores. (6) had to be written in English.
A total of 51 articles yielded 97 multisection studies.
Authors claim that the first two graphs show that there is significant inverse correlation between the sample used and the likelihood of a significant correlation detected between SET and measures of learning. Thus, supporting their claim that smaller (i.e., less trustworthy) samples were more likely to show larger effects.
Conclusions: (1) findings indicate small studies often reported high correlations while large sized studies reported small or no correlations. (2) When analyses include both multisection studies with and without prior learning controls, estimated correlations are very weak with the ratings account for up to 1% of variance. (3) When controlling for prior learning, previously reported correlations were found not to be significantly different from zero. A caveat is that multisection studies typically only use 10 or fewer sections.
The main contribution of this paper is that it outlined some blind spots often overlooked by meta-analysis.
Student Evaluation of Teaching Working Group Report 2020
16
Gender, Ethnicity and Other Instructor-Related Questions
Gupta, A., Garg, D., & Kumar, P. (2018). Analysis of Students’ Ratings of Teaching Quality to Understand the Role of Gender and Socio-Economic Diversity in Higher Education. IEEE Transactions on Education, 61(4), 319–327. https://doi-org.ezproxy.library.ubc.ca/10.1109/TE.2018.2814599
Description:
The paper analyzed 112 919 and 16 354 entries of teaching evaluations from students in a university in India to mainly look into the effects of teachers’ SES (“caste”) and gender (male, female). The SES was categorized using their caste system, where a few castes were jointly called ‘low socio-economic status’ (LSES) while other castes were filed as “general” (GEN).
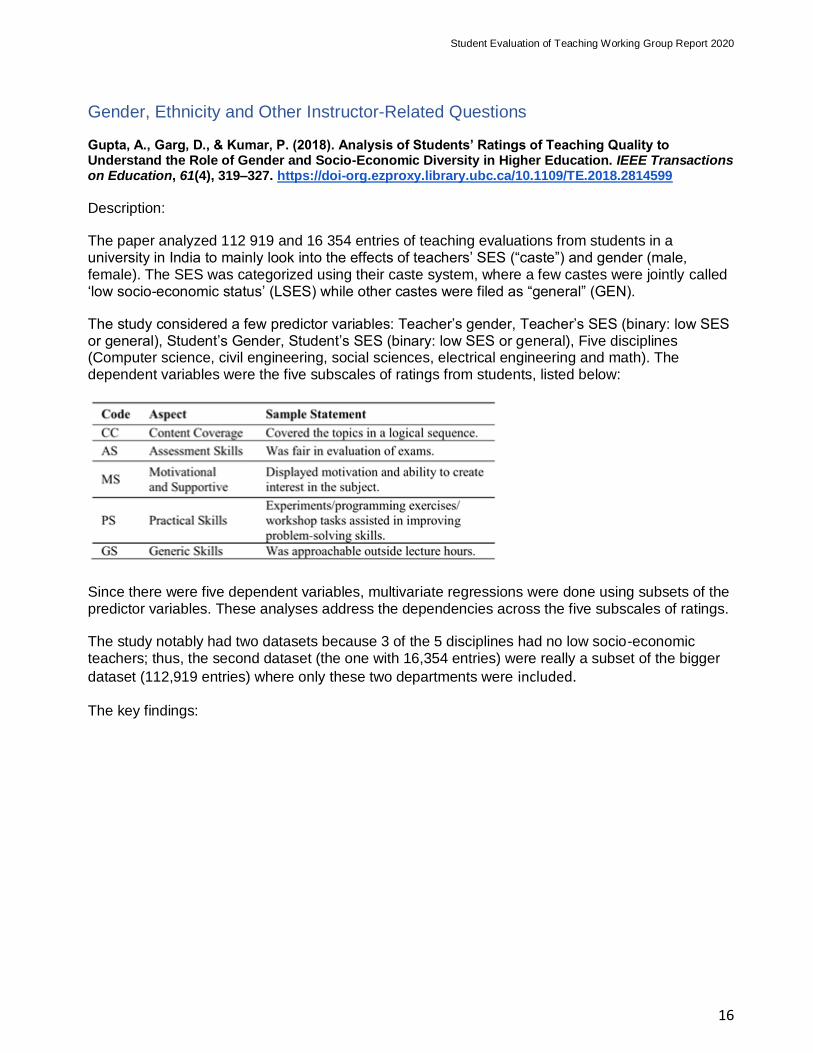
The study considered a few predictor variables: Teacher’s gender, Teacher’s SES (binary: low SES or general), Student’s Gender, Student’s SES (binary: low SES or general), Five disciplines (Computer science, civil engineering, social sciences, electrical engineering and math). The dependent variables were the five subscales of ratings from students, listed below:
Since there were five dependent variables, multivariate regressions were done using subsets of the predictor variables. These analyses address the dependencies across the five subscales of ratings.
The study notably had two datasets because 3 of the 5 disciplines had no low socio-economic teachers; thus, the second dataset (the one with 16,354 entries) were really a subset of the bigger
dataset (112,919 entries) where only these two departments were included.
The key findings:

Student Evaluation of Teaching Working Group Report 2020
17
The study found lots of subtleties such as this:
“The pattern of ratings given by the five discipline students varied largely on different [student ratings]. In [computer science] and [math], female teachers were rated more highly than their male counterparts on Content Coverage, Assessment Skills, Practical Skills and Generic Skills scales […]. Similarly, in [civil engineering], female teachers were rated higher than the male teachers on Motivational and Supportive and Generic Skills scales. Whereas in [social sciences], male teachers received higher rating then their female counterparts on Content Coverage, Assessment Skills, Motivational and Supportive and Generic Skills subscales.”
The authors argued “gender atypicality” attracts more rewards from students “This study via this differentiation in ratings across the disciplines, reveal gender atypical behavior confirmation of the students, i.e. the students tend to give higher rating to the teachers in discipline that are less typical to their gender, as compared to the disciplines, that are more typical to their gender.”
It is worth noting that, in this study, all mean differences range from 0.05 to 0.15, on a 5-point scale. These differences, though statistically significant, may not be of great practical significance.
Mengel, F., Sauermann, J., & Zölitz, U. (2019). Gender Bias in Teaching Evaluations. Journal of the European Economic Association, 17(2), 535–566. https://doi-org.ezproxy.library.ubc.ca/10.1093/jeea/jvx057d
Description:
The study was done via “a quasi-experimental dataset of 19,952 evaluations of instructors at School of Business and Economics (SBE) of Maastricht University in the Netherlands in the Netherlands. 51% of the students are German, and only 30% are Dutch. To identify causal effects, the authors “exploited the institutional feature that within each course students are randomly assigned to either female or male section instructors” The dataset is of students’ subjective evaluations of the teachers, their course grades, and students’ self-reported efforts (measured in
Student Evaluation of Teaching Working Group Report 2020
18
hours of studying). The main finding was that “lower teaching evaluations of female faculty stem mostly from male students, who evaluate their female instructors 21% of a standard deviation worse than their male instructors (this translates to an average difference of 0.15 points on a 5-point scale),” even after controlling for student grades and self-reported efforts. Gender bias was “worse in math-related courses” and for younger female instructors.
The study used linear regression analysis. A linear mixed effects model, including course and/or department-level variables, would have been more appropriate.
Wagner, N., Rieger, M., & Voorvelt, K. (2016). Gender, ethnicity and teaching evaluations: Evidence from mixed teaching teams. Economics of Education Review, 54, 79–94. https://doi-org.ezproxy.library.ubc.ca/10.1016/j.econedurev.2016.06.004
Subject of interest: Link between Student Evaluations of teaching (SET) and being female and being of non-caucasian ethnic background.
Data Origin: Dutch university (Erasmus University)
Summary: Proposes a new identification strategy to assess the association between teacher traits and student evaluations of teaching. Lecturers teach more than one course and many courses are co-taught by mixed gender and ethnicity teams. Allows study of the impact of gender and ethnicity on student evaluations within the same course. Controls for course heterogeneity and for self -selection of teachers and students into courses. Also allows to control for personality or ability specific to teachers.
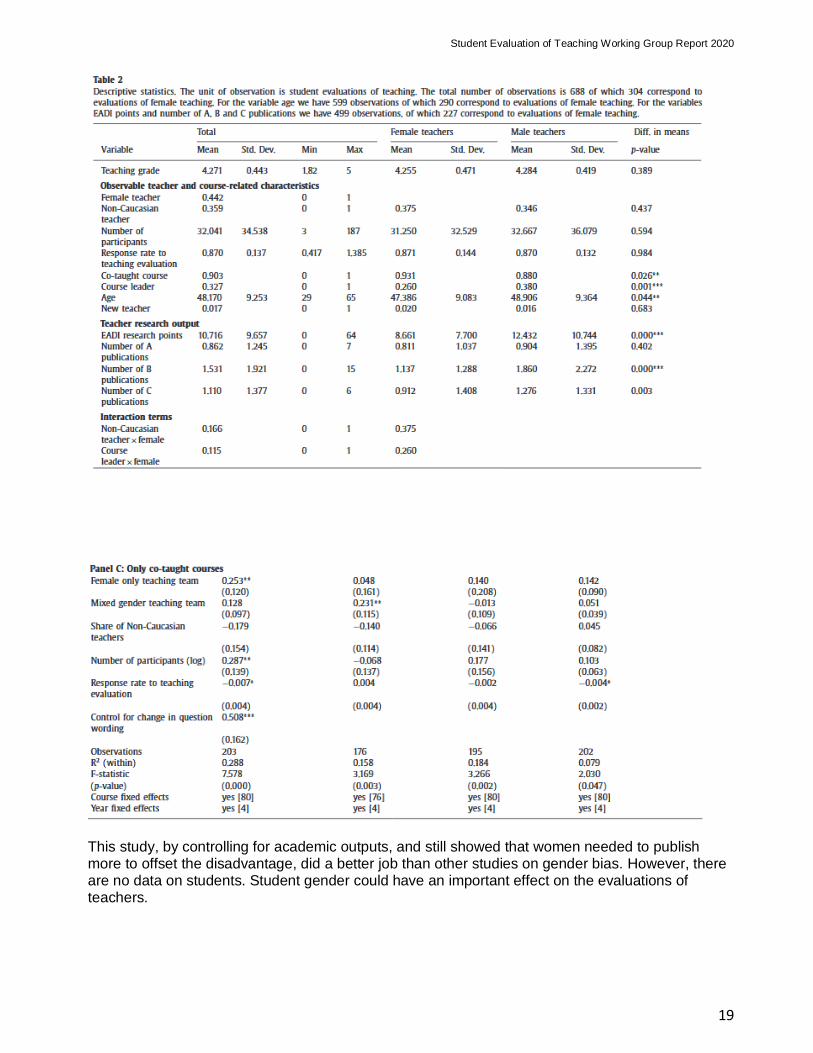
Findings: Gender explains roughly ¼ of the sample standard deviation in SETs. Women are 11% less likely to attain the teaching evaluation cut-off for promotion to associate professor compared to men. They also claim that results are able to net out teacher unobservables such as ability or personality. They ran teacher fixed-effects models separately for men and women. Women obtain considerably lower teacher evaluations when teaching with men compared to teaching alone or with other women. Woman teachers would need a sizable 4.79 top publications to offset the negative impact of students’ evaluation of their teaching. There was no difference for ethnicity. However, in Gender studies and Social Justice courses, female teachers were rated higher than male teachers.
Sample: 75% of all courses are co-taught. Among these, 65% are co-taught by mixed gender teams and about 15% are co-taught by female only teams. 66.54% of all courses offered are either co-taught by mixed gender or female-only teaching teams.
Data: Same questionnaire across courses over a five-year period. Dataset with 688 evaluations for a total of 272 courses.
Student Evaluation of Teaching Working Group Report 2020
19
This study, by controlling for academic outputs, and still showed that women needed to publish more to offset the disadvantage, did a better job than other studies on gender bias. However, there are no data on students. Student gender could have an important effect on the evaluations of teachers.
Student Evaluation of Teaching Working Group Report 2020
20
Clayson, D. (2013). Initial Impressions and the Student Evaluation of Teaching. Journal of Education for Business, 88(1), 26–35. https://doi-org.ezproxy.library.ubc.ca/10.1080/08832323.2011.633580
Article is interested in the relation between initial impressions and SETs. Finds that first impressions of the instructor and their personality were significantly related to instructor evaluations made at the end of the course.
Experiment: Initial impressions were gathered, after students were exposed to the instructor, but before the syllabus was distributed and instruction had taken place. Ratings based on initial impressions were then compared to data taken at the end of the 16 weeks.
Data: Data mined from an existing database. During spring 2003, over 700 students in organizational management and principles of marketing classes were followed for an entire semester. Data was gathered about the students and the perceptions of the class and instructor regularly over 16 weeks. Eight instructors taught 13 sections of introductory business classes, with a total of 737 students. Sample size resulted in 567 for the ones who responded to both questionnaires, the rest having not responded to the first one or dropped out of the course.
Students rated instructor personality using a variation of the Five Factor Model (i.e., agreeableness, conscientiousness, emotional stability, extraversion, and imaginativeness replaced openness to experience).Impressions of each dimension were given on a 7-point scale. The student evaluation of teaching was measured using the institution’s formal SET (5 items), measured on a 5-point scale.
Results: Initial expected grade and initial SET were significantly correlated with the initial measure of personality, though effects were very small (correlations less than .10). Both initial personality and initial SET were significantly associated with final measure of personality, and initial perception that grading be fair (effect sizes were small, correlations less than .20).
Initial SET, before any instruction took place, was significantly related to final SET 16 weeks later, although effect size was small (correlation = .14). This seems to be consistent across the best and the worst students.
It is unclear in some cases what precise statistical tests were used, which raises concerns about the quality of these data analyses overall. Though from what is reported, effects continue to remain small.
Peterson, D. A. M., Biederman, L. A., Andersen, D., Ditonto, T. M., & Roe, K. (2019). Mitigating gender bias in student evaluations of teaching. PLoS ONE, 14(5), 1–10. https://doi-org.ezproxy.library.ubc.ca/10.1371/journal.pone.0216241
Paper wants to find a way to reduce gender bias in student evaluations. Performs an experiment which tests to see if gender neutral language reduces gender bias. Results indicate that it can reduce it significantly.
Main Hypothesis: students provided with cues that make them aware of gender biases and motivate them to rely on less stereotypical considerations about their instructor will result in more positive ratings of female instructors compared to students who do not receive these cues.
Sample: Four introductory courses in Spring 2018: 2 Intro to Biology and 2 intro to American politics. Each pair, one taught by a male instructor the other by a female. All instructors were white. Students were randomized into control and treatment conditions. One received the standard SET survey, the other used language intended to mitigate gender biases. The added text was:

Student Evaluation of Teaching Working Group Report 2020
21
Results: The added language seems to improve the average student ratings of female faculty, with no average effect for male faculty. However, it is unclear whether the effects of the added language counteracted implicit bias or made students overcompensate because they were worried about implicit bias. (The authors acknowledge this, but it might be a bigger problem than they think.)
Peer, E., & Babad, E. (2014). The Doctor Fox Research (1973) Revisited: “Educational Seduction” Ruled Out. Journal of Educational Psychology, 106(1), 36–45. https://doi-org.ezproxy.library.ubc.ca/10.1037/a0033827
Note: The study consisted of many smaller studies, with lots of subtleties to report. The gist of the results is accurately represented in its abstract. I’ve summarized lots of details later.
Below is a direct quote of the study abstract.
“In their study about the Dr. Fox lecture, Naftulin, Ware, and Donnelly (1973) claimed that an expressive speaker who delivered an attractive lecture devoid of any content could seduce students into believing that they had learned something significant. Over the decades, the study has been (and still is) cited hundreds of times and used by opponents of the measurement of student evaluations of teachers (SET) as empirical proof for the lack of validity of SET. In an attempt to formulate an alternative explanation of the findings, we replicated the 1973 study, using the original video of the lecture and following the exact methodology of the original study. The alternative explanations tested on several samples of students included (a) acquiescence bias (via a reversed questionnaire and a cognitive remedy); (b) ignorance bias (participants’ lack of familiarity with the lecture content); (c) status/prestige bias (presentation of the speaker as a world authority); and (d) a direct measurement of students’ reports about their presumed learning. The Dr. Fox effect was indeed consistently replicated in all samples. However, the originally proposed notion of educational seduction leading to presumable (illusory) student learning was ruled out by the empirical findings: Students indeed enjoyed the entertaining lecture, but they had not been seduced into believing they had learned. We discuss the relevance of metacognitive considerations to the inclusion of self -reported learning in this study, and to the wider issue of the incorporation of student learning in the contemporary measurement of SET.”
Detailed summary:
The paper replicates the so-called Dr. Fox experiment and rules out the conclusion drawn by previous researchers, the conclusion that “an expressive speaker who delivered an attractive lecture devoid of any content could seduce students into believing that they had learned something significant.”
Study 1 was designed to replicate the original Dr. Fox experiment (or the Dr. Fox effect) and to
offer an alternative explanation of the experimental results.
Participants: “247 undergraduate students in several courses in the behavioral sciences (78.9% female, ages ranging between 18 and 48, Mage =23.8, SD = 4.2)”
● Results (below are quotes):
○ Almost all conditions showed a replication of the basic Dr. Fox effect, and
participants’ evaluations of the lecturer were mostly favorable. At the same time,
none of the manipulations that were tested in this study had a significant effect on
reducing the favorable evaluations of Dr. Fox.
Student Evaluation of Teaching Working Group Report 2020
22
○ Thus, we concluded that the favorable ratings of Dr. Fox could not be accounted for
by the manner in which the questions were asked or by the scale that was used, nor
could the Fox effect be explained as reflecting acquiescence response bias.
Study 2 was designed to test the status bias, but the results of the study suggest that “even if the status or implied prestige had any effect on students’ evaluations, it was a very small, insignificant, and negligible effect.”
Study 3 was designed to test the ignorance bias. This kind of bias occurs when a confident expert teaches a topic about which the learners know nothing. Learners would naturally tend to be more impressed and feel ‘instructed’ because of the gap between the teacher knowledge and their ignorance of the subject matter. However, the study results show that “the group of informed students...evaluated Dr. Fox in the same way as the group of the ignorant students,” which suggests that the ignorance bias does not account for the favorable ratings for the Dr. Fox lecture.
However, study 3 showed that students evaluated the lecture favorably even when they said that they did not learn anything from the lecture. This finding contradicts the conclusion drawn by previous researchers, the conclusion “an expressive speaker who delivered an attractive lecture devoid of any content could seduce students into believing that they had learned something significant.” It seems that just because students rate the lecture favorably does not necessarily mean that they believe that they have learned something.
Meta-analyses are done to confirm this point, which suggests that “the notions of educational seduction and illusory learning have to be ruled out.”
Response Rates and Non-Response Bias
Al-Maamari, F. (2015). Response Rate and Teaching Effectiveness in Institutional Student Evaluation of Teaching: A Multiple Linear Regression Study. Higher Education Studies, 5(6), 9–20. Retrieved from http://ezproxy.library.ubc.ca/login?url=http://search.ebscohost.com/login.aspx?direct=true&db=eric&AN=EJ1085962&site=ehost-live&scope=site
Description:
The study consisted of two parts. The first part tried to predict response rate, and the second part progressively added variables to test the average ratings students gave to teachers based on many different multiple regression models. Note that in some of the models in the second part, response rate became a predictor, rather than the predicted, as in the first part.
Data were limited to two large EFL (English as a foreign language) programs at a university setting in the Sultanate of Oman, with a total of 2095 courses included. There seemed to be no student-level data, so all the analyses were done at the course level.
The measurement used was a 13-item and an overall quality of teaching item, on a 5-point Likert-type scale. In the context of the analysis, the author used “statement 14” to refer to the average of the 13 items and “statement 15” to refer to the overall quality of teaching item.
The main result of the first part was that both Instructor Gender and Course Type (non-degree v.s. degree courses) were significant predictors of response rate, but the effect sizes were small (explaining just 5% of the variance in response rate). The author pointed out that the test was significant because the sample size was large.
Student Evaluation of Teaching Working Group Report 2020
23
The main result of the second part was that the single ‘overall quality of teaching’ item (called “statement 15” in this paper) was a strong predictor of the average of the other 13 SET items, explaining 84% of the variance.
The main contribution of the paper is in showing that response rates in these English language programs were not related to class size or instructor gender (effect size small though significant), and that response rates did not predict ratings.
However, the findings need to be interpreted with caution in that there were no instructor-level data collected which can help tease apart influences from instructors and courses. It was not clear if the same course could be taught by different instructors.
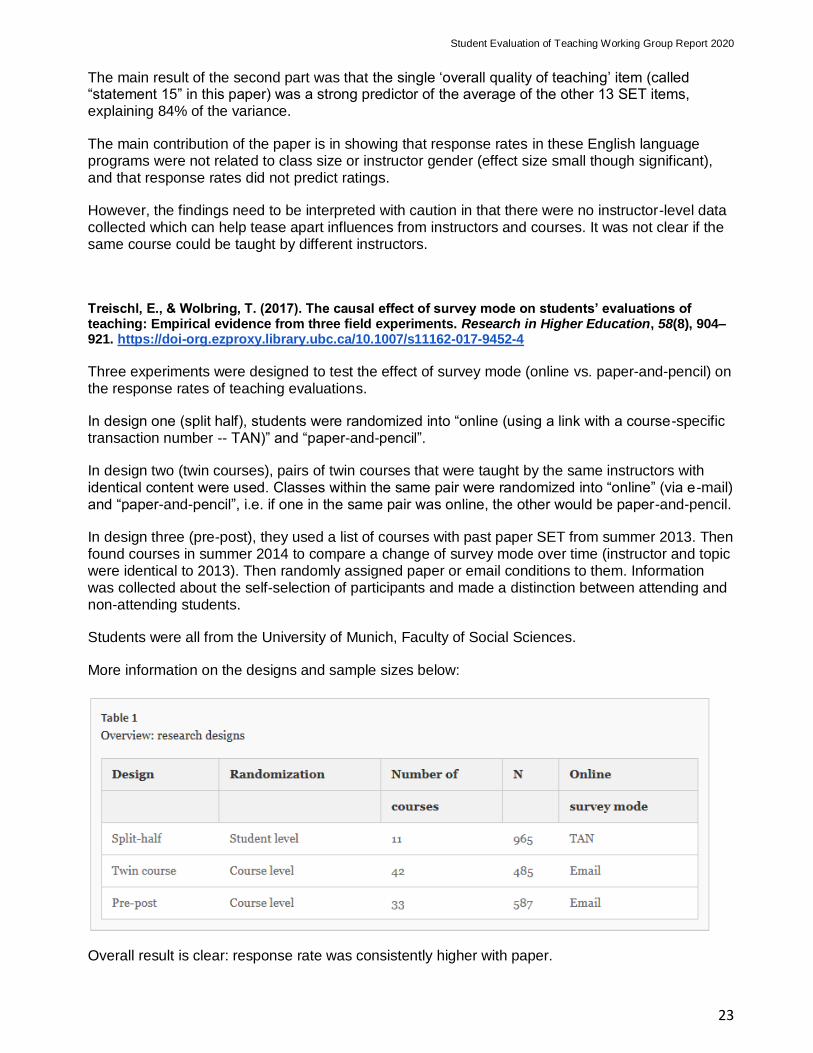
Treischl, E., & Wolbring, T. (2017). The causal effect of survey mode on students’ evaluations of teaching: Empirical evidence from three field experiments. Research in Higher Education, 58(8), 904–921. https://doi-org.ezproxy.library.ubc.ca/10.1007/s11162-017-9452-4
Three experiments were designed to test the effect of survey mode (online vs. paper-and-pencil) on the response rates of teaching evaluations.
In design one (split half), students were randomized into “online (using a link with a course-specific transaction number -- TAN)” and “paper-and-pencil”.
In design two (twin courses), pairs of twin courses that were taught by the same instructors with identical content were used. Classes within the same pair were randomized into “online” (via e-mail) and “paper-and-pencil”, i.e. if one in the same pair was online, the other would be paper-and-pencil.
In design three (pre-post), they used a list of courses with past paper SET from summer 2013. Then found courses in summer 2014 to compare a change of survey mode over time (instructor and topic were identical to 2013). Then randomly assigned paper or email conditions to them. Information was collected about the self-selection of participants and made a distinction between attending and non-attending students.
Students were all from the University of Munich, Faculty of Social Sciences.
More information on the designs and sample sizes below:
Overall result is clear: response rate was consistently higher with paper.

Student Evaluation of Teaching Working Group Report 2020
24
The authors think that their study is in line with most of the literature on this topic. But they think their study design allows them to draw firmer conclusions about the causal effect of survey mode on SET, compared to quasi-experimental and non-experimental designs.
They also argue that, contrary to popular opinion, pencil and paper surveys are not the gold standard by which to assess the quality of online SET. Both paper and online surveys have their own kinds of non-response and related biases, as some students do not show up to class for the in-class survey. Online-based methods at the very least make it accessible to all students no matter if they attend class on survey day or they do not.
Third conclusion is that one should not confound the type of survey mode (online versus paper) with the survey situation (in class versus after class). And found that the highest response rates were through email surveys which were given in class and were accessible outside of class.
Goos, M., & Salomons, A. (2017). Measuring teaching quality in higher education: Assessing selection bias in course evaluations. Research in Higher Education, 58(4), 341–364. https://doi-org.ezproxy.library.ubc.ca/10.1007/s11162-016-9429-8
Student evaluations of teaching typically have missing responses, which are not necessarily random, pointing to a selection bias.
Data were from 28,240 students in 3329 courses taught by 1781 teachers in a European university.
Selection bias was quantified by the differences in teaching evaluation scores between those who responded and those who did not, and a few predictors were used to predict whether one responded. The authors used the fact that some courses were offered in two different semesters, which typically had different response rates, because one was closer to long holidays, to figure out who did not respond (grouped by student variables).
The overall selection bias effect, in standardized units, is summarized in this way: those who responded were estimated to give ratings that were 0.13 standard deviations higher than those who did not. There was no significant impact of the following variables: being a female student, student grade, student activeness (how many courses the student evaluates), how many courses the teacher being evaluated teaches.
The authors admit that the university had atypical timing of semesters and admitted limitations of their generalizability.
Student Evaluation of Teaching Working Group Report 2020
25
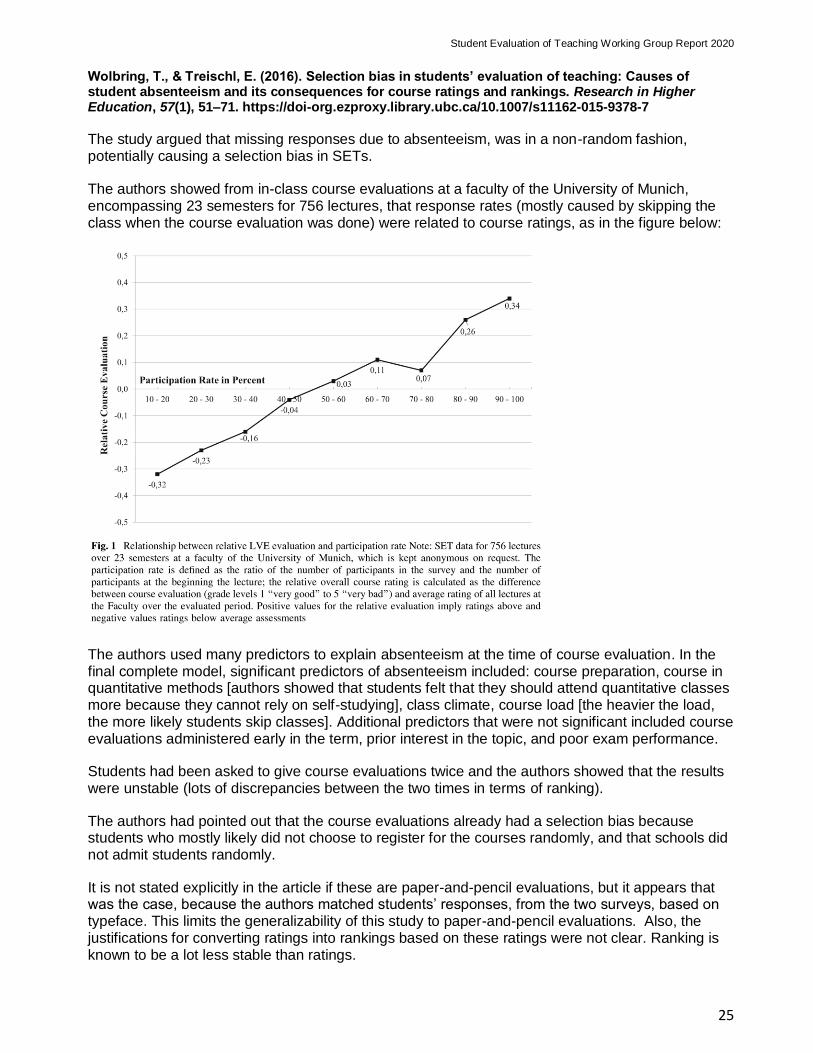
Wolbring, T., & Treischl, E. (2016). Selection bias in students’ evaluation of teaching: Causes of student absenteeism and its consequences for course ratings and rankings. Research in Higher Education, 57(1), 51–71. https://doi-org.ezproxy.library.ubc.ca/10.1007/s11162-015-9378-7
The study argued that missing responses due to absenteeism, was in a non-random fashion, potentially causing a selection bias in SETs.
The authors showed from in-class course evaluations at a faculty of the University of Munich, encompassing 23 semesters for 756 lectures, that response rates (mostly caused by skipping the class when the course evaluation was done) were related to course ratings, as in the figure below:
The authors used many predictors to explain absenteeism at the time of course evaluation. In the final complete model, significant predictors of absenteeism included: course preparation, course in quantitative methods [authors showed that students felt that they should attend quantitative classes more because they cannot rely on self-studying], class climate, course load [the heavier the load, the more likely students skip classes]. Additional predictors that were not significant included course evaluations administered early in the term, prior interest in the topic, and poor exam performance.
Students had been asked to give course evaluations twice and the authors showed that the results were unstable (lots of discrepancies between the two times in terms of ranking).
The authors had pointed out that the course evaluations already had a selection bias because students who mostly likely did not choose to register for the courses randomly, and that schools did not admit students randomly.
It is not stated explicitly in the article if these are paper-and-pencil evaluations, but it appears that was the case, because the authors matched students’ responses, from the two surveys, based on typeface. This limits the generalizability of this study to paper-and-pencil evaluations. Also, the justifications for converting ratings into rankings based on these ratings were not clear. Ranking is known to be a lot less stable than ratings.
Student Evaluation of Teaching Working Group Report 2020
26
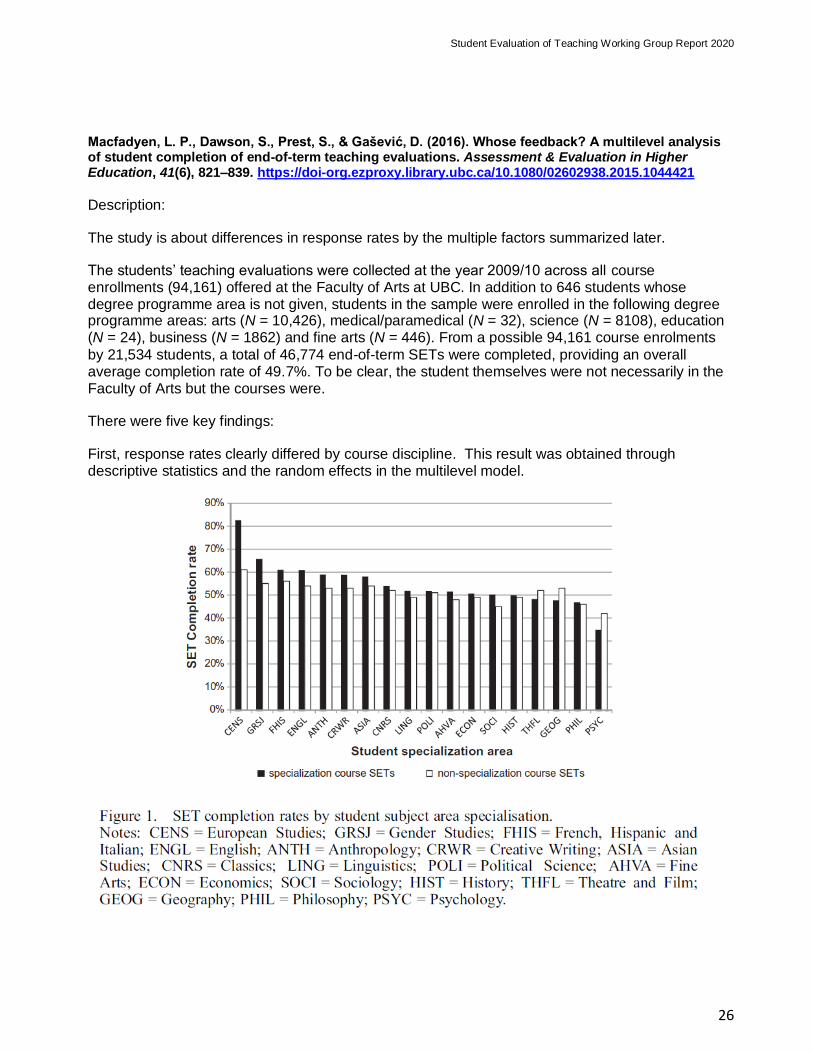
Macfadyen, L. P., Dawson, S., Prest, S., & Gašević, D. (2016). Whose feedback? A multilevel analysis of student completion of end-of-term teaching evaluations. Assessment & Evaluation in Higher Education, 41(6), 821–839. https://doi-org.ezproxy.library.ubc.ca/10.1080/02602938.2015.1044421
Description:
The study is about differences in response rates by the multiple factors summarized later.
The students’ teaching evaluations were collected at the year 2009/10 across all course enrollments (94,161) offered at the Faculty of Arts at UBC. In addition to 646 students whose degree programme area is not given, students in the sample were enrolled in the following degree programme areas: arts (N = 10,426), medical/paramedical (N = 32), science (N = 8108), education (N = 24), business (N = 1862) and fine arts (N = 446). From a possible 94,161 course enrolments
by 21,534 students, a total of 46,774 end-of-term SETs were completed, providing an overall average completion rate of 49.7%. To be clear, the student themselves were not necessarily in the Faculty of Arts but the courses were.
There were five key findings:
First, response rates clearly differed by course discipline. This result was obtained through descriptive statistics and the random effects in the multilevel model.
Student Evaluation of Teaching Working Group Report 2020
27
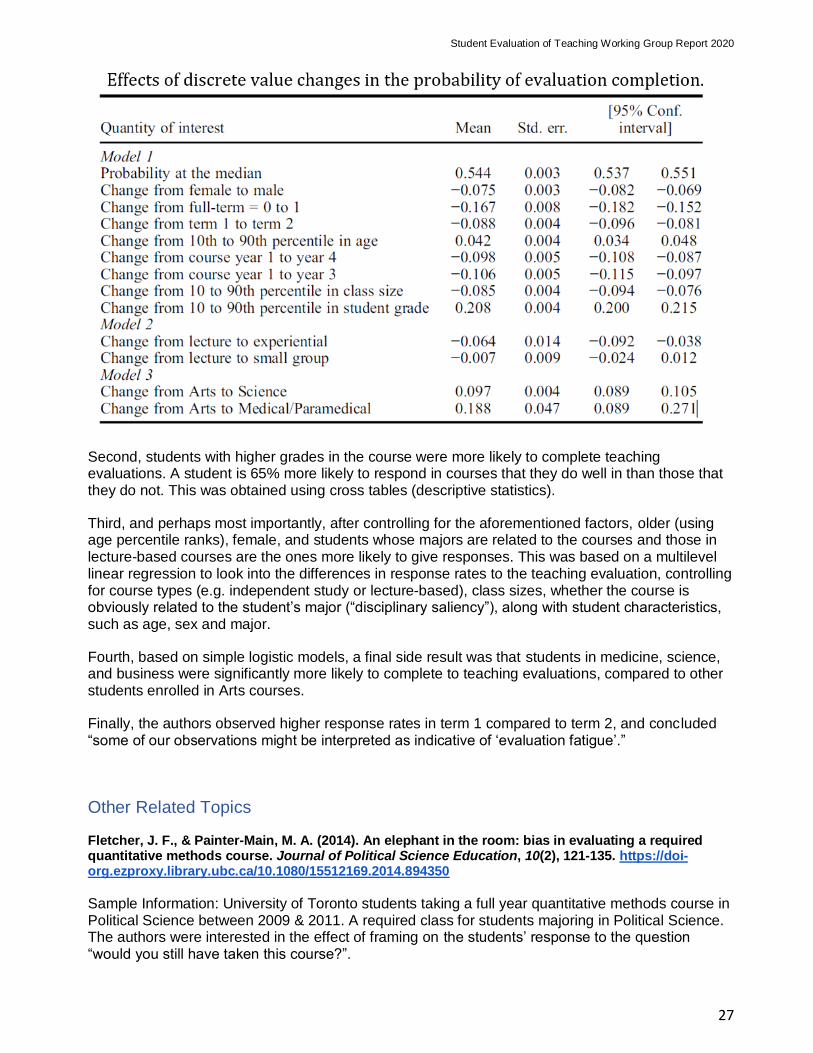
Second, students with higher grades in the course were more likely to complete teaching evaluations. A student is 65% more likely to respond in courses that they do well in than those that they do not. This was obtained using cross tables (descriptive statistics).
Third, and perhaps most importantly, after controlling for the aforementioned factors, older (using age percentile ranks), female, and students whose majors are related to the courses and those in lecture-based courses are the ones more likely to give responses. This was based on a multilevel linear regression to look into the differences in response rates to the teaching evaluation, controlling for course types (e.g. independent study or lecture-based), class sizes, whether the course is obviously related to the student’s major (“disciplinary saliency”), along with student characteristics, such as age, sex and major.
Fourth, based on simple logistic models, a final side result was that students in medicine, science, and business were significantly more likely to complete to teaching evaluations, compared to other students enrolled in Arts courses.
Finally, the authors observed higher response rates in term 1 compared to term 2, and concluded “some of our observations might be interpreted as indicative of ‘evaluation fatigue’.”
Other Related Topics
Fletcher, J. F., & Painter-Main, M. A. (2014). An elephant in the room: bias in evaluating a required quantitative methods course. Journal of Political Science Education, 10(2), 121-135. https://doi-org.ezproxy.library.ubc.ca/10.1080/15512169.2014.894350
Sample Information: University of Toronto students taking a full year quantitative methods course in Political Science between 2009 & 2011. A required class for students majoring in Political Science. The authors were interested in the effect of framing on the students’ response to the question “would you still have taken this course?”.

Student Evaluation of Teaching Working Group Report 2020
28
In this experiment, the authors varied the “retake” question by comparing students’ responses to the question “Considering the value of this course in preparing for future study and future work, would you still have taken this course?” (the Revised question) versus the standard wording, “Considering your experience with this course, and disregarding your need for it to meet program or degree requirements, would you still have taken this course?” (the Traditional question).
The Revised question was not intended to be neutral, but to provide students with an alternative frame, which primed future considerations rather than past ones.
Results:
In table 2, 100% of students who answered “Yes” to the traditional question, also answered “Yes” to the revised question. On the other hand, 28% of those who answered “No” to the traditional question, responded positively to the modified question. Overall, this study reminds us that question wording can influence responses.
Murray, K. B., & Zdravkovic, S. (2016). Does MTV really do a good job of evaluating professors? An empirical test of the internet site RateMyProfessorscom. Journal of Education for Business, 91(3), 138–147. https://doi-org.ezproxy.library.ubc.ca/10.1080/08832323.2016.1140115
Description:
The authors recruited 6 professors teaching Foundations of Management in the school of business at Bryant University, USA, and had all 276 students (of whom 91% responded) rate these professors using a few different scales at the end of the term. One contained a two-item scale with only “clarity” and “helpfulness”, similar to that used on RateMyProfessors.com, and the other few were more the standard 12-item student teaching evaluation tools. The authors then compared these to the RateMyProf 2-item ratings on RateMyProf.
Their key findings were:
Student Evaluation of Teaching Working Group Report 2020
29
First, only a small fraction of students enrolled with a given professor (< 5%) actually rated that person on RateMyProfessor. These very small response rates were inadequate for generalizing to all an instructor’s students.
Second, students who used RateMyProfessor tended to rate the professors lower, compared to those who responded to the two-item in-class scale. Third, students’ evaluation using the 12-item institutional scale yielded higher ratings of the professors.
The authors concluded that RateMyProfessors.com should not be taken seriously due to the lack of sampling adequacy and bias towards lower ratings.
It is worth noting that only six instructors were evaluated, all in business, so the generalizability of the results could be questioned.
Jones, J., Gaffney-Rhys, R., & Jones, E. (2014). Handle with Care! an Exploration of the Potential Risks Associated with the Publication and Summative Usage of Student Evaluation of Teaching (SET) Results. Journal of Further and Higher Education, 38(1), 37–56. Retrieved from http://ezproxy.library.ubc.ca/login?url=http://search.ebscohost.com/login.aspx?direct=true&db=eric&AN=EJ1027993&site=ehost-live&scope=site
Description:
This paper is a commentary on previous SET studies, with particular emphasis on issues in the UK institutions of higher education. The authors discouraged the use of SET for summative purposes (tenure and promotion), while formative use was encouraged. The authors clarified that they were not suggesting abandoning quantitative teaching evaluation scales.
In the context of the U.K., the authors suggested the following:
● SET questions could focus upon learning rather than teaching, thus encouraging students to
reflect upon their own performance.
● Involve faculty in SET design.
● Require all new students to undertake an induction session that explains the rationale for
SET, its usage and student responsibilities.
● Avoid using mixed data collection methods for SETs (e.g. online/offline), unless allowance
for potential bias is acknowledged during evaluation.
● Use several tools/methods to gain feedback on lecturers' performance, e.g. focus groups or
peer observation.
● Ensure that it is possible to identify the students who complete the SETs (for example, by
requiring them to insert their student identification number) in order to address the issue of
inappropriate or inaccurate comments and to gain further information regarding allegations
of incompetence.
● Ensure that managers/administrators are trained so that they appreciate the potential for
bias and legal issues.
● Measure against a standard mean score, rather than make comparisons across modules.
● Consider abandoning the summative use of SET results and therefore utilize them as a
professional development tool only.
● Allow the lecturer to view and comment upon the results before escalating them further.
● Ensure that the dissemination of results is in line with the policy recommended earlier.
● Avoid wholesale publication of SET results via the intranet or group emails.
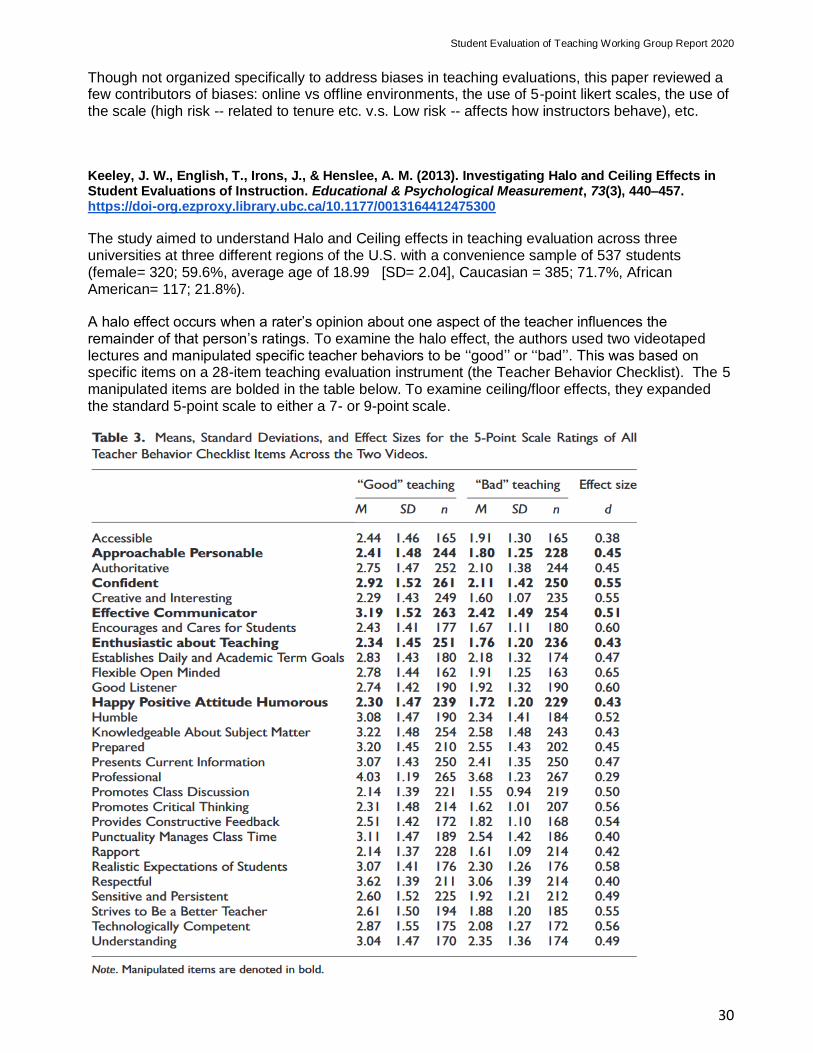
Student Evaluation of Teaching Working Group Report 2020
30
Though not organized specifically to address biases in teaching evaluations, this paper reviewed a few contributors of biases: online vs offline environments, the use of 5-point likert scales, the use of the scale (high risk -- related to tenure etc. v.s. Low risk -- affects how instructors behave), etc.
Keeley, J. W., English, T., Irons, J., & Henslee, A. M. (2013). Investigating Halo and Ceiling Effects in Student Evaluations of Instruction. Educational & Psychological Measurement, 73(3), 440–457. https://doi-org.ezproxy.library.ubc.ca/10.1177/0013164412475300
The study aimed to understand Halo and Ceiling effects in teaching evaluation across three universities at three different regions of the U.S. with a convenience sample of 537 students (female= 320; 59.6%, average age of 18.99 [SD= 2.04], Caucasian = 385; 71.7%, African American= 117; 21.8%).
A halo effect occurs when a rater’s opinion about one aspect of the teacher influences the remainder of that person’s ratings. To examine the halo effect, the authors used two videotaped lectures and manipulated specific teacher behaviors to be ‘‘good’’ or ‘‘bad’’. This was based on specific items on a 28-item teaching evaluation instrument (the Teacher Behavior Checklist). The 5 manipulated items are bolded in the table below. To examine ceiling/floor effects, they expanded the standard 5-point scale to either a 7- or 9-point scale.
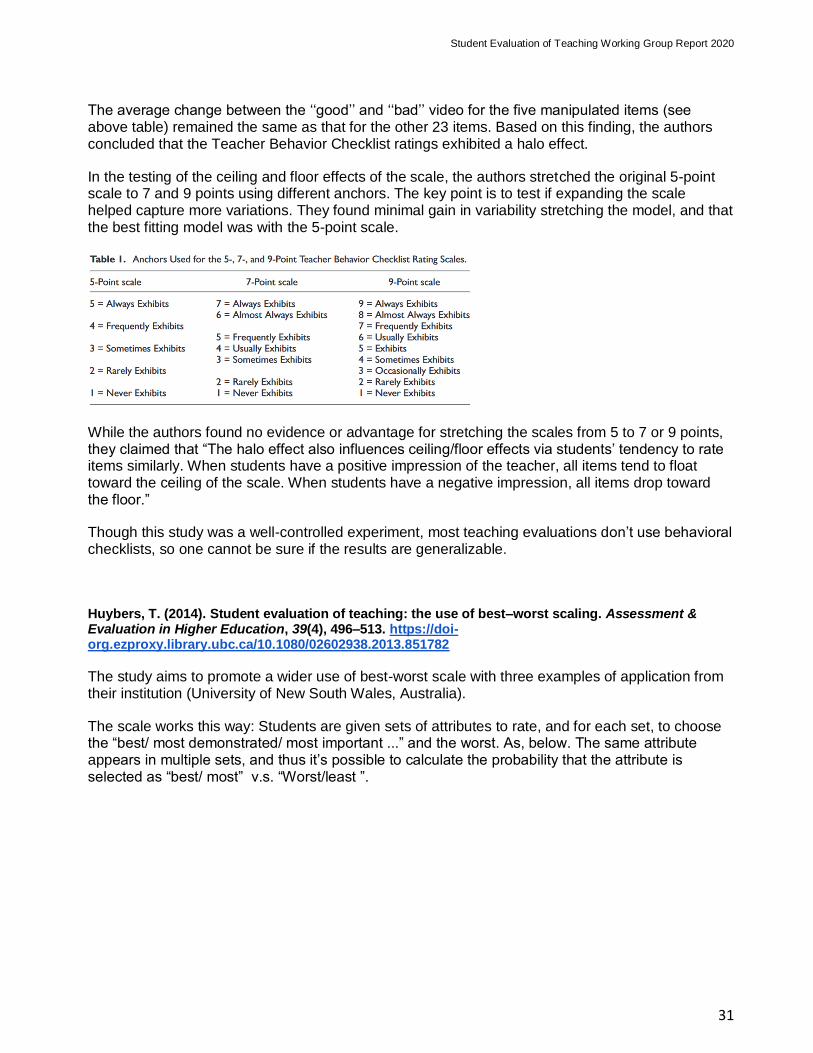
Student Evaluation of Teaching Working Group Report 2020
31
The average change between the ‘‘good’’ and ‘‘bad’’ video for the five manipulated items (see above table) remained the same as that for the other 23 items. Based on this finding, the authors concluded that the Teacher Behavior Checklist ratings exhibited a halo effect.
In the testing of the ceiling and floor effects of the scale, the authors stretched the original 5-point scale to 7 and 9 points using different anchors. The key point is to test if expanding the scale helped capture more variations. They found minimal gain in variability stretching the model, and that the best fitting model was with the 5-point scale.
While the authors found no evidence or advantage for stretching the scales from 5 to 7 or 9 points, they claimed that “The halo effect also influences ceiling/floor effects via students’ tendency to rate items similarly. When students have a positive impression of the teacher, all items tend to float toward the ceiling of the scale. When students have a negative impression, all items drop toward the floor.”
Though this study was a well-controlled experiment, most teaching evaluations don’t use behavioral checklists, so one cannot be sure if the results are generalizable.
Huybers, T. (2014). Student evaluation of teaching: the use of best–worst scaling. Assessment & Evaluation in Higher Education, 39(4), 496–513. https://doi-org.ezproxy.library.ubc.ca/10.1080/02602938.2013.851782
The study aims to promote a wider use of best-worst scale with three examples of application from their institution (University of New South Wales, Australia).
The scale works this way: Students are given sets of attributes to rate, and for each set, to choose the “best/ most demonstrated/ most important ...” and the worst. As, below. The same attribute appears in multiple sets, and thus it’s possible to calculate the probability that the attribute is selected as “best/ most” v.s. “Worst/least ”.
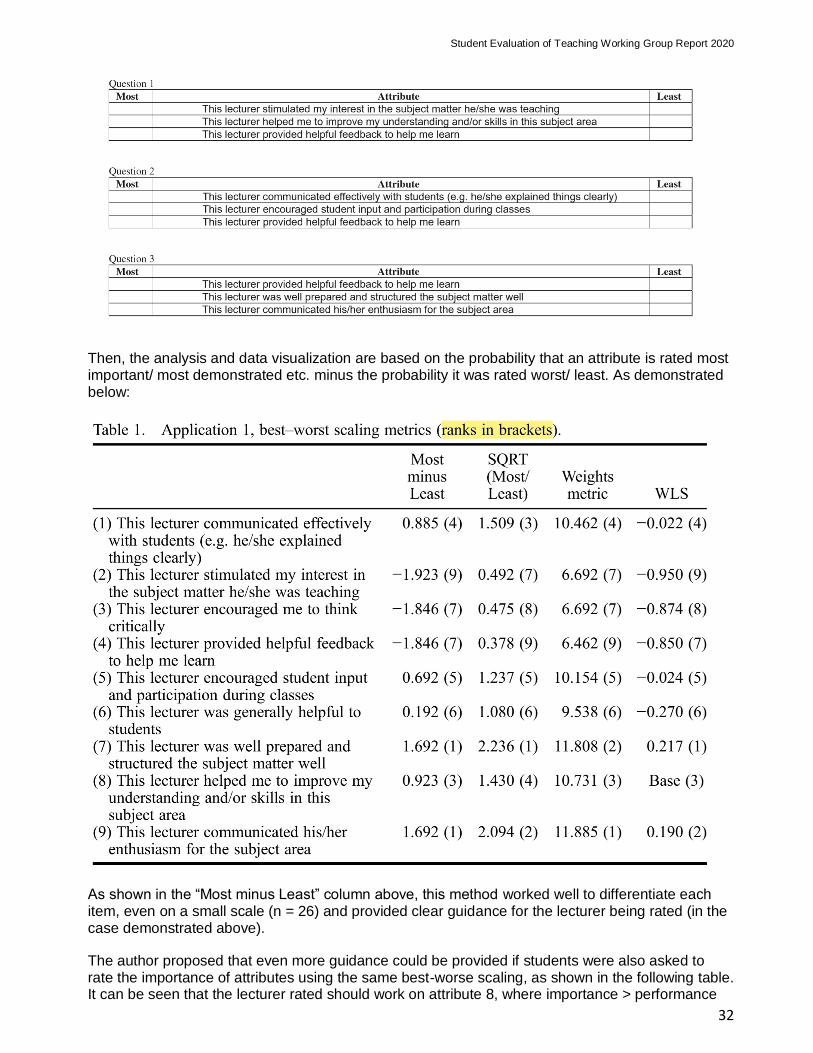
Student Evaluation of Teaching Working Group Report 2020
32
Then, the analysis and data visualization are based on the probability that an attribute is rated most important/ most demonstrated etc. minus the probability it was rated worst/ least. As demonstrated below:
As shown in the “Most minus Least” column above, this method worked well to differentiate each item, even on a small scale (n = 26) and provided clear guidance for the lecturer being rated (in the case demonstrated above).
The author proposed that even more guidance could be provided if students were also asked to rate the importance of attributes using the same best-worse scaling, as shown in the following table. It can be seen that the lecturer rated should work on attribute 8, where importance > performance
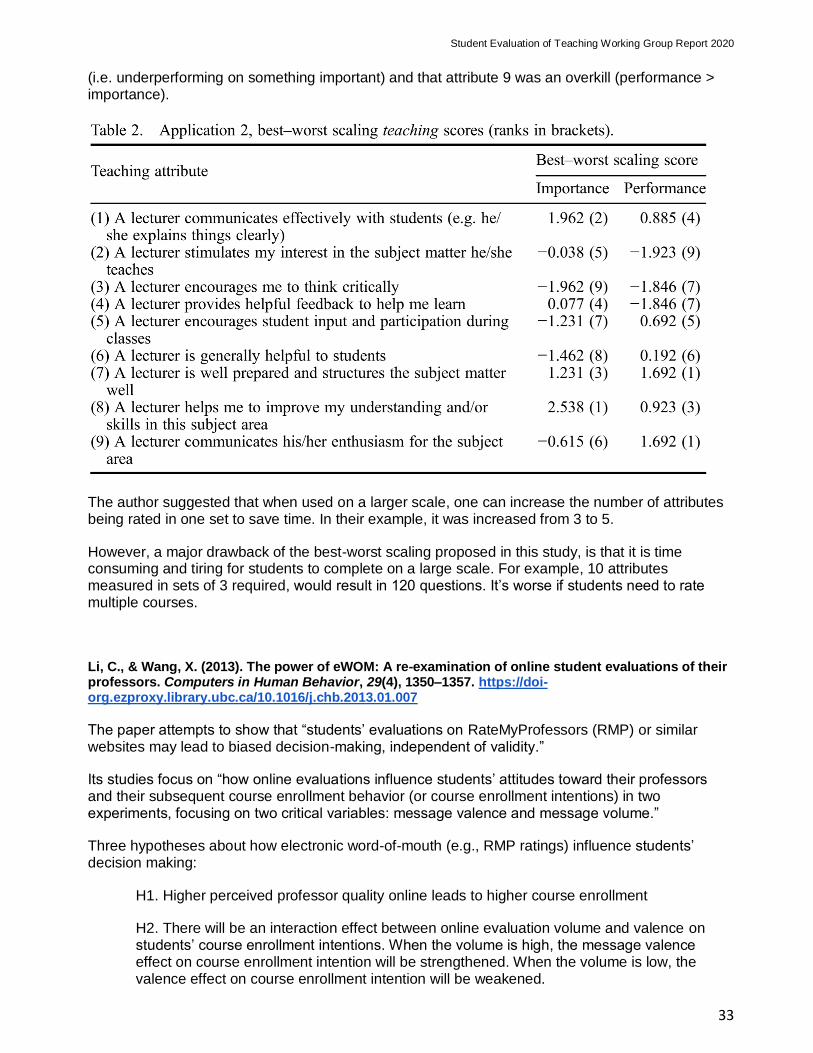
Student Evaluation of Teaching Working Group Report 2020
33
(i.e. underperforming on something important) and that attribute 9 was an overkill (performance > importance).
The author suggested that when used on a larger scale, one can increase the number of attributes being rated in one set to save time. In their example, it was increased from 3 to 5.
However, a major drawback of the best-worst scaling proposed in this study, is that it is time consuming and tiring for students to complete on a large scale. For example, 10 attributes measured in sets of 3 required, would result in 120 questions. It’s worse if students need to rate multiple courses.
Li, C., & Wang, X. (2013). The power of eWOM: A re-examination of online student evaluations of their professors. Computers in Human Behavior, 29(4), 1350–1357. https://doi-org.ezproxy.library.ubc.ca/10.1016/j.chb.2013.01.007
The paper attempts to show that “students’ evaluations on RateMyProfessors (RMP) or similar websites may lead to biased decision-making, independent of validity.”
Its studies focus on “how online evaluations influence students’ attitudes toward their professors and their subsequent course enrollment behavior (or course enrollment intentions) in two experiments, focusing on two critical variables: message valence and message volume.”
Three hypotheses about how electronic word-of-mouth (e.g., RMP ratings) influence students’ decision making:
H1. Higher perceived professor quality online leads to higher course enrollment
H2. There will be an interaction effect between online evaluation volume and valence on students’ course enrollment intentions. When the volume is high, the message valence effect on course enrollment intention will be strengthened. When the volume is low, the valence effect on course enrollment intention will be weakened.
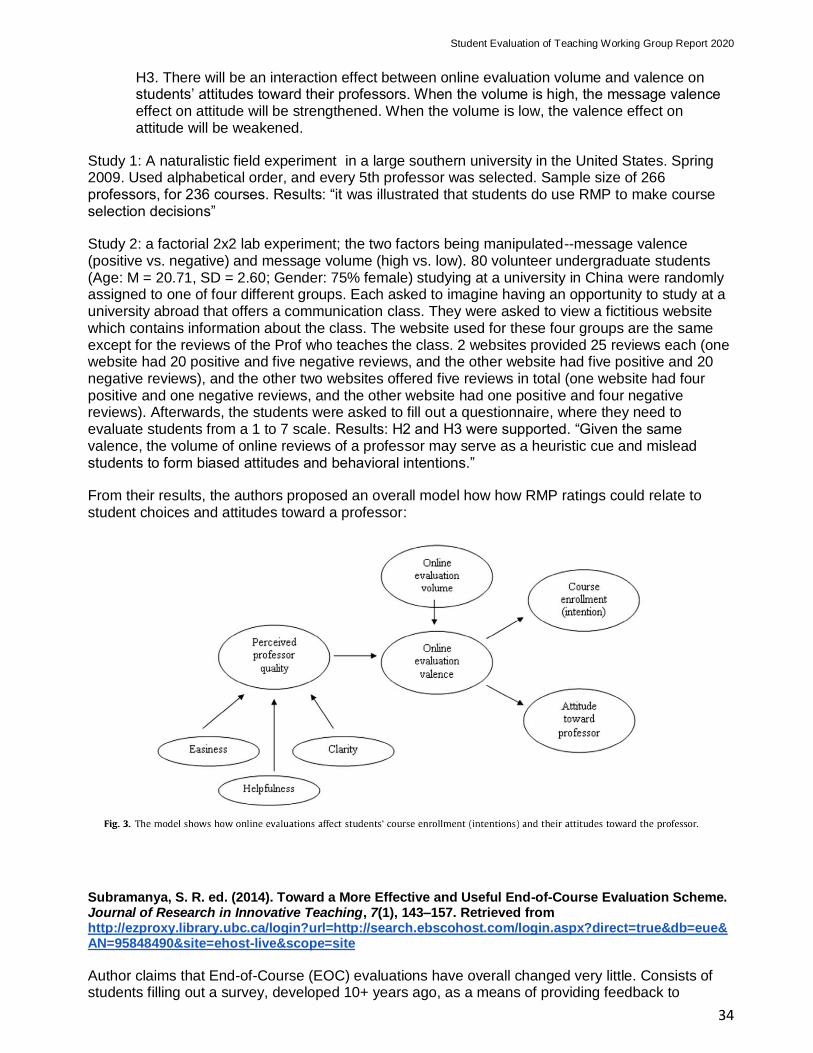
Student Evaluation of Teaching Working Group Report 2020
34
H3. There will be an interaction effect between online evaluation volume and valence on students’ attitudes toward their professors. When the volume is high, the message valence effect on attitude will be strengthened. When the volume is low, the valence effect on attitude will be weakened.
Study 1: A naturalistic field experiment in a large southern university in the United States. Spring 2009. Used alphabetical order, and every 5th professor was selected. Sample size of 266 professors, for 236 courses. Results: “it was illustrated that students do use RMP to make course selection decisions”
Study 2: a factorial 2x2 lab experiment; the two factors being manipulated--message valence (positive vs. negative) and message volume (high vs. low). 80 volunteer undergraduate students (Age: M = 20.71, SD = 2.60; Gender: 75% female) studying at a university in China were randomly assigned to one of four different groups. Each asked to imagine having an opportunity to study at a university abroad that offers a communication class. They were asked to view a fictitious website which contains information about the class. The website used for these four groups are the same except for the reviews of the Prof who teaches the class. 2 websites provided 25 reviews each (one website had 20 positive and five negative reviews, and the other website had five positive and 20 negative reviews), and the other two websites offered five reviews in total (one website had four positive and one negative reviews, and the other website had one positive and four negative reviews). Afterwards, the students were asked to fill out a questionnaire, where they need to evaluate students from a 1 to 7 scale. Results: H2 and H3 were supported. “Given the same valence, the volume of online reviews of a professor may serve as a heuristic cue and mislead students to form biased attitudes and behavioral intentions.”
From their results, the authors proposed an overall model how how RMP ratings could relate to student choices and attitudes toward a professor:
Subramanya, S. R. ed. (2014). Toward a More Effective and Useful End-of-Course Evaluation Scheme. Journal of Research in Innovative Teaching, 7(1), 143–157. Retrieved from http://ezproxy.library.ubc.ca/login?url=http://search.ebscohost.com/login.aspx?direct=true&db=eue&AN=95848490&site=ehost-live&scope=site
Author claims that End-of-Course (EOC) evaluations have overall changed very little. Consists of students filling out a survey, developed 10+ years ago, as a means of providing feedback to

Student Evaluation of Teaching Working Group Report 2020
35
instructors about how students feel about learning experiences, course content, and instructor teaching. Hence, the need for an enhanced model for teaching evaluations.
Talks about the current model of EOC evaluations, which is considered open-ended, where the professor and administration is left to interpret the EOC evaluations:
Proposes an enhanced alternative model:
Discusses and addresses the issues with the current schemes of evaluation that have remained unchanged. Listed in this box:
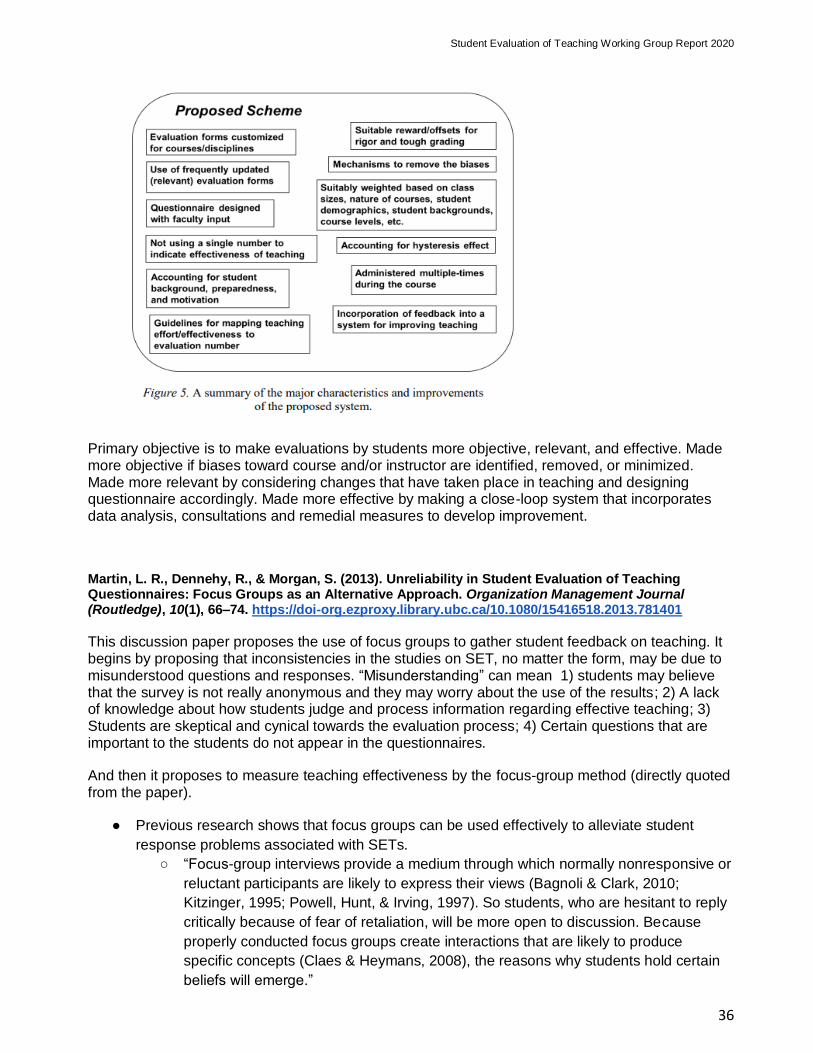
Student Evaluation of Teaching Working Group Report 2020
36
Primary objective is to make evaluations by students more objective, relevant, and effective. Made more objective if biases toward course and/or instructor are identified, removed, or minimized. Made more relevant by considering changes that have taken place in teaching and designing questionnaire accordingly. Made more effective by making a close-loop system that incorporates data analysis, consultations and remedial measures to develop improvement.
Martin, L. R., Dennehy, R., & Morgan, S. (2013). Unreliability in Student Evaluation of Teaching Questionnaires: Focus Groups as an Alternative Approach. Organization Management Journal (Routledge), 10(1), 66–74. https://doi-org.ezproxy.library.ubc.ca/10.1080/15416518.2013.781401
This discussion paper proposes the use of focus groups to gather student feedback on teaching. It begins by proposing that inconsistencies in the studies on SET, no matter the form, may be due to misunderstood questions and responses. “Misunderstanding” can mean 1) students may believe that the survey is not really anonymous and they may worry about the use of the results; 2) A lack of knowledge about how students judge and process information regarding effective teaching; 3) Students are skeptical and cynical towards the evaluation process; 4) Certain questions that are important to the students do not appear in the questionnaires.
And then it proposes to measure teaching effectiveness by the focus-group method (directly quoted from the paper).
● Previous research shows that focus groups can be used effectively to alleviate student
response problems associated with SETs.
○ “Focus-group interviews provide a medium through which normally nonresponsive or
reluctant participants are likely to express their views (Bagnoli & Clark, 2010;
Kitzinger, 1995; Powell, Hunt, & Irving, 1997). So students, who are hesitant to reply
critically because of fear of retaliation, will be more open to discussion. Because
properly conducted focus groups create interactions that are likely to produce
specific concepts (Claes & Heymans, 2008), the reasons why students hold certain
beliefs will emerge.”
Student Evaluation of Teaching Working Group Report 2020
37
● Focus groups improve students’ appreciation for the process of evaluation. Students will
thus be more likely to respond truthfully.
● Focus groups provide more detailed information (such as students’ attitudes) than
questionnaires.
● Focus groups can address some of the problems in SETs. For example, if a student does
not understand a question in a focus group, the moderator may further explain it or the
group may discuss and figure out what the question means. But if a question does not
understand a question is SET, the student may just skip the question.
● Having a moderator in a focus group that listens to the students’ opinions gives students a
sense of having an impact on their education.
● Focus groups, in their promoting self-disclosure, will allow active learning to take place.
Students will become more confident in their abilities to evaluate their teachers.
However, the paper also recognizes that there are several issues surrounding the focus group approach. It then proposes “a set of consideration the requires discussion and resolution before implementing a focus group approach.” (All sentences below are quoted from the article.)
● How expensive would it be to either duplicate the current evaluation system (i.e., use both
SETs and focus groups), partially adopt the focus-group evaluation, or switch to focus-group
evaluation completely? What outcomes are desired? How would “successful” results of
focus-group evaluation be defined? Where would funding be available? Would it make
sense (i.e., be less expensive) to start with a pilot program in a few classes, evaluate the
results, learn from them, and then implement focus-group evaluation on a wider scale if
warranted?
● In terms of faculty: Can they help design the focus-group approach, thereby increasing their
commitment and buy-in to the change? What resistance might occur from faculty members
who have pros- pered under the SET system with consistent high ratings? Also, some
faculty may need training in running of a focus group.
● In terms of the intended use of data: Will the faculty trust the data analysts to be fair and
balanced (an issue because the data from focus groups are more subjective than the
numbers from the SETs)? How will deans and department heads use the new type of data
for both developmental and salary decision purposes? Will there need to be training for the
administrators, possibly at additional cost?
● In terms of the triangulation of method: Should schools that decide to try focus-group evaluation also use another evaluation tool such as faculty self-evaluation, qualitative evaluations, SETs, observations, or peer review? How is this decision to be made and who are the relevant decision makers?
In this paper, it is unclear exactly how students who are hesitant to reply critically because of fear of retaliation will actually be more open to discussion. Moreover, and although focus groups have some merit, they are expensive, time-consuming, and thus not practical.
Stroebe, W. (2016). Why Good Teaching Evaluations May Reward Bad Teaching: On Grade Inflation and Other Unintended Consequences of Student Evaluations. Perspectives on Psychological Science, 11(6), 800–816. https://doi-org.ezproxy.library.ubc.ca/10.1177/1745691616650284
Commentary paper. Topic: University GPAs have increased for decades while time invested by students has decreased. Why is this? Paper argues that grading leniency is encouraged by the use of teaching evaluations in decisions regarding promotion, tenure and hiring. Instructors believe that the average student prefers courses that are entertaining, require little work, and result in high

Student Evaluation of Teaching Working Group Report 2020
38
grades, and thus would more likely rate a course highly based on this. Positive association between student grades and their evaluation of teaching reflects a bias rather than teaching effectiveness. If good teaching evaluations reflected improved student learning, they should be positively related to grades received in subsequent courses that build on knowledge gained in the previous course. Teaching evaluations of concurrent courses are negatively related to student performance in later courses are more consistent with the assumption that the evaluations are the result of lenient grading than effective teaching.
Discusses two kinds of empirical evidence: experiments and correlational evidence, both offer some support for bias from students evaluating their professors. This portion of the paper focuses on the degree to which a students’ grade affects their evaluation of the professor.
In the section about determining whether there is grading leniency, the authors discuss that the evidence for the existence of bias related to grades and student evaluations isn’t evidence for grading leniency as a result. The focus should be on perceived bias instead. Provides very limited evidence that professors actually grade students leniently based on the desire to get better evaluations.
Presents limited evidence that perceived grading leniency from students increase teaching evaluation. Also presents some decent evidence that perceived grading leniency from students decreases the likelihood of them taking courses from that professor. Tends to be more prevalent in less able students (ones with lower SAT scores)/
He outlines ‘the dark side’ of grading leniency, in response to claims that grading leniency might be a win-win for both students and teachers. Points to evidence that the more lenient the grader, the more demotivated students might be. Grades are also supposed to give feedback to students on their strengths/weaknesses/talents, supposed to help them with career choice. Grades which are more strict are more likely to indicate future performance than lenient grades. Lenient grades invalidates grades as selection criteria on job markets (or, as I’m adding grad school).
What has been clearly established:
(1) There has been grade inflation.
What needs better support in the article:
(2) There is grading leniency.
(3) Teachers think that if they grade leniently, they will get better teaching evaluations.
(4) Teachers actually do grade leniently to get better teaching evaluations, and not for other reasons. (Such as thinking that grading more leniently and assigning less work is actually conducive to student learning.)
The paper does a decent job reviewing literature and arguing for their position. However, its main flaw reflects the lack of sufficient evidence to support the claims as fully as they should be. It relies more on intuitive connecting premises and arguments than the data itself presents. Using an argumentative strategy that might be called, “It would be reasonable to think that this supports x and y.” And while this is fine as far as publishing papers go, it’s not sufficient to conclusively support the authors’ contentious claims. At the most, the authors provided 3-4 studies to support each step in their argument, of which 1-2 were usually said by the author to be limited in its support, or merely suggestive. Furthermore, this tenuous support really only supports (2) & (3) above, and not (4). The authors never consider the possibility that grading leniently and assigning less work could in fact be beneficial to student learning not detrimental.
Student Evaluation of Teaching Working Group Report 2020
39
Griffin, T. J., Plummer, K., & Barret, D. (2014). Correlation between grade point averages and student evaluation of teaching scores: taking a closer look. Assessment & Evaluation in Higher Education, 39(3), 339–348. https://doi-org.ezproxy.library.ubc.ca/10.1080/02602938.2013.831809
Description:
The study looked at 2073 general religion education courses at Brigham Young University (BYU), a religious university and found an overall correlation of .37 between student GPA and the evaluation the student gives. When the data were disaggregated by courses taught by individual instructors, the correlations ranged between .21 and .42, showing variability. Most of the disaggregated sample sizes were greater than 200, so are not considered underpowered. Since BYU has a higher than average GPA at admission, the correlation may have been attenuated by range restriction.
Kalender, İ. (2015). Measurement invariance of student evaluation of teaching across groups defined by course-related variables. International Online Journal of Educational Sciences, 7(4), 69-79.
The study tested if “measurement invariance” holds for the 10-item teaching evaluations used in the Ihsan Dogramaci Bilkent University in Turkey, based on the 625 courses from the 20388 students (undergrad + grad students) enrolled.
Measurement invariance basically means if the test (here the teaching evaluation) behaves the same way across multiple groups. “Behaving the same” means 1) measuring the same latent variables, 2) measuring them to the same degrees (i.e. same factor loadings), and 3) measuring them to the same error terms (same level of unpredicted randomness).
Fulfilling condition 1) is called configural invariance.
Fulfilling conditions 1) + 2) is called weak invariance.
Fulfilling condition 1) + 2) + 3) is called strong invariance.
The authors tested all three of types of invariance, across the following factors students grade level (1st year, 2nd year, 3rd year and 4th year), course type (mandatory for undergrads, electives for undergrads and mandatory for grads), and credits (2-3 or 4-5).
The questionnaire used had the ten 5-point Likert-type items: (i) The instructor clearly stated course objectives and expectations from students (expectations), (ii) The instructor stimulated interest in the subject (interest), (iii) The instructor was able to promote effective student participation in class (participation), (iv) The instructor helped develop analytical, scientific, critical, creative, and independent thinking abilities in students (thinking), (v) The instructor interacts with students on a basis of mutual respect (respect), (vi) The instructor was on time and has not missed classes (timing), (vii) The instructor taught the course in English (English), (viii) Rate the instructor's overall teaching effectiveness in this course (effective), (ix) I learned a lot in this course (learnt), and (x) The exams, assignments, and projects required analytical, scientific, critical, and creative thinking (assessment).
After the Confirmatory Factor Analysis, the timing and English items were deleted (struckthrough).
Then, the main finding was that weak measurement invariance held, i.e. fulling conditions 1 & 2 (see above definitions) given that there is only one latent variable measured. The items measure the same latent variables, to the same degree, across factors studied (year-level, course type, etc.).
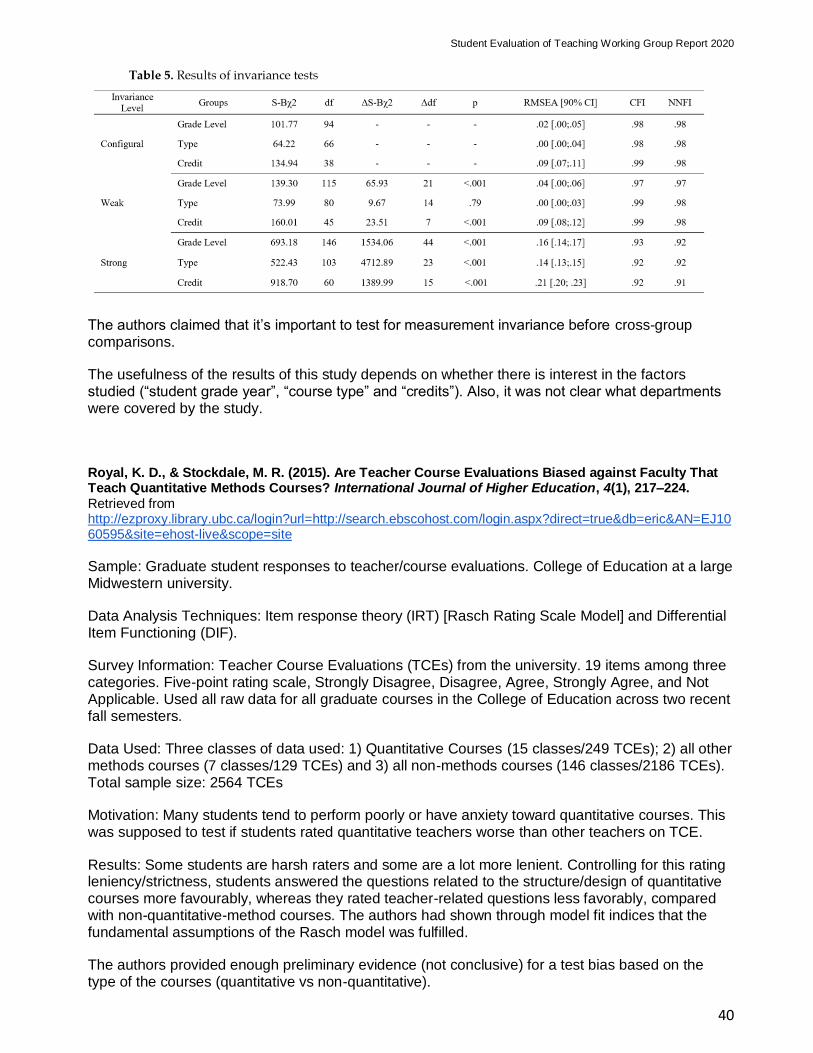
Student Evaluation of Teaching Working Group Report 2020
40
The authors claimed that it’s important to test for measurement invariance before cross-group comparisons.
The usefulness of the results of this study depends on whether there is interest in the factors studied (“student grade year”, “course type” and “credits”). Also, it was not clear what departments were covered by the study.
Royal, K. D., & Stockdale, M. R. (2015). Are Teacher Course Evaluations Biased against Faculty That Teach Quantitative Methods Courses? International Journal of Higher Education, 4(1), 217–224. Retrieved from http://ezproxy.library.ubc.ca/login?url=http://search.ebscohost.com/login.aspx?direct=true&db=eric&AN=EJ1060595&site=ehost-live&scope=site
Sample: Graduate student responses to teacher/course evaluations. College of Education at a large Midwestern university.
Data Analysis Techniques: Item response theory (IRT) [Rasch Rating Scale Model] and Differential Item Functioning (DIF).
Survey Information: Teacher Course Evaluations (TCEs) from the university. 19 items among three categories. Five-point rating scale, Strongly Disagree, Disagree, Agree, Strongly Agree, and Not Applicable. Used all raw data for all graduate courses in the College of Education across two recent fall semesters.
Data Used: Three classes of data used: 1) Quantitative Courses (15 classes/249 TCEs); 2) all other methods courses (7 classes/129 TCEs) and 3) all non-methods courses (146 classes/2186 TCEs). Total sample size: 2564 TCEs
Motivation: Many students tend to perform poorly or have anxiety toward quantitative courses. This was supposed to test if students rated quantitative teachers worse than other teachers on TCE.
Results: Some students are harsh raters and some are a lot more lenient. Controlling for this rating leniency/strictness, students answered the questions related to the structure/design of quantitative courses more favourably, whereas they rated teacher-related questions less favorably, compared with non-quantitative-method courses. The authors had shown through model fit indices that the fundamental assumptions of the Rasch model was fulfilled.
The authors provided enough preliminary evidence (not conclusive) for a test bias based on the type of the courses (quantitative vs non-quantitative).
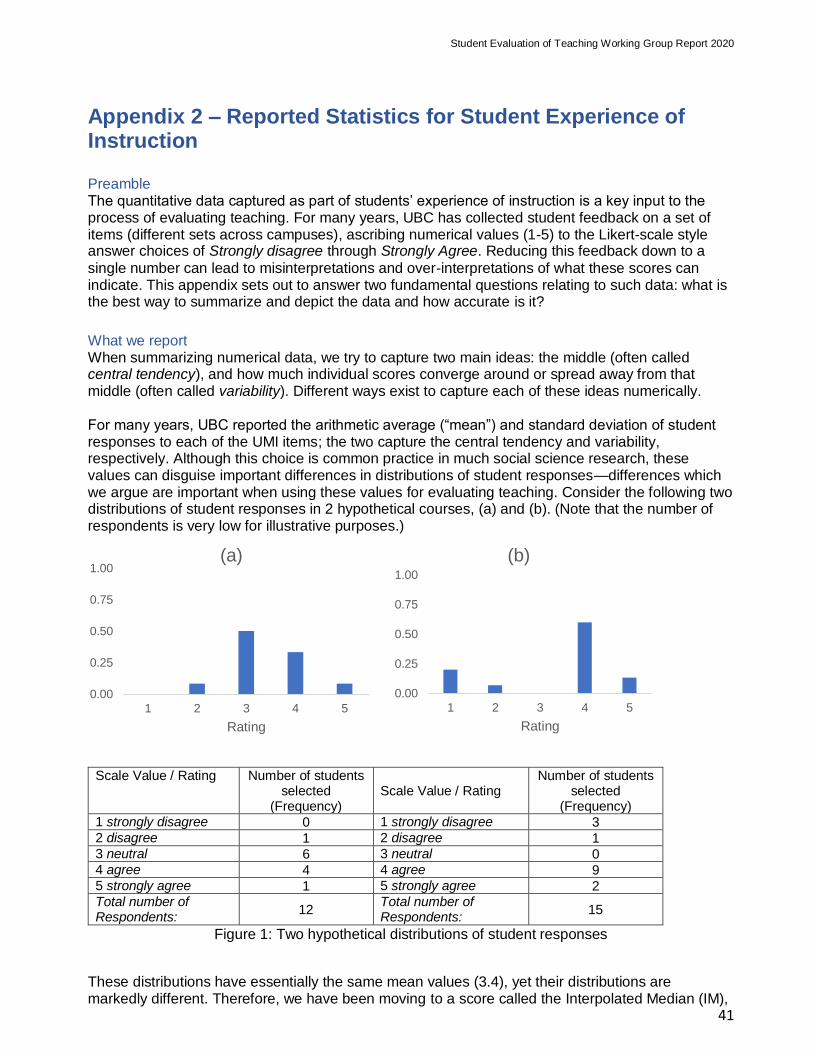
Student Evaluation of Teaching Working Group Report 2020
41
Appendix 2 – Reported Statistics for Student Experience of Instruction
Preamble The quantitative data captured as part of students’ experience of instruction is a key input to the process of evaluating teaching. For many years, UBC has collected student feedback on a set of items (different sets across campuses), ascribing numerical values (1-5) to the Likert-scale style answer choices of Strongly disagree through Strongly Agree. Reducing this feedback down to a
single number can lead to misinterpretations and over-interpretations of what these scores can indicate. This appendix sets out to answer two fundamental questions relating to such data: what is the best way to summarize and depict the data and how accurate is it?
What we report When summarizing numerical data, we try to capture two main ideas: the middle (often called central tendency), and how much individual scores converge around or spread away from that middle (often called variability). Different ways exist to capture each of these ideas numerically. For many years, UBC reported the arithmetic average (“mean”) and standard deviation of student responses to each of the UMI items; the two capture the central tendency and variability, respectively. Although this choice is common practice in much social science research, these values can disguise important differences in distributions of student responses—differences which we argue are important when using these values for evaluating teaching. Consider the following two distributions of student responses in 2 hypothetical courses, (a) and (b). (Note that the number of respondents is very low for illustrative purposes.)
Scale Value / Rating Number of students
selected (Frequency)
Scale Value / Rating Number of students
selected (Frequency)
1 strongly disagree 0 1 strongly disagree 3 2 disagree 1 2 disagree 1 3 neutral 6 3 neutral 0 4 agree 4 4 agree 9 5 strongly agree 1 5 strongly agree 2 Total number of Respondents:
12 Total number of Respondents:
15
Figure 1: Two hypothetical distributions of student responses
These distributions have essentially the same mean values (3.4), yet their distributions are markedly different. Therefore, we have been moving to a score called the Interpolated Median (IM),
0.00
0.25
0.50
0.75
1.00
1 2 3 4 5
Rating
(a)
0.00
0.25
0.50
0.75
1.00
1 2 3 4 5
Rating
(b)
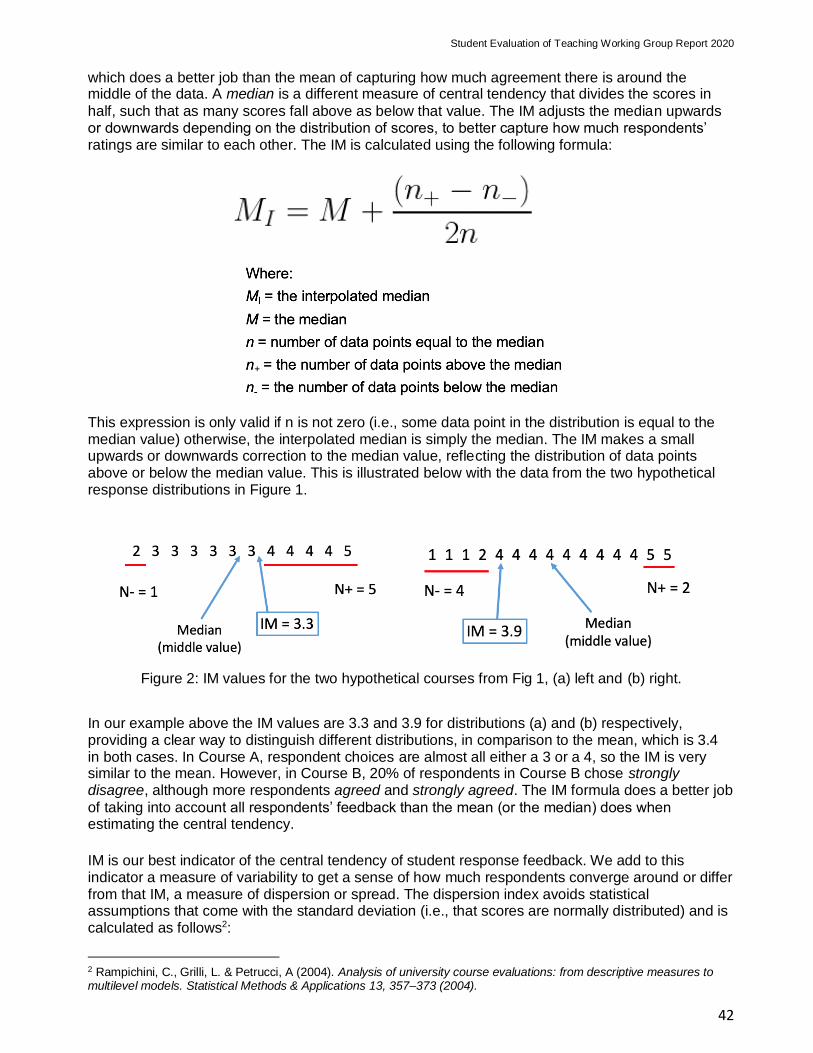
Student Evaluation of Teaching Working Group Report 2020
42
which does a better job than the mean of capturing how much agreement there is around the middle of the data. A median is a different measure of central tendency that divides the scores in
half, such that as many scores fall above as below that value. The IM adjusts the median upwards or downwards depending on the distribution of scores, to better capture how much respondents’ ratings are similar to each other. The IM is calculated using the following formula:
This expression is only valid if n is not zero (i.e., some data point in the distribution is equal to the median value) otherwise, the interpolated median is simply the median. The IM makes a small upwards or downwards correction to the median value, reflecting the distribution of data points above or below the median value. This is illustrated below with the data from the two hypothetical response distributions in Figure 1.
Figure 2: IM values for the two hypothetical courses from Fig 1, (a) left and (b) right.
In our example above the IM values are 3.3 and 3.9 for distributions (a) and (b) respectively, providing a clear way to distinguish different distributions, in comparison to the mean, which is 3.4 in both cases. In Course A, respondent choices are almost all either a 3 or a 4, so the IM is very similar to the mean. However, in Course B, 20% of respondents in Course B chose strongly disagree, although more respondents agreed and strongly agreed. The IM formula does a better job
of taking into account all respondents’ feedback than the mean (or the median) does when estimating the central tendency.
IM is our best indicator of the central tendency of student response feedback. We add to this indicator a measure of variability to get a sense of how much respondents converge around or differ from that IM, a measure of dispersion or spread. The dispersion index avoids statistical assumptions that come with the standard deviation (i.e., that scores are normally distributed) and is calculated as follows2:
2 Rampichini, C., Grilli, L. & Petrucci, A (2004). Analysis of university course evaluations: from descriptive measures to multilevel models. Statistical Methods & Applications 13, 357–373 (2004).

Student Evaluation of Teaching Working Group Report 2020
43
𝐷 = ∑ 𝐹𝑘(1 − 𝐹𝑘), 0 ≤ 𝐷 ≤𝐾 − 1
4,
𝐾−1
𝑘=1
𝐷 is the dispersion index, 𝑘 = 1, 2…, 𝐾 are the categories of possible responses for each question,
and 𝐹𝑘 is the relative cumulative distribution function of the responses. As our questions have five possible responses (K = 5), the dispersion index can range from 0 to 1). A dispersion index of zero
indicates that all students in the section gave the same rating to the instructor, whereas 1 is obtained when the class splits evenly between the two extreme values (Strongly Disagree & Strongly Agree). In UBC data, the dispersion index rarely exceeds 0.7; much more common is that
respondents are closer in agreement with each other. Table 1 shows an example of variability in instructor rating using real data: from the 2018W UMI5 responses (Vancouver data). The columns of data represent different possible ranges of the dispersion index, whilst the rows are possible values of the IM (4.5-5.0 for the top row, 4.0-4.49 for the second and so on). The percentages in brackets are the percent favorable ratings, the percentage of students choosing Agree or Strongly Agree, which we discuss further below. The
color shading shows different regions of range of percentage agree values (above 85% dark green, mid green above 65% and so on) as a guide to the eye. The vast majority of all evaluations fall within IM 3.5-5.0 and a dispersion somewhere between 0 and 0.55 (the upper 3 rows of the table). Table 1: Sample of variability in instructor ratings: 2018W UMI 5 evaluations meeting minimum recommended response rate (see below). UBC Vancouver data.
An additional value that can be useful for interpretation purposes is the percentage of respondents who responded favorably to a given question (defined as choosing Agree or Strongly Agree, 4 or 5, and summarized as percentage agree, or PA). Recall our example above of Course A and Course
B, scenarios that depict very different response distributions yet with the same mean. Course A has a PA value of 42% (because so many people chose neutral), whereas Course B has a PA value of 73% (which importantly contextualizes the IM; although a subgroup chose strongly disagree, the
majority responded favorably).
Variability in Instructor Rating (dispersion index) 0 < 0.2 0.2 - 0.3 0.3 - 0.4 0.4 -0.55 0.55-0.70 0.7-0.85 > 0.85 Total
IMedian Number of Evaluations (% Favourable Rating in Parenthesis)
4.5 – 5.0 87
(100%) 510
(99%) 854
(97%) 616
(90%) 193
(84%) 15
(74%) 2
(66%)
2,277
4.0 – 4.49
6
(97%) 209
(95%) 658
(87%) 617
(79%) 70
(72%) 3
(68%)
1,563
3.5 – 3.99
5 (77%)
23 (73%)
93 (68%)
415 (64%)
156 (59%)
20 (54%)
1 (50%)
713
3.0 – 3.49
1
(21%) 11
(41%) 53
(42%) 70
(42%) 11
(42%)
146
< 3.0 1
(0%) 8
(20%) 24
(26%) 2
(29%)
35
4,734

Student Evaluation of Teaching Working Group Report 2020
44
The metrics of IM and PA are associated with each other. In general, when half the respondents disagree (1+2) and the other half agree (4+5, PA of 50%), the resulting IM is 3.53. Taken together,
they provide a useful visual combination that capture elements of centrality and distribution, as shown in Figure 3 below which uses all the data from Table 1.
Figure 3: Percent favorable rating (PA - percent of respondents choosing Agree or Strongly Agree,
4 or 5) versus interpolated median for data in Table 1
The ‘hinge point’ at IM=3.5 and PA=50% can clearly be seen, and no data can fall in the top left or bottom right regions. Comparing this graph to the data in Table 1 illustrates that the first three rows of Table 1 correspond to the data points in the upper right quadrant of this graph: when responses indicate PA of 50% or higher, the IM is greater than 3.5. It is worth noting that the vast majority of ratings across courses are favorable. Fully 96% of the 2018W UMI 5 ratings are in the upper right quadrant. The bottom two rows in Table 2 correspond to the lower left quadrant in this graph: when responses indicate less than 50% favorable ratings, the IM is less than 3.5. In these cases, we recommend a further investigation into the data. Figure 3 presents nearly 5,000 data points for a huge number of courses. Various versions of this graph can be generated to aid in representing and contextualizing student feedback in different subgroups of courses, for different UMI questions, or for a given instructor representing their feedback over time and courses. Figures 4-7 offer examples from both campuses.
3 There is one exception to this rule, but it is rare and tends to occur in small classes that don’t meet the minimum response rates.
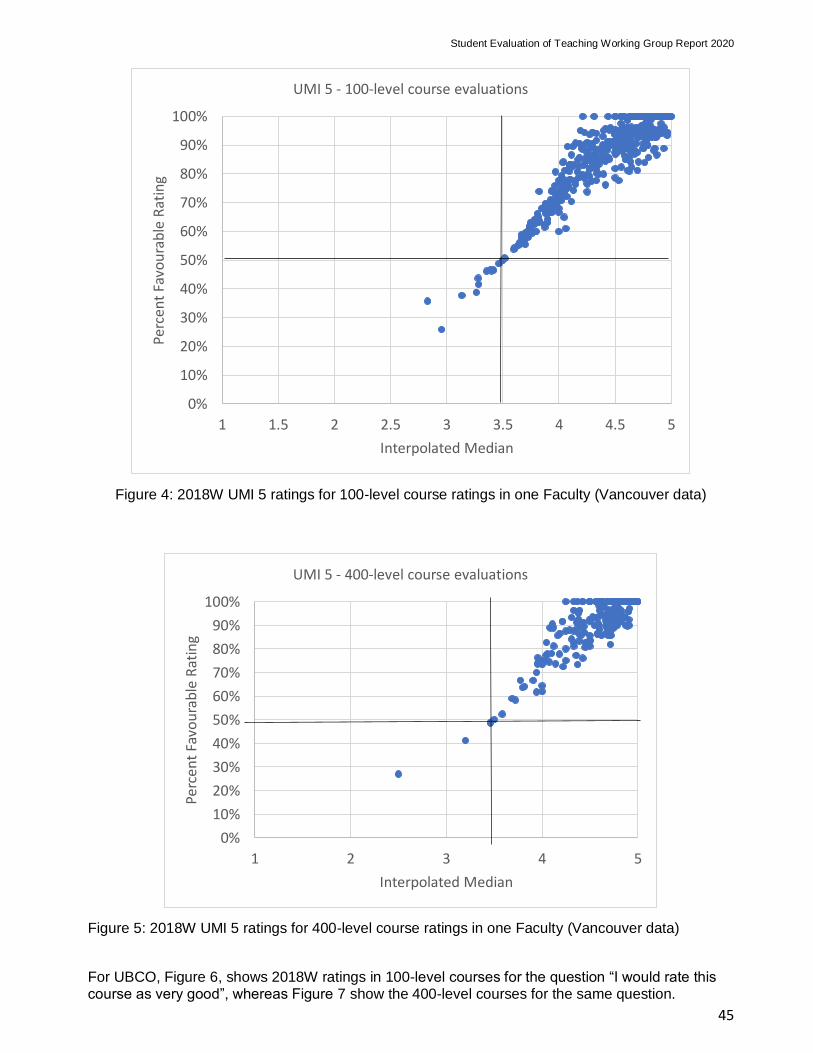
Student Evaluation of Teaching Working Group Report 2020
45
Figure 4: 2018W UMI 5 ratings for 100-level course ratings in one Faculty (Vancouver data)
Figure 5: 2018W UMI 5 ratings for 400-level course ratings in one Faculty (Vancouver data)
For UBCO, Figure 6, shows 2018W ratings in 100-level courses for the question “I would rate this course as very good”, whereas Figure 7 show the 400-level courses for the same question.
0%
10%
20%
30%
40%
50%
60%
70%
80%
90%
100%
1 1.5 2 2.5 3 3.5 4 4.5 5
Perc
ent
Favo
ura
ble
Rat
ing
Interpolated Median
UMI 5 - 100-level course evaluations
0%
10%
20%
30%
40%
50%
60%
70%
80%
90%
100%
1 2 3 4 5
Perc
ent
Favo
ura
ble
Rat
ing
Interpolated Median
UMI 5 - 400-level course evaluations
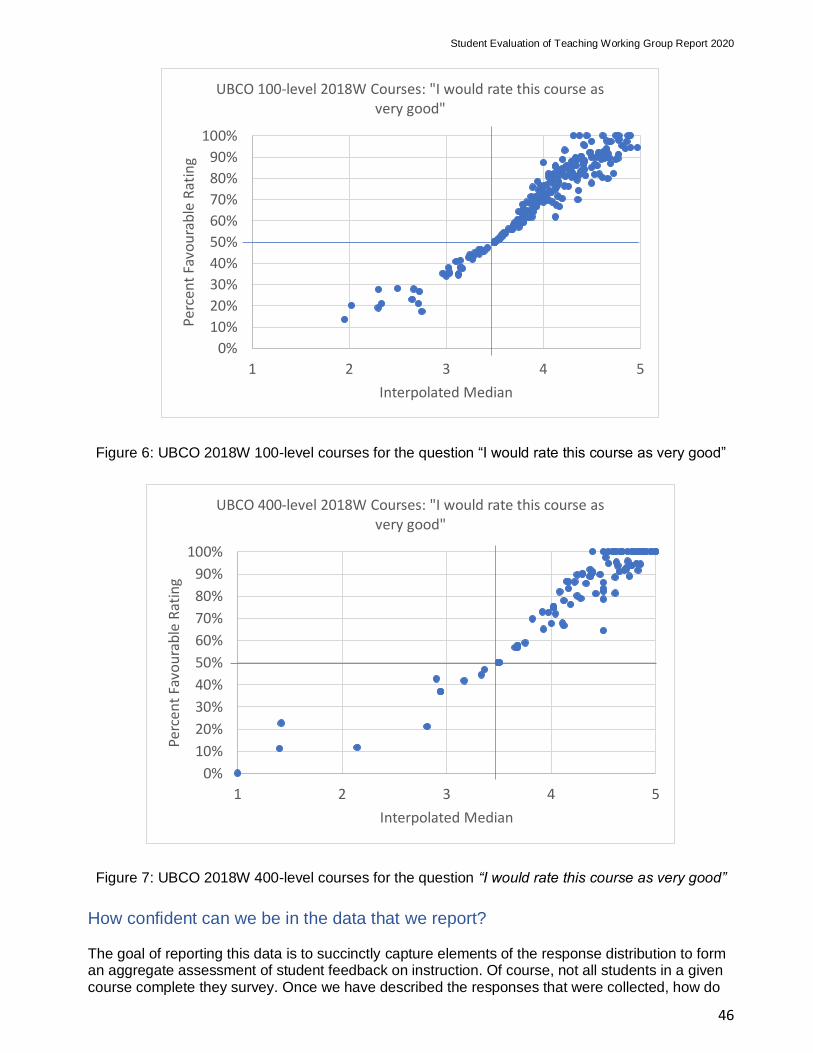
Student Evaluation of Teaching Working Group Report 2020
46
Figure 6: UBCO 2018W 100-level courses for the question “I would rate this course as very good”
Figure 7: UBCO 2018W 400-level courses for the question “I would rate this course as very good”
How confident can we be in the data that we report? The goal of reporting this data is to succinctly capture elements of the response distribution to form an aggregate assessment of student feedback on instruction. Of course, not all students in a given course complete they survey. Once we have described the responses that were collected, how do
0%
10%
20%
30%
40%
50%
60%
70%
80%
90%
100%
1 2 3 4 5
Perc
ent
Favo
ura
ble
Rat
ing
Interpolated Median
UBCO 100-level 2018W Courses: "I would rate this course as very good"
0%
10%
20%
30%
40%
50%
60%
70%
80%
90%
100%
1 2 3 4 5
Perc
ent
Favo
ura
ble
Rat
ing
Interpolated Median
UBCO 400-level 2018W Courses: "I would rate this course as very good"

Student Evaluation of Teaching Working Group Report 2020
47
we understand those responses relative to the whole class, including those who did not respond? How confident can we be in drawing conclusions or inferences from the data? There are many potential sources that limit this confidence: the bottom line is that survey data does not represent some ‘absolute truth’, is never completely free from error and should never be interpreted as such. One variable that we have investigated is response rates: what rates are needed in what size of class and how confident can we be in the aggregate data derived from the responses? Two key factors that influence what the minimum response rates should be for a given class are the confidence level we desire to have in the data and its margin of error. Historically at UBC, we have adopted a confidence level of 80% with a 10% margin of error for SEoT responses. The calculated minimum response rates, based on the underlying variability of historical UBC data, for 80% confidence and 10% margin of error are shown in the table below, as a function of class size4. In the case of a distribution of responses that have a PA of 70%, that meet the minimum response rates for this confidence level and margin of error, means that the PA is estimated to be between 63% and 77% (+/- 10% of 70), 8 times out of 10. Table 2: Recommended minimum response rates as a function of class size.
Class Size Recommended Minimum Response Rates based on 80% confidence & ± 10% margin
< 10 75%
11 - 19 65%
20 - 34 55%
35 - 49 40%
50 - 74 35%
75 - 99 25%
100 - 149 20%
150 - 299 15%
300 - 499 10%
> 500 5%
If the feedback survey for a class of, for example, 60 students, fails to meet a response rate of 35%, it means that we can expect a lower confidence and larger error in the measurement and it should be interpreted as such, as part of a series of such measurements, over time and across courses.
4 Zumrawi, A., Bates, S. & Schroeder, M (2014). What response rates are needed to make reliable inferences from student evaluations of teaching? Educational Research and Evaluation: An International Journal on Theory and Practice, 20:7-8, 557-563

Student Evaluation of Teaching Working Group Report 2020
48
Appendix 3 – Gender Bias Studies at UBC
Executive Summary Gender Bias Studies at UBC Vancouver The question of gender bias first arose in a 2008 town hall. Dr. Ralph Hakstian (emeritus)
undertook a study to examine the effects of instructor gender, student-respondent gender and field of study on University Module Items (UMI) ratings, based on 2008-2009 data. The study controlled for the effects of class size and average course grade, and found a statistically significant interaction between student-respondent gender and instructor gender, for some but not all UMIs. In these cases, the female instructor mean rating was significantly higher than that of male instructors, when the ratings were those of female student-respondents. However, the difference of 0.14, though statistically significant, is not practically meaningful. The corresponding difference between the instructor genders was non-significant when the ratings were those of male student respondents. In 2015, the 2009 study was replicated using 2014-2015 data. In this study, the “Field of Study” was found to be the most significant factor in most UMI question analyses. The overall trends in UMI ratings for all tested main effects (field of study, instructor gender and student gender) and their interactions were comparable to those found in 2009. However, some of the significant interactions reported in 2009 (though trending in the same direction) were not statistically significant. For some UMIs, male students rated their instructors higher than female student-respondents. However, the effect size was negligible (<1%), though statistically significant. Gender Bias Studies at UBC Okanagan In 2017, the Okanagan Planning and Institutional Research undertook a gender analysis of the Student Evaluations of Teaching (SEoT), using data from the 2015/2016 academic year. The objective of the study was to investigate if there are differences between students’ responses to male and female instructors. The study examined all 19 UBCO instructor and course questions, using differential analysis based on Item Response Theory. Of the 19 SEoT questions, three questions had statistically significant, non-negligible differences between the responses for male and female instructors. In particular, male instructors scored more positive endorsement responses for the questions “I found the course content challenging”, and “The instructor demonstrated a broad knowledge of the subject”, whereas female instructors scored more positive endorsement responses in the question “The textbook and/or assigned readings contributed strongly to this course” A similar analysis was conducted in January 2020, using SEoT data from the 2018W1 and 2018W2 academic terms. This time, only two questions had statistically significant, non-negligible differences between the responses for male and female instructors. Namely, female instructors scored more positive endorsement responses for the question “I found the course content challenging”, whereas male instructors scored more positive responses for the question “The instructor showed enthusiasm for the subject matter”. Overall Remarks Gender studies at both UBC campuses are based on aggregate data analysis; and as such, individual instructor lived experiences may naturally vary. In these studies, instructor gender data is obtained from HRMS and student gender data from SIS, where only binary gender information were available. Data on ethnicity is protected and has not been available. Thus, no ethnic bias studies have been conducted at UBC to date.
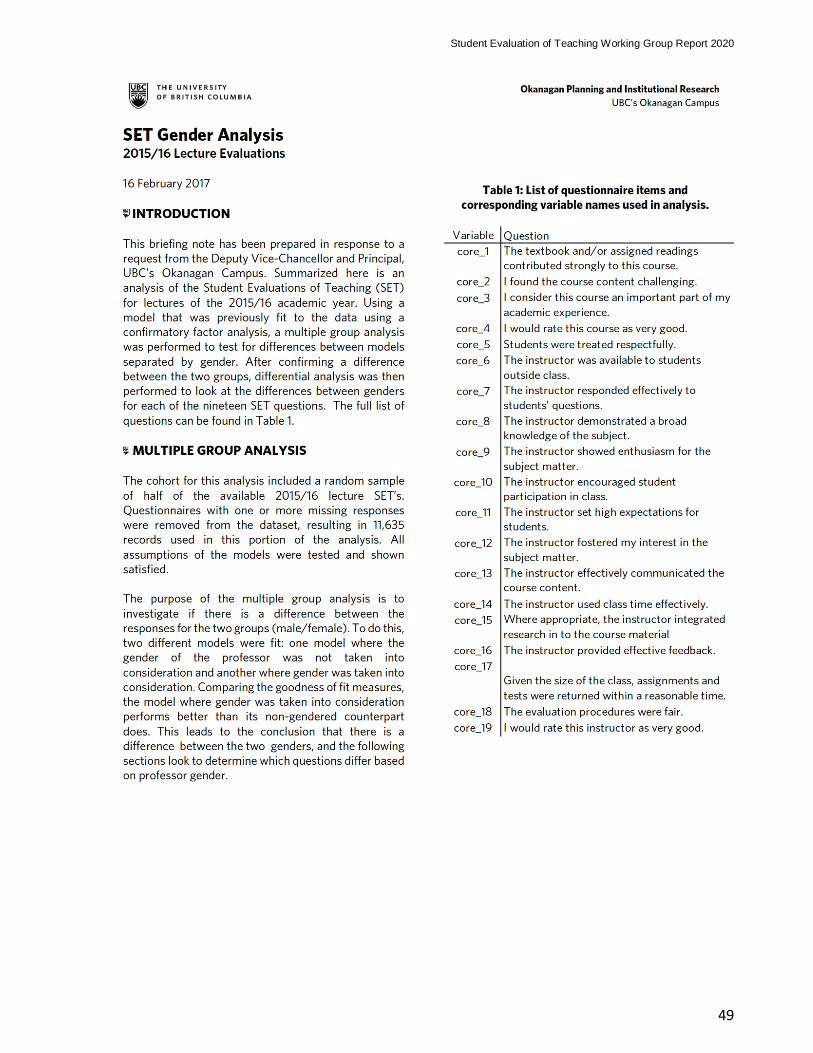
Student Evaluation of Teaching Working Group Report 2020
49
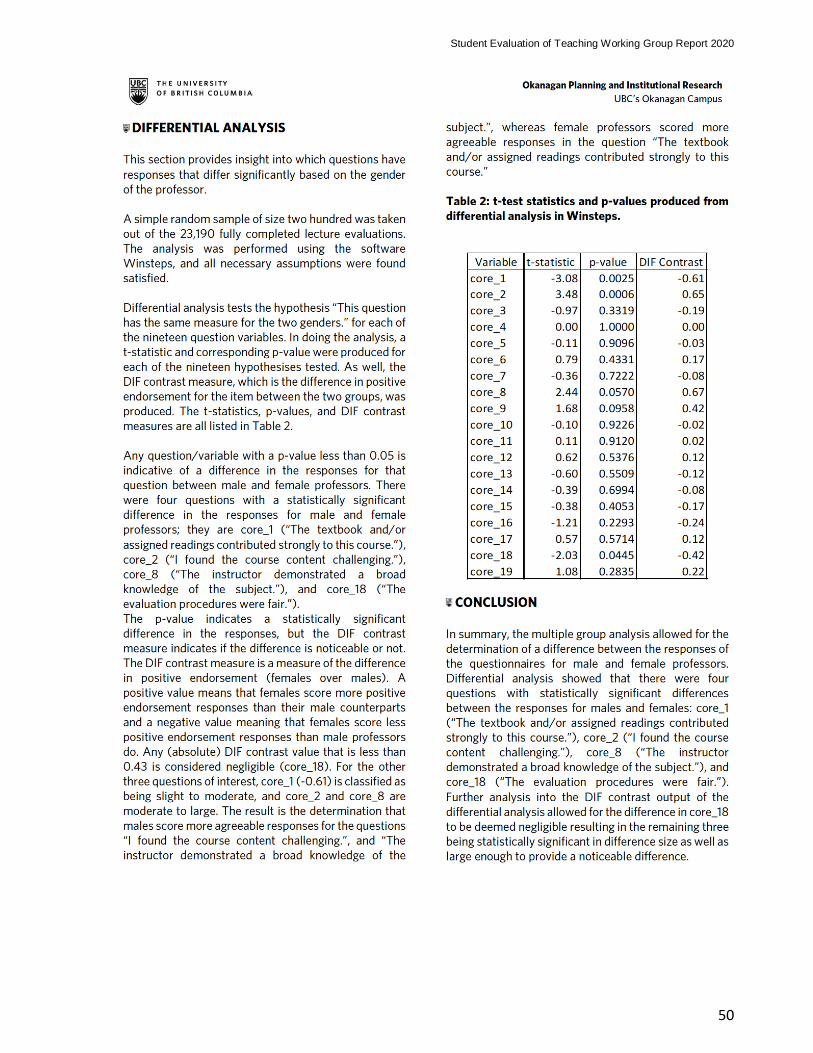
Student Evaluation of Teaching Working Group Report 2020
50
Student Evaluation of Teaching Working Group Report 2020
51
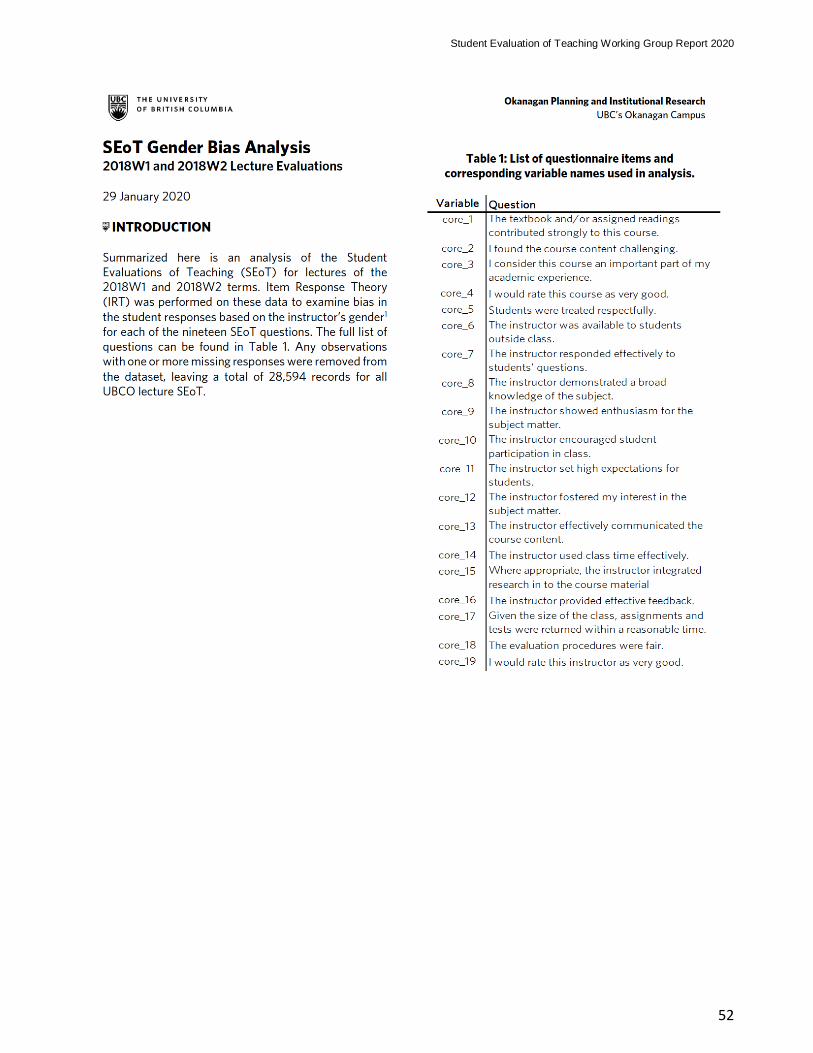
Student Evaluation of Teaching Working Group Report 2020
52
Student Evaluation of Teaching Working Group Report 2020
53
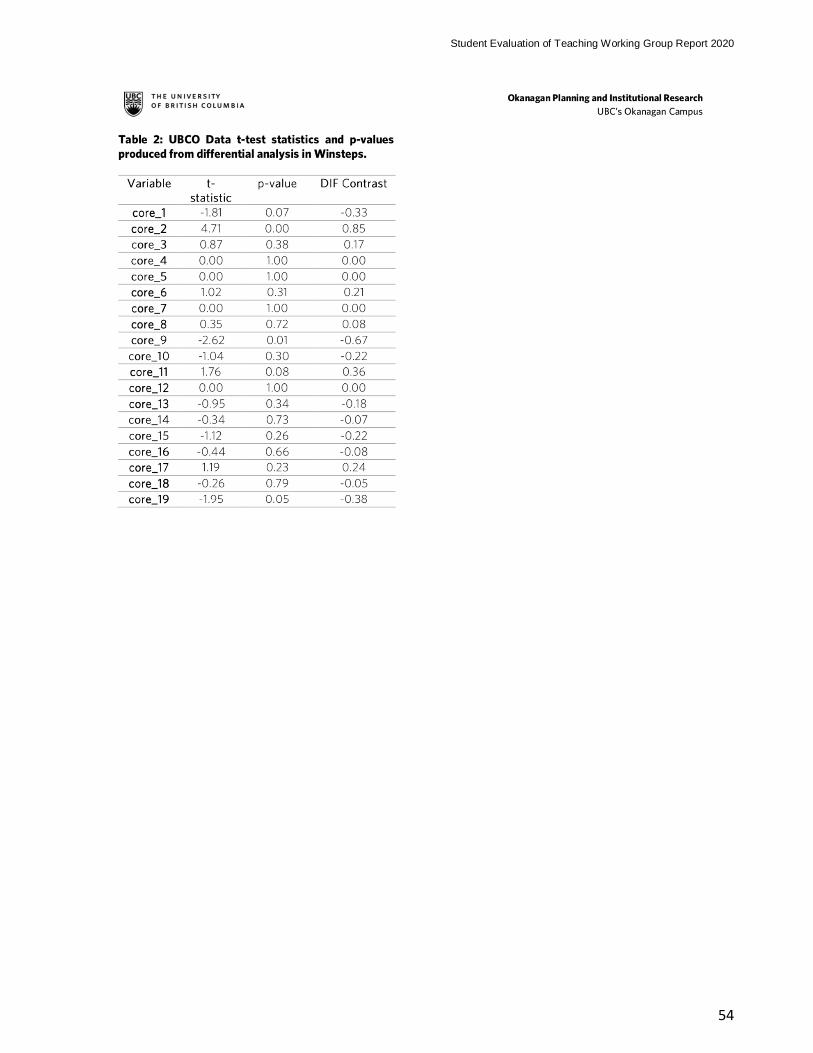
Student Evaluation of Teaching Working Group Report 2020
54
Student Evaluation of Teaching Working Group Report 2020
55
AN INVESTIGATION INTO THE EFFECTS OF INSTRUCTOR GENDER, FIELD OF STUDY, AND
STUDENT-RESPONDENT GENDER ON UMI SCORES IN THE 2008-09 SEOT ADMINISTRATION __________________________________________________________________________
Abstract
The effects on UMI scores of gender of instructor, gender of student respondent,
and field of study were simultaneously examined via a three-‐way analysis of covariance (ANCOVA), incorporating control for any influences on scores arising from class size and mean course grade. A total sample of 519 UBC
instructor/course units from the 2008-‐09 academic year’s offerings was divided into 342 taught by male instructors and 177, by female instructors (roughly replicating the instructor gender proportions at UBC). In addition, these 519 units were divided equally among the Humanities, Social Sciences, and Science, each with 173 instructor/course units. In addition, for each instructor/course unit, mean ratings on each UMI were obtained separately for the male students and female students. With this orthogonal design, seven dependent variables were analyzed—the six UMIs and the average of the six UMIs, taken as an overall aggregated summary measure.
Small instructor-‐gender effects were found for the averaged UMI measure and UMI 6 (the summative item) in favor of female instructors. However, a consistent instructor-‐gender × student-‐respondent gender interaction effect was also
found, and this reduced the interpretability of the instructor-‐gender effects. Analysis of these interactions revealed that, in general, female students tended to rate female instructors significantly more highly than they rated male instructors, but that this effect was not present for male students, who tended to rate male and
female instructors relatively equally. In addition, a small, but significant field-‐of-‐study effect was found with the averaged UMI scores, with mean scores for the Social Sciences significantly higher than those for Science, but this effect too was
compromised by a significant interaction effect involving the student-‐respondent
factor, where it was found that this field-‐of-‐study difference was manifested only in the ratings provided by the female student respondents. With two UMIs analyzed separately, of the Humanities/Social Sciences ratings were significantly higher than the Science means, and this effect was not compromised by interaction, although it was small.
Differences were also found between individual UMIs on the basis of a sample with
all instructor/course units combined (and student-‐respondent gender means aggregated). These differences are discussed, and possible implications for teaching improvement are identified.
Overview
The purpose of this study was to provide information on the effects of gender of both
Instructor and Student-‐Respondent, along with those arising from Field-‐of-‐Study, on responses to our final set of University Module Items (UMIs). The study was based on Student Evaluation of Teaching (SEoT) results obtained, through online administration of
the UMIs, in both terms of the 2008-‐09 academic year. Questions about whether male and female instructors can be expected to be systematically rated differently, whether
male or female student-‐respondents can be expected to give different ratings, and whether ratings obtained in substantively different academic disciplines can be expected
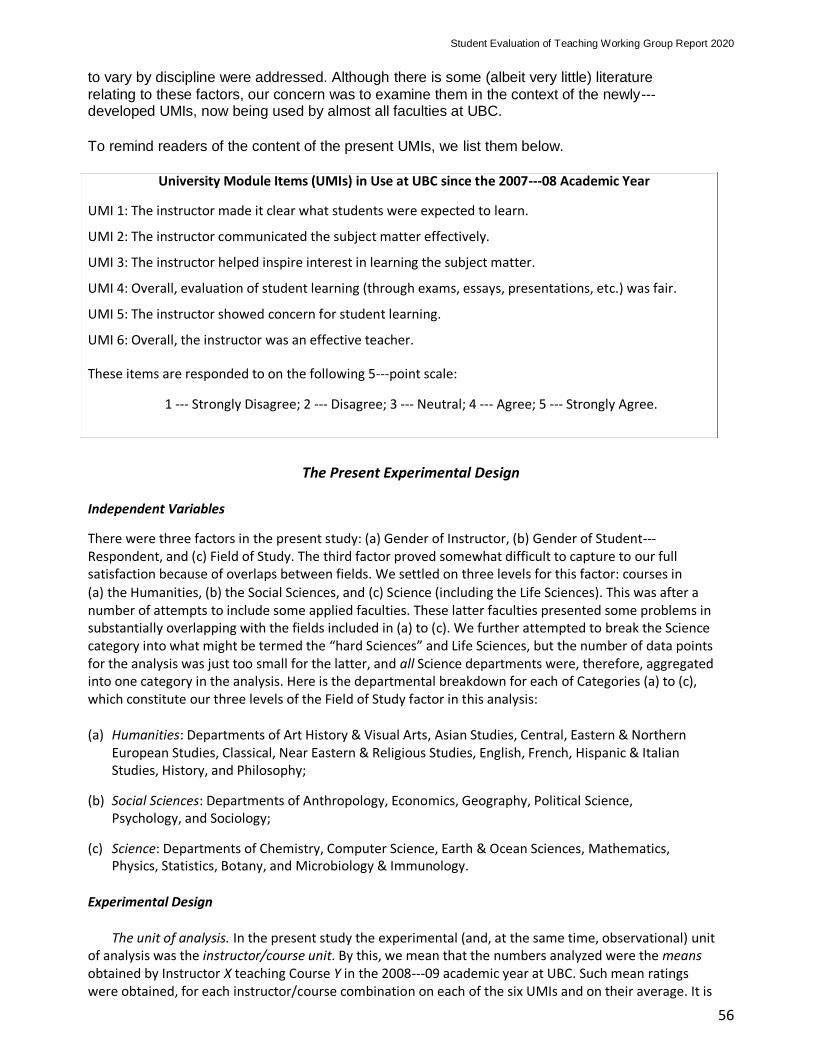
Student Evaluation of Teaching Working Group Report 2020
56
to vary by discipline were addressed. Although there is some (albeit very little) literature
relating to these factors, our concern was to examine them in the context of the newly-‐developed UMIs, now being used by almost all faculties at UBC.
To remind readers of the content of the present UMIs, we list them below.
University Module Items (UMIs) in Use at UBC since the 2007-08 Academic Year UMI 1: The instructor made it clear what students were expected to learn. UMI 2: The instructor communicated the subject matter effectively. UMI 3: The instructor helped inspire interest in learning the subject matter. UMI 4: Overall, evaluation of student learning (through exams, essays, presentations, etc.) was fair. UMI 5: The instructor showed concern for student learning. UMI 6: Overall, the instructor was an effective teacher. These items are responded to on the following 5-point scale:
1 - Strongly Disagree; 2 - Disagree; 3 - Neutral; 4 - Agree; 5 - Strongly Agree.
The Present Experimental Design
Independent Variables There were three factors in the present study: (a) Gender of Instructor, (b) Gender of Student- Respondent, and (c) Field of Study. The third factor proved somewhat difficult to capture to our full satisfaction because of overlaps between fields. We settled on three levels for this factor: courses in (a) the Humanities, (b) the Social Sciences, and (c) Science (including the Life Sciences). This was after a number of attempts to include some applied faculties. These latter faculties presented some problems in substantially overlapping with the fields included in (a) to (c). We further attempted to break the Science category into what might be termed the “hard Sciences” and Life Sciences, but the number of data points for the analysis was just too small for the latter, and all Science departments were, therefore, aggregated into one category in the analysis. Here is the departmental breakdown for each of Categories (a) to (c), which constitute our three levels of the Field of Study factor in this analysis:
(a) Humanities: Departments of Art History & Visual Arts, Asian Studies, Central, Eastern & Northern
European Studies, Classical, Near Eastern & Religious Studies, English, French, Hispanic & Italian Studies, History, and Philosophy;
(b) Social Sciences: Departments of Anthropology, Economics, Geography, Political Science,
Psychology, and Sociology; (c) Science: Departments of Chemistry, Computer Science, Earth & Ocean Sciences, Mathematics,
Physics, Statistics, Botany, and Microbiology & Immunology. Experimental Design
The unit of analysis. In the present study the experimental (and, at the same time, observational) unit
of analysis was the instructor/course unit. By this, we mean that the numbers analyzed were the means obtained by Instructor X teaching Course Y in the 2008-09 academic year at UBC. Such mean ratings were obtained, for each instructor/course combination on each of the six UMIs and on their average. It is
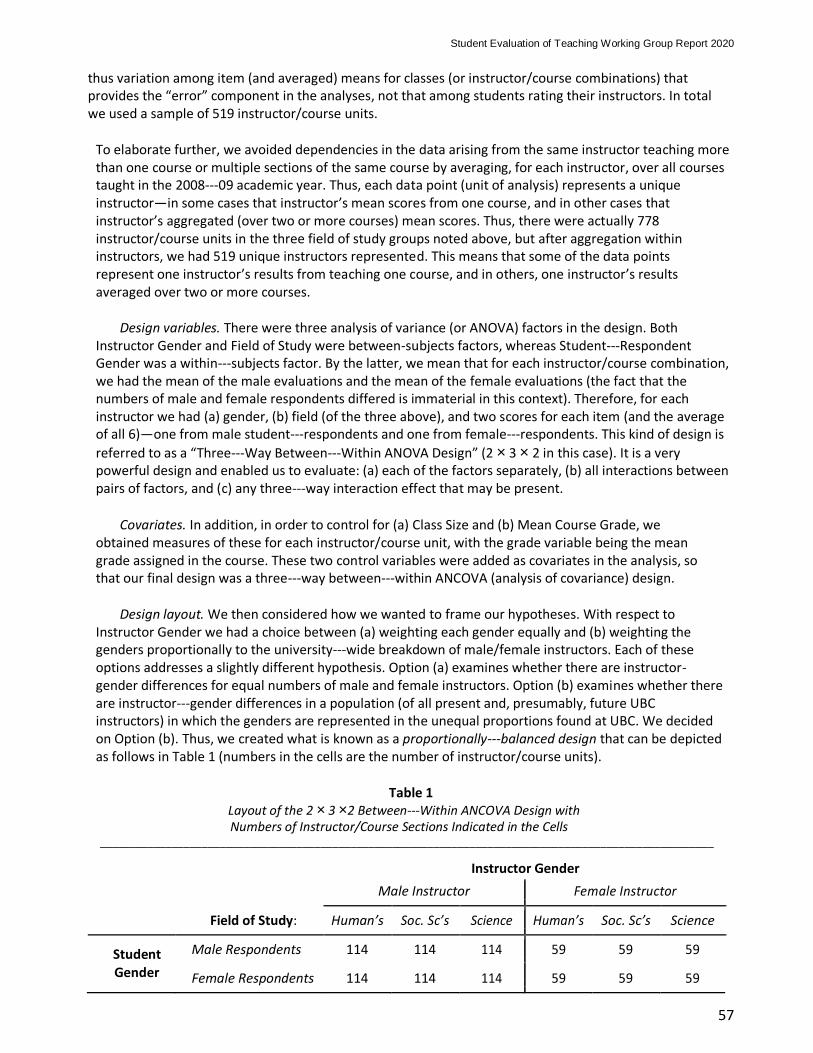
Student Evaluation of Teaching Working Group Report 2020
57
thus variation among item (and averaged) means for classes (or instructor/course combinations) that provides the “error” component in the analyses, not that among students rating their instructors. In total we used a sample of 519 instructor/course units.
To elaborate further, we avoided dependencies in the data arising from the same instructor teaching more than one course or multiple sections of the same course by averaging, for each instructor, over all courses taught in the 2008-09 academic year. Thus, each data point (unit of analysis) represents a unique instructor—in some cases that instructor’s mean scores from one course, and in other cases that instructor’s aggregated (over two or more courses) mean scores. Thus, there were actually 778 instructor/course units in the three field of study groups noted above, but after aggregation within instructors, we had 519 unique instructors represented. This means that some of the data points represent one instructor’s results from teaching one course, and in others, one instructor’s results averaged over two or more courses.
Design variables. There were three analysis of variance (or ANOVA) factors in the design. Both
Instructor Gender and Field of Study were between-subjects factors, whereas Student-Respondent Gender was a within-subjects factor. By the latter, we mean that for each instructor/course combination, we had the mean of the male evaluations and the mean of the female evaluations (the fact that the numbers of male and female respondents differed is immaterial in this context). Therefore, for each instructor we had (a) gender, (b) field (of the three above), and two scores for each item (and the average of all 6)—one from male student-respondents and one from female-respondents. This kind of design is
referred to as a “Three-Way Between-Within ANOVA Design” (2 × 3 × 2 in this case). It is a very powerful design and enabled us to evaluate: (a) each of the factors separately, (b) all interactions between pairs of factors, and (c) any three-way interaction effect that may be present.
Covariates. In addition, in order to control for (a) Class Size and (b) Mean Course Grade, we
obtained measures of these for each instructor/course unit, with the grade variable being the mean grade assigned in the course. These two control variables were added as covariates in the analysis, so that our final design was a three-way between-within ANCOVA (analysis of covariance) design.
Design layout. We then considered how we wanted to frame our hypotheses. With respect to
Instructor Gender we had a choice between (a) weighting each gender equally and (b) weighting the genders proportionally to the university-wide breakdown of male/female instructors. Each of these options addresses a slightly different hypothesis. Option (a) examines whether there are instructor- gender differences for equal numbers of male and female instructors. Option (b) examines whether there are instructor-gender differences in a population (of all present and, presumably, future UBC instructors) in which the genders are represented in the unequal proportions found at UBC. We decided on Option (b). Thus, we created what is known as a proportionally-balanced design that can be depicted as follows in Table 1 (numbers in the cells are the number of instructor/course units).
Table 1
Layout of the 2 × 3 ×2 Between-Within ANCOVA Design with Numbers of Instructor/Course Sections Indicated in the Cells
_______________________________________________________________________________________________________ Instructor Gender
Male Instructor
Female Instructor
Field of Study: Human’s Soc. Sc’s Science Human’s Soc. Sc’s Science
Student Male Respondents 114 114 114 59 59 59
Gender Female Respondents 114 114 114 59 59 59
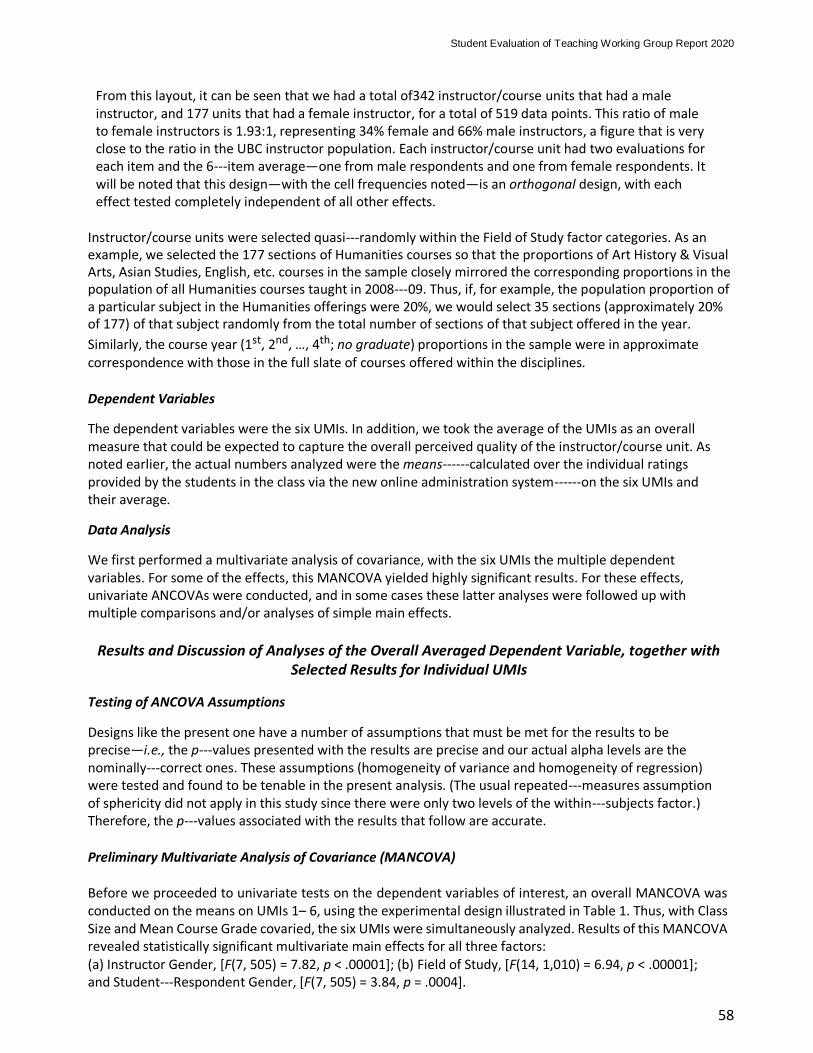
Student Evaluation of Teaching Working Group Report 2020
58
From this layout, it can be seen that we had a total of342 instructor/course units that had a male instructor, and 177 units that had a female instructor, for a total of 519 data points. This ratio of male to female instructors is 1.93:1, representing 34% female and 66% male instructors, a figure that is very close to the ratio in the UBC instructor population. Each instructor/course unit had two evaluations for each item and the 6-item average—one from male respondents and one from female respondents. It will be noted that this design—with the cell frequencies noted—is an orthogonal design, with each effect tested completely independent of all other effects.
Instructor/course units were selected quasi-randomly within the Field of Study factor categories. As an example, we selected the 177 sections of Humanities courses so that the proportions of Art History & Visual Arts, Asian Studies, English, etc. courses in the sample closely mirrored the corresponding proportions in the population of all Humanities courses taught in 2008-09. Thus, if, for example, the population proportion of a particular subject in the Humanities offerings were 20%, we would select 35 sections (approximately 20% of 177) of that subject randomly from the total number of sections of that subject offered in the year.
Similarly, the course year (1st, 2nd, …, 4th; no graduate) proportions in the sample were in approximate correspondence with those in the full slate of courses offered within the disciplines.
Dependent Variables The dependent variables were the six UMIs. In addition, we took the average of the UMIs as an overall measure that could be expected to capture the overall perceived quality of the instructor/course unit. As noted earlier, the actual numbers analyzed were the means--calculated over the individual ratings provided by the students in the class via the new online administration system--on the six UMIs and their average. Data Analysis We first performed a multivariate analysis of covariance, with the six UMIs the multiple dependent variables. For some of the effects, this MANCOVA yielded highly significant results. For these effects, univariate ANCOVAs were conducted, and in some cases these latter analyses were followed up with multiple comparisons and/or analyses of simple main effects.
Results and Discussion of Analyses of the Overall Averaged Dependent Variable, together with Selected Results for Individual UMIs
Testing of ANCOVA Assumptions Designs like the present one have a number of assumptions that must be met for the results to be precise—i.e., the p-values presented with the results are precise and our actual alpha levels are the nominally-correct ones. These assumptions (homogeneity of variance and homogeneity of regression) were tested and found to be tenable in the present analysis. (The usual repeated-measures assumption of sphericity did not apply in this study since there were only two levels of the within-subjects factor.) Therefore, the p-values associated with the results that follow are accurate.
Preliminary Multivariate Analysis of Covariance (MANCOVA)
Before we proceeded to univariate tests on the dependent variables of interest, an overall MANCOVA was conducted on the means on UMIs 1– 6, using the experimental design illustrated in Table 1. Thus, with Class Size and Mean Course Grade covaried, the six UMIs were simultaneously analyzed. Results of this MANCOVA revealed statistically significant multivariate main effects for all three factors: (a) Instructor Gender, [F(7, 505) = 7.82, p < .00001]; (b) Field of Study, [F(14, 1,010) = 6.94, p < .00001]; and Student-Respondent Gender, [F(7, 505) = 3.84, p = .0004].
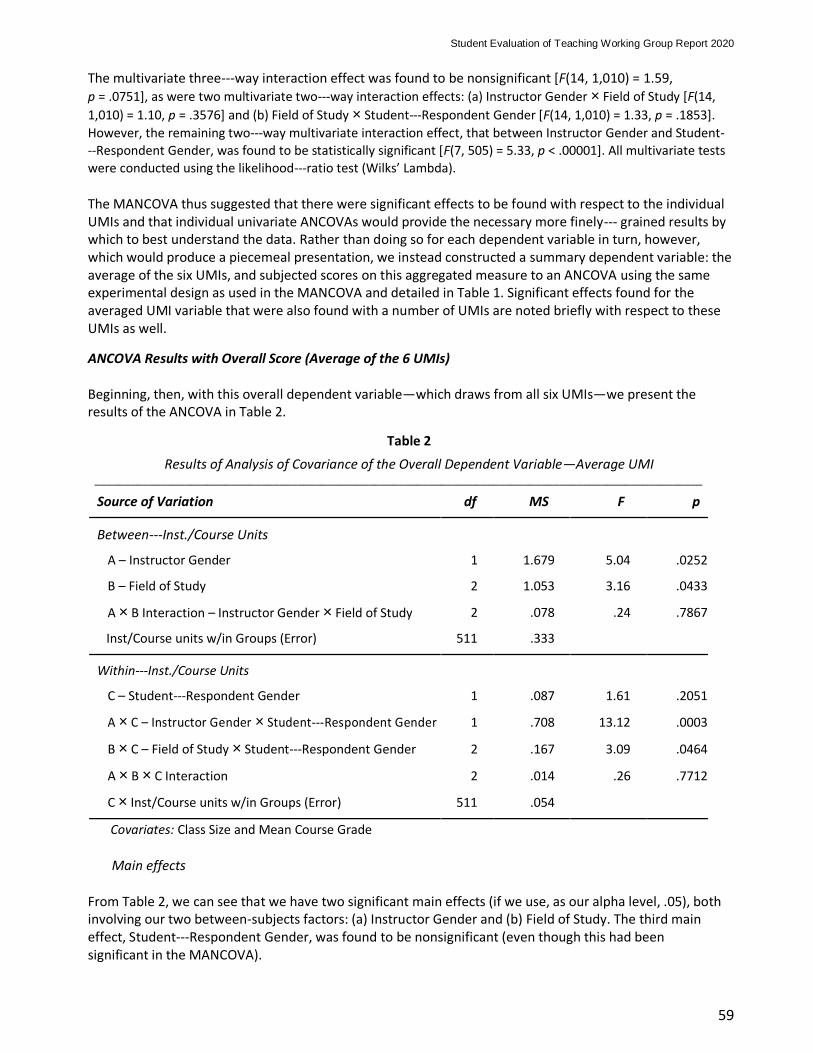
Student Evaluation of Teaching Working Group Report 2020
59
The multivariate three-way interaction effect was found to be nonsignificant [F(14, 1,010) = 1.59, p = .0751], as were two multivariate two-way interaction effects: (a) Instructor Gender × Field of Study [F(14,
1,010) = 1.10, p = .3576] and (b) Field of Study × Student-Respondent Gender [F(14, 1,010) = 1.33, p = .1853].
However, the remaining two-way multivariate interaction effect, that between Instructor Gender and Student-Respondent Gender, was found to be statistically significant [F(7, 505) = 5.33, p < .00001]. All multivariate tests
were conducted using the likelihood-ratio test (Wilks’ Lambda).
The MANCOVA thus suggested that there were significant effects to be found with respect to the individual UMIs and that individual univariate ANCOVAs would provide the necessary more finely- grained results by which to best understand the data. Rather than doing so for each dependent variable in turn, however, which would produce a piecemeal presentation, we instead constructed a summary dependent variable: the average of the six UMIs, and subjected scores on this aggregated measure to an ANCOVA using the same experimental design as used in the MANCOVA and detailed in Table 1. Significant effects found for the averaged UMI variable that were also found with a number of UMIs are noted briefly with respect to these UMIs as well. ANCOVA Results with Overall Score (Average of the 6 UMIs)
Beginning, then, with this overall dependent variable—which draws from all six UMIs—we present the results of the ANCOVA in Table 2.
Table 2
Results of Analysis of Covariance of the Overall Dependent Variable—Average UMI ______________________________________________________________________________________________________
Source of Variation df MS F p
Between-Inst./Course Units
A – Instructor Gender 1 1.679 5.04 .0252
B – Field of Study 2 1.053 3.16 .0433
A × B Interaction – Instructor Gender × Field of Study 2 .078 .24 .7867
Inst/Course units w/in Groups (Error) 511 .333
Within-Inst./Course Units
C – Student-Respondent Gender 1 .087 1.61 .2051
A × C – Instructor Gender × Student-Respondent Gender 1 .708 13.12 .0003
B × C – Field of Study × Student-Respondent Gender 2 .167 3.09 .0464
A × B × C Interaction 2 .014 .26 .7712
C × Inst/Course units w/in Groups (Error) 511 .054
Covariates: Class Size and Mean Course Grade
Main effects
From Table 2, we can see that we have two significant main effects (if we use, as our alpha level, .05), both involving our two between-subjects factors: (a) Instructor Gender and (b) Field of Study. The third main effect, Student-Respondent Gender, was found to be nonsignificant (even though this had been significant in the MANCOVA).
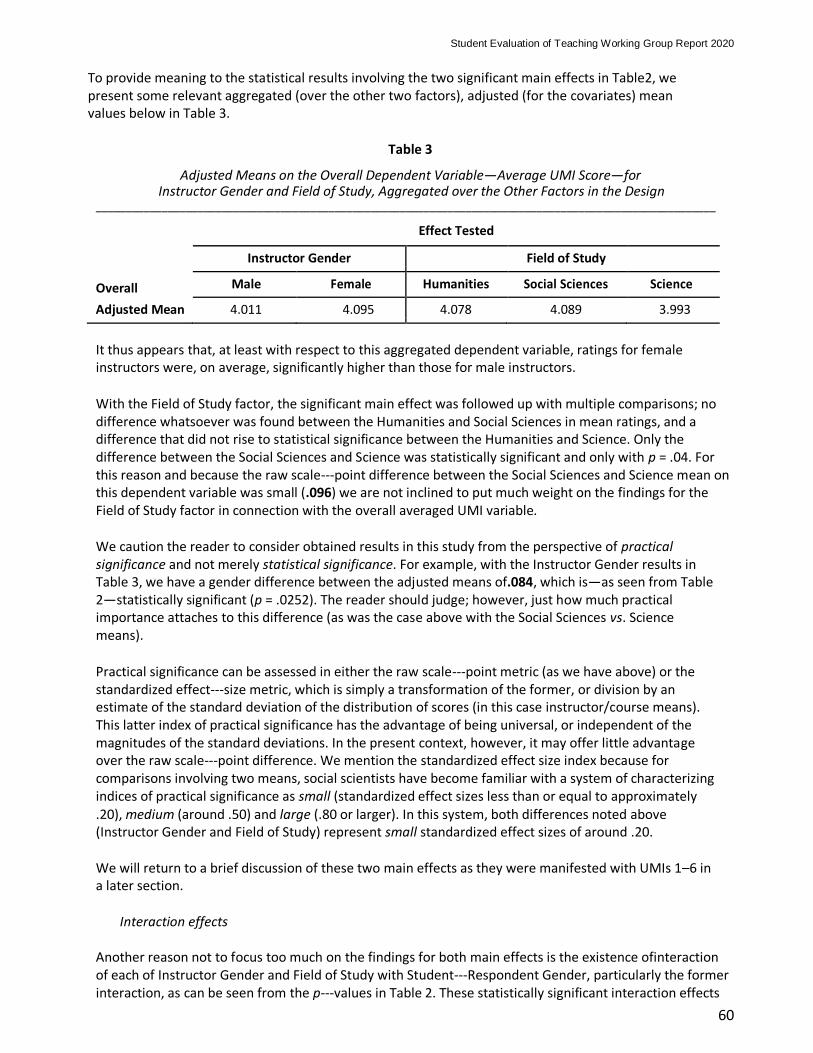
Student Evaluation of Teaching Working Group Report 2020
60
To provide meaning to the statistical results involving the two significant main effects in Table2, we present some relevant aggregated (over the other two factors), adjusted (for the covariates) mean values below in Table 3.
Table 3
Adjusted Means on the Overall Dependent Variable—Average UMI Score—for Instructor Gender and Field of Study, Aggregated over the Other Factors in the Design
________________________________________________________________________________________________________ Effect Tested
Instructor Gender Field of Study
Overall Male Female Humanities Social Sciences Science
Adjusted Mean 4.011 4.095 4.078 4.089 3.993
It thus appears that, at least with respect to this aggregated dependent variable, ratings for female instructors were, on average, significantly higher than those for male instructors.
With the Field of Study factor, the significant main effect was followed up with multiple comparisons; no difference whatsoever was found between the Humanities and Social Sciences in mean ratings, and a difference that did not rise to statistical significance between the Humanities and Science. Only the difference between the Social Sciences and Science was statistically significant and only with p = .04. For this reason and because the raw scale-point difference between the Social Sciences and Science mean on this dependent variable was small (.096) we are not inclined to put much weight on the findings for the Field of Study factor in connection with the overall averaged UMI variable.
We caution the reader to consider obtained results in this study from the perspective of practical significance and not merely statistical significance. For example, with the Instructor Gender results in Table 3, we have a gender difference between the adjusted means of.084, which is—as seen from Table 2—statistically significant (p = .0252). The reader should judge; however, just how much practical importance attaches to this difference (as was the case above with the Social Sciences vs. Science means).
Practical significance can be assessed in either the raw scale-point metric (as we have above) or the standardized effect-size metric, which is simply a transformation of the former, or division by an estimate of the standard deviation of the distribution of scores (in this case instructor/course means). This latter index of practical significance has the advantage of being universal, or independent of the magnitudes of the standard deviations. In the present context, however, it may offer little advantage over the raw scale-point difference. We mention the standardized effect size index because for comparisons involving two means, social scientists have become familiar with a system of characterizing indices of practical significance as small (standardized effect sizes less than or equal to approximately .20), medium (around .50) and large (.80 or larger). In this system, both differences noted above (Instructor Gender and Field of Study) represent small standardized effect sizes of around .20.
We will return to a brief discussion of these two main effects as they were manifested with UMIs 1–6 in a later section.
Interaction effects
Another reason not to focus too much on the findings for both main effects is the existence ofinteraction of each of Instructor Gender and Field of Study with Student-Respondent Gender, particularly the former interaction, as can be seen from the p-values in Table 2. These statistically significant interaction effects
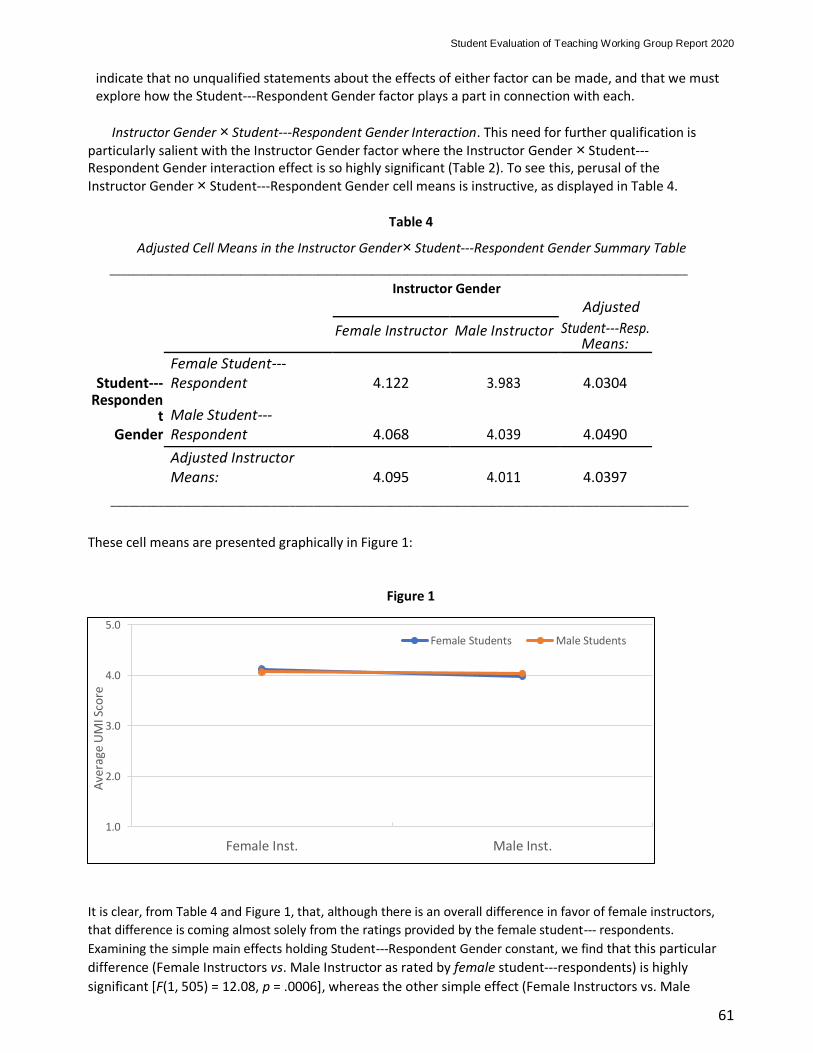
Student Evaluation of Teaching Working Group Report 2020
61
indicate that no unqualified statements about the effects of either factor can be made, and that we must explore how the Student-Respondent Gender factor plays a part in connection with each.
Instructor Gender × Student-Respondent Gender Interaction. This need for further qualification is
particularly salient with the Instructor Gender factor where the Instructor Gender × Student- Respondent Gender interaction effect is so highly significant (Table 2). To see this, perusal of the Instructor Gender × Student-Respondent Gender cell means is instructive, as displayed in Table 4.
Table 4
Adjusted Cell Means in the Instructor Gender× Student-Respondent Gender Summary Table
_________________________________________________________________________________________________ Instructor Gender
Adjusted Female Instructor Male Instructor Student-Resp.
Means:
Student- Female Student-Respondent 4.122 3.983 4.0304
Respondent Male Student-
Respondent 4.068 4.039 4.0490 Gender
Adjusted Instructor Means: 4.095 4.011 4.0397
_________________________________________________________________________________________________
These cell means are presented graphically in Figure 1:
Figure 1
It is clear, from Table 4 and Figure 1, that, although there is an overall difference in favor of female instructors,
that difference is coming almost solely from the ratings provided by the female student- respondents.
Examining the simple main effects holding Student-Respondent Gender constant, we find that this particular
difference (Female Instructors vs. Male Instructor as rated by female student-respondents) is highly
significant [F(1, 505) = 12.08, p = .0006], whereas the other simple effect (Female Instructors vs. Male
1.0
2.0
3.0
4.0
5.0
Female Inst. Male Inst.
Ave
rage
UM
I Sco
re
Female Students Male Students
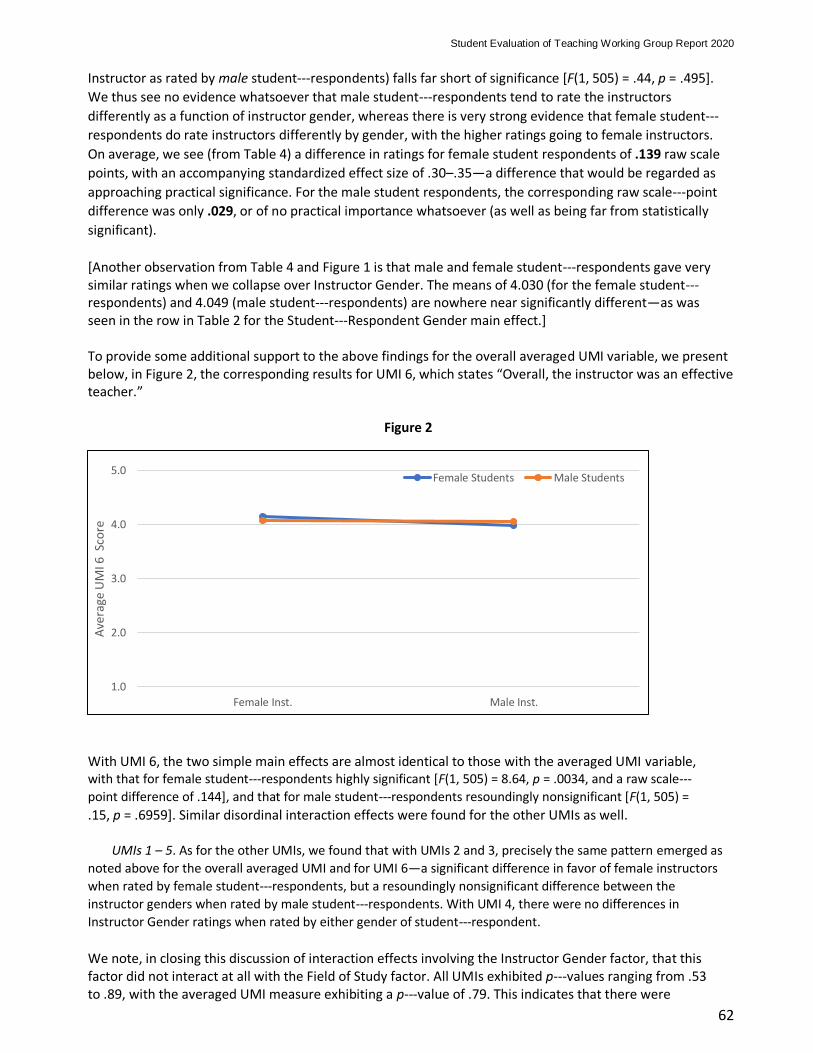
Student Evaluation of Teaching Working Group Report 2020
62
Instructor as rated by male student-respondents) falls far short of significance [F(1, 505) = .44, p = .495].
We thus see no evidence whatsoever that male student-respondents tend to rate the instructors
differently as a function of instructor gender, whereas there is very strong evidence that female student-
respondents do rate instructors differently by gender, with the higher ratings going to female instructors.
On average, we see (from Table 4) a difference in ratings for female student respondents of .139 raw scale
points, with an accompanying standardized effect size of .30–.35—a difference that would be regarded as
approaching practical significance. For the male student respondents, the corresponding raw scale-point
difference was only .029, or of no practical importance whatsoever (as well as being far from statistically
significant).
[Another observation from Table 4 and Figure 1 is that male and female student-respondents gave very similar ratings when we collapse over Instructor Gender. The means of 4.030 (for the female student- respondents) and 4.049 (male student-respondents) are nowhere near significantly different—as was seen in the row in Table 2 for the Student-Respondent Gender main effect.]
To provide some additional support to the above findings for the overall averaged UMI variable, we present below, in Figure 2, the corresponding results for UMI 6, which states “Overall, the instructor was an effective teacher.”
Figure 2
With UMI 6, the two simple main effects are almost identical to those with the averaged UMI variable, with that for female student-respondents highly significant [F(1, 505) = 8.64, p = .0034, and a raw scale- point difference of .144], and that for male student-respondents resoundingly nonsignificant [F(1, 505) = .15, p = .6959]. Similar disordinal interaction effects were found for the other UMIs as well.
UMIs 1 – 5. As for the other UMIs, we found that with UMIs 2 and 3, precisely the same pattern emerged as
noted above for the overall averaged UMI and for UMI 6—a significant difference in favor of female instructors
when rated by female student-respondents, but a resoundingly nonsignificant difference between the
instructor genders when rated by male student-respondents. With UMI 4, there were no differences in
Instructor Gender ratings when rated by either gender of student-respondent.
We note, in closing this discussion of interaction effects involving the Instructor Gender factor, that this factor did not interact at all with the Field of Study factor. All UMIs exhibited p-values ranging from .53 to .89, with the averaged UMI measure exhibiting a p-value of .79. This indicates that there were
1.0
2.0
3.0
4.0
5.0
Female Inst. Male Inst.
Ave
rage
UM
I 6 S
core
Female Students Male Students
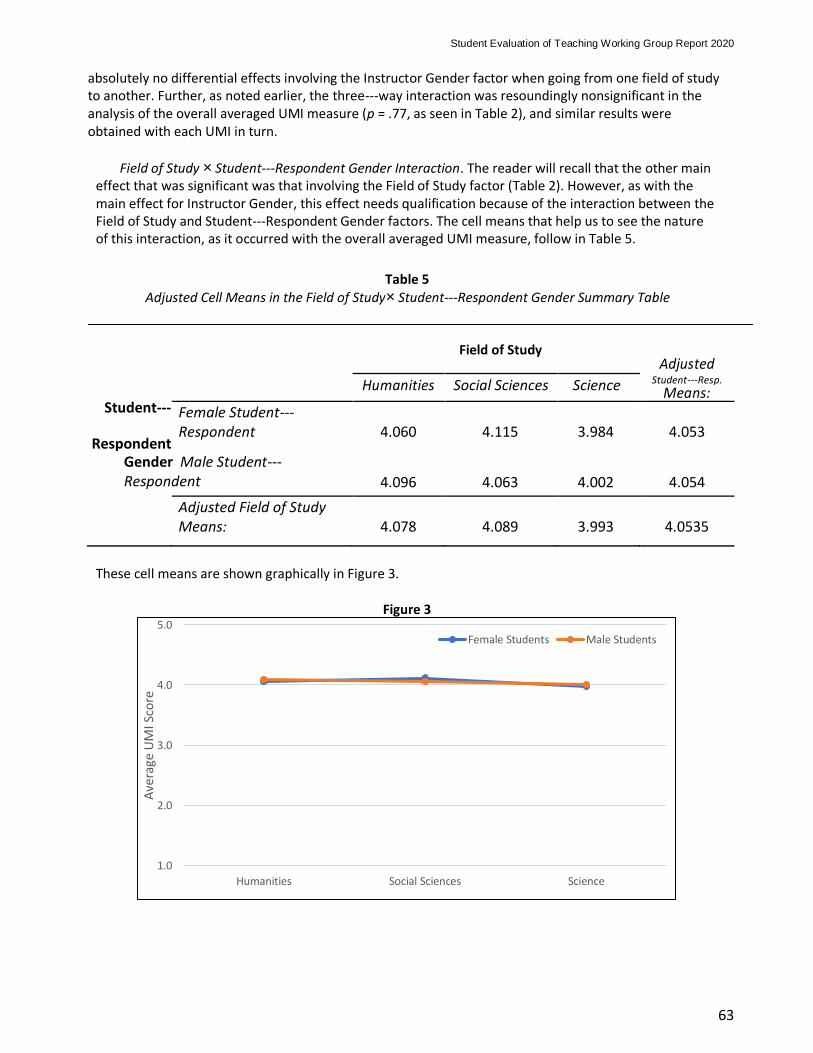
Student Evaluation of Teaching Working Group Report 2020
63
absolutely no differential effects involving the Instructor Gender factor when going from one field of study to another. Further, as noted earlier, the three-way interaction was resoundingly nonsignificant in the analysis of the overall averaged UMI measure (p = .77, as seen in Table 2), and similar results were obtained with each UMI in turn.
Field of Study × Student-Respondent Gender Interaction. The reader will recall that the other main effect that was significant was that involving the Field of Study factor (Table 2). However, as with the main effect for Instructor Gender, this effect needs qualification because of the interaction between the Field of Study and Student-Respondent Gender factors. The cell means that help us to see the nature of this interaction, as it occurred with the overall averaged UMI measure, follow in Table 5.
Table 5 Adjusted Cell Means in the Field of Study× Student-Respondent Gender Summary Table
Field of Study
Adjusted Humanities Social Sciences Science Student-Resp. Means:
Student-
Female Student-Respondent 4.060 4.115 3.984 4.053
Respondent
Gender Male Student-Respondent 4.096 4.063 4.002 4.054
Adjusted Field of Study Means: 4.078 4.089 3.993 4.0535
These cell means are shown graphically in Figure 3.
Figure 3
1.0
2.0
3.0
4.0
5.0
Humanities Social Sciences Science
Ave
rage
UM
I Sco
re
Female Students Male Students
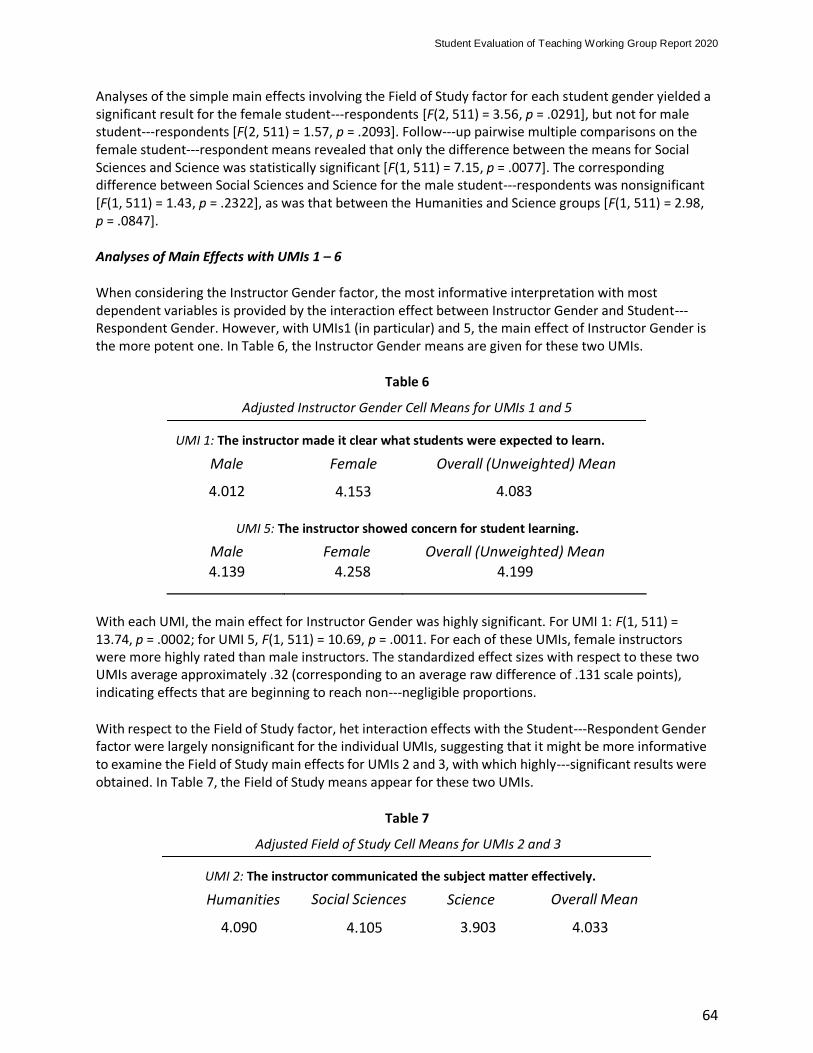
Student Evaluation of Teaching Working Group Report 2020
64
Analyses of the simple main effects involving the Field of Study factor for each student gender yielded a significant result for the female student-respondents [F(2, 511) = 3.56, p = .0291], but not for male student-respondents [F(2, 511) = 1.57, p = .2093]. Follow-up pairwise multiple comparisons on the female student-respondent means revealed that only the difference between the means for Social Sciences and Science was statistically significant [F(1, 511) = 7.15, p = .0077]. The corresponding difference between Social Sciences and Science for the male student-respondents was nonsignificant [F(1, 511) = 1.43, p = .2322], as was that between the Humanities and Science groups [F(1, 511) = 2.98, p = .0847]. Analyses of Main Effects with UMIs 1 – 6
When considering the Instructor Gender factor, the most informative interpretation with most dependent variables is provided by the interaction effect between Instructor Gender and Student- Respondent Gender. However, with UMIs1 (in particular) and 5, the main effect of Instructor Gender is the more potent one. In Table 6, the Instructor Gender means are given for these two UMIs.
Table 6
Adjusted Instructor Gender Cell Means for UMIs 1 and 5
UMI 1: The instructor made it clear what students were expected to learn.
Male Female
Overall (Unweighted) Mean
4.012
4.153
4.083
UMI 5: The instructor showed concern for student learning.
Male Female Overall (Unweighted) Mean
4.139 4.258 4.199
With each UMI, the main effect for Instructor Gender was highly significant. For UMI 1: F(1, 511) = 13.74, p = .0002; for UMI 5, F(1, 511) = 10.69, p = .0011. For each of these UMIs, female instructors were more highly rated than male instructors. The standardized effect sizes with respect to these two UMIs average approximately .32 (corresponding to an average raw difference of .131 scale points), indicating effects that are beginning to reach non-negligible proportions.
With respect to the Field of Study factor, het interaction effects with the Student-Respondent Gender factor were largely nonsignificant for the individual UMIs, suggesting that it might be more informative to examine the Field of Study main effects for UMIs 2 and 3, with which highly-significant results were obtained. In Table 7, the Field of Study means appear for these two UMIs.
Table 7
Adjusted Field of Study Cell Means for UMIs 2 and 3
UMI 2: The instructor communicated the subject matter effectively.
Humanities Social Sciences
Science
Overall Mean
4.090
4.105
3.903
4.033
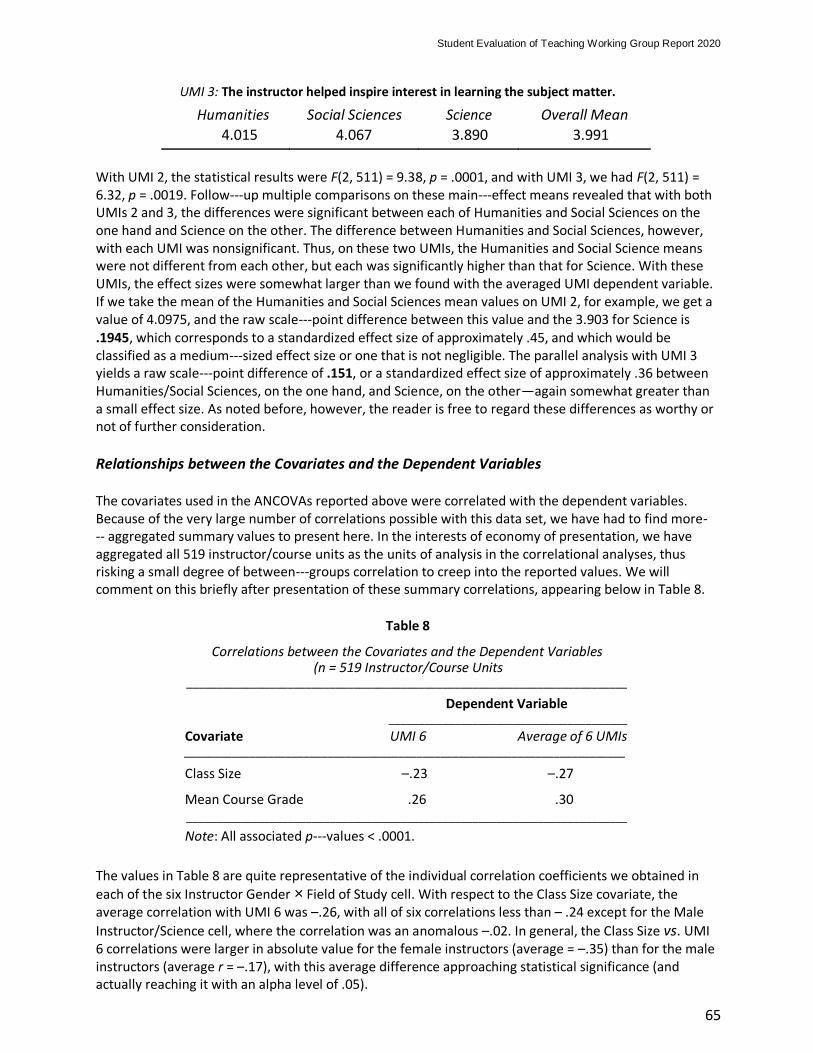
Student Evaluation of Teaching Working Group Report 2020
65
UMI 3: The instructor helped inspire interest in learning the subject matter.
Humanities Social Sciences Science Overall Mean
4.015 4.067 3.890 3.991
With UMI 2, the statistical results were F(2, 511) = 9.38, p = .0001, and with UMI 3, we had F(2, 511) = 6.32, p = .0019. Follow-up multiple comparisons on these main-effect means revealed that with both UMIs 2 and 3, the differences were significant between each of Humanities and Social Sciences on the one hand and Science on the other. The difference between Humanities and Social Sciences, however, with each UMI was nonsignificant. Thus, on these two UMIs, the Humanities and Social Science means were not different from each other, but each was significantly higher than that for Science. With these UMIs, the effect sizes were somewhat larger than we found with the averaged UMI dependent variable. If we take the mean of the Humanities and Social Sciences mean values on UMI 2, for example, we get a value of 4.0975, and the raw scale-point difference between this value and the 3.903 for Science is .1945, which corresponds to a standardized effect size of approximately .45, and which would be classified as a medium-sized effect size or one that is not negligible. The parallel analysis with UMI 3 yields a raw scale-point difference of .151, or a standardized effect size of approximately .36 between Humanities/Social Sciences, on the one hand, and Science, on the other—again somewhat greater than a small effect size. As noted before, however, the reader is free to regard these differences as worthy or not of further consideration.
Relationships between the Covariates and the Dependent Variables The covariates used in the ANCOVAs reported above were correlated with the dependent variables. Because of the very large number of correlations possible with this data set, we have had to find more- aggregated summary values to present here. In the interests of economy of presentation, we have aggregated all 519 instructor/course units as the units of analysis in the correlational analyses, thus risking a small degree of between-groups correlation to creep into the reported values. We will comment on this briefly after presentation of these summary correlations, appearing below in Table 8.
Table 8
Correlations between the Covariates and the Dependent Variables
(n = 519 Instructor/Course Units __________________________________________________________________________
Dependent Variable ________________________________________
Covariate UMI 6 Average of 6 UMIs __________________________________________________________________________
Class Size –.23 –.27
Mean Course Grade .26 .30 __________________________________________________________________________ Note: All associated p-values < .0001.
The values in Table 8 are quite representative of the individual correlation coefficients we obtained in
each of the six Instructor Gender × Field of Study cell. With respect to the Class Size covariate, the average correlation with UMI 6 was –.26, with all of six correlations less than – .24 except for the Male
Instructor/Science cell, where the correlation was an anomalous –.02. In general, the Class Size vs. UMI 6 correlations were larger in absolute value for the female instructors (average = –.35) than for the male instructors (average r = –.17), with this average difference approaching statistical significance (and actually reaching it with an alpha level of .05).
Student Evaluation of Teaching Working Group Report 2020
66
The pattern of correlational results with the Average UMI dependent variable was very similar, with the
average across the six Instructor Gender × Field of Study cells equal to –.30, with the mean for female instructors –.39 and for male instructors –.21. We thus might see, as a convenient summary value for the correlation between class size and rated instructor performance with the present data, a correlation on the order of –.25 to – .30. This value makes good sense when we reflect on the variables involved in this correlation.
With respect to the Mean Course Grade covariate, our expectations would likely be a small-to-moderate positive correlation, and the results in Table 8 are consistent with this. The average correlation between Mean Course Grade and UMI 6 scores, over the six cells in the design, was .25, with the mean r for female instructors .31 and for male instructors .19. As for the other dependent variable, Average UMI, the correlations with Mean Course Grade averaged .29, with the mean r for female instructors .35 and for male instructors .22. As with the other covariate, Class Size, there was one anomalous cell among the six—Male Instructor/Social Sciences—in which the correlations between Mean Course Grade and the two dependent variables were not different from zero. Nonetheless, we might see, as a sort of rounded summary value here for the correlation between Mean Course Grade and rated instructor performance, something on the order of .25 – .30.
One detail that should be noted in the just-preceding results is that the Mean Course Grade variable is a proxy for, but not exactly the same thing as, the grades that the students expect to see in the course. nI the present study, a better covariate might have been the average expected (by the students) course grade since that is the perception that could be expected to influence instructor performance ratings. This would have necessitated an additional procedure in the study—soliciting expected grades from the students while the course was in progress—and without that intervention, our best proxy would seem to be the actual average course grade. Our assumption here would be that by the time the course evaluations are performed, students have a pretty good idea of the distribution of final course grades.
It is probably worth mentioning that the covariates in this study did not tend to be associated to any significant degree with the three factors in the analyses. This meant that the adjustment to the marginal and cell means arising from the covariates was quite minimal, and the main findings were very similar to those found in a standard analysis of variance performed on the data (without the covariates). Nonetheless, as we can see from the correlational results above in Table 8, the covariates did correlate reasonably substantially with the dependent variables, and the analyses performed in this study were more powerful as a result. Perhaps more conceptually important is the fact that neither covariate— Class Size and Mean Course Grade—was allowed to influence the central findings at all. These extraneous variables (for the present purposes) were held constant, and thus the main findings should be understood as completely independent of, and uninfluenced by, Class Size and Mean Course Grade.
Results from Comparing between-UMI Mean Levels Finally, it might be of interest to consider the overall UMI means—based on all 519 instructor/course units. These appear in Table 9. To make a reading of Table 9 more meaningful, we again remind readers of the content of the UMIs:
Student Evaluation of Teaching Working Group Report 2020
67
UMI 1: The instructor made it clear what students were expected to learn. UMI 2: The instructor communicated the subject matter effectively. UMI 3: The instructor helped inspire interest in learning the subject matter. UMI 4: Overall, evaluation of student learning (through exams, essays, presentations, etc.) was fair. UMI 5: The instructor showed concern for student learning. UMI 6: Overall, the instructor was an effective teacher. We note in passing that the overall university-wide mean over 6,636 instructor/course units from all faculties, including Arts and Science, on UMI 6 for the 2008-09 academic year was 4.12, and the standard deviation was .57. We also note that the means in Table 9 are not adjusted for the effects of the covariates. This is because we felt that they would have more descriptive value this way and could be better compared with corresponding (also unadjusted) values for the university as a whole, perhaps arising in previous and future academic years. In addition, since the comparisons deriving from Table 9 do not involve the experimental factors in this study, improving the inferential properties of the significance tests involving these factors was irrelevant. The means in Table 9 provide information about which aspects of teaching are being most favorably and least
favorably perceived by student raters. The overall mean rating is highest (at 4.20) for UMI 5—“The instructor
showed concern for student learning.” On the basis of paired-comparison t-tests, UMI 5 was found to
manifest significantly higher rating means than each of the remaining five UMIs (conservative tests were
conducted comparing among the UMI means, with alpha levels of .005). At the other end of the continuum,
the lowest overall mean rating (3.95) was found for UMI4—“Overall, evaluation of student learning (through
exams, essays, presentations, etc.) was fair.” The UMI 4 mean was found, from paired-comparison t-tests,
to differ significantly from those of all the remaining UMIs except for UMI 3 (which difference approached,
but did not quite reach statistical significance). In a way, this is not surprising, in that it is probably the grading
(and giving students a grade that reflects what they believe they deserve) that is most salient to students and about which many students would be most critical.
Whether or not this lowest rating indicates the need for more attention being paid to grading practices among instructors as a whole is unclear from these results. It may be, instead, that this aspect of teaching will always be the one most criticized no matter howwell it is done. The other somewhat lower-than-average rating, that for UMI 3—“The instructor helped inspire interest in learning the subject matter”—may also be worth noting. The mean rating on UMI 3 was significantly lower than those of all other UMIs except for UMI 4. It is probably the case that actually inspiring students is a higher-order goal that is difficult to achieve for most instructors. It is likely the case that what might be conceptualized, perhaps, as lower-order goals of careful preparation (UMIs 1, 2, and 4) and concern for learning (UMI 5) are easier to achieve and could be seen as occupying a lower stratum in a hierarchy of goals that we might visualize for university instructors.
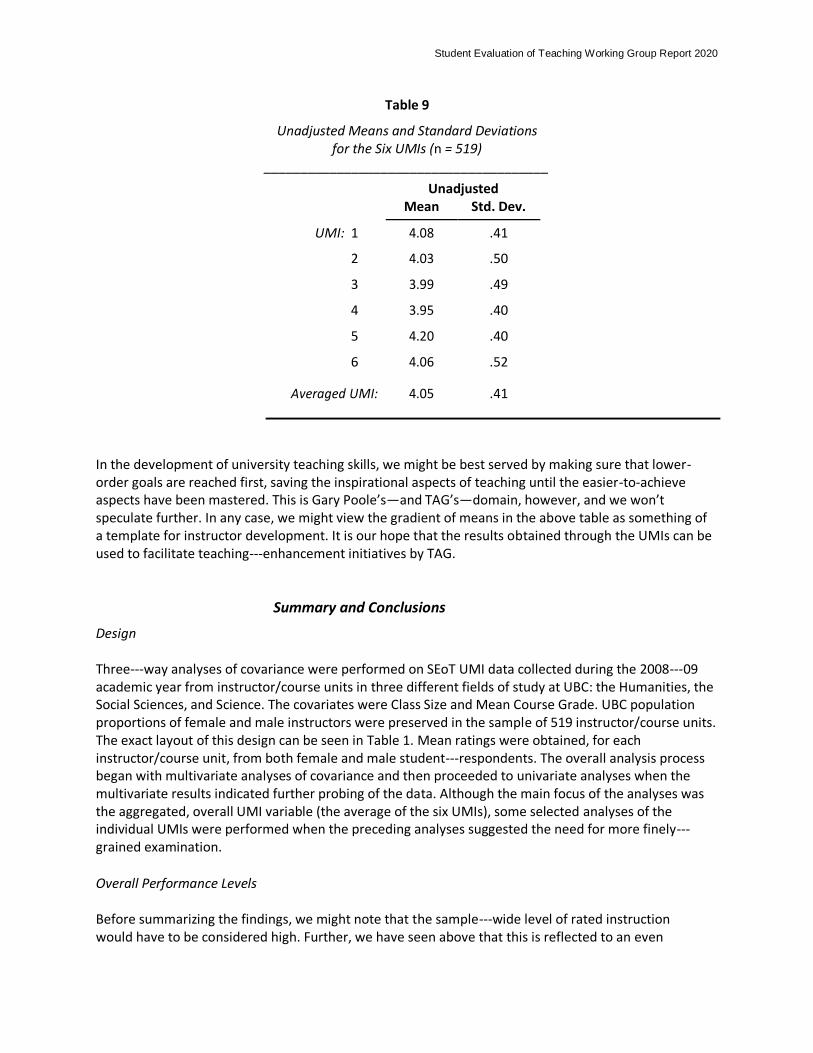
Student Evaluation of Teaching Working Group Report 2020
Table 9
Unadjusted Means and Standard Deviations for the Six UMIs (n = 519)
_______________________________________
Unadjusted Mean Std. Dev.
UMI: 1 4.08 .41
2 4.03 .50
3 3.99 .49
4 3.95 .40
5 4.20 .40
6 4.06 .52
Averaged UMI: 4.05 .41
In the development of university teaching skills, we might be best served by making sure that lower-order goals are reached first, saving the inspirational aspects of teaching until the easier-to-achieve aspects have been mastered. This is Gary Poole’s—and TAG’s—domain, however, and we won’t speculate further. In any case, we might view the gradient of means in the above table as something of a template for instructor development. It is our hope that the results obtained through the UMIs can be used to facilitate teaching-enhancement initiatives by TAG.
Summary and Conclusions Design Three-way analyses of covariance were performed on SEoT UMI data collected during the 2008-09 academic year from instructor/course units in three different fields of study at UBC: the Humanities, the Social Sciences, and Science. The covariates were Class Size and Mean Course Grade. UBC population proportions of female and male instructors were preserved in the sample of 519 instructor/course units. The exact layout of this design can be seen in Table 1. Mean ratings were obtained, for each instructor/course unit, from both female and male student-respondents. The overall analysis process began with multivariate analyses of covariance and then proceeded to univariate analyses when the multivariate results indicated further probing of the data. Although the main focus of the analyses was the aggregated, overall UMI variable (the average of the six UMIs), some selected analyses of the individual UMIs were performed when the preceding analyses suggested the need for more finely- grained examination.
Overall Performance Levels
Before summarizing the findings, we might note that the sample-wide level of rated instruction would have to be considered high. Further, we have seen above that this is reflected to an even
Student Evaluation of Teaching Working Group Report 2020
69
greater degree when we consider the university-wide results. If we focus on just UMI 6, which is concerned with students’ overall impressions of the quality of instruction, we see averages of 4.06 (this sample) and 4.12 (university as a whole). These averages reflect good perceived teaching at this university and, incidentally, are very similar to the corresponding UMI 6 averages that were obtained through the previous pencil-and-paper administration mode.
Sample Representativeness
In addition, the similarity of the UMI 6 mean for both groups of instructor/course units (present sample and larger university-wide aggregation of which the present sample is a part), along with an even greater similarity in their standard deviations (.52 vs. .57) suggests that the present sample is quite representative of the larger set of all instructor/course units found in the 2008-09 offerings. Noteworthy Effects Found
In the analyses of the overall averaged UMI mean scores, we found two main effects: (a) for Instructor Gender and (b) for Field of Study. These main effects, however, were found to be complicated conceptually by the interactions between each and the Student-Respondent Gender factor. The statistical results appear in Table 2. We note here that any means discussed earlier and in the sequel are to be understood as adjusted (by the covariates) means. As noted earlier, the question of the practical significance of these main-effect differences must be considered by the reader.
The most highly (statistically) significant finding in the present study was the Instructor Gender× Student-Respondent Gender interaction effect. This can be seen in Table 2 for the averaged UMI
dependent variable and also in the results for UMIs 2, 3, and 6. In these cases, the female instructor mean was significantly higher than the male instructor mean when the ratings were those of female student-respondents, but the corresponding difference between the instructor genders was nonsignificant when the ratings were those of male student-respondents. Aspects of this effect can be seen in Table 4 and Figures 1 and 2.
In other cases, though (UMIs 1 and 5), both female and male student-respondents rated female instructors more highly, on average, than they rated male instructors. These main-effect results can be found in Table 6. In all of UMIs 1, 2, and 5, and the overall averaged UMI measure, this significant Instructor Gender main effect was found. Thus, we might summarize all of this by noting that, in general, we may say that female instructors were more highly rated than male instructors, but in several cases this resulted from the ratings provided by female student-respondents only.
With respect to the Field of Study factor, when the overall averaged UMI dependent variable was analyzed, there was a significant difference between the means for Social Sciences and Science, in favor of the former, but only on the basis of ratings provided by female student-respondents. There were no significant differences among the three fields of study from ratings provided by male student- respondents. Thus, although the overall main effect for Field of Study was significant for this averaged
dependent variable, this effect must be understood in terms of the Field of Study× Student-Respondent Gender interaction, as detailed above in this paragraph. The specifics of this analysis can be found in Table 5 and Figure 3.
When considering UMIs 2 and 3, however, Field of Study was found not to interact with Student- Respondent Gender, and the Field of Study factor instead yielded a highly-significant main effect.
Student Evaluation of Teaching Working Group Report 2020
70
The nature of this effect was that ratings in the Humanities and Social Sciences did not differ from each other, but that each differed significantly from the ratings found in Science, with the Humanities/Social Sciences ratings higher. The specifics of these results can be found in Table 7. Here the differences were approaching practical-significance levels.
Relationships with the Two Covariates
The two covariates, Class Size and Mean Course Grade were largely unrelated to the three independent variables, but were moderately correlated with the dependent variables. Class size was found to be negatively correlated with mean ratings on UMI 6 and for the averaged UMI dependent variable. These Class Size vs. Dependent variable correlations were in the –.20 to –.30 range. Positive, and slightly higher, correlations were found between Mean Course Grade and the dependent variables (in the .25 to .30 range).
Differences among Mean Levels on the Six UMIs Among the six UMIs, UMI 5 manifested the highest mean in this sample and UMI 4, the lowest. The gradient of the UMI means in Table 9 may have useful implications for teaching improvement, and this possibility is discussed in the text following the results in Table 9.
Student Evaluation of Teaching Working Group Report 2020
71
Examining the Effect of Field of Study and Gender on Students’ Evaluation of
Teaching (SEoT): A Case Study of the University Module Items (UMI) Scores in
the 2014-2015 Academic Year
Centre for Teaching, Learning & Technology University of British Columbia
Abstract This case study is a follow-up to a similar study conducted in 2009 to examine the effect of field of study, instructor gender and student gender on the scores of the six University Module Items (UMI). The sample in this study mimicked the one used in 2009 in terms of the 3 fields of study selected (Humanities, Social Sciences and Science) as well as the selected departments in each field. A total of 519 UBC instructor/course section in the 2014-2015 academic year were randomly selected, by department, from the 3 fields of study. The ratio of male and female instructors reflected their respective university wide proportions. In each instructor/course section evaluation, scores were aggregated by student gender, resulting in a total of 1038 observations.
Analysis of variance was conducted using a generalized linear model (Proc GLM in SAS). Unlike the 2009 study, in which enrollment and average grades were used as a covariates, this case study used course year-level and average letter grade as class variables. For most UMIs, more than 80% of the variation in the SEoT scores was due to “random/unexplained” variation between evaluations within the same filed, at the same course level, and the same instructor gender.
There were statistically significant differences in ratings between fields of study, course year levels, and letter grades, in some, but not all UMI questions. Effect Size ranged from 3% for average grade to 16% for field of study.
Male students rated their instructors slightly higher than their female colleagues for UMI question 2 and 3, however, while these gender differences are statistically significant the effect size is under 1%.
Introduction
The objective of this case study is to examine the presence of gender bias in the students’ evaluation of teaching. The design of this observational study was used to control for as many of the variables reported in the literature to affect students’ rating of instructors. Independent variables considered include field of study, course year-level, instructor gender, student gender and average grade by student gender.
For the 3 fields of study, the departmental breakdown included:
1) Humanities: Departments of Art History & Visual Arts, Asian Studies, Central, Eastern & Northern European Studies, Classical, Near Eastern & Religious Studies, English, French, Hispanic & Italian Studies, History, and Philosophy;
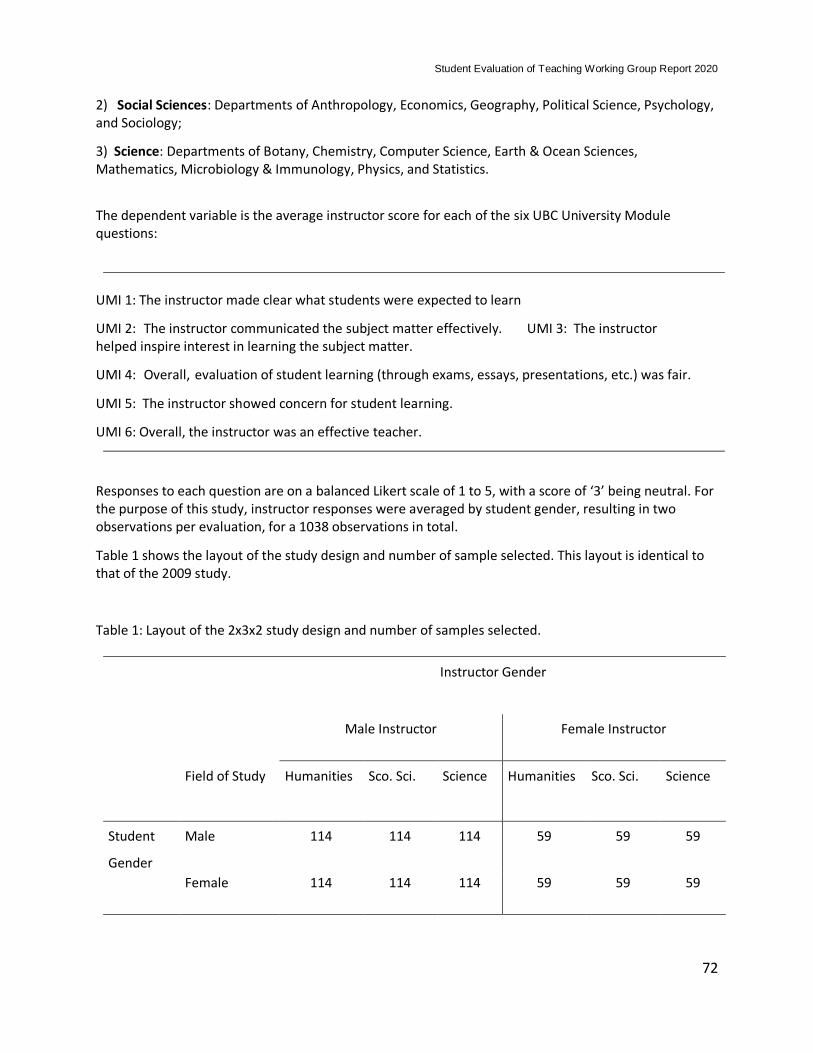
Student Evaluation of Teaching Working Group Report 2020
72
2) Social Sciences: Departments of Anthropology, Economics, Geography, Political Science, Psychology, and Sociology;
3) Science: Departments of Botany, Chemistry, Computer Science, Earth & Ocean Sciences, Mathematics, Microbiology & Immunology, Physics, and Statistics.
The dependent variable is the average instructor score for each of the six UBC University Module questions:
UMI 1: The instructor made clear what students were expected to learn
UMI 2: The instructor communicated the subject matter effectively. UMI 3: The instructor helped inspire interest in learning the subject matter.
UMI 4: Overall, evaluation of student learning (through exams, essays, presentations, etc.) was fair.
UMI 5: The instructor showed concern for student learning.
UMI 6: Overall, the instructor was an effective teacher.
Responses to each question are on a balanced Likert scale of 1 to 5, with a score of ‘3’ being neutral. For the purpose of this study, instructor responses were averaged by student gender, resulting in two observations per evaluation, for a 1038 observations in total.
Table 1 shows the layout of the study design and number of sample selected. This layout is identical to that of the 2009 study.
Table 1: Layout of the 2x3x2 study design and number of samples selected.
Instructor Gender
Male Instructor Female Instructor
Field of Study Humanities Sco. Sci. Science Humanities Sco. Sci. Science
Student
Gender
Male 114 114 114 59 59 59
Female 114 114 114 59 59 59

Student Evaluation of Teaching Working Group Report 2020
73
Analysis & Results
For each of the six UMI, as well as for a combined average of all UMIs, a generalized linear model (GLM) was used (SAS 9.4) to analyze the variance (ANOVA) in the response variable as a function of a number of categorical variables at two hierarchal levels:
i) between instruction/course variation; and
ii) within instructor/course variation.
Mean comparisons were conducted if the main effect or an interaction was significant (α=0.05).
Overall Score (Average of all 6 UMIs)
The analysis of variance results for the overall average is given in table 2.
Table 2. Analysis of variance for overall score (average of the 6 UMIs)
Sources of variation df MS F p-value
Between Instructor/Section Variation
Course year level 4 0.93 2.3 0.056
Field of study 2 2.33 5.8 0.0033
Instructor gender 1 0. 35 0.86 0.3534
Instructor gender x Field of study 2 0.004 0.01 0.9892
Course (Instructor gender x filed)* 504 0.40
Within Instructor/Section Variation
Student Gender 1 0.07 1.1 0.3027
Instructor gender x Student Gender 1 0.11 1.8 0.1864
Field of study x Student Gender 2 0.005 0.07 0.9300
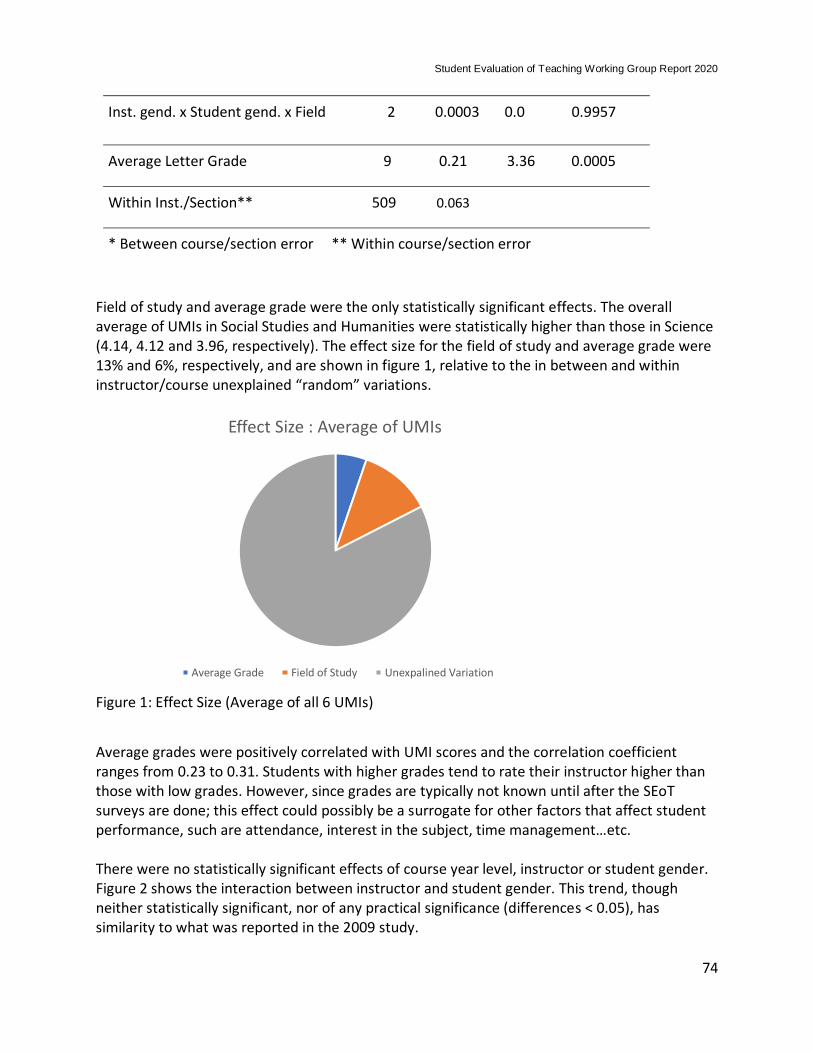
Student Evaluation of Teaching Working Group Report 2020
74
Inst. gend. x Student gend. x Field 2 0.0003 0.0 0.9957
Average Letter Grade 9 0.21 3.36 0.0005
Within Inst./Section** 509 0.063
* Between course/section error ** Within course/section error
Field of study and average grade were the only statistically significant effects. The overall average of UMIs in Social Studies and Humanities were statistically higher than those in Science (4.14, 4.12 and 3.96, respectively). The effect size for the field of study and average grade were 13% and 6%, respectively, and are shown in figure 1, relative to the in between and within instructor/course unexplained “random” variations.
Figure 1: Effect Size (Average of all 6 UMIs)
Average grades were positively correlated with UMI scores and the correlation coefficient ranges from 0.23 to 0.31. Students with higher grades tend to rate their instructor higher than those with low grades. However, since grades are typically not known until after the SEoT surveys are done; this effect could possibly be a surrogate for other factors that affect student performance, such are attendance, interest in the subject, time management…etc. There were no statistically significant effects of course year level, instructor or student gender. Figure 2 shows the interaction between instructor and student gender. This trend, though neither statistically significant, nor of any practical significance (differences < 0.05), has similarity to what was reported in the 2009 study.
Effect Size : Average of UMIs
Average Grade Field of Study Unexpalined Variation

Student Evaluation of Teaching Working Group Report 2020
75
Figure 2: Mean interaction between instructor and student gender.
Individual UMI Scores
This section presents the results for the individual UMI scores. None of interactions were statistically significant, however, some main effects were significant, for some of the UMIs. For UMI 1 to 6, the factors that were statistically significant (α=0.05) are shown in Table 3.
Table 4: Significant Effects for the individual six UMIs and their effect size.
UMI Question Significant Main Effects Effect Size (respectively)
UMI 1 Average Grade 3%
UMI 2 Field of Study & Student Gender
16% & 1%
UMI 3 Field of Study, Year level, Student Gender & Avg. Grade
16%, 13%, 1% & 4%
UMI 4 Field of Study & Average Grade 5% & 7%
UMI 5 Year level 13%
UMI 6 Field of Study & Average Grade 12%, 4%
1
1.5
2
2.5
3
3.5
4
4.5
5
Female Male
Ave
rage
of
UM
Is
Instructor Gender
Female Student
Male Student

Student Evaluation of Teaching Working Group Report 2020
76
As apparent in table 4, there was no single factor which was consistently statistically significant for all UMIs. The Field of Study is Signiant for questions 2, 3, 4 and 6, and the results are similar to the overall average, where ratings in Science are significantly lower than those in Humanities and/or Social Sciences (Table 5). The magnitude of the mean scores and the relative ranking in the three fields of study are comparable to what was reported in the 2009 study.
For UMI questions 2 and 3, male students scored their instructor higher than female students. The mean difference between student genders, for both questions (0.06 and 0.05, respectively), though statistically significant, has negligible effect size (1%). Also, lower level courses (first and second year) has lower average UMI scores compared to fourth year and graduate courses.
Table 5. Mean scores for individual UMIs for Field of Study and Year Level (where significant)
Year Level Field of Study
Question 1st year 2nd Year 3rd Year 4th Year Grad Humanities Social Sci. Science
UMI1
UMI 2 4.12 4.17 3.89
UMI 3 3.83 4.00 4.05 4.30 4.40 4.09 4.14 3.86
UMI4 4.02 3.95 3.84
UMI5 4.05 4.15 4.19 4.44 4.50
UMI 6 4.14 4.18 3.96
Although no instructor gender effect was detected, There is a general trend, though neither statistically significant nor of any noticeable effect size, similar to that for the overall average of UMIs (figure 2), where, for most UMIs, female instructors received higher ratings, particularly from female students. The means for the instructor and student genders interaction is given in table 6.
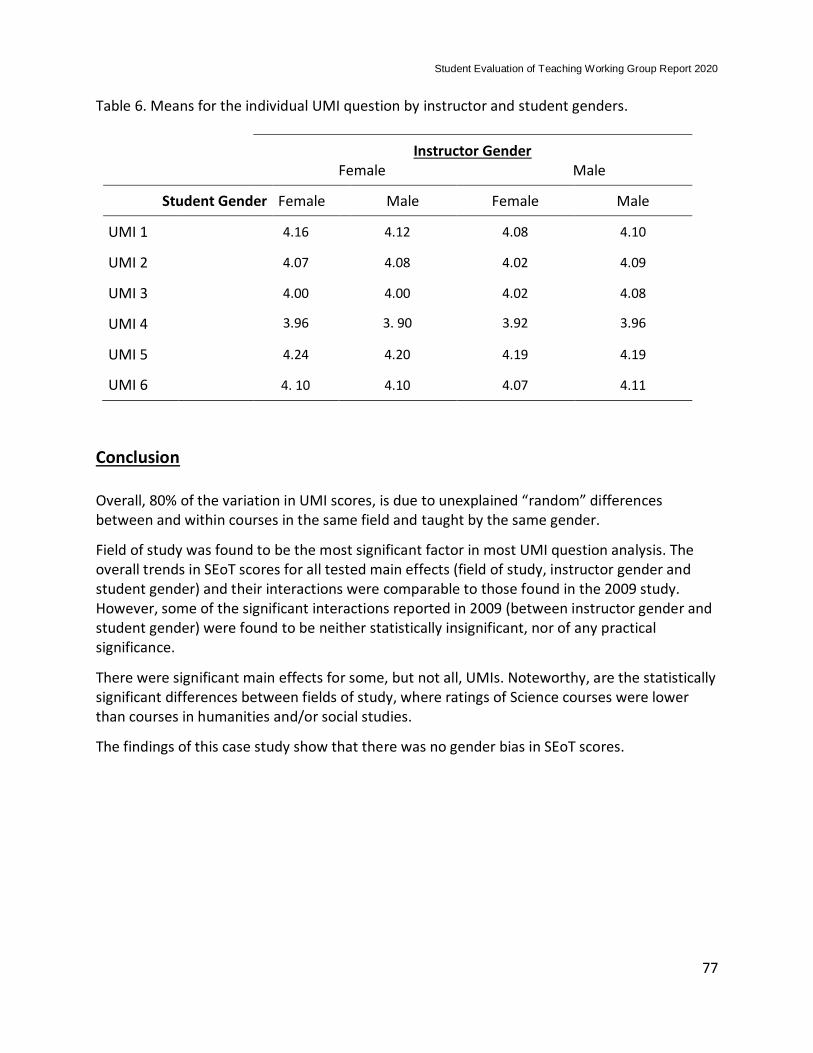
Student Evaluation of Teaching Working Group Report 2020
77
Table 6. Means for the individual UMI question by instructor and student genders.
Instructor Gender Female Male
Student Gender Female Male Female Male
UMI 1 4.16 4.12 4.08 4.10
UMI 2 4.07 4.08 4.02 4.09
UMI 3 4.00 4.00 4.02 4.08
UMI 4 3.96 3. 90 3.92 3.96
UMI 5 4.24 4.20 4.19 4.19
UMI 6 4. 10 4.10 4.07 4.11
Conclusion
Overall, 80% of the variation in UMI scores, is due to unexplained “random” differences between and within courses in the same field and taught by the same gender.
Field of study was found to be the most significant factor in most UMI question analysis. The overall trends in SEoT scores for all tested main effects (field of study, instructor gender and student gender) and their interactions were comparable to those found in the 2009 study. However, some of the significant interactions reported in 2009 (between instructor gender and student gender) were found to be neither statistically insignificant, nor of any practical significance.
There were significant main effects for some, but not all, UMIs. Noteworthy, are the statistically significant differences between fields of study, where ratings of Science courses were lower than courses in humanities and/or social studies.
The findings of this case study show that there was no gender bias in SEoT scores.

Student Evaluation of Teaching Working Group Report 2020
78
Appendix 4 – Survey: Key Themes and Sample Statements An open online survey was made available for comments between November 25th 2019 – March 12th 2020 at https://teacheval.ubc.ca/seot-working-group/seot-feedback/. It was promoted at various face-to-face consultation meetings with students, faculty, Heads & Directors and staff. It was also included in the interim report to Vancouver and Okanagan Senates in January 2020. A total of 55 responses were received. What follows is a summary of themes and sample quotes that relate directly to matters addressed in the Working Group’s recommendations, as well as important concerns that fall outside the mandate of the current Working Group.
1. Over reliance on a single quantitative metric.
A number of comments highlighted a desire to reduce reliance on a single metric:
“Don't boil it down to one number. Students don't know what "effectiveness" means. They interpret it a million ways, and it poses a significant risk to the validity of the evaluations. Break out the question into sensible components that get at what the students are likely trying to say: Were you able to understand what the professor was saying? If you started a lecture by not understanding a concept, were you able to understand it by the end? things like that.” (Stop) “Inflating the importance of the numbers; making them the only thing that "really" counts in the evaluation of teaching.” “Instructor's reflections should also be added to the process of teaching evaluations. Teaching & learning is a two-way street that involves both instructors and students. By adding instructor's reflection to student evaluations, we will provide a more complete picture about what went in a particular course.”
Likewise, the desire for meaningful triangulation of multiple data sources:
“It is important to allow students the opportunity to share their perspectives, but it is not equitable to make novice opinions the basis for hiring/retention/promotion. Peer review of teaching is a better process for these applications.” “(Stop) Relying on student evaluations of teaching so heavily as a measure of the efficacy of an instructor's ability to teach. I know that the working group is advocating for this, so I am really just echoing it. I would like to see a more fulsome policy regarding the evaluation of teaching that combines student outcomes, peer review and self- reflection with student evaluations - so that they are part of a whole and related to one another.”
Also, a number of comments highlighted the need for further communication and dialog on the limitations of SEoT:
“Educate senior administrators about why they should not be used in this way (e.g. loss of morale, loss of confidence, punishes risk-taking, rewards "safe bets")
2. Use of SEoT for reappointment, tenure and promotion This was a frequently mentioned topic in the responses. Most often, respondents said SEoT should not be used in personnel decisions (e.g., P & T), based on bias, response rates and/or the validity of the instrument.

Student Evaluation of Teaching Working Group Report 2020
79
“I think we should consider stopping the use of student evaluations of teaching for tenure and promotion purposes when the response rate is too low and student rating is not free from biases.” “Making inferences from them and treat these inferences as if they were facts (at least, until the validity of the survey/instrument has been thoroughly and rigorously validated by experts).” (stop) “Using them as significant factors in tenure and promotion. A large body of research shows they are biased against women and people of colour; using them further embeds racism and sexism within the institution.” “Stop evaluating all instructors with the same measuring stick - this is unbelievably archaic. Stop using an evaluation tool that does not have any validity when comparing two instructors, for example.”
However, a range of views were expressed, with some comments arguing that SEoT should continue to be used:
“First, keep using them. I know they are not perfect, and that a lot of instructors hate them. Personally, I find them motivating, and I use them to change my approach in subsequent years. I also think they are important in giving the students some power with regards to their educational experience. I suspect that student satisfaction overall is higher when they feel like they have a voice." “We need to continue to gather student evaluations of teaching, even though they are not the perfect way of evaluating someone's teaching. Student evaluations are part of the overall evaluation process, but they should not be the only component of it.” “Continue to engage stakeholders and the community at large. Strive to engage populations that have been shown to be negatively affected by bias in SEoTs. Be bold and take action to introduce new interventions that will reduce inequities in SEoTs.
“Continue to use some tool to allow students to provide feedback regarding students' impressions of their learning environment (to include--in addition to feedback for the instructors--their perceptions of learning spaces, scheduling, instructional equipment, etc.). In some cases, this information could be used, along with other valid evaluation tools, to identify instances that might warrant intervention. This could include providing training/resources to the instructor, or changes to the learning environment.”
But recognizing the fact that students are not pedagogy experts, and that evaluations can be ‘gamed’ to some degree:
“Stop or reduce the importance of student evaluations in P & T decision making. While the learner perspective is important, students are not experts in the pedagogy of teaching and learning, neither do they always know or appreciate how important it is to be stretched in order to grow and learn. Faculty who teach course with content students "like" or who spoon-feed students consistently receive higher evaluations than those who teach more challenging content or who challenge students to push themselves, which is very unfair when student feedback is such a key element in P & T”
Student Evaluation of Teaching Working Group Report 2020
80
“If somebody sets high current student evaluations as their main goal in class, this may not be compatible with good pedagogy. The easiest way would be 1) to make student perceive class as "easy" (low study/info content); 2) have high assessment grades right from the start, 3) do games in class in addition to lectures; 4) play lots of u-tube stuff. I know several colleagues for whom this approach has worked nicely.”
From a former Head’s perspective, SEoT was most useful as a signal for issues to be addressed:
“As a former department head and member of a university-level tenure and promotion committee, I find student evaluations to be of some use when evaluating candidates for RTP -- although they must be taken with a grain of salt. They are most useful in signaling big, overall issues -- for example, instructors who are really having difficulties (cancelling classes without notice, coming in to work intoxicated, making sexist, racist, homophobic, and otherwise bigoted comments, struggling with organization). A persistent pattern of this type of feedback across classes and semesters is a red flag, and merits further investigation and intervention. Sometimes faculty can be helped to overcome these difficulties and get back on track.”
The theme of reducing the importance given to one particular data source (e.g. SEoT) was often entwined with issues of bias and reliability:
“Student evaluations are often biased and unreliable - like most forms of data in some way shape or form. they're an imperfect piece of the puzzle and that should be clearly understood. I believe they can be improved but should remain a piece of the puzzle rather than a reflection of any kind of straightforward truth about someone's teaching ability.”
“It is important to allow students the opportunity to share their perspectives, but it is not equitable to make novice opinions the basis for hiring/retention/promotion. Peer review of teaching is a better process for these applications.” “Maybe stop having students do evaluations that are used for P&T at all. Students are kind of biased. They respond to things like easy midterms, candy, and a sunny personality, when in fact those have nothing to do with effective teaching. They typically don't like strong accents, and it takes a lot for women to gain their trust as being credible instructors. Students give higher evals to those they trust, and these are all ways of gaining trust that have nothing to do with teaching.”
3. Bias in student evaluations
Bias in the evaluations was a common theme in the feedback from respondents, with clear suggestions for what UBC should do in regards to this:
“Hold a UBC-wide forum and provide a platform for faculty to provide evidence of the worst abuses of the SEoT. Listen and learn.” “Take serious how results from SEoT regularly shuts down highly educated, qualified, and talented Indigenous, racialized, Two Spirit, Queer, disabled, and related diverse faculty at UBC in ways which negatively impact on productivity, and diminishes campus
Student Evaluation of Teaching Working Group Report 2020
81
safety and the utility of the safe environment policy for these constituencies and communities.” “Account for the vast body of evidence showing bias in student evaluations, against faculty who are women, racialized, Indigenous, queer and trans, and those with disabilities.” “Check scores and comments periodically to assess for evidence of bias-- a campus-wide study to identify trends-- and decide accordingly about how one uses these scores.” “(stop) Using them as significant factors in tenure and promotion. A large body of research shows they are biased against women and people of colour; using them further embeds racism and sexism within the institution.” “Delete the last question where students are asked to rank the instructor as very good. Studies have shown that when teaching the same material, female instructors are consistently ranked lower than male instructors. Other issues such as race, age, ethnicity also have a bearing on these rankings. The system is inherently unfair and biased in favour of white male instructors.”
4. Helping students understand the purpose and use of SEoT
Several comments related to the theme of promoting greater student understanding of what SEoT is used for, and suggestions for how students might engage with this:
“I wonder if we couldn't teach students to be more helpful on teaching evaluations. Students often have no idea how these documents are used and what sorts of comments are useful. I often tell students, for example, that comments about the scheduling of the class, the room the class is in, and other things about physical facilities are ignored; that is not the venue in which to make those observations. I also urge them to avoid commenting on things I can't help, such as my physical appearance. I tell them the best comments focus on things I can change and improve, like readings, classroom activities, types of assignments, etc., and represent reasonable adjustments (e.g. "don't have any assignments or readings" is not reasonable). Likewise, general comments such as "This class sucks!"/ "This class was awesome!" are equally unhelpful. I'd like to think that these guidelines have produced slightly more useful evaluations (though I still get both fulsome praise and rude remarks).” “I think it's imperative that students be given some lessons about how to transmit effective feedback. Having been at UBC since before the surveys went online, I can say that there was a marked difference in tone when they went online. Never before had I had random meanness - grotesque comments about appearance, delivery of course material, as well as really cruel profanity. The other faculty members in my small program say the same thing - the student comments, especially in large lecture courses, can be just brutal to read. We are all award-winning teachers, each of us having won campus-wide prizes for effective teaching...so I don't think it's that we're terrible instructors. But for all of us, reading these comments is emotionally damaging. It seems to me that students need to be given very explicit instruction about what they're doing, about the need for kindness and constructive language. At the moment, they seem to view like this like any other online rating exercise, which they often do thoughtlessly and cruelly. They need to learn that this is different, and why it is different.”

Student Evaluation of Teaching Working Group Report 2020
82
The nature of student (open) comments was also a theme:
“Allowing them to make cruel and personal remarks- there should be a way for them to know they are accountable for what they say. Have the student do so many each year-- they get so tired of them. Maybe they need to be shorter.” “I would not like to receive bullying comments from students any more. Receiving my student evaluations, coupled with a complete lack of support from my department … has left me feeling quite hopeless. I think this system should at the very least not allow for free-form, anonymous commenting from students (that is, if the university cares at all about faculty well-being or retaining their faculty). I do not see how allowing students to anonymously objectify, vilify, and attack faculty contributes to teaching effectiveness.” “I really hate reading the comments. They are often hurtful and personal. If I can put aside the emotions, I find there can be helpful things that I appreciate- what they prefer in terms of technology use, classroom strategies I use, etc.”
“Presenting modules to students about how and why their input is sought that include information on implicit bias.”
5. Nature of questions asked
The nature of the questions asked in student feedback featured in an array of comments:
“Stop making the evaluations on both campuses different. I don't understand why teaching evals are different on the two campuses.” “Stop asking students if they liked their textbook/readings. Some courses don't use textbooks as readily and the question is not as applicable. For example, project-based courses. While we provide resources for students to use, unless it is "labeled" as a textbook, they don't perceive the question as applicable to those resources. Since the evals are done privately (not in class), we cannot explain to them how they should answer questions.” “Change the questions! Some of them are not questions that students can answer, and some provide no useful information at all to me as an instructor - they do not reflect any of the things that I would want to know form my students. One simple improvement would be to use the first person and be specific.” “Rather than the majority of questions focusing on the instruction, I would add a couple questions that provide more insight into the student context and their perspective/beliefs of the course (i.e. Rate level of interest in the subject matter; indicate whether this is required/service/elective course). I would also consult with students as to the wording of particular questions (to sound more like a student) and to better know how they interpret the questions they're being asked (what do they mean by effective?). I wasn't able to attend the session but really like the idea of changing the terminology to "student experiences of instruction". I also think it might be nice to have some kind of tool that helps to consolidate the open-ended comments in the evaluations” (Stop) “Asking 20 questions! The Okanagan Campus questionnaire needs to be much, much shorter. Asking students questions that they are not equipped to answer. They
Student Evaluation of Teaching Working Group Report 2020
83
don't know, as non-experts, if a course is "good," for example. They should only be asked things they can offer a reasonable and informed opinion about.” “Unless we have a very good way to communicate what 'effective teaching" means to students, we should not ask that question. We do need to understand how to figure out based on the qualitative feedback students have already provided common concerns; prioritize those concerns and see if those can be integrated into the survey” “Include a component about equity, diversity and inclusion into the questions. this is a key component of teaching that's currently not captured at all in the SEOT.”
6. Additional comments and concerns from open forums and the online survey that fell
outside the terms of reference for the Working Group. These are not direct quotes, but are meant to capture the essence of what was said in open forums.
Should evaluations be done for every faculty member, every course, every year?
There should not be a need for students to complete a survey on a fully tenured professor with high ratings every time, or even to complete all of the UMI. It may be useful to minimize the UMI to just one or two core items, or reduce the frequency with which various groups require evaluation.
I think we should start framing student evaluations of teaching more as "feedback" for the future improvement of teaching, rather than evaluations. Explore different ways of collecting more meaningful student feedback. We may also consider a way to create a mechanism to hold instructors accountable to the feedback they have received from their students (e.g., tenure and promotion process requiring the evidence of how they have integrated student feedback into their teaching practices or materials).
Please make the results more comprehensible to those without statistical training. I have some statistical training and still found the results almost impossible to understand. Think about incentivizing students to fill out evaluations. Many universities only show students their grades after they have completed evaluations. Or students can see grades earlier. Perhaps you could have a short screen, alerting students to potential bias in their evaluations? A few bullet points to make them aware may help to mitigate the well-documented sexism and racism in student evaluations.
Timing of evaluations: From a faculty member: “Stop distributing them at the most stressful point in the term where they tend to be reactionary rather than thoughtful”. From a student: “Every other university I've attended has student evaluations due after classes end or after the final exam period. This would be much better.”
Can ‘one size’ of evaluations be applicable across the diverse teaching contexts at UBC? What about year-long courses where many faculty members may teach (only) a few weeks or one module of content?
Is there a way in which the administration could use social media design principles to send out messages about SEoT? The announcements about SEoT are really boring and other announcements are well-designed! (student comment)
Student Evaluation of Teaching Working Group Report 2020
84
How will the process be sensitive to different teachers? o Tenure-track faculty o Sessional instructors; clinical teachers; Teaching Assistants; etc. o Teams and co-teaching (number of different instructors)
How will the process be sensitive to contextual variations?
o Number of students; time of day; required vs. elective; 1st year vs. 3rd year o On-line, blended; programs that cost learners more than other programs
What does ‘effective’ mean?
o Variations across teachers (teachers vary in how they are ‘effective’) o Variations across learners (what is effective for one, may not be for others)
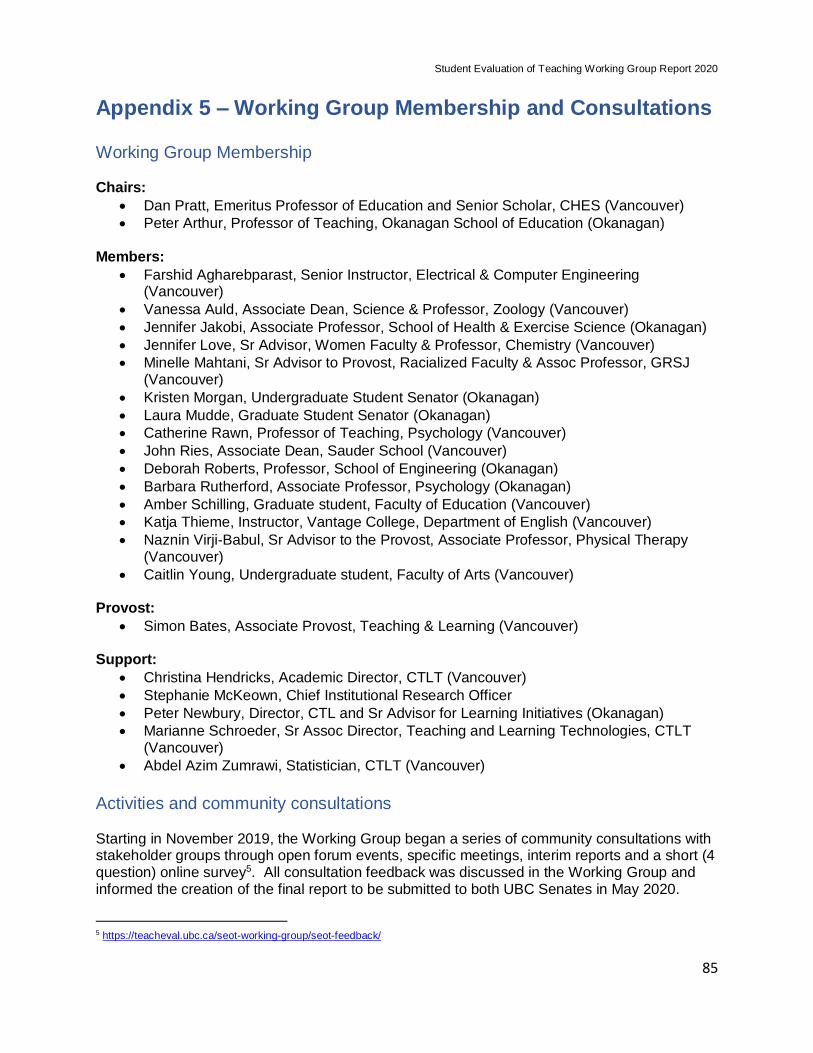
Student Evaluation of Teaching Working Group Report 2020
85
Appendix 5 – Working Group Membership and Consultations
Working Group Membership Chairs:
Dan Pratt, Emeritus Professor of Education and Senior Scholar, CHES (Vancouver)
Peter Arthur, Professor of Teaching, Okanagan School of Education (Okanagan) Members:
Farshid Agharebparast, Senior Instructor, Electrical & Computer Engineering (Vancouver)
Vanessa Auld, Associate Dean, Science & Professor, Zoology (Vancouver)
Jennifer Jakobi, Associate Professor, School of Health & Exercise Science (Okanagan)
Jennifer Love, Sr Advisor, Women Faculty & Professor, Chemistry (Vancouver)
Minelle Mahtani, Sr Advisor to Provost, Racialized Faculty & Assoc Professor, GRSJ (Vancouver)
Kristen Morgan, Undergraduate Student Senator (Okanagan)
Laura Mudde, Graduate Student Senator (Okanagan)
Catherine Rawn, Professor of Teaching, Psychology (Vancouver)
John Ries, Associate Dean, Sauder School (Vancouver)
Deborah Roberts, Professor, School of Engineering (Okanagan)
Barbara Rutherford, Associate Professor, Psychology (Okanagan)
Amber Schilling, Graduate student, Faculty of Education (Vancouver)
Katja Thieme, Instructor, Vantage College, Department of English (Vancouver)
Naznin Virji-Babul, Sr Advisor to the Provost, Associate Professor, Physical Therapy (Vancouver)
Caitlin Young, Undergraduate student, Faculty of Arts (Vancouver) Provost:
Simon Bates, Associate Provost, Teaching & Learning (Vancouver) Support:
Christina Hendricks, Academic Director, CTLT (Vancouver)
Stephanie McKeown, Chief Institutional Research Officer
Peter Newbury, Director, CTL and Sr Advisor for Learning Initiatives (Okanagan)
Marianne Schroeder, Sr Assoc Director, Teaching and Learning Technologies, CTLT (Vancouver)
Abdel Azim Zumrawi, Statistician, CTLT (Vancouver)
Activities and community consultations Starting in November 2019, the Working Group began a series of community consultations with stakeholder groups through open forum events, specific meetings, interim reports and a short (4 question) online survey5. All consultation feedback was discussed in the Working Group and informed the creation of the final report to be submitted to both UBC Senates in May 2020.
5 https://teacheval.ubc.ca/seot-working-group/seot-feedback/
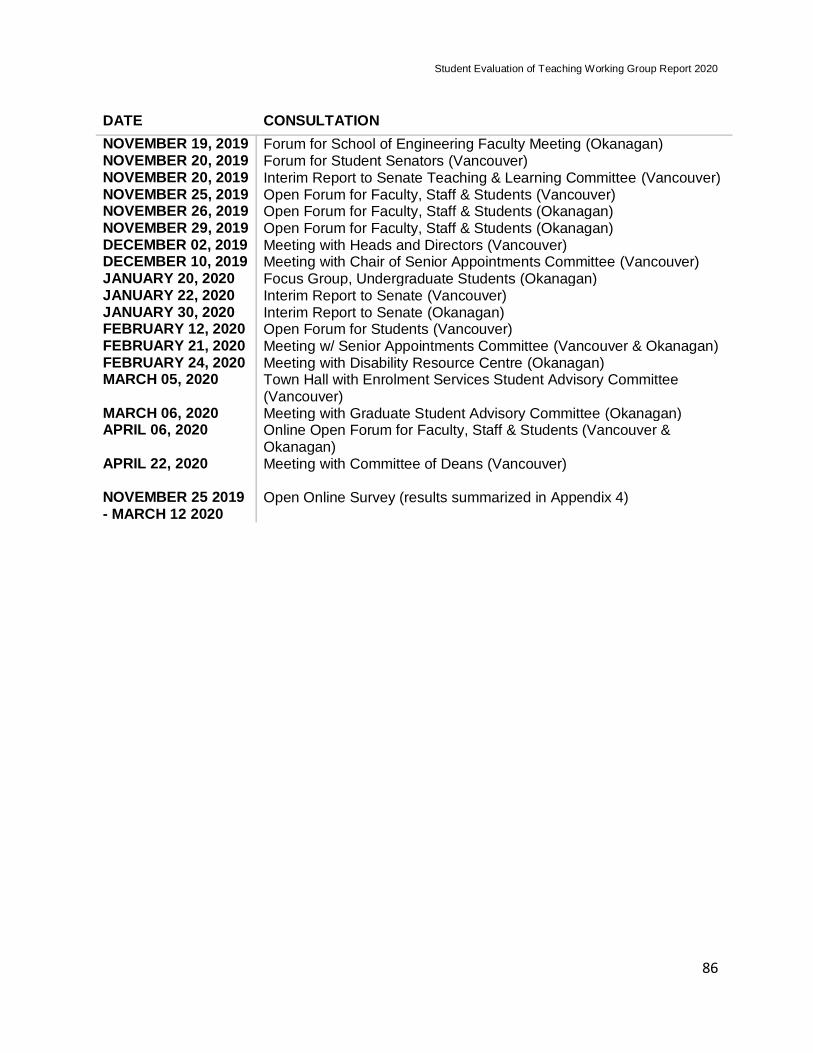
Student Evaluation of Teaching Working Group Report 2020
86
DATE CONSULTATION
NOVEMBER 19, 2019 Forum for School of Engineering Faculty Meeting (Okanagan) NOVEMBER 20, 2019 NOVEMBER 20, 2019 NOVEMBER 25, 2019 NOVEMBER 26, 2019
Forum for Student Senators (Vancouver) Interim Report to Senate Teaching & Learning Committee (Vancouver) Open Forum for Faculty, Staff & Students (Vancouver) Open Forum for Faculty, Staff & Students (Okanagan)
NOVEMBER 29, 2019 Open Forum for Faculty, Staff & Students (Okanagan) DECEMBER 02, 2019 DECEMBER 10, 2019 JANUARY 20, 2020
Meeting with Heads and Directors (Vancouver) Meeting with Chair of Senior Appointments Committee (Vancouver) Focus Group, Undergraduate Students (Okanagan)
JANUARY 22, 2020 JANUARY 30, 2020 FEBRUARY 12, 2020 FEBRUARY 21, 2020 FEBRUARY 24, 2020
Interim Report to Senate (Vancouver) Interim Report to Senate (Okanagan) Open Forum for Students (Vancouver) Meeting w/ Senior Appointments Committee (Vancouver & Okanagan) Meeting with Disability Resource Centre (Okanagan)
MARCH 05, 2020 MARCH 06, 2020
Town Hall with Enrolment Services Student Advisory Committee (Vancouver) Meeting with Graduate Student Advisory Committee (Okanagan)
APRIL 06, 2020 APRIL 22, 2020 NOVEMBER 25 2019 - MARCH 12 2020
Online Open Forum for Faculty, Staff & Students (Vancouver & Okanagan) Meeting with Committee of Deans (Vancouver) Open Online Survey (results summarized in Appendix 4)