to work or not to work? the growing child care … · to work or not to work? the growing child...
TRANSCRIPT

To Work or Not To Work?
The Growing Child Care
Dilemma Faced by
Families and Employers

PRESENTING SPONSOR

VIP SPONSOR

CORPORATE SPONSOR

U.S. CHAMBER OF COMMERCE
FOUNDATION
Speakers:
Caitlin Codella
Lucy Davidson

THE CASE FOR
HIGH-QUALITY CHILDCARE
THE CENTER FOR EDUCATION A N D W O R K F O R C E

High-Quality Early Education:
A Crucial Economic DriverHigh quality, affordable, and accessible early education ensures:
2
Strong Businesses
Skilled and productive workers
keeping the US at the helm of
innovation.
A Strong Workforce
Bridging the Skills Gap:
Strength for today, quality for
tomorrow.
1 3
A Strong Economy
Workers contributing to
our shared wealth and
economic growth.
But, America faces a significant challenge when it comes to meeting the early
education and care needs of today’s workers and children.

Workforce Development Challenges:Quality early childhood education must be part of the solution
40% of businesses can’t
take on more work because
they can’t fill open jobs.
By 2020, there will be 6
million unfilled jobs
America is facing an unprecedented workforce
crisis: a large and growing shortage of skilled
workers.

The FactsHigh-quality early education matters for:
2
The Current
Workforce
1 3
Business and the
Economy
The Future
Workforce

Where Do We Go From Here?
Strengthening the workforce
of today
A Two-Generation Approach to a Prosperous Workforce
Building the workforce
of tomorrow

Care
Education
Early Education Begins at BirthThe U.S. Chamber of Commerce Foundation is committed to improving and expanding access to quality early
learning programs, as well as supporting the care needs of the current workforce.

1. Child development is the foundation of prosperous communities
1. Brains are built over time, from the bottom up (simple skills beget more complex skills)
1. Genes and experiences together build brains (serve and return relationships)
1. Cognitive, social and emotional development are inextricably intertwined - skill ropes
1. Toxic stress damages brain architecture
1. Resilience is built through combined impact of genes and experiences of a child (not an internal character strength)
1. For many functions, the brain’s capacity for change decreases over time (cost-effectiveness factor) - but not all functions are impacted equally
The critical importance of the early years

BUILDING A
BRAIN
The 60 months from birth through
age four is the most critical
period of human development
First three years matter
Rapid brain development
1-2 million synapses formed per second in the early years)
Experiences wire the brain
Experience Shapes Brain Architecture
by Over-Production Followed by
Pruning Through Childhood


What supports
healthy learning
and development?
• Secure relationships
• Language rich engagement with adults
• Serve and return interactions
• Supportive environment to buffer stress


WHY DOES IT
MATTER? Gaps emerge early
Gaps between advantaged and disadvantaged children begin emerging as early as 9 months of age
Economic Mobility
43% of children born into the bottom
income quintile remained in the
bottom quintile as adults
Early disruption = long term
problems
While positive interactions wire the
brain, so to do negative interactions.
Toxic Stress has a significant impact on a child’s brain development
Impact of adversity
Children who face greater adversity,
like living in poverty, are at far greater
risk for delays in their cognitive,
language, or emotional
development.

A National Picture
Low preschool
attendance
Nationally, only 59% of
four-year-olds are enrolled
in high - quality programs
Low enrollment
In 2015, some 38 percent
of 3-year-olds and 67% of
4-year-olds were enrolled
in pre-primary programs
Children Under 5
33 percent are in non-
relative care
24 percent are in traditional
care centers
39 percent have had no
regular care arrangements

The Current
Workforce

The Current Workforce:
Demographics and Impact
Two-thirds of children under five are living in homes where
all parents work
In 1940, one in ten children under five lived in homes
where all parents work
Women
40 % of Primary Bread-
winners
Mothers
Half of the AmericanWorkforce
1/3 Current Workforce
8 of 10 births
Millennials
Without women in the workforce ~ 1970
Current economy = $2 trillion smaller
Median family income =
$14,000 less

The Current Workforce:Care Access and Quality Challenges
Staying home instead of working
Among nonworking poor with young children, 70% cite “taking care of home/family” as to why
they are not in the workforce and 23 percent of workers reported
downshifting to a part-time schedule or becoming a stay-at-home parent to save money on
child care
Finishing degrees
Among all postsecondary students with children, only 27% attain a
degree within six years. One study found that more than half of the students who had dropped out
had done so for family commitments’. Access to
Childcare was frequently cited as something that would help them
finish their degree.
Quality is hard to find
Only 10 percent of providers in
the U.S. are considered high-
quality
Lack of access
Half of Americans live in an area that has an undersupply of
licensed options

The Current Workforce:Care Affordability Challenges
More than college tuition
Full-time center based care
facility can cost $10,000/ year
Over half of earnings spent on childcare
18% of a medium household
income will be spent on
childcare. For someone earning
minimum wage, that increases
to 64% of earnings
Serious BurdenIn a 2016 survey, nearly one-third of parents who paid for child
care said that child care expenses have caused a financial
problem for their household —and of those, more than 70 percent said it was a serious problem.

The Future
Workforce

Income matters
Fewer than half (48 percent) of poor
children are ready for school at age five,
compared to 75 percent of children from
families with moderate and high income
Attendance
Attending a high-quality early childhood program
predicts higher levels of achievement at age 11, and
is one of the strongest factors in school readiness
Executive functions
High-quality early education provide
children with the scaffolding to build these
skills allowing them to plan, focus, juggle
tasks and remember instruction
The Future
Workforce: School Readiness

The Future
Workforce: Early Education = Strong
ROI
Higher wages later in life +less dependence on social programs
Increased tax revenue
More effective public schools
Improved personal and public health
Less crime and incarceration
More educated, skilled workers
Public Savings:$16 saved for every $1 spent

The Business
Case

The Business Case
Absenteeism costs
U.S. businesses lose $3 billion
annually as the result of
childcare breakdowns
Childcare reduces absenteeism
Businesses report that when
they provided childcare they
decreased employee
absences by up to 30% and
reduced job turnover by as
much as 60%
Retaining and Attracting Talent
83% of millennials say that
they would leave their jobs for
one with more family-friendly
benefits
Workforce of Today
Declining Women’s EmploymentIt has been found that the rising cost of child care has
resulted in a five percent decline in women’s employment
and a 13 percent decline for working mothers with children
under age five.
Increased WagesParents with children
participating in high-quality
early childhood education
saw sustained parental
wage growth

High-quality early learning programs aimed at disadvantaged children help close the achievement
gap, increasing IQ scores by up to 10 points
High School Graduation RatesEarly learning and care increases high school graduation
rates 14%.
College Graduation and Employment RatesChildren participating in high-quality early childhood
education had increased college graduation rates and
increased rates of employment at age 30.
The Business CaseWorkforce of Tomorrow

Business Engagement
Opportunities in
Childcare

No one sector can solve this
chal lenge alone
LeadershipPrivateSector
StrongerWorkforce

Get the facts
Understand why early education matters to your
businesses bottom line and the American economy
Educate
Your executive and leadership team about care and its
central importance to your business
Assess
The ways that you can help be a leader on the issue and
advance early education
✓ Use your voice
✓ Join a coalition
✓ Take stock of your own company
✓ Understand your Quality Rating and Improvement System
Develop
Strategies to implement company policies, influence the
conversation and public policy, and invest in the
community
Be a Business Champion for Childcare

THANK YOU

UNITED WAY FOR GREATER
AUSTIN
Speakers:
Rosie Mendoza
Malini Rajput
For more information, contact Cathy McHorse

POWERED BY
This project is supported by the Health Resources and Services Administration (HRSA) of the U.S. Department of Health and Human Services (HHS) under MIECHV grant #24532533 awarded to United
Way for Greater Austin. The total MIECHV grant is $1.1 Million which is matched by local dollars. This information or content and conclusions are those of the author and should not be construed as
the official position or policy of, nor should any endorsements be inferred by HRSA, HHS or the U.S. Government.

STEERING COMMITTEE
Christina Ayer
Sam Bryant
John Cullen
Libby Doggett
Jesus Garza
Ali Khataw
Earl Maxwell
Matt McDonnell
Rosie Mendoza
Catherine Morse
Reza Piri
Malini Rajput
Leslie Sweet
Mark Williams
Blanca Zamora-Garcia
35

CHILDREN AT RISK
Speakers:
Mandi Sheridan Kimball ([email protected])
Shay Everitt ([email protected])

Access to Quality Child Care in Texas
November 2017
37

Quality child care is quality early education, and leads to…
Higher Graduation Rates and a Better
Prepared Workforce
More Working Families and a
Stronger Economy
…especially for low-income children.
Improved School-Readiness and 3rd
Grade Reading Levels
38

Challenges Facing Child Care in Texas
Low participation in Texas Rising Star (TRS) and other quality programs
Little coordination among key stakeholders
Limited access to quality providers
39

Annual Cost of Child Care in the Capital Area
$0.00
$2,000.00
$4,000.00
$6,000.00
$8,000.00
$10,000.00
Infant Toddler Preschool School Age
Full-day care for an infant and a toddler costs 21% of Travis County’s median household income for a family of 4
Full-day care for an infant and a toddler costs 34% of the income for a family of 4 living at 200% of the federal poverty level (FPL)
Full-day
Part-day
40

Subsidized Child Care
$500 millionallotted by the Federal Government through the Child Care Development Block Grant annually to TWC
Distributed to
28 regional
workforce boards…
…to over 8,000 child
care centers and homes.
41

TWC Funding per Low-Income Child with Working Parents by TWC Board
42

Source: Texas Department of Family and Protective Services and Texas Workforce Commission
50% of child care providers accept subsidies…
…but only 16%of those are Texas Rising Star-certified
43

Texas Rising Star Participation by TWC Board
44

27%49%
37%50%
47%58%
51%39%
21%53%
59%
59%38%
50%38%44%
34%41%
54%72%
40%35%
14%13%13%12%
9%8%8%7%7%7%6%
Subsidy and Texas Rising Star Participation by Region
CAMERON (n=246)
Providers Not Accepting Child Care Subsidies
Providers Accepting Subsidies but Are Not TRS Certified
TRS Certified Providers
EL PASO (n=455)
POTTER/RANDALL (n=112)
TRAVIS (n=734)
DALLAS (n=1286)
TARRANT (n=1236)
TEXAS (n=15340)
HIDALGO (n=511)
BEXAR (n=904)
LUBBOCK (n=189)
HARRIS (n=2895)
n=Total number of licensed child care providers in each region
45

6%8%12%
25%26%
13%36%
49%25%
53%
14%20%
24%21%
15%28%
41%36%
27%53%
33%
86%73%
68%67%
61%46%46%
29%23%22%
13%
Texas Rising Star Level Comparison by Region
TEXAS (n=1188)
TRS Level 2 TRS Level 3 TRS Level 4
HIDALGO (n=37)
EL PASO (n=64)
TRAVIS (n=90)
BEXAR (n=61)
TARRANT (n=100)
HARRIS (n=172)
CAMERON (n=32)
DALLAS (n=111)
POTTER/RANDALL (n=15)
n=Total number of TRS providers in each region
46

Travis County Characteristics
Only includes child care demand among low-
income children
231 subsidized seats per
1000
65 Texas Rising Star-
certified seats per 1000
44 TRS 4-star seats per
1000
47

Travis County Median Household Income by Desert Type
48

Travis County Race and Ethnicity by Desert Type
49

Undersupply & Oversupply: Austin’s TRS Seats
ZIP CodeTRS Seats per 1000 Low-
Income Children
78634 0
78654 0
78669 0
78724 0
78726 0
78729 0
78734 0
78735 0
78737 0
78748 0
78753 3
78725 6
78721 10
78741 14
78744 20
78747 22
78664 24
78621 24
78752 27
78617 42
78759 45
78660 47
78610 48
ZIP CodeNumber of Surplus TRS
Seats
78749 50
50
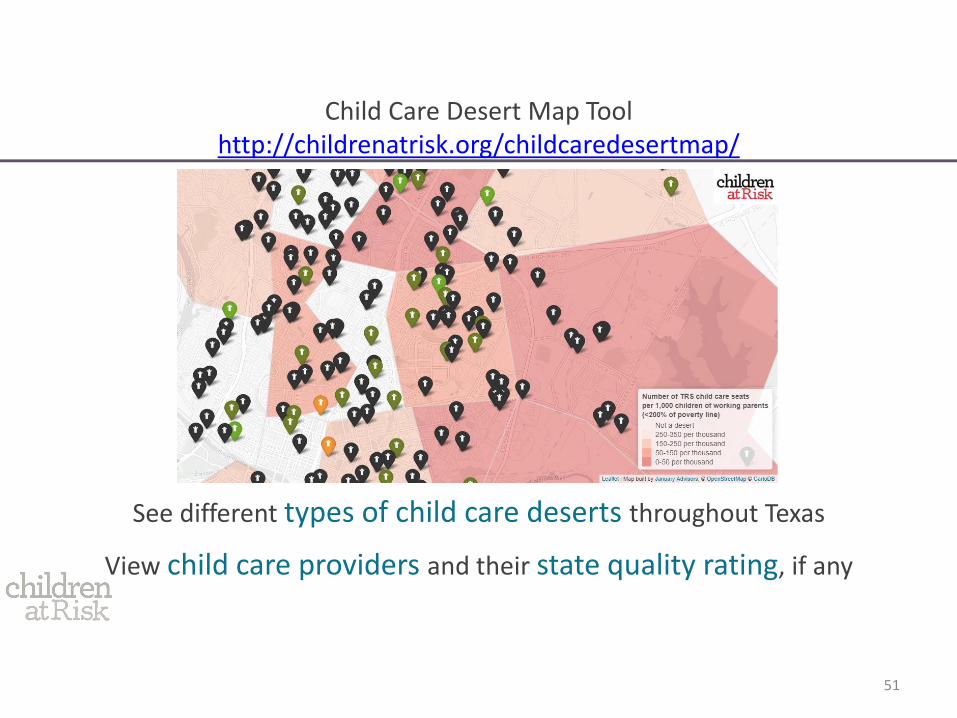
Child Care Desert Map Toolhttp://childrenatrisk.org/childcaredesertmap/
See different types of child care deserts throughout Texas
View child care providers and their state quality rating, if any
51

Child Care Desert Map Toolhttp://childrenatrisk.org/childcaredesertmap/
Map child care providers near local elementary schools to target public-private partnerships and other policy solutions
See desert rates at the ZIP code level
52

Encourage parents to
choose quality
Use your
networks
Talk to your
public officials
Use your
business
What can you do?
53

PANEL
Speakers:
Cheslee Escobedo – KinderCare Education
Jessica Olson – Austin Diagnostic Clinic
Cynthea Rhodes-Patterson –The Home Depot
Moderator: Drew Scheberle – Austin Chamber of Commerce

Thank you.