tomotherapy for post-mastectomy radiotherapy … · the department of physics and astronomy by...
TRANSCRIPT

TOMOTHERAPY FOR POST-MASTECTOMY RADIOTHERAPY
(PMRT): COMPARISON WITH CONVENTIONAL ELECTRON
BEAM TECHNIQUE
A THESIS
Submitted to the Graduate Faculty of the
Louisiana State University and
Agricultural and Mechanical College
in partial fulfillment of the
requirements for the degree of
Master of Science
in
The Department of Physics and Astronomy
by
Michael Sissay Ashenafi
B.S. Southern University and Agricultural and Mechanical College, 2002
December, 2006

ii
This work is dedicated to my late grandmother,
Adada
rest in peace

iii
Acknowledgements
My gratitude goes to Almighty God for giving me strength and helping me to reach
where I am right now.
I thank my major advisor, Dr. Robert Boyd, who was always encouraging and
motivating, and had endless patience with me. Without his help, I would have been
overwhelmed. I also would like to thank Dr. Kenneth Hogstrom. He was a great teacher
and mentor; I learned volumes from him. Also I would like to thank my other committee
members: Drs. Greg Stacy, Kenneth Lo, and John Gibbons. They provided invaluable
assistance in developing the project. I also wish to express my appreciation to Dr. Tae
Kyu Lee for developing an “in house” radiation biological program.
A special thanks is extended to Mary Bird Perkins Cancer Center for allowing me to
use their facility for my thesis research project. I would also like to thank all the staff at
MBPCC; they are a wealth of knowledge that is impossible to fully appreciate.
I wish to thank Drs. Henry Hardy, Mostafa Elaasar, Diola Bagayoko, Kenneth
Mathews, Dennis Cheek, Oscar Hidalgo, Erno Sajeo, Mr. Connel Chu and Ms. Yvonne
Thomas for their constant support throughout my matriculation, without them I would not
be where I am right now.
I would like to convey special appreciation to my family: grand parents: A. Asfaw
and T. Asfaw, my parents: S. Ashenafi and B. Abraham, my siblings: Nebiat, Mary, and
Adoni, my aunt and uncle in-law: Emebet Abraham and Fikru. Thank you for your
endless sacrifices and unconditional love. I feel blessed to have such a wonderful family.
My acknowledgements would not be complete if I would not thank my friends.
Selam, words are not enough to say how grateful I am to know you.
iv
Table of Contents
Acknowledgements....................................................................................................... iii
List of Tables ............................................................................................................... vii
List of Figures ................................................................................................................ix
Abstract ..........................................................................................................................xi
1. Introduction...............................................................................................................1
1.1 Overview.............................................................................................................1
1.2 Significance of TomoTherapy vs. Electron Beams ............................................3
1.3 Postmastectomy Radiation Therapy (PMRT).....................................................5
1.3.1 Overview....................................................................................................5
1.3.2 Conventioanl Electron PMRT Technique..................................................6
1.3.3 Complication Associated with PMRT .......................................................7
1.3.4 IMRT..........................................................................................................9
1.4 Hypothesis/Specific Aims.................................................................................10
2. Materials and Methods............................................................................................12
2.1 Overview of Study ............................................................................................12
2.2 Aim 1: Patient Database....................................................................................13
2.3 Aim 2: TomoTherapy PMRT Treatment Plans ................................................17
2.3.1 Importing CT Data...................................................................................17
2.3.2 TomoTherapy Dose Prescription .............................................................17
2.3.3 TomoTherapy Plan Parameters................................................................18
2.3.4 Dose Limiting Structures ........................................................................18
2.3.5 TomoTherapy Optimization and Dose Calculation .................................19
2.4 Aim 3: Generate Dose-Volume Treatment Plan Metrics..................................22
2.5 Aim 4: Radiation Oncologist Evaluation of Treatment Plans ..........................23
2.6 Aim 5: Determine Biological Treatment Plan Evaluation Tools .....................24
2.6.1 Tumor Control Probability (TCP)............................................................24
2.6.2 Normal Tissue Complication Probability (NTCP) for The Lung ............26
2.6.3 Normal Tissue Complication Probability (NTCP) for The Heart............27
2.6.4 Secondary Cancer Complication Probability (SCCP) for The Lung .......28
3. Results ....................................................................................................................32
3.1 Format for Presenting Results of Each Patient .................................................32
3.2 Patient One........................................................................................................33
3.2.1 Isodose Comparisons ...............................................................................33
3.2.2 DVH Comparisons...................................................................................37
3.2.3 Radiation Oncologist Review ..................................................................38
3.2.4 Chest Wall................................................................................................39
3.2.5 Ipsilateral Lung ........................................................................................40
3.2.6 Heart.........................................................................................................40
3.2.7 Contralateral Breast .................................................................................41

v
3.2.8 Normal Tissue..........................................................................................42
3.3 Patient Two .......................................................................................................42
3.3.1 Isodose Comparisons ...............................................................................42
3.3.2 DVH Comparisons...................................................................................47
3.3.3 Radiation Oncologist Review ..................................................................47
3.3.4 Chest Wall................................................................................................48
3.3.5 Ipsilateral Lung ........................................................................................48
3.3.6 Heart.........................................................................................................49
3.3.7 Contralateral Breast .................................................................................49
3.3.8 Normal Tissue..........................................................................................49
3.4 Patient Three .....................................................................................................50
3.4.1 Isodose Comparisons ...............................................................................50
3.4.2 DVH Comparisons...................................................................................55
3.4.3 Radiation Oncologist Review ..................................................................56
3.4.4 Chest Wall................................................................................................56
3.4.5 Ipsilateral Lung ........................................................................................56
3.4.6 Heart.........................................................................................................57
3.4.7 Contralateral Breast .................................................................................57
3.4.8 Normal Tissue..........................................................................................57
3.5 Patient Four.......................................................................................................58
3.5.1 Isodose Comparisons ...............................................................................58
3.5.2 DVH Comparisons...................................................................................60
3.5.3 Radiation Oncologist Review ..................................................................63
3.5.4 Chest Wall................................................................................................63
3.5.5 Ipsilateral Lung ........................................................................................64
3.5.6 Heart.........................................................................................................64
3.5.7 Contralateral Breast .................................................................................65
3.5.8 Normal Tissue..........................................................................................65
3.6 Patient Five .......................................................................................................65
3.6.1 Isodose Comparisons ...............................................................................66
3.6.2 DVH Comparisons...................................................................................70
3.6.3 Radiation Oncologist Review ..................................................................70
3.6.4 Chest Wall................................................................................................71
3.6.5 Ipsilateral Lung ........................................................................................71
3.6.6 Heart.........................................................................................................71
3.6.7 Contralateral Breast .................................................................................72
3.6.8 Normal Tissue..........................................................................................72
3.7 Summary: Tables of Review ...........................................................................72
3.7.1 Chest Wall................................................................................................73
3.7.2 Lung .........................................................................................................74
3.7.3 Heart.........................................................................................................76
3.7.4 Contralateral Breast .................................................................................78
3.7.5 Normal Tissue..........................................................................................79

vi
4. Discussions ..............................................................................................................81
4.1 Similarities Between The TomoTherapy and Conventional Plans ...................81
4.2 Differences Between the TomoTherapy and Conventional Plans ....................81
4.3 Overview of Doctor’s Review ..........................................................................84
5. Conclusions...............................................................................................................86
6. Future Works ............................................................................................................87
6.1 Additional Treatment Studies ...........................................................................87
6.2 Accuracy of Dose Calculation on Surface ........................................................87
6.3 Impact of Breathing Motion..............................................................................87
6.4 Utility of Skin Collimation ...............................................................................88
References ....................................................................................................................89
Appendix A: Radiation Oncologist Evaluation of Treatment Plans .............................93
Appendix B: Acronyms ................................................................................................95
Vita................................................................................................................................96

vii
List of Tables
1. TomoTherapy plan parameter specifications .........................................................18
2. Table 2. Typical PTV (a) and RAR (b) constraints upon completion of
optimization ............................................................................................................21
3. Radiation oncologist specifications .......................................................................23
4. Parameters selected to calculate TCP for chest wall ..............................................26
5. Parameters selected to calculate NTCP for lung.....................................................27
6. Parameters selected to calculate NTCP for heart....................................................28
7. Parameters selected to calculate SCCP for lung. ....................................................30
8. Parameters selected to calculate SCCP for the contralateral breast........................30
9. Parameters selected to calculate SCCP for the normal tissue.................................30
10. Summary of the radiation oncologist plan review ..................................................73
11. Dmean (Gy) for PTV: Chest Wall (Average + Standard deviation).......................74
12. D90% – D10% (Gy) for PTV: CW..............................................................................74
13. Calculated TCP values for CW PTV ......................................................................74
14. Percent volume of the ipsilateral lung receiving > 20 Gy ......................................75
15. Calculated NTCP values for radiation pneumonitis ...............................................75
16. Percent volume of the total lung (ipsilateral + contralateral) > 20 Gy ...................76
17. Ipsilateral lung’s calculated SCCP values ..............................................................76
18. Total lung’s calculated SCCP values......................................................................76
19. Percent volume of the heart receiving > 30 Gy ......................................................77
20. Percent volume of the heart receiving > 15 Gy ......................................................77
21. Calculated NTCP values for excess cardiac mortality due to Ischaemic disease
after radiotherapy....................................................................................................78
22. Dmean (Gy) for contralateral breast (Average + Standard deviation)....................78
23. Percent volume of the contralateral breast receiving > 5 Gy..................................78

viii
24. Calculated SCCP values for solid tumor in the contralateral breast after
radiotherapy ............................................................................................................79
25. Percent volume of normal tissue (delineated tissue volume except critical structures)
receiving between 5 and 25 Gy...............................................................................79
26. Calculated SCCP values for normal tissue .............................................................80

ix
List of Figures
1. Schematic of helical TomoTherapy unit. The commercially available TomoTherapy
system does not have an on-board kilo voltage imaging system, rather it uses but have
a megavoltage CT (Courtesy TomoTherapy Inc. Madison, WI) ..............................2
2. Conventional electron PMRT technique. The CW and IMN are treated with electron
beams and the SCl/AX is treated with photon beams...............................................7
3. Figure 3 shows an example of converting the 90% isodose line (45 Gy) shown in (a)
to a CW PTV (b).The 45 Gy isodose line, 90% of the prescribed dose, is shown as a
thick yellow contour. The converted PTV is shown as a solid red area .................16
4. A dose limiting structure called ring.......................................................................20
5. A directional blocking structure (Structure is directional blocked, so that no primary
beam should pass through it before passing through the PTV structure) ...............20
6. Estimated solid tumors induction as function of homogenous organ dose for normal
tissue (based on Schneider’s model, Schneider et al 2005a). .................................31
7. Transverse views of the conventional plan (a) and TomoTherapy plan (b) taken at the
supraclavicular nodal region shown on sagittal view (c)........................................35
8. Transverse views of the conventional plan (a) and TomoTherapy plan (b) taken at the
IMN region as shown on the sagittal view (c) .......................................................36
9. Transverse views of the conventional plan (a) and TomoTherapy plan (b) taken at the
chest wall region as shown on the sagittal view (c)................................................38
10. DVH comparisons for distribution shown in Figures 7 to 9. Solid lines – conventional
plan, dashed lines –TomoTherapy plan. CW – chest wall target; SCl/AX –
supraclavicular/axillary target; Ipsi – ipsilateral; Cont – contralateral ...................39
11. The dDVH of the ipsilateral lung............................................................................41
12. Transverse views of the conventional plan (a) and TomoTherapy plan (b) taken at the
supraclavicular nodal region shown on sagittal view (c)........................................44
13. Transverse views of the conventional plan (a) and TomoTherapy plan (b) taken at the
IMN region as shown on the sagittal view (c) .......................................................45
14. Transverse views of the conventional plan (a) and TomoTherapy plan (b) taken at the
chest wall region as shown on the sagittal view (c)................................................46
15. DVH comparisons for distribution shown in Figures 12 to 14. Solid lines –
conventional plan, dashed lines –TomoTherapy plan. CW – chest wall target; SCl/AX
– supraclavicular/axillary target; Ipsi – ipsilateral; Cont – contralateral ................47

x
16. Transverse views of the conventional plan (a) and TomoTherapy plan (b) taken at the
supraclavicular nodal region shown on sagittal view (c)........................................51
17. Transverse views of the conventional plan (a) and TomoTherapy plan (b) taken at the
IMN region as shown on the sagittal view (c) .......................................................53
18. Transverse views of the conventional plan (a) and TomoTherapy plan (b) taken at the
chest wall region as shown on the sagittal view (c)................................................54
19. DVH comparisons for distribution shown in Figures 16 to 18. Solid lines –
conventional plan, dashed lines –TomoTherapy plan. CW – chest wall target; SCl/AX
– supraclavicular/axillary target; Ipsi – ipsilateral; Cont – contralateral ................55
20. Transverse views of the conventional plan (a) and TomoTherapy plan (b) taken at the
supraclavicular nodal region shown on sagittal view (c)........................................59
21. Transverse views of the conventional plan (a) and TomoTherapy plan (b) taken at the
IMN region as shown on the sagittal view (c) .......................................................61
22. Transverse views of the conventional plan (a) and TomoTherapy plan (b) taken at the
chest wall region as shown on the sagittal view (c)................................................62
23. DVH comparisons for distribution shown in Figures 20 to 22. Solid lines –
conventional plan, dashed lines –TomoTherapy plan. CW – chest wall target; SCl/AX
– supraclavicular/axillary target; Ipsi – ipsilateral; Cont – contralateral ................63
24. Transverse views of the conventional plan (a) and TomoTherapy plan (b) taken at the
supraclavicular nodal region shown on sagittal view (c)........................................67
25. Transverse views of the conventional plan (a) and TomoTherapy plan (b) taken at the
IMN region as shown on the sagittal view (c) .......................................................68
26. Transverse views of the conventional plan (a) and TomoTherapy plan (b) taken at the
chest wall region as shown on the sagittal view (c)................................................69
27. DVH comparisons for distribution shown in Figures 21 to 23. Solid lines –
conventional plan, dashed lines –TomoTherapy plan. CW – chest wall target; SCl/AX
– supraclavicular/axillary target; Ipsi – ipsilateral; Cont – contralateral ................70

xi
Abstract
Purpose: TomoTherapy, capable of delivering intensity-modulated, image-guided
radiotherapy with a helical fan-beam, multileaf-collimated beam and detector array
mounted on a CT ring, is challenging the treatment techniques commonly used in today’s
radiotherapy clinic. The present works investigates the potential of using TomoTherapy
in lieu of electron beams for treatment of the chest wall in post-mastectomy radiotherapy
(PMRT). It is hypothesized that TomoTherapy can plan dose distributions for PMRT
patients, that a pre-selected radiation oncologist judges to be equal to or better than that
of a conventional plan treated with electron beams.
Methods: A patient database of retrospective conventional PMRT treatment plans was
generated, including contoured target and critical structure region-of-interest volumes. A
TomoTherapy plan was generated for five patients out of the database using the same
treatment criteria as the conventional plan. The TomoTherapy plan and the conventional
plan was evaluated and compared by a radiation oncologist using a simplified scoring
system. Physical and radiobiological dose metrics were generated from the treatment
plans to supplement the evaluation of the radiation oncologist.
Results: Four of the five TomoTherapy plans were rated superior to the rival
conventional electron beam treatment plan, and the other Tomotherapy plan was rated
marginally superior. The TomoTherapy plan was able to spare the ipsilateral lung and
heart of excessive dose as well as the conventional plan, while delivering a more
homogeneous dose distribution to the target volumes. However, the TomoTherapy plan
showed the contralateral breast receiving an average dose of 2.9 Gy as opposed to 0.4 Gy
for the conventional electron beam plan, and a greater volume of normal tissue outside

xii
the target volumes receiving dose between 5 and 25 Gy (average percent volume was
33% for the TomoTherapy plan and 5 % for the electron beam plan). This could affect
the radiation oncologist’s decision to use TomoTherapy for younger patients who are at
greater risk of developing radiation-induced secondary cancers.
Conclusion: The study showed TomoTherapy can deliver dose distributions the radiation
oncologist judges to be equal to or better than that of a conventional electron beam
PMRT plan for five treatment plans.

1
Chapter 1
Introduction
1.1. Overview
During the last decade, the radiotherapy clinic has seen numerous advances in
technology designed to deliver practical and highly conformal dose distribution that
better spare critical organs while dosing planning PTV volumes (PTVs) to tumorcidal
levels. Intensity-modulated radiotherapy (IMRT), using multi-leaf collimators and
advanced 3D treatment planning systems capable of inverse planning, is the most well
known recent advance in radiotherapy technology (Galvin et al. 2001). IMRT with the
help of a computerized optimization algorithms provides variable-intensity fields that
replace uniform intensity ones. Typically, IMRT improves PTV coverage and
conformality and reduces PTV dose inhomogeneity. The principle of IMRT is to treat a
patient from a number of different directions (or continuous arcs) with beams of non-
uniform fluences, which have been optimized to deliver a high dose to the PTV volume
and acceptable low dose to the surrounding normal structures (Khan 2003).
Tomotherapy is a novel approach to the delivery of IMRT (Mackie et al. 1993).
Figure 1 shows TomoTherapy Hi-Art System developed by the TomoTherapy Inc.
(Madison, WI) was designed to provide tomotherapy in a helical motion much like
current CT machines acquire images. TomoTherapy delivers photon IMRT dose
distributions with a continuously rotating, helical fan beam using a binary multi-leaf
collimator, and it utilizes an onboard mega-voltage computerized tomography system
(MVCT) that allows for image-guided radiotherapy (IGRT). As in an ordinary helical
computed tomography (CT) scanner, the patient is continuously translated through a ring
gantry as the fan beam rotates.

2
Figure 1. Schematic of helical TomoTherapy unit. The commercially available
TomoTherapy system does not have an on-board kilo voltage imaging system,
rather it uses a megavoltage CT (Courtesy TomoTherapy Inc. Madison, WI)
TomoTherapy differs from fixed-beam linear accelerator IMRT in several ways. First,
in fixed-beam IMRT beam directions are selected by the planner before the beam
intensity patterns are modulated with the optimizer. TomoTherapy uses all beamlet
orientations within a 40-cm wide fan beam that intersect the PTVs and optimally weights
them to achieve user-defined volumetric dose goals and limitations. A beamlet is a single
leaf-pair opening in one projected angle. There are 64 binary leaf-pairs in any projected
angle and 51 projected angles in each rotation, making a total of 3264 possible beamlets
in each rotation. This greater degree of freedom on the part of the optimizer in selecting
beam incidence may allow for improvements in the planning of more complex
treatments. However, it also may irradiate significant regions of tissue outside the PTV to
achieve volumetric dose goals unless dose constraints have been placed on those regions.
Also, the TomoTherapy helical delivery allows the treatment of extended treatment

3
volumes without the need for junctioning fields (Bauman et al. 2005). However,
TomoTherapy beams are limited to axial beams, i.e., beams directed perpendicular to the
TomoTherapy gantry axis.
One obvious difference between a multi-modality linear accelerator and
TomoTherapy is that the latter does not offer electron beams. Electron beams are
advantageous in that dose falls rapidly off distal to the treatment volume which makes
this modality ideal for treating superficial PTVs, often with a single beam. There are a
multitude of treatment sites that use electrons exclusively or in combination with photon
beams, especially sites within the breast and head and neck (Tapley 1976 and Hogstrom
2003a).
1.2. Significance of TomoTherapy vs. Electron Beams
Published comparisons between TomoTherapy and mixed beams are limited in
number. Lock et al. (2002) compared a conventional photon/electron total scalp
irradiation technique Tung et al. (1993) with a serial tomotherapy treatment delivered
with the NOMOS MIMiC system. They concluded that the conventional technique was
superior in sparing critical structures, such as the eyes, although the tomotherapy
treatment delivered much greater dose homogeneity to the PTV and provided better
sparing of the parotid glands. However, the study did not explore the possibility of
relaxing PTV dose homogeneity to better spare critical structures and achieve a
comparably similar plan to the conventional irradiation technique. Orton et al. (2005)
showed that a TomoTherapy dose distribution was superior for treating total scalp due to
PTV dose homogeneity and sparing of critical structures such as the eyes.
Superficial lesions (depth < 6cm) have traditionally been treated with the electron
radiation techniques. Because electrons are directly ionizing particles and deliver high

4
dose on the surface while sparing critical structures due to limited particle range making
electrons a good candidate to treat superficial PTVs. However for large treatment areas,
abutting adjacent electron fields can in some circumstances result in either overdosing or
under dosing the junctioned areas. In Mary Bird Perkins Cancer Center (MBPCC) where
the project was conducted, shifting the abutment borders during the course of treatment is
done to minimize dose heterogeneity at field junctions. This requires considerable effort
in the planning of both field shapes and positions, and requires careful observation of the
abutment regions during the course of radiotherapy.
Eliminating problems associated with a field junction is often necessary, especially
for large, superficial chest wall PTVs in post-mastectomy radiation therapy (PMRT). An
ideal technique should deliver a homogenous dose to the PTV including the matchline, if
deemed to be a risk, while minimizing normal tissue radiation exposure without
compromising the PTV treatment. Although this can be achieved in part with arc therapy
(Hogstrom 2003a), that technology is complex and not often used.
Prior studies by Krueger et al. (2003) demonstrated the feasibility and possible utility
of IMRT for post-mastectomy breast patients. Unlike traditional methods, the IMRT
technique significantly reduced problems associated with field junctioning and improved
the dose homogeneity in the chest wall. The natural extension of this technique for
PMRT is the use of arcing modulated photon beams, and TomoTherapy may seem an
ideal candidate for this technique. The ability to treat extended treatment volumes
without the need for fixed-beam field junctioning, and the greater degree of freedom on
part of the optimizer in selecting beam incidence, may give TomoTherapy an advantage
over conventional fixed-beam linear accelerator techniques.

5
Although TomoTherapy is a relatively new technology, its presence is being felt
throughout the radiotherapy community. When using a new technology, the question of
improvement in dose delivery, cost, and outcome create a complex environment to
answer the question: Does the technology significantly improve patient care (Lock et al.
2002)? This investigation focused on a more specific question: Are TomoTherapy
treatment plans for PMRT patients comparable to conventional (electron field) technique
treatment plans?
1.3. Postmastectomy Radiation Therapy (PMRT)
1.3.1. Overview
Although radiotherapy in the treatment of breast cancer is associated with an ncreased
risk of complication, subsequent studies showed its advantage in improving cancer
survival overrides the risks associated with the radiation treatment. Rutqvitst et al. (1990)
showed that post-operative radiation therapy for early breast cancer produces a sustained
improvement of recurrence free survival, mainly through prevention of locoregional
recurrences. Other studies have subsequently shown a significant improvement in
survival for patients who underwent radiation treatment after surgical mastectomy (Ragaz
et al. 1997, Overgaard et al. 1997 and 1999). On the basis of these and other studies, a
National Institutes of Health consensus panel recommended locoregional PMRT in
patients with > 4 positive axillary lymph nodes and/or T3 and T4 staged lesions (Eifel et
al. 2000). As a result, many institutions offer comprehensive PMRT for high risk breast
cancer patients who have undergone mastectomy.
PMRT PTVs the chest wall (CW) and regional lymph nodes such as the
supraclavicular (SCl), the internal mammary chain (IMN), and the axillary (AX) nodes.
Due to the complexity of the treatment, different techniques exist, with no single

6
technique being accepted as a gold standard. Pierce et al. (2002) investigated seven
commonly used conventional techniques for irradiation of post mastectomy CW patients,
namely: 1. Standard tangents; 2. Electron fields; 3. Cobalt fields; 4. Reverse hockey stick
(RHS); 5. 30%/70% Photon/Electron mix; 6. 20%/80% Photon/Electron mix; and 7.
Partially wide tangent fields (PWTF). The study concluded that none of the techniques
combined the best CW and IMN coverage with minimal lung and heart complication
probabilities, i.e., no single technique was found to be superior for all treatment goals.
However, among the seven discussed techniques, the use of PWTFs was found to
produce the most appropriate compromise of PTV coverage and normal tissue sparing.
The study did not take IMRT into consideration. In conclusion, the selection of PMRT
technique should be based on clinical discretion and technical expertise available to
implement complex treatment plans. Clinical discretion encompasses estimated risk
reduction in locoregional recurrence and its potential impact on survival, and the
predicted complication risk for each patient.
1.3.2. Conventional Electron PMRT Technique
In our study, we have chosen to compare TomoTherapy with a conventional electron
and photon beam technique commonly used to treat PMRT patients at Mary Bird Perkins
Cancer Center. In this technique, a total of five fields are typically used (Figure 2). The
medial CW is treated with an anterior electron field and the lateral CW is treated with an
oblique electron field. The IMN is treated with an anterior electron field, and parallel-
opposed photon fields (6 MV) are used to treat the region containing the
supraclavicular/axillary nodes (SCl/AX). As discussed in the previous section, matching
adjacent electron fields presents a considerable problem for this technique at the border
of medial and lateral chest-wall fields because converging central axes create a large

7
overlap (Hogstrom 2003a). This problem is addressed in the clinic by moving the
junction between the lateral and medial fields every week over the typical 5-week course
of treatment to reduce the magnitude of dose heterogeneity.
Figure 2. Conventional electron PMRT technique. The CW and IMN are treated with
electron beams and the SCl/AX is treated with photon beams.
1.3.3. Complications Associated with PMRT
The close proximity of the lung and heart to the CW and IMN poses problems for
PMRT. Radiation exposure risks to the heart and to the lung include pericarditis and
pneumonitis respectively. According to Emami et al. (1991), 50 Gy causes a probability
of 50 % complication (pericarditis) and 24.5 Gy causes a probability of 50 %
complication (pneumonitis) within five years. The concern for complication is amplified

8
if patients are likely to receive systemic chemotherapy agents with known cardiac and
pulmonary toxicity (Krueger et al. 2003). Hence, individual treatment planning warrants
complex field arrangements that strive to spare critical structures but at the same time
deliver the prescribed dose to designated treatment areas.
Biological dose-response models are useful for evaluating plans. Biological dose
metrics associated with these models include the tumor control probability (TCP), the
normal tissue complication probability (NTCP) for organs at risk, and the secondary
cancer complication probability (SCCP). Researchers using available epidemiological
data have used these models to describe complications associated with radiation therapy.
However, the values generated by TCP, NTCP and SCCP models should not be used to
predict absolute biological impact as there is still concern in the scientific community to
their accuracy (Perez and Brady, 1998). On the other hand, TCP, NTCP and SCCP
models are useful for comparing rival plans and techniques (Perez and Brady, 1998).
Gagliardi et al. (1996) demonstrated the relative seriality model (Kallman et al.,
1992) can be used to quantitatively describe the dose response relationship for excess
cardiac mortality on the basis of given clinical data. The study showed that a dose
reduction to the heart has more importance than a restriction of the irradiated heart
volume. In this model, the heart’s functional subunits are regarded as an organ with a
parallel structure of serially aligned subunits.
The risk of secondary cancer induction in the contralateral breast is also of concern in
radiotherapy of breast cancer. Storm et al. (1992) conducted a case-control study in
cohort of 56,540 women in Denmark diagnosed with invasive breast cancer from 1943
through 1978. The average age at the time of radiation exposure in this study was 51
years, and 2.51 Gy was the mean radiation dose to the contralateral breast. The result of
9
their study indicated that the radiation treatment of women with breast cancer does not
significantly increase the risk of development of contralateral breast cancer. They
attributed the negative finding to the age at radiation exposure. Most published positive
findings for radiation-associated risk has been concentrated in young patients, less than
30 years at time of exposure (Hancock et al. 1993).
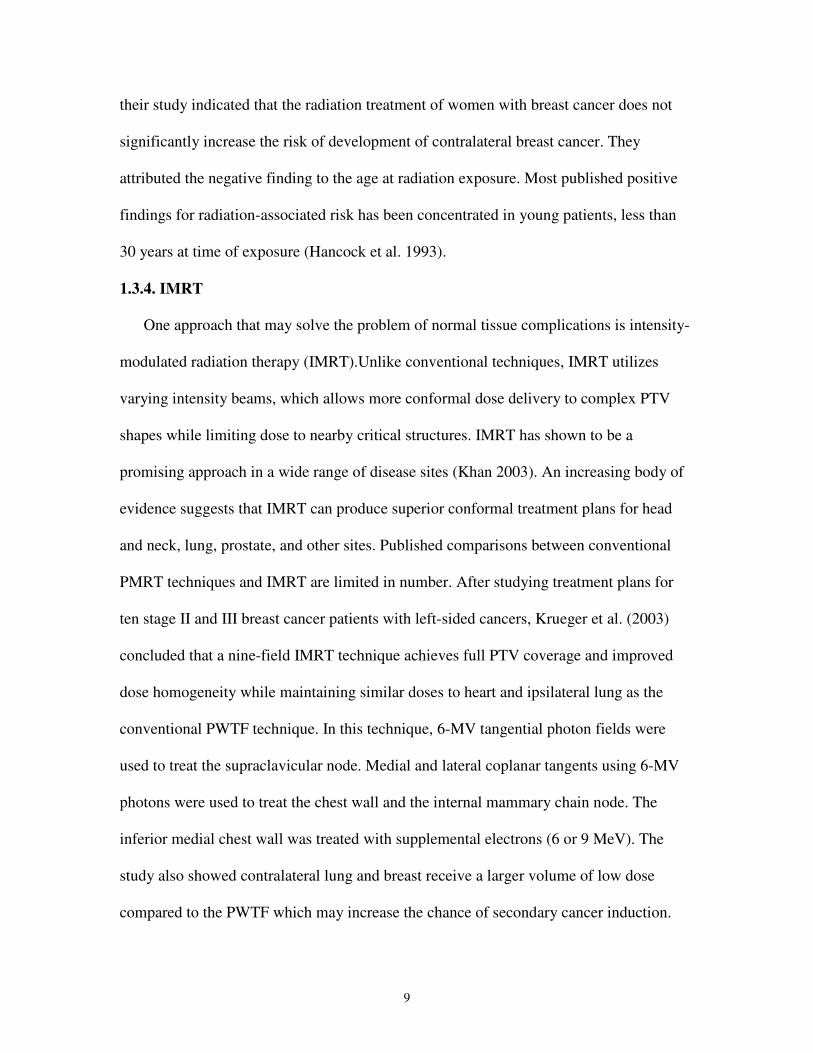
1.3.4. IMRT
One approach that may solve the problem of normal tissue complications is intensity-
modulated radiation therapy (IMRT).Unlike conventional techniques, IMRT utilizes
varying intensity beams, which allows more conformal dose delivery to complex PTV
shapes while limiting dose to nearby critical structures. IMRT has shown to be a
promising approach in a wide range of disease sites (Khan 2003). An increasing body of
evidence suggests that IMRT can produce superior conformal treatment plans for head
and neck, lung, prostate, and other sites. Published comparisons between conventional
PMRT techniques and IMRT are limited in number. After studying treatment plans for
ten stage II and III breast cancer patients with left-sided cancers, Krueger et al. (2003)
concluded that a nine-field IMRT technique achieves full PTV coverage and improved
dose homogeneity while maintaining similar doses to heart and ipsilateral lung as the
conventional PWTF technique. In this technique, 6-MV tangential photon fields were
used to treat the supraclavicular node. Medial and lateral coplanar tangents using 6-MV
photons were used to treat the chest wall and the internal mammary chain node. The
inferior medial chest wall was treated with supplemental electrons (6 or 9 MeV). The
study also showed contralateral lung and breast receive a larger volume of low dose
compared to the PWTF which may increase the chance of secondary cancer induction.

10
1.4. Hypothesis/Specific Aims
The hypothesis of current study is that TomoTherapy can plan dose distributions for
PMRT patients, that a pre-selected radiation oncologist judges to be equal to or better
than that of a conventional plan treated with electron beams, alone or in combination with
photon beams. To carry out this objective the following specific aims were followed.
Aim 1: Generate a patient database. Generate a patient database by selecting patient
data from five chest wall (CW) patients that were previously-treated with electron
beams.
Aim 2: Plan each case on the TomoTherapy Hi-Art planning system. Specify
planning objectives and weights for the PTVs and critical structures. Use the system’s
iterative method to minimize the objective function and produce clinically acceptable
treatment plan.
Aim 3: Determine treatment plan metrics. Choose and conduct physical plan
evaluation metrics for both techniques. Generate dose volume histograms (DVHs) for
all involved structures. The metrics will include, the minimal, maximal and mean
dose to the planning PTV volumes (PTVs) and organs at risks (OARs), the volume of
lung receiving more than 20 Gy (V20lung), the volume of heart receiving more than 30
Gy (V30heart), and the volume of the contralateral breast receiving more than 5 Gy
(V5contralateral breast). This data will be made available for the radiation oncologist’s
evaluation and comparison of rival plans (Aim 4) as needed, and to further
supplement the comparisons.
Aim 4: Clinically evaluate the conventional and TomoTherapy treatment plans. Have
one American Board Radiology (ABR) certified radiation oncologist evaluate both

11
the TomoTherapy and the conventional treatment plans. Along with the plans,
provide multiple choice questionnaires to the radiation oncologist for this evaluation.
Aim 5: Determine biological treatment plan metrics. Calculate and compare the tumor
control probability (TCP), the normal tissue complication probability (NTCP), and
the secondary cancer complication probability (SCCP) for both techniques. The
purpose of these data is to supplement the comparisons of two rival plans
(conventional and the TomoTherapy plans) with radiobiological modeling of the
impact of the treatment.

12
Chapter 2
Materials and Methods
2.1. Overview of Study
The first aim was to generate a PMRT patient database on an ADAC Pinnacle
workstation version 6.2 (Philips, Inc., Milpitas, California). The planning process is
based on Hogstrom algorithm for an electron treatment planning (Hogstrom et al. 1981b)
and a superposition-convolution dose calculation engine for photon treatment planning.
The patient database included the CT scan data, contoured regions of interests (ROIs)
relevant to the study, and several Pinnacle treatment plan trials for plan comparison
studies. At least one Pinnacle treatment plan trial contained the original conventional
treatment plan used to treat the PMRT patient along with the calculated dose distribution.
The database was made to maintain patient confidentiality in accordance with a protocol
approved by an institutional review board.
The second goal was to generate a clinically-acceptable, TomoTherapy treatment plan
for each case in the PMRT patient database. TomoTherapy Hi-Art System, version 2.1
(TomoTherapy, Inc, Madison, WI) was used to generate a plan for each of the five
patients in the PMRT patient database. The planning process is based on a superposition-
convolution dose calculation engine (Mackie et al. 2000) and an iterative least square
optimization process (Shepard et al. 2000). An iterative process is a process used to
minimize the objective function after the user specified the planning objectives and
weights for the PTV and critical structures. As a result, appropriate beam pattern,
position, and intensity will be calculated by the system. After a suitable plan was
developed on the TomoTherapy treatment planning system, the dose distribution was
transferred to the PMRT patient database into a separate Pinnacle treatment plan trial.

13
The third goal was to generate and compare dose-volume metrics from both the
TomoTherapy and the conventional electron beam treatment plans.
The fourth goal was to have a radiation oncologist evaluate both plans for clinical
acceptability, i.e., is the plan acceptable for treating the patient? The radiation oncologist
also was to review both plans side-by-side and determine which plan was better (or if
they were similar). A questionnaire was generated to help the radiation oncologist in the
decision process.
The fifth goal was to generate and compare the radiobiological impact of the
PMRT plans using standard radio-biological models. Radiobiological metrics of interest
in this study included:
1. PTV tumor control probability (TCP).
2. normal tissue complication probability (NTCP) for the heart and lung.
3. secondary cancer complication probability (SCCP) for contralateral and
ipsilateral lungs, contralateral breast, and for normal tissue.
2.2. Aim 1: Patient Database
A logbook of Pinnacle treatment plans archived since August 2000 maintained by
MBPCC group was searched for possible chest wall or breast treatment sites. From that
list 22 patients receiving conventional electron beam PMRT to the chest wall were
identified. From the 22 patients identified, five were selected for the study; four left-sided
and one right-sided chest wall PMRT patients. The basis for the five patients chosen were
(1) they were treated by the same radiation oncologist who was asked to evaluate
treatment plans for the study, and (2) that the CT scan data was readily available from a
separate archive maintained by on-site CT technologists. This was important because CT

14
scan data could not be directly exported from a Pinnacle workstation to the TomoTherapy
planning system.
The Pinnacle treatment plan was retrieved and imported into the Pinnacle
workstation. The patient name and medical record number were stripped from the
treatment plan and replaced with a code number. The code number was linked to the
patient name and medical record number on a master list kept independently by the
project director. This was done to maintain patient confidentiality in accordance with a
protocol approved by an institutional review board.
PTVs were generated for each of the PMRT treatment plans in the patient database,
as (1) PTVs are typically not contoured for conventional electron beam PMRT planning,
and (2), the TomoTherapy treatment planning system (TPS) is strictly an inverse
planning system and requires contoured PTVs and OARs.
All OARs were generated except for the spinal cord which was previously contoured
in some patients. Both the lungs were contoured separately using Pinnacle’s auto contour
tool which uses CT thresholds and appropriate edits was made. The heart chambers (left
and right atria and left and right ventricles) were contoured starting at the superior extent
of the heart chamber and ending at the apex. The contralateral breast was outlined
starting at the clavicular head and ending at the inframammary fold. Also, the spinal cord
and the 0.5 cm expanded spinal cord were outlined. A structure compromising all normal
tissue, excluding specified OARs and PTVs, was auto-contoured. This was defined by
subtracting the volumes of PTVs and specified normal tissues from the whole patient
volume. The entire contour set was reviewed by a certified dosimetrist and later by the
radiation oncologist upon reviewing the dose distributions.

15
Since the prescribed dose for the chest wall (CW) can differ from prescribed dose for
the supraclavicular and axillary (SCl/AX) nodes, separate PTVs are required for
TomoTherapy treatment planning. Therefore, two PTVs were generated, one for the CW
and the IMN, and a second for the supraclavicular/axillary nodes (SCl/AX). The IMN
was considered part of the CW PTV because the dose prescriptions for each were the
same in each of the patient cases.
The PTVs were generated from the conventional Pinnacle treatment plans by
converting an isodose line to a contour. The isodose line chosen for generating a PTV
was 90% of the prescribed dose. The prescribed dose in each case was the maximum dose
delivered to water along the central axis. In order to separate the two PTVs, the
prescription for SCl/AX was set to zero when contouring CW and vice versa. Pinnacle
allows turning individual prescription assigned to filed(s) on/off, when a multiple
prescriptions present in a treatment plan. As a result, the dose distribution from individual
fields can easily be seen. If the automatically-generated PTV was found broken up into
several contours on the same slice resulting in “contour islands,” the PTV contours were
connected if found in close proximity to each other. PTV contours that protruded into
OARs delineating the lung and the heart were pushed outside of the contour delineating
the OAR.
Figure 3 shows an example of converting the 90% isodose line to a contour for the
CW PTV. Figure 3a shows the Pinnacle-calculated dose distribution of the conventional
plan for the CW. The prescribed dose was 50 Gy to 100% of the dose at R100 along the
central axis of each beam. Note the CW PTV in Figure 3b has excluded the ipsilateral
lung, which is an organ at risk.

16
a)
b)
Figure 3 shows an example of converting the 90% isodose line (45 Gy) shown in (a) to a
CW PTV (b).The 45 Gy isodose line, 90% of the prescribed dose, is shown as a
thick yellow contour. The converted PTV is shown as a solid red area

17
2.3. Aim 2: TomoTherapy PMRT Treatment Plans
2.3.1. Importing CT Data
The TomoTherapy treatment planning system was used to generate an inverse IMRT
plan for 5 patients. CT scan data was imported into the TomoTherapy treatment planning
20workstation from the CT workstation (GE Discovery ST, Model #: 316097CN5) after
being retrieved from long term storage. Patient name and medical record number were
removed and changed to a code before sending CT images to the TomoTherapy planning
system. CT image slices, which were 5-cm or more beyond the superior and inferior
extent of the PTVs and did not include OARs, were removed from the CT scan data to
reduce dose calculation times with TomoTherapy treatment planning. The CT scan data
was down-sampled to a smaller matrix size (128 x 128 matrix) as it was imported into the
Tomotherapy treatment planning system. The diameter of the CT scan data field-of-view
was 50 cm. Hence, the pixel width of the down-sampled CT image was 3.91 mm. The
slice width of the CT scan data in all patient studies was 2.5 mm.
2.3.2. TomoTherapy Dose Prescription
Planning ROIs (PTVs and OARs) were transferred from the Pinnacle workstation to
the TomoTherapy planning system. The CW PTV was selected as the primary PTV to
receive the TomoTherapy dose prescription. The TomoTherapy dose prescription is
specified in terms of percentage volume and dose, i.e., the percentage volume of the
primary PTV that receives at least the prescribed dose. The TomoTherapy dose
prescription for the CW was specified to be 50 Gy (same as conventional plan), and the
percentage volume that received 50 Gy or less was set to match the percentage volume of
the CW in the conventional plan that received 50 Gy or less.

18
2.3.3. TomoTherapy Plan Parameters
Table 1 gives a summary of the plan parameter values used for TomoTherapy
treatment planning. To achieve better dose conformality to the PTV in the superior-
inferior direction of the patient, the small jaw opening (2.45 cm) was used instead of the
large jaw opening (4.98 cm). The pitch, i.e., the fraction of the field width advanced with
each revolution, was set to a standard value of 0.3 used in the clinic. The planning
modulation factor, the ratio of the highest beamlet intensity to the average intensity of all
non-zero beamlets, was set to a maximum of 7 to allow for significant intensity
modulation. The dose grid resolution was set to “fine” making the dimensions of the dose
grid equivalent to the voxel dimensions of the CT scan data (3.91 x 3.91 x 2.5 mm3).
Table 1. TomoTherapy plan parameter specifications
Field width 2.45 cm
Pitch 0.3
Planning modulation factor 7
Dose grid resolution Fine (3.91 x 3.91 x 2.5 mm3)
2.3.4. Dose Limiting Structures
Quite often, dose limiting structures were utilized to better control the TomoTherapy
dose distribution. The most common dose limiting structures used was a “ring” (Figure 4)
surrounding a PTV, which is also widely utilized for IMRT treatment planning on
conventional linear accelerators. Several treatment planning trials were performed to
study the effect of using “ring” dose limiting structures on TomoTherapy. The contour
expands and contract option on the Pinnacle system was used to auto-contour rings. The
procedures followed were as follows:

19
1. A temporary ROI was generated by expanding the PTV by 1 cm in all
directions.
2. Another temporary ROI was generated by expanding the PTV by 1.5 cm in all
directions.
3. The final “ring” ROI was generated by subtracting the first ROI from the
second.
The ring dose limiting structures were labeled as region at risk (RAR) for TomoTherapy
treatment planning.
Other dose limiting structures were utilized in the TomoTherapy treatment plan as
needed. A dose limiting structure which acts as a buffer zone was drawn approximately
one cm superiorly and inferiorly from the PTVs to limit patient dose outside the PTVs. A
directional blocking RAR was utilized to prevent beamlets from coming in the direction
where patient anatomy was outside the CT scan field of view (FOV) Figure 5. 2.3.5. TomoTherapy Optimization and Dose Calculation
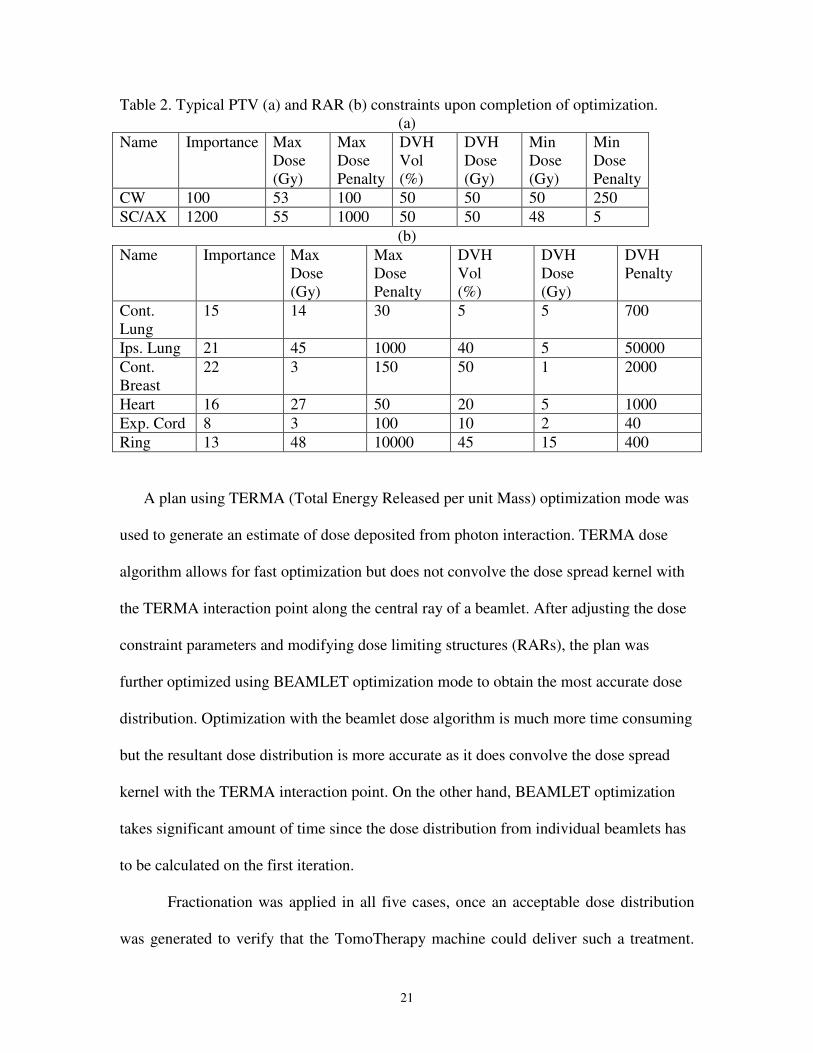
Once all such constraints were defined, optimization and dose calculation
commenced. Table 2 lists typical PTV and RAR constraints upon completion of
optimization. Dose constraints such as importance levels and maximum/minimum
penalties were specified to all structures (PTVs and RARs). Compared to distal critical
structures, a large value was used for the importance and max dose penalty for adjacent
ones. In general, OARs dose limits were made as low as possible without degrading dose
delivered to the PTV or creating unnecessary dose to large volumes of normal tissue.
Also dose to normal tissue peripheral to PTVs was minimized without degrading PTV
dose homogeneity or OAR dose sparing.

20
Figure 4. A dose limiting structure called ring
Figure 5. A directional blocking structure (Structure is directional blocked, so that no
primary beam should pass through it before passing through the PTV structure)
21
Table 2. Typical PTV (a) and RAR (b) constraints upon completion of optimization.
(a)
Name Importance Max
Dose
(Gy)
Max
Dose
Penalty
DVH
Vol
(%)
DVH
Dose
(Gy)
Min
Dose
(Gy)
Min
Dose
Penalty
CW 100 53 100 50 50 50 250
SC/AX 1200 55 1000 50 50 48 5
(b)
Name Importance Max
Dose
(Gy)
Max
Dose
Penalty
DVH
Vol
(%)
DVH
Dose
(Gy)
DVH
Penalty
Cont.
Lung
15 14 30 5 5 700
Ips. Lung 21 45 1000 40 5 50000
Cont.
Breast
22 3 150 50 1 2000
Heart 16 27 50 20 5 1000
Exp. Cord 8 3 100 10 2 40
Ring 13 48 10000 45 15 400
A plan using TERMA (Total Energy Released per unit Mass) optimization mode was
used to generate an estimate of dose deposited from photon interaction. TERMA dose
algorithm allows for fast optimization but does not convolve the dose spread kernel with
the TERMA interaction point along the central ray of a beamlet. After adjusting the dose
constraint parameters and modifying dose limiting structures (RARs), the plan was
further optimized using BEAMLET optimization mode to obtain the most accurate dose
distribution. Optimization with the beamlet dose algorithm is much more time consuming
but the resultant dose distribution is more accurate as it does convolve the dose spread
kernel with the TERMA interaction point. On the other hand, BEAMLET optimization
takes significant amount of time since the dose distribution from individual beamlets has
to be calculated on the first iteration.
Fractionation was applied in all five cases, once an acceptable dose distribution
was generated to verify that the TomoTherapy machine could deliver such a treatment.

22
Fractionation is dividing up the patient’s dose prescription into a number of different
sessions, all of which add up to the total prescribed dose. The temporary dose distribution
file (EOPDose.img) was saved along with the header file into a separate directory on the
TomoTherapy workstation and was exported to a separate Pinnacle plan trial in the
patient database.
2.4. Aim 3: Generate Dose-Volume Treatment Plan Metrics
Dose-volume treatment plan metrics were generated using (1) ADAC Pinnacle,
(2) Matlab version 7.1 (MathWorks, Inc., Natick, Massachusetts), and (3) Microsoft
office excel 2003 (Microsoft, Inc., Redmond, Washington). The Pinnacle treatment plan
trial dose-volume information was exported to the in-house program as an RTOG file.
Differential dose-volume histograms (dDVHs) embedded in the RTOG file were read in
by the in-house program to generate relevant dose-volume metrics. The dose-volume
metrics of interest in this study included:
1. DVHs for each PTV and OAR.
2. Mean and standard deviation of dose to each PTV.
3. Difference in PTV dose between 10% and 90% of PTV (D90%-D10%).
4. Volume of lung receiving at least 20 Gy or more.
5. Volume of heart receiving at least 30 Gy or more.
6. Volume of heart receiving at least 15 Gy or more.
7. Volume of contralateral breast receiving at least 5 Gy or more.
8. Mean dose to the contralateral breast.
Both the standard deviation of the PTV and the D90%-10% , the difference between
the dose received by 90% of the PTV volume and the dose received by 10% of the PTV
volume.. The percent of the total lung volume exceeding 20 Gy (V20lung) to be

23
statistically significant relative to the development of pneumonitis. Hence, the volume of
lung receiving at least 20 Gy or more was useful in comparing competing treatment plans
to evaluate the risk of pneumonitis (Graham et al., 1999). Studies conducted by Gagliardi
et al. (1996) showed that the probability of excess cardiac mortality due to IHD is less
than 4.5% for the whole heart volume receiving less than 30 Gy. Hence, the percentage of
heart that received 30 Gy or less (V30heart) was chosen to compare competing treatment
plans.
Table 3 lists the dose/volume limits specific to our clinic. Published tolerance
doses and irradiated volumes (Emami, et al. 1991) are generally higher those listed on
Table 3. Radiation oncologists at our institution have stricter dose limits than published
tolerance doses, which they feel take into account the patient’s prior experience, such as
chemotherapy. The radiation oncologist specifications were taken into consideration
during optimizing the TomoTherapy treatment plans. Also, the volume of the
contralateral breast that received 5 Gy or more (V5contralateral breast), the volume of the heart
that received 15 Gy or more (V15heart), and the volume of the lung that received 20 Gy or
more (V20lung) were noted when generating the dose-volume treatment plan metrics.
Table 3. Radiation oncologist specifications
Organ Dose Limit Volume
Lung 20 Gy < 15%
Heart 15 Gy < 10%
Spinal Cord 10 Gy < 10%
Contralateral Breast Max 5 Gy
2.5. Aim 4: Radiation Oncologist Evaluation of Treatment Plans
In the fourth aim, a radiation oncologist evaluated and compared both
conventional and TomoTherapy plans. The radiation oncologist was presented with a

24
side-by-side trial comparison of the patient dose distribution and DVHs of both the
conventional and TomoTherapy plans on a Pinnacle workstation. The actual worksheet
provided to the radiation oncologist is located in Appendix A. First, the radiation
oncologist was asked to evaluate the clinical acceptability of each plan on a scale of 1 to
5, 1 being best (acceptable) and 5 being worst (unacceptable). Second, the radiation
oncologist was asked to rate the TomoTherapy plan in comparison with the conventional
plan on a scale of 1 to 5, 1 being best (superior) and 5 being worst (inferior). The
radiation oncologist was then asked to fill out a simple multiple-choice question as to
why he preferred a particular plan. Third, a margin was left on questionnaire for
additional comments.
2.6. Aim 5: Determine Biological Treatment Plan Evaluation Tools
An “in-house” radiation biological program developed by Dr. Tae Ku Lee, research
medical physicist, was used to calculate and compare relevant radiobiological treatment
plan evaluation tools. The radiobiological evaluation tools included:
1. PTV tumor control probability (TCP).
2. Normal tissue complication probability (NTCP) for the heart and lung.
3. Secondary cancer complication probability (SCCP) for the both the
contralateral and ipsilateral lungs, contralateral breast, and for normal tissue.
Differential dose-volume histograms (dDVHs) embedded in the RTOG file were
imported into the in-house program to evaluate radiobiological treatment plans.
2.6.1. Tumor Control Probability (TCP)
TCP, the probability of tumor control in radiation therapy, for the chest wall PTV was
calculated using the Webb and Brenner model [Webb and Nahum 1993 and Brenner et al.
1993], which incorporates a repair mechanism. Sinceα , β and Tr values for chest wall

25
are not available in literature, chest wall was considered as a breast to retrieve α and β
values and as a skin to retrieve the Tr value. Definitions ofα , β and Tr parameters are
listed on the following page. The overall probability of tumor control is the product of
probabilities of tumor control in each tumor dose bin i of the differential dose-volume
histogram:
∏=i
iTCPTCP . (1)
The tumor control probability in each tumor sub-volume is calculated as
iSFN
i eTCP*−= , (2)
N in Equation 2 is the product of the number of tumor cells per cm3 (n) and the volume vi
that receives dose Di, i.e.
N = ∑i
ivn . (3)
SF in Equation 2, the survival fraction (i.e., the probability of cell survival from
irradiation), is given by
)}/
1(exp{βα
α iii
GdDSF +−= . (4)
G, the dose protraction factor for radiation-induced DNA damage repair, in the Equation
4 is calculated as
G = )1)(exp()(
22
−+− TTT
RR
R
λλλ
(5)
where λR, repair rate (hr-1
), is calculated as
r
RT
2ln=λ . (6)

26
The rest of the parameters in Equations 4, 5, and 6 defined as:
α = cell radio sensitivity (Gy-1
).
β = the effectiveness/lethality of radiation (Gy-2
).
di = Di/number of fraction (Gy/fraction).
T = treatment time per fraction (hr).
Tr = Repair half-time of cells with sub lethal damage (hr).
The values of the parameters used to calculate TCP for the chest wall are shown in Table
4.
Table 4. Parameters selected to calculate TCP for chest wall
Name Value Source
N 2 .0 E 8 cm-3
[Wigg et al. 2001]
α 0.51 Gy-1
[Wigg et al. 2001]
β 0.061 Gy-2
[Wigg et al. 2001]
T 1/3 hrs Each treatment time is approximated to 20
minutes (Wang et al. 2003)
Tr 1.6 hrs [Wigg 2001]
2.6.2. Normal Tissue Complication Probability (NTCP) for The Lung
Since lung has a strong dose-volume tissue complication response, it is considered
a parallel structure. The NTCP for lung was calculated using Layman-Kutcher-Burman
(LKB) model [Layman et al., 1992, Kutcher and Burman, 1989], i.e.,
))2
(1(2
1 terfNTCP += , (7)
where 50
50effD V) t(D,
Dm
D
⋅
−= , (8)
and nn
i
iDv )( D1
ieff ∑= . (9)
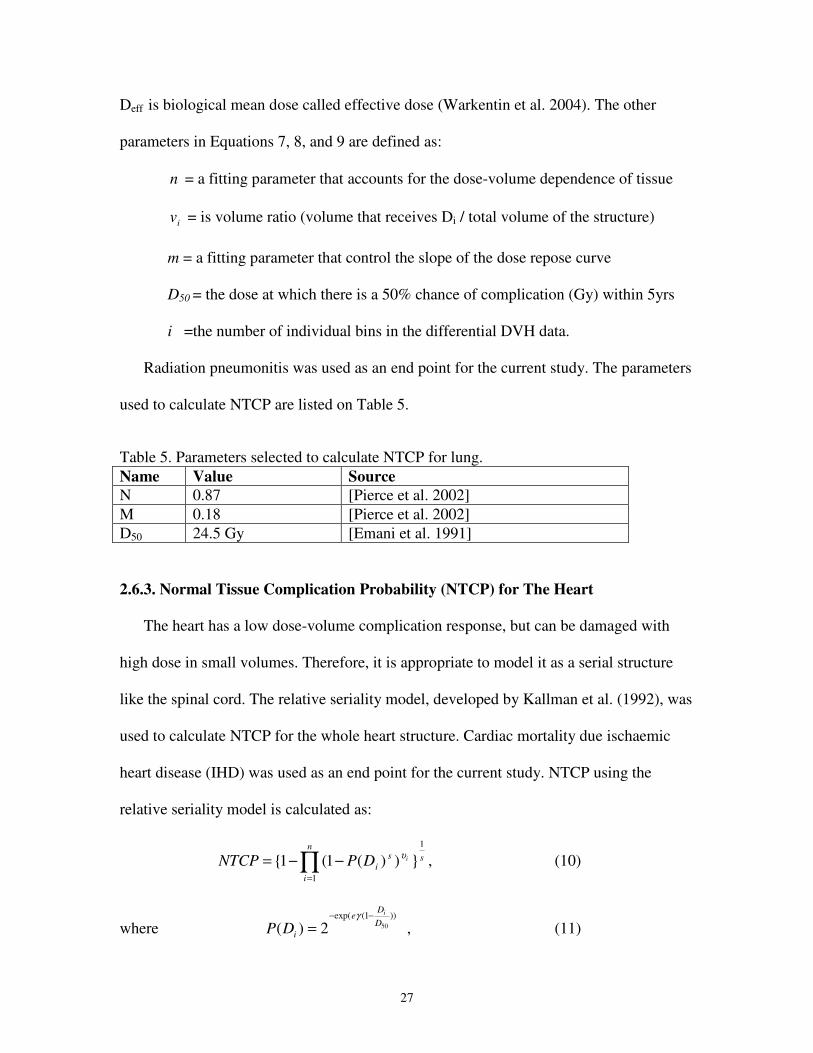
27
Deff is biological mean dose called effective dose (Warkentin et al. 2004). The other
parameters in Equations 7, 8, and 9 are defined as:
n = a fitting parameter that accounts for the dose-volume dependence of tissue
iv = is volume ratio (volume that receives Di / total volume of the structure)
m = a fitting parameter that control the slope of the dose repose curve
D50 = the dose at which there is a 50% chance of complication (Gy) within 5yrs
i =the number of individual bins in the differential DVH data.
Radiation pneumonitis was used as an end point for the current study. The parameters
used to calculate NTCP are listed on Table 5.
Table 5. Parameters selected to calculate NTCP for lung.
Name Value Source
N 0.87
[Pierce et al. 2002]
M 0.18 [Pierce et al. 2002]
D50 24.5 Gy [Emani et al. 1991]
2.6.3. Normal Tissue Complication Probability (NTCP) for The Heart
The heart has a low dose-volume complication response, but can be damaged with
high dose in small volumes. Therefore, it is appropriate to model it as a serial structure
like the spinal cord. The relative seriality model, developed by Kallman et al. (1992), was
used to calculate NTCP for the whole heart structure. Cardiac mortality due ischaemic
heart disease (IHD) was used as an end point for the current study. NTCP using the
relative seriality model is calculated as:
ssn
i
iiDPNTCP
1
1
}))(1(1{υ∏
=
−−= , (10)
where ))1(exp(
502)(D
De
i
i
DP−−
=γ
, (11)

28
where: P (D) = the NTCP of the organ irradiated homogenously to dose Di
iv = is volume ratio (volume that receives Di / total volume of the structure)
m = a fitting parameter that control the slope of the dose repose curve
D50 = the dose at which there is a 50% chance of complication (Gy)
s = seriality of subunits (ratio of number of serial subunits to all subunits)
γ = The maximum relative slope of the dose response curve
i = the number of individual bins in the differential DVH
The parameters used to calculate NTCP are listed on Table 6.
Table 6. Parameters selected to calculate NTCP for heart.
Name Value Source
D50 52.3 Gy [Gagliardi et al. 1996]
S 1.0 [Gagliardi et al. 1996]
γ 1.28 [Gagliardi et al. 1996]
2.6.4. Secondary Cancer Complication Probability (SCCP) for The Lung.
The probability of secondary cancer induction was calculated for lung, contralateral
breast, and normal tissue using the Schneider model [Schneider et al. 2005a and 2005b]:
orgorgorg OEDInSCCP *= , (12)
Where OEDorg is the organ equivalent dose calculated as
iDN
i
iorg eDN
OEDα−
=
∑=1
1 (13)
29
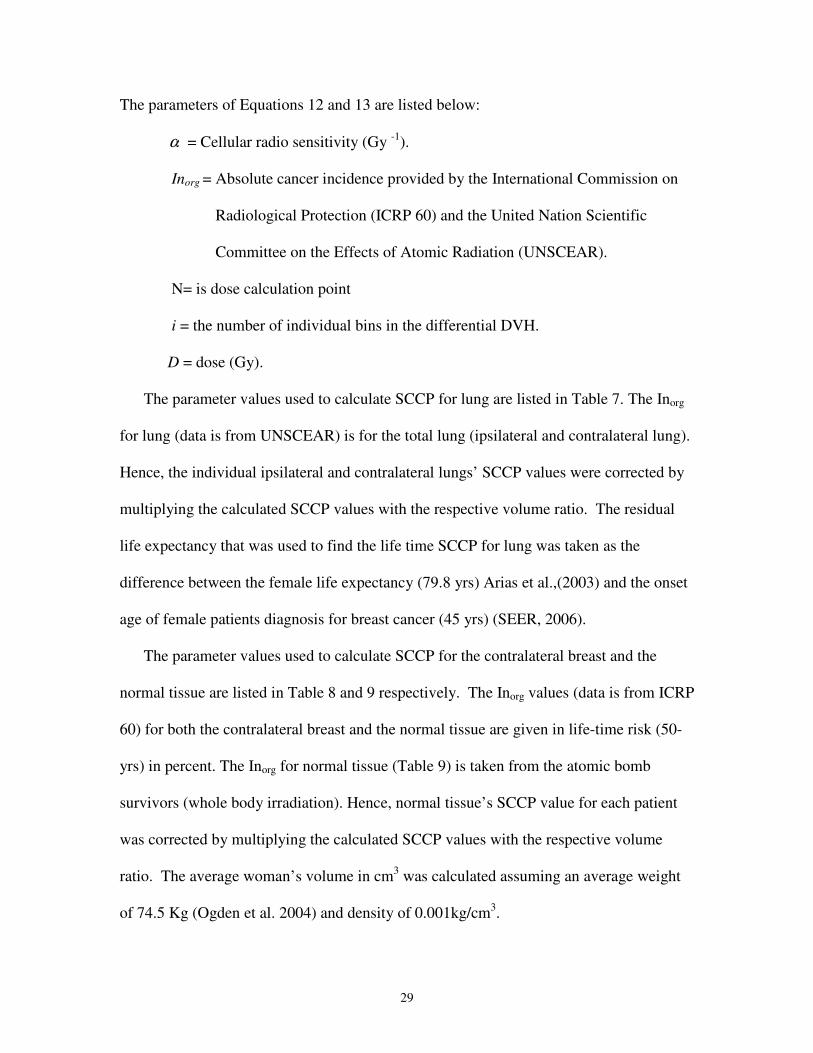
The parameters of Equations 12 and 13 are listed below:
α = Cellular radio sensitivity (Gy -1
).
Inorg = Absolute cancer incidence provided by the International Commission on
Radiological Protection (ICRP 60) and the United Nation Scientific
Committee on the Effects of Atomic Radiation (UNSCEAR).
N= is dose calculation point
i = the number of individual bins in the differential DVH.
D = dose (Gy).
The parameter values used to calculate SCCP for lung are listed in Table 7. The Inorg
for lung (data is from UNSCEAR) is for the total lung (ipsilateral and contralateral lung).
Hence, the individual ipsilateral and contralateral lungs’ SCCP values were corrected by
multiplying the calculated SCCP values with the respective volume ratio. The residual
life expectancy that was used to find the life time SCCP for lung was taken as the
difference between the female life expectancy (79.8 yrs) Arias et al.,(2003) and the onset
age of female patients diagnosis for breast cancer (45 yrs) (SEER, 2006).
The parameter values used to calculate SCCP for the contralateral breast and the
normal tissue are listed in Table 8 and 9 respectively. The Inorg values (data is from ICRP
60) for both the contralateral breast and the normal tissue are given in life-time risk (50-
yrs) in percent. The Inorg for normal tissue (Table 9) is taken from the atomic bomb
survivors (whole body irradiation). Hence, normal tissue’s SCCP value for each patient
was corrected by multiplying the calculated SCCP values with the respective volume
ratio. The average woman’s volume in cm3 was calculated assuming an average weight
of 74.5 Kg (Ogden et al. 2004) and density of 0.001kg/cm3.

30
Table 7. Parameters selected to calculate SCCP for lung.
Name Value Source
α 0.129Gy-1
[Schneider et al. 2005a]
Inorg 8.27/(104. patients. yr. Gy) [Schneider et al. 2005a]
Table 8. Parameters selected to calculate SCCP for the contralateral breast.
Name Value Source
α 0.085 Gy-1
[Schneider et al. 2005b]
Inorg 0.78 (% Gy-1
) [Schneider et al. 2005b]
Table 9. Parameters selected to calculate SCCP for the normal tissue.
Name Value Source
α 0.085 Gy-1
[Schneider et al. 2005b]
Inorg 1.76 (% Gy-1
) [Schneider et al. 2005b]
Figure 6 shows a plot of cancer incidence per 104 patients per year for solid tumor
(i.e., an abnormal mass tissue that usually does not contain cysts or liquid areas)
induction as a function of dose. Note that the probability is maximum around 11 Gy and
decreases for higher dose values because sterilization of already mutated cells becomes
more important. According to the Schneider’s model, certain tissue receiving dose
between 5 and 25 Gy will have a high probability of solid tumors induction (> 0.75) with
a mean follow up time of 9.5yrs. Therefore, the volume of normal tissue receiving doses
between 5 and 25 Gy was also determined for plan evaluation

31
0
20
40
60
80
100
120
140
0 5 10 15 20 25 30 35 40 45 50
Dose (homogenous) [Gy]
Can
cer
Inci
den
ce [
/10^4 p
atie
nts
/ y
r])
5 Gy 25 Gy
Figure 6. Estimated solid tumors induction as function of homogenous organ dose for
normal tissue (based on Schneider’s model, Schneider et al 2005a).

32
Chapter 3
Results
3.1. Format for Presenting Results of Each Patient
The format for presenting the results is the same for all patients. For each patient, the
results are presented in the following order:
1. isodose comparison,
2. DVH comparison,
3. radiation oncologist’s review of the conventional and TomoTherapy plans, and
their comparison,
4. mean and standard deviation of dose to the chest wall PTV, and the resultant TCP,
5. dose to the ipsilateral lung and heart, and the resultant NTCPs, and
6. dose to the contralateral breast and normal tissue, and the resultant SCCPs.
The isodose comparisons between the conventional and TomoTherapy plans are
shown on transverse CT image slices for three distinct regions:
1. The supraclavicular nodal region along the beam axis of the parallel-opposed
photon beams used in the conventional plan.
2. The region of the chest wall containing the internal mammary chain nodes.
3. A region of the chest wall inferior to (2).
The transverse CT image slice where the isodose comparison is made is delineated by
a yellow line in a sagittal midline CT image view in the same figure as the isodose
comparison. The isodose lines are displayed in Gy, with dose values of 55, 50, 45, 35, 25,
15, and 5 Gy. In addition, due to change in the prescription for the supraclavicular and
axillary nodal region, an additional 40.5 Gy dose line is added for the third and fifth

33
patients and 43.2 Gy dose line is added for the fourth patient. The color scheme for the
isodose lines is consistent for all patients. It should be noted that the TomoTherapy TPS
calculates dose in air outside the patient while ADAC Pinnacle TPS sets this dose to zero.
This results in isodose lines appearing outside the patient in the TomoTherapy plan.
A cumulative DVH comparison between the conventional and TomoTherapy plans is
done for both planning PTVs (chest wall and supraclavicular/axillary nodes) and for the
heart, ipsilateral lung, contralateral breast, and normal tissue. In these plots, the y-axis
displays the percentage of the total volume of each region of interest; the x-axis displays
in Gray. DVHs for both plans are superimposed on one plot for each patient, with a
consistent color and line scheme for all patients.
3.2. Patient One
A 74 year old female was diagnosed to have an infiltrating ductal carcinoma of the
upper outer quadrant of the left breast, stage T2pN3aM0 carcinoma with 10 out of 12
lymph nodes positive with extra-nodal extension. The conventional electron beam PMRT
plan had the following fields:
1. AP/PA 6 MV photon beam SCl/AX fields,
2. 12 MeV electron beam IMN field,
3. 9 MeV electron beam medial CW field, and
4. 9 MeV electron beam lateral CW field.
Both the SCl/AX and CW PTVs were irradiated to 50 Gy in 25 fractions.
3.2.1. Isodose Comparison
Figure 7 shows the isodose comparison between the conventional plan (Figure 7a)
and the TomoTherapy plan (Figure 7b) on the transverse CT image slice in the region of
the supraclavicular nodes delineated by the yellow line in sagittal midline CT image
34
shown in Figure 7c. The yellow 45-Gy isodose line represents the 90% isodose line
where the TomoTherapy plan was optimized to match the conventional plan. The
conventional plan showed a hot spot of 55 Gy (110% of the prescription dose) in the
medial, anterior portion of the dose distribution, whereas the TomoTherapy plan showed
no similar hot spot in that region.
The conventional plan showed a sharper dose falloff than the TomoTherapy plan
along the beam edges of the parallel-opposed photon beams of the conventional plan.
Greater dose restriction outside the supraclavicular PTV in the TomoTherapy plan during
optimization might have resulted in a sharper dose falloff along the “beam edges”
delineated by the conventional plan. The TomoTherapy plan also showed a significant
volume of tissue outside the PTV receiving low dose (5 Gy or more).However, the
TomoTherapy plan showed a greater dose gradient beyond the 45 Gy isodose line in the
anterior-to-posterior (AP) direction. This resulted in lower dose to region posterior to the
supraclavicular nodes, including the scapula.
Figure 8 shows the dose distribution for the conventional plan (Figure 8a) and the
TomoTherapy plan (Figure 8b) on a transverse CT image slice in the region of the IMN
delineated by the yellow line in sagittal image shown in Figure 8c. The yellow 45 Gy
isodose line represents the 90% prescription isodose line, where the TomoTherapy plan
was optimized to match the conventional plan. The conventional plan showed a hot spot
of 55 Gy (110% of the prescription dose) in the IMN region and at the junction of the
lateral and medial electron fields. Although in practice this hot spot is reduced (smeared)
by moving the match line, this is not reflected in the conventional plan.

35
Figure 7. Transverse views of the conventional plan (a) and TomoTherapy plan (b) taken
at the supraclavicular nodal region shown on sagittal view (c).

36
Figure 8. Transverse views of the conventional plan (a) and TomoTherapy plan (b) taken
at the IMN region as shown on the sagittal view (c).
Figure 9 shows the isodose comparison between the conventional plan (Figure 9a)
and the TomoTherapy plan (Figure 9b) on a transverse CT image slice near the inferior
border of the CW PTV, and is delineated by the yellow line in sagittal midline CT image
shown in Figure 9c. The yellow 45 Gy isodose line represents the 90% isodose line,
where the TomoTherapy plan was optimized to match the conventional plan. The
conventional plan showed a hot spot of 55 Gy (110% of the prescription dose at the
junction of the lateral and medial electron fields. Although in practice this hot spot is

37
reduced by moving (smeared) the match line, this is not reflected in the conventional
plan.
The conventional plan showed a sharper dose falloff than the TomoTherapy plan
along the beam edges of the electron beams for the IMN and the lateral chest wall of the
conventional plan. Greater dose restriction outside the chest wall PTV in the
TomoTherapy plan during optimization might have resulted in a sharper dose falloff
along the “beam edges” delineated by the conventional plan. The TomoTherapy plan also
showed a significant volume of tissue outside the PTV receiving low dose (5 Gy or
more). However, the TomoTherapy plan showed a greater dose gradient beyond the 45
Gy isodose line in the anterior-to-posterior (AP) direction. This resulted in a lower
volume with dose greater than 20 Gy to ipsilateral lung.
3.2.2. DVH Comparisons
The DVH comparisons are shown in Figure 10. The conventional plan showed a
small volume of the PTV receiving high dose created by the junction of the medial and
lateral chest wall, although in practice this hot spot is reduced by moving (smeared) the
junction over the course of treatment. For the TomoTherapy plan, dose homogeneity was
better than the conventional plan for both the SCl/AX and CW PTVs. However, low dose
(D < 5Gy) covered a larger volume of normal tissue.
Compared to the conventional plan, the TomoTherapy plan showed less ipsilateral
lung volume receiving doses greater than 13 Gy while more ipsilateral lung volume
received doses less than 13 Gy. This crossover of DVH lines for OARs was seen in all
patients so it will be reported as the crossover dose from here on out. The crossover dose
for the heart was 15 Gy.

38
Figure 9. Transverse views of the conventional plan (a) and TomoTherapy plan (b) taken
at the chest wall region as shown on the sagittal view (c).
3.2.3. Radiation Oncologist Review
A radiation oncologist evaluated the clinical acceptability of both conventional and
TomoTherapy plans and scored both plans acceptable. After reviewing the dose
distributions and DVHs for both plans, he ranked the TomoTherapy plan marginally
superior. PTVs (CW and SCI/AX) coverage was listed as a reason for preferring
TomoTherapy plan over the conventional plan. The radiation oncologist commented that

39
the dose to the heart was higher in the TomoTherapy plan and may be of concern if the
patient was to receive chemotherapy.
0
10
20
30
40
50
60
70
80
90
100
0 10 20 30 40 50 60 70 80Dose (Gy)
Volu
me (
%)
CW: Conventional
CW: Tomo
SCl/AX: Conventional
SCl/AX: Tomo
Ipsi. Lung: Conventional
Ipsi. Lung: Tomo
Heart: Conventional
Heart: Tomo
Normal Tissue: Conventional
Normal Tissue: Tomo
Cont. Breast: Conventional
Cont. Breast: Tomo
Figure 10. DVHs comparison for distribution shown in Figures 7 to 9. Solid lines –
conventional plan, dashed lines –TomoTherapy plan. CW – chest wall PTV;
SCl/AX – supraclavicular/axillary PTV; Ipsi – ipsilateral; Cont – contralateral
3.2.4. Chest Wall
The TomoTherapy plan showed a more uniform CW PTV dose, e.g. the standard
deviation (σ) of the CW PTV dose on the TomoTherapy plan was lower than that for the
conventional plan. The average CW dose (+ 1σ) was 49.6 + 0.9 Gy on the TomoTherapy
plan and 50.7 + 6 Gy on the conventional plan. The D90%-10% of the CW volume was
9.8 Gy for the conventional plan and 1.4 Gy for the TomoTherapy plan. Even though the
CW PTV dose distribution showed better uniformity on the TomoTherapy plan, the TCP
values were comparable for both plans (conventional plan = 0.978 and TomoTherapy
plan = 0.995).

40
3.2.5. Ipsilateral Lung
During optimization of the TomoTherapy plan, a high penalty factor was assigned to
the ipsilateral lung objective to force photon beams to come in an oblique direction. As a
result, TomoTherapy avoided irradiating it with high doses (20Gy). The ipsilateral lung
receiving dose above 20 Gy was reduced from 16.1% on the conventional plan to 9.1%
on the TomoTherapy plan. The ipsilateral lung in the conventional plan was exposed to
higher doses (e.g. 5% of the ipsilateral lung received 40 Gy or more). However, as shown
in Figure 10, a large volume of the ipsilateral lung received low dose (5 Gy or more) with
the TomoTherapy plan. The average ipsilateral lung dose (+ 1σ) was comparatively
higher on the TomoTherapy plan (conventional plan = 9.4 + 12.5 Gy and TomoTherapy
plan = 11.3 + 6.0 Gy). The reason behind high standard deviation of the conventional
plan is due to asymmetric distribution of dose to the ipsilateral lung, shown in Figure 11.
A relatively higher NTCP value was observed for the TomoTherapy plan although both
values were small (conventional plan = 0.0007 and TomoTherapy plan = 0.0016).
3.2.6. Heart
The heart volume receiving a dose above 30 Gy or more was very low and similar in
both plans (0.06% for the TomoTherapy plan and 0.54% for the conventional plan). Also,
similar was the value for V15heart (conventional plan = 4.3% and TomoTherapy plan =
4.5%). Like the ipsilateral lung, a larger volume of the heart received low dose (5 Gy or
more) with the TomoTherapy plan. The average heart dose (+ 1σ) was reduced from 7.3
+ 3.6 Gy on the TomoTherapy plan to 3.5 + 5.0 Gy on the conventional plan. A relatively
lower NTCP value was observed for the TomoTherapy plan although both values were
insignificant (conventional plan = 0.0009 and TomoTherapy plan = 0.0002).

41
0
10
20
30
40
50
60
70
0 10 20 30 40 50Dose (Gy)
Vo
lum
e (
cm
^3
)
Figure 11. The dDVH of the ipsilateral lung.
3.2.7. Contralateral Breast
In order to stop dose exposure to the contralateral breast, a higher importance factor
was assigned compared to other critical structures during optimization of the
TomoTherapy plan (Table 2). This helped to bring down the dose to the contralateral
breast. However, due to the nature of beam arrangements of TomoTherapy delivery, dose
to the contralateral breast was significantly greater than the dose for conventional plan.
The average contralateral breast dose (+ 1σ) was 3.2 + 1.6 Gy on the TomoTherapy plan
and 0.1 + 0.1 Gy for the conventional plan. As shown in Figure 9, a relatively large
volume of the contralateral breast was exposed to low dose with the TomoTherapy plan.
The percent of volume receiving 5 Gy or more was zero for the conventional plan and
13.1 for the TomoTherapy plan. Age dependence effect of radiation induced breast
cancer was ignored when calculating SCCP for patient one (age = 73 yrs). The SCCP was
42
relatively higher for the TomoTherapy plan (conventional plan = 0.0001 and
TomoTherapy plan = 0.0178).
3.2.8. Normal Tissue
The normal tissue volume receiving between 5 and 25 Gy for this patient was 17.6
cm3 for the conventional plan and 111.7 cm
3 for the TomoTherapy plan. The calculated
SCCP value relatively higher on the TomoTherapy plan (conventional plan =0.003 and
TomoTherapy plan = 0.012).
3.3. Patient Two
A 53 – year old female was diagnosed to have an infiltrating ductal carcinoma of the
upper outer quadrant of the left breast, stage T3pN2aM0 carcinoma with 4 out of 12
lymph nodes positive with extra-nodal extension. The conventional electron beam PMRT
plan had the following fields:
1. AP/PA 6 MV photon beam SCl/AX fields,
2. 12 MeV electron beam IMN field,
3. 6 MeV electron beam medial CW field, and
4. 9 MeV electron beam lateral CW field.
Both the SCl/AX and CW PTVs were irradiated to 50 Gy in 25 fractions.
3.3.1. Isodose Comparison
Figure 12 shows the isodose comparison between the conventional plan (Figure 12a)
and the TomoTherapy plan (Figure 12b) on the transverse CT image slice in the region of
the supraclavicular nodes delineated by the yellow line in sagittal midline CT image
shown in Figure 12c. The yellow 45 Gy isodose line represents the 90% isodose line
where the TomoTherapy plan was optimized to match the conventional plan. The
conventional plan showed a hot spot of 55 Gy (110% of the prescription dose) in the

43
medial, anterior portion of the dose distribution, whereas the TomoTherapy plan showed
no similar hot spot in that region.
The conventional plan showed a sharper dose falloff than the TomoTherapy plan
along the beam edges of the parallel-opposed photon beams of the conventional plan.
Greater dose restriction outside the supraclavicular PTV in the TomoTherapy plan during
optimization might have resulted in a sharper dose falloff along the “beam edges”
delineated by the conventional plan. The TomoTherapy plan also showed a significant
volume of tissue outside the PTV receiving low dose (5 Gy or more).However, the
TomoTherapy plan showed a greater dose gradient beyond the 45 Gy isodose line in the
AP direction. This resulted in lower dose to region posterior to the supraclavicular nodes,
including the scapula.
Figure 13 shows the isodose comparison on the transverse slice for the conventional
plan (Figure 13a) and the TomoTherapy plan (Figure 13b) on a transverse CT image slice
in the region of the IMN delineated by the yellow line in sagittal image shown in Figure
13c. The yellow 45 Gy isodose line represents the 90% prescription isodose line, where
the TomoTherapy plan was optimized to match the conventional plan. The conventional
plan showed a hot spot of 55 Gy (110% of the prescription dose) in the IMN region and
at the junction of the lateral and medial electron fields.
The conventional plan showed a sharper dose falloff than the TomoTherapy plan
along the beam edges of the electron beams for the IMN and the lateral CW of the
conventional plan. Greater dose restriction outside the CW PTV in the TomoTherapy
plan during optimization might have resulted in a sharper dose falloff along the “beam
edges” delineated by the conventional plan. The TomoTherapy plan also showed a
significant volume of tissue outside the PTV receiving low dose (5 Gy or more).

44
However, the TomoTherapy plan showed slightly greater dose gradient beyond the 45 Gy
isodose line in the AP direction. This resulted in lower volume of dose to ipsilateral lung.
Figure 12. Transverse views of the conventional plan (a) and TomoTherapy plan (b)
taken at the supraclavicular nodal region shown on sagittal view (c).
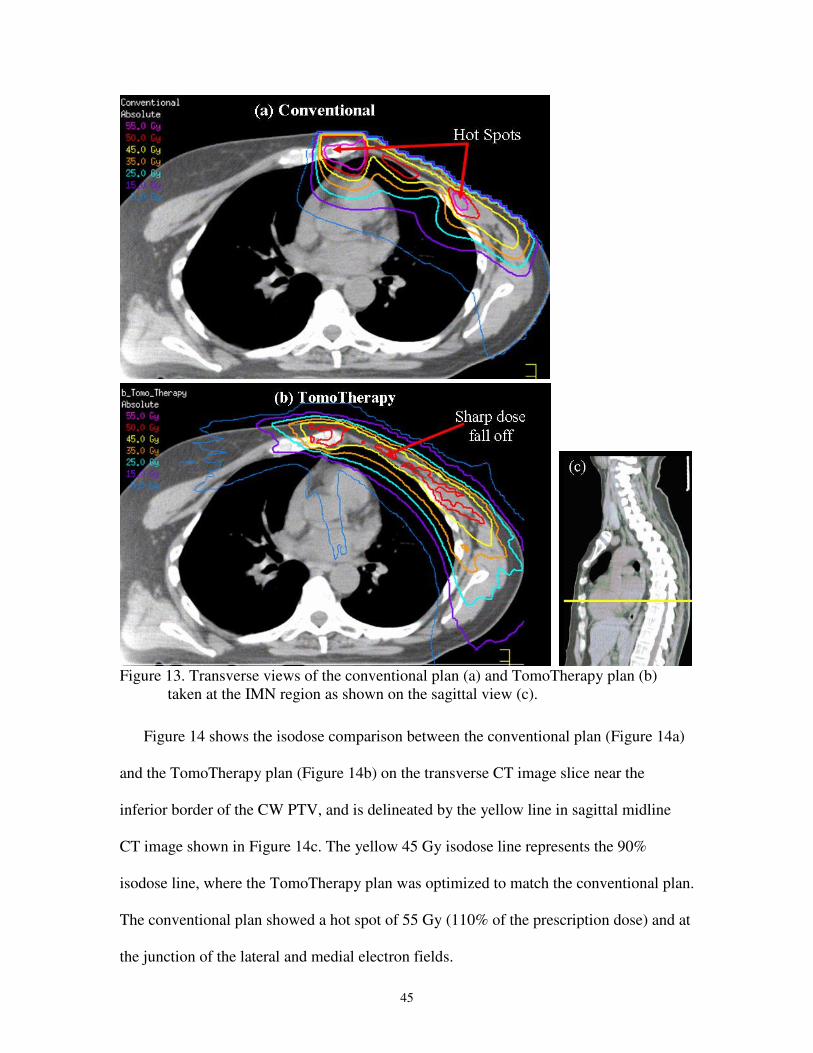
45
Figure 13. Transverse views of the conventional plan (a) and TomoTherapy plan (b)
taken at the IMN region as shown on the sagittal view (c).
Figure 14 shows the isodose comparison between the conventional plan (Figure 14a)
and the TomoTherapy plan (Figure 14b) on the transverse CT image slice near the
inferior border of the CW PTV, and is delineated by the yellow line in sagittal midline
CT image shown in Figure 14c. The yellow 45 Gy isodose line represents the 90%
isodose line, where the TomoTherapy plan was optimized to match the conventional plan.
The conventional plan showed a hot spot of 55 Gy (110% of the prescription dose) and at
the junction of the lateral and medial electron fields.

46
The conventional plan showed a sharper dose falloff than the TomoTherapy plan
along the beam edges of the medial and the lateral CW of the conventional plan. Unlike
the conventional plan, the TomoTherapy plan avoided irradiating the ipsilateral lung with
high dose (45, 50, and 55 Gy). However, the TomoTherapy plan also showed a
significant volume of tissue outside the PTV receiving low dose (5 Gy or more).
Figure 14. Transverse views of the conventional plan (a) and TomoTherapy plan (b)
taken at the CW region as shown on the sagittal view (c).

47
3.3.2. DVH Comparisons
The DVH comparisons are shown in Figure 15. The conventional plan showed a
small volume of the PTV receiving high dose created by the junction of the medial and
lateral CW. For the TomoTherapy plan dose homogeneity was better than the
conventional plan for both the SCl/AX and CW PTVs. However, low dose (5 Gy or
more) covered a larger volume of the normal tissue not including critical structures. The
crossover dose for the ipsilateral lung was 4.3 Gy, and the crossover dose for the heart
was 6 Gy.
0
10
20
30
40
50
60
70
80
90
100
0 10 20 30 40 50 60 70 80Dose (Gy)
Vo
lum
e (
%)
CW: Conventional
CW: Tomo
SCl/AX: Conventional
SCl/AX: Tomo
Ipsi. Lung: Conventional
Ipsi. Lung: Tomo
Heart: Conventional
Heart: Tomo
Normal Tissue: Conventional
Normal Tissue: Tomo
Cont. Breast: Conventional
Cont. Breast: Tomo
Figure 15. DVH comparisons for distribution shown in Figures 12 to 14. Solid lines –
conventional plan, dashed lines –TomoTherapy plan. CW – CW PTV; SCl/AX –
supraclavicular/axillary PTV; Ipsi – ipsilateral; Cont – contralateral
3.3.3. Radiation Oncologist Review
A radiation oncologist evaluated the clinical acceptability of both conventional and
TomoTherapy plans and scored the conventional plan marginally acceptable and the

48
TomoTherapy plan acceptable. After reviewing the dose distributions and DVHs for both
plans, he ranked the TomoTherapy plan superior. The absence of hot and cold spots on
the TomoTherapy plan was listed as a primary reason for preferring TomoTherapy plan
over the conventional plan.
3.3.4. Chest Wall
The TomoTherapy plan showed a more uniform dose distribution. The average CW
dose (+ 1σ) was 49.9 + 1.1 Gy on the TomoTherapy plan and 51.4 + 6.1 Gy on the
conventional plan. Dose irradiating 90% to 10% of the CW volume was 13.6 Gy for the
conventional plan and was 2.3 Gy for the TomoTherapy plan. Although the CW PTV
dose distribution showed better uniformity on the TomoTherapy plan, TCP values were
comparable for both plans (conventional plan = 0.989 and TomoTherapy plan = 0.996).
3.3.5. Ipsilateral Lung
During optimization of the TomoTherapy plan, high penalty factor was assigned to
the ipsilateral lung objective to force photon beams to come in an oblique direction. As a
result, compared to the conventional plan, the TomoTherapy plan showed less volume
irradiated. The ipsilateral lung receiving dose above 20 Gy was reduced from 29.4% for
the conventional plan to 24.8% for the TomoTherapy plan. Also unlike the TomoTherapy
plan, the ipsilateral lung was exposed to high doses with the conventional plan (e.g. 5%
of the ipsilateral lung received 40 Gy or more). The average ipsilateral lung dose (+ 1σ)
was comparatively lower on the TomoTherapy plan (conventional plan = 14.7 + 16.2 Gy
and TomoTherapy plan = 12.3 + 12.6 Gy). A relatively lower NTCP value was calculated
for the TomoTherapy plan although both values were insignificant (conventional plan =
0.025 and TomoTherapy plan = 0.005).

49
3.3.6. Heart
The heart volume receiving a dose above 30 Gy or more was very low (0.02% for the
TomoTherapy plan and 0.9% for the conventional plan). The heart volume receiving 15
Gy or more was slightly higher on the TomoTherapy plan (conventional plan = 4.6% and
TomoTherapy plan = 6.8%). As shown on Figure 15, large volume of the ipsilateral lung
received low dose (2.5 Gy) with the TomoTherapy plan compared to the conventional
plan. The average heart dose (+ 1σ) was reduced from 5.1 + 4.8 Gy on the conventional
plan to 3.9 + 5.6 Gy on the TomoTherapy plan. A relatively lower NTCP value was
calculated for the TomoTherapy plan although both values were insignificant
(conventional plan = 0.0018 and TomoTherapy plan = 0.0003).
3.3.7. Contralateral Breast
The average contralateral breast dose (+ 1σ) was 2.1 + 1.4 Gy on the TomoTherapy
plan and 0.1 + 0.1 Gy on the conventional plan. As shown in the DVH comparison, a
large volume of the contralateral breast was exposed to low dose (2 Gy) with the
TomoTherapy plan. Also, the percent of volume receiving 5 Gy or more on the
conventional plan was 0.0% and 3.0% on the TomoTherapy plan. Age dependence effect
of radiation induced breast cancer was ignored when calculating SCCP for patient two
(age = 53 yrs). The calculated SCCP value was relatively higher on the TomoTherapy
plan (conventional plan 0.0003 and TomoTherapy plan = 0.0125).
3.3.8. Normal Tissue
The normal tissue volume receiving between 5 and 25 Gy for this patient was 11.6
cm3 for the conventional plan and 61.9 cm
3 on the TomoTherapy plan. The calculated
SCCP value was relatively higher on the TomoTherapy plan (conventional plan = 0.002
and TomoTherapy plan 0.008).

50
3.4. Patient Three
A 49-year old female was diagnosed to have a squamous cell carcinoma of the upper
outer quadrant of the left breast, stage T2N1M0 carcinoma with 2 out of 10 lymph nodes
positive with extra-nodal extension. The conventional electron beam PMRT plan had the
following fields:
1. AP/PA 6 MV photon beam SCl/AX fields,
2. 9 MeV electron beam IMN field,
3. 9 MeV electron beam medial CW field, and
4. 9 MeV electron beam lateral CW field.
The prescription for the CW was 50 Gy in 25 fractions. The prescription for the SCl/AX
was 45 Gy in 25 fractions.
3.4.1. Isodose Comparison
Figure 16 shows the isodose comparison between the conventional plan (Figure 16a)
and the TomoTherapy plan (Figure 16b) on the transverse CT image slice in the region of
the supraclavicular nodes delineated by the yellow line in sagittal midline CT image
shown in Figure 16c. The yellow green 40.5 Gy isodose line represents the 90%
prescription isodose line where the TomoTherapy plan was optimized to match the
conventional plan. Compared to the conventional plan, the TomoTherapy plan showed
small area covered by hot spot of 50 Gy (110% of the prescription dose).
The conventional plan showed a sharper dose falloff than the TomoTherapy plan
along the beam edges of the parallel-opposed photon beams of the conventional plan.
Greater dose restriction outside the supraclavicular PTV in the TomoTherapy plan during
optimization might have resulted in a sharper dose falloff along the “beam edges”
delineated by the conventional plan. The TomoTherapy plan also showed a significant

51
volume of tissue outside the PTV receiving low dose (5 Gy or more). However, the
TomoTherapy plan showed a greater dose gradient beyond the 40.5 Gy isodose line in
AP direction. This resulted in lower dose to region posterior to the supraclavicular nodes,
including the left upper lobe of lung.
Figure 16. Transverse views of the conventional plan (a) and TomoTherapy plan (b)
taken at the supraclavicular nodal region shown on sagittal view (c).
Figure 17 shows the isodose comparison the conventional plan (Figure 17a) and the
TomoTherapy plan (Figure 17b) on a transverse CT image slice in the region of the IMN

52
delineated by the yellow line in sagittal image shown in Figure 17c. The yellow 45 Gy
isodose line represents the 90% prescription isodose line, where the TomoTherapy plan
was optimized to match the conventional plan. The conventional plan showed a hot spot
of 55 Gy (110% of the prescription dose) at the junction of the lateral and medial electron
fields. Although in practice this hot spot is reduced (smeared) by moving the match line,
this is not reflected in the conventional plan.
The conventional plan showed a sharper dose falloff than the TomoTherapy plan
along the beam edges of the electron beams for the IMN and the lateral CW of the
conventional plan. The physical location of the IMN, in between the contralateral and
ipsilateral lung at a depth of approximately 2 – 5.5 cm from the surface made it difficult
for the TomoTherapy trying to cover this region with a photon beam. As a result, dose
bleeding toward aorta was observed throughout all five cases. Also, the TomoTherapy
plan showed a significant volume of tissue outside the PTV receiving low dose (5 Gy or
more).
Figure 18 shows the isodose comparison between the conventional plan (Figure 18a)
and the TomoTherapy plan (Figure 18b) on the transverse CT image slice near the
inferior border of the CW PTV, and is delineated by the yellow line in sagittal midline
CT image shown in Figure 17c. The yellow 45 Gy isodose line represents the 90%
isodose line, where the TomoTherapy plan was optimized to match the conventional plan.
The conventional plan showed a hot spot of 55 Gy (110% of the prescription dose) at the
junction of the lateral and medial electron fields. Although in practice this hot spot is
reduced (smeared) by moving the match line, this is not reflected in the conventional
plan.

53
Figure 17. Transverse views of the conventional plan (a) and TomoTherapy plan (b)
taken at the IMN region as shown on the sagittal view (c).

54
Figure 18. Transverse views of the conventional plan (a) and TomoTherapy plan (b)
taken at the CW region as shown on the sagittal view (c).
The conventional plan showed a sharper dose falloff than that of the TomoTherapy
plan along the beam edges of the medial and the lateral CW of the conventional plan.
Greater dose restriction outside the CW PTV in the TomoTherapy plan during
optimization might have resulted in a sharper dose falloff along the “beam edges”
delineated by the conventional plan. The TomoTherapy plan also showed a significant
volume of tissue outside the CW PTV receiving low dose (5 Gy or more). Both the

55
conventional and TomoTherapy plans showed similarity when it comes to sparing the
lung and heart.
3.4.2. DVH Comparisons
The DVH comparisons are shown in Figure 19. The conventional plan showed small
volume of the PTV receiving high dose created by the junction of the medial and lateral
CW. For the TomoTherapy plan, dose homogeneity was better than the conventional plan
for both the SCl/AX and CW PTVs. However, low dose (5 Gy or more) covered a larger
volume of the normal tissue not including critical structures. The crossover dose for the
ipsilateral lung was 5.5 Gy. The crossover dose for the heart was 15 Gy.
0
10
20
30
40
50
60
70
80
90
100
0 10 20 30 40 50 60 70 80Dose (Gy)
Volu
me (
%)
CW: Conventional
CW: Tomo
SCl/AX: Conventional
SCl/AX: Tomo
Ipsi. Lung: Conventional
Ipsi. Lung: Tomo
Heart: Conventional
Heart: Tomo
Normal Tissue: Conventional
Normal Tissue: Tomo
Cont. Breast: Conventional
Cont. Breast: Tomo
Figure 19. DVH comparisons for distribution shown in Figures 16 to 18. Solid lines –
conventional plan, dashed lines –TomoTherapy plan. CW – CW PTV; SCl/AX –
supraclavicular/axillary PTV; Ipsi – ipsilateral; Cont – contralateral

56
3.4.3. Radiation Oncologist Review
A radiation oncologist evaluated the clinical acceptability of both conventional and
TomoTherapy plans and scored both plans acceptable. After reviewing the dose
distributions and DVHs for both plans, he ranked the TomoTherapy plan superior. No
comment was provided on his decision.
3.4.4. Chest Wall
The TomoTherapy plan showed an improved uniform dose distribution. The average
CW dose (+ 1σ) was 49.7 + 1.9 Gy on the TomoTherapy plan and 52.4 + 7.0 Gy on the
conventional plan. Dose irradiating 90% to 10% of the CW volume was 14.3 Gy on the
conventional plan and was 4.2 Gy for the TomoTherapy plan. Even though the CW PTV
dose distribution showed better uniformity on the TomoTherapy plan, the TCP values
were similar for both plans (conventional plan = 0.989 and TomoTherapy plan = 0.991).
3.4.5. Ipsilateral Lung
The TomoTherapy plan showed less volume of ipsilateral lung irradiated. The
ipsilateral lung receiving dose above 20 Gy was reduced from 28.4% on the conventional
plan to 22.0% on the TomoTherapy plan. Also unlike the TomoTherapy plan, the
ipsilateral lung was exposed to high doses with the conventional plan (e.g. 5% of the
ipsilateral lung received 40 Gy or more). The average ipsilateral lung dose (+ 1σ) was
comparatively lower on the TomoTherapy plan (conventional plan = 14.0 + 17.7 Gy and
on the TomoTherapy plan = 11.5 + 13.3 Gy). A relatively lower NTCP value was
calculated for the TomoTherapy plan although both values were small (conventional plan
= 0.02 and TomoTherapy plan = 0.0031).
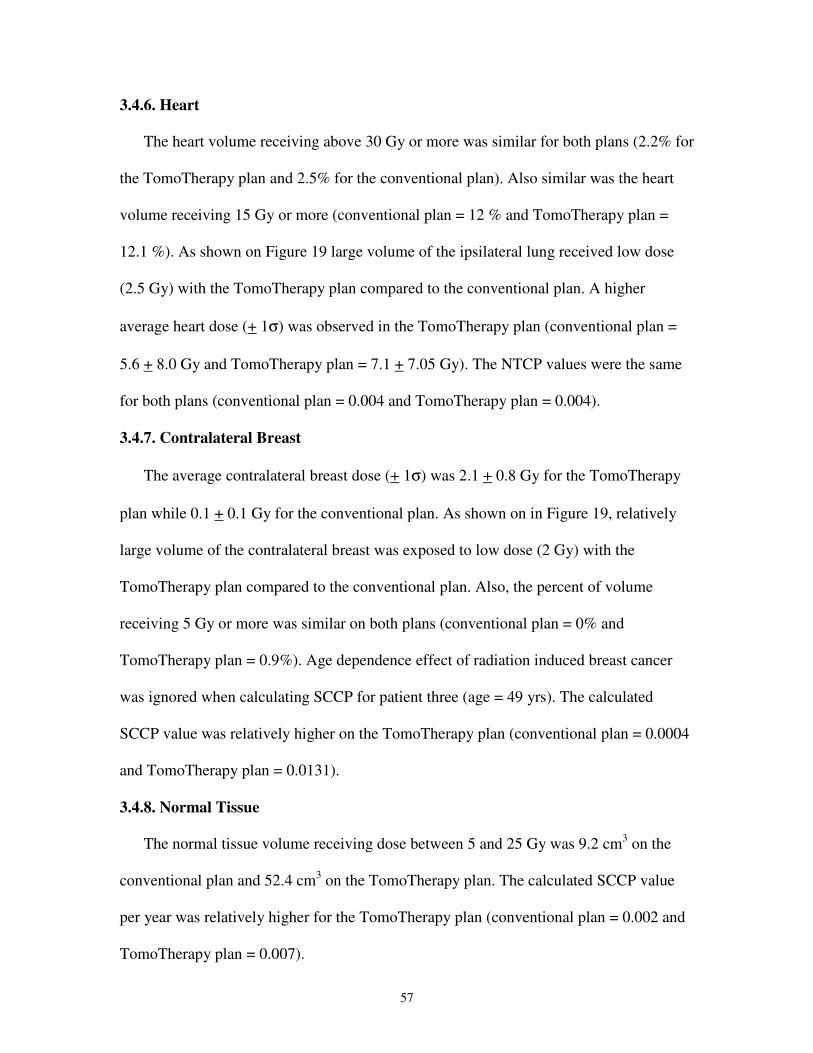
57
3.4.6. Heart
The heart volume receiving above 30 Gy or more was similar for both plans (2.2% for
the TomoTherapy plan and 2.5% for the conventional plan). Also similar was the heart
volume receiving 15 Gy or more (conventional plan = 12 % and TomoTherapy plan =
12.1 %). As shown on Figure 19 large volume of the ipsilateral lung received low dose
(2.5 Gy) with the TomoTherapy plan compared to the conventional plan. A higher
average heart dose (+ 1σ) was observed in the TomoTherapy plan (conventional plan =
5.6 + 8.0 Gy and TomoTherapy plan = 7.1 + 7.05 Gy). The NTCP values were the same
for both plans (conventional plan = 0.004 and TomoTherapy plan = 0.004).
3.4.7. Contralateral Breast
The average contralateral breast dose (+ 1σ) was 2.1 + 0.8 Gy for the TomoTherapy
plan while 0.1 + 0.1 Gy for the conventional plan. As shown on in Figure 19, relatively
large volume of the contralateral breast was exposed to low dose (2 Gy) with the
TomoTherapy plan compared to the conventional plan. Also, the percent of volume
receiving 5 Gy or more was similar on both plans (conventional plan = 0% and
TomoTherapy plan = 0.9%). Age dependence effect of radiation induced breast cancer
was ignored when calculating SCCP for patient three (age = 49 yrs). The calculated
SCCP value was relatively higher on the TomoTherapy plan (conventional plan = 0.0004
and TomoTherapy plan = 0.0131).
3.4.8. Normal Tissue
The normal tissue volume receiving dose between 5 and 25 Gy was 9.2 cm3 on the
conventional plan and 52.4 cm3 on the TomoTherapy plan. The calculated SCCP value
per year was relatively higher for the TomoTherapy plan (conventional plan = 0.002 and
TomoTherapy plan = 0.007).

58
3.5. Patient Four
A 39 – year old female was diagnosed to have an infiltrating ductal carcinoma of the
upper outer quadrant of the left breast, stage T3pN2aM0 carcinoma with 9 out of 12
lymph nodes positive with extra-nodal extension. The conventional electron beam PMRT
plan had the following fields:
1. AP/PA 6 MV photon beam SCl/AX fields,
2. 12 MeV electron beam IMN field,
3. 9 MeV electron beam medial CW field, and
4. 9 MeV electron beam lateral CW field.
The prescription for the CW was 50 Gy in 25 fractions. The prescription for the SCl/AX
was 48.25 Gy in 25 fractions.
3.5.1. Isodose Comparison
Figure 20 shows the isodose comparison between the conventional plan (Figure 20a)
and the TomoTherapy plan (Figure 20b) on the transverse CT image slice in the region of
the supraclavicular nodes delineated by the yellow line in sagittal midline CT image
shown in Figure 20c. The yellow green 43.4 Gy isodose line represents the 90%
prescription isodose line where the TomoTherapy plan was optimized to match the
conventional plan. The conventional plan showed a hot spot of 55 Gy (110% of the
prescription dose) in the medial, anterior portion of the dose distribution, whereas the
TomoTherapy plan showed a lower hot spot of 50 Gy (104% of the prescription dose) in
that region. Unlike the conventional plan, the TomoTherapy plan avoided irradiating the
ipsilateral lung with high dose (45 Gy).
The conventional plan showed a sharper dose falloff than the TomoTherapy plan
along the beam edges of the parallel-opposed photon beams of the conventional plan. The

59
TomoTherapy plan also showed a significant volume of tissue outside the PTV receiving
low dose (5 Gy or more).
Figure 20. Transverse views of the conventional plan (a) and TomoTherapy plan (b)
taken at the supraclavicular nodal region shown on sagittal view (c).
Figure 21 shows the isodose comparison for the conventional plan (Figure 21a) and
the TomoTherapy plan (Figure 21b) on a transverse CT image slice in the region of the
IMN delineated by the yellow line in sagittal image shown in Figure 21c. The yellow 45
Gy isodose line represents the 90% prescription isodose line, where the TomoTherapy
(a) Conventional
Hot Spots

60
plan was optimized to match the conventional plan. The Conventional plan showed a hot
spot of 55 Gy (110% of the prescription dose) at the junction of the lateral and medial
electron fields.
The conventional plan showed a sharper dose falloff than that of the TomoTherapy
plan along the beam edges of the electron beams for the IMN and the lateral CW of the
conventional plan. Higher dose near the aorta was observed in the TomoTherapy plan.
The TomoTherapy plan showed a significant volume of tissue outside the PTV receiving
low dose (5 Gy or more).
Figure 22 shows the isodose comparison between the conventional plan (Figure 22a)
and the TomoTherapy plan (Figure 22b) on the transverse CT image slice near the
inferior border of the CW PTV, and is delineated by the yellow line in sagittal midline
CT image shown in Figure 22c. The yellow 45 Gy isodose line represents the 90%
isodose line, where the TomoTherapy plan was optimized to match the conventional plan.
The conventional plan showed a significant region of tissue receiving 55 Gy (110% of the
prescription dose).
The conventional plan showed a sharper dose falloff than that of the TomoTherapy
plan along the beam edges of the medial and the lateral CW of the conventional plan. The
TomoTherapy plan showed a significant volume of tissue outside the PTV receiving low
dose (5 Gy or more).
3.5.2. DVH Comparisons
The DVH comparisons are shown in Figure 23. The conventional plan showed a
small volume of the PTV receiving high dose created by the junction of the medial and
lateral CW. Although in practice this hot spot is reduced by moving (smeared) the match
line. For the TomoTherapy plan showed dose homogeneity was better than the

61
conventional plan for both the SCl/AX and CW PTVs. However, low dose (5Gy or more)
covered a large area of contralateral breast, contralateral lung, and the normal tissue not
including critical structures. The crossover dose for the ipsilateral lung was 16 Gy. The
crossover dose for the heart was 8.6 Gy.
Figure 21. Transverse views of the conventional plan (a) and TomoTherapy plan (b)
taken at the IMN region as shown on the sagittal view (c).

62
Figure 22. Transverse views of the conventional plan (a) and TomoTherapy plan (b)
taken at the CW region as shown on the sagittal view (c).

63
0
10
20
30
40
50
60
70
80
90
100
0 10 20 30 40 50 60 70 80Dose (Gy)
Volu
me (
%)
CW: Conventional
CW: Tomo
SCl/AX: Conventional
SCl/AX: Tomo
Ipsi. Lung: Conventional
Ipsi. Lung: Tomo
Heart: Conventional
Heart: Tomo
Normal Tissue: Conventional
Normal Tissue: Tomo
Cont. Breast: Conventional
Cont. Breast: Tomo
Figure 23. DVH comparisons for distribution shown in Figures 20 to 22. Solid lines –
conventional plan, dashed lines –TomoTherapy plan. CW – CW PTV; SCl/AX –
supraclavicular/axillary PTV; Ipsi – ipsilateral; Cont – contralateral
3.5.3. Radiation Oncologist Review
A radiation oncologist evaluated the clinical acceptability of both conventional and
TomoTherapy plans and scored the conventional plan marginally acceptable and the
TomoTherapy plan acceptable. After reviewing the dose distributions and DVHs for both
plans, he ranked the TomoTherapy plan superior. Better PTV coverage and fewer hot
spots on the TomoTherapy plan was listed as a primary reason for preferring
TomoTherapy plan over the conventional plan.
3.5.4. Chest Wall
The TomoTherapy plan showed an improved uniform dose distribution. The average
CW dose (+ 1σ) was 50.4 + 1.5 Gy on the TomoTherapy plan and 54.0 + 7.5 Gy on the
conventional plan. Dose irradiating 90% to 10% of the CW volume was 12.5 Gy for the

64
conventional plan and was 3.0 Gy for the TomoTherapy plan. Even though, the CW PTV
dose distribution showed better uniformity on the TomoTherapy plan, the TCP values
were similar for both plans (conventional plan = 0.996 and TomoTherapy plan = 0.997).
3.5.5. Ipsilateral Lung
Compared to the conventional plan, the TomoTherapy plan avoided exposing the
ipsilateral lung with high doses (45 Gy). However, as shown in Figure 23, a large
volume of the ipsilateral lung received low dose (5 Gy or more) with the TomoTherapy
plan. Similar values for V20lung was observed for both plans (conventional plan = 23.9%
and TomoTherapy plan = 22.8%). The average ipsilateral lung dose (+ 1σ) was
comparatively lower on the TomoTherapy plan (conventional plan = 13.3 + 16.7 Gy and
TomoTherapy plan = 12.7 + 12.7 Gy). A relatively smaller NTCP value was observed for
the TomoTherapy plan although both values were insignificant (conventional plan =
0.0117 and TomoTherapy plan = 0.0059).
3.5.6. Heart
The heart receiving dose above 30 Gy or more was reduced from 6.8% on the
conventional plan to 4.1% on the TomoTherapy plan. The heart volume receiving 15 Gy
or more was reduced from 17.1% on the conventional plan to 14.5% on the
TomoTherapy plan. However, as shown in Figure 23, a large volume of the heart
received low dose (2.5 Gy) with the TomoTherapy plan. Comparable average heart dose
(+ 1σ) was observed in both plans (conventional plan = 8.5 + 10.7 Gy and TomoTherapy
plan = 9.1 + 7.7 Gy). A lower NTCP value was calculated for the TomoTherapy plan
(conventional plan = 0.020 and TomoTherapy plan = 0.007).

65
3.5.7. Contralateral Breast
Dose to the contralateral breast was significantly higher in the TomoTherapy plan
than in the conventional plan. The average contralateral breast dose (+ 1σ) was 3.8 + 2.8
Gy on the TomoTherapy plan while 0.7 + 0.5 Gy on the conventional plan. As shown in
Figure 23, a large volume of the contralateral breast was exposed to low dose (2 Gy) with
the TomoTherapy plan. Large difference was observed for the percent of volume
receiving 5 Gy or more (conventional plan = 0.0% and TomoTherapy plan = 30.6%). Age
dependence effect of radiation induced breast cancer was ignored when calculating SCCP
for patient four (age = 39 yrs). The calculated SCCP value was relatively higher for the
TomoTherapy plan (conventional plan = 0.0046 and TomoTherapy plan = 0.0183).
3.5.8. Normal Tissue
The normal tissue volume receiving between 5 and 25 Gy for this patient was 32.7
cm3 for the conventional plan and 89.1 cm
3 on the TomoTherapy plan. The calculated
SCCP value was relatively higher for the TomoTherapy plan (conventional plan = 0.004
and TomoTherapy plan = 0.009).
3.6. Patient Five
A 49 – year old female was diagnosed to have an infiltrating ductal carcinoma of the
upper outer quadrant of the left breast, stage T1scpN1M0 carcinoma with 2 out of 19
lymph nodes positive with extra-nodal extension. The conventional electron beam PMRT
plan had the following fields:
1. AP/PA 6 MV photon beam SCl/AX fields,
2. 12 MeV electron beam IMN field,
3. 9 MeV electron beam medial CW field, and
4. 9 MeV electron beam lateral CW field.

66
The prescription for the CW was 50 Gy in 25 fractions. The prescription for the SCl/AX
was 45 Gy in 25 fractions.
3.6.1. Isodose Comparison
Figure 24 shows the isodose comparison between the conventional plan (Figure 24a)
and the TomoTherapy plan (Figure 24b) on the transverse CT image slice in the region of
the supraclavicular nodes delineated by the yellow line in sagittal midline CT image
shown in Figure 24c. The yellow green 40.5 Gy isodose line represents the 90%
prescription isodose line where the TomoTherapy plan was optimized to match the
conventional plan. Unlike the TomoTherapy plan, the conventional plan showed large
area covered by hot spot of 50 Gy (110% of the prescription dose).
The conventional plan showed a sharper dose falloff than the TomoTherapy plan
along the beam edges of the parallel-opposed photon beams of the conventional plan. The
TomoTherapy plan also showed a significant volume of tissue outside the PTV receiving
low dose (5 Gy or more).
Figure 25 shows the isodose comparison between the conventional plan (Figure 25a)
and the TomoTherapy plan (Figure 25b) on a transverse CT image slice in the region of
the IMN delineated by the yellow line in sagittal image shown in Figure 25c. The yellow
green 40.5 Gy isodose line represents the 90% prescription isodose line, where the
TomoTherapy plan was optimized to match the conventional plan. The conventional plan
showed a hot spot of 55 Gy (110% of the prescription dose) at the junction of the lateral
and medial electron fields.

67
Figure 24. Transverse views of the conventional plan (a) and TomoTherapy plan (b)
taken at the supraclavicular nodal region shown on sagittal view (c).
The conventional plan showed a sharper dose falloff than the TomoTherapy plan
along the beam edges of the electron beams for the IMN and the lateral CW of the
conventional plan. TomoTherapy showed more dose in the region of the aorta. Also, the
TomoTherapy plan showed a significant volume of tissue outside the PTV receiving low
dose (5 Gy or more).

68
Figure 25. Transverse views of the conventional plan (a) and TomoTherapy plan (b)
taken at the IMN region as shown on the sagittal view (c).
Figure 26 shows the isodose comparison between the conventional plan (Figure 26a)
and the TomoTherapy plan (Figure 26b) on the transverse CT image slice near the
inferior border of the CW PTV, and is delineated by the yellow line in sagittal midline
CT image shown in Figure 26c. The yellow 45 Gy isodose line represents the 90%
isodose line, where the TomoTherapy plan was optimized to match the conventional plan.
The conventional plan showed a hot spot of 55 Gy (110% of the prescription dose) at the
junction of the lateral and medial electron fields.

69
The conventional plan showed a sharper dose falloff than the TomoTherapy plan
along the beam edges of the medial and the lateral CW of the conventional plan. The
TomoTherapy plan showed a significant volume of tissue outside the PTV receiving low
dose (5 Gy or more).
Figure 26. Transverse views of the conventional plan (a) and TomoTherapy plan (b)
taken at the CW region as shown on the sagittal view (c).
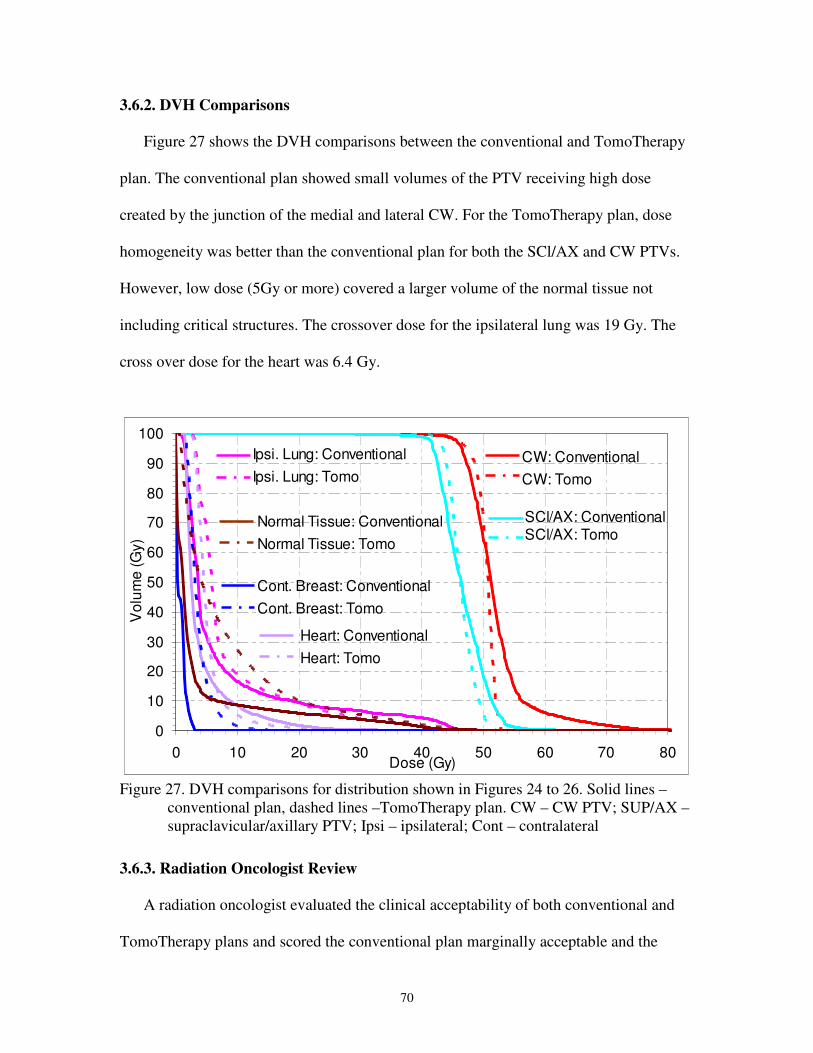
70
3.6.2. DVH Comparisons
Figure 27 shows the DVH comparisons between the conventional and TomoTherapy
plan. The conventional plan showed small volumes of the PTV receiving high dose
created by the junction of the medial and lateral CW. For the TomoTherapy plan, dose
homogeneity was better than the conventional plan for both the SCl/AX and CW PTVs.
However, low dose (5Gy or more) covered a larger volume of the normal tissue not
including critical structures. The crossover dose for the ipsilateral lung was 19 Gy. The
cross over dose for the heart was 6.4 Gy.
0
10
20
30
40
50
60
70
80
90
100
0 10 20 30 40 50 60 70 80Dose (Gy)
Vo
lum
e (G
y)
Ipsi. Lung: Conventional
Ipsi. Lung: Tomo
CW: Conventional
CW: Tomo
SCl/AX: Conventional SCl/AX: Tomo
Heart: Conventional
Heart: Tomo
Normal Tissue: Conventional
Normal Tissue: Tomo
Cont. Breast: Conventional
Cont. Breast: Tomo
Figure 27. DVH comparisons for distribution shown in Figures 24 to 26. Solid lines –
conventional plan, dashed lines –TomoTherapy plan. CW – CW PTV; SUP/AX –
supraclavicular/axillary PTV; Ipsi – ipsilateral; Cont – contralateral
3.6.3. Radiation Oncologist Review
A radiation oncologist evaluated the clinical acceptability of both conventional and
TomoTherapy plans and scored the conventional plan marginally acceptable and the

71
TomoTherapy plan acceptable. After reviewing the dose distributions and DVHs for both
plans, he ranked the TomoTherapy plan superior. Better PTVs (CW and SCl/AX)
coverage and fewer doses to the critical structure on the TomoTherapy plan was listed as
a primary reason for preferring TomoTherapy plan over the conventional plan.
3.6.4. Chest Wall
The TomoTherapy plan showed improved dose homogeneity in the CW. The average
CW dose (+ 1σ) was 50.4 + 1.7 Gy on the TomoTherapy plan and 52.0 + 5.2 Gy on the
conventional plan. Dose irradiating 90% to 10% of the CW volume was 9.0 Gy on the
conventional plan and was 3.5 Gy on the TomoTherapy plan. The TCP values were
similar for both plans (conventional plan = 0.990 and TomoTherapy plan = 0.993).
3.6.5. Ipsilateral Lung
The TomoTherapy plan avoided exposing the ipsilateral lung with high doses (45
Gy). However, as shown in Figure 27, a large volume of the ipsilateral lung received low
dose (5 Gy or more) with the TomoTherapy plan. Comparable V20lung was observed for
both plans (conventional plan = 9.5% and TomoTherapy plan = 9.2%). The ipsilateral
lung dose (+ 1σ) was lower for the TomoTherapy plan (conventional plan = 7.4 + 10.2
Gy and TomoTherapy plan = 8.5 + 8.0 Gy). A lower NTCP value was calculated for the
TomoTherapy plan (conventional plan = 0.0001 and TomoTherapy plan = 0.0002).
3.6.6. Heart
In this patient the heart is not a proximal critical structure because the CW PTV is
located on the right side of the patient’s anatomy. The heart volume receiving above 30
Gy or more was similar for both plans (0.1% on the TomoTherapy plan and 0.4% on the
conventional plan). The heart volume receiving 15 Gy or more was reduced from 4.1 %
on the conventional plan to 1.9 % on the TomoTherapy plan. The average heart dose (+
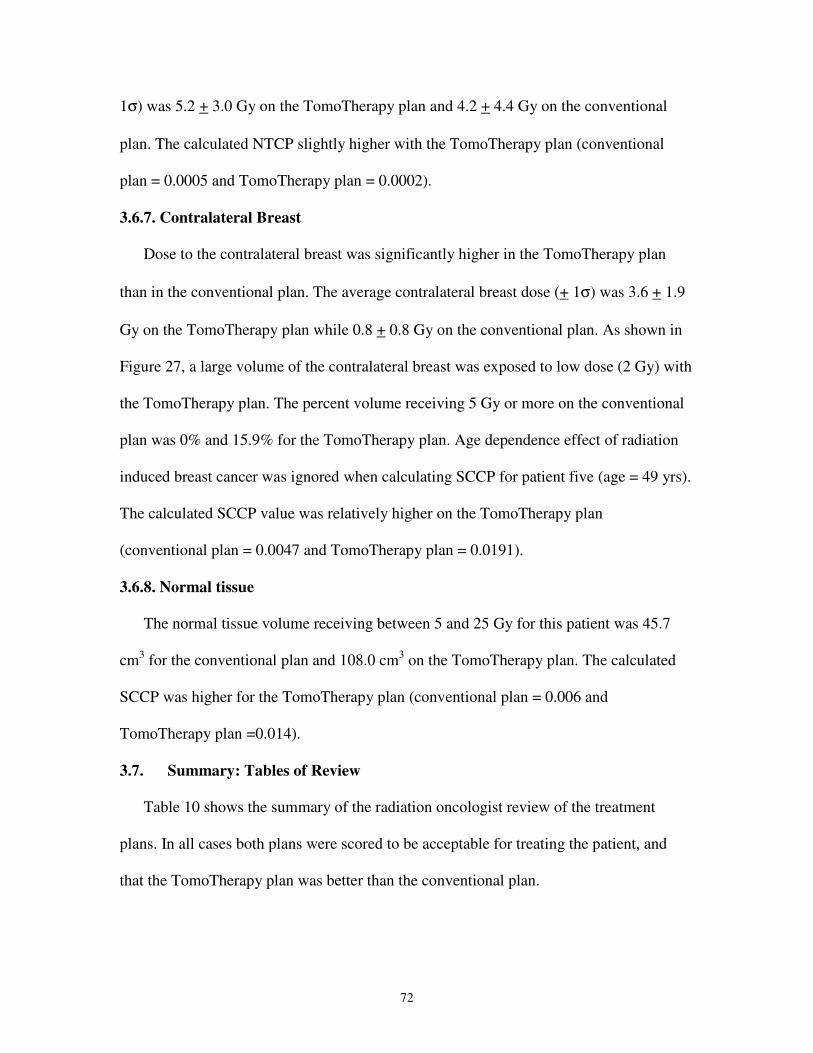
72
1σ) was 5.2 + 3.0 Gy on the TomoTherapy plan and 4.2 + 4.4 Gy on the conventional
plan. The calculated NTCP slightly higher with the TomoTherapy plan (conventional
plan = 0.0005 and TomoTherapy plan = 0.0002).
3.6.7. Contralateral Breast
Dose to the contralateral breast was significantly higher in the TomoTherapy plan
than in the conventional plan. The average contralateral breast dose (+ 1σ) was 3.6 + 1.9
Gy on the TomoTherapy plan while 0.8 + 0.8 Gy on the conventional plan. As shown in
Figure 27, a large volume of the contralateral breast was exposed to low dose (2 Gy) with
the TomoTherapy plan. The percent volume receiving 5 Gy or more on the conventional
plan was 0% and 15.9% for the TomoTherapy plan. Age dependence effect of radiation
induced breast cancer was ignored when calculating SCCP for patient five (age = 49 yrs).
The calculated SCCP value was relatively higher on the TomoTherapy plan
(conventional plan = 0.0047 and TomoTherapy plan = 0.0191).
3.6.8. Normal tissue
The normal tissue volume receiving between 5 and 25 Gy for this patient was 45.7
cm3 for the conventional plan and 108.0 cm
3 on the TomoTherapy plan. The calculated
SCCP was higher for the TomoTherapy plan (conventional plan = 0.006 and
TomoTherapy plan =0.014).
3.7. Summary: Tables of Review
Table 10 shows the summary of the radiation oncologist review of the treatment
plans. In all cases both plans were scored to be acceptable for treating the patient, and
that the TomoTherapy plan was better than the conventional plan.
73
Table 10. Summary of the radiation oncologist plan review
Patient Conventional
(Conv.)
TomoTherapy
(Tomo)
Conv. Vs. Tomo Reason for
preferring Tomo
over Conv.
1 Acceptable Acceptable Marginally* Superior Better PTV coverage;
absence of hot or cold
spot
2 Marginally
Acceptable
Acceptable Superior Absence of hot or
cold spot
3 Acceptable Acceptable Superior No comment
4 Marginally
Acceptable
Acceptable Superior Better PTV coverage;
less hot spot
5 Marginally
Acceptable
Acceptable Superior Better PTV coverage;
less dose to the
critical structure
*Dose to the heart in the TomoTherapy plan was a concern if probability that the
patient was to receive chemotherapy.
3.7.1. Chest Wall
Table 11 lists the mean dose and the standard deviation of dose distribution in the
CW PTV for each of the treatment plans. Table 12 lists the D90%-D10% for the CW PTV.
Both tables show improved dose homogeneity in the CW PTV with the TomoTherapy
plan. A Paired Student ‘t’ test was used for plan comparisons using the values listed on
Table 12. There exist a significant difference in the D90%-D10% for the CW PTV between
the conventional and the TomoTherapy plans (p = 0.001). Paired Student ‘t’ test is a
statistical analysis method used to evaluate if there exist an actual difference between two
small sets of quantitative data when data in each sample set are related. The difference is
statistically significant (95% confidence level), if the value of p (probability) < 0.05. On
the other hand, the difference is not statically significant, if the value of p > 0.05 (Press et
al. 1986). The average value (+ 1σ) was reduced from 11.8 + 2.3 Gy on the conventional
plan to 2.9 + 1.1 Gy on the Tomotherapy plan.

74
Table 11. Dmean (Gy) for PTV: CW (Average + Standard deviation)
Patient Conventional TomoTherapy
1 50.7 + 6.0 49.6 + 0.9
2 51.4 + 6.1 49.9 + 1.1
3 52.4 + 7.0 49.7 + 1.9
4 54.0 + 7.5 50.4 + 1.5
5 52.0 + 5.2 50.4 + 1.7
Table 12. D90% – D10% (Gy) for PTV: CW
Patient Conventional TomoTherapy
1 9.8 1.4
2 13.6 2.3
3 14.3 4.2
4 12.5 3.0
5 9.0 3.5
Table 13 lists the TCP values of the CW PTV for all patients. There was a slight, but
insignificant difference in the calculated TCP values for CW PTV between the
conventional and the TomoTherapy plans (p = 0.11).The average TCP value (+ 1σ) on
the conventional plan was 0.988 +0.007 and 0.994 + 0.002 on the TomoTherapy plan.
Table 13. Calculated TCP values for CW PTV
Patient Conventional TomoTherapy
1 0.978 0.995
2 0.989 0.996
3 0.989 0.991
4 0.996 0.997
5 0.990 0.993
3.7.2. Lung
Table 14 lists the V20lung for the ipsilateral lung. There was a statistically significant
difference in the ipsilateral lung volume receiving > 20 Gy between the conventional and
the TomoTherapy plans (p = 0.05). The average value (+ 1σ) of the V20lung for the
conventional plan was 21.5 +8.5 % and 17.6 + 7.8 % for the TomoTherapy plan.

75
Table 14. Percent volume of the ipsilateral lung receiving > 20 Gy
Patient Conventional TomoTherapy
1 16.1 9.1
2 29.4 24.8
3 28.4 22.0
4 23.9 22.8
5 9.5 9.2
Table 15 lists the calculated NTCP values for the ipsilateral lung. There was no
significant differences in the NTCP between the conventional and the TomoTherapy
plans (p = 0.13).The average of the NTCP (+ 1σ) on the conventional plan was 0.012 +
0.011 and 0.003 + 0.002 on the TomoTherapy plan.
Table 15. Calculated NTCP values for radiation pneumonitis
Patient Conventional TomoTherapy
1 0.0007 0.0016
2 0.0250 0.0049
3 0.0200 0.0031
4 0.0117 0.0059
5 0.0001 0.0002
Table 16 shows the V20lung for the total lung (ipsilateral + contralateral) volume.
Three out of the five patients listed had V20lung values that were higher than the clinical
limit of 15%. There was no significant differences in the volume receiving > 20 Gy
between the conventional and the TomoTherapy plans (p = 0.4). The average of the
V20lung (+ 1σ) on the conventional plan was 12.4 + 4.2 % and 11.4 + 3.3 % on the
TomoTherapy plan.
Table 17 lists the calculated SCCP values for the ipsilateral lung. There was
significant differences in the SCCP between the conventional and the TomoTherapy
plans (p = 0.005).The average of the SCCP (+ 1σ) on the conventional plan was 0.021 +
0.007 and 0.029 + 0.008 on the TomoTherapy plan.

76
Table 16. Percent volume of the total lung (ipsilateral + contralateral) > 20 Gy
Patient Conventional TomoTherapy
1 9.9 7.8
2 17.8 15.1
3 15.2 12.1
4 11.8 13.8
5 7.2 8.2
Table 17. Ipsilateral lung’s calculated SCCP values
Patient Conventional TomoTherapy
1 0.020 0.033
2 0.019 0.025
3 0.014 0.023
4 0.019 0.024
5 0.032 0.041
Table 18 lists the calculated SCCP values for the total lung. There was significant
differences in the SCCP between the total and the TomoTherapy plans (p = 0.004).The
average SCCP value (+ 1σ) on the conventional plan was 0.032 + 0.012 and 0.062 +
0.010 on the TomoTherapy plan.
Table 18. Total lung’s calculated SCCP values
Patient Conventional TomoTherapy
1 0.028 0.073
2 0.025 0.046
3 0.019 0.059
4 0.038 0.067
5 0.049 0.066
3.7.3. Heart
Table 19 lists the value of V30heart. Since the heart is not in a proximal distance to the
CW PTV for the last patient, the fifth patient’s V30heart, V15heart and NTCP were not
considered when calculating either a paired Student’s T test or the overall average. There
was a difference, although statistically insignificant, in the volume receiving > 30 Gy

77
between the conventional and the TomoTherapy plans (p = 0.14). The average heart
volume receiving dose above or equal to 30 Gy (+ 1σ) was reduced from 2.7 +2.9 % on
the conventional plan to 1.6 + 2.0 % on the TomoTherapy plan.
Table 19. Percent volume of the heart receiving > 30 Gy
Patient Conventional TomoTherapy
1 0.54 0.06
2 0.9 0.02
3 2.5 2.2
4 6.8 4.1
5 0.4 0.1
Table 20 lists the value of V15heart. Both the conventional and the TomoTherapy plans
showed values of V15heart higher than the clinical limit of 10% for two of the cases. The
average heart volume receiving dose above or equal to V15 (+ 1σ) on the conventional
plan was 9.5 +6.2 % and 9.5 + 4.6 % on the TomoTherapy plan. There were no
significant differences in the volume receiving > 15 Gy was observed between the
conventional and the TomoTherapy plans (p = 0.98).
Table 20. Percent volume of the heart receiving > 15 Gy
Patient Conventional TomoTherapy
1 4.3 4.5
2 4.6 6.8
3 12.0 12.1
4 17.1 14.5
5 4.1 1.9
Table 21 shows the calculated NTCP values for the heart. There were no significant
differences in the NTCP for excess cardiac mortality after radiotherapy between the
conventional and the TomoTherapy plans (p = 0.31). The average of the NTCP (+ 1σ) on
the conventional plan was 0.007 +0.009 and 0.003 + 0.003 on the TomoTherapy plan.

78
Table 21. Calculated NTCP values for excess cardiac mortality due to Ischaemic disease
after radiotherapy
Patient Conventional TomoTherapy
1 0.0009 0.0002
2 0.0018 0.0003
3 0.004 0.004
4 0.02 0.007
5 0.0005 0.0002
3.7.4. Contralateral Breast
Table 22 lists the average dose to the contralateral breast. The overall average of the
mean dose of the contralateral breast on the conventional plan was 0.4 and 2.95 on the
TomoTherapy plan.
Table 22. Dmean (Gy) for contralateral breast (Average + Standard deviation)
Patient Age (yrs) Conventional TomoTherapy
1 73 0.1 + 0.1 3.20 + 1.58
2 53 0.1 + 0.1 2.07 + 1.37
3 49 0.1 + 0.1 2.10 + 0.76
4 39 0.7 + 0.5 3.77 + 2.75
5 49 0.8 + 0.8 3.60 + 1.93
Table 23 lists the V5contralateral breast. There were differences in the contralateral
breast volume receiving > 5 Gy between the conventional and the TomoTherapy plans (p
= 0.08). The average of the V5contralateral breast (+ 1σ) on the conventional plan was
0.0 % and 12.7 + 11.9 % on the TomoTherapy plan.
Table 23. Percent volume of the contralateral breast receiving > 5 Gy
Patient Conventional TomoTherapy
1 0 13.1
2 0 3.0
3 0 0.9
4 0 30.6
5 0 15.9

79
Age dependence effect of radiation induced breast cancer was ignored when
calculating the SCCP values (Table 24) for the contralateral breast. There was
statistically significant difference in the SCCP after radiotherapy between the
conventional and the TomoTherapy plans (p = 0.0001). The average of the SCCP (+ 1σ)
was 0.002 + 0.002 for the conventional plan and 0.016 + 0.003 for the TomoTherapy
plan.
Table 24. Calculated SCCP for the contralateral breast after radiotherapy
Patient Conventional TomoTherapy
1 0.0001 0.0178
2 0.0003 0.0125
3 0.0004 0.0131
4 0.0046 0.0183
5 0.0047 0.0191
3.7.5. Normal Tissue
Table 25 lists the percent volume of normal tissue receiving 5 to 25 Gy. There was a
statistically significant difference between the rival plans in the percentage of normal
tissue volume that received 5 to 25 Gy (p = 0.002). The overall average of on the
conventional plan (+ 1σ) was 23.4 +15.5 cm3 and 84.6+ 26.7 cm
3 on the TomoTherapy
plan.
Table 25. Volume of normal tissue (delineated tissue volume except critical structures)
receiving between 5 and 25 Gy
Patient Conventional TomoTherapy
1 17.6 111.7
2 11.6 61.9
3 9.2 52.4
4 32.7 89.1
5 45.7 108.0

80
Table 26 lists the SCCP values for normal tissue. There was a statistically significant
difference in the SCCP values between the rival plans (p = 0.001). The average of the
SCCP on the conventional plan (+ 1σ) was 0.003 + 0.002 and 0.010 + 0.003 on the
TomoTherapy plan.
Table 26. Calculated SCCP values for normal tissue
Patient Conventional TomoTherapy
1 0.003 0.012
2 0.002 0.008
3 0.002 0.007
4 0.004 0.009
5 0.006 0.014

81
Chapter 4
Discussions
The focus of this study was to show TomoTherapy could deliver dose distributions a
radiation oncologist judges to be equal to or better than that of a conventional electron
plan. Physical dose-volume and radiobiological metrics were calculated and used to
evaluate the treatment plans in addition to the radiation oncologist’s critique.
4.1. Similarities Between The TomoTherapy and Conventional Plans
Overall, the TomoTherapy plan was very similar to the conventional electron beam
plan in treating the CW PTV while sparing critical structures adjacent to the CW PTV.
There was no statistically significant difference in the CW TCP values between the
TomoTherapy and conventional plans, although there was considerable difference in
PTV dose homogeneity. The values for V20lung and NTCP for the ipsilateral lung were
similar (i.e., no significant difference) between the two treatment plans, as was the values
for V15heart, V30heart, and NTCP for the heart. From this study, one can assume with some
degree of confidence that TomoTherapy is able to plan a PMRT that is as good as the
conventional electron beam PMRT plan so far as TCP and NTCP are concerned.
4.2. Differences Between The TomoTherapy and Conventional Plans
As expected, the Tomotherapy plan showed better PTV dose uniformity compared to
the conventional plan (Table 12). Dose uniformity was insured by giving a high
importance to the PTVs (CW and SCl/AX), and as a result, the TomoTherapy plan
produced a significantly more uniform dose distribution in the PTV. Also, the
conventional plan had at least a 10% dose gradient because of the method of generating
the PTVs (i.e., the 90% isodose line was utilized to generate the PTV). Hot spots in the

82
field junctions added to the PTV dose inhomogeneity in the conventional plan. A
difference in PTV dose homogeneity, mostly due to the abutting of the electron fields,
were slightly over stated as the effect of edge feather were not included in the calculation.
On the other hand, the conventional plan successfully avoided irradiating the
contralateral breast. In all five cases, the volume receiving 5 Gy or more was negligible
(Table 23). In order to stop dose exposure to the contralateral breast, a higher importance
factor was assigned compared to other critical structures during the optimization of the
TomoTherapy plan. This helped reduce the dose to the contralateral breast; however, the
nature of beam arrangements and modality made dose reduction difficult for the
TomoTherapy. As a result, the average dose to the contralateral breast was higher
compared to the conventional plan. The average for all five patients was increased from
0.4 Gy on the conventional plan to 2.95 Gy on the TomoTherapy plan. No excess breast
cancer risk has been found among woman irradiated at age 40 years or older (Leeuwen et
al. 2005). Boice et al, (1992) showed radiation exposure after the age of 45 years entails
little, if any risk (relative risk, 1.01) of radiation-induced breast cancer for population of
an average age of 51.7 years woman exposed with mean radiation dose to the
contralateral breast be 2.82 Gy (maximum 7.10). Storm et al, (1992) also showed little if
any risk (relative risk, 1.04) of radiation-induced breast cancer for population of an
average age of 51 years woman exposed with mean radiation dose to contralateral breast
estimated to be 2.51 Gy. Relative risk is ratio of the probability of the event occurring in
the exposed group vs. the control (non-exposed) group. In the current study, the average
age for the five patients was 53 years and the overall average mean dose was 2.95 Gy.
Given the conclusions of the studies mentioned above, the risk of developing radiation

83
induced breast cancer is comparable with other PMRT techniques for the five patients
studied using the TomoTherapy.
Two assumptions were made when calculating SCCP for the contralateral breast. (1)
Age dependence effect of radiation induced breast cancer was ignored and (2) incidence
of solid tumor induction in the contralateral breast was only calculated. The SCCP
modeling for the TomoTherapy plan indicates a higher prediction of SCCP for the
TomoTherapy plan relative to the conventional plan (Table 24). This may be attributed to
the increased mean dose observed on the TomoTherapy plan (Table 22). The study
recommends that further studies that attempt to reduce dose to the contralateral breast
should be done before implementing TomoTherapy clinically as PMRT technique for
young patients less than 30 yrs of age who experience long survival times and may be at
risk of radiation-induced cancer. Hancock et al. (1993) showed that for women treated for
Hodgkin’s disease with therapeutic radiation before 30 years of age are at markedly
increased risk for breast cancer.
According to Schneider et al. (2005a), solid tumor induction anywhere in the body
tends to peak in the dose range of 5 to 25 Gy. Hence the present study noted the volume
receiving between 5 and 25 Gy and found larger normal tissue volumes on the
TomoTherapy plan compared to the conventional plan. This might be the reason why the
SCCP for normal tissue was higher on the TomoTherapy plan compared to the
conventional plan, but on the average, the calculated SCCP values for both rival plans
were found to be very small. Limiting high dose to critical structures (ipsilateral lung and
heart) proximal to the PTVs (CW and SCl/AX) the ipsilateral lung and heart and the
nature of TomoTherapy’s beam arrangements and modality resulted in low dose spread to
normal tissue. Dose limiting structures were used to minimize dose to the normal tissue
84
but could not eliminate the dose without negatively impacting the treatment plan. As a
result of the low dose spread to a large area of the normal tissue, TomoTherapy showed
relatively higher risk of SCCP. The overall SCCP value when using TomoTherapy plan
for the five studied patients was 0.088 + 0.012 (total lung = 0.062, contralateral breast =
0.016, and normal tissue = 0.010) compared to the conventional plan 0.037 + 0.011 (total
lung = 0.032, contralateral breast = 0.002, and normal tissue = 0.003). The influence of
chemotherapy and possible genetic susceptibility are not included in the radio-biological
models (TCP, NTCP and SCCP). Also, there is lack of accuracy in dos reconstruction in
patient treated decade ago. Hence, the absolute values generated by radiobiological
models thus far are not accurate and as a result should not be used to predict response.
However, the models are sufficient to compare rival plans.
4.3. Overview of Doctor’s Review
After reviewing the spatial dose distributions and the superimposed DVHs of both the
conventional and the TomoTherapy plans, the radiation oncologist ranked the
TomoTherapy plan to be superior in all cases (marginally superior in one case). The basis
for his judgment was his clinical experience. Absence of hot and cold spots to the PTV
for the TomoTherapy plan was the reason why he chose the TomoTherapy plan over the
conventional plan. He liked (1) the significant improvement in dose uniformity seen in
the PTV on the TomoTherapy plan, (2) the ability of the TomoTherapy to avoid
complexities that arise from matching abutting fields, (3) the absence of necessity for the
use of more than one modality (electrons/photons), and (4) the ability of the
TomoTherapy to spare specified organs at risk (e.g. ipsilateral lung). Also seen as a
bonus feature was the on board megavoltage computed tomography (CT), which verifies
setup in three dimensions rather than in two. On the other hand, he had a concern in the
85
accuracy of TomoTherapy dose delivery to the skin surface due to the effect of breathing
motion. The chest wall is the site at greater risk of recurrence in patient undergoing
mastectomy (Recht et al. 1996). For patient with locally advanced disease (stage IIIB),
achieving a high skin and subcutaneous dose may be more important (Thomas et al.
1989). It is also the clinical experience of radiation oncologists at MBPCC that most
recurrences (failure to control locoregional tumor) occur on the skin.
Both rival plans showed similarity on what the radiation oncologist set as a
requirement for the total lung and the heart (Table 16 and Table 20 respectively).
However, due to the nature of beam arrangements of the TomoTherapy delivery, only
two of the five TomoTherapy plans met his contralateral breast requirement (maximum
of 5 Gy), while all five of the conventional plans met his requirement (Table 23).

86
Chapter 5
Conclusions
The study showed that TomoTherapy can deliver dose distributions the radiation
oncologist judges to be equal to or better than that of a conventional electron beam
PMRT plan for five CW treatment plans. TomoTherapy showed improved dose
homogeneity in the CW PTV with reduced dose to proximal critical structures (ipsilateral
lung and heart). However, large volume of critical structures and normal tissue received
low doses with TomoTherapy. As a result, SCCP for a contralateral breast and normal
tissue were found to be higher with the TomoTherapy plan when compared to the
conventional plan. This may be a concern for young patients (< 30 yrs) who experience
long survival times and as a result may be at risk of radiation-induced cancer; however,
this was not considered a significant factor by the radiation oncologist reviewing the
plans.
In conclusion, the ability of the TomoTherapy to avoid complexities that arise from
matching abutting fields and to spare specified normal tissue (e.g. ipsilateral lung) while
maintaining a uniform dose distribution to the PTV makes it an attractive candidate for
PMRT. However, more studies should be done to address issues such as skin dose and
the effect of breathing motion on the dose distribution before gaining complete
confidence with treating PMRT patients on TomoTherapy.

87
Chapter 6
Future Works
6.1. Additional Treatment Studies
Additional studies should be conducted to better compare conventional and
TomoTherapy PMRT plans. These studies should include junction shift over the course
of treatment should be modeled by the treatment planning system to reduce the hot spot
seen in the dose distributions and DVHs. Also, surgically-removed tumor beds are
typically boosted to 60 Gy in 2Gy/fraction treatments after the CW is treated to 50 Gy.
Whether the boosted portion of the CW can be treated at the same time as the rest of the
CW, or if an additional TomoTherapy plan has to generated, is yet to be studied.
6.2. Accuracy of Dose Calculation on Surface
The accuracy of the TomoTherapy dose calculate on the skin surface is of interest.
The dosimetric uncertainty in the surface and buildup region in IMRT cases has been
documented by Chung et al. (2005) for the Pinnacle treatment planning system and by
Mutic et al. (1999) for the Peacock treatment planning system (NOMOS Corp.,
Sewickley, PA). Hence, a careful experimental measurements and comparison to the
TomoTherapy treatment planning system’s dose calculation in this superficial site are
necessary as most breast cancer recur on the skin surface.
6.3. Impact of Breathing Motion
The effect of motion due to breathing may have significant impact on the study.
Breathing motion is not so much an issue with conventional electron beam PMRT as the
beams are perpendicular to the breathing motion. However, the TomoTherapy plan
required greater weighting to beamlets incident on the CW at highly oblique, grazing
angles to avoid excessive dose to the heart and lungs. Breathing motions would take the

88
CW out of the PTV area for a fraction of the treatment, and therefore a margin would
have to be added to the CW PTV to account for breathing. Unfortunately expanding the
PTV into the air above the CW would have a negative impact on the optimization of
beamlet fluence patterns near the skin unless the patient is scanned with bolus allowing
expansion of the ROI above the skin.
6.4. Utility of Skin Collimation
Typically when the CW is treated with photon beams, bolus is applied to the skin of
the CW to insure adequate skin dose. Such a procedure would be performed for PMRT
on the TomoTherapy. However, this study utilized patient CT scan data absent of bolus
material and TomoTherapy does not provide an option for adding bolus material to the
plan unless the patient is scanned with bolus. Skin dose is of great concern in PMRT as
failure of local control is often seen on the skin.

89
References
1. Arias E, Anderson R, Kung H, Murphy S, Kochanek K 2003 Deaths: final data for
2001 National Vital Statistics Reports retrieved July 19, 2006, from
http://www.cdc.gov/nchs/data/nvsr/nvsr52/nvsr52_03.pdf
2. Bauman G, Yartsev S, Coad T, Fisher B, and Kron T 2005 Helical tomotherapy for
craniospinal radiation The British J. of Raiat. 78 548–552
1. Boice JD, Harvey EB, Blettner M, Stovall M, Flannery JT 1992 Cancer in the
contralateral breast after radiotherapy for breast cancer N. Engl. J. Med. 326 781–
785
2. Brenner DJ 1993 Dose volume and tumor-control predictions in radiotherapy Int. J.
Radiat. Oncol. Biol. Phys. 26 171-179
3. Chung H and Jin H 2005 Evaluation of surface and build-up region dose for intensity-
modulated radiation therapy in head and neck cancer Med. Phys. 32 2682–2689
4. Leeuwen F and Travis L 2005 Second cancer. In: Principles and Practice of
Oncology 7th
ed., edited by De Vita V, Hellman S, and Rosenberg S (Philadelphia,
PA: Lippincott Williams & Wilkins) pp. 2577
5. Eifel P, Axelson JA, Costa J, Crowley J, Curran WJ Jr, Deshler A, Fulton S,
Hendricks CB, Kemeny M, Kornblith AB, Louis TA, Markman M, Mayer R, and
Roter D 2001 National Institute of Health Consensus Development Conference
Statement: Adjuvant therapy for breast caner November 1- 3 2000 J. Natl. Cancer
Inst. 93 979 -989
6. Emami B, Lyman J, Brown A, Coia L, Goitein M, Munzenrider JE, Shank B, Solin
LJ, and Wesson M 1991Tolerance of normal tissue of therapeutic irradiation. Int. J.
Radiat. Oncol Biol. Phys. 21 109-122
7. Gagliardi G, Lax I, Ottolenghi A, and Rutqvist LE 1996 Long-term cardiac mortality
after radiotherapy of breast cancer-application of the relative serilaity model. Br. J.
Radiol. 69 839-846
8. Galvin MJ, Ezzell G, Eisbrauch A, et al. 2001 Intensity-modulated radiotherapy:
current status and issues of interest. Int. J. Radiat. Oncol Biol. Phys. 51 880-914
9. Graham MV, Purdy JA, Emami B, Harms W, Bosch W, Lockett MA, and Perez CA
1999 Clinical dose-volume histogram analysis for pneumonitis after 3D treatment for
non-small cell lung cancer (NSCLC) Int. J. Radiat. Oncol. Biol. Phys. 45 323-329
10. Hancock SL, Tucker MA, Hoppe RT 1993 Breast cancer after treatment of Hodgkin’s
disease J. Clin. Oncol. 85 25-31
11. Hogstrom KR 2003a Electron beam therapy: dosimetry, planning, and techniques. In:

90
Principles and Practice of Radiation Oncology 4th
ed., edited by C. A. Perez, L.
W. Brady, E. C. Halperin, and R. Schmidt-Ullrich (Philadelphia, PA: Lippincott
Williams & Wilkins) pp. 252–282
12. Hogstrom KR, Mills MD, Almond PR 1981b Electron beam dose calculation Phys.
Med. Biol. 26 445
13. Khan FM 2003 The physics of radiation therapy 3rd
ed. (Philadelphia, PA: Lippincott
– Williams & Wilkins) pp. 481-505
14. Källman P, Agren A and Brahame A 1992 Tumor and normal tissue responses to
fractionated non-uniform dose delivery Int. J. Radiat. Oncol. Biol. Phys. 62 249-
262
15. Krueger EA, Fraass BA, McShan DL, Marsh R, and Pierce LJ 2003 Potential Gains
for Irradiation of Chest Wall and Regional Nodes with Intensity Modulated
Radiotherapy Int. J. Radiat. Oncol. Biol. Phys. 56 1023-1037
16. Kutcher GJ and Burman C 1989 Calculation of complication probability factors for
non-uniform normal tissue irradiation: The effective volume method Int. J. Radiat.
Oncol Biol. Phys. 16 1623-1630
17. Lyman JT 1992 Normal Tissue complication probabilities: variable dose per fraction
Int. J. Radiat. Oncol. Biol. Phys. 22 247-250
18. Locke J, Low DA, Grigireit T, and Chao KS 2002 Potential of TomoTherapy for total
scalp treatment Int. J. Radiat. Oncol. Biol. Phys. 52 553-559
19. Mackie TR, Holmes T, Swerdloff S, Reckwerdt P, Deasy JO, Yang J, Paliwal B, and
Kinsella T 1993 TomoTherapy: A new concept for the delivery of dynamic conformal
radiotherapy Med. Phys. 20 1709–1719
20. Mackie TR, Olivera GH, Reckwerdt PJ, and Shepard DM 2000 Convolution
/superposition photon dose calculation. In: Shui AS and Mellenberg De ed General
practice of radiation oncology physics in the 21st century. Published for AAPM by
Medical Physics Publishing, Madison WI, 39-56
21. Mutic S and Low D 1999 Superficial doses from serial tomotherapy delivery Med.
Phys. 27 163–165
22. Orton N, Jaradat H, Welsh J, and Tome W 2005 Total scalp irradiation using helical
tomotherapy Medical Dosimetry 30 162-1688
23. Overgaard M., Hansen PS, Overgaard J, Rose C, Andersson M, Bach F, Kjaer M,
Gadeberg CC, Mouridsen HT, Jensen MB, and Zedeler K 1997 Postoperative
radiotherapy in high-risk pre menopausal women with breast cancer who receive
adjuvant chemotherapy: Danish Breast Cancer Cooperative Group 82b Trial N. Engl.
J. Med. 337 949–995

91
24. Overgaard M., Jensen MB, Overgaard J, Hansen PS, Rose C, Andersson M, Kamby
C, Kjaer M, Gadeberg CC, Rasmussen BB, Blichert-Toft M, and Mouridsen HT 1999
Postoperative radiotherapy in high-risk postmenopausal women given adjuvant
tamoxifen: Danish Breast Cancer Cooperative Group DBCC 82c trial Lancet 353
1641–1648
25. Ogden C, Fryar C, Carroll M, and Flegal K 2004 Mean body weight, height, and body
mass index, United States 1960-2002 Advance Data Center of Disease Control and
Prevention No. 347 retrieved July 25, 2006, from
http://www.cdc.gov/nchs/data/ad/ad347.pdf
26. Perez C and Brady L 1998 Three-dimensional physics and treatment planning In:
Principle and practice of radiation oncology 3rd
ed, edited by Purdy J
(Philadelphia, PA: Lippincott – Raven, Philadelphia) pp. 354
27. Perez W, Flannery B, Teukolsky S, and Vetterling W 1986 Numerical recipes the art
of scientific computing (London, Cambridge University Press) pp. 45
28. Pierce L, Butler JB, Martel MK, Normolle DP, Koelling T, Marsh RB, Lichter AS,
and Fraass BA 2002 Postmastectomy radiotherapy of the chest wall: Dosimetric
comparison of common techniques Int. J. Radiat. Oncol. Biol. Phys. 52 1220-1230
29. Ragaz J., Jackson SM, Le N, Plenderleith IH, Spinelli JJ, Basco VE, Wilson KS,
Knowling MA, Coppin CM, Paradis M, Coldman AJ, and Olivotto IA 1997 Adjuvant
radiotherapy and chemotherapy in node-positive pre menopausal women breast
cancer N. Engl. J. Med. 337 956 – 962
30. Recht A, Hayes DF, Eberlein TJ, et al. 1996 Local-regional recurrence after
mastectomy or breast-conserving therapy In: Diseases of breast edited by Harris JR,
Lippman M, et al. (Philadelphia, PA: Lippincott, Philadelphia) pp. 649 – 667
31. Rutqvist LE, and Johansson H 1990 Mortality by laterality of the primary tumor
among 55,000 breast cancer patients from the Swedish Cancer Registry Br. J.
Cancer 61 866-868
32. SEER stat fact sheets – cancer of the breast seer.cancer.gov retrieved July 18, 2006,
from http://seer.cancer.gov/statfacts/html/breast_print.html
33. Schneider U, Zwahlen D, Ross D, Kaser-Hotz B 2005a Estimation of radiation-
induces cancer from three-dimensional dose distributions: concept of organ
equivalent dose Int. J. Radiat. Oncol. Biol. Phys. 611510-1515
34. Schneider U, Kaser-Hotz B 2005b A simple dose-response relationship for modeling
secondary cancer incidence after radiotherapy Z Med Phys. 15 31-37
35. Shepard DM, Olivera GH, Reckwerdt PJ, and Mackie TR 2000 Iterative approaches
to dose optimization in tomotherapy Phys. Med. Biol. 45 69-90
36. Storm HH, Anderson M, Boice JD Jr, Blettner M, Stovall M, Mouridsen HT,
92
Dombernowsky P, Rose C, Jacobsen A, and Pedersen M 1992 Adjuvant radiotherapy
and risk of contralateral breast cancer J. Natl. Cancer Inst. 84 1245-1250
37. Tapley DN 1976 Clinical applications of the electron beam (Wiley, New York).
38. Thomas WW, McNeese MD, Fletcher GH, et al. 1989 Multimodal treatment for
inflammatory breast cancer 17 Int. J. Radiat. Oncol. Biol. Phys. 739-745
39. Tung SS, Shiu AS, Starkschall G, Morrison WH, Hogstrom KR 1993 Dosimetric
evaluation of total scalp irradiation using a lateral electron-photon technique 27 Int.
J. Radiat. Oncol. Biol. Phys. 153-160
40. Wang JZ, Li XA, D’ Souza WD, and Stewart RD 2003 Impact of prolonged fraction
delivery times on tumor control: a note of caution for intensity-modulated radiation
therapy (IMRT) Int. J. Radiat. Oncol. Biol. Phys. 57 543-552
41. Warkentin B, Stavrev P, Stavreva N, Field C, and Fallone BG 2004 A TCP-NTCP
estimates module using DVH and known radiobiological models and parameter sets
J. Appl. Clin. Med. Phys. 5 50-63
42. Webb S and Nahum AE 1993 A model for calculating TCP in radiotherapy including
the effects of inhomogeneous distributions of dose and clonogenic cell density Phys.
Med. Biol. 38 653 – 666
43. Wigg D 2001 Applied radiobiology and bioeffect planning. (Madison WI: Medical
Physics Publishing) pp 75 - 269

93
Appendix A
Radiation Oncologist Evaluation of Treatment Plans
Date :
Patient:
a. Evaluate the clinical acceptability of plans (scale 1-5)
• How do you evaluate the TomoTherapy plan? Please circle
one value that closely describes your observation.
1 2 3 4 5
Acceptable 1
Marginally acceptable 2
Indifferent 3
Marginally unacceptable 4
Unacceptable 5
• How do you evaluate the Conventional plan? Please circle
one value that closely describes your observation.
1 2 3 4 5
Acceptable 1
Marginally acceptable 2
Indifferent 3
Marginally unacceptable 4
Unacceptable 5
b. Compare the TomoTherapy plan with the conventional plan (either
electron beam alone treatment or mixed beam treatment).
i. Please circle one value that closely describes your observation,
after comparing the TomoTherapy plan with the conventional pan.
1 2 3 4 5
Superior 1
Marginally superior 2
Indifferent 3
Marginally inferior 4
Inferior 5

94
ii. Why do you prefer it? Is it,
a. Better PTV coverage
b. Less dose to the critical structure
c. Less whole body dose
d. other
c. Comment

95
Appendix B
Acronyms
ABR American Board of Radiology
AX axillary
CW chest wall
CT computed tomography
DVH dose volume histogram
dDVHs differential dose-volume histograms
FOV field of view
IHD ischaemic heart disease
ICRP International Commission on Radiological Protection
IGRT image-guided radiotherapy
IMRT intensity-modulated radiotherapy
IMN internal mammary chain
MVCT mega-voltage computerized tomography system
MBPCC Mary Bird Perkins Cancer Center
NTCP normal tissue complication probability
OAR organ at risk
PMRT post-mastectomy radiation therapy
PTV planning PTV volume
PWTF partially wide tangent fields
RAR region at risk
RHS reverse hockey stick
ROI region of interest
SCCP secondary cancer complication probability
SCl supraclavicular
SEER Surveillance Epidemiology and End Results
SCl/AX supraclavicular/axillary nodes
TCP tumor control probability
TERMA total Energy Released per unit Mass
UNSCEAR United Nation Scientific Committee on the Effects of Atomic
Radiation

96
Vita
Michael Ashenafi was born in Addis Ababa, Ethiopia, in 1979. He is the oldest son of
Sissay Ashenafi and Birhan Abraham and has two brothers and one sister. He began his
education at Saint Joseph school in Ethiopia. After graduation from high school, he was
employed by the Crown International Consultants Company. After spending more than a
year with this company, he came to the United States of America to further his education
and to pursue a degree in physics. First, he joined Southern University at New Orleans
(SUNO) and then he transferred to Southern University and A & M College in Baton
Rouge (SUBR) to pursue physics.
His research experience has been rich and varied. In the summer of 1999, he worked
at the Louisiana Universities Marine Consortium (LUMCON) in Houma, Louisiana.
During this same summer, he worked at the Thomas Jefferson Laboratory, a research
center managed and operated by the Southern Universities Research Association
(SURA). During the summer of 2000, he had the opportunity to work with Dr. Sergey
Mirov (patent holder) at the Laser Photonic Research Laboratory in Birmingham,
Alabama. He studied the spectroscopic analysis of color center crystal and ultimately
succeeded in conducting a spectral hole burning experiment. During the summer of 2001,
he had the privilege again to work with Dr. Sergey Mirov and Dr. Marry Zvanut. During
the summer of 2002, he had the great privilege to work at the famous CERN Laboratory,
a world-renowned facility for Nuclear Physics Research in Geneva, Switzerland.
He began his master’s work at the Louisiana State University in 2003. He is now a
candidate for the degree of Master of Science in the Department of Medical Physics.