toolkit for promoting sustainable development city of oakland california integrated waste management...
TRANSCRIPT

Toolkit for Promoting Sustainable Development
CITY OF OAKLAND
California Integrated Waste Management Board
August 29, 2001
29 August 2001 © WorldBuild Technologies Inc.
2
Toolkit Contents:
1. What is Green Building?2. Benefits of Green Development3. Countering Myths of Green
Development4. The Green Development Process5. Green Contracts6. Resources

1. What is Green Building?

29 August 2001 © WorldBuild Technologies Inc.
4
What is Green Building?
Resource EfficientHealthy & ProductiveMaximizes return on investment & lifecycle valueTreads lightly on the Planet
So. Cal. Gas Energy Resource Center
29 August 2001 © WorldBuild Technologies Inc.
5
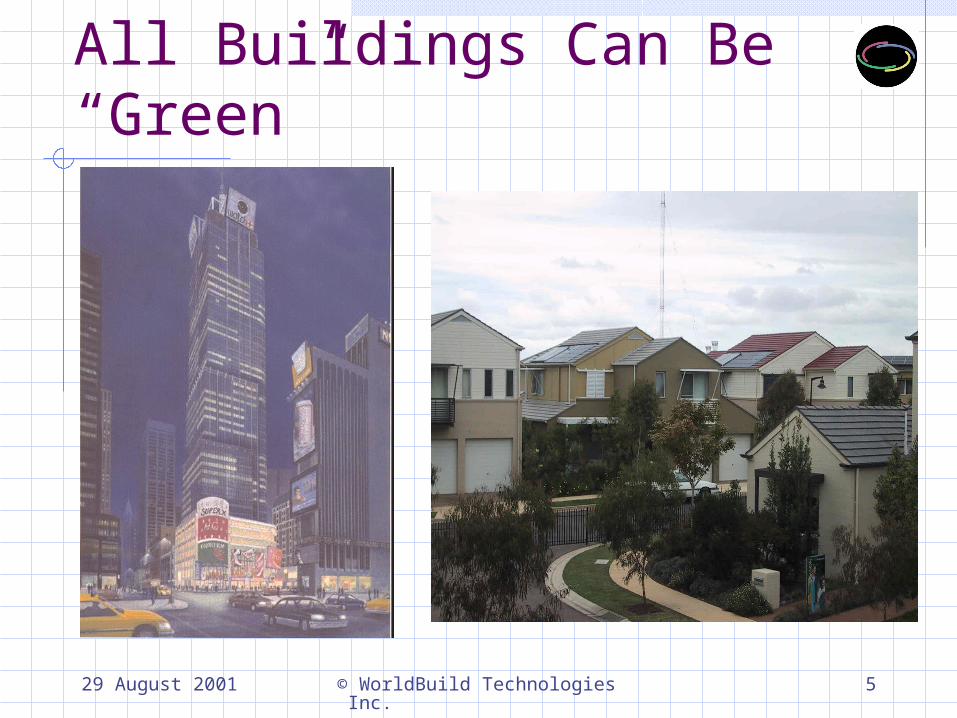
All Buildings Can Be “Green”

29 August 2001 © WorldBuild Technologies Inc.
6
Green Building Benchmarks
LEED certified building>30% below California’s Title 24 energy codeIndoor air quality thresholds – (ppb TVOC)75% - 90% waste diversion from landfill20% - 30% recycled content productsWater efficient and uses recycled waterDaylight penetration into core of building, e.g. 1.5-5% daylight factor depending on use5% - 10% Renewable energy productionIndividual thermal comfort & controlPedestrian and transit access
29 August 2001 © WorldBuild Technologies Inc.
7
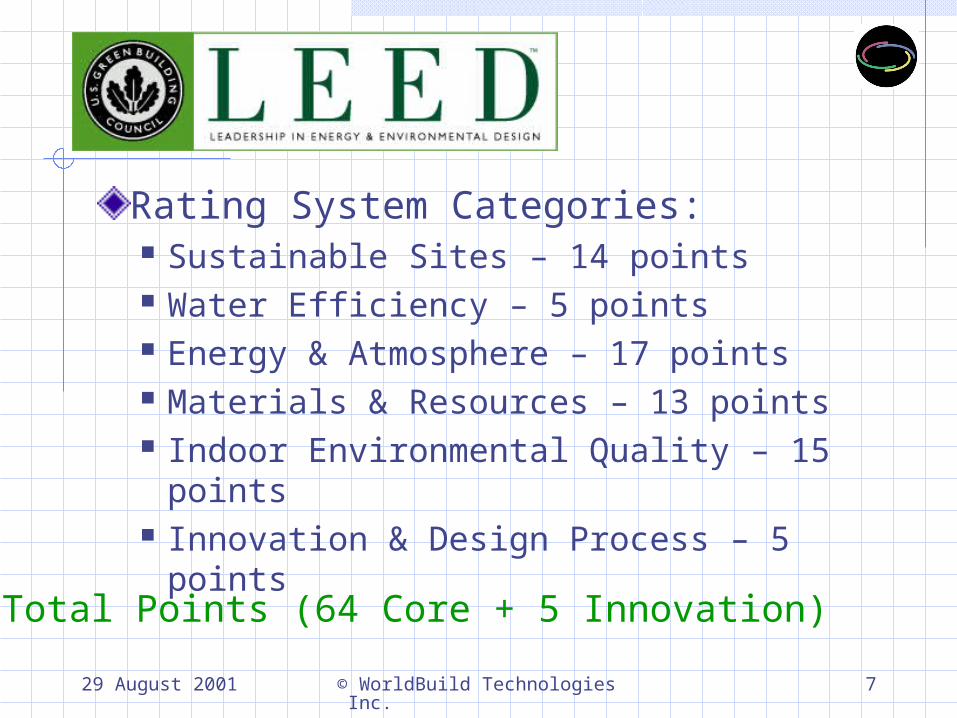
Rating System Categories: Sustainable Sites – 14 points Water Efficiency – 5 points Energy & Atmosphere – 17 points Materials & Resources – 13 points Indoor Environmental Quality – 15
points Innovation & Design Process – 5 points
Total Points (64 Core + 5 Innovation)

29 August 2001 © WorldBuild Technologies Inc.
8
LEED Award Levels
Certified: 26 – 32 PointsSilver: 33 – 38 PointsGold: 39 – 51 PointsPlatinum: 52+ Points
Let the Competition Begin!

29 August 2001 © WorldBuild Technologies Inc.
9
Oakland Sustainable Design Guide
http://www.oaklandpw.com/OSDG/index.html

29 August 2001 © WorldBuild Technologies Inc.
10

29 August 2001 © WorldBuild Technologies Inc.
11
Oakland Sustainable Design Guide
Site: 13 pointsWater: 8 pointsEnergy: 23 pointsIndoor Environmental Quality: 20 pointsMaterials: 15 pointsWaste: 13 pointsTransportation: 8 pointsTotal 100 points possible

29 August 2001 © WorldBuild Technologies Inc.
12
Sample Strategy: Indoor Environmental Quality Strategy 4.1
Control and Isolate Source of Pollutants: Performance Indicator1. Site is analyzed to identify potential sources of indoor air pollution.
Remedial action is taken if the site contaminants will result in unacceptable indoor air emissions according to the Oakland Urban land Redevelopment Program Guidance Document. 1 point
AND2. Pollution generating activities are eliminated where feasible or zoned
to an isolated area of the building and have a separate ventilation system. Air intakes are separated from pollution sources with a minimum separation distance to minimize risk of capture of contaminated air. 1 point.
AND3. Ducted returns are used within the building. Internal duct insulation is
eliminated. If that is impossible the duct lining should be chosen to minimize the risk to occupants. 1 point.

2. Benefits of Green Development
29 August 2001 © WorldBuild Technologies Inc.
14
•Lifecycle Value = value over time
-lifecycle budgeting
-reduced annual operating costs
-higher building value
•Increased productivity
“Green” is about Value

29 August 2001 © WorldBuild Technologies Inc.
15
Increased Building Value Example
Energy Retrofit Savings $100,000Water Savings $5,000Waste Savings $5,000Total Annual Savings$110,000Normal Capitalization Rate 8%LEED Capitalization Rate 7%Increased Building Value $1,375,000LEED Value $1,571,000Increase related to LEED $196,000

29 August 2001 © WorldBuild Technologies Inc.
16
Increased ROI
Lower operating costs due to higher efficienciesFirst cost increases, if any, offset by higher building valueHigher net operating incomeLower cap rate --->higher building valueBetter financing opportunities

29 August 2001 © WorldBuild Technologies Inc.
17
Other Benefits of Green Building
Quicker fill rateMarketing advantagesIncreased salesCompetitive quality work spaceHigher rents and sales price Faster permit approvals in some citiesAccess to outside funds and grants

29 August 2001 © WorldBuild Technologies Inc.
18
The Flow of Money in Buildings
30 Year Building Costs Initial Cost: 2% Operation & Maintenance:
6% Personnel Costs: 92%
Maximize life-cycle return on investment

29 August 2001 © WorldBuild Technologies Inc.
19
Economic Opportunity Areas
Energy EfficiencyWater EfficiencyWaste EfficiencyLitigation & InsuranceO & M SavingsProductivity
Energy SupplyGreen FinanceGreen ProcurementBuilding ValueReturn on InvestmentOther Benefits

29 August 2001 © WorldBuild Technologies Inc.
20
City of San DiegoRidgehaven Green Building

29 August 2001 © WorldBuild Technologies Inc.
21
Ridgehaven Energy Figures
Base Case: 21 Kwh/sfTitle 24 Code: 17 Kwh/sfGoal: 9 Kwh/sfActual: 6.5 Kwh/sfSister building: 22 Kwh/sf

29 August 2001 © WorldBuild Technologies Inc.
22
Ridgehaven Financial PerformanceScenario 1, with financing
Building Square Footage 73,020Title 24 Compliant Building Level 17.67Actual Average Consumption Level 6.51% Reduction from Code Level 63%Annual Savings from Code Level $114,086Extra 1st Cost of Energy Measures $269,000SDG&E Financing $230,000Net Owner Investment $39,000Internal Rate of Return to City 150%Payback period to City (years) 0.6810 Year Total Estimated Savings $910,86410 Year % Return on Initial Investment 2351%
Note: numbers are based on estimates provided by building owner
29 August 2001 © WorldBuild Technologies Inc.
23
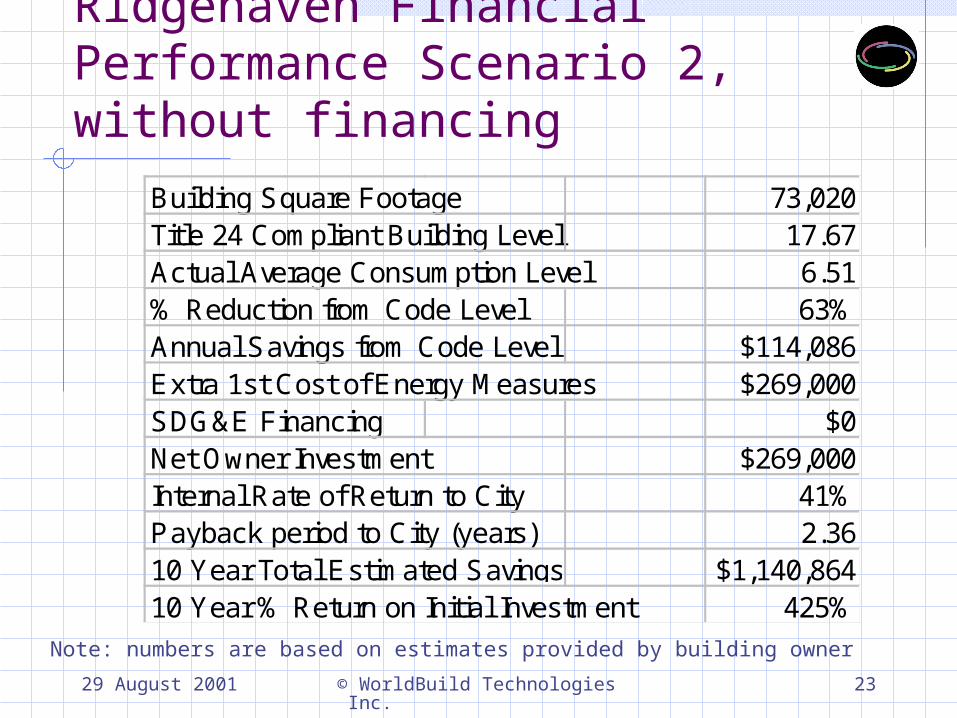
Ridgehaven Financial Performance Scenario 2, without financing
Building Square Footage 73,020Title 24 Compliant Building Level 17.67Actual Average Consumption Level 6.51% Reduction from Code Level 63%Annual Savings from Code Level $114,086Extra 1st Cost of Energy Measures $269,000SDG&E Financing $0Net Owner Investment $269,000Internal Rate of Return to City 41%Payback period to City (years) 2.3610 Year Total Estimated Savings $1,140,86410 Year % Return on Initial Investment 425%
Note: numbers are based on estimates provided by building owner

29 August 2001 © WorldBuild Technologies Inc.
24
Water Efficiency
Savings up to 30%1 - 3 yr. paybackWater + SewerNon residential use = 35% of totalProgram creation
Site landscaping Building interior On-site treatment Capture

29 August 2001 © WorldBuild Technologies Inc.
25
Waste Reduction
Limited Landfill CapacityC & D occupies 25%Waste separation and
hauling practicesIntegrate through building processPortland Arena:
$186,000 Savings Tipping fees/scrap

29 August 2001 © WorldBuild Technologies Inc.
26
Litigation & Insurance
We spend approximately 80-90% of our time insideEPA ranks indoor air pollution among top 5 environmental risks to healthPoor IAQ found in up to 30% of buildingsSick building syndrome & building related illness costs $60 billion/yr. (US EPA)Successful litigation lawsuitsLower insurance for good IAQMore insurance companies moving into field

29 August 2001 © WorldBuild Technologies Inc.
27
Operations & Maintenance
Building Performance Assurance Program Development & ImplementationLife-cycle CommissioningOperational Efficiency Savings:
Energy Water Waste Staff salaries Supplies
Emphasize Education, Training and performance based incentives & empowerment
29 August 2001 © WorldBuild Technologies Inc.
28
Occupant Productivity
92% of building-related expense over a 30 year period6 - 16% gains documented by case studySalaries = largest financial commitment$650 p.s.f. paid annually for salaries>300 times greater than energy bill1% increase = $6.5 p.s.f.6% increase = $39 p.s.f.

29 August 2001 © WorldBuild Technologies Inc.
29
Owner Occupant Benefits
Improved indoor environmental qualityLower worker absenteeismImproved worker productivityImproved worker satisfactionHigher employee retentionLower churn costs and downtimeHigher employee tenure periodsLower training costs for new hires
29 August 2001 © WorldBuild Technologies Inc.
30
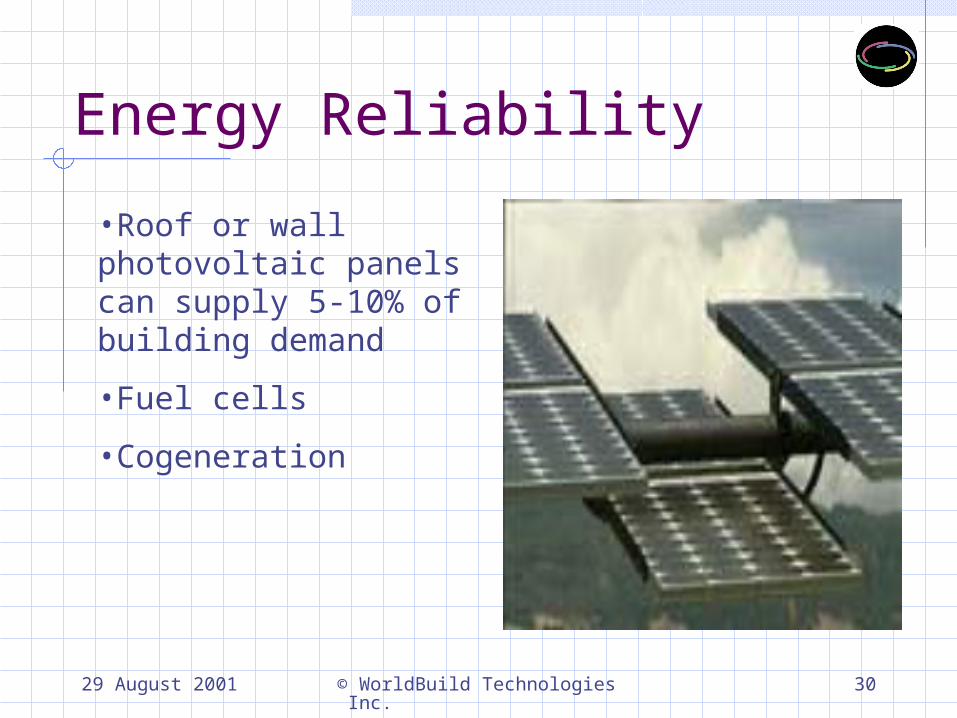
Energy Reliability
•Roof or wall photovoltaic panels can supply 5-10% of building demand
•Fuel cells
•Cogeneration

3. Countering Myths of Green Development

29 August 2001 © WorldBuild Technologies Inc.
32
Green costs moreIt depends, sometimes yes, sometimes no
SF Main Library: + 1.4% Santa Monica Public Safety Facility: minimal increase Cal/EPA Headquarters Building: +1.6% Laguna Honda Hospital: +1.25% Pier 1 Building, SF: +0.7% Capitol East End Complex, Block 225: +2.4%
First cost increases are lower with an experienced team and the program establishes green goals from the beginningHarnessing systems efficiencies greatly reduces first costsEnergy efficiency and IEQ measures can cost more in first costs, though not always, but yield high returns on a lifecycle basisGreen features can increase annual income and the building future value upon saleSoft costs do increase in green design, but should provide a high return on investment

29 August 2001 © WorldBuild Technologies Inc.
33
Green takes longer
There may be more time spent in planning and design due to integrated team approach, though experienced teams take no longerConstruction progresses more quickly because more decisions are made, there are fewer RFI’s and change orders in the fieldResult is that greening a project, if started early, does not add time, and can even accelerate the schedule

29 August 2001 © WorldBuild Technologies Inc.
34
Green Increases Risk
Energy efficient design and technologies used today are not experimental; many are off the shelfGreen materials are readily available and offered by major manufacturers. This trend is rapidly increasing.Green can reduce risk of sick building syndrome, IEQ issuesIn the future, by not going green, the risk will be increased – negligence clauses

29 August 2001 © WorldBuild Technologies Inc.
35
Green is hard to do
Design technology of green is not difficult, but it is different than conventional processGoal setting,benchmarking and commissioning for optimal performance are new emphasis areasGreen requires a dedicated team and buy-in from the ownership and management entitiesRefer to City of Oakland guidelines for “no-brainer” features of green buildingsThe hardest part of “green” is to open ourselves up to change and new ideas and processes for success

29 August 2001 © WorldBuild Technologies Inc.
36
I am Already “Green”
In California, Title 24 requires energy efficiency, but all projects can do better Even beyond Title 24 2001 <20 – 30%
There are many other areas besides energy efficiency, such as site, IEQ, water, materials, transportation, which need to be addressed to be greenGreen is performance basedNo matter how good we are doing, we can always improve and continually advance

29 August 2001 © WorldBuild Technologies Inc.
37
Our project is too far along to change anything in its design
It is always better to start early in the design process to introduce “green”Many projects can be “greened” at the back-end, especially for the tenant interiorsBren School at UCSB greened at 90% construction documents will attain a LEED gold rating, at some additional first cost but much higher lifecycle valueRidgehaven was also greened at a late date, resulting in a few months of delay, but 63% energy savings that made up for the delay in the first year of operations

29 August 2001 © WorldBuild Technologies Inc.
38
Green only works for the public sector, not private
Green is an emerging field and has been supported by public sector projects on a greater initial basisGreen is now catching on in the private sectorExamples include: 555 12th Street, GAP Offices, Green City Lofts at 1007 41st Street, Battery Park City high rise residential, 4 Times Square, Walmart, Shorenstein, HinesMainstream firms are now embracing green Disney, Time Warner, Starbucks, Patagonia
29 August 2001 © WorldBuild Technologies Inc.
39
My Bank won’t finance Green
B of A is a member of USGBC and interested in “green” loansBanks are concerned about the value of the assets they’re financing; green buildings have more value and they also have less liability.LEED may become part of a Phase 1 environmental assessment by BanksBanks may soon offer lower interest rates for green; also insurance firm rates

29 August 2001 © WorldBuild Technologies Inc.
40
Doesn’t “green” mean funky, experimental technologies?
Many green projects in all sectors of the economy are using established, off the shelf technologiesWhat constitutes “green” more than anything is a holistic approach and integrated thinking – to harness performance efficiencies and create healthy & productive buildingsMany green products are on the market, more everyday, from mainstream product manufacturersGreen design has no particular esthetic--all buildings can be green, from small projects to large corporate facilitiesGreen buildings don’t have to look any different than non-green; they just perform better

4. Greening the Project Lifecycle

29 August 2001 © WorldBuild Technologies Inc.
42
“Green” Development Process
I. Lifecycle Based Development Process Plan for Success
II. Best Practice Design Areas Design for Success
III. Lifecycle Investment Fund for Success
IV. Building Performance Assurance Operate for Success
V. Communicate the Performance Results Communicate the Results

29 August 2001 © WorldBuild Technologies Inc.
43
“Green” Development Process
I. LifecycleDevelopment
Process
II. Best Practice Design Areas
III. LifecycleInvestment
IV. BuildingPerformanceAssurance
V. Communicationof Results
DefineSuccess
EnergyIndependence
IntelligentProcurement
Managefor
Success
Hire forSuccess
Sustainability
Flexibility&
Resilicency
"Smart"
LifecycleCosting
LIfecycleBudgeting
GreenFinance
PerformanceEfficiencies
PublicOutreach
BenchmarkResults
CommunicationProgram
ShowcaseFeatures
Adjustment &Upgrade
Benchmarking
Monitoring &Verification
Commissioning
AdaptiveReuse
Education &Training
29 August 2001 © WorldBuild Technologies Inc.
44
I. Lifecycle-based Development
1. Define SuccessPerformance-based goals, project benchmarking,budget & schedule, future adaptability, rate of return
on investment2. Hire for SuccessCreate an integrated team with credentials in best
practices, modeling and analytical tools capability, and green
3. Manage for SuccessIntegrated/Collaborative Process, full scope of work,
“Green” scheduling, inclusion of outside “Partners” (industry, government, NGO’s)

29 August 2001 © WorldBuild Technologies Inc.
45
Hiring a Green Project Team
Experience in green work scope areas, in addition to typical work scopeAbility to work as an integrated team, experience working together Specialties: IAQ, green materials, renewable energy, environmental value engineering, LEED certification

29 August 2001 © WorldBuild Technologies Inc.
46
Sustainability Work Scope Areas
Program DefinitionProject Management and Master PlanningIndoor Environmental Quality and ComfortEnergy and AtmosphereMaterials and ResourcesCost estimating/environmental value engineeringLEED Certification

29 August 2001 © WorldBuild Technologies Inc.
47
Ridgehaven Green Goals
Create a green showcase projectMeet budget & scheduleBeat energy codeGood IAQ designMinimize waste
Green materials: Recycled content Recyclable Renewable sources
Green constructionGreen operations Monitor resultsDemonstration

29 August 2001 © WorldBuild Technologies Inc.
48
II. Best Practice Design Areas
Sustainable Building“Smart” ControlFlexibility and Disaster Resiliency Energy Security & ControlOthers: Current & Future

29 August 2001 © WorldBuild Technologies Inc.
49
Integrated Energy DesignIntegrated Team:
Team approach/integration & collaborationBenchmarking to Code and individual targetsUse of energy modeling & analytical tools
Integrated Design:Optimal Building sitingBuilding envelope = passive solar approachDaylighting capture and penetrationLighting optimization & efficiencyPlug load reduction & efficiencyHVAC & Plumbing sizing
Integrated Operations:Building controls, commissioning & optimization

29 August 2001 © WorldBuild Technologies Inc.
50
City of Santa Monica Public Safety Facility
29 August 2001 © WorldBuild Technologies Inc.
51
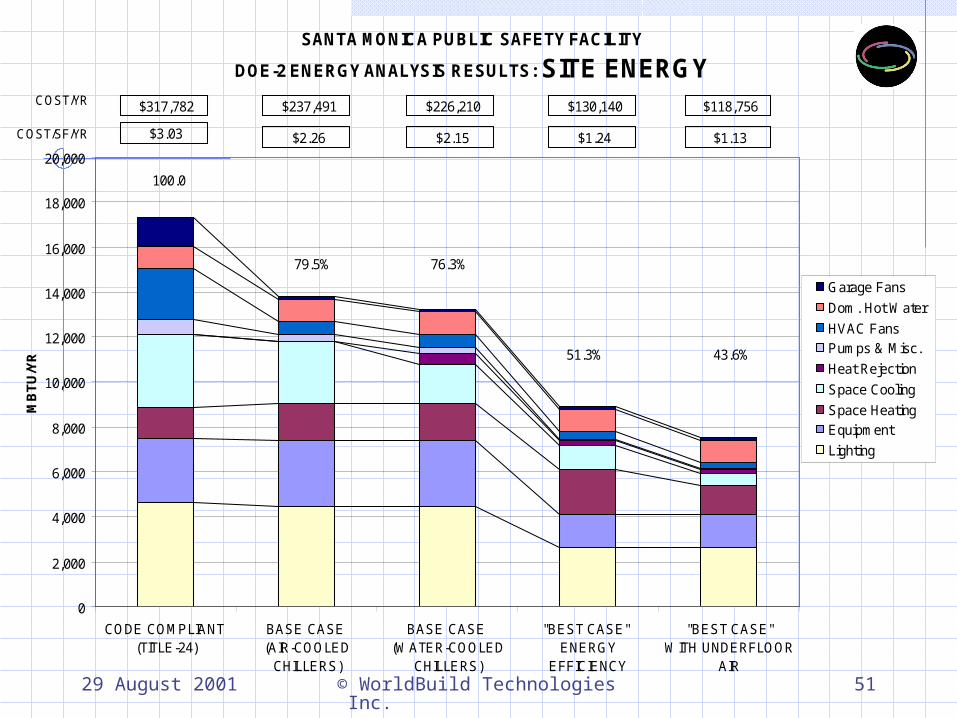
SANTA MONICA PUBLIC SAFETY FACILITY
DOE-2 ENERGY ANALYSIS RESULTS: SITE ENERGY
0
2,000
4,000
6,000
8,000
10,000
12,000
14,000
16,000
18,000
20,000
CODE COMPLIANT (TITLE-24)
BASE CASE (AIR-COOLED
CHILLERS)
BASE CASE (WATER-COOLED
CHILLERS)
"BEST CASE" ENERGY
EFFICIENCY
"BEST CASE"WITH UNDERFLOOR
AIR
MB
TU
/YR
Garage Fans
Dom. Hot Water
HVAC FansPumps & Misc.
Heat Rejection
Space Cooling
Space HeatingEquipment
Lighting
$317,782 $226,210 $130,140 $237,491 COST/YR:
$3.03 $2.26 $2.15 $1.24 COST/SF/YR:
100.0%
79.5% 76.3%
51.3% 43.6%
$1.13
$118,756

29 August 2001 © WorldBuild Technologies Inc.
52
III. Lifecycle Investment
Lifecycle BudgetingAdditional “Green” Sources of Capital and FinancingLife-cycle costing and ROI“Green” Procurement

29 August 2001 © WorldBuild Technologies Inc.
53
Lifecycle Budgeting
Budgets typically set too early and not always set to fit the projectDoesn’t usually include “green”Prioritizes green components and systems incorporated into initial budgetMay need incremental green fundingLifecycle costing & prioritization

29 August 2001 © WorldBuild Technologies Inc.
54
Green Finance
Lifecycle budgeting firstSystems Leasing “chafage” Off Balance Sheet financing 1st Cost Capital Reduction Interface Evergreen carpet lease Central plant/mechanical systems
Industry PartneringGreen BondsGreen Banks, Appraisers & Insurance

29 August 2001 © WorldBuild Technologies Inc.
55
Green Procurement
Supply chain “disintermediation”Utilize the Internet to harness efficienciesPower to the buyerAccess to vital information & “knowledge”Aggregation potentialAuction options & toolsReal time pricing = dynamicGlobal marketplace

29 August 2001 © WorldBuild Technologies Inc.
56
Santa Monica Public Safety FacilityWorldBuild Procurement (Aug-99)
TradeMarket
EstimateWorldBuild
PriceHard Cost Savings Discount
Raised Floor $633,244 $451,694 $181,550 29%Carpet Tile $176,314 $145,510 $30,804 17%Broadloom Carpet $61,282 $54,188 $7,094 12%Ceiling Tile $166,174 $111,085 $55,089 41%Resilient Flooring $45,031 $39,243 $5,788 24%Ceramic Tile $224,980 $189,067 $35,913 23%Lighting Fixtures $450,754 $372,625 $78,129 22%Subtotal $1,757,779 $1,363,412 $394,367 26%

29 August 2001 © WorldBuild Technologies Inc.
57
IV. Performance Assurance
Full BenchmarkingLife-cycle CommissioningMonitoring, VerificationAdjustment & UpgradeStaff Education & Training
29 August 2001 © WorldBuild Technologies Inc.
58
V. Communication of Results
1. Benchmark Results2. Showcase sustainable design
features3. Develop Communication Program4. Public Outreach & Education5. Update over-time

5. Green Contracts
29 August 2001 © WorldBuild Technologies Inc.
60
“Green Contracts”RFP’s, RFQ’s, Design, Construction, Design-Build, Operations, Development, Loans, Insurance, CleaningSets intent from the beginningAllocate % of Points for GreenIntegrate into Scope of WorkPart of Performance RequirementRelated to Liability, Damages

29 August 2001 © WorldBuild Technologies Inc.
61
Green Contract Provisions
Description of Work AnnouncementInvitation to BidBid ConferenceWeighting System for SelectionDesign CriteriaContract DocumentsQualifications
Team CompositionGreen Plan SubmittalWork ScheduleQuality AssuranceBid PriceSubstitutionsWarranty & GuaranteeFinal CompletionLiquidated DamagesSafety & Health

29 August 2001 © WorldBuild Technologies Inc.
62
RFQ/P and Bid Invitation
Define sustainable building requirementsState team qualificationsDefine selection criteriaPre-bid conference/meeting
29 August 2001 © WorldBuild Technologies Inc.
63
Statement of Qualifications
Team composition and experienceSustainability Scope of WorkSub-Contractors and ConsultantsOperations and commissioningWork schedule

29 August 2001 © WorldBuild Technologies Inc.
64
Team Selection
Establish Technical Evaluation Committee (TEC) or Project Manager to review qualifications/proposalsReview scope of workReview design feesAnalyze team member qualificationsAnalyze commissioning and building management plan
29 August 2001 © WorldBuild Technologies Inc.
65
Bidder Requirements
Team committed to sustainable building program, goals, performance benchmarksBidder investigation and evaluationDesign-Build, Design-Build-Operate, Energy Performance Contracts

29 August 2001 © WorldBuild Technologies Inc.
66
State of California East End Complex
2 Projects – 5 buildings, 1.3 million s.f.RFP – Design/Build Teams Short listed in RFQ process Contract Documents previously prepared by
Master Architecture Team
2 projects: Block 225 & Blocks 171-174Selection committee Technical Evaluation Committee Other parties

29 August 2001 © WorldBuild Technologies Inc.
67
Evaluation Criteria
Certification of Stipulated SumDesignated Subcontractors (17%)Design & CM Plan (31%)Small Business/DVBE Plan (4%)Building Systems Description (24%) Energy Efficiency/Sustainable Design
Measures - (45/216 points = 21%) = 5% of Total
Quality Enhancements (24%)

29 August 2001 © WorldBuild Technologies Inc.
68
Personnel Experience
Design-Build Projects – 30%Similar projects – 25%Relevant training – 15%Public entities – 5%Sustainable Building – 20%Other Factors – 5%

29 August 2001 © WorldBuild Technologies Inc.
69
Sustainable Design Measures
Energy Efficiency – (12 points)Sustainable Measures – (12 points)Indoor Air Quality – (9 points) Alternative Energy – (6 points)Other Relevant Factors – (6 points)Total: 45 points

29 August 2001 © WorldBuild Technologies Inc.
70
Proposed Quality Enhancements
Further Energy Efficiency – 12 pts.Additional Recycling – 9 pts.Additional Resource conservation – 6 pts.Improvement to IAQ – 9 pts.Additional alternative technology – 6 pts.Other Relevant Factors – 3 pts.Added durability/quality materials – 15 pts.

29 August 2001 © WorldBuild Technologies Inc.
71
TEC Composition
Representatives from the State: Group I – General Design Elements
Master Architect Project Consultant RESD/PMB and OEA State Architect’s Structure Safety Office
Group II – Sustainable Building Elements California Energy Commission CA. Integrated Waste Management Bd. Department of Health Services California Air Resources Board
TEC: Technical Evaluation Committee

6. Resources
29 August 2001 © WorldBuild Technologies Inc.
73
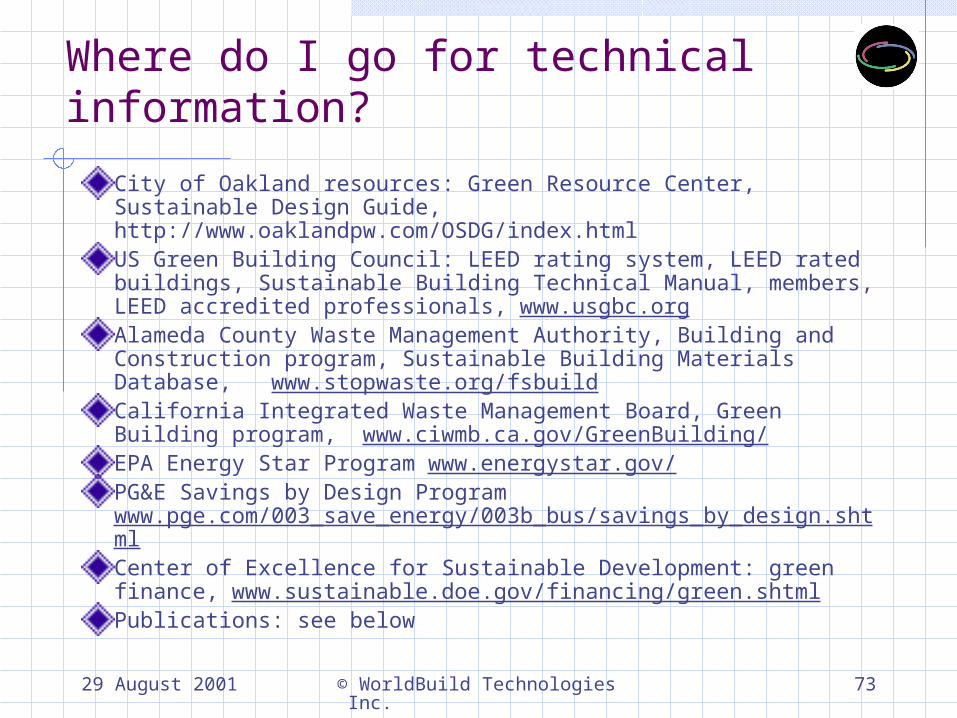
Where do I go for technical information?
City of Oakland resources: Green Resource Center, Sustainable Design Guide, http://www.oaklandpw.com/OSDG/index.htmlUS Green Building Council: LEED rating system, LEED rated buildings, Sustainable Building Technical Manual, members, LEED accredited professionals, www.usgbc.orgAlameda County Waste Management Authority, Building and Construction program, Sustainable Building Materials Database, www.stopwaste.org/fsbuildCalifornia Integrated Waste Management Board, Green Building program, www.ciwmb.ca.gov/GreenBuilding/EPA Energy Star Program www.energystar.gov/PG&E Savings by Design Program www.pge.com/003_save_energy/003b_bus/savings_by_design.shtmlCenter of Excellence for Sustainable Development: green finance, www.sustainable.doe.gov/financing/green.shtmlPublications: see below

29 August 2001 © WorldBuild Technologies Inc.
74
Other green projects:555 12th Street, Oakland, CA1007 41st Street, Oakland, CAThoreau Center for Sustainability, SF525 Golden Gate, City Office Building, SFLaguna Honda Hospital renovation, SFGAP Offices, San Bruno, CASanta Monica Public Safety Facility, Santa Monica, CABren School of Environmental Science & Management, UC Santa Barbara, CAKirsch Center for Environmental Studies, De Anza CC, Cupertino, CAPittsburgh Convention Center, Pittsburgh, PA4 Times Square, NYC20 River Terrace, Battery Park City, NYCGreenpeace Headquarters, NYCPhillip Merrill Environmental Center, Annapolis, MD