tools for performance management in education · level efforts to develop tools for performance...
TRANSCRIPT

SDP FELLOWSHIP CAPSTONE REPORT
Tools for Performance Management in Education
Alexandre Peres, National Institute for Educational Studies and Research (Inep) Fábio Bravin, National Institute for Educational Studies and Research (Inep) Jessica Mellen Enos, Office of the State Superintendent of Education (OSSE) Colleen Flory, Oklahoma State Department of Education (OSDE)/Office of
Management and Enterprise Services (OMES) Brandon McKelvey, Orange County Public Schools
Sabrina Yusuf, School District of Philadelphia
SDP Cohort 5 Fellows

TOOLS FOR PERFORMANCE MANAGEMENT IN EDUCATION
1
Strategic Data Project (SDP) Fellowship Capstone Reports SDP Fellows compose capstone reports to reflect the work that they led in their education agencies during the two-year program. The reports demonstrate both the impact fellows make and the role of SDP in supporting their growth as data strategists. Additionally, they provide recommendations to their host agency and will serve as guides to other agencies, future fellows, and researchers seeking to do similar work. The views or opinions expressed in this report are those of the authors and do not necessarily reflect the views or position of the Center for Education Policy Research at Harvard University.

TOOLS FOR PERFORMANCE MANAGEMENT IN EDUCATION
2
Framing the Problem
Our capstone project—involving SDP Fellows at the National Institute for Educational
Studies and Research (Inep), Brazil; Office of the State Superintendent of Education (OSSE),
Washington, DC; Oklahoma State Department of Education (OSDE) and Office of Management
and Enterprise Services (OMES), Oklahoma City, OK; Orange County Public Schools, Orlando, FL;
and School District of Philadelphia, Philadelphia, PA—represents district-, state-, and nation-
level efforts to develop tools for performance management in education.
The purpose of this report is to provide practitioners with guidance on how to develop
and implement performance management tools for K–12 education. Representing the diverse
work of SDP Fellows at these organizations, the report will cover various phases of the
development and implementation processes, drawing on relevant research, best practices, and
case studies at the local, state, and national levels. Our hope is that this report will facilitate
work being done by others in this area.
The development and implementation phases covered in this report include defining
goals, engaging stakeholders, defining content, developing metrics, presenting data, providing
communication and training, and application and use. Each identified step of the performance
management tool construction process is critical in assisting organizations with building the
support to create and sustain performance management projects. When an organization does
not develop each step of the process or ignores pieces of its development, there can be
weaknesses in the performance management tool or the use of these tools to improve
operational efficiency and effectiveness.
Literature Review
The development of performance metrics and goals is a powerful tool for creating
organizational improvement. Whether part of a structured strategic planning process or
focused on a smaller set of operational indicators, the process of developing metrics and goals
and using these regularly for improvement can be powerful in aligning and improving work.

TOOLS FOR PERFORMANCE MANAGEMENT IN EDUCATION
3
When developing performance metrics and goals and determining progress towards and
achievement of goals, one clear theme in the literature is the importance of including
stakeholders at all points in these processes. Hoerr (2014) states that “a goal is a statement
about values and priorities; our goals reflect our beliefs” (p. 83). It is especially true then, when
organizations are setting goals about education which impacts all community members directly
or indirectly, that it is critical to include all stakeholders in a significant way in the process.
Wheaton and Sullivan (2014) describe a successful process of stakeholder inclusion from
the educational entity perspective, and Keown, Van Eerd, and Irvin (2008) describe the process
from the research and academic perspective. Both emphasize the importance of including
stakeholders at multiple points in the process: having stakeholder input as a basis for draft
goals, reviewing drafts along the way, and advocating for outcomes and projects resulting from
the iterative process.
Both Wheaton and Sullivan (2014) and Keown et al. (2008) discuss some challenges and
lessons learned that others embarking on this process may want to consider. Wheaton and
Sullivan highlight the need to allow sufficient time for meaningful stakeholder engagement; and
Keown et al. go further, making clear that authentic stakeholder engagement absolutely
requires more time and resources than not including stakeholders. Involving stakeholders may
even require training both stakeholders and those facilitating conversations with stakeholders
to ensure productive and constructive outcomes (p. 71). Additionally, authentic inclusion also
involves an additional logistical burden on organizers and flexibility in the process to allow for
additional unforeseen but necessary conversations and milestones that pop up along the way.
The additional burden, however, should yield results in setting goals and performance
metrics. Keown, et al.’s list includes: adding depth to research questions, broadening and
modifying research questions when involved early, adding clarity and refining
recommendations when involved in later stages, adding credibility to the work in general,
capacity building, advocacy of recommendations, and future partnerships. Wheaton and
Sullivan also discuss the importance and power of having those who will be impacted by the
research and indicators be the same individuals who help identify gaps and recommend
solutions.

TOOLS FOR PERFORMANCE MANAGEMENT IN EDUCATION
4
It is also important, once stakeholders are involved in the process, to ensure that goals
and metrics are thoughtful and appropriate. Elwell (2005) discusses examining the inherent and
often times unnoticed biases embedded in goals and performance indicators. More specifically,
“any metric is nested in an intricate web of assumptions and values that often remains unseen.
Understanding this foundation is critical to creating good metrics and just as important in using
them wisely” (p. 11). Interestingly, Elwell advocates not for tighter methodology to avoid bias,
but rather greater transparency into the goal setting process so that biases may be more clearly
understood and considered when discussing the metrics. In particular, Elwell suggests that both
organizers and stakeholders consider and examine the denominator of any metric or indicator,
medians and averages, and comparison points (p. 16), as these components say a lot about the
values inherent in that metric or statistic. Looking at the denominators and comparison points
closely show stakeholders and readers what population is important in that metric. Medians
and averages have the ability as well as the tendency to hide more granular data (p. 16).
Compellingly, comparing achievement of one group to an average tells a much different story,
and is a much different measure, than comparing one group to the highest achieving group: are
the creators illuminating or minimizing gaps?
Hoerr (2014) further challenges us to consider and create goals that are not just
predictable or politically feasible, stating that by “stick[ing] to goals that can be measured
easily, we’ve missed an important opportunity” (p. 83). Again, this is where stakeholder input
and feedback are useful. Including stakeholders and more specifically educators in the goal-
setting process can help stakeholders see performance metrics as more than just numbers, but
actual measures of quality that move the needle more than a simple report of proficiency
percentiles. Hoerr also advocates for setting challenge goals; Hoerr terms them “grit goals,”
goals that intentionally only have a 50% likelihood of being reached. Such goals, Hoerr argues,
allow stakeholders and those being measured to be less fearful of failure, and more open to
bigger, more ambitious goals. By acknowledging that success on such a goal is not likely,
missing that goal is not failure, and partial progress to such a goal may move the work further
than a less ambitious goal (p. 84).

TOOLS FOR PERFORMANCE MANAGEMENT IN EDUCATION
5
Robert Kaplan and David Norton (1993, 2007) developed a balanced scorecard process
that advocates for a system of measuring business performance beyond measures of financial
stability and success. By including measures built on customer feedback, the performance of
internal processes, and system growth, a business would have more information on which to
make effective decisions that would improve the finances of the company. This work can link
the process of constructing goals and metrics to the work of maintaining and reinforcing these
goals and metrics. To be effective, metrics must be presented clearly and reinforced
throughout the period of time covered by the strategic plan.
It is critical to build capacity of all organizational stakeholders throughout the
strategic planning process. Converse and Weaver (2008) discuss this when describing the
presentation of data and information for decision making. Not only must goals, content, and
metrics be defined and stakeholders be engaged in development, but stakeholders and
audiences must be able to access and understand the final product in order to make the best
decisions using the reporting tools. To that end, the data presentation and communication
must be very thoughtful. Converse and Weaver point out that in order for data to be the most
impactful, they must have information integrity (quality, relevance, expertise and credibility of
presenters), information layering (multiple formats, variety of presentation, multiple levels of
information granularity), and information processing (presentation format that fits multiple
learning styles, connections to what stakeholders and audiences already know).
When applying these goals and metrics to hold an educational organization
accountable, a collective understanding of the consequences is critical. Not all goals and
metrics will be connected to direct consequences, though effective goals will be embedded in
annual evaluation and improvement processes (Storey 2002). Work done to connect the
balanced scorecard to education by Karathanos and Karanthanos (2005) and others provides
many options for connecting developed goals and metrics to regular use. In educational
settings, this can be done in multiple ways. Most K–12 institutions have regular school board
meetings run by elected school board members. These meetings can be used as an
opportunity to link current items and agendas to the goals and priorities of goals and metrics.
In addition, many districts and schools have existing improvement planning and reporting

TOOLS FOR PERFORMANCE MANAGEMENT IN EDUCATION
6
processes that may be required as a piece of federal, state or local accountability
requirements. Educational institutions that align their already existing reporting and
accountability cycles with goals and metrics developed with stakeholders can provide a more
coherent vision of their goals and strategic vision.
Case Studies
National Institute for Educational Studies and Research (Inep), Brazil
Agency Profile: The National Institute for Educational Studies and Research or Inep
(Instituto Nacional de Estudos e Pesquisas Educacionais Anísio Teixeira in Portuguese) is a
special federal research agency linked to the Ministry of Education of Brazil. Founded in 1937,
Inep has seven departments and more than 800 collaborators. Inep’s mission is to promote
studies, research, and assessments of the Brazilian basic and higher educational systems in
order to support the formulation and implementation of educational public policies and
produce valid and reliable information to managers, researchers, educators and the general
public.
SDP Fellows placed at Inep, Alexandre Peres and Fábio Bravin, are career researchers on
educational information and assessment of the Institute. Peres works at Inep’s Department of
Educational Studies and Research where he is coordinator of educational measurements and
instruments and leads a team of 17 researchers dedicated to education policy research. Bravin
works at Inep’s Department of Educational Statistics where he coordinates a team of around 26
collaborators responsible for handling, systematizing, and building informational data products
from the national Basic Education Census and Higher Education Census.
Policy/Research Question: The Brazilian National Plan for Education (Brazil, 2014)—
NPE—is a 10-year plan, from 2014 to 2024, conceived with recommendations from organized
civil society conferences held at the municipality, state, and national levels. It was approved by
the Congress and materialized in a federal law in 2014. Its core objectives are to coordinate the
educational systems (federal, states, and municipalities) and define goals, strategies and
metrics to improve the educational development of Brazil. The NPE has 20 goals regarding
access, quality, equity and public funding on both basic and higher education systems.

TOOLS FOR PERFORMANCE MANAGEMENT IN EDUCATION
7
Inep has a key role in the NPE, as it is officially responsible for producing, systematizing,
and disseminating information and analysis about the achievement of the plan’s goals and
strategies. During the term of the NPE, Inep will continuously support—with research and
information—the monitoring and evaluation to be conducted by the governance committee of
the NPE, composed of the Ministry of Education, the Education Committees of the Senate and
of the House of Representatives, the National Forum of Education, and the National Council of
Education.
Attending the NPE assignments, Inep’s researchers have been developing indicators and
conducting studies to monitor goals and strategies achievement and to deepen the
understanding of issues and challenges. This work will provide useful elements to decision
making processes for government, parliament, and organized civil society stakeholders from all
over the country. The broader objective is to answer the question of how effective the policies,
programs, and public actions have been in matching the goals of the NPE. This is a complex and
challenging task that requires both analytic and leadership skills.
Project Scope and Timeline: In the context of the NPE, Inep will identify issues and
challenges and offer accurate and integrated information that helps enhance and optimize
public resources and strategies in the pursuit of its goals. The scope of this project is to build
data reports and a dashboard for continuously monitoring the NPE’s goals to promote equity
and improve the quality of instruction.
The NPE established some requirements for its monitoring and evaluation. The data
must come from official and well-established national surveys. The information should be
organized by federated entities (i.e., municipalities, states and Federal District) and
consolidated at the national level. Research should include analysis regarding educational gaps
considering student characteristics such as race/ethnicity, gender, locales of residence (i.e.,
rural or urban areas),socioeconomic status, and students with disabilities.
In this way, the monitoring and evaluation processes will be grounded on reliable and
comparable information and focused on equity. Based on the best possible common metrics, all
government levels (i.e., federal, state and municipal) can manage their educational system
pathways through the effective implementation of the National Plan’s goals.

TOOLS FOR PERFORMANCE MANAGEMENT IN EDUCATION
8
Nevertheless, providing appropriate and reliable data to society in an integrated and
meaningful way has many challenges, starting with the definition of the proper metrics to be
adopted. Since 2013, Inep’s researchers, including the SDP Fellows Peres and Bravin, have been
enrolled in determining a set of indicators that will be used for monitoring the achievement of
the NPE’s goals. This process starts with the conceptual definition of the metrics: what will be
measured? The second step is to choose the most appropriate database for a given indicator,
considering aspects as target population representativeness, territorial coverage, time series
available, etc. After exploratory analysis, the next step is to validate the indicators set with the
stakeholders. Figure 3 presents a summary of the overall timeline.
Communication with stakeholders is crucial to ensure indicators are effectively adopted.
As well as being reliable, indicators should be understandable and meaningful, so public
managers will be engaged in integrating them to decision-making processes, and organized civil
society will use them to exert control over educational public policies. Inep has worked
alongside the Ministry of Education’s managers and technicians and with representatives of the
governance committee of the NPE, like the National Forum of Education. In this work, Inep
informs about data possibilities and limitations and receives feedback about the
appropriateness of indicators, the data presentation and report, and about the stakeholders’
main policy questions.
Although necessary, agreement on key performance indicators takes a long time and is a
source of risk for project management and timeline. After a year and a half from the start of
this project, the group obtained a minimum consensus around the indicators to figure on the
dashboard and studies. There is still disagreement regarding some goals’ metrics that do not
have indicators or that have a weak approach.
In this way, Inep is still working on a data dashboard for monitoring the NPE.
Nonetheless, a report covering the ten years preceding the NPE was prepared as a baseline to
track the trajectory of the indicators chosen. The report also presents analysis regarding
regional inequalities and student characteristics such as race/ethnicity, gender, locales of
residence (i.e., rural or urban areas), socioeconomic status, and students with disabilities.

TOOLS FOR PERFORMANCE MANAGEMENT IN EDUCATION
9
Results/Impact: At least three key successes of the project can be highlighted. First,
the integrated efforts of Inep and the Ministry of Education’s departments in building a
consensus on metrics that will be used by society to follow up the NPE. A second highlight is
that the project adopted a focus on equity as an assumption, which is critical to offer
meaningful information and engage different stakeholders on the monitoring and evaluation of
the NPE. Finally, in the first year of NPE (i.e., from July 2014 to July 2015), the chosen set of
indicators was used by the Ministry of Education to offer technical support to Brazilian
municipalities and states governments in elaborating their plans of education for the next ten
years, as demanded by the NPE’s Law. This provided useful feedback to Inep.
The challenges faced during the project originated from many sources. One such
difficult task included working with different stakeholders to answer distinct questions and to
combine various objectives in just one product (i.e., a set of indicators for a data dashboard).
Other challenges were related to data availability and metrics development for some goals.
There are goals on the NPE that do not have direct measures, since they were elaborated in
terms of abstract concepts (e.g., democratic management of schools). Besides this, there is a
lack of information regarding some goals, years, and aggregation levels. Since we share the
perception that the local managers’ engagement increases when they recognize themselves in
data and they can identify their trajectory, it was a challenge to bring the information to the
lowest possible aggregation level (e.g., municipal level). These challenges hinder the relation
with stakeholders. They may become frustrated with data limitations but are not familiar with
the costs and technical complexity of collecting nationally representative data.
Inep and the Ministry of Education had defined around 36 monitoring indicators for the
20 goals of the NPE. In addition, for illustrative purposes, in the Appendices section of this case
study, we list a subset of these indicators which are focused on the assessment of the
performance of the Brazilian national system of basic education. These indicators are related to
topics such as school access, students’ regular pathway, and learning and educational equity.
The sources are the Brazilian Population Census (decennial), the National Household Sample
Survey (annual), the Educational Census (annual) and the Prova Brazil, a national standardized
test for the assessment of students’ literacy and numeracy (biannual). Figure 1 presents the
TOOLS FOR PERFORMANCE MANAGEMENT IN EDUCATION
10
2013 results for the indicators and Figure 2 presents the trajectory of Brazilian municipal school
networks on the Basic Education Development Index (Goal 7) between the years 2007 and
2013.
The last challenge to mention, but not less important, is the development of a platform
and tools to handle big data and present information and analysis in an adaptable way to
various users, such as politicians, managers, researchers and society in general. Information
Technology personnel are also important stakeholders in projects like this.
The project here described will be permanent during the term of the NPE. The next step
is to disseminate the chosen monitoring indicators with the stakeholders by developing a
dashboard with dynamic data visualization and periodic monitoring reports that can be updated
every two years until the end of the plan. In the next years, Inep will work on the improvement
of the relation and communication with the various stakeholders of NPE and on the
advancement of data collection, analysis, and dissemination.
Office of the State Superintendent of Education (OSSE), Washington, DC
Agency Profile: The Office of the State Superintendent of Education (OSSE) serves as
the state education agency for the District of Columbia. The landscape of public education in
the District is varied and complex, with both a large traditional public school system (District of
Columbia Public Schools, or DCPS) that enrolls approximately 46,500 (55%) of publicly educated
students, and a strong public charter sector enrolling about 38,900 (45%) of students at sixty
different public charter districts across the city. OSSE was created as a result of the Public
Education Reform Amendment Act, instituting Mayoral control of education in the District in
2007. With a mission to remove barriers and create pathways for District residents to receive a
great education and prepare them for success in college, careers, and life, OSSE serves several
main functions for students and local education agencies (LEAs, both DCPS and charter). OSSE is
responsible for the dispersal of federal funds aligned to federal programs, support and
monitoring of those federal programs, special education support and monitoring,
transportation, wellness and nutrition, data systems, research and analysis, federal reporting,
statewide assessment, postsecondary support and grantmaking, and early childhood support
and monitoring.

TOOLS FOR PERFORMANCE MANAGEMENT IN EDUCATION
11
Jessica Mellen Enos served as an SDP Fellow across two different positions within the
Division of Data, Accountability and Research (DAR), as both a data analysis manager, and the
director of assessment and accountability. DAR is one of the key divisions in the agency, and
has grown rapidly in the past four years, since its inception, to meet the growing demands for
high quality data for both educational and accountability purposes. Within DAR there are three
teams: Analysis and Research, Systems and Collection, and Assessment and Accountability.
With DC’s large charter sector, DC education is a marketplace, which needs valid, transparent,
and easily accessible data for families to make the best decisions about the best school match
for their students. The data also allows stakeholders to see where students are flourishing and
study what is working there. It also allows them tounederstand where more support is needed
to ensure that all students receive a high quality education that prepares them for life after
high school.
Policy/Research Question: To present high quality metrics for families and
policymakers, the data that fuels those metrics must be clean and accurate. While there are
many quantitative and qualitative measures available, the state assessment is a cornerstone for
many metrics. In 2013, the Assessment division underwent several major transitions: having
four directors in one year and a shift from living within the Elementary and Secondary division
to the division of Data, Accountability and Research. At the same time, the District was
transitioning its legacy state assessment to be aligned with the Common Core, adopted in 2010,
and serving as a governing state in the Partnership for the Assessment of Readiness of College
and Careers (PARCC) consortium, with the first planned administration of the PARCC
assessment in 2015. All this transition resulted in inconsistent implementation of state policy,
loss of institutional knowledge, doubts around the fidelity of state level test development
activities, and mistrust. Consequently, LEAs were skeptical of both DC’s legacy test (DC CAS) and
extremely anxious about the implementation of a new test. How could OSSE ensure that pivotal
assessment data used for performance metrics was still accurate and valid?
Project Scope and Timeline: OSSE began with a listening tour, opening several
avenues for authentic communication with LEAs and other DC stakeholders. This initiative was
kicked off in early fall 2013 with a lessons learned feedback session with LEAs (a three hour

TOOLS FOR PERFORMANCE MANAGEMENT IN EDUCATION
12
session where stakeholders at the LEA and school-level were able to express their frustrations
with previous years and hopes for the future, where no topic was off limits). While OSSE could
not commit to fixing every issue, we could commit to listening. OSSE also began a monthly in
person, stakeholder meeting with both LEAs and other educational stakeholders, and notes
from this meeting were posted publicly on OSSE’s website. OSSE also collected names to create
an Assessment distribution email list, so that the Assessment team could keep all stakeholders
up to date quickly.
Through this authentic listening, OSSE built strong relationships with its stakeholders
and partners. Through this relationship building, stakeholders, particularly the LEAs, were
willing to be very honest but also very constructive. OSSE leveraged this honest feedback to
then make tweaks to processes and to engage in both official and unofficial feedback cycles as
the Assessment team considered business rules and policy both in the last year of the DC CAS in
2014 and the first year of the PARCC in 2015. OSSE Assessment utilized the monthly
stakeholder meetings, small working groups spun off from the stakeholder meeting, ad hoc
surveys, and informal focus groups and phone calls to further strengthen the relationship with
stakeholders. Assessment also partnered with other divisions within OSSE to leverage
information and data already collected, along with related projects already underway to further
support LEAs without asking them for information they had already provided to OSSE.
Assessment analyzed both the hard and soft data from multiple sources to inform business rule
creation and policy making around assessment.
This move to greater collaboration also caused a shift in when and how Assessment
received feedback. Instead of issuing final policy and guidance and waiting for a rebuttal from
the field, when possible, Assessment partnered and consulted with LEAs first, used their input
to tweak as much as possible, and then issued final policy and guidance that was acceptable to
all stakeholders. This was especially important in the first year of a new assessment, where the
Data and Assessment teams were creating new accountability rules for assessment data,
performance metric calculations, and policy and guidance. Over the course of two years,
Assessment was able to change the relationship between OSSE and LEAs from a contentious
one to a collaborative one. The work moving forward for OSSE is to maintain that relationship

TOOLS FOR PERFORMANCE MANAGEMENT IN EDUCATION
13
by continuing to provide high quality products and continuous improvement of what already
exists. We are confident that this new collaborative relationship has ensured, and will continue
to ensure, that assessment data are accurate and valid because the assessments, policy and
implementation are all done with a new level of fidelity.
Results/Impact: Through this feedback and collaboration process, several themes
emerged including the surprising LEA hunger for more policy from OSSE about assessment and
the desire and willingness from LEAs to be involved in critical decisions and policymaking. DC
education has a strong culture of autonomy. The historical impression was that LEAs wanted to
make decisions for themselves wherever possible; in the assessment arena, however, we found
this was not true. LEAs wanted to know the rules so that they could play by them. And further,
when Assessment involved the LEAs, less anxious, and more open to collaboration, Assessment
was able to arrive at policy decisions around assessment that both satisfied OSSE’s federal and
local requirements and felt fair and reasonable for the LEAs.
This trust and collaboration led to a very solid and transparent last administration of the
DC CAS in spring 2014. With it being the last year of the DC CAS and with new, more rigorous
assessments on the horizon, there were real risks of the assessment not being taken seriously
or not administered with fidelity. As a result of the new relationship, however, the data coming
out of the last DC CAS was authentic and gave OSSE confidence that the results were valid and
could be used for authentic decision making. OSSE was able to use the data in the state
reporting system, LearnDC.org in school profiles, and to calculate school accountability metrics
per our ESEA waiver business rules. OSSE leadership was able to communicate to stakeholders
that there had been real growth across the city from the previous year and stand behind that
statement.
This trust and collaboration also set the stage for the inaugural PARCC
assessment in spring 2015 where risks were similar. Again, Assessment was able to pull out
common themes from all the feedback avenues, particularly about the state accountability
framework. With so much unknown about this new assessment, and with decisions being made
at the consortium level on a consortium timeline, there was a lot of anxiety from the field about
how they would be held accountable. With this information, OSSE crafted and passed a
TOOLS FOR PERFORMANCE MANAGEMENT IN EDUCATION
14
proposal and an amendment to DC’s ESEA Waiver that made this first transitional year of our
state assessment a “hold harmless” year. Until OSSE can comprehensively analyze and
contextualize assessment data, and understand the impacts, OSSE committed to not using the
data for accountability purposes and performance metrics.
Even with this hold harmless year and anti-test sentiment across the country as
evidenced by movements like United Opt Out (www.unitedoptout.com), the National Center
for Fair and Open Testing (www.fairtest.com) and chronicling by outlets like Education Week,
The Washington Post, and The New York Times, DC did not experience any significant numbers
of students opting out of the state assessment and had one of the highest rates of online
testing in the PARCC consortium. Again, this participation will be especially crucial in future
years, since the spring 2015 administration will be a baseline year, used to calculate growth
metrics in the future. While the stakes were low this year for schools, the positive relationship
OSSE has built with stakeholders about assessment implementation ensured that the
assessment was given with fidelity. OSSE is confident that the data will be accurate and
informative, allowing Data and Assessment to use it for calculating growth and for analyses
against other benchmarks. These analyses will inform the metrics used for performance,
allowing OSSE and stakeholders to have authentic conversations around what this new
assessment tells us about student progress towards college and career readiness.
There is still much work to be done in the future. OSSE will need to analyze the data
once they are available to understand student achievement and mastery on these new
standards. Assessment will need to rewrite the accountability framework business rules in DC’s
ESEA waiver to reflect and incorporate fully the new assessment and the data that goes with
them. And, Assessment will need to shift gears from building trust to maintaining trust. OSSE
also needs to continue finding authentic ways to engage all stakeholders, regardless of how big
or small, to ensure that all students and educators are represented in these conversations going
forward. But for now, OSSE can be proud and confident in the validity of our results, and
Assessment can look forward to continued collaboration and conversation with our
stakeholders, all with the goal of improving outcomes for DC students.

TOOLS FOR PERFORMANCE MANAGEMENT IN EDUCATION
15
Oklahoma State Department of Education (OSDE) and Office of Management and
Enterprise Services (OMES), Oklahoma City, OK
Agency Profile: Colleen Flory has served as an SDP Fellow to two organizations in the
state of Oklahoma over the course of the SDP Fellowship—the Oklahoma State Department of
Education and the Office of Management and Enterprise Services.
The Oklahoma State Department of Education (OSDE) is the state education agency for
Oklahoma and has approximately 300 employees. OSDE oversees 516 school districts with 1756
school sites. There are approximately 680,000 students enrolled in public education in
Oklahoma. Flory’s role at the OSDE was to lead strategic planning and performance
management efforts for the reforms adopted as a part of the Elementary and Secondary
Education Act (ESEA) Waiver. The priorities of OSDE are Rigorous Curricula and Standards;
Effective Teachers, Leaders and Schools; Accountability and Transparency; and Digital Learning.
Flory served as the Assistant State Superintendent of Policy Implementation and reported
directly to the State Superintendent of Public Instruction from January 2012–August 2014.
The Office of Management and Enterprise Services (OMES) is a centralized government
services agency established to serve other state agencies and functions of government, such as
statewide budget functions, procurement, performance and efficiency, human capital
management, information technology, and other functions, under the Secretary of Finance,
Administration, and Information Technology. OMES has over 1,300 employees and serves over
80 state agencies. Flory serves as the Statewide Performance Manager of the Performance
Department at the Performance and Efficiency Division of OMES and reports to the Director of
the Performance and Efficiency Division under the Secretary. The OMES Performance
Department was charged with developing a statewide performance framework to which the
state of Oklahoma now aligns its statewide budget as a part the new Performance Informed
Budgeting initiative. The performance framework includes five goals in the areas of Health,
Safety, Education, Economy and Accountable Government. Flory oversees a staff of four
performance analysts and has served at OMES from August 2014–present.
Additionally, Flory has continued a project from OSDE to OMES, which is developing
metrics to support the Governor’s statewide P20 workforce and talent pipeline initiatives.

TOOLS FOR PERFORMANCE MANAGEMENT IN EDUCATION
16
Policy/Research Question: In any organization there are finite resources available to
address all of the reforms, priorities and issues of the day—what should leaders be focused on?
And what information do leaders need in order to make the best choices about resources,
implementation, and the direction of progress? The research question for this case study is:
How do we create a performance management system with tools that support leaders in
making policy and budgetary decisions, allocating resources, and driving progress?
Performance management was implemented in Oklahoma to support education reform
and transparency in budgeting—two new statewide initiatives. The state wanted to improve its
education system through education reform efforts and to enhance transparency and
accountability in statewide budgeting by aligning its budget to priorities. At the Oklahoma State
Department of Education, the performance management system would support the
implementation of education reforms. At the OMES, implementation of Performance Informed
Budgeting led to the development of a performance management system to support the state
budgeting process and to implement statewide goals by monitoring performance and financial
data against state priorities. Each performance management system was developed to have
clear goals with priority areas of focus, to drive progress and to measure outcomes.
Choosing the right performance measures was a challenge in both systems. At OSDE it
became clear that during early reform implementation, measuring outcomes of reforms would
not be possible as many reforms were not yet implemented. Thus, development of
implementation measures and the establishment of routines to discuss implementation efforts
and progress was the initial focus of the system. Implementation measures were more likely to
be operational level data such as inputs, outputs and milestones. As reforms were fully
implemented, outcome level data became available and was used to inform the work. By tying
outcomes to operations using performance measures and analyses, data could be used to
inform key decision points and actions. Priorities and available data were reassessed regularly.
This allowed for the streamlining of services to schools, processes and continued progress
toward positive outcomes in each area of reform.
Alternatively at OMES, statewide performance management would be used to inform
and support Performance Informed Budgeting across all state agencies at the state level. The

TOOLS FOR PERFORMANCE MANAGEMENT IN EDUCATION
17
challenge was to narrow the scope and develop a statewide performance framework, called
OKStateStat, so that focus and resources were placed on areas of statewide priority. Statewide
priorities were designed to be cross-cabinet and aligned to multiple agencies. For key
performance measures under each Statewide Program, high-level data that indicated the
progress of the state was used. The key performance measures in this system approximate the
state’s current status in a given priority area and thus, each key performance measure must be
high-level, outcome-focused and representative of a given priority area. Additionally, budget
and actual financial data are then aligned to each Statewide Program, which will allow for
analysis of the impact of budgeting decisions on statewide priorities and outcomes.
Additionally, the state was in the process of developing talent pipeline metrics across
the workforce systems, education systems and agencies in the state. As a part of this effort,
outcome metrics for common education were researched and developed as a part of the work
at OSDE and later these metrics were incorporated, as appropriate, into the education goal in
OKStateStat.
Project Scope and Timeline:
State Agency Performance Management—Oklahoma State Department of Education
(OSDE):In 2011, a new State Superintendent of Public Instruction was elected and the
Oklahoma legislature passed a sweeping set of education reforms in support of the ESEA
flexibility waivers in the following areas: Rigorous Curricula and Standards; Effective Teachers,
Leaders and Schools; Accountability and Transparency; and Digital Learning. The Oklahoma
State Department of Education needed a way to track and manage all implementation efforts
and gauge efficacy of programs once implemented. This required the development of a
performance management system which began in 2012.
Engaging stakeholders throughout the OSDE to establish agency goals and priority
projects was the first step in developing a performance management framework. There were
four agency goals to which relevant priority projects were aligned. Agency goals corresponded
to four major areas of education reform (i.e. Rigorous Curricula and Standards; Effective
Teachers, Leaders and Schools; Accountability and Transparency; and Digital Learning). Priority
projects are defined as those projects or strategies that were specifically designed to

TOOLS FOR PERFORMANCE MANAGEMENT IN EDUCATION
18
implement reforms or support reform implementation. Stakeholder meetings were held to
determine which existing projects closely aligned with reform efforts and where new projects
would have to commence. After goals and priority projects were identified, implementation
metrics and later sustainability and progress metrics were established and tracked for each
project and for each goal. As a method for monitoring progress and maintaining stakeholder
engagement, regular quarterly and annual review meetings were established for each goal and
corresponding set of priority projects. These meetings included agency leadership and all
relevant stakeholders.
At OSDE, meaningful key performance measures included those that spoke to the
progress in implementing each education reform. Thus, each priority project needed
operational level indicators that could act as a signaling system to the leader of the project.
These were established for each project to allow for managerial decision-making at the project
level. However, in many cases metrics that were useful to project leaders were not as useful to
agency leadership. A more distilled and targeted set of information about the goals and
outcomes were needed for executive leaders to make decisions. Thus, goal level metrics were
defined to allow for better information at the state education agency level of leadership. Goal
level indicators were high-level metrics which allowed a view of agency progress across all key
statewide outcomes for each goal. Thus, metrics differed for priority projects versus goals.
Priority projects had detailed inputs, outputs and milestones as performance measures, while
performance measures at the goal level focused on information that would be meaningful to
agency leaders and to external stakeholders regarding education reform, such as results and
outcomes (i.e. graduation rate, dropout rate, etc.).
Executive level leadership at OSDE needed a routine “40,000 foot” viewpoint on all data
across the agency. It was the role of the SDP Fellow to sift through all of this information and
provide the most relevant, objective, and timely data to assess the current situation or decision
point. The fellow sat on the executive team and acted as an advisor. The fellow managed the
processes of regular data collection, review and development of metrics for goals and priority
projects, and quarterly and annual review meetings for each goal and set of corresponding
priority projects. Stakeholders and project leads for each goal were grouped strategically in

TOOLS FOR PERFORMANCE MANAGEMENT IN EDUCATION
19
meetings to facilitate agency-wide collaboration and increase the quality of services provided to
schools. The fellow and her staff analyst at OSDE performed additional analyses across all
agency priority projects as needed to continually support, clarify, define, and assist in the
functions of the agency.
Continuous improvement and regular reflection were critical to the maintenance of the
performance management system at OSDE. Performance measures at the project and goal level
were streamlined and clarified to maintain relevance to executive leaders and project leads.
The Leadership Team at OSDE routinely reviewed performance measures and reflected
quarterly on the relevance of measures and what additional information was needed. OSDE
Leadership also reviewed agency progress on the whole at Annual Review Meetings and at the
annual Leadership Retreat that followed. The information, data and analyses from each review
was used to drive decisions and actions to improve implementation and efficacy of education
reforms in Oklahoma.
The SDP Fellowship began in August of 2013, and by May of 2014 much of the legislation
supporting the ESEA waiver passed in the 2011 legislative session had been significantly
modified or repealed during the 2014 legislative session. In June, the incumbent state
superintendent lost the republican primary election, meaning that in January 2015 her four-
year term would expire. In order to continue supporting data use and performance
management in education in Oklahoma, in August of 2014 Flory moved to OMES to take the
position of Statewide Performance Manager.
Statewide Performance Management—Office of Management and Enterprise Services
(OMES): At OMES the challenge was to develop a statewide performance management system
for the state of Oklahoma that includes Education, and four other goal areas—Health, Safety,
Economy and Accountable Government. For the development of this statewide performance
management system, state goals and, later, priority areas were developed with statewide
stakeholder input.
Goals were developed under the Governor and her cabinet as a part of a strategic
planning retreat in preparation for the state’s launch of its new Performance Informed
Budgeting system. After this, statewide priorities, called Statewide Programs, were established

TOOLS FOR PERFORMANCE MANAGEMENT IN EDUCATION
20
through a series of meetings with stakeholders at state agencies. Subject matter experts in the
area of the goal were asked about the statewide priorities in each area. Once priorities were
established, key performance measures were researched for each priority area.
Key performance measures for statewide performance needed to be representative of
the state and nationally aligned. They also needed to be recognizable to citizens. To meet
these needs, the performance team developed a process of data validation, such that each key
performance measure was researched and benchmarked nationally and regionally, as
appropriate. Historical data were collected on each measure. From this, performance objectives
were formed—each objective contained a validated, research-based performance measure,
baseline year with historical data, and an established target year and target data point to reach
in the future. Each performance objective was displayed with a corresponding data visualization
containing the respective historical data and target. Additionally, contextual information was
reported for each performance objective to fully inform users of the performance management
system about the intent and purpose of each performance objective. Finalized performance
objectives with contextual information are housed on OKStateStat.ok.gov, a public facing
website that houses Oklahoma’s statewide performance framework.
In total, 51 Statewide Programs were established as cross-agency, cross-cabinet priority
areas for the state with over 160 performance objectives. Throughout all agencies and financial
transactions, Oklahoma’s state budget is now aligned to Statewide Program areas. The state
launched the Performance Informed Budgeting system with the new performance management
framework in December of 2014, and later in February of 2015 launched the website
OKStateStat.ok.gov, to inform and engage citizens. In order to organize, sustain, and support
progress, the state is now in the process of establishing a Delivery Unit to employ the Delivery
Model, a methodology of performance management, to routinely review performance for the
state and implement plans to achieve performance outcomes.
Results/Impact:
State Agency Performance Management—Oklahoma State Department of Education
(OSDE): Establishment of the performance management system at OSDE allowed for regular
review of goals and progress. Regular reviews allowed for refining, not only goals but processes,

TOOLS FOR PERFORMANCE MANAGEMENT IN EDUCATION
21
for improving the OSDE’s agency-wide service to schools in the state. For the purposes of this
case study, one example of improvement of processes and services that resulted from
performance management will be explored—the development of Internal Action Chains for the
Office of School Improvement (Figure 1: Internal Action Chain for Serving Low Performing
Schools). Internal Action Chains defined the flow of the data throughout the agency, and thus,
allowed for data analyses to occur cyclically as needed within the agency. In Figure 1, analyses
were based on the needs of schools as assessed by the Offices of School Improvement,
Educator Effectiveness, and Assessment and Accountability. Each Internal Action Chain
represented a specific process within the agency in which data needed to be analyzed, handed
off and/or shared in order to inform decision making, and then acted upon once decisions were
made. Efficacy of the actions was assessed by the Offices of Policy Implementation, Student
Information and the Data Fellow, and then fed back into the chain to further inform decisions
within the agency and later actions externally. Additionally, external feedback loops were used
to collect data from the field for use in decision-making or program evaluation. Data was
collected, analyzed and used to inform next steps in implementation or to shape the existing
program into a more effective program.
As more and new data became available with the implementation of the new A–F
Grading System, Oklahoma’s grade-card accountability system, increasingly specific
conversations about improving individual school performance were made possible by using the
easy-to-understand A–F framework and combining it with other data to create analyses. For
example, A–F grades were mapped across the state to identify geographic trends by training
region (Figure 2: High and Low Performing Districts by Training Region, 2013). This analysis was
later used to inform work in each training region and to combine not only efforts, but funding
for trips to these locations. As a result, specifically tailored regional summits were held to meet
needs identified in the school sites in each region. Multiple offices from OSDE were engaged in
each summit to address the needs of the schools in that region as identified in the analysis.
Other analyses, supported by the SDP Fellow, presented district demographic factors
such as percent of student population with economically-disadvantaged status against A–F
grades such that schools who were more successful on average on a given demographic factor

TOOLS FOR PERFORMANCE MANAGEMENT IN EDUCATION
22
could be identified and compared with underperforming schools of similar size and
demographics (Figure 3: Districts with Economically Disadvantaged Student Population of 85%
or Above, 2013). This analysis combined with training regions allowed for pairing of school
leaders in schools with similar populations and demographics, but very different performance
outcomes ( i.e. A and B schools were paired with F schools of similar size and demographics),
such that similar schools could share tips on leadership, instruction and culture. Schools
designated as in need of improvement (Priority or C3 Schools) that participated in the regional
trainings were found to be more likely to have implemented reforms.
Thus, the performance management system at the OSDE allowed for development of
goals, data collection tools, analyses and support throughout the agency to consistently inform
decisions and guide progress in real-time.
Statewide Performance Management—Office of Management and Enterprise Services
(OMES): Overall, the statewide performance framework has been successfully adopted and
integrated into the state budgeting cycle. A Performance Informed Budgeting bill successfully
passed in the 2015 legislative session making this state law. The launch of the performance
management framework for budgeting OKStateStat.ok.gov has allowed for increased
transparency for all citizens on what the state is doing and how goals are accomplished.
Alignment of the budgeting process to Statewide Programs will allow for the budget to be
analyzed by priorities and outcomes. Thus, relevant analyses of performance and financial data
to inform budget decisions are now a part of the state budgeting process.
As an example of the results and impact, a focus will be placed on the Education goal for
the Statewide Program called “School Excellence” to display results (Figure 4: OKStateStat
Education Goal: School Excellence).
Efforts are now underway to further develop and utilize data collection tools and to
support implementation in agencies, and to develop a routine review process with stakeholders
(based on the Delivery Model or Stat Model). A move toward developing a statewide
performance review or “Stat Review” model based on the Delivery model and work in other
states such as Maryland (City Stat and State Stat) and Washington (Results Washington).

TOOLS FOR PERFORMANCE MANAGEMENT IN EDUCATION
23
The first preliminary alignment of statewide financial data to the new statewide
performance framework will be available in August of 2015, and will be reported officially in
February of 2016 on OKStateStat.ok.gov.
Orange County Public Schools, Orlando, FL
Agency Profile: Orange County Public Schools (OCPS) is the 10th largest school district
in the country and the 4th largest in Florida serving 191,192 students. Nearly 23,000 thousand
teachers, administrators, paraprofessionals and support staff work to support the district’s
mission and vision. The mission of OCPS is “to lead our students to success with the support
and involvement of parents and the community”. The vision of OCPS is ”to be the top producer
of successful students in the nation”. OCPS provides student services from Pre-Kindergarten to
Adult Technical Education and is committed to using community support to ensure student
success.
In the last year, OCPS was named as a co-winner of the Broad Prize for Urban Education
for improvements in student achievement and the Governor’s Sterling Award for operational
efficiency.
One SDP Fellow from OCPS, Brandon McKelvey, works with the Research,
Accountability and Grants department to provide support to the district in the areas of
accountability, assessment, evaluation, research, school improvement, grants, philanthropic
development and strategic planning. This group has helped to guide the district through
transitions in assessment and accountability while aligning new changes to strategic planning.
Over the last year, McKelvey has worked closely with an additional SDP Fellow from the
district, Jennifer Sasser, to improve and refresh the district’s strategic plan.
Policy/Research Question: The prior strategic plan guiding work in OCPS ended in
the 2014–15 school year. District leadership and the School Board of Orange County met to
determine what was needed in the new strategic plan. All agreed that the prior strategic plan
placed the district on the right path, though a ‘refresh’ was needed to align with new priorities
and strategies. In addition, the market differentiators that separated Orange County schools
from other educational options needed to be refined to include additional items such as the
district’s transition to digital curriculum programs.

TOOLS FOR PERFORMANCE MANAGEMENT IN EDUCATION
24
OCPS’ prior strategic plan contained over two hundred measurable objectives
connected to five district goals. Though a large organization such as OCPS requires numerous
metrics to monitor student and operational needs, more focused measurable objectives would
make community participation and accountability more direct. The prior strategic plan provided
business plans in each area that translated the measurable objectives into goals. District leaders
agreed that the new strategic plan must provide more research-based strategies and input into
these goals. Finally, in the construction of the plans, stakeholders agreed that a common
priority and measureable objective selection process should be used to create consistency
between instructional and operational targets.
Through these changes, OCPS would like to see the following outcomes from the new
strategic planning process. First, the strategic plan will be clearer for community members to
follow and understand. This will lead to the plan’s use in guiding policy more directly
throughout the year. Second, the strategic plan will be more consistent across divisions of the
school district. This will be seen through a more coherent plan that shares objectives across
divisions. Finally, the plan will reflect research-based strategies for achieving district goals.
Project Scope and Timeline: The district’s prior strategic plan ended in the 2014–15
school year, and the new strategic plan is required for the 2015–16 to 2019–20 school years.
Refreshing the strategic plan consisted of changing and updated multiple elements. The new
plan would require feedback from multiple stakeholder groups including students, parents,
community members, teachers, administrators and other personnel. Business plans and
measureable objectives would require revision while still maintaining alignment to the mission,
vision and goals in the current strategic plan. Throughout this process, all stakeholder groups
including the School Board of Orange County would require updates and opportunities to
provide feedback.
The refreshing of the strategic plan began in late 2014 with initial discussions between
stakeholders about the plan. Initial decisions were made about the deliverables of the new plan
and the timeline. The new strategic plan would be completed in the summer of 2015 and
approved by the School Board of Orange County in late July. In early 2015, a group of district
and school administrators began to build a new structure for the business plans and district

TOOLS FOR PERFORMANCE MANAGEMENT IN EDUCATION
25
scorecards. Concurrently, the district sent out a SWOT (Strengths, Weaknesses, Opportunities
and Threats) survey to all stakeholder groups in the district to gather feedback on current
perceptions on the district’s strengths, weaknesses, opportunities and threats.
Following this, a group of all stakeholders met to examine the survey results. The results
validated the decision to refresh rather than rewrite the strategic plan. All stakeholder groups
desired continued progress in areas identified in the prior strategic plan and acknowledged
large improvements over the last five years. Each division in the school district met individually
to translate the feedback from stakeholders into new division priorities that would be used to
write updated business plans and measurable objectives. To facilitate each division executing a
similar process, Research, Accountability and Grants provided a portfolio of resources including
research summaries, guides for selecting priorities and data from comparable school districts.
An additional outside consultant group worked with all divisions as well to provide additional
assistance throughout the process.
Brandon McKelvey and other members of the Research, Accountability and Grants
department assisted in providing more focused support throughout the strategic plan process.
Before groups began their work in selecting and defining priorities, groups were able to
examine comparable data from other school districts to orient groups on strengths and
weaknesses. In addition, the department constructed a SWOT survey built around the needs of
school districts to provide stakeholder feedback in a format that would support the process. All
members of the department also worked with a research partner to identify meaningful
research for divisions and provide this to all groups.
By May, all divisions had initial draft of their priorities, business plans and measurable
objectives. These documents were provided for review by the district leadership and the School
Board of Orange County. The School Board of Orange County was asked to select their top
priorities for two goals where there more than three to five priorities for each goal.
Concurrently, the district requested additional feedback from all stakeholder groups again for
the priorities and measurable objectives. Over 1200 parents, students and community
members gave additional feedback on the work.

TOOLS FOR PERFORMANCE MANAGEMENT IN EDUCATION
26
Starting in late June, district consultant partners along with the Public Relations
department began meeting on a communication plan for the new strategic plan. This work is
leading to final School Board approval in late July 2015 that will be followed by communication
and community engagement concerning the plan throughout the 2015–16 school year. As in
prior years, updates on the strategic plan are a repeated agenda item on all School Board
meetings. This ensures that the strategic plan is emphasized over the next five years and
continues to be an important part of monitoring and focusing the work of the school district.
Results/Impact: The school district benefitted greatly from the ability to refresh
rather than rewrite the strategic plan. This was possible due to the work of the Superintendent
who in her prior position as Chief of Staff guided the last strategic planning process. With this
prior foundation to use, OCPS was able to focus on improving a smaller set of objectives to
improve the plan.
There were many successes of the strategic planning process that can be attributed to
collaboration across stakeholder groups and district departments. In prior iterations of the
strategic plan, the priorities, business plans and objectives of individual divisions were aligned
with a single goal. The new strategic plan will contain goals with priorities, business plans and
objectives that cross division barriers. The support of the Research, Accountability and Grants
department, along with our external partners, led to more continuity in the forms and
operationalization of measurable objectives. The final number of priorities in the new strategic
plan will also be more focused. The measurable objectives that are most critical and aligned will
be in the strategic plan, while other objectives will be monitored on a monthly, quarterly, or
biannual schedule in a separate monitoring process.
Orange County Public Schools did experience some challenges as well during this
process that we look forward to addressing in future years. Though there were some
improvements made to the website and the display of scorecards, we are not yet a point where
we are prepared to dashboard our measurable objectives. We are working with our external
partners to build a roadmap that will take us from our current state to a fully automated,
dashboard display process. We made improvements in defining and operationalizing measures.
This would be further improved with a dashboard system where instead of creating written

TOOLS FOR PERFORMANCE MANAGEMENT IN EDUCATION
27
business rules for an analyst to follow we were able to gather, shape and calculate measurable
objectives directly from our student, staff and business information systems.
Multiple analyses conducting with the support and recommendations from the Strategic
Data Project helped to guide our strategic planning process. Data collected and analyzed
through the SDP Toolkit, a set of structured data exercises and support provided to all school
district participating in the SDP program, assisted the district in understanding its current
status. OCPS purchased access to National Student Clearinghouse data thanks to participation
in SDP, and we anticipate that this will be an important source of data to support our planning
and improvement processes for years to come. The Research, Accountability and Grants
department compiled data on comparable districts in Florida in student assessment
performance, attendance, and discipline along with other financial and operational metrics.
This helped us understand our strengths and weaknesses and identify relevant priorities.
We had numerous analysis challenges that mainly arose from the lack of statewide
assessment data for the 2014–15 school year along with other transitions in assessment and
accountability. Concerns about the validity of the 2014–15 statewide assessments, resulted in
the Florida legislature choosing to conduct a validity study and determine whether the new
assessments should be used for high-stakes decisions for students, teachers and administrators.
Until this study is completed, no scores will be released from the new assessments. This has left
numerous gaps in our objectives until this issue is resolved.
Our next steps are to communicate the strategic plan to all community stakeholders and to
continue work that improves the quality and consistency of the plan. Our communication
process will require us to embed discussion about the strategic plan in all public presentations
in the 2015–16 school year. We are also looking forward to making continued improvements in
the presentation and dashboarding of measurable objectives. This will help ensure consistency
in calculation year to year and increase district accountability.
School District of Philadelphia, Philadelphia, PA
Agency Profile: The School District of Philadelphia’s mission is to “provide a high-
quality education that prepares, ensures, and empowers all students to achieve their full
intellectual and social potential in order to become lifelong learners and productive members

TOOLS FOR PERFORMANCE MANAGEMENT IN EDUCATION
28
of society.” The District serves a predominantly low-income, minority population of more than
200,000 students in traditional, cyber, charter, alternative education, and early childhood
education schools and programs. Nearly 10% of K–12 students in traditional schools are English
Language Learners, and nearly 15% of these students have disabilities. The District employs
more than 15,000 individuals, including close to 9,000 principals, assistant principals, and
teachers.
Policy/Research Question: As part of the District’s Action Plan, the Office of Strategic
Analytics was tasked with developing and implementing a School Progress Report that
“measures, communicates, and holds the District accountable for the performance of
traditional and charter public schools on multiple dimensions, including academic achievement,
academic progress, climate, and college and career readiness.” Several district- and state-level
accountability tools existed prior to the development of the School Progress Report; however,
District leadership wanted to develop a tool that was better aligned to the District’s Action Plan
and reflected local context and goals.
Developing the School Progress Report required a number of steps: engaging multiple
stakeholders on the question of what the School Progress Report should measure; determining
whether the data required for these metrics were available and of high quality; coordinating
the collection of data from multiple sources; determining how to structure metrics so that they
supported the goals in the District’s Action Plan; developing a scoring methodology that set
high standards for performance while allowing for meaningful differentiation between schools;
and developing final reports that displayed nuanced information in a way that was easy to
understand and actionable.
Completing these steps required familiarity with best practices in performance
management, research on key performance indicators and other district- and state-level
performance frameworks, and an understanding of how to collect, organize, analyze, and
interpret data.
The development process for the School Progress Report began in May 2013; 2012–13
school year reports were issued in April 2014. 2013–14 school year reports, incorporating new
metrics and including charter schools for the first time, were issued in April 2015.

TOOLS FOR PERFORMANCE MANAGEMENT IN EDUCATION
29
Project Scope and Timeline: The development and implementation of the School
Progress Report (SPR) required several steps:
Stakeholder Engagement and Research: The first step in the development of the SPR
involved engaging with multiple stakeholders and conducting research to define the tool’s
purpose and content. The Office of Strategic Analytics (OSA) interviewed senior leadership
(including the superintendent, deputy superintendent, assistant superintendents, and Cabinet
members), organized a series of working group meetings for administrators from both
traditional and charter schools, and held a series of public meetings for parents/guardians,
families, and community members. OSA also reviewed performance frameworks from other
districts and states, research on evidence-based indicators of postsecondary success, and
literature on best practices in performance management. At the conclusion of this process, OSA
was able to develop a list of design principles and candidate measures for the SPR. Design
principles included alignment to the goals, priorities, and values outlined in the District’s Action
Plan, meaningful differentiation between schools, and acknowledgement of the differences in
populations that schools serve. Candidate measures spanned a broad set of domains, including
academic achievement, academic progress, climate, college and career readiness, equity,
educator effectiveness, and stakeholder feedback.
Data Collection and Assessment: Working closely with the Office of Information Systems
and various program offices (including Curriculum, Instruction, and Assessment; Multilingual
Curriculum and Programs; and Student Support Services), OSA conducted an assessment of
data availability and quality to determine the feasibility of including candidate measures in the
SPR. For a number of measures, high-quality data were not available for SY 2012–2013. For
example, the District’s educator effectiveness system and a revamped citywide survey were not
implemented until SY 2013–2014; additionally, a subset of relevant datasets had not been
collected or maintained over time. In addition to limiting the metrics included in the SY 2012–
2013 SPR to those that could be reliably calculated, OSA collaborated with internal staff and
external partners, such as the Pennsylvania Department of Education (PDE), to ensure that the
relevant data could be collected for SY 2013–2014.

TOOLS FOR PERFORMANCE MANAGEMENT IN EDUCATION
30
Metric Development: While the stakeholder engagement and research and data
collection and assessment processes identified general metrics for inclusion in the SPR, OSA
invested a significant amount of time in structuring the metrics so that they were nuanced,
actionable, and incentivized the right behavior at the district and school levels. For example,
the percentage of students scoring Advanced on standardized assessments was included to
communicate that the District’s goals for student achievement extend beyond proficiency.
Separate credit accumulation metrics were created for on-track and off-track students, allowing
stakeholders to determine whether the needs of under-credited students were being met.
Finally, rather than focusing solely on participation or performance (i.e., performance for those
who participated), Advanced Placement/International Baccalaureate and ACT/SAT metrics
focused on participation and performance for a cohort of 12th-grade students, ensuring that
the expectation for all students—in accordance with the District’s Action Plan—was the
achievement of college and career benchmarks by the end of the 12th grade.
Scoring Methodology Development: Developing a scoring methodology for the School
Progress Report required determining how to score metrics as well as how to weight individual
metrics and domains to reach an overall score. OSA used a simulation tool to model different
scenarios for senior leadership. At the conclusion of this process, it was determined that
metrics would be scored on the basis of performance between a floor (the minimum
performance required to earn points on a metric) and a target (the performance at which a
school earns the full number of points possible for a metric). Floors and targets were generally
set at the 10th and 90th percentiles, ensuring differentiation between schools, particularly on
metrics where the distribution of performance was relatively narrow; however, for
standardized test performance, standardized test growth, and graduation, floors and targets
were reset to align with the goals outlined in the District’s Action Plan. Of the four domains on
the SY 2012–13 SPR (Achievement, Progress, Climate, and College & Career), Progress was
weighted most highly, reflecting the District’s commitment to ensuring that all students are
learning.
Report Development: A number of features were included in the final report to ensure
that the displayed data were nuanced and actionable. Domain scores aggregate performance at
TOOLS FOR PERFORMANCE MANAGEMENT IN EDUCATION
31
the domain level, allowing stakeholders to quickly assess a school’s strengths and weaknesses
before drilling down to the metric level. City ranks compare a school’s performance to that of
all schools citywide while peer ranks contextualize school performance by making comparisons
within groups of schools serving similar student populations, thereby acknowledging
differences in the populations that schools serve and ensuring fair comparisons. Finally,
performance tiers—called Model, Reinforce, Watch, and Intervene—assign schools to groups
based on the District’s standards for performance and ensure transparency about the potential
actions that can be taken in response to a school’s performance.
Addition of New Metrics: For the SY 2013–2014 SPR, OSA included new metrics in the
SPR; these metrics were identified during the original stakeholder engagement and research
process but were eliminated during the data collection and assessment process due to
challenges with data availability and quality. Among these metrics were three college and
career readiness metrics focused on Advanced Placement/International Baccalaureate
participation and performance, ACT/SAT participation and performance, and FAFSA completion;
equity metrics focused on academic growth for the lowest-performing students in a school; and
educator effectiveness and stakeholder feedback metrics.
Inclusion of Charter Schools: Charter schools were included in the SPR for the first time
in SY 2013–14. As charter schools do not share data systems with the District, this required
collecting data directly from individual charter schools as well as coordinating data collection
from PDE and other external partners. Working collaboratively with the Charter Schools Office,
OSA developed a template for data collection from charter schools as well as a protocol for
vetting the submitted data for completeness and accuracy.
Results/Impact: As described in the District’s Action Plan, the SPR is used to
“celebrate schools that are meeting or exceeding a standard of educational excellence for all
students; to identify, so we can learn from, principals and teachers who are realizing
exceptional success in serving particular student populations or establishing a positive school
climate; and to identify schools needing additional interventions and supports.”
After the second year of implementation, a key success of this project has been the
incorporation of the SPR into District decision-making processes. The SPR is used in the

TOOLS FOR PERFORMANCE MANAGEMENT IN EDUCATION
32
District’s annual “System of Great Schools” decision-making process, which focuses on
reinvestment in neighborhood schools and turnaround efforts for low-performing schools. By
providing a standardized assessment of a school’s strengths and weaknesses across a broad set
of domains as well as comparisons to other schools (including those that serve similar
populations), the SPR provides District staff with a starting point for conversations about which
schools are most likely to benefit from additional resources and turnaround efforts. Having an
evidence base for these decisions is especially important given the financial and resource
constraints facing the District. The SPR is also used by the Charter Schools Office to support
decisions regarding charter school authorization and renewal, and performance on the SPR may
be used as a criterion to identify high-performing schools that will be granted greater autonomy
as the District transitions to a shared-services model.
At the school level, the SPR is used by assistant superintendents, principals, and
teachers to manage schools and guide school improvement efforts. In the first year of SPR
implementation, OSA released a web tool called the SPR Calculator that allowed principals to
simulate performance on the SPR based on performance on individual metrics, supporting
schools’ ability to set goals for year-end performance and understand how performance against
those goals would affect their eventual scores.
Finally, the SPR also provides critical information on school progress to
parents/guardians, families, and community members. All of the reports are published on the
District Web site, and the underlying school-level data are shared publicly through the District’s
Open Data Initiative, ensuring transparency about how scores are calculated and allowing
external stakeholders to incorporate the data into their own work.
In the next year, OSA will develop a set of aligned dashboards and additional web
applications that allow multiple stakeholders to access and utilize SPR data more easily.
Dashboards will allow district- and school-based staff to view historical performance and
monitor progress towards annual targets at various levels of aggregation. Web applications,
such as School Profiles and School Finder, will combine SPR data with other relevant data (e.g.,
enrollment, feeder patterns, etc.) to provide parents/guardians, families, and community
members with information that informs their school choice decisions.

TOOLS FOR PERFORMANCE MANAGEMENT IN EDUCATION
33
Additional next steps include the improvement of processes for data collection,
maintenance, and management and the provision of high-quality training for district- and
school-level staff. In collaboration with the Office of Information Systems, OSA is working
towards the automation of SPR calculations in the District’s new business intelligence tool; this
requires ongoing meetings between both teams to ensure that the relevant data are accessible
via the business intelligence tool and that the business rules for calculations are appropriately
applied to the underlying data. Options for systemizing the collection of charter school data are
also being explored, and the hope is that this work will lead to significant reductions in the
amount of time required to produce an SPR.
Training for district- and school-based staff will focus not only on the tool’s purpose and
content, but also on ways to improve data accuracy. Building a better understanding of the
tool’s purpose and content will support the incorporation of the SPR into district- and school-
level decision-making processes and ensure that the tool is being used appropriately. The focus
on accurate data entry and reporting, coupled with the technical work related to the business
intelligence tool, should lead to improvements in data quality over time. Training will also offer
an opportunity for OSA to receive and incorporate feedback on the SPR, ensuring that it
remains aligned to the District’s evolving priorities and goals.
Finally, in future years, OSA plans to extend the District’s performance framework by
building School Progress Reports for additional program types, including alternative education,
early childhood education, and career and technical education programs. OSA will likely
undertake a process similar to the one used to develop the SPR to ensure that the resulting
reports are tailored to these programs’ unique objectives and needs.
Lessons Learned
Each organization profiled recognized strengths and weaknesses in their performance
management process. The sections below describe some of the lessons learned that were
common to multiple organizations. Though not all organizations had similar concerns, or agreed
on the solution to these concerns, these represent general lessons that could positively support
performance management work in other organizations.

TOOLS FOR PERFORMANCE MANAGEMENT IN EDUCATION
34
Stakeholder Engagement
Goals should be set from the top down—executive leaders need to be clear in the
aspiration and direction of the goals and in setting expectations for the outcome or end result
of achieving the goals (i.e. defining what success looks like). Engaging stakeholders outside of
executive leadership at this early and crucial phase can confuse the overall mission and
development of meaningful goals.
After establishing goals, engaging stakeholders from the bottom up to develop plans,
priorities and measures for each goal is key for long-term buy-in. A reference planning
document is crucial to engaging stakeholders and facilitating the development of performance
monitoring tools. Plans must include broad and significant stakeholder input, including all who
will be affected by the plan and performance tools. Leaders, teachers, parents, students, and
other interested individuals, organizations or agencies will all have very useful insights that
inform the development of plans and performance management tools. Spending time clarifying
the scope and expectations of the deliverables in planning documents early in the process with
stakeholder input will help ensure that all stakeholders are in agreement on the outcome of the
project. In addition to defining an initial framework, plans should include a responsibility matrix
with a work schedule, as this benefits institutional alignment with stakeholders.
Scope
Limiting the scope of the performance management tool to meet the needs of a specific
stakeholder or group of stakeholders is imperative. It is difficult to meet the needs of all
stakeholders within the scope of a single tool; often, stakeholders are interested in different
performance metrics (e.g., inputs versus outcomes) or in different levels of aggregation (e.g.,
school level versus student level). To address all stakeholder needs, developing supplementary
or alternative performance management tools or reports to meet the additional needs of
stakeholders is necessary at times. When this approach is not taken, performance management
tools can become bloated with “too much information,” making it difficult for all stakeholders
to understand the purpose and content of the tool and to use the tool in decision-making
processes.

TOOLS FOR PERFORMANCE MANAGEMENT IN EDUCATION
35
Data and Policy Constraints
It is important to understand and acknowledge data and policy constraints when
developing a performance management tool. A given metric may be viewed as a critical
indicator of system success, but limitations on the availability and quality of data may prevent
its inclusion in a tool. For instance, implementation metrics are very different from
sustainability or outcome metrics. When a policy is new or has yet to be fully implemented,
measuring outcomes is not possible. Starting with metrics that are appropriate to gauge
progress and successful implementation of the policy is foundational to later outcome metrics
that will inform the progress made toward the goals or targets—in other words, implement
first, using measures that guide successful implementation; then shift to measuring outcomes
once full implementation of the policy has occurred.
Similarly, if policy constraints limit the ability of actors to perform well on a metric (e.g.,
if schools are assessed on performance on standards before the curriculum has been aligned to
those standards), its inclusion in a performance management tool—while signaling the
importance of the metric—may be viewed as unfair. It is important to properly register and
share concepts and information about data availability, periodicity and granularity. Data
analysis presentations can be used as important opportunities for receiving feedback and to
garner consensus regarding public policies and program monitoring indicators, especially when
dealing with different levels of government and various stakeholders from the public and other
organizations.
Training
Training is often overlooked as a critical step in the implementation of a performance
management tool. A performance management tool may contain useful information, but if
relevant stakeholders are not trained on the content of the tool and on how to use the tool in
decision-making processes, it is unlikely that the tool will drive organizational change. Training
also offers an opportunity to gather feedback on the content, design, and utility of tools, which
can lead to improvements in these areas.

TOOLS FOR PERFORMANCE MANAGEMENT IN EDUCATION
36
Demonstrating Progress
Finding connections throughout the new performance framework and commonalities
across stakeholders allows for collaboration and the building of better and stronger processes
and services. Collaboration, cost savings and an overall better understanding of progress and
how to work together is the outcome of a well-implemented performance management
system—it is crucial to articulate, track and to show these “wins” to the leadership and
stakeholders as often as possible backed with data so that all parties continue to work toward
the same goals and make progress on the whole. Often these interactions can be structured as
routine data-driven reviews or meetings with leadership and interested stakeholders that allow
for meaningful discussions of progress, performance and decision-making processes.
Reflecting
Lastly, reflecting on and realigning goals and priorities is part of the process of
continuing to improve and make progress, without this flexibility a performance management
system loses relevance quickly and impedes instead of supports the work.

TOOLS FOR PERFORMANCE MANAGEMENT IN EDUCATION
37
References
Brazil. (2014, June 25). Federal Law nº 13,005. Approves the National Plan of Education - NPE.
Retrieved July 05, 2015, from http://www.planalto.gov.br/ccivil_03/_Ato2011-
2014/2014/Lei/L13005.htm.
Converse, D. and Weaver, C. L. (2008). Improving decision quality: A process for communicating
data. Performance Improvement, 47(10), 19–24.
Ewell, P. T. (2005). Power in Numbers. (cover story). Change, 37(4), 10–16.
Hoerr, T. R. (2014). Goals That Matter. Educational Leadership, 72(1), 8384.
Kaplan, R.S. and Norton, D.P. (1993). Putting the Balanced Scorecard to Work. Harvard Business
Review, September-October, 74–87.
Kaplan, R. S. and Norton, D. P. (2007). Using the Balanced Scorecard as a Strategic Management
System. Harvard Business Review, July-August, 1–14.
Keown, K., Van Eerd, D., & Irvin, E. (2008). Stakeholder engagement opportunities in systematic
reviews: Knowledge transfer for policy and practice. Journal of Continuing Education In
The Health Professions, 28(2), 67–72. doi:10.1002/chp.159
Karathanos, D. and Karathanos P. (2005). Applying the Balanced Scorecard to Education. Journal
of Education for Business, 222–230.
Storey, A. (2002). Performance Management in Schools: Could the Balanced Scorecard Help?
School Leadership and Management, 22(3), 321–338.
Wheaton, C., & Sullivan, J. (2014). Community input in goal-setting: ONE DISTRICT'S STORY.
Leadership, 44(1), 28–38.

TOOLS FOR PERFORMANCE MANAGEMENT IN EDUCATION
38
Appendices
National Institute for Educational Studies and Research (Inep), Brazil
Exhibit 1. Basic education monitoring indicators of the Brazilian National Plan of Education (NPE) School enrollment rate, children ages 0 to 3 (%) – Goal 1 The ratio of children age 0 to 3 who are enrolled in school to the total population in that age group. School enrollment rate, children ages 4 to 5 (%) – Goal 1 The ratio of children age 4 and 5 who are enrolled in school to the total population in that age group. School enrollment rate, children ages 6 to 14 (%) – Goal 2 The ratio of children age 6 and 14 who are enrolled in school to the total population in that age group.
Rate of children age 16 who completed the 9th grade (%) – Goal 2 The ratio of children age 16 who complete the lower secondary education (9th grade) to the total population in that age group.
School enrollment rate, children ages 15 to 17 (%) – Goal 3 The ratio of children age 15 to 17 who are enrolled in school to the total population in that age group.
High school enrollment rate, children ages 15 to 17 (%) – Goal 3
The ratio of children age 15 to 17 who are enrolled in secondary education (high school) to the total population in that age group.
School enrollment rate, children with disabilities ages 4 to 17 (%) – Goal 4 The ratio of children age 4 to 17 with disabilities who are enrolled in school to the total population in that age group.
Regular classes enrollments (inclusion rate), children with disabilities ages 4 to 17 (%) – Goal 4 The ratio of school enrollments in regular classes of children with disabilities, pervasive developmental disorders and high ability or giftedness, age 4 to 17, to the total school enrollments of children with disabilities, pervasive developmental disorders and high ability or giftedness, age 4 to 17.

TOOLS FOR PERFORMANCE MANAGEMENT IN EDUCATION
39
Children literacy rate at the end of the 3rd grade (%) – Goal 5 The ratio of children (i) age 9 who are enrolled or completed the 3rd grade of the primary education and can read and write and (ii) age 10 who completed the 3rd grade and can read and write (iii) to the total population in that age group. Full time enrollments rate in basic education (%) – Goal 6 The ratio of school enrollments in full time education (seven daily hours in school activities) to the total school enrollments.
The Basic Education Development Index – IDEB (0 to 10) – Goal 7 IDEB was created to monitor student achievement and progression flows in primary, lower secondary and secondary education. Data are drawn from the School Census and from achievement averages obtained from national standardized tests for Mathematics and Portuguese (Prova Brasil). IDEB assigns a score between zero and 10 to schools and schools networks (i.e., state, municipals and a national score). The national goal is an IDEB equal six.
Adult (ages 15+) literacy rate (%) – Goal 9 The ratio of individuals age 15 and above who can read and write to the total population in that age group. College adjusted net enrollment rate for individuals ages 18 to 24 (%) – Goal 12 The ratio of individuals age 18 to 24 who are enrolled or who completed the tertiary education (college) to the total population in that age group.

TOOLS FOR PERFORMANCE MANAGEMENT IN EDUCATION
40
Figure 1. NPE’s Basic Education monitoring indicators, Brazil (2013)
Source: National Household Sample Survey (IBGE); Populational Census (IBGE) and Basic Education Census (INEP)

TOOLS FOR PERFORMANCE MANAGEMENT IN EDUCATION
41
Figure 2. Basic Education Development Index (IDEB) of Brazilian Municipalities (2007–11)
Source: Ideb/Inep. Note: NPE’s Goal 7 is to reach a national Ideb equal 6.0 in 2024.
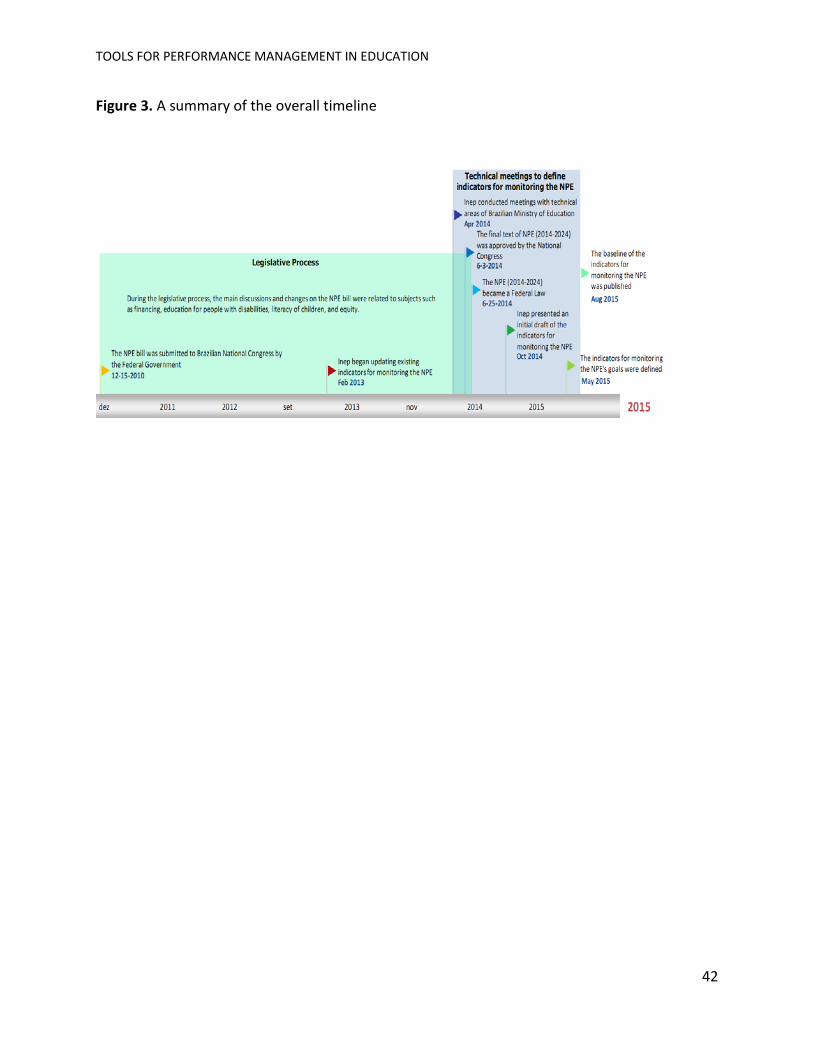
TOOLS FOR PERFORMANCE MANAGEMENT IN EDUCATION
42
Figure 3. A summary of the overall timeline

TOOLS FOR PERFORMANCE MANAGEMENT IN EDUCATION
43
Oklahoma State Department of Education (OSDE) and Office of Management and Enterprise Services (OMES), Oklahoma City, OK
Low Performing schools were identified and then treated through the chain of actions
below. For each low performing school site, offices within the agency were tasked with diagnosing and prescribing specific needs, administering treatment and support for those needs, and running analytics and performing research to assure that the support to schools was working. The data from each step in the action chain flowed to the next step where appropriate actions could be taken based on the previous step’s analyses and outcomes. Figure 1. An Internal Action Chain for Serving Low Performing Schools
OSDE Offices—Check-Up: School Improvement Assessment and
Accountability Educator Effectiveness
OSDE Offices—Check-in: Instruction Special Education Federal Programs Fiscal
OSDE Offices—Run Tests: Policy
Implementation Data Fellow Student Information

TOOLS FOR PERFORMANCE MANAGEMENT IN EDUCATION
44
Figure 2. High and Low Performing Districts by Training Region, 2013
High Performing Districts by Training Region, 2013
Low Performing Districts by Training Region, 2013

TOOLS FOR PERFORMANCE MANAGEMENT IN EDUCATION
45
Figure 3. Districts with Economically Disadvantaged Student Population of 85% or Above
*See chart for disaggregation by site
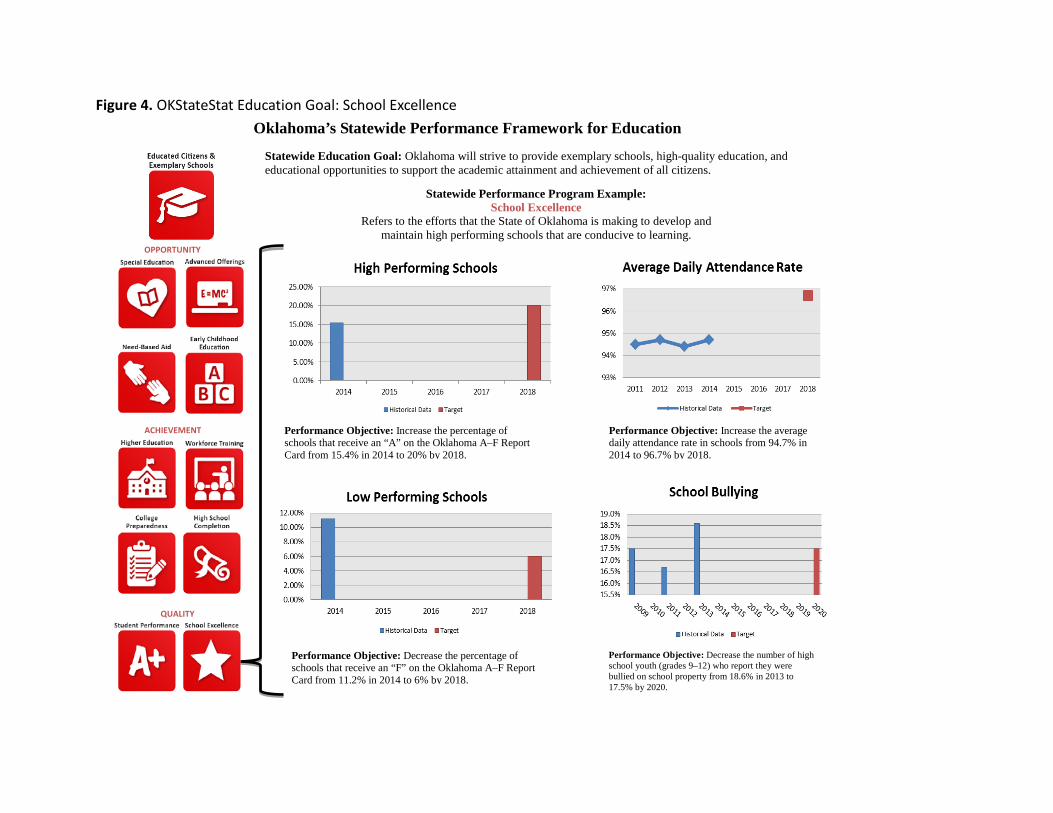
OPPORTUNITY
ACHIEVEMENT
QUALITY
Statewide Education Goal: Oklahoma will strive to provide exemplary schools, high-quality education, and educational opportunities to support the academic attainment and achievement of all citizens.
Performance Objective: Increase the percentage of schools that receive an “A” on the Oklahoma A–F Report Card from 15.4% in 2014 to 20% by 2018.
Performance Objective: Decrease the percentage of schools that receive an “F” on the Oklahoma A–F Report Card from 11.2% in 2014 to 6% by 2018.
Performance Objective: Increase the average daily attendance rate in schools from 94.7% in 2014 to 96.7% by 2018.
Performance Objective: Decrease the number of high school youth (grades 9–12) who report they were bullied on school property from 18.6% in 2013 to 17.5% by 2020.
Oklahoma’s Statewide Performance Framework for Education
Statewide Performance Program Example: School Excellence
Refers to the efforts that the State of Oklahoma is making to develop and maintain high performing schools that are conducive to learning.
Figure 4. OKStateStat Education Goal: School Excellence

Orange County Public Schools, Orlando, FL
Exhibit 1. Division Priority Selection Process
Division Priority Selection Process Teaching and Learning Developed by Research, Accountability, and Grants
Overview of Steps
1. Review OCPS data from BPOs and existing scorecards along with relevant research to
identify performance trends
2. Review results from the stakeholder survey(s)
3. Identify and prioritize strengths, weaknesses, opportunities, and threats
4. SWOT (Strengths, Weaknesses, Opportunities, and Threats) Analysis
5. Synthesize prior data, stakeholder feedback and the SWOT analysis to identify emerging themes
6. Identify and record district priorities in ranked order
Step 1: Review OCPS data from BPOs and existing scorecards along with relevant research to identify performance trends
A. For your division, examine your current scorecards and discuss the following questions:
a. Are the measured objectives the highest priority objectives in your division? b. How well do these objectives align with the district mission and vision? c. What other potential objectives could be selected?
B. After answering the above questions, work with relevant BPOs to collect any
additional data and relevant research that may be important to examine work in your division.
C. Using the current scorecards and additional measurable objectives, find comparable
data from other school districts and nationally. Discuss the following questions: a. How is the district performing on these objectives in relation to comparable
districts or states? b. Which objectives, if improved, will most positively impact the OCPS
vision to be the top producer of successful students in the nation?
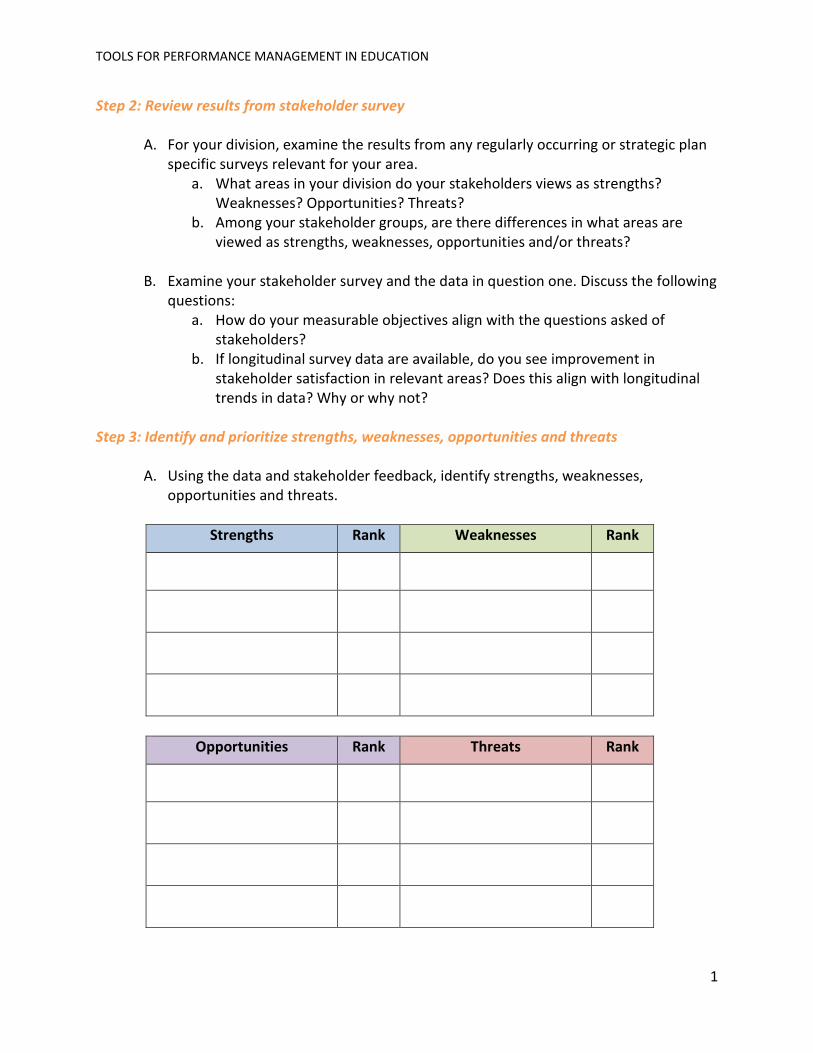
TOOLS FOR PERFORMANCE MANAGEMENT IN EDUCATION
1
Step 2: Review results from stakeholder survey
A. For your division, examine the results from any regularly occurring or strategic plan specific surveys relevant for your area.
a. What areas in your division do your stakeholders views as strengths? Weaknesses? Opportunities? Threats?
b. Among your stakeholder groups, are there differences in what areas are viewed as strengths, weaknesses, opportunities and/or threats?
B. Examine your stakeholder survey and the data in question one. Discuss the following
questions: a. How do your measurable objectives align with the questions asked of
stakeholders? b. If longitudinal survey data are available, do you see improvement in
stakeholder satisfaction in relevant areas? Does this align with longitudinal trends in data? Why or why not?
Step 3: Identify and prioritize strengths, weaknesses, opportunities and threats
A. Using the data and stakeholder feedback, identify strengths, weaknesses, opportunities and threats.
Strengths Rank Weaknesses Rank
Opportunities Rank Threats Rank

TOOLS FOR PERFORMANCE MANAGEMENT IN EDUCATION
2
B. Rank each group of strengths, weaknesses, opportunities, and threats in the tables
above with ‘1’ as the most important in each category. Step 4: SWOT (Strengths, Weaknesses, Opportunities and Threats) Analysis
Taking your prioritized strengths, weaknesses, opportunities, and threats, examine how they interact using the below matrix.
Strengths Weaknesses
Opportunities How can your division use
strengths to take advantage of opportunities?
How can your division overcome weaknesses to
take advantage of opportunities?
Threats How can your division use
strengths to minimize threats?
How can your division overcome weaknesses to
avoid threats?
How can your division use strengths to take advantage of opportunities?
How can your division use strengths to minimize threats?
How can your division overcome weaknesses to take advantage of opportunities?
How can your division overcome weaknesses to avoid threats?

TOOLS FOR PERFORMANCE MANAGEMENT IN EDUCATION
3
Step 5: Synthesize prior data, stakeholder feedback and the SWOT analysis to identify emerging themes
Review your analyses in Steps 1 and 2 along with SWOT rankings to identify emerging themes that support the district vision. Please list these themes in the below table.
Example Analysis: Information gathered in Steps 1 and 2 earlier revealed that students did not receive needed industry certifications. It also revealed that students enrolling in college also had to take remedial courses before they were able to enroll in credit-bearing courses. All stakeholders surveyed (students, parents, and district employees) identified concerns about student preparation.
Themes
Example: Students are not prepared for the workforce Example: Students need remedial courses in college
The themes above will guide in the development of division priorities. A division priority is a broad statement or phrase that reflects a division’s commitment to achieving the district’s vision.
Using the themes above, list potential division priorities in the table below. A division priority should be clear and concise.
Potential Division Priorities
Example: Career and College Readiness

TOOLS FOR PERFORMANCE MANAGEMENT IN EDUCATION
4
Step 6: Identify and record district priorities in ranked order
Record division priorities in ranked order and describe the reasons for selecting them to assist the business plan development group.
Example: Division Priority: Career and College Readiness Rationale for the selection of Career and College Readiness as a division priority
Division Priority 1: Rationale
Division Priority 2:
Rationale
Division Priority 3: Rationale Division Priority 4:
Rationale
Division Priority 5: Rationale

TOOLS FOR PERFORMANCE MANAGEMENT IN EDUCATION
5
Exhibit 2. Business Plan Development Guide Business Plan Development Guide Teaching & Learning Developed by Research, Accountability, and Grants Dr. Gina Tovine, Associate Superintendent
Overview of Steps
1. Review national research and OCPS data
2. Identify performance trends
3. Develop 3 to 5 measureable objectives
4. For each measureable objective, identify one or two main barrier and one or two
root causes
a. Identify barriers to performance b. Prioritize barriers c. Perform Root Cause Analysis using Fishbone Diagram
5. Articulate Theory of Action
6. Identify relevant, efficient, & effective strategies
Steps in Detail
Step 1: Review national research and OCPS data
The first step in the process of developing the business plan is to analyze a comprehensive set of research & data. Silently read through the related Hanover research brief(s) and current OCPS data. Make notes about any patterns or trends to determine opportunities for improvement. The group leader may choose to assign this as independent work ahead of the first discussion meeting.
Step 2: Identify performance trends
At your first team meeting, share out the patterns/trends team members identified in the national research literature. Record the comments on a piece of poster paper or whiteboard where everyone can see them.

TOOLS FOR PERFORMANCE MANAGEMENT IN EDUCATION
6
As a group, determine which patterns or trends are the most meaningful. Star these. Then, describe trends based on analysis of OCPS data. Share and record these as before, starring the most meaningful. Finally, clarify both the national context and your division’s current performance concerning your team’s goal and division priority. Draft a brief narrative (3–5 sentences) describing the most meaningful national research & local data trends that are directly related to your goal and priority. Type this into the Current Condition section at the top of the business plan.
Step 3: Develop 3 to 5 measureable objectives
To keep your measureable objectives on track, a good rule of thumb is that every objective should begin with the word "increase" or a quantifiable synonym such as “expand,” or "decrease" or a quantifiable synonym such as “reduce.”
After all, objectives define how much improvement will take place, and that improvement is either in the form of increasing a statistic—graduation rate, for example—or decreasing a statistic—drop-out rate, for example. If you are simply trying to maintain a statistic, it doesn't belong in the business plan.
The following template will assist in developing a well-written measureable objective:

TOOLS FOR PERFORMANCE MANAGEMENT IN EDUCATION
7
Setting Targets
Targets should be identified by analyzing national, state, and local trends for the specific area addressed in the measurable objective. Targets must be outside of current conditions, but achievable with reasonable effort.
Type your measureable objectives into the appropriate section of the business plan, and then add your baseline data and targets in the columns to the right of each corresponding measureable objective.
Points to Consider
• Remember that you only have 3 to 5 measureable objectives, so they must be broad enough in scope to capture progress toward the priority.
o The “S” in SMART refers to specific in that the objective is clear and unambiguous.
• Think about the fact that the strategic plan is over a span of five years. • Carefully consider pros and cons of measurable objectives that are based on
standards set by outside organizations.
Change desired: ______________________________________________________________________________ In what/ behavior, attitude, etc.: ____________________________________________________________ In who/target population: ___________________________________________________________________ By how much:

TOOLS FOR PERFORMANCE MANAGEMENT IN EDUCATION
8
o For example, career and college readiness standards set by the College Board are updated periodically. How does this affect our ability to track progress?
Example for Division Priority: Continuously improve student achievement in reading.
SMART Measurable Objective: Increase the percent of students scoring a “3” or above on FSA Reading assessments by ____ % by the end of year 2020.
Q: Why is this a good example of a measureable objective? A: This measureable objective meets all of the SMART criteria: it is specific (“percent of students scoring a 3 or above on FSA Reading assessments”), measureable (“increase by ____ %”), achievable (assuming the “____ %” is within reach based on national research and local trends), relevant (directly addresses the division priority), and time-bound (“by the end of the year 2020”).
Poor Measureable Objective: Improve reading comprehension and fluency by using Read 180. Q: Why is this a poor example of a measureable objective?
A: Although it includes the desired change, it neglects all of the other components of a SMART measureable objective. In addition, it includes a specific strategy that does not belong in the measureable objective section. Let’s review the SMART requirements: S – This objective is not clear. We cannot determine what exactly is expected or the requirements for meeting the objective. Note: naming a specific strategy within the objective does not count as specific! M – We have no measure or indicator to tell if we reached “improvement.” How will we know when we’ve improved comprehension or fluency? A – This objective does meet the achievable criterion because it is so vague. It will be easy to argue that we improved in general if we don’t specify a target. R – If the District does not support or provide Read 180, this objective will not be relevant.
T – There is no deadline listed, so this objective does not satisfy the time-bound requirement of SMART. Step 4: For each measureable objective, identify one or two main barriers and one or two root causes

TOOLS FOR PERFORMANCE MANAGEMENT IN EDUCATION
9
First, brainstorm and list all of the barriers to the objective. Barriers need to be broad and focused; they should be wide enough to capture ideas without containing all of the specific details.
• On chart paper, the group will brainstorm all potential barriers for each objective. Combine similar barriers.
• After all barriers are listed, take the total count of barriers. Divide the number by 3 to get the number that each individual will need to select as a barrier.
Then, prioritize barriers—which barrier, if removed or reduced, would have the largest positive impact on the District? This is the top barrier or “Problem.”
• Each participant selects the determined number (total/3) of their top choices. • Compile all individual responses to organize group top barriers. • Rank the barriers based on total number of individual responses. • Identify the top barrier, also called the Problem.
Sometimes there might be more than one top barrier—a tie. In that case, combine the two top barriers into one main Problem, if possible. You may need to go through Step 4 twice, if your team cannot combine the two top barriers. For each problem, perform a root cause analysis by completing a fishbone diagram.

TOOLS FOR PERFORMANCE MANAGEMENT IN EDUCATION
10

TOOLS FOR PERFORMANCE MANAGEMENT IN EDUCATION
11
Root Cause Analysis Process – Fishbone Diagram
1. Identify the problem. This is the top barrier to the measureable objective. Write that in the “head” of the fish on the far right.
Methods Environment People
Materials Equipment (IT) Measurements
Problem
Cause
CauseCause
Cause
Cause
CauseCause
Cause
SecondaryCause
SecondaryCause
SecondaryCause
Cause
Cause Cause
2. Select one of the bones of the fish (example categories listed below). Your team may choose different categories.
Example Category

TOOLS FOR PERFORMANCE MANAGEMENT IN EDUCATION
12
a. Ask why that bone would create the problem. Discuss and reach consensus on the primary reason(s) the bone would cause the problem. These are called “causes” and are represented by smaller bones stemming off of the large bone.
i. Stay focused on primary reasons which have large impact. ii. Use the 80/20 rule (roughly 80% of the effects come from 20%
of the causes).
b. Ask “Why” about each of the answer(s) provided in part a. above. Again, stay focused on the primary reasons. Each of these is a “secondary cause” and is represented by even smaller bones.
• Ask “Why” 5 times • Rule of Thumb—you may ask “Why” fewer or more than 5 times • Moves you from symptoms to causes • Keep asking “Why?” until you get to a root cause—stop
where you can still take action • You may find multiple root causes • Avoid the “5 Whos” which leads to root blame
There are 2 types of Whys. Both are ok to include in the Fishbone, but the speculative whys, if identified as root causes to address, will need to be validated with data. Speculative Why – You think it’s true
• No specific evidence • Limited value
Validated Why – You know it’s true
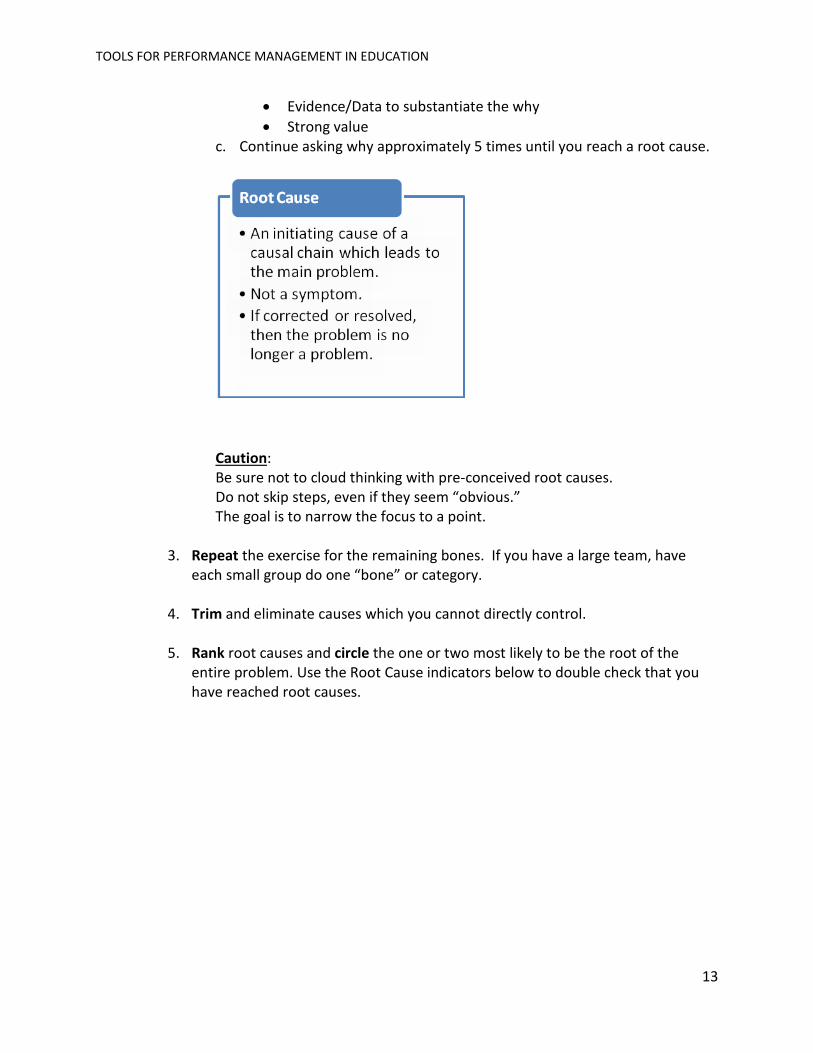
TOOLS FOR PERFORMANCE MANAGEMENT IN EDUCATION
13
• Evidence/Data to substantiate the why • Strong value
c. Continue asking why approximately 5 times until you reach a root cause.
Caution: Be sure not to cloud thinking with pre-conceived root causes. Do not skip steps, even if they seem “obvious.” The goal is to narrow the focus to a point.
3. Repeat the exercise for the remaining bones. If you have a large team, have each small group do one “bone” or category.
4. Trim and eliminate causes which you cannot directly control.
5. Rank root causes and circle the one or two most likely to be the root of the entire problem. Use the Root Cause indicators below to double check that you have reached root causes.

TOOLS FOR PERFORMANCE MANAGEMENT IN EDUCATION
14
Example from a school district in New Jersey: “Using an Ishikawa (fishbone) diagram, we conducted a cause-and-effect analysis (fig. 3). After brainstorming why students are absent or tardy, we grouped reasons into four categories: outside influences, staff, student, and system. Whenever a cause was given, the team asked “Why?” Asking this question repeatedly forced us to step back and keep searching until we were left only with root causes. In Figure 3, each arrow connected to the central (bone) line had “Why?” asked again and again until there were no more whys to ask. The answers to these why questions are indented under the first idea. The last answer (in bold face in the figure) generally indicates the cause, not the symptom. It took great patience to probe in such a way, so different from the modus operandi of school systems. In education the tendency to address symptoms, not causes, is the reason the same problems resurface in other forms later on” (Abernethy & Serfass, 1992, p. 16). Ishikawa (Fishbone) Diagram of Root Causes of Nonattendance


Step 5: Articulate Theory of Action
Example 1: If we increase the frequency with which teachers employ effective questioning in reading lessons every day, then we will increase the percent of students scoring a “3” or above on FSA Reading assessments by ____ % by the end of year 2020.
Example 2: Through consistency and improvement in areas relative to writing scoring, writing methodology and integration of writing, student performance in writing will increase. A comprehensive writing plan and quality staff development will be vehicles that enable us to accomplish this goal. Develop a theory of action for each problem/root cause.
Type these into the Current Conditions section of the business plan.

TOOLS FOR PERFORMANCE MANAGEMENT IN EDUCATION
1
Step 6: Identify relevant, efficient, & effective strategies
The root causes identified in Step 4 will naturally lead to strategies.
For example, if the highest ranked root cause for the problem of low achievement scores on the FSA Reading assessments is that teachers are not employing effective questioning in reading lessons every day, then a strategy might be to provide professional development for how to identify and consistently ask effective questions.
Use the strategy criteria below to double check that you have developed relevant, affordable, & effective strategies.
Business plans should clearly identify specific resources, funds/sources and start/end dates that are highly correlated to strategies and each other. Type strategies and corresponding details into the Strategies section of the business plan.

TOOLS FOR PERFORMANCE MANAGEMENT IN EDUCATION
2
TOOLS FOR PERFORMANCE MANAGEMENT IN EDUCATION
3
Resources
Abernethy, P. E. & Serfass, R. W. (1992). One district's quality improvement story. Educational
Leadership, 50(3), 1417. ASCD. Retrieved from
http://www.ascd.org/publications/educational-leadership/nov92/vol50/num03/One-
District%27s-Quality-Improvement-Story.aspx.
Ammerman, M. (1998). The root cause analysis handbook: A simplified approach to identifying,
correcting and reporting workplace errors, 6667. New York: Quality Resources.
Childress, S. M., Doyle, D. P., & Thomas, D. A. (2009). Leading for equity: The pursuit of
excellence in Montgomery County Public Schools. Cambridge, MA: Harvard Education
Press.
Conzemius, A. & O’Neill, J. (2002). The handbook for SMART school teams. Bloomington, IN:
Solution Tree.
Florida Bureau of School Improvement. (2014). DA Summer Academy Module 1 Presentation.
Retreived from https://www.floridacims.org/downloads/88.
Liker, J. K. & Meier, D. (2005). The Toyota way field book, 341355. New York, NY: McGraw-Hill.
Smith, M. & Sarber, S. (2011). APS Root Cause Analysis guide. Arlington, VA: Arlington Public
Schools. Retrieved from www.apsva.us.
Yemm, Graham (2013). Essential guide to leading your team : How to set goals, measure
performance and reward talent. New York, NY: Pearson Education.
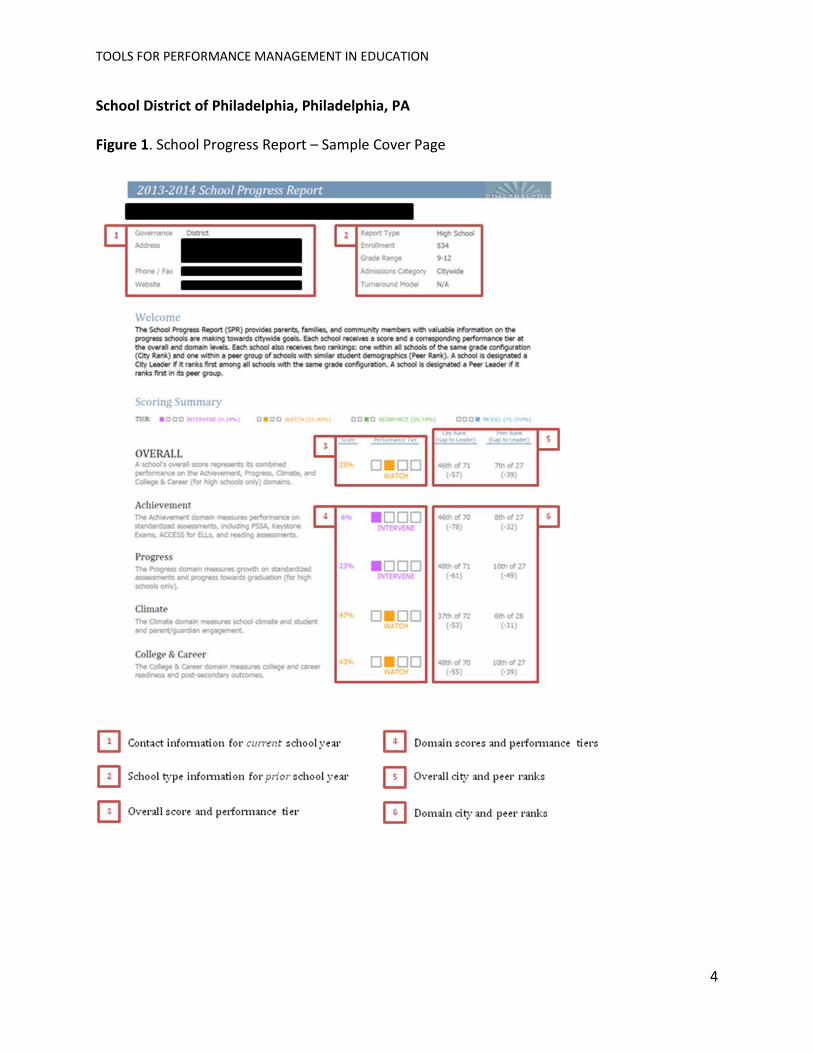
TOOLS FOR PERFORMANCE MANAGEMENT IN EDUCATION
4
School District of Philadelphia, Philadelphia, PA
Figure 1. School Progress Report – Sample Cover Page
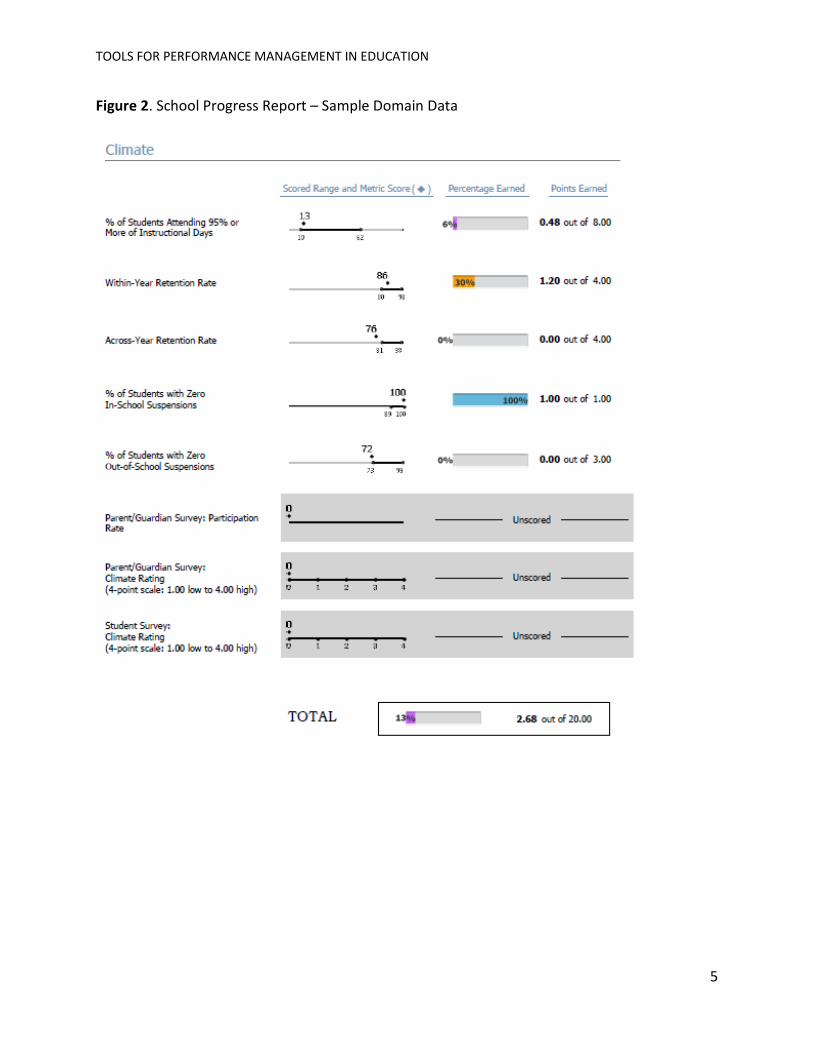
TOOLS FOR PERFORMANCE MANAGEMENT IN EDUCATION
5
Figure 2. School Progress Report – Sample Domain Data