top 50 data interpretation for ibps rrb clerk pre 2021
TRANSCRIPT

Top 50 Data Interpretation for IBPS RRB Clerk Pre 2021
(Based on 08th Aug 2021 Exam) – English Version
Click Here For Grand Bundle PDF Course Combo (Prelims + Mains) 2021 Click Here to Subscribe Our Yearly Platinum Package
Follow us: Telegram , Facebook , Twitter , Instagram 1
Click Here for IBPS RRB Clerk Prelims Test Series 2021
Click Here for IBPS RRB Clerk Prelims Bundle PDF Course
Top 50 Data Interpretation for IBPS RRB Clerk Pre 2021
(Based on 08th Aug 2021 Exam) – English Version
Click Here For Grand Bundle PDF Course Combo (Prelims + Mains) 2021 Click Here to Subscribe Our Yearly Platinum Package
Follow us: Telegram , Facebook , Twitter , Instagram 2
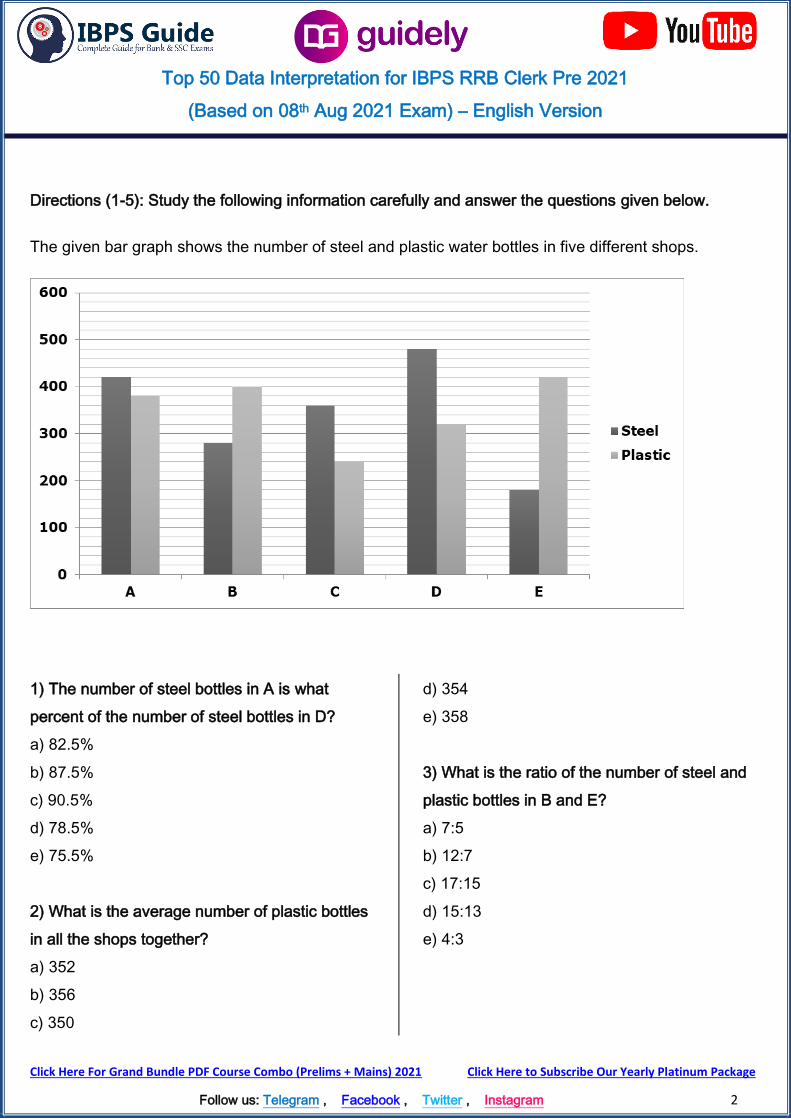
Directions (1-5): Study the following information carefully and answer the questions given below.
The given bar graph shows the number of steel and plastic water bottles in five different shops.
1) The number of steel bottles in A is what
percent of the number of steel bottles in D?
a) 82.5%
b) 87.5%
c) 90.5%
d) 78.5%
e) 75.5%
2) What is the average number of plastic bottles
in all the shops together?
a) 352
b) 356
c) 350
d) 354
e) 358
3) What is the ratio of the number of steel and
plastic bottles in B and E?
a) 7:5
b) 12:7
c) 17:15
d) 15:13
e) 4:3

Top 50 Data Interpretation for IBPS RRB Clerk Pre 2021
(Based on 08th Aug 2021 Exam) – English Version
Click Here For Grand Bundle PDF Course Combo (Prelims + Mains) 2021 Click Here to Subscribe Our Yearly Platinum Package
Follow us: Telegram , Facebook , Twitter , Instagram 3
4) The number of plastic bottles in A and C
together is what percent of the number of steel
bottles in C and D together?
a) 73.8%
b) 75.9%
c) 77.3%
d) 79.5%
e) 71.4%
5) What is the ratio of the number of steel bottles
in A and E together to the number of plastic
bottles in B and E together?
a) 29:39
b) 30:37
c) 29:37
d) 30:41
e) 29:41
Directions (6-10): Study the following information carefully and answer the questions given below.
The given line graph shows the number of CSE and ECE students in five different colleges.
6) What is the ratio of the number of ECE and
CSE students in A and E?
a) 26:27
b) 28:29
c) 29:30
d) 25:26
e) 24:25
7) The number of CSE students in C is what
percent of the number of ECE students in B?

Top 50 Data Interpretation for IBPS RRB Clerk Pre 2021
(Based on 08th Aug 2021 Exam) – English Version
Click Here For Grand Bundle PDF Course Combo (Prelims + Mains) 2021 Click Here to Subscribe Our Yearly Platinum Package
Follow us: Telegram , Facebook , Twitter , Instagram 4
a) 122.22%
b) 133.33%
c) 144.44%
d) 111.11%
e) 155.55%
8) What is the average number of CSE students
in all the colleges together?
a) 258
b) 268
c) 272
d) 278
e) 262
9) What is the difference between the number of
ECE students in C and D together and the
number of CSE students in B and E together?
a) 100
b) 120
c) 80
d) 90
e) 110
10) The number of ECE and CSE students in B
is approximately what percent of the number of
ECE and CSE students in D?
a) 82%
b) 85%
c) 88%
d) 91%
e) 94%
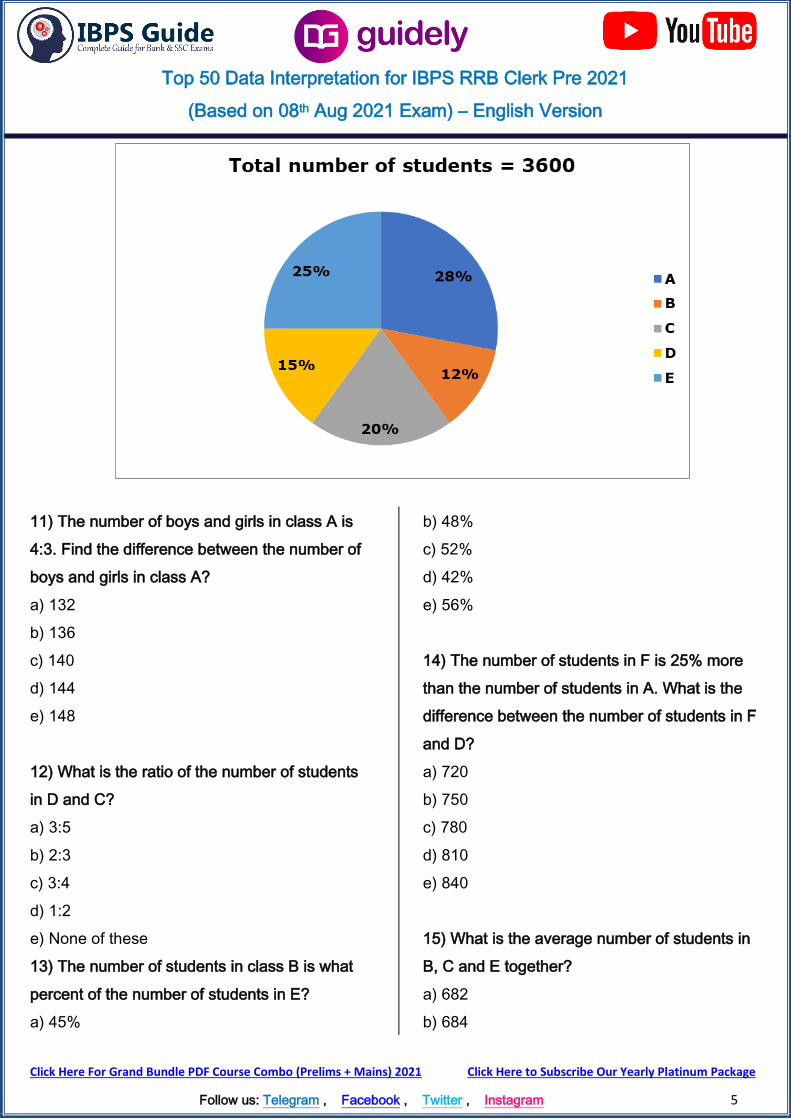
Directions (11-15): Study the following information carefully and answer the questions given below.
The given pie chart shows the number of students in five different classes.
Top 50 Data Interpretation for IBPS RRB Clerk Pre 2021
(Based on 08th Aug 2021 Exam) – English Version
Click Here For Grand Bundle PDF Course Combo (Prelims + Mains) 2021 Click Here to Subscribe Our Yearly Platinum Package
Follow us: Telegram , Facebook , Twitter , Instagram 5
11) The number of boys and girls in class A is
4:3. Find the difference between the number of
boys and girls in class A?
a) 132
b) 136
c) 140
d) 144
e) 148
12) What is the ratio of the number of students
in D and C?
a) 3:5
b) 2:3
c) 3:4
d) 1:2
e) None of these
13) The number of students in class B is what
percent of the number of students in E?
a) 45%
b) 48%
c) 52%
d) 42%
e) 56%
14) The number of students in F is 25% more
than the number of students in A. What is the
difference between the number of students in F
and D?
a) 720
b) 750
c) 780
d) 810
e) 840
15) What is the average number of students in
B, C and E together?
a) 682
b) 684

Top 50 Data Interpretation for IBPS RRB Clerk Pre 2021
(Based on 08th Aug 2021 Exam) – English Version
Click Here For Grand Bundle PDF Course Combo (Prelims + Mains) 2021 Click Here to Subscribe Our Yearly Platinum Package
Follow us: Telegram , Facebook , Twitter , Instagram 6
c) 688
d) 690
e) 680
Directions (16-20): Read the following information carefully and answer the questions.
The given bar graph shows the total number of photos and videos posted by five different persons (A, B,
C, D and E) in the year 2000 and also given the total number of photos posted by five persons in the year
2000.
16) If the average number of videos posted by F
and B is 150 and then find the ratio of the total
number of videos posted by F and photos
posted by C?
a) 1:2
b) 3:4
c) 6:5
d) 8:7
e) None of these
17) The total number of photos and videos
posted by C is how much more/less than the
total number of photos posted by E and D?
a) 150 less
b) 190 more
c) 110 less
d) 160 more
e) None of these
18) The total number of photos posted by A and
D together is what percentage of the total
number of photos and videos posted by E?
Top 50 Data Interpretation for IBPS RRB Clerk Pre 2021
(Based on 08th Aug 2021 Exam) – English Version
Click Here For Grand Bundle PDF Course Combo (Prelims + Mains) 2021 Click Here to Subscribe Our Yearly Platinum Package
Follow us: Telegram , Facebook , Twitter , Instagram 7
a) 25%
b) 60%
c) 40%
d) 35%
e) None of these
19) If the total number of photos and videos
posted by B in the year 2001 is 40 more and 20
less than that of 2000 respectively and then find
the total number of photos and videos posted by
B in the year 2001?
a) 240
b) 220
c) 260
d) 280
e) None of these
20) Find the difference between the total number
of photos and videos together posted by A and
B?
a) 240
b) 180
c) 200
d) 120
e) None of these
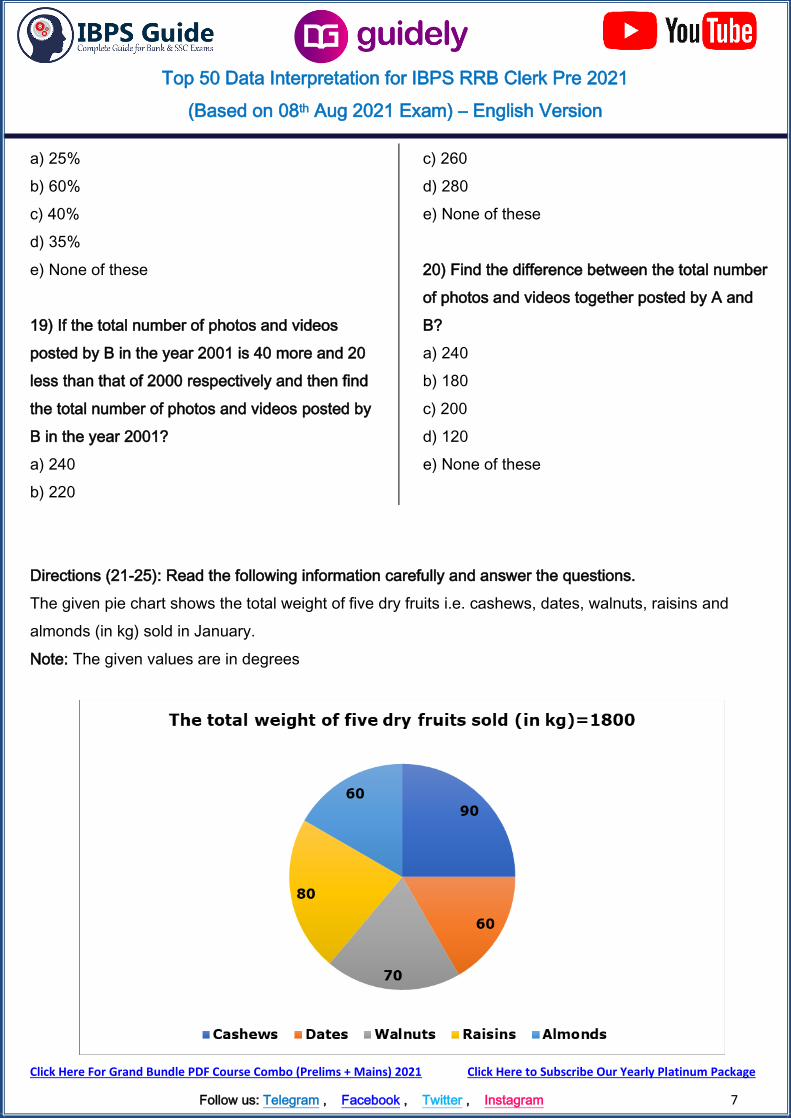
Directions (21-25): Read the following information carefully and answer the questions.
The given pie chart shows the total weight of five dry fruits i.e. cashews, dates, walnuts, raisins and
almonds (in kg) sold in January.
Note: The given values are in degrees
Top 50 Data Interpretation for IBPS RRB Clerk Pre 2021
(Based on 08th Aug 2021 Exam) – English Version
Click Here For Grand Bundle PDF Course Combo (Prelims + Mains) 2021 Click Here to Subscribe Our Yearly Platinum Package
Follow us: Telegram , Facebook , Twitter , Instagram 8
21) If the total weight of walnuts sold in March is
28.56% more than that of January and then the
total weight of walnuts sold in March is what
percentage of the total weight of dates sold in
January?
a) 180%
b) 150%
c) 120%
d) 190%
e) None of these
22) Out of the total weight of cashews sold,
33.33% of the cashews sold for males and then
find the total weight of cashews sold for
females?
a) 300
b) 280
c) 150
d) 360
e) None of these
23) Find the difference between the total weight
of raisins and almonds sold in January?
a) 70
b) 120
c) 90
d) 100
e) None of these
24) The total weight of cashews sold is what
percentage more than the total weight of dates
sold?
a) 70%
b) 60%
c) 50%
d) 20%
e) None of these
25) If the selling price of walnuts is Rs.160 per
kg and then find 12.5% of the total revenue
generated by selling walnuts in January?
a) Rs.3600
b) Rs.7000
c) Rs.2800
d) Rs.4500
e) None of these
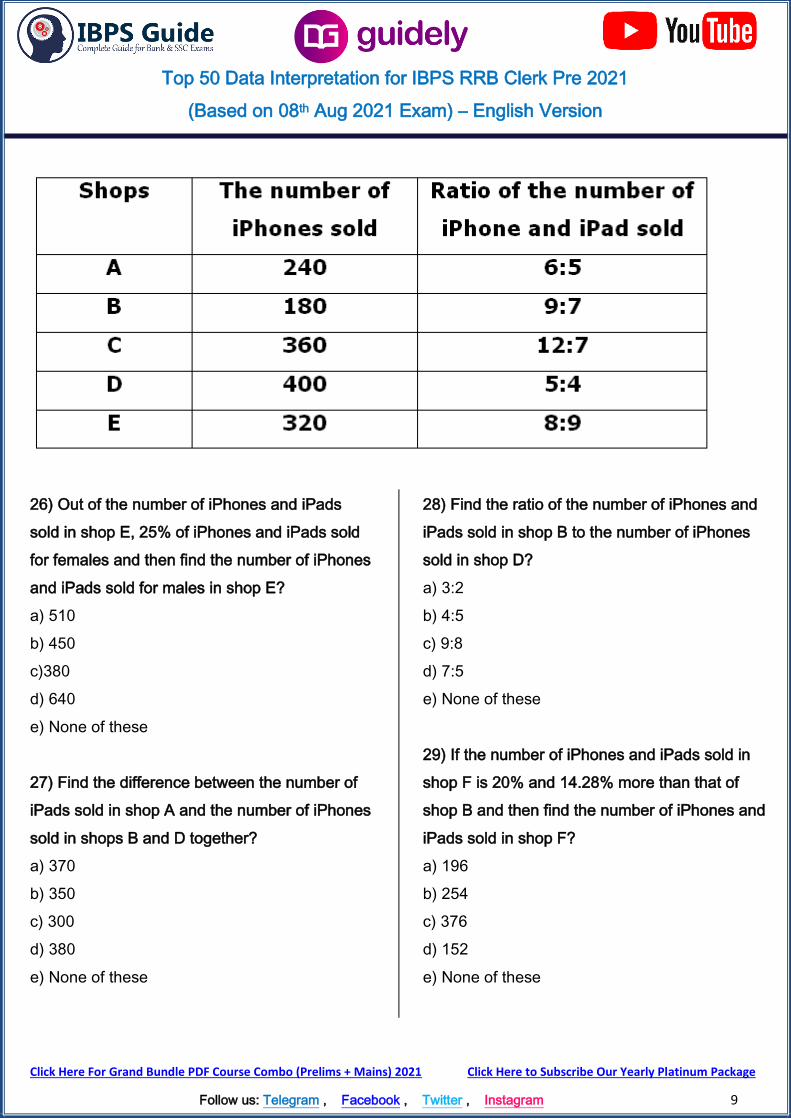
Directions (26-30): Read the following information carefully and answer the questions.
The given table chart shows the number of iPhones sold in five different shops (A, B, C, D and E) and
also given the ratio of the number of iPhones and iPads sold in five different shops.
Top 50 Data Interpretation for IBPS RRB Clerk Pre 2021
(Based on 08th Aug 2021 Exam) – English Version
Click Here For Grand Bundle PDF Course Combo (Prelims + Mains) 2021 Click Here to Subscribe Our Yearly Platinum Package
Follow us: Telegram , Facebook , Twitter , Instagram 9
26) Out of the number of iPhones and iPads
sold in shop E, 25% of iPhones and iPads sold
for females and then find the number of iPhones
and iPads sold for males in shop E?
a) 510
b) 450
c)380
d) 640
e) None of these
27) Find the difference between the number of
iPads sold in shop A and the number of iPhones
sold in shops B and D together?
a) 370
b) 350
c) 300
d) 380
e) None of these
28) Find the ratio of the number of iPhones and
iPads sold in shop B to the number of iPhones
sold in shop D?
a) 3:2
b) 4:5
c) 9:8
d) 7:5
e) None of these
29) If the number of iPhones and iPads sold in
shop F is 20% and 14.28% more than that of
shop B and then find the number of iPhones and
iPads sold in shop F?
a) 196
b) 254
c) 376
d) 152
e) None of these

Top 50 Data Interpretation for IBPS RRB Clerk Pre 2021
(Based on 08th Aug 2021 Exam) – English Version
Click Here For Grand Bundle PDF Course Combo (Prelims + Mains) 2021 Click Here to Subscribe Our Yearly Platinum Package
Follow us: Telegram , Facebook , Twitter , Instagram 10
30) The number of iPads sold in shop B is what
percentage of the number of iPhones sold in
shop D?
a) 35%
b) 20%
c) 15%
d) 50%
e) None of these
Directions (31-35): Read the following information carefully and answer the questions.
The given line graph shows the number of round and square tables sold on five different days in a week
i.e. Monday, Tuesday, Wednesday, Thursday and Friday.
31) If 2/3 and 3/8 of the round and square tables
sold on Monday are wood and then find the sum
of the number of round and square tables sold
on Monday are other than wood?
a) 42
b) 36
c) 54
d) 48
e) None of these
32) The number of square tables sold on
Monday is how much percentage more than the
number of round tables sold on Thursday?
a) 40%
b) 25%
c) 60%

Top 50 Data Interpretation for IBPS RRB Clerk Pre 2021
(Based on 08th Aug 2021 Exam) – English Version
Click Here For Grand Bundle PDF Course Combo (Prelims + Mains) 2021 Click Here to Subscribe Our Yearly Platinum Package
Follow us: Telegram , Facebook , Twitter , Instagram 11
d) 15%
e) None of these
33) If the selling price of each round table on
Friday is Rs.2000 and all the square tables sold
for Rs.30000 on Friday and then find the
difference between the selling price of a round
and square table on Friday?
a) Rs.300
b) Rs.400
c) Rs.250
d) Rs.500
e) None of these
34) Find the ratio of the number of round and
square tables sold on Tuesday to Wednesday?
a) 3:2
b) 5:4
c) 6:7
d) 8:5
e) None of these
35) Find the difference between the number of
round and square tables sold on Thursday and
the number of square tables sold on Wednesday
and Friday together?
a) 26
b) 22
c) 24
d) 20
e) None of these
Directions (36-40): Read the following information carefully and answer the questions.
The given table chart shows the total number of online and offline shoppers (males and females) in four
different cities i.e. A, B, C and D.
The total number of shoppers=Men + Women
Top 50 Data Interpretation for IBPS RRB Clerk Pre 2021
(Based on 08th Aug 2021 Exam) – English Version
Click Here For Grand Bundle PDF Course Combo (Prelims + Mains) 2021 Click Here to Subscribe Our Yearly Platinum Package
Follow us: Telegram , Facebook , Twitter , Instagram 12
36) The number of online women shoppers in
cities B and C together is how much more than
the number of offline men shoppers in cities B
and D?
a) 250 more
b) 150 less
c) 210 less
d) 180 more
e) None of these
37) If the total number of online and offline
shoppers in city E is 25% less and 40% more
than that of city C and then find the total number
of online and offline shoppers in city E?
a) 280
b) 350
c) 440
d) 500
e) None of these
38) Find the ratio of the maximum number of
shoppers in the city and the minimum number of
shoppers in the city (both online and offline)?
a) 20:13
b) 31:19
c) 15:7
d) 17:12
e) None of these
39) Find the total number of online and offline
men shoppers in cities A and C?
a) 270
b) 510
c) 330
d) 450
e) None of these
40) The number of offline women shoppers in
cities B and D is what percentage more than the
number of online men shoppers in city B?
a) 20%
b) 55%
c) 10%
d) 35%
e) None of these
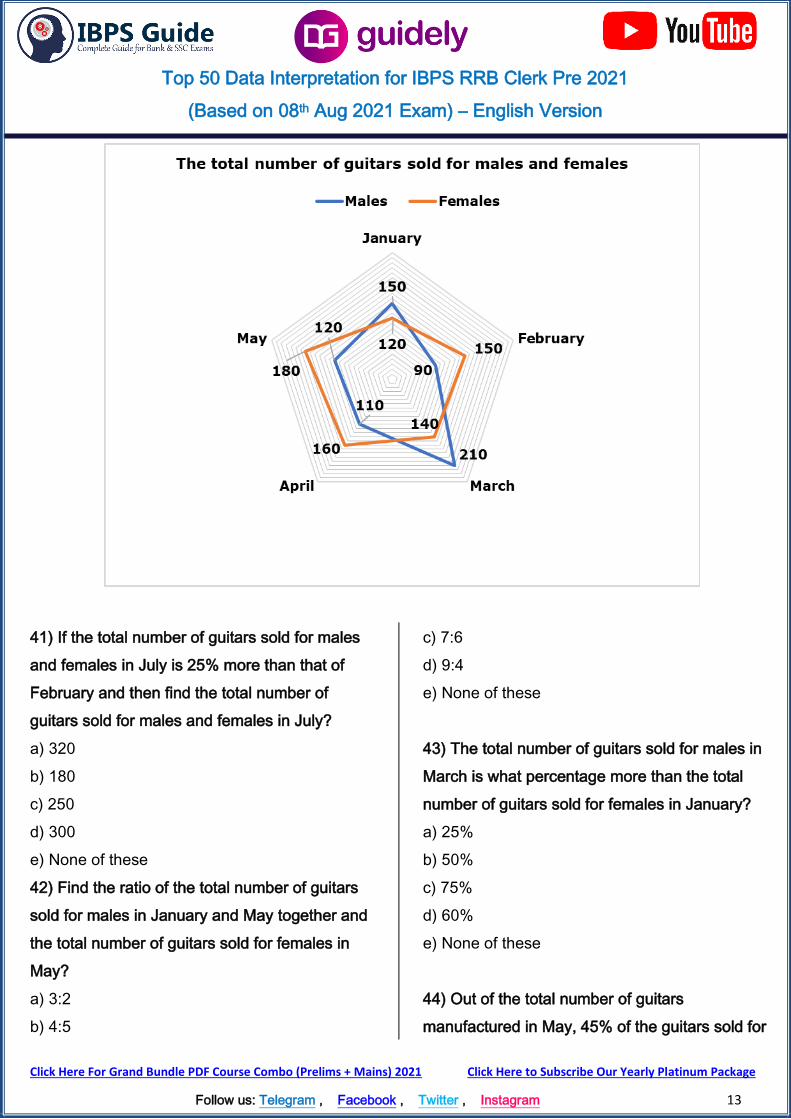
Directions (41-45): Read the following information carefully and answer the questions.
The given radar graph shows the total number of guitars sold for males and females in five different
months (January, February, March, April and May).
Top 50 Data Interpretation for IBPS RRB Clerk Pre 2021
(Based on 08th Aug 2021 Exam) – English Version
Click Here For Grand Bundle PDF Course Combo (Prelims + Mains) 2021 Click Here to Subscribe Our Yearly Platinum Package
Follow us: Telegram , Facebook , Twitter , Instagram 13
41) If the total number of guitars sold for males
and females in July is 25% more than that of
February and then find the total number of
guitars sold for males and females in July?
a) 320
b) 180
c) 250
d) 300
e) None of these
42) Find the ratio of the total number of guitars
sold for males in January and May together and
the total number of guitars sold for females in
May?
a) 3:2
b) 4:5
c) 7:6
d) 9:4
e) None of these
43) The total number of guitars sold for males in
March is what percentage more than the total
number of guitars sold for females in January?
a) 25%
b) 50%
c) 75%
d) 60%
e) None of these
44) Out of the total number of guitars
manufactured in May, 45% of the guitars sold for

Top 50 Data Interpretation for IBPS RRB Clerk Pre 2021
(Based on 08th Aug 2021 Exam) – English Version
Click Here For Grand Bundle PDF Course Combo (Prelims + Mains) 2021 Click Here to Subscribe Our Yearly Platinum Package
Follow us: Telegram , Facebook , Twitter , Instagram 14
females and then find the total number of guitars
unsold in May?
a) 210
b) 100
c) 300
d) 180
e) None of these
45) The total number of guitars sold for males
and females in April is how much less than the
total number of guitars sold for females in
February?
a) 160
b) 110
c) 150
d) 120
e) None of these
Directions (46-50): Study the following information carefully and answer the questions given below.
The given line graph shows the total number of posts (Facebook and Instagram) shared by six different
persons.
46) What is the ratio of the total number of posts
shared by Karan to David?
a) 3:4
b) 4:5
c) 2:3
d) 5:6
e) None of these
47) The number of posts shared by sharu is
25% more than that of Nila and the number of

Top 50 Data Interpretation for IBPS RRB Clerk Pre 2021
(Based on 08th Aug 2021 Exam) – English Version
Click Here For Grand Bundle PDF Course Combo (Prelims + Mains) 2021 Click Here to Subscribe Our Yearly Platinum Package
Follow us: Telegram , Facebook , Twitter , Instagram 15
posts shared by Anu is 26 more than the
number of posts shared by Pavani. Find the
difference between the number of posts share
by Anu and Sharu?
a) 35
b) 40
c) 50
d) 45
e) 30
48) Ratio of the number of facebook and
instagram posts shared by Anil and Karan is 3:2
and 5:3 respectively. Find the total number of
facebook posts shared by Anil and Karan?
a) 120
b) 140
c) 150
d) 170
e) 190
49) Total number of posts share by Pavani is
what percent of the number of posts shared by
Ezhil?
a) 85.35%
b) 86.36%
c) 87.87%
d) 88.88%
e) 89.89%
50) The number of instagram posts shared by
Nila is 45% of the total number of posts shared
by David. Find the number of Facebook posts
shared by Nila?
a) 25
b) 15
c) 20
d) 30
e) 35
Answer With Explanation
1) Answer: B
Required percentage = 420/480 * 100
= 87.5%
2) Answer: A
Required average = (380 + 400 + 240 + 320 +
420)/5
= 352
3) Answer: C
Required ratio = (280 + 400):(180 + 420)
= 680:600
= 17:15
4) Answer: A
Required percentage = (380 + 240)/(360 + 480)
* 100
=620*100/840 = 73.8%
5) Answer: D
Required ratio = (420 + 180):(400 + 420)

Top 50 Data Interpretation for IBPS RRB Clerk Pre 2021
(Based on 08th Aug 2021 Exam) – English Version
Click Here For Grand Bundle PDF Course Combo (Prelims + Mains) 2021 Click Here to Subscribe Our Yearly Platinum Package
Follow us: Telegram , Facebook , Twitter , Instagram 16
= 600:820
= 30:41
6) Answer: A
Required ratio = (200 + 320):(220 + 320)
= 520:540
= 26:27
7) Answer: B
Required percentage = 240/180 * 100
= 133.33%
8) Answer: C
Required average = (320 + 280 + 240 + 300 +
220)/5
= 272
9) Answer: A
Required difference = (360 + 240) – (220 + 280)
= 100
10) Answer: B
Required percentage = (280 + 180)/(240 + 300)
* 100
=460*100/540 = 85%
11) Answer: D
Required difference = 1/7 * 28/100 * 3600 = 144
12) Answer: C
Required ratio = 15:20
= 3:4
13) Answer: B
Required percentage = 12/25 * 100
= 48%
14) Answer: A
Required difference = (28 * 125/100 – 15)/100 *
3600
= 720
15) Answer: B
Required average = (12 + 20 + 25)/300 * 3600
= 684
16) Answer: A
The total number of photos and videos posted
by B=240
The total number of videos posted by B=240-
120=120
The total number of videos posted by B and
F=150*2=300
The total number of videos posted by F=300-
120=180
The total number of photos posted by C=360
Required ratio=180:360=1:2
17) Answer: D
The total number of photos and videos posted
by C=560
The total number of photos posted by D and
E=160+240=400
Required difference=560-400=160 more
18) Answer: B

Top 50 Data Interpretation for IBPS RRB Clerk Pre 2021
(Based on 08th Aug 2021 Exam) – English Version
Click Here For Grand Bundle PDF Course Combo (Prelims + Mains) 2021 Click Here to Subscribe Our Yearly Platinum Package
Follow us: Telegram , Facebook , Twitter , Instagram 17
The total number of photos posted by A and
D=200+160=360
The total number of photos and videos posted
by E=600
Required percentage=360/600*100=60%
19) Answer: C
The total number of photos and videos posted
by B in the year 2000=240
The total number of photos and videos posted
by B in the year 2001=240+40-20=260
20) Answer: A
Required difference=480-240=240
21) Answer: B
The total weight of walnuts sold in January=70%
of 1800=70*1800/360=70*5=350
The total weight of walnuts sold in
March=350*9/7=450
The total weight of dates sold in January=60% of
1800=60*5=300
Required percentage=450/300*100=150%
22) Answer: A
The total weight of cashews sold=90% of
1800=90*1800/360=90*5=450
The total weight of cashews sold for
females=450*2/3=300
23) Answer: D
The total weight of raisins sold in January=80%
of 1800=80*5=400
The total weight of almonds sold in
January=60% of 1800=60*5=300
Required difference=400-300=100
24) Answer: C
The total weight of cashews sold=90% of
1800=90*1800/360=90*5=450
The total weight of dates sold=60% of
1800=60*5=300
Required percentage=(450-
300)/300*100=150/3=50%
25) Answer: B
The total weight of walnuts sold=70% of
1800=70*5=350
The 12.5% of the total revenue generated by
walnuts sold=350*160/8=Rs.7000
26) Answer: A
The number of iPhones sold in shop E=320
The number of iPads sold in shop
E=320/8*9=360
The number of iPhones and iPads sold in shop
E=320+360=680
The number of iPhones and iPads sold for
males in shop E=680*3/4=510
27) Answer: D
The number of iPhones sold in shops B and
D=180+400=580
The number of iPhones sold in shop A=240
The number of iPads sold in shop
A=240*5/6=200

Top 50 Data Interpretation for IBPS RRB Clerk Pre 2021
(Based on 08th Aug 2021 Exam) – English Version
Click Here For Grand Bundle PDF Course Combo (Prelims + Mains) 2021 Click Here to Subscribe Our Yearly Platinum Package
Follow us: Telegram , Facebook , Twitter , Instagram 18
Required difference=580-200=380
28) Answer: B
The number of iPhones sold in shop B=180
The number of iPhones and iPads sold in shop
B=180/9*16=320
The number of iPhones sold in shop D=400
Required ratio=320:400=4:5
29) Answer: C
The number of iPhones sold in shop B=180
The number of iPhones sold in shop
F=180*6/5=216
The number of iPads sold in shop
B=180*7/9=140
The number of iPads sold in shop
F=140*8/7=160
Required sum=216+160=376
30) Answer: A
The number of iPhones sold in shop D=400
The number of iPhones sold in shop B=180
The number of iPads sold in shop
B=180*7/9=140
Required ratio=140/400*100=35%
31) Answer: A
The number of round tables sold on Monday=36
The number of round tables sold on Monday is
other than wood=36*1/3=12
The number of square tables sold on
Monday=48
The number of square tables sold on Monday is
other than wood=48*5/8=30
Required sum=12+30=42
32) Answer: C
Required percentage=(48-
30)/30*100=18/30*100=60% more
33) Answer: D
All the square tables sold on Friday=Rs.30000
The selling price of each square table on
Friday=30000/20=Rs.1500
Required difference=2000-1500=Rs.500
34) Answer: B
The number of round and square tables sold on
Tuesday=52+28=80
The number of round and square tables sold on
Wednesday=24+40=64
Required ratio=80:64=5:4
35) Answer: A
The number of round and square tables sold on
Thursday=30+56=86
The number of square tables sold on
Wednesday and Friday=40+20=60
Required difference=86-60=26
36) Answer: D
The number of online women shoppers in city
B=350-200=150

Top 50 Data Interpretation for IBPS RRB Clerk Pre 2021
(Based on 08th Aug 2021 Exam) – English Version
Click Here For Grand Bundle PDF Course Combo (Prelims + Mains) 2021 Click Here to Subscribe Our Yearly Platinum Package
Follow us: Telegram , Facebook , Twitter , Instagram 19
The number of online women shoppers in city
C=400-150=250
The number of online women shoppers in cities
B and C=150+250=400
The number of offline men shoppers in cities B
and D=100+120=220
Required difference=400-220=180 more
37) Answer: C
The number of online shoppers in city C=400
The number of online shoppers in city E=75% of
400=400*3/4=300
The number of offline shoppers in city C=100
The number of offline shoppers in city E=140%
of 100=140
Required total=300+140=440
38) Answer: A
The total number of online and offline shoppers
in city A=200+300=500
The total number of online and offline shoppers
in city B=350+250=600
The total number of online and offline shoppers
in city C=400+100=500
The total number of online and offline shoppers
in city D=150+240=390
Required ratio=600:390=20:13
39) Answer: B
The number of online and offline men shoppers
in city A=120+180=300
The number of online and offline men shoppers
in city C=150+60=210
Required total=210+300=510
40) Answer: D
The number of offline women shoppers in city
B=250-100=150
The number of offline women shoppers in city
D=240-120=120
The number of offline women shoppers in cities
B and D=150+120=270
The number of online men shoppers in city
B=200
Required percentage=(270-
200)/200*100=70/2=35%
41) Answer: D
The total number of guitars sold for males and
females in February=90+150=240
The total number of guitars sold for males and
females in July=240*5/4=300
42) Answer: A
The total number of guitars sold for males in
January and May=150+120=270
The total number of guitars sold for females in
May=180
Required ratio=270:180=3:2
43) Answer: C
Required percentage=(210-
120)/120*100=90/120*90=75%
44) Answer: B

Top 50 Data Interpretation for IBPS RRB Clerk Pre 2021
(Based on 08th Aug 2021 Exam) – English Version
Click Here For Grand Bundle PDF Course Combo (Prelims + Mains) 2021 Click Here to Subscribe Our Yearly Platinum Package
Follow us: Telegram , Facebook , Twitter , Instagram 20
The total number of guitars sold for males and
females in May=120+180=300
The total number of guitars manufactured in
May=180*20/9=400
The total number of guitars unsold in May=400-
300=100
45) Answer: D
The total number of guitars sold for males and
females in April=110+160=270
Required difference=270-150=120
46) Answer: B
Required ratio = 96:120
= 4:5
47) Answer: A
Required difference = (114 + 26) – 84 * 125/100
= 35
48) Answer: C
Required total = 3/5 * 150 + 5/8 * 96 = 150
49) Answer: B
Required % = 114/132 * 100 = 86.36%
50) Answer: D
Required total = 84 – (120 * 45/100) = 30

Top 50 Data Interpretation for IBPS RRB Clerk Pre 2021
(Based on 08th Aug 2021 Exam) – English Version
Click Here For Grand Bundle PDF Course Combo (Prelims + Mains) 2021 Click Here to Subscribe Our Yearly Platinum Package
Follow us: Telegram , Facebook , Twitter , Instagram 21
Click Here for IBPS RRB Clerk Prelims Test Series 2021
Click Here for IBPS RRB Clerk Prelims Bundle PDF Course