topological insulators are tunable waveguides for...
TRANSCRIPT

PHYSICAL REVIEW B 92, 205430 (2015)
Topological insulators are tunable waveguides for hyperbolic polaritons
Jhih-Sheng Wu (���), D. N. Basov, and M. M. FoglerUniversity of California San Diego, 9500 Gilman Drive, La Jolla, California 92093, USA
(Received 20 September 2015; published 30 November 2015)
We present a theoretical analysis showing that layered topological insulators, for example, Bi2Se3 are opticallyhyperbolic materials in the range of terahertz (THz) frequencies. As such, these topological insulators possessdeeply subdiffractional, highly directional collective modes: hyperbolic phonon polaritons. We predict that in thincrystals the dispersion of these modes is split into discrete subbands and is strongly influenced by electron surfacestates. If the surface states are doped, then hybrid collective modes result from coupling of the phonon polaritonswith surface plasmons. The strength of the hybridization can be controlled by an external gate that varies thechemical potential of the surface states. We also show that the momentum dependence of the plasmon-phononcoupling leads to a polaritonic analog of the Goos-Hanchen effect. The directionality of the polaritonic rays andtheir tunable Goos-Hanchen shift is observable via THz nanoimaging.
DOI: 10.1103/PhysRevB.92.205430 PACS number(s): 73.21.−b, 78.20.−e
I. INTRODUCTION
Bismuth-based topological insulators (TIs) have attractedmuch interest for their unusual electron surface states (SSs),which behave as massless Dirac fermions [1,2]. However,the bulk optical response of these compounds [3–15] isalso remarkable. The quintuple-layered structure of thesematerials causes a strong anisotropy of their phonon modes.The Eu phonons that involve atomic displacements in a planeparallel to the basal plane (henceforth, x-y or ⊥ plane) havelower frequencies than A2u, the c-axis (henceforth, z-axis)vibrations [5]. For Bi2Se3, the dominant ⊥- and z-axis phononfrequencies,
ω⊥1,to = 64 cm−1 = 1.9 THz,
(1)ωz
1,to = 135 cm−1 = 4.1 THz ,
differ more than twice. As a result, this and similar TIs canexhibit a giant anisotropy of the dielectric permittivity. Thereis a range of ω where the permittivity tensor is indefinite:the real part of εz(ω) is positive, while that of ε⊥(ω) isnegative. Media with such characteristics are referred to ashyperbolic [16–18] because the isofrequency surfaces of theirextraordinary rays in the momentum space k = (kx,ky,kz)are shaped as hyperboloids [Fig. 1(a)]. In the terahertz(THz) domain, the widest band of frequencies where Bi2Se3
behaves as a hyperbolic medium (HM) is between theaforementioned dominant frequencies, ω⊥
to,1 < ω < ωzto,1;
however, other hyperbolic bands also exist in this TI (both atTHz frequencies, see Sec. II, and at visible frequencies, seeRef. [19]). It is important that the approximate equation forthe extraordinary isofrequency surfaces,
(kx)2 + (ky)2
εz(ω)+ (kz)2
ε⊥(ω)= ω2
c2, (2)
is valid up to |k| of the order of the inverse lattice constant.Accordingly, rays of momenta |k| greatly exceeding thefree-space photon momentum ω/c can propagate throughhyperbolic materials without evanescent decay. At such k, thehyperboloids can be further approximated by cones, whichmeans that the group velocity v = ∂ω/∂k of the rays makes
ε0
d ε⊥, εz
εs
(b)(a)
kx
ky
kz
ω2
ω1
θ
v
FIG. 1. (Color online) (a) Hyperboloidal isofrequency surfacesof HP2s for two frequencies ω1 and ω2 (ω2 > ω1). The asymptoteangle θ with respect to the kx-ky plane is shown; the group velocityv makes the same angle with respect to the kz axis. (b) Modelgeometry: a TI slab of thickness d sandwiched between a substrateof permittivity εs and a superstrate of permittivity ε0. The two thin(orange) layers represent the top and the bottom surfaces states.
a fixed angle θ (or −θ ) with respect to the z axis, with
tan θ (ω) = i[ε⊥(ω)]1/2
[εz(ω)]1/2, (3)
see Fig. 1(a). We refer to these deeply subdiffractional, highlydirectional modes as the hyperbolic phonon polaritons (HPPor HP2 for short).
Our interest to HP2 of TIs is stimulated by the recentdiscovery [20,21] and further exploration of similar collectivemodes in other systems such as hexagonal boron nitride [22–25] (hBN) and hBN covered by graphene [26–28] (hBN/G).There is a close analogy between these systems. In fact,except for the difference in the number of Dirac cones(N = 1 versus N = 4) and the frequency range where thehyperbolic response occurs (THz versus midinfrared), theelectrodynamics of longitudinal collective modes of Bi2Se3
and hBN/G structures is qualitatively the same. (The analogyis the most faithful when graphene and hBN are rotationallymisaligned; otherwise, their collective modes are modified bythe moire superlattice effects [28,29].)
The main goal of this paper is to investigate the interactionof HP2 with the Dirac plasmons of the topological SS. The
1098-0121/2015/92(20)/205430(12) 205430-1 ©2015 American Physical Society

JHIH-SHENG WU, D. N. BASOV, AND M. M. FOGLER PHYSICAL REVIEW B 92, 205430 (2015)
latter dominate the charge (and current) density response ofthe system at frequencies outside the hyperbolic band whereHP2 are absent. Dirac plasmons have been extensively studiedin previous literature [8,13,14,30–44] on both TI and graphene.The basic properties of the Dirac plasmons can be introducedon the example of a hypothetical TI material with a frequency-independent permittivity εz > 0 and the permittivity ε⊥(ω)dominated by a single phonon mode. Such an idealizedmaterial is hyperbolic in a single frequency interval ωto < ω <
ωlo, where ε⊥(ω) < 0. Its Dirac plasmons exist at ω < ωto andω > ωlo where ε⊥(ω) > 0. In the setup shown in Fig. 1(b),where the TI slab borders media of constant permittivitiesε0 > 0 and εs > 0, there are two plasmon modes. At largeenough in-plane momenta q ≡ [(kx)2 + (ky)2]1/2, these modesare confined to the opposite interfaces and electromagneticallydecoupled. In the relevant range of momenta q < q∗, thedispersion of the plasmon bound to the top interface is given by
q(ω) � 4
N
ε0 + ε1
e2|μ| (�ω)2 , �ω � |μ| , (4)
where
ε1(ω) = [ε⊥(ω)]1/2 [εz(ω)]1/2, (5)
is the effective permittivity of the TI and μ is the chemicalpotential of the SSs measured from the Dirac point. Atfrequencies far below ωto or far above ωlo, function ε1(ω) canbe approximated by a real constant, which yields ω ∝ √
q.This typical two-dimensional (2D) plasmon dispersiondescribes the low-frequency part of the full curve sketchedin Fig. 2(a). The plasmon dispersion for the bottom interfaceis obtained by replacing ε0 with εs (unless εs ε0, in whichcase the range q > q∗ is relevant where the dispersion isapproximately linear, see Sec. III B).
Equation (4) implies that the nature of the plasmon modesshould change drastically when ω enters the hyperbolicfrequency band where ε1(ω) [Eq. (5)] is imaginary and stronglyω − dependent. This equation predicts a complex q, whichsuggests that the Dirac plasmons become leaky modes thatrapidly decay into the HP2 bulk continuum. However, this isnot quite correct. We will show that nonleaky, i.e., propagatingmodes can survive in thin enough TI slabs where the HP2
continuum is broken into discrete subbands of waveguidemodes. The latter hybridize with plasmons to form hyperbolicplasmon phonon polaritons (HPPP or HP3 for short), theprimary target of our investigation, see Figs. 2(b) and 2(c).We explore the following properties and manifestations of thecollective charge modes of the TIs: (i) the mode dispersionin the momentum-frequency space, (ii) the dependence ofsuch dispersions on the surface doping and the thickness ofthe slab, and (iii) the unusual real-space dynamics of the HP3
rays, including a polaritonic analog of the Goos-Hanchen (GH)effect [45,46].
The remainder of the paper is organized as follows. InSec. II, we specify the model and the basic equations. InSec. III, we present our results for the dispersion of thethree different types of collective modes (plasmons, HP2s,and HP3s). In Sec. IV, which is the centerpiece of this work,we discuss waveguiding and launching of the HP2 modes andalso their tunable GH shifts. We explain how these phenomenacan be probed experimentally using the imaging capabilities
(a)
(b)
ω
q
2√3vq∗
q∗
intraband
interband
μ/h
ω
q
ωlo
ωto
0(s)
1(a)2
3
(c)
0(s)
1(a)
2
3
Ex
z
FIG. 2. (Color online) Schematic illustrations of the collectivemode spectra in idealized model systems. (a) The plasmon dispersionof Dirac fermions confined to the interface of two bulk media ofconstant positive permittivity ε0 and εs . The dispersion crosses overfrom ω � v
√qq∗/2 to ω � vq at a characteristic momentum q∗
[Eq. (26)]. The shaded areas indicate the electron-hole continua wherethe plasmons (and any other charged collective modes) are damped.(b) The dispersion of hybrid HP3 modes for a slab of a hypotheticalTI material that has a single in-plane phonon mode at ωto and constantεz > 0. Permittivity ε⊥ is negative at ωto < ω < ωlo and positive atother ω. The dotted boundary corresponds to the dotted line in (a).Outside the band ωto < ω < ωlo, only plasmonic modes 0 and 1 exist.In the degenerate case ε0 = εs they correspond to the symmetric (s)and antisymmetric (a) combinations of the top and bottom interfaceplasmons. Inside that band, multiple branches of HP3 are formed dueto hybridization of the plasmons with the HP2 waveguide modes. Thefrequencies of all the branches other than 0 and 1 tend to ωlo at largemomenta. (c) Schematic in-plane electric field profiles of the first fewHP3 modes (thick curves). The number of nodes in each profile (thepoints where they cross with the vertical lines Ex = 0) is equal to themodal index.
of the scattering-type scanning near-field optical microscopy(s-SNOM) [47,48]. In Sec. V, we give concluding remarksand an outlook for the future. Finally, in Appendix, we discusssignatures of the phonon-plasmon coupling measurable by thes-SNOM operating in the spectroscopic mode.
II. MODEL
Our model for the bulk permittivities of the TI is
εα(ω) = εα∞ +
∑j=1,2
ωα 2p,j
ωα 2to,j − ω2 − iγ α
j ω, α = ⊥,z . (6)
In the case of Bi2Se3, we choose the parameters based onavailable experimental [3,4,7] and theoretical [5] literatureas follows: ε⊥
∞ = 29, εz∞ = 17.4, ω⊥
to,1 = 64 cm−1, ω⊥p,1 =
205430-2

TOPOLOGICAL INSULATORS ARE TUNABLE WAVEGUIDES . . . PHYSICAL REVIEW B 92, 205430 (2015)
ω (1/cm)0 50 100 150 200 250 300
-200
-100
0
100
200
e ⊥
e zA B C
FIG. 3. (Color online) The real parts of the tangential and axialpermittivities of Bi2Se3. The sign changes of the permittivities are dueto the Eu and A2u phonons. Surface- and bulk-confined collectivemodes exist inside the spectral regions where at least one of thepermittivities is negative. They include the type-II hyperbolic regionA (�e ε⊥ < 0,�e εz > 0), the reststrahlen region B (�e ε⊥,�e εz <
0), and the type-I hyperbolic region C (�e ε⊥ > 0,�e εz < 0).
704 cm−1, ω⊥to,2 = 125 cm−1, ω⊥
p,2 = 55 cm−1, ωzto,1 =
135 cm−1, ωzp,1 = 283 cm−1, ωz
to,2 = 154 cm−1, ωzp,2 =
156 cm−1, and γ αj = 3.5 cm−1. [Note that ω⊥
to,1 and ωzto,1
were already listed in Eq. (1).] The real parts of functionsε⊥(ω) and εz(ω) are plotted in Fig. 3. The regions whereat least one of them is negative are shaded. They includeregion A, ω⊥
to,1 < ω < ωzto,1, where Bi2Se3 is an HM of type
II (�e εz > 0, �e ε⊥ < 0); region C, ωzto,2 < ω < 163 cm−1
where it is an HM of type I (�e εz < 0, �e ε⊥ > 0), and regionB, ωz
to,1 < ω < 146 cm−1, where it exhibits the Reststrahlenbehavior (�e εz < 0, �e ε⊥ < 0). Since regions B and C arenarrow, in our discussion of HP2 and HP3 modes we focuson region A. In this discussion, we often refer to hBN as anexample of a simpler material. The type-II hyperbolic band ofhBN is bounded by the frequencies [20,22]
ωto = 1376 cm−1, ωlo = 1614 cm−1. (7)
In this band, ε⊥(ω) of hBN can be modeled similar to Eq. (6)but using a single Lorentzian oscillator while εz can beconsidered ω-independent and positive.
In the case of Bi2Se3, we also have to specify ourassumptions about the electronic response. We consider onlyfrequencies smaller than the bulk gap 0.3 eV of Bi2Se3 at whichthe electronic contribution to the permittivities [included inEq. (6) via εα
∞] is purely real. Additionally, we assume that thevalence bulk band is completely filled, the conduction one isempty, with no free carriers present in the bulk. However, suchcarriers populate the gapless SS described by the massless 2DDirac equation. The chemical potential μ, which is locatedinside the bulk band gap, determines the doping of theseSS. For simplicity, we ignore any virtual or real electronictransitions between the surface and the bulk states, whichshould not change the result qualitatively, except perhaps forthe additional damping from these transitions.
The fundamental current/density response functions of theSS are the sheet conductivity σ and polarizability P , which
are related in the standard way:
σ (q,ω) = iω
q2e2P (q,ω) . (8)
Within the random-phase approximation for Dirac fermions,P (q,ω) can be computed [49,50] analytically:
P (q,ω) = − NkF
2π�v− iN
16π�v
q2√q2 − k2
ω
×[G
(kω + 2kF
q
)− G
(kω − 2kF
q
)− iπ
],
G(x) = ix√
1 − x2 − i arccos x . (9)
Here, the branch cut for the square root and logarithm functionsis the negative real semi-axis, kω is defined by kω = (ω +iγe)/v, phenomenological parameter γe > 0 is the electronscattering rate, v is the Fermi velocity, and kF = |μ|/(�v) isthe Fermi momentum. Equation (9) is a good approximationat small μ. At large doping, trigonal warping [51] and otherdetails of realistic band structure [43] should be included. Sincethe above formula is a bit cumbersome, it may be helpful tomention some properties of σ (q,ω). For example, if γe = +0,the real part of σ (q,ω) is nonvanishing only inside the twoshaded areas in Fig. 2(a), which together form the so-calledelectron-hole continuum [30,39]. (This real part is a measureof dissipation, i.e., Landau damping.) For a doped system atsmall momenta and frequencies, q,kω � kF , the expressionfor the conductivity can be reduced to
σ (q,ω) � Ne2
2π�
kF√q2 − k2
ω
ikω
ikω − √q2 − k2
ω
. (10)
At q � ω/v, it further simplifies to the Drude formula
σ � Ne2
4π�2
|μ|γe − iω
, μ �= 0 . (11)
For an undoped system, one finds instead
σ (q,ω) = N
16
e2
�
ikω√q2 − k2
ω
(12)
� N
16
e2
�, q � ω
v. (13)
In order to find the dispersion of the collective modes ofthe TI slab, we use two computational methods. One method,which is advantageous for deriving analytical results, is to lookfor the poles of the response function rP (q,ω). This function isthe total P - (also known as the TM-) polarization reflectivityof the system measured when an external field is incident fromthe medium labeled “ε0” in Fig. 1(b). It must be immediatelyclarified that rP (q,ω) has no poles at simultaneously real q
and ω if the dissipation parameters γ and γe are nonzero. Atleast one of these arguments must be complex. Whenever onerefers to the dispersion relation of a mode, one means therelation between the real parts of q and ω. The other method,which is especially convenient for numerical simulations, isto identify the sought dispersion curves with the maxima of m rP (q,ω) at real arguments. As long as the imaginary partsof q and ω (which give information about the propagationlength and lifetime of the mode) are small, both methods give
205430-3

JHIH-SHENG WU, D. N. BASOV, AND M. M. FOGLER PHYSICAL REVIEW B 92, 205430 (2015)
the same dispersions. An extra benefit of working with realq and ω is that the corresponding rP (q,ω) is the input forfurther calculations we discuss in Appendix where we models-SNOM experiments for the system in hand.
Our procedure for calculating function rP (q,ω) can beexplained as follows. Taking a more general view for amoment, we regard the entire system including the substrateand superstrate as a stack of layers j = 0,1, . . . ,M of thicknessdj , tangential permittivity ε⊥
j , and axial permittivity εzj . (In the
present case, M = 2, the TI slab is layer j = 1 and d1 = d.)Additionally, we assume that the interface of the layers j andj + 1 possesses the sheet conductivity σj,j+1. We observe thatthe P -polarization reflectivity rj,j+1 of j,j + 1 interface inisolation is given by the formula (see, e.g., Ref. [27])
rj,j+1 = Qj+1 − Qj + 4πω
σj,j+1
Qj+1 + Qj + 4πω
σj,j+1, (14)
Qj = ε⊥j
kzj
, kzj =
√ε⊥j
√ω2
c2− q2
εzj
, (15)
where kzj and q are, respectively, the axial and the tangential
momenta inside layer j . Let rj be the reflectivity of asubsystem composed of layers j, . . . ,M . By this definition,rM−1 = rM−1,M . The crucial point is that the desired rP ≡ r0
can be found by the backward recursion
rj = rj,j+1 − (1 − rj,j+1)(1 − rj+1,j )rj+1
rj+1,j rj+1 − exp(−2ikj+1dj+1), (16)
where rj+1,j is the right-hand side of Eq. (14) with Qj andQj+1 interchanged. For M = 2, one recursion step suffices,which gives us, after some algebra [27],
rP = r12(r01 + r10 − 1) − r01 exp(−2ik1d1)
r10r12 − exp(−2ik1d1). (17)
Hence function rP (q,ω) has poles whenever
r10(q,ω)r12(q,ω) = exp(−2ikz
1d). (18)
For large in-plane momenta q (ω/c) max |εzj |1/2, we can
use the approximations kz1 � q tan θ and
r10 �ε0 − ε1 − 2q
qtop
ε0 + ε1 − 2q
qtop
, qtop ≡ iω
2πσtop, (19)
where σtop = σtop(q,ω) is the sheet conductivity of the SS atthe top interface. Let us also define the “phase shifts” φtop andφbot for inner reflections from the top and bottom interfaces,respectively: r10 = − exp(2iφtop),r12 = − exp(2iφbot). Notethat in general φtop and φbot are complex numbers. Specifically,
we take
φtop = arctan
[iε0
ε1
(1 − 2
ε0
q
qtop
)], (20)
φbot = arctan
[i
εs
ε1
(1 − 2
εs
q
qbot
)], (21)
where the standard definition of arctan z is assumed, with thebranch cuts (−i∞, − i),(i,i∞) in the complex-z plane; qbot
is defined analogously to qtop but with the sheet conductivityσbot of the bottom SS instead of σtop. Equation (18) can nowbe transformed to
qn = −2
δ(nπ + φtop + φbot) , δ ≡ 2d tan θ , (22)
where the integer subscript n labels possible multiple solutions.Admissible n must satisfy the condition m rP (qn,ω) > 0. Ournumerical results for rP computed from Eq. (17) and analyticapproximations for the solutions of Eq. (22) are presented inSec. III.
III. COLLECTIVE MODE DISPERSIONS
The false color maps of function m rP (q,ω) providea convenient visualization of the collective mode spectra.Examples of such maps computed for Bi2Se3 slabs arepresented in the bottom row of Fig. 4. Their counterparts forgraphene-hBN-graphene (G/hBN/G) structures are shown inthe top row to facilitate the interpretation. The bright lines inFig. 4 are the dispersion curves of the collective modes. Theapparent widths of those lines give an idea how damped themodes are. Below we discuss these results in more detail.
A. Hyperbolic waveguide modes
Figures 4(a) and 4(d) depict the m rP maps for, respec-tively, G/hBN/G and Bi2Se3 slabs, when they are undoped,μ = 0. No Dirac plasmons exist in such systems, so thatthe collective modes are limited to HP2s. In Fig. 4(a), wesee a single family of such modes whereas in 4(d) one canactually distinguish three of them. Let us start with the former,simpler case. The key to understanding the nature of thesemodes is that inside the hyperbolic band ωto < ω < ωlo thez-axis momentum kz
1 � q tan θ of the modes is nearly real.Hence, the HP2s form standing waves inside the slab. Theinteger n in Eq. (22) corresponds to the number of nodesof these waves, see Fig. 2(c). For G/hBN/G, the requisitecondition m rP > 0 is satisfied by all nonegative integersn due to the fact that m tan θ > 0. This inequality alsoensures that m q > 0. An analytical approximation for thedispersion curves of an undoped slab is obtained by neglectingthe fractions q/qtop,q/qbot in Eqs. (20) and (21), in whichcase Eq. (22) yields q(ω) directly. Within this approximation,momenta qn at given ω are equidistant:
qn+1 − qn � −2π
δ= −π
d
1
tan θ (ω). (23)
The dispersion of the HP2 waveguide modes is dominatedby the factor 1/ tan θ (ω) in Eqs. (22) and (23), which, ifall damping is neglected, changes from zero to infinity asω increases from ωto to ωlo. This is precisely what we see in
205430-4

TOPOLOGICAL INSULATORS ARE TUNABLE WAVEGUIDES . . . PHYSICAL REVIEW B 92, 205430 (2015)
q (10−2 nm−1)
ω(c
m−1
)
0 2 4 60
100
200
300
q (10−2 nm−1)0 2 4 6
0
100
200
300
q (10−2 nm−1)0 2 4 60
100
200
300
q (10−2 nm−1)
ω(c
m−1
)
0 10 201000
1500
2000
q (10−2 nm−1)0 10 20
1000
1500
2000
q (10−2 nm−1)0 10 20
1000
1500
2000
(c)
√m rP
2
0
1
0.4
0.6
0.2
0
(a) (b)
(d) (e) (f)√
m rP
FIG. 4. (Color online) Collective mode dispersions of graphene-hBN-graphene (G/hBN/G) and Bi2Se3 slabs rendered using the false colormaps of m rP . The parameters of the calculation for G/hBN/G are: (a) d = 60 nm,μ = 0, (b) d = 60 nm,μ = 0.29 eV, (c) d = 30 nm,μ =0.29 eV. The other parameters are v = 1.00 × 108 cm/s,γe = 1.00 THz,ε0 = 1, and εs = 1.5. The parameters of the calculation for Bi2Se3
are (d) d = 120 nm,μ = 0, (e) d = 120 nm,μ = 0.29 eV, (f) d = 60 nm,μ = 0.29 eV. In these three plots, v = 0.623 × 108 cm/s,γe =1 THz,ε0 = 1, and εs = 10. Equal doping of the top and bottom SS is assumed. The vertical dashed lines indicate a characteristic momentumprobed by the s-SNOM experiments simulated in Fig. 7 below.
Fig. 4(a): all the dispersion curves start at ωto at q = 0 andincrease toward ωlo at large q.
Equation (23) is general and it applies to Bi2Se3 as well. Thethree families of collective modes seen in Fig. 4(d), belong tothe spectral regions A, B, and C of Fig. 3. In region A, whichis the widest of the three, we see a set of HP2 modes verysimilar to those in Fig. 4(a). They start at ωto,1 = 64 cm−1 atq = 0 and monotonically increase toward ωto,2 = 135 cm−1 atlarge q. In region C, 154 < ω (cm−1) < 163, we again find afamily of HP2 modes but this time with a negative dispersion.This behavior is typical of type I HM (�e ε⊥ > 0,�e εz < 0).The shape of the dispersion can be understood noticing thatthe real part of 1/ tan θ (ω) is positive, varying from ∞ to 0(if the phonon damping γ α
j is neglected) while admissiblen are now n � 0. [In hBN, this type I behavior is alsorealized [22,24,27] but the corresponding frequency rangeis below the axis cutoff in Fig. 4(a).] Lastly, in region B,135 < ω (cm−1) < 146, function tan θ (ω) is almost purelyimaginary, which implies that the collective modes do notform standing waves but are exponentially confined to theinterfaces. Also, there are only two such modes, n = 0 and1. In this respect, these surface-bound HP2 modes are similarto the Dirac plasmons, see Sec. I above and Sec. III B below.However, their dispersion is completely different from thoseof the plasmons, e.g., the dispersion of the upper (n = 1)mode has a negative slope, see Fig. 4(d). Similar collectiveexcitations have been studied in literature devoted to othersystems, e.g., anisotropic superconductors [52], which can
be consulted for details and references. Due to narrownessof regions B and C, some of the described features may bedifficult to see in Fig. 4(a) and probably challenging to observein experiments. For this reasons, we will mostly refrain fromdiscussing regions B and C further.
One implication of Eq. (23) is that the HP2 dispersion iswidely tunable: the scaling law qn ∝ d−1 provides a practicalway to engineer a desired wavelength of the waveguide modessimply by tailoring the slab thickness d, as has been previouslydemonstrated using hBN slabs [20].
B. Surface plasmons
Examples of the collective mode spectra at finite dopingare shown in Figs. 4(b) and 4(c) for G/hBN/G and Figs. 4(e)and 4(f) for Bi2Se3. The spectra are dramatically differentinside and outside the hyperbolic frequency bands. A keyto understanding this difference is again the value of themomentum kz
1 � q tan θ (ω). Outside the hyperbolic bands, itis almost purely imaginary, and so the collective excitationsare exponentially confined to the surfaces of the slab. Thesesurface modes are the Dirac plasmons introduced in Sec. I.Having in mind applications to near-field experiments, weare particularly interested in momenta q of the order of afew times 105 cm−1, i.e., the region nearby the dashed linesq = 0.0025 nm−1 in Fig. 4. If ε1 is real, there are at most twosolutions of Eq. (22), one for n = 0 and the other for n = 1.However, the distinct n = 1 dispersion curves are visible only
205430-5
JHIH-SHENG WU, D. N. BASOV, AND M. M. FOGLER PHYSICAL REVIEW B 92, 205430 (2015)
in Figs. 4(b) and 4(c) for G/hBN/G and none of them is closeenough to the range of q we are interested in. Therefore wefocus on the n = 0 branch.
The shape of the plasmon dispersion curves in TI slabs anddouble-layer graphene systems was a subject of many previoustheoretical studies [31,37,40,43,44] whose basic conclusionsare reproduced by the following analysis. To the right of thedashed lines in Figs. 4(b) and 4(e) and for d ∼ 100 nm,the dimensionless product 2kz
1d = qδ is typically large byabsolute value and almost purely imaginary. This implies thatthe plasmons of the two interfaces are decoupled. Taking intoaccount that ε0 < εs and qtop = qbot in Fig. 4, one can showthat the dispersion of the n = 0 mode is controlled by theproperties of the top interface. In the first approximation, thisdispersion can be obtained setting φtop → −i∞, which yields
q0 ≈ ε0 + ε1
2qtop , q0 |δ|−1. (24)
For μ = 0, momentum qtop = qtop(q0,ω) is imaginary, cf.Eqs. (13) and (19). Hence, for real ε1, Eq. (24) has no realsolutions: as already mentioned, undoped SSs do not supportplasmons. Indeed, Figs. 4(a) and 4(d) contain no bright linesoutside the hyperbolic bands. On the other hand, if μ �= 0,we can use Eq. (11) to transform Eq. (24) to Eq. (4), whichpredicts a parabolic dispersion curve ω ∝ √
q if ε1 is constant.Such parabolas are seen in the upper halves of Figs. 4(b), 4(c),and 4(e), 4(f) although they appear rectilinear because of therestricted range of q.
As smaller momenta Eq. (24) no longer holds. The correctapproximation for the n = 0 mode is obtained by setting theleft-hand side of Eq. (22) to zero. This yields φtop = −φbot and
q0 � ε0 + εs
2
1
q−1top + q−1
bot
� 2
N
ε0 + εs
e2|μ| (�ω)2 . (25)
Thus both the low-q and high-q parts of the n = 0 dispersioncurve are parabolic but with different curvatures. The crossoverbetween these two parabolas occurs via a rapid increaseof ε⊥(ω), and so, ε1(ω) at frequencies immediately abovethe hyperbolic bands. It takes place at ω > 1614 cm−1 forG/hBN/G and ω > 163 cm−1 for Bi2Se3, which generates theinflection points seen on the curves in, respectively, Figs. 4(b),4(c) and 4(e), 4(f).
As indicated schematically in Fig. 2(a), at very large q
the plasmon dispersion should have another inflection point.Using the more accurate Eq. (10) instead of Eq. (11), we findthe following analytical result for the frequency of the n = 0mode as a function of q:
ω(q) � vq + q∗√
1 + (2q∗/q), q∗ = 2e2
�v
NkF
ε0 + ε1. (26)
This equation predicts a crossover from the parabolic to thelinear dispersion ω � vq above q = q∗. However, this occursfar outside the plot range of Fig. 4.
Returning to Eq. (25), we notice that it does not containthe bulk permittivities. Hence, it should continue to hold for arange of ω inside the hyperbolic bands. A physical picture ofthis mode [“0(s)” in Fig. 2(c)] is in-phase oscillations of thecharges of both Dirac fermion layers, i.e., the system behavingas a single 2D layer with the combined oscillator strength.As ω decreases further into the hyperbolic bands, the length
scale |δ| increases. The strength of the inequality q0|δ| � 1and so the accuracy of Eq. (25) becomes progressively lower[in fact, Eq. (27) below gives a better approximation]. At ω =ωto for G/hBN/G and similarly, at ω = ω⊥
to,1 for Bi2Se3, thisinequality is violated completely, which is consistent with thetermination of these branches at q = 0 in Figs. 4(b) and (e).Similar analysis can be applied to Figs. 4(c) and 4(f) whered is twice smaller than in, respectively, Figs. 4(b) and 4(e).Because of that, the plasmon dispersion in the region q|δ| < 1is shifted to smaller q. The dispersions in the large-q regionsare virtually unaffected since the stronger surface confinementof the plasmons makes them insensitive to d.
One qualitative difference between G/hBN/G and Bi2Se3
is the richer phonon spectrum of the latter. This leads to theavoided crossings of the plasmon branch with the dispersionlines of the HP2 modes in regions B and C of Bi2Se3, cf.Figs. 4(b), 4(c) and 4(e), 4(f). The small shifts caused bythose crossings are somewhat masked by the considerablelinewidth of the n = 0 line due to relatively stronger phonondamping. In turn, higher electronic damping rate γe ∼ ω⊥
to,1due to disorder scattering in Bi2Se3 effectively eliminates theplasmon excitations in the lower spectral region ω < ω⊥
to,1, seeFigs. 4(e) and 4(f). Therefore we do not discuss it here.
C. Hybrid modes
From now on we turn to the subject of our primary interest,the hyperbolic collective modes of a doped TI. In this shortsection we address their dispersion law. Comparing Fig. 4(d)for μ = 0 with Figs. 4(e) and 4(f) for μ > 0, we observesignificant shifts in the dispersion of the n = 0 mode in theupper half of the hyperbolic band ω⊥
to,1 < ω < ωzto,1 of Bi2Se3.
Similar shifts are seen in hBN near ωlo, cf. Fig. 4(a) withFigs. 4(b) and 4(c). These shifts result from hybridizationof HP2 and Dirac plasmons into combined HP3 waveguidemodes. In general, calculation of these shifts requires solvingEq. (22) numerically. However, near the bottom of thehyperbolic band where these shifts become small, they canbe also found analytically. Thus, Eq. (25) gets replaced by
q0 � ε0 + εs
ε⊥d + 2q−1top + 2q−1
bot
, |ε1| ε0,εs , (27)
which shows explicitly that q0 goes to zero as ω approachesω⊥
to,1 where ε⊥ sharply increases.Unlike in Figs. 4(a) and 4(d), in Figs. 4(b), 4(c), 4(e), and
4(f), the higher-order n > 1 modes are more difficult to seebecause of their lower relative intensity compared to those ofthe plasmon n = 0 (and n = 1) modes. Nevertheless, thesemodes remain well defined (underdamped). Near the bottomsof the respective hyperbolic bands their momenta qn still forman equidistant sequence except with a spacing
qn+1 − qn � 2π
l − δ, (28)
which is modified compared to Eq. (23). This result can beobtained from Eq. (22) by approximating the finite differencessuch as φtop(qn+1) − φtop(qn) by means of the derivative.Parameter l is defined by
l = −2∂φtop
∂q− 2
∂φbot
∂q. (29)
205430-6

TOPOLOGICAL INSULATORS ARE TUNABLE WAVEGUIDES . . . PHYSICAL REVIEW B 92, 205430 (2015)
The physical meaning of this quantity is clarified in the nextsection.
IV. GOOS-HANCHEN EFFECT
In this section, we consider the problem of the plasmon-polariton mixing from the point of view of real-space tra-jectories of the HP2 excitations. The question we consider ishow polariton wave packets propagate inside the slab and, inparticular, how they reflect off its interfaces. As mentionedin Sec. I, for a given ω, the angle θ between the z axis andthe group velocity v vector of HP2s is nearly independentof q. Therefore, monochromatic HP2 wave packets propagateas highly directional rays. Naively, one would then expectthat the polariton rays should zigzag inside the slab returningto each interface periodically with the repeat distance of2d |tan θ | = |δ|. Although such geometrical optics picture isadequate for insulating hyperbolic materials [53], it is not quitecorrect for TI with gapless doped SS. The geometrical opticsneglects a lateral shift or displacement of the rays after eachreflection [compare Figs. 5(a) and 5(b)], which is analogous tothe GH effect of light. The GH effect was first discussed in thecontext of the total internal reflection of light. As explainedbelow, it can be understood from two complementary pointsof view. In the wave picture, it originates from the momentumdependence of the reflection phase shift. In the particle picture,the GH effect is due to the quasi-classical tunneling (excitationof evanescent waves) along the interface. To define such adisplacement one usually considers a wave packet with a
θ
polariton polariton
plasmon
l
(a) (b)
(c)
split gate
undoped
doped
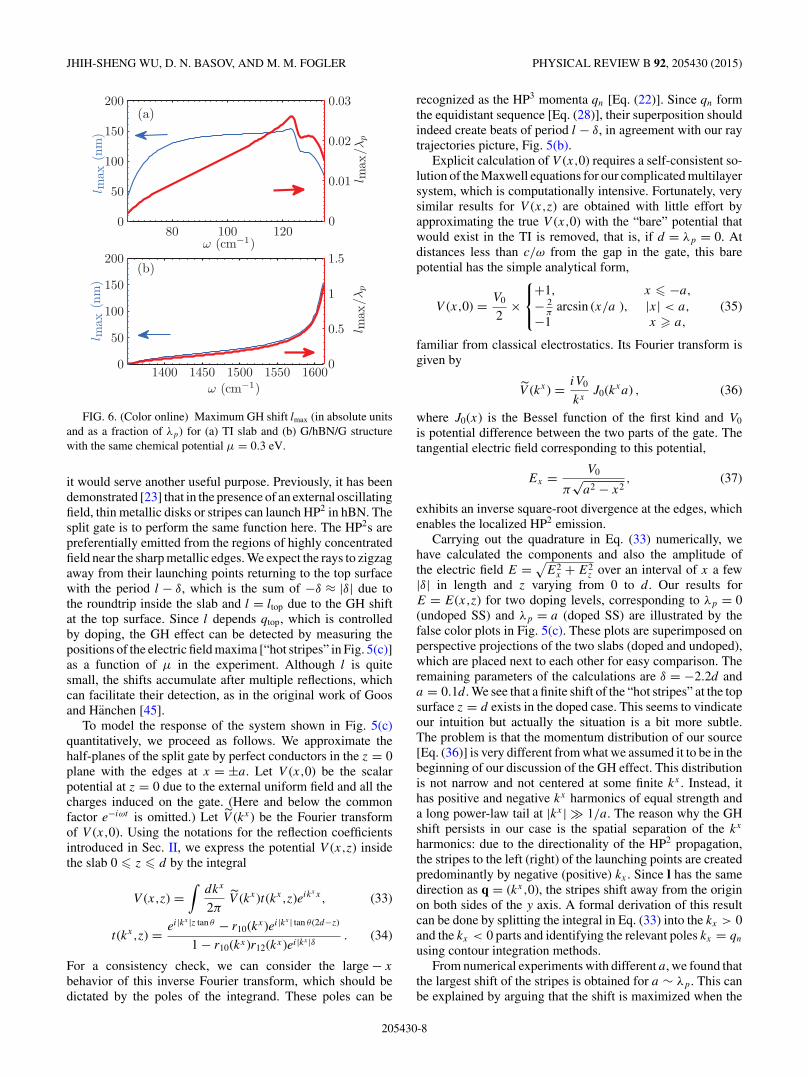
FIG. 5. (Color online) Polaritonic GH effect in TI slabs. (a)Schematics of the HP2 ray reflection in the absence of the SS. (b) Thesame with the SS. The wavy lines symbolize virtual Dirac plasmons.The GH shift l is indicated. (c) The electric field distribution insideand/or at the upper surfaces of two slabs with equal δ = −2.2d butdifferent doping. The lower (“doped”) and the upper (“undoped”)parts of the image are computed for λp = a and 0, respectively.The split gate—a pair of metallic half-planes separated by a distance2a—launches highly directional HP2 rays that bounce inside the slabscreating periodic “hot stripes” at their upper surfaces. The period islarger in the “doped” slab. The two small circles, one in the undopedand one in doped part, are the representative locations of the HP2
reflections. Their enlarged views are shown in, respectively, (a) and(b).
smooth envelope (for example, a Gaussian), in which casethe displacement is the shift in the position of its maximum.
While the GH effect [45] was discovered measuring thereflection of light off an air-metal interface, the displacementl of the reflected ray is a general wave phenomenon [46] thatarises due to the dependence of the reflection phase shift φ onthe lateral momentum q = (kx,ky). For example, the GH effectshould also occur for surface plasmons [54]. The expressionfor l has the form [55]
l = −�e∂φ
∂q. (30)
It seems to be another general rule that the momentumdependence of φ is significant only if the interface supportselectromagnetic modes with either a large propagation lengthor a long decay length if such modes are evanescent. Inthe original photonic GH effect, this is the case under theconditions of the total internal reflection. The magnitude |l| ofthe GH displacement can be interpreted as the decay lengthof the evanescent transmitted wave. Alternatively, a large GHshift can occur if the interface supports surface plasmons orpolaritons [56–58]. Experimental demonstration of the GHeffect enhanced by surface plasmons of the air-metal interfacehas been reported [59].
Comparing Eqs. (29) and (30), we recognize the lengthscale l in the former as the sum of the GH shifts due to thetop and the bottom interfaces. Therefore we conclude that theDirac plasmons must act as the transient interface modes forthe HP2 rays bouncing inside the TI slab. Using Eqs. (20) and(30), and taking into account that �e ε1 � m ε1, we find theGH shift at the top interface to be
ltop = 4
qtop
m ε1(ε0 − 2q
qtop
)2 + |ε1|2. (31)
A few comments on this result can be made. First, the GHshift is positive in our case, which means the displacement isin the same direction as the in-plane group velocity of the ray.Second, ltop depends on the permittivity of the environment.For example, at fixed q, it vanishes if ε0 is very large.Conversely, for fixed ε0, the GH shift reaches its maximum
lmax = 2
π
λpε0 m ε1
(�e ε1)2 + ( m ε1)2 , λp ≡ 2π
ε0qtop, (32)
at q = π/λp. Finally, lmax depends linearly on the characteris-tic size λp of the Dirac plasmon wavelength and inversely onthe absolute value |ε1| ≈ m ε1 of the effective permittivity ofthe hyperbolic medium.
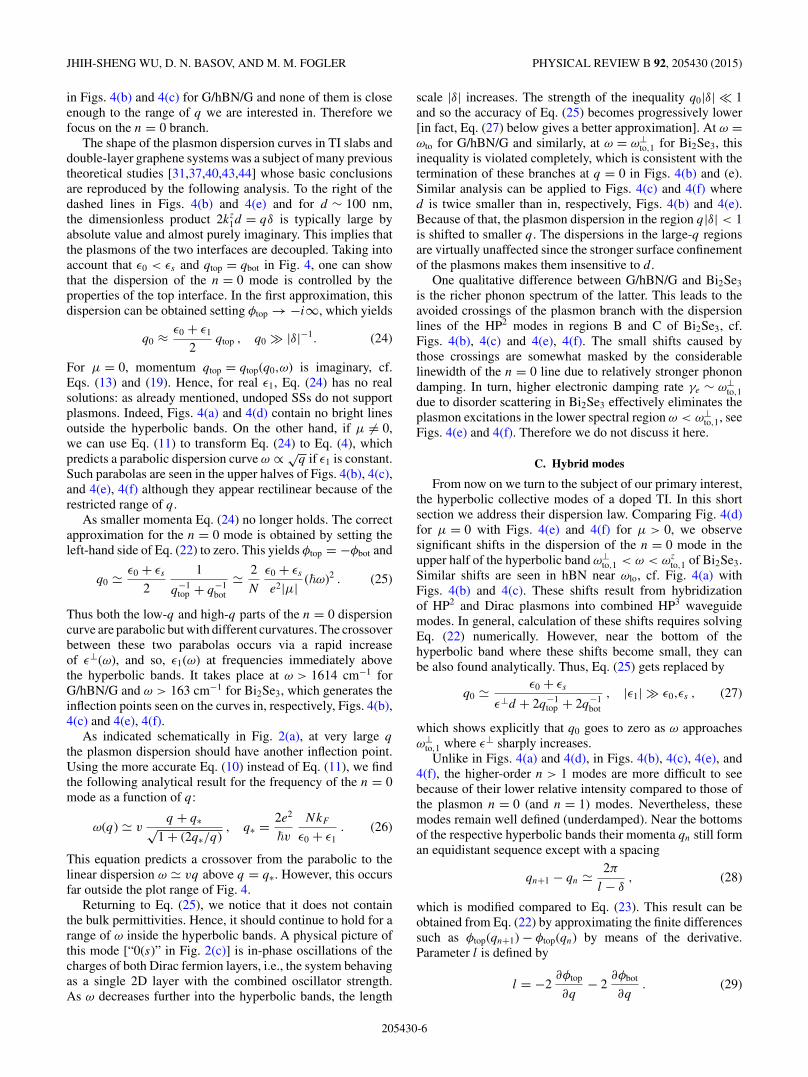
In Fig. 6, we show lmax for Bi2Se3 and G/hBN/G systems asa function of ω spanning their respective hyperbolic bands. Therelative shift, lmax/λp, is greater in G/hBN/G because |ε1| issmaller. Yet the absolute lmax at the same μ = 0.3 eV is greaterin Bi2Se3 (where it is ∼ 200 nm) because it is hyperbolic atlower frequencies and λp is larger at smaller ω.
One possible setup for experimental detection of the GHeffect in TI is shown in Fig. 5(c). It differs from Fig. 1(b) inthe addition of a split gate between the TI slab and the substrate.If this gate is made of a good conductor with large permittivity,it would suppress the GH shift at the bottom surface. However,
205430-7
JHIH-SHENG WU, D. N. BASOV, AND M. M. FOGLER PHYSICAL REVIEW B 92, 205430 (2015)
ω (cm−1)
l max
(nm
)
1400 1450 1500 1550 16000
50
100
150
200
l max
/λ
p0
0.5
1
1.5ω (cm−1)
l max
(nm
)
80 1000
50
100
150
200
120
l max
/λ
p
0
0.01
0.02
0.03(a)
(b)
FIG. 6. (Color online) Maximum GH shift lmax (in absolute unitsand as a fraction of λp) for (a) TI slab and (b) G/hBN/G structurewith the same chemical potential μ = 0.3 eV.
it would serve another useful purpose. Previously, it has beendemonstrated [23] that in the presence of an external oscillatingfield, thin metallic disks or stripes can launch HP2 in hBN. Thesplit gate is to perform the same function here. The HP2s arepreferentially emitted from the regions of highly concentratedfield near the sharp metallic edges. We expect the rays to zigzagaway from their launching points returning to the top surfacewith the period l − δ, which is the sum of −δ ≈ |δ| due tothe roundtrip inside the slab and l = ltop due to the GH shiftat the top surface. Since l depends qtop, which is controlledby doping, the GH effect can be detected by measuring thepositions of the electric field maxima [“hot stripes” in Fig. 5(c)]as a function of μ in the experiment. Although l is quitesmall, the shifts accumulate after multiple reflections, whichcan facilitate their detection, as in the original work of Goosand Hanchen [45].
To model the response of the system shown in Fig. 5(c)quantitatively, we proceed as follows. We approximate thehalf-planes of the split gate by perfect conductors in the z = 0plane with the edges at x = ±a. Let V (x,0) be the scalarpotential at z = 0 due to the external uniform field and all thecharges induced on the gate. (Here and below the commonfactor e−iωt is omitted.) Let V (kx) be the Fourier transformof V (x,0). Using the notations for the reflection coefficientsintroduced in Sec. II, we express the potential V (x,z) insidethe slab 0 � z � d by the integral
V (x,z) =∫
dkx
2πV (kx)t(kx,z)eikxx, (33)
t(kx,z) = ei|kx |z tan θ − r10(kx)ei|kx | tan θ(2d−z)
1 − r10(kx)r12(kx)ei|kx |δ . (34)
For a consistency check, we can consider the large − x
behavior of this inverse Fourier transform, which should bedictated by the poles of the integrand. These poles can be
recognized as the HP3 momenta qn [Eq. (22)]. Since qn formthe equidistant sequence [Eq. (28)], their superposition shouldindeed create beats of period l − δ, in agreement with our raytrajectories picture, Fig. 5(b).
Explicit calculation of V (x,0) requires a self-consistent so-lution of the Maxwell equations for our complicated multilayersystem, which is computationally intensive. Fortunately, verysimilar results for V (x,z) are obtained with little effort byapproximating the true V (x,0) with the “bare” potential thatwould exist in the TI is removed, that is, if d = λp = 0. Atdistances less than c/ω from the gap in the gate, this barepotential has the simple analytical form,
V (x,0) = V0
2×
⎧⎨⎩+1, x � −a,
− 2π
arcsin (x/a ), |x| < a,
−1 x � a,
(35)
familiar from classical electrostatics. Its Fourier transform isgiven by
V (kx) = iV0
kxJ0(kxa) , (36)
where J0(x) is the Bessel function of the first kind and V0
is potential difference between the two parts of the gate. Thetangential electric field corresponding to this potential,
Ex = V0
π√
a2 − x2, (37)
exhibits an inverse square-root divergence at the edges, whichenables the localized HP2 emission.
Carrying out the quadrature in Eq. (33) numerically, wehave calculated the components and also the amplitude ofthe electric field E = √
E2x + E2
z over an interval of x a few|δ| in length and z varying from 0 to d. Our results forE = E(x,z) for two doping levels, corresponding to λp = 0(undoped SS) and λp = a (doped SS) are illustrated by thefalse color plots in Fig. 5(c). These plots are superimposed onperspective projections of the two slabs (doped and undoped),which are placed next to each other for easy comparison. Theremaining parameters of the calculations are δ = −2.2d anda = 0.1d. We see that a finite shift of the “hot stripes” at the topsurface z = d exists in the doped case. This seems to vindicateour intuition but actually the situation is a bit more subtle.The problem is that the momentum distribution of our source[Eq. (36)] is very different from what we assumed it to be in thebeginning of our discussion of the GH effect. This distributionis not narrow and not centered at some finite kx . Instead, ithas positive and negative kx harmonics of equal strength anda long power-law tail at |kx | 1/a. The reason why the GHshift persists in our case is the spatial separation of the kx
harmonics: due to the directionality of the HP2 propagation,the stripes to the left (right) of the launching points are createdpredominantly by negative (positive) kx . Since l has the samedirection as q = (kx,0), the stripes shift away from the originon both sides of the y axis. A formal derivation of this resultcan be done by splitting the integral in Eq. (33) into the kx > 0and the kx < 0 parts and identifying the relevant poles kx = qn
using contour integration methods.From numerical experiments with different a, we found that
the largest shift of the stripes is obtained for a ∼ λp. This canbe explained by arguing that the shift is maximized when the
205430-8

TOPOLOGICAL INSULATORS ARE TUNABLE WAVEGUIDES . . . PHYSICAL REVIEW B 92, 205430 (2015)
characteristic kx ∼ π/a contributing to the integral in Eq. (33)is close to the momentum π/λp at which l = lmax in Eq. (31).
Experimental detection of the “hot stripes” and theirdoping-dependent GH shift is possible via the s-SNOMimaging. This technique involves measuring the light scatteredby the tip of an atomic force microscope brought to the sampleand scanned along its surface [47,48]. Using clever signalprocessing methods, it is possible to isolate the genuine near-field component of this scattered light, which originates fromconversion of evanescent electromagnetic waves emanatingfrom the sample into free-space photons. In the proposedexperiment, the evanescent waves are due to the HP2 modeslaunched by the split gate. The spatial resolution of thes-SNOM imaging is set by the tip curvature radius R. Fortypical R = 20–40 nm, it is barely sufficient to observethe predicted GH shifts in hBN/G, Fig. 6(b). Nevertheless,detecting the cumulative shift after several stripe periodsshould be feasible. The prior success of s-SNOM imagingexperiments of surface plasmons and polaritons in grapheneand hBN structures [20,23–25,27,28,33,35] gives us a firmconfidence in this approach. Note that if a doped graphenelayer only partially covers the top surface of hBN, one literallygets the situation depicted in Fig. 5(c), where the doped andundoped regions are positioned side by side.
In the case of Bi2Se3 where the GH shift ∼ 200 nm[Fig. 6(a)] is much larger, the spatial resolution of the s-SNOMis even less of an issue. The main obstacle is the scantavailability of suitable THz sources. We are optimistic thatin a near future this problem can be overcome as well.
V. SUMMARY AND OUTLOOK
Recent experiments [8,14] have shown that coupling be-tween Dirac plasmons and bulk phonons of bismuth-based TIsshould be strong. In this paper, we have studied this interactiontaking into account the anisotropic phonon spectrum of suchTIs. We have predicted that a TI slab can act as a tunable waveg-uide for phonon polaritons, with the doping of the surfacestates being the tuning parameter. In additional to the changein dispersion, the phonon-plasmon coupling can cause measur-able real-space shifts of the polariton rays. Similar phenomenahave been recently studied in artificial structures made bystacking graphene layers on top of hBN. The present workindicates that the TIs are a promising alternative platformfor realizing highly tunable, strongly confined, low-losselectromagnetic modes in a natural material. Additionally,while hBN/G waveguides operate in midinfrared frequencies,Bi2Se3 and similar compounds extend the same functionalityto the technologically important THz domain.
We envision several directions for further work in this field.One is to attempt a multisource coherent control of polaritonemission and propagation using ultrafast laser pulses. A varietyof such techniques has been developed [60] in the contextof THz polaritonics of LiNbO3 and LiTiO3. (Incidentally, atheoretical proposal [61] of integrating graphene into suchmaterials would lead to polariton waveguides similar infunctionality and perhaps also tunability to those studied inthe present work.) Another intriguing direction is to exploreoscillating spin currents, which were predicted to accompanycharge density currents produced by Dirac plasmons [32].
It may be also interesting to study the effect of opticalhyperbolicity [19] on the high-energy bulk plasmons of theTIs [62,63]. Finally, it may be worthwhile to investigatenew applications that can be enabled by tunable hyperbolicpolaritons. Harnessing such types of modes for hyperlensing[64–66] or focusing [23,24] has been widely discussed. Thepresent work shows that the GH effect and its dependenceon doping and dielectric environment of the TI can be anotheravenue for applications, for example, THz chemical sensing orcharacterization of spatially inhomogeneous TI samples. Wehope our work can stimulate these and other future studies.
ACKNOWLEDGMENTS
This work is supported by the University of CaliforniaOffice of the President and by the ONR.
APPENDIX: NEAR-FIELD SPECTRA
A fully realistic modeling of the s-SNOM imaging exper-iments proposed in Sec. IV is an unwieldy task requiring arepeated solution of the Maxwell equations for a system withcomplicated material properties, a hierarchy of widely differ-ent length scales, and no special symmetries. In this Appendix,we present some results of less ambitious calculations thatsimulate a simpler structure depicted in Fig. 1(b). Although nosplit gate is present in this structure, the measured signal is stillexpected to reveal characteristics of the collective modes. Inthis case, these modes are excited by the sharp tip itself. Hencethe tip plays the role of both the launcher and the detectorof the HP3 modes. Unfortunately, this implies that only thelocal response can be measured, which is a superposition ofresponses due to a distribution of momenta up to qt ∼ 1/R
rather than one specific q.We assume that the TI slab and the substrate are infinite
and uniform in x and y coordinates, so that the imagingcapability of the s-SNOM is irrelevant. Instead, the quantityof interest is the frequency dependence of the measurednear-field signal s(ω). A few more explanations about ourcalculational scheme are in order. We model the tip as ametallic spheroid with the curvature radius R = 40 nm andtotal length 720 nm. We use the quasistatic approximationbut include the radiative corrections included perturbatively.This model [67,68] has been successful for simulating manyrecent s-SNOM experiments, and should be especially suitablein the THz domain where no antenna resonances or otherstrong retardation effects [69] should appear. Our calculationsincorporate the so-called far-field factors [67–69], which areexpressed in terms of rP (q,ω) at q ∼ ω/c. This factors accountfor the fact that the incident wave is originally created by afar-field source and the scattered wave is ultimately measuredby a far-field detector. Finally, what we compute is not thefull scattering amplitude s but its third harmonic s3, whichis what experimentalists typically report. The idea is thatin the experiment the tip is made to oscillate at some lowfrequency , so that s is periodic with this fundamental tappingfrequency. The third Fourier harmonic of s, which is s3, givesa good representation of the genuine near-field signal.
Naively, one can think of s3(ω) as a weighted averageof the surface reflectivity rP (q,ω) over q. The weighting
205430-9
JHIH-SHENG WU, D. N. BASOV, AND M. M. FOGLER PHYSICAL REVIEW B 92, 205430 (2015)
|s 3|(
arb.
u.)
ω (cm−1)0 100 200 300 400
0
5
10
40 nm
60 nm
80 nm
100 nm
120 nm
|s 3|(
arb.
u.)
ω (cm−1)0 100 200 300 400
0
5
10
0
0.1 eV
0.2 eV
0.29 eV
μ = 0.29 eV
d = 120 nm
(a)
(b)
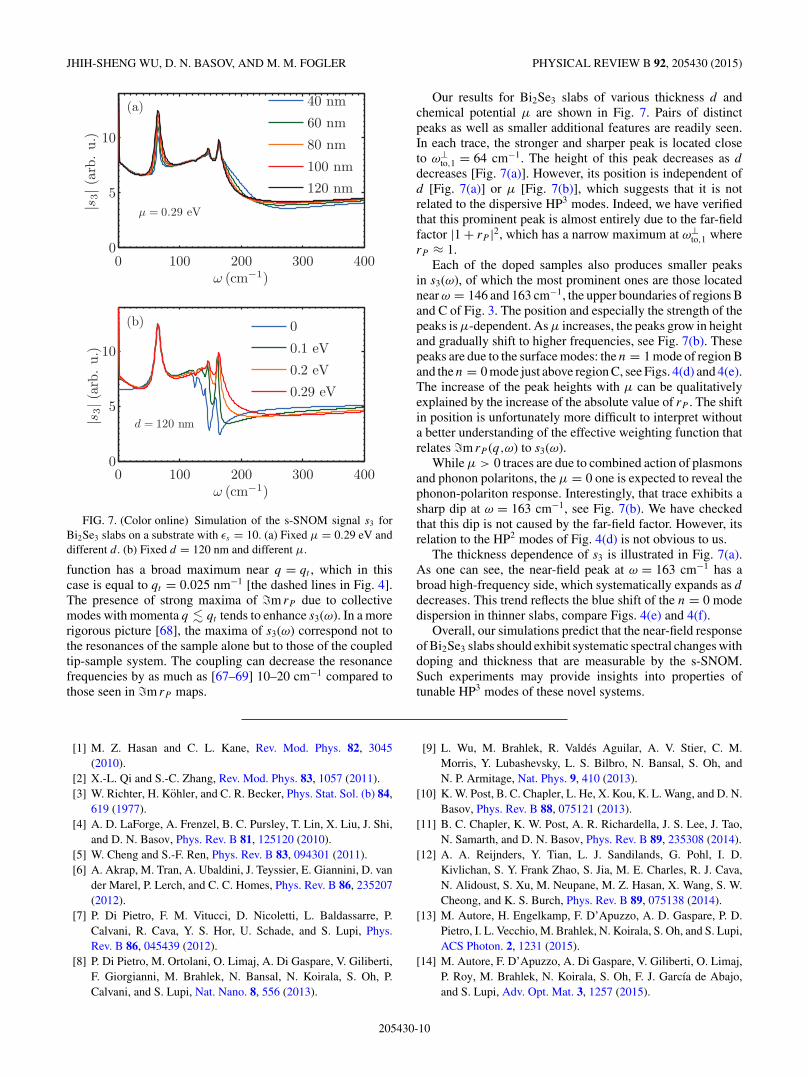
FIG. 7. (Color online) Simulation of the s-SNOM signal s3 forBi2Se3 slabs on a substrate with εs = 10. (a) Fixed μ = 0.29 eV anddifferent d . (b) Fixed d = 120 nm and different μ.
function has a broad maximum near q = qt , which in thiscase is equal to qt = 0.025 nm−1 [the dashed lines in Fig. 4].The presence of strong maxima of m rP due to collectivemodes with momenta q � qt tends to enhance s3(ω). In a morerigorous picture [68], the maxima of s3(ω) correspond not tothe resonances of the sample alone but to those of the coupledtip-sample system. The coupling can decrease the resonancefrequencies by as much as [67–69] 10–20 cm−1 compared tothose seen in m rP maps.
Our results for Bi2Se3 slabs of various thickness d andchemical potential μ are shown in Fig. 7. Pairs of distinctpeaks as well as smaller additional features are readily seen.In each trace, the stronger and sharper peak is located closeto ω⊥
to,1 = 64 cm−1. The height of this peak decreases as d
decreases [Fig. 7(a)]. However, its position is independent ofd [Fig. 7(a)] or μ [Fig. 7(b)], which suggests that it is notrelated to the dispersive HP3 modes. Indeed, we have verifiedthat this prominent peak is almost entirely due to the far-fieldfactor |1 + rP |2, which has a narrow maximum at ω⊥
to,1 whererP ≈ 1.
Each of the doped samples also produces smaller peaksin s3(ω), of which the most prominent ones are those locatednear ω = 146 and 163 cm−1, the upper boundaries of regions Band C of Fig. 3. The position and especially the strength of thepeaks is μ-dependent. As μ increases, the peaks grow in heightand gradually shift to higher frequencies, see Fig. 7(b). Thesepeaks are due to the surface modes: the n = 1 mode of region Band the n = 0 mode just above region C, see Figs. 4(d) and 4(e).The increase of the peak heights with μ can be qualitativelyexplained by the increase of the absolute value of rP . The shiftin position is unfortunately more difficult to interpret withouta better understanding of the effective weighting function thatrelates m rP (q,ω) to s3(ω).
While μ > 0 traces are due to combined action of plasmonsand phonon polaritons, the μ = 0 one is expected to reveal thephonon-polariton response. Interestingly, that trace exhibits asharp dip at ω = 163 cm−1, see Fig. 7(b). We have checkedthat this dip is not caused by the far-field factor. However, itsrelation to the HP2 modes of Fig. 4(d) is not obvious to us.
The thickness dependence of s3 is illustrated in Fig. 7(a).As one can see, the near-field peak at ω = 163 cm−1 has abroad high-frequency side, which systematically expands as d
decreases. This trend reflects the blue shift of the n = 0 modedispersion in thinner slabs, compare Figs. 4(e) and 4(f).
Overall, our simulations predict that the near-field responseof Bi2Se3 slabs should exhibit systematic spectral changes withdoping and thickness that are measurable by the s-SNOM.Such experiments may provide insights into properties oftunable HP3 modes of these novel systems.
[1] M. Z. Hasan and C. L. Kane, Rev. Mod. Phys. 82, 3045(2010).
[2] X.-L. Qi and S.-C. Zhang, Rev. Mod. Phys. 83, 1057 (2011).[3] W. Richter, H. Kohler, and C. R. Becker, Phys. Stat. Sol. (b) 84,
619 (1977).[4] A. D. LaForge, A. Frenzel, B. C. Pursley, T. Lin, X. Liu, J. Shi,
and D. N. Basov, Phys. Rev. B 81, 125120 (2010).[5] W. Cheng and S.-F. Ren, Phys. Rev. B 83, 094301 (2011).[6] A. Akrap, M. Tran, A. Ubaldini, J. Teyssier, E. Giannini, D. van
der Marel, P. Lerch, and C. C. Homes, Phys. Rev. B 86, 235207(2012).
[7] P. Di Pietro, F. M. Vitucci, D. Nicoletti, L. Baldassarre, P.Calvani, R. Cava, Y. S. Hor, U. Schade, and S. Lupi, Phys.Rev. B 86, 045439 (2012).
[8] P. Di Pietro, M. Ortolani, O. Limaj, A. Di Gaspare, V. Giliberti,F. Giorgianni, M. Brahlek, N. Bansal, N. Koirala, S. Oh, P.Calvani, and S. Lupi, Nat. Nano. 8, 556 (2013).
[9] L. Wu, M. Brahlek, R. Valdes Aguilar, A. V. Stier, C. M.Morris, Y. Lubashevsky, L. S. Bilbro, N. Bansal, S. Oh, andN. P. Armitage, Nat. Phys. 9, 410 (2013).
[10] K. W. Post, B. C. Chapler, L. He, X. Kou, K. L. Wang, and D. N.Basov, Phys. Rev. B 88, 075121 (2013).
[11] B. C. Chapler, K. W. Post, A. R. Richardella, J. S. Lee, J. Tao,N. Samarth, and D. N. Basov, Phys. Rev. B 89, 235308 (2014).
[12] A. A. Reijnders, Y. Tian, L. J. Sandilands, G. Pohl, I. D.Kivlichan, S. Y. Frank Zhao, S. Jia, M. E. Charles, R. J. Cava,N. Alidoust, S. Xu, M. Neupane, M. Z. Hasan, X. Wang, S. W.Cheong, and K. S. Burch, Phys. Rev. B 89, 075138 (2014).
[13] M. Autore, H. Engelkamp, F. D’Apuzzo, A. D. Gaspare, P. D.Pietro, I. L. Vecchio, M. Brahlek, N. Koirala, S. Oh, and S. Lupi,ACS Photon. 2, 1231 (2015).
[14] M. Autore, F. D’Apuzzo, A. Di Gaspare, V. Giliberti, O. Limaj,P. Roy, M. Brahlek, N. Koirala, S. Oh, F. J. Garcıa de Abajo,and S. Lupi, Adv. Opt. Mat. 3, 1257 (2015).
205430-10

TOPOLOGICAL INSULATORS ARE TUNABLE WAVEGUIDES . . . PHYSICAL REVIEW B 92, 205430 (2015)
[15] K. W. Post, B. C. Chapler, M. K. Liu, J. S. Wu, H. T. Stinson,M. D. Goldflam, A. R. Richardella, J. S. Lee, A. A. Reijnders,K. S. Burch, M. M. Fogler, N. Samarth, and D. N. Basov, Phys.Rev. Lett. 115, 116804 (2015).
[16] Y. Guo, C. L. Newman, W. Cortes, and Z. Jacob, Adv.OptoElectron. 2012, 452502 (2012).
[17] A. Poddubny, I. Iorsh, P. Belov, and Y. Kivshar, Nat. Photon. 7,948 (2013).
[18] J. Sun, N. M. Litchinitser, and J. Zhou, ACS Photon. 1, 293(2014).
[19] M. Esslinger, R. Vogelgesang, N. Talebi, W. Khunsin, P.Gehring, S. de Zuani, B. Gompf, and K. Kern, ACS Photon.1, 1285 (2014).
[20] S. Dai, Z. Fei, Q. Ma, A. S. Rodin, M. Wagner, A. S. McLeod,M. K. Liu, W. Gannett, W. Regan, K. Watanabe, T. Taniguchi,M. Thiemens, G. Dominguez, A. H. Castro Neto, A. Zettl, F.Keilmann, P. Jarillo-Herrero, M. M. Fogler, and D. N. Basov,Science 343, 1125 (2014).
[21] Z. Jacob, Nat. Mater. 13, 1081 (2014).[22] J. D. Caldwell, A. V. Kretinin, Y. Chen, V. Giannini,
M. M. Fogler, Y. Francescato, C. T. Ellis, J. G. Tischler, C.R. Woods, A. J. Giles, M. Hong, K. Watanabe, T. Taniguchi,S. A. Maier, and K. S. Novoselov, Nat. Commun. 5, 5221(2014).
[23] S. Dai, Q. Ma, T. Andersen, A. S. Mcleod, Z. Fei, M. K.Liu, M. Wagner, K. Watanabe, T. Taniguchi, M. Thiemens, F.Keilmann, P. Jarillo-Herrero, M. M. Fogler, and D. N. Basov,Nat. Commun. 6, 6963 (2015).
[24] P. Li, M. Lewin, A. V. Kretinin, J. D. Caldwell, K. S. Novoselov,T. Taniguchi, K. Watanabe, F. Gaussmann, and T. Taubner, Nat.Commun. 6, 7507 (2015).
[25] Z. Shi, H. A. Bechtel, S. Berweger, Y. Sun, B. Zeng, C. Jin, H.Chang, M. C. Martin, M. B. Raschke, and F. Wang, ACS Photon.2, 790 (2015).
[26] V. W. Brar, M. S. Jang, M. Sherrott, J. J. Lopez, and H. A.Atwater, Nano Lett. 13, 2541 (2013).
[27] S. Dai, Q. Ma, M. K. Liu, T. Andersen, Z. Fei, M. D. Goldflam,M. Wagner, K. Watanabe, T. Taniguchi, M. Thiemens, F.Keilmann, G. C. A. M. Janssen, S.-E. Zhu, P. Jarillo-Herrero,M. M. Fogler, and D. N. Basov, Nat. Nanotechnol. 10, 682(2015).
[28] G. X. Ni, H. Wang, J. S. Wu, Z. Fei, M. D. Goldflam, F.Keilmann, B. Ozyilmaz, A. H. Castro Neto, X. M. Xie, M. M.Fogler, and D. N. Basov, Nat. Mater. (to be published).
[29] A. Tomadin, F. Guinea, and M. Polini, Phys. Rev. B 90, 161406(2014).
[30] A. H. Castro Neto, F. Guinea, N. M. R. Peres, K. S. Novoselov,and A. K. Geim, Rev. Mod. Phys. 81, 109 (2009).
[31] E. H. Hwang and S. Das Sarma, Phys. Rev. B 80, 205405(2009).
[32] S. Raghu, S. B. Chung, X.-L. Qi, and S.-C. Zhang, Phys. Rev.Lett. 104, 116401 (2010).
[33] Z. Fei, G. O. Andreev, W. Bao, L. M. Zhang, A. S. McLeod, C.Wang, M. K. Stewart, Z. Zhao, G. Dominguez, M. Thiemens,M. M. Fogler, M. J. Tauber, A. H. Castro-Neto, C. N.Lau, F. Keilmann, and D. N. Basov, Nano Lett. 11, 4701(2011).
[34] Z. Fei, A. S. Rodin, G. O. Andreev, W. Bao, A. S. McLeod, M.Wagner, L. M. Zhang, Z. Zhao, M. Thiemens, G. Dominguez,
M. M. Fogler, A. H. Castro Neto, C. N. Lau, F. Keilmann, andD. N. Basov, Nature (London) 487, 82 (2012).
[35] J. Chen, M. Badioli, P. Alonso-Gonzalez, S. Thongrattanasiri,F. Huth, J. Osmond, M. Spasenovic, A. Centeno, A. Pesquera,P. Godignon, A. Z. Elorza, N. Camara, F. J. Garcıa de Abajo,R. Hillenbrand, and F. H. L. Koppens, Nature (London) 487, 77(2012).
[36] A. N. Grigorenko, M. Polini, and K. S. Novoselov, Nat. Photon.6, 749 (2012).
[37] R. E. V. Profumo, R. Asgari, M. Polini, and A. H. MacDonald,Phys. Rev. B 85, 085443 (2012).
[38] F. J. Garcıa de Abajo, ACS Photon. 1, 135 (2014).[39] D. N. Basov, M. M. Fogler, A. Lanzara, F. Wang, and Y. Zhang,
Rev. Mod. Phys. 86, 959 (2014).[40] T. Stauber, G. Gomez-Santos, and L. Brey, Phys. Rev. B 88,
205427 (2013).[41] R. Schutky, C. Ertler, A. Trugler, and U. Hohenester, Phys. Rev.
B 88, 195311 (2013).[42] J. Qi, H. Liu, and X. C. Xie, Phys. Rev. B 89, 155420
(2014).[43] M. Li, Z. Dai, W. Cui, Z. Wang, F. Katmis, J. Wang, P. Le, L.
Wu, and Y. Zhu, Phys. Rev. B 89, 235432 (2014).[44] T. Stauber, J. Phys.: Condens. Matter 26, 123201 (2014).[45] F. Goos and H. Hanchen, Ann. Phys. 436, 333 (1947).[46] K. Y. Bliokh and A. Aiello, J. Opt. 15, 014001 (2013).[47] F. Keilmann and R. Hillenbrand, Phil. Trans. Roy. Soc. London,
Ser. A 362, 787 (2004).[48] J. M. Atkin, S. Berweger, A. C. Jones, and M. B. Raschke, Adv.
Phys. 61, 745 (2012).[49] B. Wunsch, T. Stauber, F. Sols, and F. Guinea, New J. Phys. 8,
318 (2006).[50] E. H. Hwang and S. Das Sarma, Phys. Rev. B 75, 205418
(2007).[51] J. P. F. LeBlanc and J. P. Carbotte, Phys. Rev. B 89, 035419
(2014).[52] H. T. Stinson, J. S. Wu, B. Y. Jiang, Z. Fei, A. S. Rodin,
B. C. Chapler, A. S. McLeod, A. Castro Neto, Y. S. Lee,M. M. Fogler, and D. N. Basov, Phys. Rev. B 90, 014502(2014).
[53] Z. Sun, A. Gutierrez-Rubio, D. N. Basov, and M. M. Fogler,Nano Lett. 15, 4455 (2015).
[54] F. Huerkamp, T. A. Leskova, A. A. Maradudin, and B. Baumeier,Opt. Express 19, 15483 (2011).
[55] K. Artmann, Ann. Phys. 437, 87 (1948).[56] T. Tamir and A. Oliner, Proc. IEEE 51, 317
(1963).[57] T. Tamir and H. L. Bertoni, J. Opt. Soc. Am. 61, 1397
(1971).[58] S. L. Chuang, J. Opt. Soc. Am. A 3, 593 (1986).[59] X. Yin, L. Hesselink, Z. Liu, N. Fang, and X. Zhang, Appl. Phys.
Lett. 85, 372 (2004).[60] T. Feurer, N. S. Stoyanov, D. W. Ward, J. C. Vaughan, E.
R. Statz, and K. A. Nelson, Ann. Rev. Mater. Res. 37, 317(2007).
[61] D. Jin, A. Kumar, K. Hung Fung, J. Xu, and N. X. Fang, Appl.Phys. Lett. 102, 201118 (2013).
[62] J. J. Cha, K. J. Koski, K. C. Y. Huang, K. X. Wang, W. Luo, D.Kong, Z. Yu, S. Fan, M. L. Brongersma, and Y. Cui, Nano Lett.13, 5913 (2013).
205430-11

JHIH-SHENG WU, D. N. BASOV, AND M. M. FOGLER PHYSICAL REVIEW B 92, 205430 (2015)
[63] J.-Y. Ou, J.-K. So, G. Adamo, A. Sulaev, L. Wang, and N. I.Zheludev, Nat. Commun. 5, 5139 (2014).
[64] Z. Jacob, L. V. Alekseyev, and E. Narimanov, Opt. Express 14,8247 (2006).
[65] A. Salandrino and N. Engheta, Phys. Rev. B 74, 075103(2006).
[66] Z. Liu, H. Lee, Y. Xiong, C. Sun, and X. Zhang, Science 315,1686 (2007).
[67] L. M. Zhang, G. O. Andreev, Z. Fei, A. S. McLeod, G.Dominguez, M. Thiemens, A. H. Castro-Neto, D. N. Basov,and M. M. Fogler, Phys. Rev. B 85, 075419 (2012).
[68] B.-Y. Jiang, L. M. Zhang, A. H. Castro Neto, D. N. Basov, andM. M. Fogler, arXiv:1503.00221.
[69] A. S. McLeod, P. Kelly, M. D. Goldflam, Z. Gainsforth, A. J.Westphal, G. Dominguez, M. H. Thiemens, M. M. Fogler, andD. N. Basov, Phys. Rev. B 90, 085136 (2014).
205430-12