total factor productivity, intangible assets and spatial
TRANSCRIPT

HAL Id: hal-00671230https://hal.archives-ouvertes.fr/hal-00671230
Submitted on 17 Feb 2012
HAL is a multi-disciplinary open accessarchive for the deposit and dissemination of sci-entific research documents, whether they are pub-lished or not. The documents may come fromteaching and research institutions in France orabroad, or from public or private research centers.
L’archive ouverte pluridisciplinaire HAL, estdestinée au dépôt et à la diffusion de documentsscientifiques de niveau recherche, publiés ou non,émanant des établissements d’enseignement et derecherche français ou étrangers, des laboratoirespublics ou privés.
Total factor productivity, intangible assets and spatialdependence in the European regionsBarbara Dettori, Emanuela Marrocu, Raffaele Paci
To cite this version:Barbara Dettori, Emanuela Marrocu, Raffaele Paci. Total factor productivity, intangible assets andspatial dependence in the European regions. Regional Studies, Taylor & Francis (Routledge), 2011,pp.1. �10.1080/00343404.2010.529288�. �hal-00671230�

For Peer Review O
nly
Total factor productivity, intangible assets and spatial
dependence in the European regions
Journal: Regional Studies
Manuscript ID: CRES-2009-0235.R1
Manuscript Type: Main Section
JEL codes:
C31 - Cross-Sectional Models|Spatial Models < C3 - Econometric
Methods: Multiple/Simultaneous Equation Models < C - Mathematical and Quantitative Methods, O47 - Measurement of Economic Growth|Aggregate Productivity < O4 - Economic Growth and Aggregate Productivity < O - Economic Development, Technological Change, and Growth, O52 - Europe < O5 - Economywide Country Studies < O - Economic Development, Technological Change, and Growth, R11 - Regional Economic Activity: Growth, Development, and Changes < R1 - General Regional Economics < R - Urban, Rural, and Regional Economics
Keywords: Total factor productivity, human capital, social capital, technology, European regions
http://mc.manuscriptcentral.com/cres Email: [email protected]
Regional Studies

For Peer Review O
nly
Page 1 of 44
http://mc.manuscriptcentral.com/cres Email: [email protected]
Regional Studies
123456789101112131415161718192021222324252627282930313233343536373839404142434445464748495051525354555657585960

For Peer Review O
nly
1
Total factor productivity, intangible assets
and spatial dependence in the European regions
Barbara Dettori, Emanuela Marrocu, Raffaele Paci
Università di Cagliari and CRENoS
BARBARA DETTORI, CRENoS, Università di Cagliari, Via San Giorgio 12, 09124 Cagliari,
Italy
EMANUELA MARROCU, CRENoS, Università di Cagliari, Via San Giorgio 12, 09124
Cagliari, Italy
RAFFAELE PACI, CRENoS, Università di Cagliari, Via San Giorgio 12, 09124 Cagliari,
Italy
(Received July 2009: in revised form September 2010)
Page 2 of 44
http://mc.manuscriptcentral.com/cres Email: [email protected]
Regional Studies
123456789101112131415161718192021222324252627282930313233343536373839404142434445464748495051525354555657585960
For Peer Review O
nly
2
Abstract
The aim of the paper is to analyse the determinants of the efficiency levels across the
European regions. First we derive a regression based measure of regional TFP by estimating a
spatial Cobb-Douglas production function. Secondly we investigate the role played by
intangible factors (human capital, social capital and technological capital) on the TFP levels
by applying the spatial 2SLS method and the SHAC estimator to account for both
heteroskedasticity and spatial autocorrelation. It turns out that a large part of TFP differences
across the European regions are explained by the disparities in the endowments of these
intangible assets.
Keywords: Total factor productivity; human capital; social capital; technology; Europe.
JEL: C31, C33, O47, O52, R11
Page 3 of 44
http://mc.manuscriptcentral.com/cres Email: [email protected]
Regional Studies
123456789101112131415161718192021222324252627282930313233343536373839404142434445464748495051525354555657585960

For Peer Review O
nly
3
1. Introduction
Recent empirical literature on economic growth, both at country and regional level,
has shown that the differences in the income levels are mainly due to disparities in the Total
Factor Productivity (TFP) levels and to a lesser extent to the factors of production.
EASTERLY and LEVINE (2001) report that more than 90% of the differences in growth
rates among nations are explained by TFP rather than traditional factor accumulation.
Moreover, a strong stylized fact that emerges from the empirical literature is that regional
disparities are larger and more persistent when compared to cross countries differences, at
least within the industrialized economies (see MAGRINI, 2004, for a review).
Since the differences in productivity turn out to depend on the efficiency levels, the
attention of economists has been increasingly devoted to search for additional factors which
may contribute to account for such disparities. Several explanations for the TFP gap have
been put forward, but among them a key role appears to be played by the intangible factors:
human capital, social capital and technology. They create the base of the “knowledge
economy” which, in turn, constitutes the most favourable environment to foster the economic
performance of countries and regions, as stated by the Lisbon declaration in 2000. As a matter
of fact, in the industrialized economies the ability to compete in the open markets is
increasingly based on production factors like the quality of labour, the degree of cohesion, the
level of trust in the society and the accumulation of technological capital. However, there is a
lack of systematic studies on the effects of different kinds of intangible assets on the
economic performance at the regional level. In a number of studies human capital is often
included as a determinant of the efficiency level, other works emphasize the effects of the
knowledge-creation process and, only recently, social capital has been considered as a
relevant variable in the context of explaining TFP variation across regions.
Page 4 of 44
http://mc.manuscriptcentral.com/cres Email: [email protected]
Regional Studies
123456789101112131415161718192021222324252627282930313233343536373839404142434445464748495051525354555657585960

For Peer Review O
nly
4
The main purpose and the novelty of this paper are to assess the effect of three
different types of intangible assets on the economic performance at the regional level in
Europe. Ideally, such a purpose would be nicely pursued by augmenting the traditional
production function model with proxy variables for the intangible factors. However, for the
European regions data on human, technological or social capital are not consistently available
for all the regions over the entire sample period considered in this study. To deal with this
severe lack of data we adopt a two-step estimation strategy. In the first stage, we derive a
measure of the TFP for the European regions by estimating a Cobb-Douglas production
function that includes only the traditional inputs: physical capital and labour. This is done in a
panel data context controlling for spatial dependence, time series non-stationarity and
endogeneity. The estimated fixed effects represent an accurate long-run measure of regional
TFP which is directly derived from the production function estimation without imposing any
(untested) restriction on the inputs elasticity parameters. In the second step we provide some
interesting new evidence on the role played by intangible assets in determining the regional
level of efficiency by including them as regressors in a model for the TFP data obtained in the
first stage. It is worth stressing that, to the best of our knowledge, this is the first attempt to
estimate “simultaneously” the effects of three different types of intangible capitals on the
regional level of productivity.
The paper is organised as follows. In section 2 we present the results for the Cobb-
Douglas production function estimation and derive the TFP variable. In section 3 we discuss
the main features of the intangible factors and analyse the related literature. The econometric
evidence on the role played by intangible assets in enhancing regional productivity is
discussed in section 4. Section 5 offers some concluding remarks.
Page 5 of 44
http://mc.manuscriptcentral.com/cres Email: [email protected]
Regional Studies
123456789101112131415161718192021222324252627282930313233343536373839404142434445464748495051525354555657585960

For Peer Review O
nly
5
2. Measuring total factor productivity
2.1 Data description and spatial patterns
Our two step strategy for the estimation of regional total factor productivity starts with
the specification of the traditional Cobb-Douglas production function, which includes the
conventional inputs, physical capital and labour, for a panel of 199 European regions
observed over the period 1985-2006; the regions belong to 15 member countries of the EU15
plus Switzerland and Norway. We follow the NUTS classification provided by Eurostat and
select national and sub-national units, combination of NUTS 0, 1 and 2 levels, characterized
by an adequate degree of administrative and economic control (see Appendix 1 for details). A
detailed description of the variables used in this study, along with the indication of the
sources, is presented in Appendix 2.
For each region and year, over the period 1985-2006, the stock of physical capital is
calculated, by applying the perpetual inventory method, from the flow of gross investment in
the previous period and assuming an annual depreciation rate equal to 10%. The capital stock
value for the initial year 1984 has been assumed equal to the cumulative sum of investment
flows over the ten-year period 1975-1984.
In Figure 1 the geographical pattern of value added (panel a) and capital stock (panel
b) is depicted by reporting the quintile distribution of the time average; the series are rescaled
with respect to the population size in order to reduce the degree of heterogeneity across
regions.
[FIGURE 1 AROUND HERE]
Figure 1.a shows evidence of significant cross-region dependence in the value added
distribution that follows a clear spatial scheme: among the worst performers are all the Greek
and Portuguese regions, four Spanish regions and the South of Italy. The top region is
Denmark followed by Inner London, Zurich, Bruxelles and Oslo. All Swiss high performing
Page 6 of 44
http://mc.manuscriptcentral.com/cres Email: [email protected]
Regional Studies
123456789101112131415161718192021222324252627282930313233343536373839404142434445464748495051525354555657585960

For Peer Review O
nly
6
regions create a well defined cluster, as well as the Norwegian ones and a group of German
and Austrian regions; also the Southern area of the United Kingdom forms a cluster of high
value added regions. The spatial distribution of labour units is very similar and is not reported
here to save space. Figure 1.b shows the distribution of the physical capital stock: Central and
Northern Europe show a large high-performance cluster, which starts from Steiermark in
Austria, passes through most of the Southern German regions and ends with Denmark and the
Southern regions of Norway. Detached from this cluster, one finds the capital regions of
London (which shows the best performance) and Paris (Île de France). The regions displaying
the worst performance are located at the European borders: in the West with Portugal and
Spain, and in the South with the Southern regions of Italy and the Greek ones. As regards
spatial variability, value added shows a stronger dispersion of values across regions, as
indicated by a higher coefficient of variation (0.39) with respect to capital stock (0.31) and
labour units (0.17).
The presence of spatial dependence, evident in the figures discussed above, is formally
tested by means of the cross-section dependence (CD) test proposed by PESARAN (2004)
and the panel version of the Moran’s I test (KELEJIAN and PRUCHA, 2001). All tests
turned out to be highly significant leading to the rejection of the null hypothesis of no cross
section dependence among the European regions1. The CD test provides evidence that
significant correlation is present between pairs of regions for all variables, while the Moran’s
I test suggests that such a correlation is most likely due to spatial interdependence among
regions2.
The estimation procedure presented in the next section will deal with this aspect of the
data.
2.2 Some econometric issues
Page 7 of 44
http://mc.manuscriptcentral.com/cres Email: [email protected]
Regional Studies
123456789101112131415161718192021222324252627282930313233343536373839404142434445464748495051525354555657585960

For Peer Review O
nly
7
The traditional Cobb-Douglas production function which includes the conventional
inputs, physical capital and labour is formulated as:
u
ititiit eLKAY 21 ββ= (1)
where Y is value added at 2000 base prices; K is the stock of capital; L are labour units; A is
the efficiency level; u is an error term; i=1,2,...N=199 regions and t=1,2…T=22 (period 1985-
2006); all variables are normalised to population in order to control for different size of the
regions.
We estimate the production function in a log–linear form within a spatial lag
framework. The empirical panel model is specified as follows:
ittitititiit uyWlkαy +++++= θρββ~
21 (2)
where low capital letters represent the log-transformed variables, ai are the regional fixed
effects, which, as will be discussed later on, represent our measure for total factor
productivity, ityW~ 3 is the spatially lagged dependent variable, W
~ is the normalized weight
matrix; we have also included time fixed effects to account for common shocks affecting the
pooled regions.
The choice of the spatial lag model specification was motivated by two fundamental
reasons; the first one is based on the importance to explicitly model (potential) economic
spillovers arriving from neighbouring regions4. The second motive is related to the issue of
tackling the possible endogeneity of the capital and the labour inputs; as pointed out by
FINGLETON and LE GALLO, 2008 (page 230) consistent estimators are only the IV ones
derived within a spatial lag specification. The elements of the (before normalization) weight
matrix W are given by the inverse of the square distance expressed in kilometres across
regions. This choice was driven by preliminary error diagnostics as the linear weights did not
prove adequate to capture the spatial structure present in the data; the square values are
Page 8 of 44
http://mc.manuscriptcentral.com/cres Email: [email protected]
Regional Studies
123456789101112131415161718192021222324252627282930313233343536373839404142434445464748495051525354555657585960

For Peer Review O
nly
8
supposed to be more informative and more powerful in discriminating between neighbouring
and distant regions as they increase the relative weights of the closest ones.
The issue of normalization of the W matrix has recently received increasing interest
given its economic – rather than pure statistical – content. In most applied studies W is row-
standardized such that each row sum to unity; in this case the impact of all other regions on a
particular region i is given by the weighted average of all regions’ impacts and it is implicitly
assumed that only relative rather than absolute distance matters5. Alternatively, the W matrix
can be normalized with respect to a single normalization factor, its largest row/column sum or
its largest characteristic root. In a recent paper KELEJIAN and PRUCHA, 2010, argue that
such a normalization is sufficient, while row-normalization imposes strong restrictions on the
spatial process since each row of the W matrix is normalized in a different way.
In this study we apply the largest eigenvalue normalization, which, differently from
the row-standardization, has also the nice feature that the symmetry of the weights is
preserved6; this is particularly important when W is an inverse distance matrix used to
describe a “distance decay” type of economic behaviour, as stated in ANSELIN, 1988
“scaling the rows so that the weights sum to one may result in a loss of that interpretation”7.
As far as the endogeneity issue is concerned, model (2) above is characterized by an
“intrinsic” endogeneity problem arising from the inclusion of the spatial term, which induces
a two-way causality in the neighbour relation in space. In this case consistent estimators are
the ones derived from the maximum likelihood method or from the two-stage least squares
(2SLS) one, based on the inclusion of instrumental variables. In the growing empirical
literature on spatial models great care has been devoted so far in tackling the endogeneity due
to the spatially lagged term while the potential endogeneity of the explanatory variables has
often been overlooked, particularly in the panel data context8. In this study we attempt to take
also into account the endogeneity between output and the production factors which can arise
Page 9 of 44
http://mc.manuscriptcentral.com/cres Email: [email protected]
Regional Studies
123456789101112131415161718192021222324252627282930313233343536373839404142434445464748495051525354555657585960

For Peer Review O
nly
9
from system feedbacks or measurement errors9. Since the usual Durbin-Wu-Hausman (DWH)
test points out that the stock of capital and (marginally) the labour units can be considered
endogenous with respect to value added10, we adopt the 2SLS estimation method in order to
estimate the single structural equation we are interested in – the production function - without
explicitly modelling the entire system relationships causing simultaneity (as in FINGLETON
and LE GALLO, 2008). Following DALL’ERBA and LE GALLO, 2008, in this work the
instruments for the productive factors are derived by applying the 3-group method proposed
by KENNEDY, 2008. Spatial lags of the 3-group instruments are considered for the spatially
lagged dependent variable (KELEJIAN and PRUCHA, 1999).
2.3 Econometric results
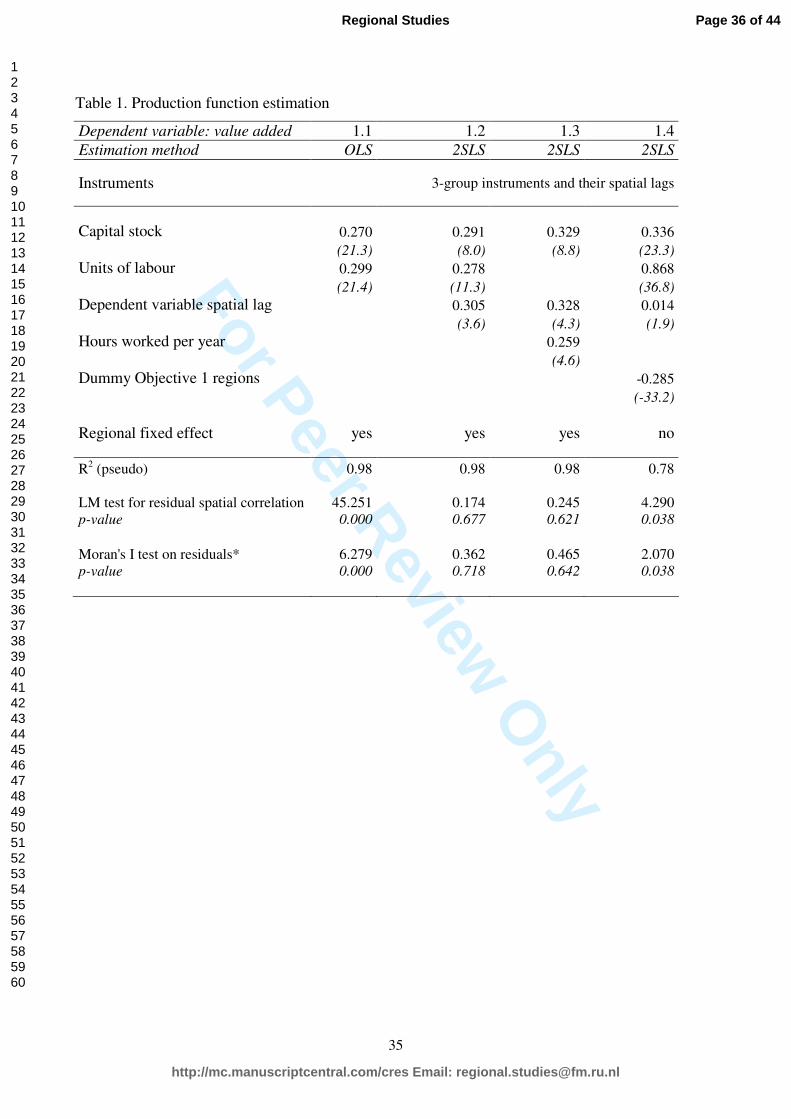
The estimation results are reported in Table 1. We first present the estimated results of
a sort of a “benchmark” model, which is a standard fixed effects model with time dummies of
the log-linearized version of the Cobb-Douglas function reported in (1), we then propose
different specifications of spatial panel models which explicitly take into account the
geographical correlation among the European regions.
[TABLE 1 AROUND HERE]
The first column (1.1) reports the OLS estimation results for the basic model which,
besides the individual intercepts and the dummy variables, includes only the traditional
productive factors. The estimated coefficients are 0.27 for the capital stock and 0.30 for the
labour input. At the bottom of the column we report the LM test for (remaining) spatial error
correlation11 and the Moran’s I test; both tests indicate that, as expected, the estimated
residuals are affected by spatial dependence12.
Regression 1.2 results from the application of the spatial 2SLS estimator, which allows
to jointly take into account the two different sources of endogeneity discussed above13; the
Page 10 of 44
http://mc.manuscriptcentral.com/cres Email: [email protected]
Regional Studies
123456789101112131415161718192021222324252627282930313233343536373839404142434445464748495051525354555657585960

For Peer Review O
nly
10
instruments included are the 3-group-method instruments for capital and labour and functions
of their spatial lags, their adequacy is assessed by the Sargan’s test, which yields a p-value of
0.14. The estimated coefficients are 0.291 for capital and 0.278 for labour; no evidence of
spatial correlation is detected for the estimated residuals according to LM test and the
Moran’s I one14.
Note that the coefficients associated with each production input cannot be directly
interpreted as an elasticity due to the presence of spillover effects, which through the spatial
multiplier, lead to a different spatial steady-state equilibrium as a consequence of a unit (or
percentage) change in one of the regressors. The spatial multiplier can be derived from the
following compact reduced form expression for model (2):
( )[ ] ( )[ ] uWIIXWIIy NTNT
11 ~(
~(
−−
−⊗+−⊗= ρβρ (3)
where the labour and capital input are included in the X matrix.
Assuming that the weight matrix is row-standardized, LeSage and Pace (2009) explain that
the direct effect of a unit (or percentage) change in the rth variable for region i is obtained as
the own-partial derivative of yi with respect to xir calculated from the function
( ) ( )[ ]rTNNT IWIIWS βρ
1~(
~ −
−⊗= , while indirect effects are given by the cross-partial derivatives;
the total effect is obtained as the sum of direct and indirect effects.
For regression 1.2 we calculate the average summary expressions for the three effects;
for the capital input the direct effect is 0.291 and the total one is 0.294; while for the case of
labour they are 0.278 and 0.281, respectively. These reported values have to be cautiously
interpreted since the summary measures are computed under the assumption that the weight
matrix is row-standardized, while, as discussed above, we have preferred the largest
eigenvalue normalization15. Notwithstanding this point, the estimated model provides
valuable indications on the role played by productive inputs and spatial spillovers in
determining the regional output level in Europe.
Page 11 of 44
http://mc.manuscriptcentral.com/cres Email: [email protected]
Regional Studies
123456789101112131415161718192021222324252627282930313233343536373839404142434445464748495051525354555657585960

For Peer Review O
nly
11
Regression 1.2 represent the base model for the calculation of the regional TFP
variable, while the last two regressions reported in Table 1 allow to evaluate some particular
aspects of the production function relationship. Specifically, regression 1.3 allows us to check
for the robustness of a different measure of the labour input. We include the variable “hours
worked per year” in place of “units of labour” to control for differences in the weekly worked
hours provided for by different national legislation. The estimated coefficients (0.26 for
labour and 0.33 for capital) are in line with those obtained from the previous specification.
Finally, as the estimation of the regional production function is relevant in its own
right - beside serving as the base for measuring total factor productivity – we also investigate
whether Objective 1 regions exhibit a significantly different performance with respect to the
average of the regions; the results point out that, for the same level of capital and labour
endowments, the Objective 1 regions show a considerable lower level of production; it is
worth noting that in regression 1.4 no fixed effects are included and this results in higher
estimated coefficients for both productive inputs while the spatially lagged term is associated
with a very low coefficient; this results in a misspecified model with spatially autocorrelated
errors as diagnosed by the LM test and the Moran’s I test.
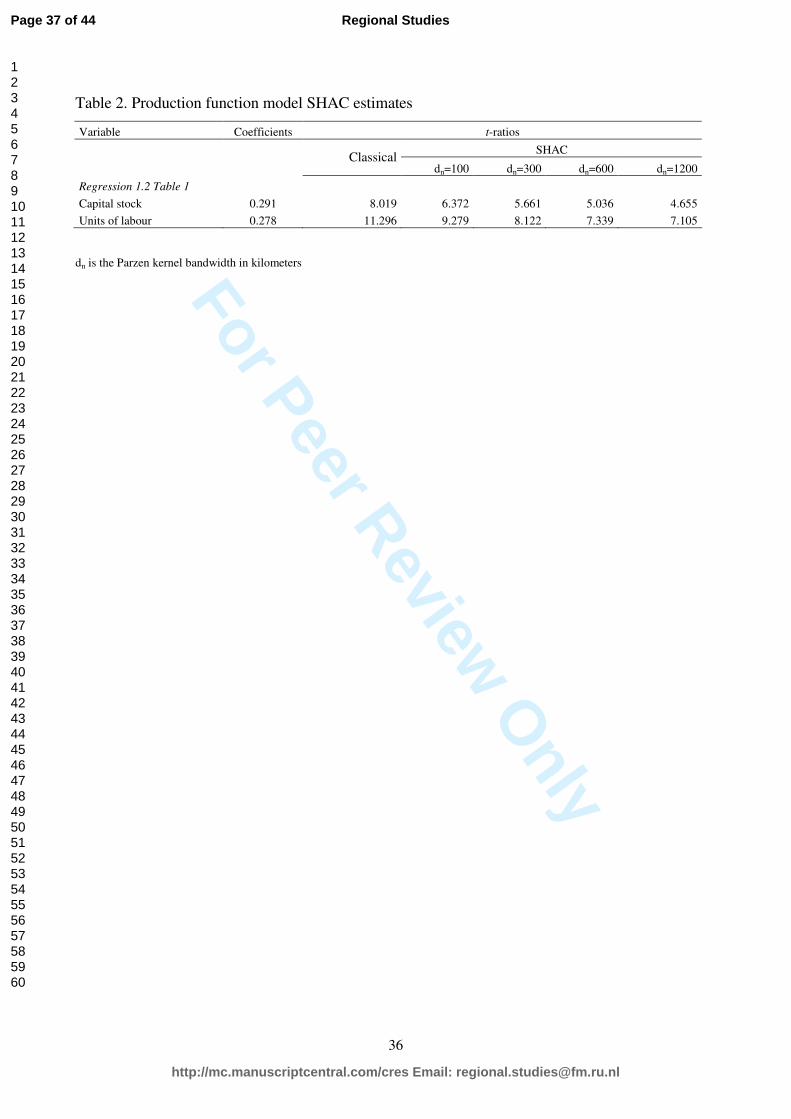
For the estimated models reported in Table 1 we guard against possible
heteroskedasticity and remaining spatial correlation by extending to our panel data framework
the spatial heteroskedasticy and correlation consistent (SHAC) estimator for the variance-
covariance matrix, proposed by KELEJIAN and PRUCHA, 2007. More specifically, in order
to estimate each element of the variance-covariance matrix we chose the Parzen kernel
function, as defined in ANDREWS, 1991, whose argument is given by the ratio of the
distance between each pair of regions to a selected bandwidth; for the latter we consider the
following values: 100, 300, 600 and 1200 kilometers; the first is a very short distance, the
Page 12 of 44
http://mc.manuscriptcentral.com/cres Email: [email protected]
Regional Studies
123456789101112131415161718192021222324252627282930313233343536373839404142434445464748495051525354555657585960

For Peer Review O
nly
12
others distances approximately correspond to the lower decile, the lower quintile and the
median of all the regional distances considered.
In Table 2 we report the results for the t-ratios based on the SHAC estimates; in order
to save space we present those for the main explanatory variables of model 1.2 of Table 116.
[TABLE 2 AROUND HERE]
Overall the results obtained confirm the significance of all the regressors included in
the model specifications considered; as expected t-ratios (standard-errors) tend to decrease
(increase) as a function of the bandwidth selected.
2.4 Total Factor Productivity
Total factor productivity at regional level, which, as known, measures the efficiency in
transforming physical capital and labour into output, is derived from the fixed effects obtained
from the estimation of regression 1.2. This approach was advanced, among others, by Islam
(1999 and references therein) and it allows to measure TFP as long run equilibrium (average)
values17.
The average values of TFP, computed as index relative to the European average, for
the period 1986-2006 are reported in Figure 2.a.
[FIGURE 2 AROUND HERE]
Denmark is the leading region, with values nearly triple the European average, way
ahead of the other regions in the ranking. Zurich, the capital regions of, Luxembourg,
Belgium (Bruxelles) and Norway (Oslo) follow at some distance. Note that the efficiency
index displays greater variability in the high end of the ranking, compared to the tail.
As for the geographical distribution of the index, we observe in the centre of Europe
the concentration of high values around Switzerland and Western Germany regions. Moreover
the TFP map shows the highest levels for all Norwegian regions, North Eastern and Eastern
Page 13 of 44
http://mc.manuscriptcentral.com/cres Email: [email protected]
Regional Studies
123456789101112131415161718192021222324252627282930313233343536373839404142434445464748495051525354555657585960

For Peer Review O
nly
13
Scotland, a cluster of regions in the south area of UK, three Dutch regions (Groningen,
Utrecht and Noord-Holland), Lombardia (Italy) and the capital regions of France (Île de
France), Sweden (Stockholm) and Austria (Wien). Good results are also displayed by the
Swedish regions, the French regions of Rhône-Alpes, Provence-Alpes-Côte d’Azur and
Alsace, the western regions of Aquitaine and Midi-Pyrenees, and the Centre-north of Italy
(Trentino, Lazio, Val d’Aosta and Emilia Romagna). Most of the regions of Portugal, Spain
(except for the capital Madrid), Southern Italy and Greece (except for Sterea Ellada) stay in
the lower part of the ranking. A very low value is unexpectedly found for the region of Outer-
London, this might be due to the presence of a high flow of labour commuting to Inner
London.
Figure 2.a clearly depicts a spatial correlation pattern for the regional values of total
factor productivity values across Europe; this is confirmed by the significant value (17.02) we
found for the Moran’s I test. In the following sections we investigate the determinants of TFP
levels within a spatial lag model framework.
3. Intangible assets
An original aspect of this paper is that we analyse the concurrent effects of three types
of intangible capitals: social capital, human capital and technological capital. In general, these
intangible inputs are supposed to enhance the level of regional efficiency by creating a more
favourable economic environment for the localised firms; for this reason in the Lisbon agenda
they are considered strategic in economic growth policies. A complementary perspective,
based on micro data, considers the intangible assets as part of business investment, like
software, R&D expenditure, patents, economic competencies, employee training (OECD,
1998). It is worth noting that MARROCU et al., 2009 for a large panel of European
companies estimate that the share of the intangible assets over the tangible one is rapidly
Page 14 of 44
http://mc.manuscriptcentral.com/cres Email: [email protected]
Regional Studies
123456789101112131415161718192021222324252627282930313233343536373839404142434445464748495051525354555657585960

For Peer Review O
nly
14
increasing and in 2006 it has reached, on average, the value of 42%, thus confirming the
importance of including intangibles assets as determinants of productivity.
As mentioned in the introduction, one novelty of our contribution is to consider how
regional productivity levels in Europe are influenced by social capital, which is an aspect
often neglected in economic analyses as pointed out, among others, by COLEMAN, 1990 and
TEMPLE and JOHNSON, 1998. In his well known contribution on regional development in
Italy, PUTNAM, 1993, stated that social capital is a complex feature of social organization –
represented by networks, norms and trust – which improves the efficiency of the local society
by facilitating the coordination among actors. Since then a growing number of papers have
tried to assess its role remarking how a high level of social capital in a certain area is
associated with a reduction of transaction costs for both firms and consumers (DIANI, 2004),
a wider diffusion of knowledge and innovation among firms (HAUSER et al., 2007) and
widespread trust which, in turn, facilitates cooperation among the members of a community;
all these effects are proved to enhance the economic performance (KNACK and KEEFER,
1997).
It is not an easy task to measure a complex, and often informal, phenomenon as social
capital (GLAESER et al., 2002) and in the empirical works several indicators have been used.
We list some relevant contributions to give an idea of the huge variability that characterizes
the selection of sound and satisfactory indicators for social capital: newspaper reading and
referenda turnout (HELLIWELL and PUTNAM, 1995), blood donation (GUISO et al., 2004),
social infrastructure (HALL and JONES, 1999), level of trust (LA PORTA et al., 1997),
density of voluntary organisation (PALDAM and SVENDSEN, 2000), associational activity
(BEUGELSDIJK and VAN SCHAIK, 2005). In this paper, as a proxy for regional social
capital, we use the notion of “active social participation” measured by the share of population
that have taken part at least once in the last 12 months in social activities such as voluntary
Page 15 of 44
http://mc.manuscriptcentral.com/cres Email: [email protected]
Regional Studies
123456789101112131415161718192021222324252627282930313233343536373839404142434445464748495051525354555657585960

For Peer Review O
nly
15
service, unions and cultural associations meetings over total population. This proxy, as
emphasized in PUTNAM, 1993 seminal paper, considers the structural features of social
capital which are assumed to facilitate the creation of “bridging networks”, social ties and
coordination among local agents. A dense network of association and participation
encourages cooperation skills and collective efforts, therefore enhancing the efficiency of the
local economy. The data on social participation come from the European Social Survey and
have the advantage of giving a homogeneous measure of social capital at the regional level
for the European countries considered.
The distribution of social capital across the European regions for the year 2002 is
presented in Figure 2.b18. With reference to the geographical distribution of social capital in
Europe note that high values are located next to areas characterised by much lower values.
The regions boasting the highest value of our indicator are located in the Scandinavian
peninsula, in the four regions of Germany’s Baden-Württemberg, in France’s Mediterranean
and Pyrenees areas and in the UK’s South-West.
The literature has also emphasized the positive role of human capital on productivity
level and growth (MANKIW et al., 1992; BENHABIB and SPIEGEL, 1994). At the regional
level a higher availability of well educated labour forces represents an advantage for the
localization of innovative firms thus promoting local productivity (RAUCH, 1993). As a
proxy of “high” human capital we use the share of population that has attained at least a
university degree (ISCED 5-6). This proxy has been used for the European regions also by
BOTTAZZI and PERI, 2003, and STERLACCHINI, 2008.
The distribution of human capital across the European regions for the year 2002 is
represented in Figure 2.c. Italy stands out for having all regions in the lowest class, while all
other countries, although displaying values below the European average, show greater
variability and have at least one region higher up in the rankings. This is the case with
Page 16 of 44
http://mc.manuscriptcentral.com/cres Email: [email protected]
Regional Studies
123456789101112131415161718192021222324252627282930313233343536373839404142434445464748495051525354555657585960
For Peer Review O
nly
16
Portugal (with the Lisboa region) and Greece (with Attiki e Kentriki Makedonia). Note the
excellent performance of Norway, Scotland, Finland’s southernmost regions (Etela-Suomi
and Lansi-Suomi) and eastern Spain (Cataluña, Aragona, Navarra, Pais Basco and Cantabria).
The inclusion in the production function of a direct measure of technological stock has
been originally suggested by GRILICHES, 1979, and afterwards the knowledge-capital model
has been used in several contributions at firms level and also extended to macroeconomic
models both at regional and country level. The idea is that technology is partly a public good,
firms benefit from a higher degree of knowledge capital available in their areas since it leads
to an increase in productivity. There is a huge number of contributions, based on different
theoretical approaches, that have studied the effect of technology on the economic
performance and also how this effect spills over the regional boundaries to influence
contiguous areas (for a comprehensive survey see AUDRETSCH and FELDMAN, 2004).
Some recent studies, in the same vein of our contribution, have examined the effects of
technological capital on the economic performance of the European regions. FISCHER et al.
(2009b) find a positive influence of patent stock on TFP together with a significant
interregional knowledge spillovers effect. The analyses proposed by STERLACCHINI, 2008
and RODRIGUEZ-POSE and CRESCENZI, 2008 are more general and offer support to the
positive role exerted by R&D expenditure on GDP growth rate controlling also for other
regional determinants like human capital and infrastructures.
There is a long standing debate on how to measure technological activity and all the
proposed measures have pros and cons. Among them patent counts have the clear advantage
of providing long time span along with large regional and sectoral coverage; moreover it has
been proved that they are closely correlated with other measures of innovation, like R&D
expenditures and new products (GRILICHES, 1990; ACS et al. 2002). Therefore, in this
paper, as an indicator for technological capital we use the number of patent applications
Page 17 of 44
http://mc.manuscriptcentral.com/cres Email: [email protected]
Regional Studies
123456789101112131415161718192021222324252627282930313233343536373839404142434445464748495051525354555657585960

For Peer Review O
nly
17
adhering to the Patent Cooperation Treaty; this choice ensures that only patent with a good
economic value are likely to be considered since this international protection of innovation is
costly. In order to control for the high variability of the regional annual series, the indicator is
computed as patent stock in the previous five years, over total population. The data have been
regionalised on the basis of the inventors’ residence; in the case of patents with multiple
inventors proportional quotas have been attributed to each region.
The distribution of technological capital across the European regions in the year 2002
is represented in the last panel of Figure 2; its per capita values show a large high-
performance cluster, which starts from Rhône-Alpes (in France), passes through all Swiss
regions and ends at the South-central part of Germany (Oberbayern, Freiburg, Stuttgart,
Rheinhessen-Pfalz, Mittelfranken, Karlsruhe, Oberpfalz, Darmstadt, Tubingen, Unterfranken,
Oberfranken). Close to this agglomeration are those of Düsseldorf and Köhln. These top-
performance regions are surrounded by other high-performance countries. Detached from this
cluster, one finds the capital region of Paris (Île de France). Sweden, Finland and Denmark
show top-high innovation performance, suggesting the presence of a Scandinavian cluster. All
southern European regions are characterised by very low levels of technological capital.
4. Econometric estimation and results
The purpose of this section is to provide empirical evidence on the role of intangible
assets in determining the level of TFP for the European regions. As stated in the introduction,
due to the lack of available long time series for variables such as social capital, our analysis is
now carried out in a cross-section framework. The estimations are based on the model
specification reported below:
iiNiiii aWtkhkskca ερβββ +++++=~
321 (4)
Page 18 of 44
http://mc.manuscriptcentral.com/cres Email: [email protected]
Regional Studies
123456789101112131415161718192021222324252627282930313233343536373839404142434445464748495051525354555657585960
For Peer Review O
nly
18
where small letters indicate values in logs; i are the 199 regions, a is total factor productivity,
sk is social capital, hk is human capital and tk is technological capital; iN aW~
is the spatially
lagged dependent variable computed with the same normalized weight matrix adopted in
section 3. All variables are normalised to population in order to control for different size of
the regions. TFP is derived from regression 1.2 in Table 1. For the explanatory variables the
values refer to the 2002 year.
Due to potential system feedbacks, omitted variables and measurement errors,
endogeneity problems can also be present in model (4); therefore, following ANSELIN and
LOZANO-GRACIA (2008), we apply the spatial 2SLS method, which allows guarding
against endogeneity bias coming from different sources. The instruments for the explanatory
variables are constructed by following the 3-group method, as discussed in the previous
section, while the spatial lag term is instrumented by the spatial lags of the other instrumental
variables19.
The results for the TFP spatial lag model estimated by 2SLS are reported in Table 3.
The first column presents the base model where all the intangible assets exhibit positive and
significant coefficients: 0.14 for social capital, 0.17 for human capital and 0.06 for
technological capital. With the caveats already reported in the previous session, we have
calculated the direct, indirect and total impacts for the three intangible assets. For social
capital the direct impact is 0.142 and the total one is 0.151; for human capital they are 0.177
and 0.188, respectively, while for technological capital they amount to 0.063 and 0.068.
Although these effects are to be cautiously interpreted, the estimation results provide
convincing evidence on the crucial role played by intangible productive factors as
determinants of regional TFP.
[TABLE 3 AROUND HERE]
Page 19 of 44
http://mc.manuscriptcentral.com/cres Email: [email protected]
Regional Studies
123456789101112131415161718192021222324252627282930313233343536373839404142434445464748495051525354555657585960

For Peer Review O
nly
19
As we have already pointed out this is the first time that the simultaneous effect of
these intangible assets on productivity is examined, we can not therefore compare the
magnitude of our results with previous literature. Within a knowledge production function
model, the positive effects of various form of “soft” inputs (human capital, R&D, social
capital) for a small sample of European regions has been shown by TAPPEINER et al.
(2008). For the case of Italian regions the positive role of some intangible inputs was
documented by MARROCU and PACI (2010) and by DI GIACINTO and NUZZO (2006).
Evidence on the influence of human capital for the European regions case has been found by
BOTTAZZI and PERI (2003) within a knowledge production function model and by
STERLACCHINI (2008) and FISCHER et al. (2009a) in a productivity growth model; the
latter authors also find an unexpected spatial indirect negative effect coming from
neighbouring regions. As far as the social capital variable is concerned, a positive effect of the
active participation in associational activity on GDP growth rate of 54 NUTS-1 regions
belonging to 7 European countries is found by BEUGELSDIJK and VAN SCHAIK (2005),
who also show that trust is never significant. A positive influence of technology, measured by
patent stock, on TFP is shown, within a spatial model, by LESAGE and FISCHER (2009) and
FISCHER et al. (2009b) for the European regions and by MADSEN (2008) for the OECD
countries.
In order to check for the correct specification of the spatial pattern we calculate the
IV-Moran’s I test (ANSELIN and KELEJIAN, 1997). According to the test result, no
evidence of remaining residual spatial autocorrelation was found. Note that the coefficient of
the spatially lagged term is strongly significant and high in value (0.89) confirming the
occurrence of external spillovers from other regions even after controlling for the effects of
the intangible factors.
Page 20 of 44
http://mc.manuscriptcentral.com/cres Email: [email protected]
Regional Studies
123456789101112131415161718192021222324252627282930313233343536373839404142434445464748495051525354555657585960

For Peer Review O
nly
20
We conduct a robustness check for the base specification by including a different
proxy for human capital (regression 3.2) and for technological capital (regression 3.3). 20. For
the first case we include an indicator of permanent education (share of population involved in
lifelong learning programmes)21. The coefficient turns out to be positive and significant
although its magnitude (0.053) is much lower than the previous proxy.
The new proxy for technology - called knowledge capital - is calculated as the total
funding by European Commission under the Fifth Framework Program (the program covers
the 5-year period 1998-2002). Data on individual projects were regionalized by means of the
address and postcodes of participants (MAGGIONI et al., 2007). In case of more than one
participant, a proportional share of the funding was assigned to each of them. This new
variable is expected to capture the effects of the creation of (new) knowledge on regional
TFP; such effects are supposed to be more widespread and less specific, at least with respect
to economic efficiency levels, than the ones induced by the patent activity. The coefficient of
the knowledge capital variable is of the same order of magnitude as the one associated with
technological capital, however its inclusion in the specification makes the coefficient of social
capital higher. This result may be due to possible complementarities between the two assets.
A thorough investigation of such complementarities in enhancing efficiency levels is left for
future research.
Although the focus of this paper is on investigating the role of intangible assets in
determining TFP, we are aware that such a complex economic phenomenon may depend on
other factors. The empirical literature has identified in a good network of public infrastructure
one of these factors22. As a proxy for infrastructures in this paper we use a composite index of
accessibility based on the potential accessibility by road, train and air and on the time
necessary to reach the market (with a negative sign); it takes the value 1 when the
accessibility is very low and reaches the value 5 for a very high accessibility level. In order to
Page 21 of 44
http://mc.manuscriptcentral.com/cres Email: [email protected]
Regional Studies
123456789101112131415161718192021222324252627282930313233343536373839404142434445464748495051525354555657585960

For Peer Review O
nly
21
investigate the potential of physical infrastructure in determining TFP, we augment the base
model with the “tangible” accessibility covariate. The results, reported in column 3.4 of Table
3, confirm the estimated coefficients for the intangible assets and offer empirical support to
the hypothesis that a high degree of accessibility is TFP enhancing.
The literature has emphasised the localised nature of spatial knowledge spillovers
which are facilitated by common institutions and culture and by face-to-face interactions. It is
well-known that knowledge flows often spill beyond regional and national borders although
they tend to decline with distance (see the recent survey by DÖRING and
SCHNELLENBACH, 2006). Therefore it is an interesting issue to assess which is the
“crucial” distance to allow the benefits of one region to spill over the neighbouring ones. We
calculate different non-overlapping weight matrices according to the distance selected; we
start from a distance of 0-300 km which guarantees that every single region has at least a
connection to another region; we then consider three more distance ranges: 300-600, 600-900
and 900-1200. Note that the cut-offs distances - 300, 600 and 1200 km - roughly correspond
to the lower decile, the lower quintile and the median of the regional distances among the
European regions considered. Although we are aware that the wideness of the interval is
arbitrary, on the basis of preliminary investigations we believe that we can derive some
interesting insights on the spatial pattern of the regional spillovers.
The results for regression 3.5, where we include the four spatially lagged terms
disaggregated according to the range distances, reveal that only the first two are significant
thus signalling that the relevant links are those within a 600 km distance. Note that with the
exception of the accessibility variable, all the explanatory variables remain significant and the
Moran’s I test does not signal residual spatial autocorrelation. To check our results we then
re-estimate regression 3.1 by including only one spatially lagged term in turn23. The evidence
corroborates the previous finding, as only the 0-300 and the 300-600 lagged terms turned out
Page 22 of 44
http://mc.manuscriptcentral.com/cres Email: [email protected]
Regional Studies
123456789101112131415161718192021222324252627282930313233343536373839404142434445464748495051525354555657585960

For Peer Review O
nly
22
to be significant, however it is worth noting that when considering distances higher than 300
km the residuals are always spatially correlated indicating that the 300 km distance range is
capturing most of the spatial dependency present in the data.
These results are in line with previous findings which have remarked the localised
nature of geographical spillovers among the European regions, although direct comparisons
are problematic given the heterogeneity of the methodological approaches and geographical
units considered. More specifically, within a knowledge production function approach,
BOTTAZZI and PERI (2003) find that technological spillovers are positive and significant
only up to a radius of 300 km and MORENO et al. (2005) up to 250 km or 2nd order
contiguity. In a regional growth model PACI and PIGLIARU (2002) show that spatial
spillovers influence productivity up to the 3rd order contiguity and RODRIGUEZ-POSE and
CRESCENZI (2008) up to 3 hours drive (equivalent to approximately 200-300 km). It is
worth noticing that in our data set the regions included in 1st order contiguity have an average
distance of 158 km, in the 2nd order 287 km and in the 3rd order 418 km. In conclusion, the
empirical evidence indicates that spatial spillovers are important in determining the economic
performance of the European regions and that their influence tends to rapidly decay once a
distance of, roughly, 300 km is reached.
We also calculate the SHAC estimates for the variance-covariance matrix; in Table 4
the t-ratios are reported for the main specification 3.1.
[TABLE 4 AROUND HERE]
All the TFP determinants maintain their significance, thus confirming previous
inference and the contribution of intangible assets in determining productivity24.
Page 23 of 44
http://mc.manuscriptcentral.com/cres Email: [email protected]
Regional Studies
123456789101112131415161718192021222324252627282930313233343536373839404142434445464748495051525354555657585960

For Peer Review O
nly
23
5. Concluding remarks
The aim of this paper has been twofold. First, we have derived a regression based
measure of regional TFP for Europe, which has the nice advantage of not imposing a priori
restrictions on the inputs elasticities; this is done by estimating a Cobb-Douglas production
function relationship which includes the traditional inputs as well as a measure of spatial
interdependence across regions.
Secondly, we have investigated the determinants of the TFP levels by analyzing the
role played by intangible factors: social capital, human capital and technological capital. This
was motivated by a wide recent literature providing evidence which suggests that the
economic performance across regions differ not only in traditional factor endowments (labour
and physical capital) but mainly in technological, human and social capital.
In the first part of the paper we have estimated a production function model over the
period 1985-2006, which serves as the base to derive the regional TFP variable; this is
obtained from an adequately specified model which properly accounts for the spatial pattern
present in the data, without overlooking relevant econometric issues such as endogeneity and
non-stationarity. The estimated TFP levels point out a concentration of high values around
Switzerland, Holland, Western Germany and Norway. Most of the Swedish regions, the
French Southern and Western regions and the Centre-north of Italy display values above
average. Finally, most of the regions in Portugal, Spain and Greece are at the bottom of the
ranking.
In the second part of the paper we have investigated the determinants of TFP level
among the European regions. At the best of our knowledge, this paper represents the first
attempt aimed at assessing the effects of three kinds of intangible assets on the regional
efficiency levels in Europe. The estimated models have provided robust evidence on the role
played by technological, human and social capital in enhancing economic growth and social
Page 24 of 44
http://mc.manuscriptcentral.com/cres Email: [email protected]
Regional Studies
123456789101112131415161718192021222324252627282930313233343536373839404142434445464748495051525354555657585960

For Peer Review O
nly
24
cohesion. This result indicates that a region with a higher level of social participation and
cooperation enjoys a higher degree of trust among the members of the community and this
enhances the economic efficiency. At the same time the local economy benefits from the
presence of a well educated labour force which facilitates the localization of innovative firms
and thus boosts the productivity of the entire economy. Finally, the presence in the region of
high levels of technological capital turns out to be beneficial for the regional total factor
productivity since local firms can benefit from the public good characteristic of technology.
We have also performed some robustness exercises including different proxy for the human
capital (lifelong learning participation) and for technological capital (participation to the
Community 5FP) and the results remain unchanged. Moreover we control for the
characteristics of the regions in terms of accessibility and this “tangible” asset turns out to
positively influence the regional TFP level.
The issue of spatial dependence has been extensively examined through means of
spatial lag models. The coefficients of the spatially lagged variable appear always positive
and strongly significant confirming the existence of external spillovers from other regions,
which through the spatial multiplier reinforce the effects of each region’s own intangible
factors. More specifically, the spatial spillovers seem to generate their strongest impacts in the
range 0-300 km which roughly represents the lower decile of the distances among the
European regions considered. This result confirm previous evidence on the fact that spatial
spillovers are somehow bounded in space and that knowledge diffusion is more effective
among closer regions.
In general our results have some interesting policy implications since they stress the
importance of policy strategies aimed at accelerating the accumulation of the intangible assets
which constitute highly effective production endowments. Such policies will allow the
Page 25 of 44
http://mc.manuscriptcentral.com/cres Email: [email protected]
Regional Studies
123456789101112131415161718192021222324252627282930313233343536373839404142434445464748495051525354555657585960

For Peer Review O
nly
25
European economy to become, as put forward in the Lisbon agenda, the most advanced and
productive society in the world.
Acknowledgments: The research leading to these results has received funding from the
European Community's Seventh Framework Programme (FP7/2007-2013) under grant
agreement n° 216813.
We would also like to thank for their useful comments participants at 2008 ERSA
Conference, 2009 SEA Conference and to DECA-CRENoS seminar. We have also benefited
from fruitful discussions with Paola Zuddas. We thank Francesca Alberti, Giuliana Caruso
and Marta Foddi for valuable assistance in preparing the database. We would also like to
thank J.Paul Elhorst for kindly making publicly available the matlab routines for estimating
spatial models.
Page 26 of 44
http://mc.manuscriptcentral.com/cres Email: [email protected]
Regional Studies
123456789101112131415161718192021222324252627282930313233343536373839404142434445464748495051525354555657585960

For Peer Review O
nly
26
References
ACS Z., L. ANSELIN and A. VARGA (2002) Patents and innovation counts as measures of
regional production of new knowledge, Research Policy, 31, 1069–1085.
ANDREWS, D.W.K. (1991) Heteroskedasticity and autocorrelation consistent covariance
matrix estimation, Econometrica, 59, 817-858.
ANSELIN L (1988) Spatial econometrics: methods and models. Dordrecht: Kluwer.
ANSELIN L. and H.H. KELEJIAN (1997) Testing for spatial error autocorrelation in the
presence of endogenous regressors, International Regional Science Review, 20, 153–182.
ANSELIN L. and N. LOZANO-GRACIA (2008) Errors in variables and spatial effects in
hedonic house price models of ambient air quality, Empirical Economics, 34, 5–34.
ANSELIN L., J. LE GALLO and J. HUBERT (2008) Spatial panel econometrics, in Mátyás
L. and Sevestre P. (eds) The Econometrics of Panel Data. Berlin Heidelberg: Springer-
Verlag.
AUDRETSCH D. and M. FELDMAN (2004), Knowledge spillovers and the geography of
innovation, in Henderson V. and J.F. Thisse (eds.) Handbook of Regional and Urban
Economics: Cities and Geography. Amsterdam: Elsevier.
ASCHAUER D. (1989) Is public expenditure productive? Journal of Monetary Economics,
23, 177-200.
BALTAGI B., P. EGGER and M. PFAFFERMAYR (2008) Estimating regional trade
agreements effects on FDI in an interdependent world, Journal of Econometrics, 145,
194-208.
Page 27 of 44
http://mc.manuscriptcentral.com/cres Email: [email protected]
Regional Studies
123456789101112131415161718192021222324252627282930313233343536373839404142434445464748495051525354555657585960

For Peer Review O
nly
27
BENHABIB J. and M. SPIEGEL (1994) The role of Human Capital in Economic
Development: evidence from aggregate cross-country data, Journal of Monetary
Economics, 34, 143-174.
BEUGELSDIJK S. and T. VAN SCHAIK (2005) Social capital and growth in European
regions: an empirical test, European Journal of Political Economy, 39, 301–324.
BOTTAZZI L. and G. PERI (2003) Innovation and Spillovers in Regions: evidence from
European Patent Data, European Economic Review, 47, 687-710.
CASELLI F. (2005) Accounting for Cross-Country Income Differences, in Aghion P. and
Durlauf S. (eds), Handbook of Economic Growth. Amsterdam: Elsevier.
COLEMAN J. (1990) Foundations of Social Theory. Cambridge MA: Harvard University
Press.
DALL’ERBA S. and J. LE GALLO (2008) Regional convergence and the impact of
European structural funds over 1989–1999: a spatial econometric analysis, Papers in
Regional Science, 87, 219–244.
DETTORI B., E. MARROCU and R. PACI (2008) Total factor productivity, intangible assets
and spatial dependence in the European regions, CRENoS WP 2008/23.
DI GIACINTO V. and G. NUZZO (2006) Explaining labour productivity differentials across
Italian regions: the role of socio-economic structure and factor endowments, Papers in
Regional Science, 85, 299-320.
DIANI M. (2004) How associations matter. An empirical assessment of the social capital-
trust-voluntary action link, in Prakash S. and Selle P. (eds) Investigating Social Capital.
Comparative perspectives on civil society, participation, and governance. New Delhi:
Sage.
Page 28 of 44
http://mc.manuscriptcentral.com/cres Email: [email protected]
Regional Studies
123456789101112131415161718192021222324252627282930313233343536373839404142434445464748495051525354555657585960

For Peer Review O
nly
28
DÖRING T. and SCHNELLENBACH J. (2006) What do we know about geographical
knowledge spillovers and regional growth?: a survey of the literature, Regional
Studies, 40, 375-395.
EASTERLY W. and R. LEVINE (2001) It's Not Factor Accumulation: Stylized Facts and
Growth Models, World Bank Economic Review, 15, 177-219.
EBERTS R. (1990) Public infrastructure and regional economic development, Economic
Review, Federal Reserve Bank of Cleveland, 26, 15-27.
ELHORST J.P. (2010) Spatial Panel Data Models, in Fischer M. and Getis A. (eds)
Handbook of Applied Spatial Analysis. Berlin: Springer.
ELHORST J.P., U. BLIEN and K. WOLF (2007) New evidence on the wage curve: A spatial
panel approach, International Regional Science Review , 30, 173-191.
FINGLETON, B. and J. LE GALLO (2008) Estimating spatial models with endogenous
variables, a spatial lag and spatially dependent disturbances: finite sample properties,
Papers in Regional Science, 87, 319-339.
FISCHER M.M., M. BARTKOWSKA, A. RIEDL, S. SARDADVAR and A. KUNNERT
(2009a) The impact of human capital on regional labor productivity in Europe, Journal
Letters in Spatial and Resource Sciences, 2, 97-108.
FISCHER M.M., T. SCHERNGELL and M. REISMANN (2009b) Knowledge spillovers and
total factor productivity. Evidence using a spatial panel data model, Geographical
Analysis, 41, 204-220.
GLAESER E., D. LAIBSON and B. SACERDOTE (2002) An Economic Approach to Social
Capital, Economic Journal, 112, 437-458.
Page 29 of 44
http://mc.manuscriptcentral.com/cres Email: [email protected]
Regional Studies
123456789101112131415161718192021222324252627282930313233343536373839404142434445464748495051525354555657585960

For Peer Review O
nly
29
GRAMLICH E.M. (1994) Infrastructure investment: a review essay, Journal of Economic
Literature, 32, 1176-1199.
GRILICHES Z. (1979) Issues in Assessing the Contribution of Research and Development to
Productivity Growth, The Bell Journal of Economics, 10, 92-116.
GRILICHES Z. (1990) Patent statistics as economic indicators: a survey, Journal of
Economic Literature, 28, 1661–1707.
GUISO L., P. SAPIENZA and L. ZINGALES (2004) The Role of Social Capital in Financial
Development, American Economic Review, 94, 526-556.
HALL R.E. and C.I. JONES (1999) Why Do Some Countries Produce So Much More Output
Per Worker Than Others? The Quarterly Journal of Economics, 114, 83-116.
HELLIWELL J. and R. PUTNAM (1995) Economic growth and social capital in Italy,
Eastern Economic Journal, 21, 295-307.
HAUSER C., TAPPEINER G. and J. WALDE (2007) The Learning Region: The Impact of
Social Capital and Weak Ties on Innovation, Regional Studies, 41, 75-88.
ISLAM, N. (1999) International comparison of total factor productivity: a review, Review of
Income and Wealth, 45, 493-518.
KELEJIAN H.H. and I.R. PRUCHA (1999) A generalized moments estimator for the
autoregressive parameter in a spatial model, International Economic Review, 40, 509-
533.
KELEJIAN H.H. and I.R. PRUCHA (2001) On the asymptotic distribution of the Moran I test
with applications, Journal of Econometrics, 104, 219-257.
KELEJIAN H.H. and I.R. PRUCHA (2004) Estimation of simultaneous systems of spatially
interrelated cross sectional equations, Journal of Econometrics, 118, 27–50.
Page 30 of 44
http://mc.manuscriptcentral.com/cres Email: [email protected]
Regional Studies
123456789101112131415161718192021222324252627282930313233343536373839404142434445464748495051525354555657585960

For Peer Review O
nly
30
KELEJIAN H.H. and I.R. PRUCHA (2007) HAC estimation in a spatial framework, Journal
of Econometrics, 140, 131–154.
KELEJIAN H.H. and I.R. PRUCHA (2010) Specification and estimation of spatial
autoregressive models with autoregressive and heteroskedastic disturbances, Journal of
Econometrics, 157, 53-67.
KENNEDY P. A guide to econometrics. Oxford: Blackwell. 2008
KNACK S. and P. KEEFER (1997) Does social capital have an economic payoff ? A cross-
country investigation, Quarterly Journal of Economics, 112, 1251-1288.
LA PORTA R., F. LOPEZ-DE-SILANES, A. SHLEIFER and R.W. VISHNY (1997) Trust in
Large Organizations, American Economic Review Papers and Proceedings, 87, 333-338.
LESAGE J.P. and M.M. FISCHER (2009) The impact of knowledge capital on regional total
factor productivity, SSRN, abstract=1088301.
LESAGE J.P. and R.K. PACE (2009) Introduction to Spatial Econometrics. Boca Raton:
CRC.
MADSEN J. (2008) Economic growth, TFP convergence, and the world export of ideas: a
century of evidence, Scandinavian Journal of Economics, 110, 145-167.
MAGGIONI M., M. NOSVELLI and T.E. UBERTI (2007) Space versus networks in the
geography of innovation: A European analysis, Papers in Regional Science, 86, 471-493.
MAGRINI S. (2004) Regional (di)convergence, in Henderson V. and J.F. Thisse (eds.)
Handbook of Regional and Urban Economics: Cities and Geography. Amsterdam:
Elsevier.
MANKIW N.G., ROMER D. and D. WEIL (1992) A contribution to the empirics of
economic growth, Quarterly Journal of Economics, 107, 407-437.
Page 31 of 44
http://mc.manuscriptcentral.com/cres Email: [email protected]
Regional Studies
123456789101112131415161718192021222324252627282930313233343536373839404142434445464748495051525354555657585960

For Peer Review O
nly
31
MARROCU E., R. PACI and M. PONTIS (2009) Intangible capital and firms productivity.
wp Crenos 2009/16.
MARROCU E. and R. PACI (2010) The effects of public capital on the productivity of the
Italian regions, Applied Economics, 42, 989-1002.
MORENO R., R. PACI, and S. USAI (2005) Spatial spillovers and innovation activity in
European Regions, Environment and Planning A, 37, 1793-1812.
OECD (1998) Measuring intangible investment: selected bibliography. Paris: OECD
Secretariat, DSTI.
PACI R. and F. PIGLIARU (2002) Technological Diffusion, Spatial Spillovers and Regional
Convergence in Europe, in Cuadrado J.R. and Parellada M. (eds) The European
Monetary Union and Regional Convergence. Berlin: Springer.
PALDAM M. and G.T. SVENDSEN (2000) An essay on social capital: looking for the fire
behind the smoke, European Journal of Political Economy, 16, 339–366
PEDRONI P. (1999) Critical values for cointegration tests in heterogeneous panels with
multiple regressor, Oxford Bulletin of Economics and Statistics, 61, 653–670.
PEDRONI P. (2004) Panel cointegration: asymptotic and finite sample properties of pooled
time series tests with an application to the PPP hypothesis, Econometric Theory, 3, 579–
625.
PESARAN M.H. (2004) General diagnostic tests for cross section dependence in panels,
University of Cambridge, wp in Economics 435.
PESARAN M.H. (2007) A simple panel unit root test in the presence of cross section
dependence, Journal of Applied Econometrics, 22, 265-312.
Page 32 of 44
http://mc.manuscriptcentral.com/cres Email: [email protected]
Regional Studies
123456789101112131415161718192021222324252627282930313233343536373839404142434445464748495051525354555657585960

For Peer Review O
nly
32
PUTNAM R. (1993). Making Democracy Work: Civic Traditions in Modern Italy. Princeton,
NJ: Princeton University Press.
RAUCH J. (1993) Productivity Gains from Geographic Concentration of Human Capital:
Evidence from the Cities, Journal of Urban Economics, 34, 380-400.
RODRIGUEZ-POSE A. and CRESCENZI R. (2008) Research and Development, Spillovers,
Innovation Systems, and the Genesis of Regional Growth in Europe, Regional Studies,
42, 51-67.
STERLACCHINI A. (2008) R&D, higher education and regional growth: Uneven linkages
among European regions, Research Policy, 37, 1096–1107.
TAPPEINER G., C. HAUSER and J. WALDE (2008) Regional knowledge spillovers: Fact or
artifact? Research Policy, 37, 861–874.
TEMPLE J. and P.A. JOHNSON (1998) Social Capability and Economic Growth, Quarterly
Journal of Economics, 113, 965-990.
Page 33 of 44
http://mc.manuscriptcentral.com/cres Email: [email protected]
Regional Studies
123456789101112131415161718192021222324252627282930313233343536373839404142434445464748495051525354555657585960

For Peer Review O
nly
33
Appendix 1. Regions and NUTS level
Country NUTS Regions
Austria 2 9 Belgium 1 3 Denmark 1 1 Finland 2 5 France (a) 2 22 Germany (b) 2 30 Greece 2 13 Ireland 2 2 Italy (c) 2 20 Luxembourg 1 1 Netherlands 2 12 Norway 2 7 Portugal (a) 2 5 Spain (a) 2 17 Sweden 2 8 Switzerland 2 7 United Kingdom 2 37
(a) Territories outside Europe are not considered (b) Berlin and East Germany regions are not considered (c) Autonomous provinces of Trento and Bolzano are aggregated
Page 34 of 44
http://mc.manuscriptcentral.com/cres Email: [email protected]
Regional Studies
123456789101112131415161718192021222324252627282930313233343536373839404142434445464748495051525354555657585960

For Peer Review Only
34
Appendix 2. Data sources and variables description
Variable Source Years Measurement unit Description
Value added Cambridge Econometrics 1985-2006 millions euros, 2000
Capital stock Own calculation 1985-2006 millions euros, 2000
Units of labour Cambridge Econometrics 1985-2006 thousands
Hours worked Cambridge Econometrics, own calculation
1985-2006 levels total hours worked by employees per year
Population Cambridge Econometrics 1985-2006 thousands
Human Capital Eurostat 2002 % of people over population 15 and over
people with a degree, ISCED 5-6 (over population 15 and over)
Social capital European Social Survey Round 1 2002, Round 2 2004
2002 % of people over total population
people that have taken part at least once in the last 12 months in social activities such as voluntary service, unions and cultural associations meetings
Technological capital
OECD, REGPAT database 2002 levels patent applications at PCT (Patent Cooperation Treaty), stock for the previous 5 years
Long life learning
Eurostat 2002 % of people over population 25 and over
participation of adults aged 25-64 in education and training
Knowledge capital
own calculation from European Commission
1998-2002 euros, current total funding by European Commission under the Fifth Framework Program (regionalized according to the research projects participants' address)
Accessibility Espon, Project 2.4.2 2001 regions are classified into five groups (from 1= very low, to 5= very high) according to their potential accessibility by road, train, air and time to the market.
Dummy Objective 1
Eurostat 2002 regions of the Objectives 1 program for the 2000-06 structural funds, including the transition regions
Page 35 of 44
http://mc.manuscriptcentral.com/cres Email: [email protected]
Regional Studies
123456789101112131415161718192021222324252627282930313233343536373839404142434445464748495051525354555657585960
For Peer Review O
nly
35
Table 1. Production function estimation
Dependent variable: value added 1.1 1.2 1.3 1.4 Estimation method OLS 2SLS 2SLS 2SLS
Instruments 3-group instruments and their spatial lags
Capital stock 0.270 0.291 0.329 0.336 (21.3) (8.0) (8.8) (23.3)
Units of labour 0.299 0.278 0.868 (21.4) (11.3) (36.8)
Dependent variable spatial lag 0.305 0.328 0.014 (3.6) (4.3) (1.9)
Hours worked per year 0.259 (4.6)
Dummy Objective 1 regions -0.285 (-33.2)
Regional fixed effect yes yes yes no
R2 (pseudo) 0.98 0.98 0.98 0.78 LM test for residual spatial correlation 45.251 0.174 0.245 4.290 p-value 0.000 0.677 0.621 0.038
Moran's I test on residuals* 6.279 0.362 0.465 2.070 p-value 0.000 0.718 0.642 0.038
Page 36 of 44
http://mc.manuscriptcentral.com/cres Email: [email protected]
Regional Studies
123456789101112131415161718192021222324252627282930313233343536373839404142434445464748495051525354555657585960
For Peer Review O
nly
36
Table 2. Production function model SHAC estimates
Variable Coefficients t-ratios
SHAC
Classical
dn=100 dn=300 dn=600 dn=1200
Regression 1.2 Table 1
Capital stock 0.291 8.019 6.372 5.661 5.036 4.655
Units of labour 0.278 11.296 9.279 8.122 7.339 7.105
dn is the Parzen kernel bandwidth in kilometers
Page 37 of 44
http://mc.manuscriptcentral.com/cres Email: [email protected]
Regional Studies
123456789101112131415161718192021222324252627282930313233343536373839404142434445464748495051525354555657585960

For Peer Review O
nly
37
Table 3. Total Factor Productivity and intangible assets
Dep. variable: total factor productivity 3.1 3.2 3.3 3.4 3.5
Social capital 0.136 * 0.164 ** 0.317 *** 0.161 ** 0.188 ***
(1.722) (2.238) (5.168) (2.154) (2.867)
Human capital 0.170 *** 0.152 ** 0.169 *** 0.161 **
(2.819) (2.476) (2.966) (3.045)
Technological capital 0.061 *** 0.060 *** 0.050 *** 0.038 **
(4.375) (4.347) (3.171) (2.184)
Long-life learning 0.053 ***
(3.388)
Knowledge capital 0.050 ***
(3.426)
Accessibility 0.070 ** 0.040
(1.925) (1.187)
Dependent variable spatial lag 0.895 *** 0.879 *** 0.924 *** 0.926 ***
(4.531) (4.559) (4.784) (4.920)
Distances for spatial lag (km) all all all all
Spatial lag - dist 0-300 km 0.853 ***
(2.322)
Spatial lag - dist 300-600 km 0.476 **
(1.836)
Spatial lag - dist 600-900 km 0.138 (0.391)
Spatial lag - dist 900-1200 km -0.253 (-0.653)
Square correl. 0.42 0.66 0.43 0.68 0.71 IV-Moran -1.749 -1.909 -1.660 -1.872 -1.773 p-value IV-Moran 0.080 0.056 0.097 0.061 0.076
All regressions are estimated by applying the 2SLS method, endogenous variables are instrumented with 3-group method instruments; all models include a constant term N=199; all variables are normalised to population and log-transformed For human capital, social capital and technological capital the values refer 2002; for accessibility the values refer to 2001.
Spatial weight matrix: square of the inverse of distance in km Aysmptotic t-statistic in parenthesis Square correl. is the squared correlation between the predicted and actual values IV-Moran is the Moran I test proposed by Anselin and Kelejian (1997) for 2SLS residuals Level of significance: *** 1%, ** 5%, * 10%
Page 38 of 44
http://mc.manuscriptcentral.com/cres Email: [email protected]
Regional Studies
123456789101112131415161718192021222324252627282930313233343536373839404142434445464748495051525354555657585960

For Peer Review O
nly
38
Table 4. TFP model SHAC estimates
Variable Coefficients t-statistics
SHAC Regression 3.1 Table 3
Classical dn=100 dn=300 dn=600 dn=1200
Social capital 0.170 2.819 2.933 2.511 2.146 2.058 Human capital 0.136 1.722 2.100 2.048 1.883 1.860 Technological capital 0.061 4.375 4.119 3.359 2.676 2.320
dn is the Parzen kernel bandwidth
Page 39 of 44
http://mc.manuscriptcentral.com/cres Email: [email protected]
Regional Studies
123456789101112131415161718192021222324252627282930313233343536373839404142434445464748495051525354555657585960

For Peer Review O
nly
39
Figure 1. Value added and capital stock (average 1986-2006)
(a) Value added (per capita, thousands euro 2000)
(b) Capital stock (per capita, thousands euro 2000)
Page 40 of 44
http://mc.manuscriptcentral.com/cres Email: [email protected]
Regional Studies
123456789101112131415161718192021222324252627282930313233343536373839404142434445464748495051525354555657585960

For Peer Review O
nly
40
Figure 2. Total Factor Productivity and intangible assets
(a) Total Factor Productivity, 2004 (b) Social capital, 2002 index Europe = 100 participation to social activities per thousands
population
(c) Human capital, 2002 (d) Technological capital, 2002 inhabitants with a degree per thousands population
patents PCT, 5-years stock, per thousands population
Page 41 of 44
http://mc.manuscriptcentral.com/cres Email: [email protected]
Regional Studies
123456789101112131415161718192021222324252627282930313233343536373839404142434445464748495051525354555657585960

For Peer Review O
nly
41
Notes
1 Results are not reported in order to save space, they are available from the authors upon request
and reported in DETTORI et al. (2008) where an extended version of this paper can be found.
2 To check the robustness of the results we calculate the Moran’s I test allowing for different
specifications of the spatial weight matrix. A more detailed discussion on the economic aspects of
matrix normalization is postponed to the next section.
3 When the panel data are stacked as T subsequent cross-sections, we have )~
(~
NT WIW ⊗= , where IT is
a (T×T) identity matrix and NW
~ is the normalized spatial weight matrix.
4 ANSELIN (1988) emphasizes that the aim of spatial econometrics should be on measuring spatial
spillovers. The alternative spatial error model specification is just a particular case of non-spherical
errors which eliminates spillovers by construction.
5 For a thorough discussion on normalization issues see also ELHORST (2010).
6 Note that, as emphasised by ANSELIN et al. (2008), the row-standardization has also the side
effect that the sum of all the elements in W equals N, the number of cross-sectional observations,
and that the induced asymmetry in the weights “is an unusual complication with significant
computational consequences”.
7 See BALTAGI et al., 2008, for a discussion on the relevance of absolute distance vs relative
distance in economic phenomena.
8 For cross-section analyses, exceptions are represented by KELEJIAN and PRUCHA (2004, 2007),
ANSELIN and LOZANO-GRACIA (2008), FINGLETON and LE GALLO (2008) and
DALL’ERBA and LE GALLO (2008); for a panel application, see ELHORST et al. (2007).
9 TFP is estimated using measured inputs, a possible cause of the disparities among regions relies
on measurement errors; moreover there may be problems of misspecification of the production
function (CASELLI, 2005).
Page 42 of 44
http://mc.manuscriptcentral.com/cres Email: [email protected]
Regional Studies
123456789101112131415161718192021222324252627282930313233343536373839404142434445464748495051525354555657585960

For Peer Review O
nly
42
10 Similar results are found when testing for weakly exogeneity of capital and labour within an error
correction model framework; only labour can be considered weakly exogenous (the p-value for the
null hypothesis that the adjustment term is zero in the labour ECM model is equal to 0.293).
11 The panel version of the test is reported in ANSELIN et al. (2008).
12 Given that our sample refer to a period of 22 years we also carried out a panel cointegration
analysis in order to guard against the spurious regression problem. Evidence of a nonstationary kind
of behavior was detected for the individual variables by means of the CIPS unit root tests
(PESARAN, 2007). The existence of a spurious relation among the variables of interest was ruled
out by the results of the well-known cointegration tests developed by PEDRONI (1999, 2004),
which allowed us to reject the null hypothesis of no cointegration. All detailed results are reported
in DETTORI et al. (2008).
13 We have also estimated models which account for the two sources of endogeneity separately. The
model estimated by IV without the spatial term, as expected, yields spatially autocorrelated
residuals; this results points out the importance of modeling explicitly the spatial pattern. On the
other hand, the spatial lag model for which the productive inputs are not instrumented (estimated by
the ML method) ensures that the residuals do not exhibit spatial autocorrelation, but the coefficients
for the capital and labour regressors are quite similar to the OLS ones, signaling that the
endogeneity bias is still present.
14 For 2SLS estimated models the Moran’s I test is calculated as suggested in ANSELIN and
KELEJIAN (1997) for the case of IV residuals.
15 For the same reason we do not report the measures of dispersion for the impact estimates. Note
also that for the normalized matrix adopted each entry has a very small value.
16 All the other results are available from the authors upon request.
17 Note that possible changes in the relationship 1.2 are accounted for by the temporal dummies. We
did not carry out a subsample analysis in order to check the robustness of our result as splitting the
Page 43 of 44
http://mc.manuscriptcentral.com/cres Email: [email protected]
Regional Studies
123456789101112131415161718192021222324252627282930313233343536373839404142434445464748495051525354555657585960

For Peer Review O
nly
43
sample would result in a loss of valuable information needed to estimate the fixed effects accurately
(it is well known that the fixed effect estimator make use of the within dimension of the sample
information which in our case is constituted by 22 time observation).
18 For some regions in France, Germany and United Kingdom data are available at NUTS1 level so
that we have assumed that value for the included NUTS2 regions.
19 In the special case in which the omitted relevant variables follow a spatial autoregressive process
and are also correlated with the included spatially correlated ones, LESAGE and PACE (2009)
show that this leads to a spatial Durbin model specification. The 2SLS method is more general as it
allows to tackle different sources of endogeneity bias. Note also that in applying the latter method
instruments are represented by the explanatory variables spatial lags, so that it is not possible to
include them as regressors, as would be required by the spatial Durbin model estimation. Moreover,
as reported in the discussion of the empirical results, evidence of omitted relevant spatially
correlated variables was not detected by the spatial diagnostics carried out on the residuals.
20 In the base specification, we have also used R&D expenditure (as an alternative to patent
counts);.however R&D at the regional level is only available for different years in each country.
Note that the correlation coefficient between patents and R&D is equal to 0.82.
21 We have also used an indicator for a “low” level of human capital (i.e. the share of population
that has attained at most a primary level, ISCED 0-2) and, as expected, it shows a negative and
significant influence on TFP, moreover its inclusion reduces the significance of the social capital
variable.
22 Starting from the seminal contributions by ASCHAUER (1989), the literature has investigated
the role of infrastructure, and more generally of public capital, on regional performances. See,
among others, EBERTS (1990) for the Unites States, MARROCU and PACI (2010) for the Italian
regions; a useful survey is in GRAMLICH (1994).
23 Detailed results are not reported here to save space, but are available in DETTORI et al. (2008)
Page 44 of 44
http://mc.manuscriptcentral.com/cres Email: [email protected]
Regional Studies
123456789101112131415161718192021222324252627282930313233343536373839404142434445464748495051525354555657585960

For Peer Review O
nly
44
24 The same kind of results are obtained for all the specifications reported in Table 3. All detailed
results are available from the authors upon request.
Page 45 of 44
http://mc.manuscriptcentral.com/cres Email: [email protected]
Regional Studies
123456789101112131415161718192021222324252627282930313233343536373839404142434445464748495051525354555657585960