total incomes system of accounts - st. louis fed · by robert eisner the total incomes system of...
TRANSCRIPT

By ROBERT EISNER
The Total Incomes System of Accounts
Editor's Note.—In this article, Dr. Robert Eisner, William R. Kenan Professor of Eco-
nomics at Northwestern University, describes the rationale and basicstructure of the system of accounts he has developed and shows his resultsfor selected years. The system of economic accounts he presents differs inseveral major ways, described in the article, from BEA 's national incomeand product accounts. Dr. Eisner's system is presented in the SURVEY OFCURRENT BUSINESS because Dr. Eisner and BEA agree that economic ac-counts, as tools of analysis, are best strengthened by discussion of alterna-tive and complementary systems in open forums of users and estimators.
This reason also motivated the presentation in the SURVEY of the systemof economic accounts designed by Richard Ruggles and Nancy D. Ruggles.That presentation, in the May and November 1982 issues, included com-ments by users and estimators. Several of those comments—for example,those on nonmarket activity and sectoring—have bearing on the accountsdesigned by Dr. Eisner as well, and the reader is referred to them (a topi-cal guide appears on page 54 of the May 1982 issue) as a supplement tothis article.
THIS article presents a set of ac-counts of total income and productand associated capital stocks for theUnited States, in current and con-stant dollars, for selected years from1946 to 1981.! As its name—total in-comes system of accounts (TISA)—suggests, these accounts are designedto include the income correspondingto all consumption and capital accu-mulation, whether or not these relateto production for the market and re-gardless of the sector in which goodsand services are produced or capitalaccumulated.
Pursuing a number of themes ad-vanced by Simon Kuznets some fourdecades ago, TISA picks among andcombines elements in the United Na-tions system of national accounts andin work of Ruggles and Ruggles,Juster, Nordhaus and Tobin, Ken-drick, and others to build upon a cen-
1. Previous presentations of these accounts or partsof them are found in Robert Eisner, "Total Incomes inthe United States, 1959 and 1969," Review of Incomeand Wealth, ser. 24 (March 1978): 41-70; idem, "Cap-ital Gains and Income: Real Changes in the Value ofCapital in the United States, 1946-77," in The Meas-urement of Capital, Studies in Income and Wealth,vol. 45, ed. Dan Usher (Chicago: University of ChicagoPress, 1980); idem, "Total Income, Total Investment,and Growth," American Economic Review 70 (May1980): 225-231; Eisner and David H. Nebhut, "An Ex-tended Measure of Government Product: PreliminaryResults for the United States, 1946-76," Review ofIncome and Wealth, ser. 27 (May 1981); 33-64; andEisner, Emily R. Simons, Paul J. Pieper, and StevenBender, "Total Incomes in the United States, 1946-1976: A Summary Report," Review of Income andWealth, ser. 28 (June 1982): 133-174.
tral core of BEA's national incomeand product accounts.2 However, itgoes beyond, or differs from, the BEAaccounts in the following major re-spects.
First, TISA embraces a broaderspectrum of production than do theBEA accounts, TISA counts nonmar-ket, as well as market, product in allsectors, and this product includes in-tangible, as well as tangible, capitalaccumulation. Among the major itemsof nonmarket product are the servicesof government and household capital,the services of unpaid householdlabor, and the opportunity costs ofstudents' time.
Second, TISA abandons the BEAdefinition of final product, (a) Servicessuch as those of national defense,roads, and police, which are finalproduct in the BEA accounts, areclassified as intermediate product in
2. See Nancy Ruggles and Richard Ruggles, TheDesign of Economic Accounts (New York: NationalBureau of Economic Research, 1970); idem, "A Propos-al for a System of Economic and Social Accounts," inThe Measurement of Economic and Social Perform-ance, and ed. Milton Moss (New York: NationalBureau of Economic Research, 1973); idem, "Integrat-ed Economic Accounts of the United States, 1947-80,"SURVEY OF CURRENT BUSINESS 62 (May 1982): 1-53; F.Thomas Juster, "A Framework for the Measurementof Economic and Social Performance," in The Meas-urement of Economic and Social Performance; andWilliam D. Nordhaus and James Tobin, "Is GrowthObsolete?" in The Measurement of Economic andSocial Performance; and John W. Kendrick, The For-mation and Stocks of Total Capital (New York: Na-tional Bureau of Economic Research, 1976).
NOTE.—The author offers the accountsthat follow in a spirit of experimenta-tion. Previously, they were presented forearlier years and without benefit of the1980 BEA benchmark revisions; herethey are updated and revised for scrutinyand use by a broader audience. Fullseries, in hard copy or machine-readableform, may be acquired from the authorat nominal cost. A forthcoming book-length report will include applications ofthe data to economic relations and a de-tailed statement of sources and methods.
Wilson Lim was of inestimable helpover a long period in putting togetherthe current set of accounts. Hilarie Liebassisted in recent revisions. John Keat-ing prepared 1981 time use estimates andStuart Weiner prepared the original esti-mates for 1975 and earlier years. Theauthor is indebted to a long line of re-search assistants and, most importantly,to his coauthors in earlier published re-ports—David Nebhut, Emily R. Simons,Paul J. Pieper, and Steven Bender.
Gerald F. Donahoe, John A. Gorman,John C. Musgrave, Gerald Silverstein,and many others in the National Incomeand Wealth Division of BEA very gener-ously supplied unpublished data andguidance in their use. The final versionof this article has benefited greatly fromsuggestions by several at BEA, especiallyCarol S. Carson, George Jaszi, and HelenStone Tice.
The work has enjoyed the financialsupport of a series of grants from the Na-tional Science Foundation, which is, ofcourse, in no way accountable for its con-tents.
24
Digitized for FRASER http://fraser.stlouisfed.org/ Federal Reserve Bank of St. Louis
January 1985

January 1985 SURVEY OF CURRENT BUSINESS 25
TISA. The value of business productas estimated by BEA is then reducedby the amount of intermediate prod-uct received from government, (b) Aportion of commercial media servicesof television, radio, newspapers, andmagazines—intermediate businesspurchases in the BEA accounts—iscounted in TISA as final product. Thevalue or cost of a movie on televisionpaid for by business advertising iscounted as much as a movie paid forat the theater box office, (c) Expensesrelated to work are subtracted fromincome and product, while the valuesof employee training and human cap-ital formation are added.
Third, TISA generally valuesoutput at factor cost and departs onmore occasions than do the BEA ac-counts from valuation at marketprices. In particular, TISA includessubsidies in the value of output andmakes imputations for the services ofvolunteer labor and for the differencebetween the opportunity costs of mili-tary conscripts and jurors and whatthey are paid.
Fourth, TISA provides, in additionto a national income and product ac-count, separate sector income andproduct accounts for business, non-profit institutions, government enter-prises, government, and households.This structure contrasts in severalways with that of the BEA accountsas represented by the summary five-account system.3 Very fundamentally,different kinds of accounts supple-ment each system's national incomeand product account. The TISA sectoraccounts are deconsolidations of thenational income and product ac-count—that is, they provide detail onincome and product by sector. (Theonly such sector detail provided byBEA is for corporate business.) TheBEA accounts provide sector incomeand outlay—that is, appropriation—accounts and a consolidated savingand investment account for the do-mestic sectors. Further, the TISAsector accounts are for five domesticsectors, whereas the BEA sector ac-counts are for persons (including bothhouseholds and nonprofit institu-
3. For a brief description of the five-account summa-ry of the BEA national income and product accounts,see Ruggles and Ruggles, "Integrated Economic Ac-counts," pp. 6-8, and Carol S. Carson and GeorgeJaszi, "The National Income and Product Accounts ofthe United States: An Overview," SURVEY 61 (Febru-ary 1981): 22-28.
tions), for government, and for therest of the world as represented byforeigners in their transactions withthe United States. Finally, within theTISA account structure, the locationof several items—for example, invest-ment in owner-occupied housing—dif-fers from that in the BEA accounts,and several new items—mainly relat-ed to services of tangible capital andto intangible capital—are placedwithin it.
Fifth, in contrast to the BEA ac-counts, which apply inventory valu-ation and capital consumption adjust-ments to exclude changes in the valueof existing assets, TISA includes grossand net revaluations of tangibleassets. Gross revaluations—that is,changes in nominal values (net, ofcourse, of net investment)—permitthe integration of flows of investmentand stocks of capital at current re-placement cost. Net revaluations—that is, changes in nominal valuesminus changes in value attributableto changes in the general level ofprices—on tangible capital are includ-ed as components of capital accumula-tion and of income and product. Thus,current-dollar net investment equalsthe current-dollar value of the realchange in net worth, whether due toacquisition of newly produced capitalor changes in the value of existingcapital.
TISA is not intended as a substitutefor the BEA national income andproduct accounts, but as a supplementto them. The BEA accounts have beenhailed appropriately as the best avail-able comprehensive measure of thecourse of the economy and of over-whelming value in economic analysisand policy formation. But they havealso been criticized as inadequatemeasures of total current consump-tion and investment and, hence, ofeconomic welfare. TISA may offersome useful additional insights.
For those interested in the contri-bution of investment to growth, atten-tion is directed to TISA series on totalcapital formation, public as well asprivate, human as well as nonhuman.For those looking for measures of cur-rent welfare, TISA series on consump-tion services, including those of dura-bles and other services provided with-out concurrent market transactions,may be relevant. Those concernedwith factor shares in income andoutput may make use of various im-
putations of labor and capital serv-ices. Net revaluations, or real capitalgains and losses, may serve particu-larly in measuring returns to capitaland in developing more robust meas-ures of relations involving consump-tion and saving.
While there may be some novelty—or substantial improvisation—in vari-ous TISA estimates, most of the seriesare in considerable part rearrange-ments or extensions of measures pro-vided by other investigators or al-ready in the BEA accounts or othergovernment statistics. Many, al-though not all, of the parts willappear familiar, but the whole willoffer a new, integrated set of ac-counts, which may open new paths ofanalysis as it is subjected to profes-sional scrutiny and use.
In the four sections that follow, thisarticle first indicates, in some detail,the structure of the TISA nationalincome and product account. Next, itdescribes the structure of the sectoraccounts and introduces the underly-ing methodology for major items ofspecial interest. The third section re-views briefly the constant-dollar andcapital stock series. Finally, thefourth section presents substantivehighlights. The accounts are present-ed following the text in tables 1-15.
I. National Income andProduct
The TISA national income andproduct account, table 1, shows grossnational product (GNP) as the sum ofcredits, and charges against GNP asthe sum of debits. As in the BEA ac-counts, GNP in TISA is a measure ofthe value of goods and services pro-duced by labor and property suppliedby residents of the United States.
DebitsThe TISA income and nonincome
charges on the debit side of the ac-count include, first, a vastly expandedmeasure of labor income. In terms of1981 figures, which are generally usedin this presentation, BEA's $1,769 bil-lion for monetary and imputed com-pensation of employees is supplement-ed by $1,502 billion of additional im-putations to bring total labor income,after deduction of $63 billion for ex-penses (for travel) related to work, to
Digitized for FRASER http://fraser.stlouisfed.org/ Federal Reserve Bank of St. Louis
January 1985

26 SURVEY OF CURRENT BUSINESS January 1985
$3,209 billion.4 The imputations in-clude $74 billion for employee train-ing, $25 billion for expense accountitems of consumption, and $139 bil-lion for labor income of the self-em-ployed. By far the largest items, how-ever, are opportunity costs of stu-dents, $284 billion, and unpaid house-hold work, $981 billion—alone overone-half as much again as compensa-tion of employees.
Several forms of income from prop-erty are measured separately. Imput-ed rental income of owner-occupiednonfarm dwellings, as in the BEA ac-counts, is included in nationalincome. For the TISA measure, how-ever, the BEA rental income is re-duced by net imputed interest, which,in TISA, is part of capital income.Hence, the TISA rental incomeamounts to only $9 billion.
Capital income of $370 billion en-compasses monetary and imputed in-terest. It includes, in addition to busi-ness interest paid, imputed intereston nonbusiness land, dwellings, struc-tures and equipment, consumer dura-bles and semidurables, and invento-ries.5 (The methodology for gross im-puted interest of the nonbusiness sec-tors, which is to apply a rate ofreturn to a capital stock, is illustratedin the subsection on the nonprofitsector account.)
Business profits (net of interest) gointo the net operating surplus of $248billion. The operating surplus in-cludes, in addition to BEA corporateprofits (with inventory valuation andcapital consumption adjustments),gross business investment in researchand development (R&D) of $34 billion,which—like any other item consid-ered investment—is not chargedagainst current income; governmententerprise surpluses of $12 billion;and net rental income of persons of$28 billion. To arrive at proprietors'capital income of negative $19 billion,which is also included, $139 billion ofimputed labor income of the self-em-ployed is subtracted from the BEA es-timate of $120 billion for proprietors'income.
4. The BEA figures included in TISA are as pub-lished in, or consistent with, those published in theJuly 1983 SURVEY. For reference, the addenda totables 1 and 7 show selected BEA aggregates.
5. Consumer semidurables consist of shoes and otherfootwear, clothing and accessories except footwear,and semidurable house furnishings. See table A.
TISA includes "net revaluations" inan effort to get closer to a consistenttheoretical measure of income aswhat can be consumed while keepingreal net worth constant. As noted ear-lier, net revaluations are the changein nominal value of tangible capital—land, dwellings, structures and equip-ment, consumer durables and semi-durables, and inventories—minus thechange in nominal value necessary tomatch changes in the general level ofprices. Tangible capital prices over1946-81 have generally increasedmore rapidly than the implicit pricedeflator for GNP. Net revaluationswere thus generally positive and fre-quently very substantially so. In 1981,however, they were a sharply nega-tive $154 billion. Net surplus, the sumof net operating surplus and net re-valuations, was thus reduced to $94billion in 1981.
National income of $3,682 billion is,then, the sum of labor income, rentalincome, capital income, net operatingsurplus, and net revaluations. Be-cause TISA includes income earned inproducing intangible capital, intangi-ble capital consumption allowancesare charged against TISA GNP. Theseamounted to $402 billion, $51 billionon R&D capital and $351 billion onhuman capital. TISA net nationalincome of $3,279 billion is then com-parable to the BEA national incomeof $2,373 billion; both national incomeestimates are measured net of the
capital consumption allowances asso-ciated with the investment includedin GNP.
TISA business transfer paymentswere $33 billion in 1981. They in-clude, in addition to the BEA's $13billion, $16 billion of entertainmentand other consumer services on radioand television and in the print mediathat are paid for by business, and $5billion of health and safety benefitsgiven to workers. TISA shows, as an-other nonincome charge against prod-uct, uncompensated factor services of$19 billion. These include a smallamount for jurors and $18 billion forthe services of volunteers in nonprofitinstitutions, particularly, in hospitals,schools, and churches. Earlier yearsshowed substantial amounts for mili-tary draftees, but now, without con-scription, this imputation is zero.
Because TISA considers govern-ment product in part intermediateand subtracts from BEA's GNP andgross business product the value of in-termediate government product esti-mated to be transferred to business, itmust correspondingly reduce thecharges against GNP. It is convenientto view indirect business taxes (non-profit and government enterprisetaxes are treated separately) as a wayof paying for government services toproduction, for which the income andnonincome charges have already beenincluded. Accordingly, TISA subtractsthe value of intermediate product
CHART 5
Gross National Product by Type of Product, 1981TOTAL INCOMES SYSTEM OF ACCOUNTS
($4,560.1 billion)BUREAU OF ECONOMIC ANALYSIS
($2,954.1 billion)
Gross DomesticCapital Accumulation
(36.8%)
NetExports(0.6%)
NetExports(0.9%)
U.S. Department of Commerce, Bureau of Economic Analysis
Digitized for FRASER http://fraser.stlouisfed.org/ Federal Reserve Bank of St. Louis
January 1985

January 1985 SURVEY OF CURRENT BUSINESS 27
transferred from government to busi-ness, $121 billion, from indirect busi-ness taxes. Finally, TISA adds noth-ing (except trivial rounding errors) tothe BEA statistical discrepancy.
These nonincome charges bringTISA net national product (NNP) to$3,425 billion, which may be com-pared to the BEA NNP of $2,625 bil-lion. Capital consumption allowancesadd $1,135 billion, $733 billion on tan-gible capital and $402 billion on in-tangible capital. These allowances arebroken into components relating tothe original cost of capital and thoserelating to revaluations (BEA's cap-ital consumption adjustment of con-sistent accounting at original cost tocurrent replacement cost). The bottomline of $4,560 billion is chargesagainst TISA GNP, as against theBEA GNP of $2,954 billion. The TISAand BEA GNP's are perhaps less com-parable than the NNP's, however, be-cause of TISA's added product andcapital consumption allowances relat-ing to nonbusiness and intangible cap-ital.
Credits
The credit side of the TISA nationalincome and product account includesconsumption of $2,856 billion andgross domestic capital accumulationof $1,678 billion, both of which differsubstantially from their BEA counter-parts, as detailed in what follows. Theremaining credit item is net exports,and it is the same as BEA's net ex-ports of $26 billion. (TISA and BEAdistributions of product by type ofproduct are contrasted in chart 5.)
For consumption, the BEA measureof personal consumption expendituresis basically changed to arrive at ameasure that includes, rather thanexpenditures for consumer durablesand semidurables (both of which aretreated as investment in TISA), thevalue of their services. These capitalservices are measured as the sum ofcapital consumption and a net imput-ed return. The items that accomplishthis substitution and other changesthat reconcile the BEA and TISAmeasures of consumption are shown,for convenience, in table A.
As indicated there, this changebegins with a number of TISA exclu-sions. First, TISA subtracts severalitems from BEA personal consump-tion expenditures: consumer pur-chases of durables and semidurables,
Table A.—Reconciliation of BEA and TISAMeasures of Consumption, 1981
[Billions of dollars]
Line
1234
5
67
8
910
11
121314151617181920
21
2223
24
BEA personal consumption expenditures .Less' Durables
SemidurablesCurrent expenditures of nonprofit
institutions.Medical care investment not includ-
ed in durables.Change in household inventoriesNet space rent, owner-occupied non-
farm housing.BEA nonhousing imputations
Equals: TISA gross household expendituresLess' Expenses related to work
Equals: Household expenditures for servicesand nondurables.Plus: Expense account items of consumption...
BEA nonhousing imputationsSubsidies to market consumptionTransfers
From businessFrom nonprofit institutionsFrom government enterprises ....From government
Nonmarket services produced in house-holds
Net space rent, owner-occupied non-farm housing, including subsidies.
Other capital servicesLabor services
Equals: TISA consumption
1,857.22361125.6123.5
60.0
.1178.6
445
1,088.1439
1,044.2
24.644.573
280.114881.060
1782
14554178.9
332.39443
2,839 6
BEA sources.—Line 1: National income and product accounts (NIPA)
table 2.2, line 1.Line 2: NIPA table 2.2, line 2.Line 3: NIPA table 2.4, lines 12, 13, and 33.Line 4: Unpublished detailed underlying NIPA table 2.4.Line 5: NIPA table 2.4, 0.5 (line 44-line 46-line 53-line
54-0.76 line 50).Line 7: NIPA table 8.8, line 74.Line 8: NIPA table 8.8, line 7.
the current expenditures of nonprofitinstitutions, medical care investmentnot already subtracted with durables,change in household inventories, andmost BEA imputations (including thatfor net space rent of owner-occupiednonfarm housing). These subtractionsleave in the TISA measure of con-sumption $1,088 billion of expendi-tures on services and nondurables in-cluded in BEA personal consumptionexpenditures. TISA subtracts, further,expenses related to work, which wereestimated at $44 billion in 1981.
TISA then puts back the excludedBEA imputations and adds a numberof others, some of major import.Among these, expense account itemsof consumption, including but not lim-ited to the notorious three-martinilunch, amount to $25 billion. Miscella-neous BEA imputations—for therental value of buildings and equip-ment owned by nonprofit institutionsserving individuals; meals, clothing,and lodging furnished by employers;food and fuel produced and consumedon farms; and checking and other fi-nancial services furnished to personswithout explicit charge—come to $44billion. Also, because the TISA meas-
ure of output is generally at factorcost rather than market prices, TISAconsumption includes the portion ofsubsidies, put at $7 billion (excludingsubsidies to owner-occupied nonfarmhousing), related to consumption.
TISA then adds $280 billion for"transfers" of consumption services tohouseholds from other* sectors. Theseinclude: $15 billion from business inthe form of media support and provi-sions for health and safety; $81 billionfrom nonprofit institutions in theform chiefly of health, education, andreligious services beyond what con-sumers paid for; $6 billion from gov-ernment enterprises from the sale ofgoods and services below cost; and, byfar the largest item, $178 billion fromgovernment for a variety of services,such as those of roads and parks, forwhich households would presumablyhave had to pay directly, rather thanby taxes, had they been furnished byprivate industry.
More than one-half of TISA con-sumption consists of $1,455 billion ofnonmarket services produced inhouseholds. In addition to $179 billionfor the net space rent of owner-occu-pied nonfarm dwellings included byBEA (plus subsidies to such housing),TISA includes $332 billion for the cap-ital services of consumer durables andsemidurables and of inventories. Asnoted earlier, these services are sub-stituted for the BEA item for corre-sponding personal consumption ex-penditures for durables and semidura-bles. The value of the services provessmaller than the BEA item in 1981,because the net imputed return is lessthan the excess of current expendi-tures over capital consumption.
Finally, TISA puts the value of non-market labor services in householdsin 1981 at $1,265 billion. (The method-ology is summarized in the subsectionon the household sector account.) Ofthis total, however, $321 billion is al-located to investment, generally inthe form of health and education ofhousehold members. Thus, $944 bil-lion remains for the preparation ofmeals, cleaning clothes, care of chil-dren, and other unpaid houseworkcounted as provision of consumptionservices.
TISA gross domestic capital accu-mulation, $1,678 billion in 1981, asmay be noted in the reconciliation
Digitized for FRASER http://fraser.stlouisfed.org/ Federal Reserve Bank of St. Louis
January 1985

28 SURVEY OF CURRENT BUSINESS January 1985
presented in table B, is far largerthan BEA gross private domestic in-vestment. The BEA figure of $475 bil-lion includes only investment instructures and equipment by privatebusiness and nonprofit institutions,additions to inventories by privatebusiness, and (what TISA counts ashousehold) investment in owner-occu-pied nonfarm housing. TISA setsforth explicitly the $10 billion of in-vestment in structures and equipmentby nonprofit institutions and, in addi-tion, includes $22 billion of such in-vestment by government enterprises,$103 billion by government (including,in this case, $27 billion of product ac-cumulated in natural resources), andadditional investment by householdsof $236 billion in durables and $126billion in semidurables.
Reconciliation items are needed tobring sector sums in line with corre-sponding BEA totals because theprices at which intersector transac-tions are carried in the two datasources differ. These items, plus in-vestment in inventories—includingthat by government and households—are part of the $973 billion in totalgross domestic tangible capital accu-mulation at original cost. Intangibleinvestment is almost as large, $850billion. This total consists of: $69 bil-lion in R&D investment by business,nonprofit institutions, and govern-ment; $640 billion of investment inthe "stock" of education of the Ameri-can people; and $142 billion of invest-ment in their health. The value ofsubsidies and government enterprisetransfers allocated to investmentcomes to another $9 billion.
To arrive at total capital accumula-tion, TISA adds net revaluations ontangible capital—in 1981, a negativefigure of $154 billion, as alreadynoted. The negative net revaluationswere due to capital losses (after ad-justment for inflation) of $142 billionon land, $35 billion on consumer du-rables and semidurables, and $28 bil-lion on inventories. There were, how-ever, capital gains of $18 billion onstructures and equipment owned bybusiness and $51 billion on govern-ment structures and equipment.Homeowners lost $14 billion after ad-justment for inflation, and nonprofitinstitutions lost $4 billion.
The net export figure is the lastitem. That figure brings TISA GNP in1981 to $4,560 billion. Without net re-
valuations, TISA GNP of $4,714 bil-lion was 59.6 percent larger thanBEA GNP. Because much of TISAproduct is additional capital accumu-lation that requires additional capitalconsumption allowances, the excess,again without net revaluations, ofTISA NNP of $3,578 billion overBEA's NNP is considerably less, 36.3percent.
II. The Sector Accounts
Total TISA GNP is the sum of theproduct of each of the domestic sec-tors plus BEA's net product attrib-uted to the rest of the world. Becausethe TISA measures reflect a substan-tial amount of nonmarket output ofnonbusiness sectors, it is useful to set
Table B.— Reconciliation of BEA and TISAMeasures of Investment, 1981
[Billions of dollars]
Line
12
345
6
789
10111213141516171819202122
23
24
25262728
29
3031323334
35
36
BEA gross private domestic investmentLess: Structures and equipment owned by
nonprofit institutions.Owner-occupied nonfarm dwellingsChange in business inventoriesFixed gross private domestic invest-
ment reconciliation.
Equals: TISA business investment in struc-tures and equipment (original cost).Plus: Nonprofit institutions
StructuresEquipment
Government enterprisesStructuresEquipment
GovernmentStructuresEquipmentProduct accumulated
HouseholdsOwner-occupied dwellingsDurablesSemidurables
ReconciliationsFixed gross private domestic invest-
ment.Government capital accumulation
Equals: TISA gross domestic investment instructures and equipment and in householddurables and semidurables (original cost).Plus' Changes in inventories
BusinessGovernmentHouseholds
Equals: TISA gross domestic tangible invest-ment (original cost).Plus' Intangible investment
Research and developmentEducation and trainingHealth
Subsidies and government enterprisetransfers to households.
Net revaluations
Equals: TISA gross domestic capital accumula-tion.
474.910.3
82.518.519.1
344.5
10.38.61.7
22.320.12.2
102.732.643.4267
443.3825
236.1125629.719.1
10.6
953.8
190185
.4
.1
972.8
850268.5
6401141.6
8.5
1537
1,677.9
BEA sources.—Lines 1 and 4 (and 26): National income and product
accounts (NIPA) table 1.1, lines 6 and 15.Lines 2, 3, 7-15, and 18: BEA updates and revisions of
Fixed Reproducible Tangible Wealth in the UnitedStates, 1925-79.
Line 19: NIPA table 1.1, line 3.Line 20: NIPA table 2.4, lines 12, 13, and 33.Line 21: These reconciliations are necessary because some
of the investment series by sector are from BEA tangi-ble wealth presentations that differ from the NIPAinvestment series in their valuation of export sales ofused equipment and business capital-account transac-tions with government.
forth the full sector accounts. Theymake clear the major roles played bythe government and household sectorsin the production of goods and serv-ices and the contrasts to be drawnwith the corresponding BEA sectors.(TISA and BEA distributions of prod-uct by sector are contrasted in chart6.)
Unlike BEA's income and outlay ac-counts, the TISA sector accountsrelate income and product. In each ac-count, the TISA credits total to grosssector product—the sector's contribu-tion to GNP, that is, its value added.TISA debits are the charges againstgross sector products. In the businesssector, the foundation is the BEAgross domestic business product andthe charges against it. Various addi-tions and subtractions on the creditside arrive at TISA gross businessproduct, and corresponding adjust-ments are made to the debits. In all ofthe other sectors, total product is cal-culated on the debit side, utilizing es-timates of market transactions fromBEA and a number of imputations forlabor and property income and fornonincome costs or charges. Grossproduct of each sector other thanbusiness and, in part, government en-terprises, is allocated, along with in-termediate product from other sec-tors, to consumption and capital accu-mulation and, in the case of govern-ment, to intermediate product.
Business
The TISA business sector comprisesthe BEA business sector less owner-occupied nonfarm dwellings, govern-ment enterprises, and buildings andequipment owned by nonprofit insti-tutions. The TISA business sector ac-count, table 2, entails subtractions,corresponding to these exclusions,from BEA's gross domestic product ofbusiness, along with a number of ad-ditions.
As in the national account, addi-tions to BEA-type product are madeto reflect the altered scope of finalproduct. Subsidies received by busi-ness are included in the value of finalproduct so that product, not merelyincome, is at factor cost. Expense ac-count items of consumption and thevalue of employee training are includ-ed in final product and, on the debitside, in labor income. Business R&Dis also counted as final product, to go
Digitized for FRASER http://fraser.stlouisfed.org/ Federal Reserve Bank of St. Louis
January 1985

January 1985 SURVEY OF CURRENT BUSINESS 29
CHART 6
Gross National Product by Sector, 1981TOTAL INCOMES SYSTEM OF ACCOUNTS
($4,560.1 billion)
Nonprofit , ,— Government Enterprise(1.1%)
BUREAU OF ECONOMIC ANALYSIS($2,954.1 billion)
Households and NonprofitInstitutions
(3.3%)
Rest of the World(1.1%)
U.S. Department of Commerce, Bureau of Economic Analysis
into the total of investment ratherthan to be expensed, as in BEA prac-tice. The portion of expenditures foradvertising that supports entertain-ment for viewers, listeners, and read-ers is allocated to final product ratherthan wiped out as intermediate pur-chases of one firm from another. Busi-ness provision for health and safety ofemployees is also counted, as notedearlier, as a business transfer pay-ment entering into final product.
Among the items subtracted, sever-al are moved to nonbusiness sectors:space rent of owner-occupied nonfarmdwellings, to the household sector; theproduct of government enterprises, tothe government enterprise sector; andthe rental value of buildings andequipment owned (and used) by non-profit institutions serving individuals,to the nonprofit sector. Expenses re-lated to work are subtracted, as theywould be in the BEA accounts if em-ployers incurred them by providingtransportation to the job. Finally,$121 billion of intermediate productfrom government—covering servicessuch as those of defense, roads, andpolice—is also subtracted. With nega-tive net revaluations of $107 billion in1981, the BEA gross domestic productof business of $2,509 billion is thus re-duced to a TISA gross business prod-uct of $2,135 billion. Without net re-valuations, TISA gross business prod-uct of $2,241 billion is 10.7 percentless than BEA's gross domestic prod-uct of business.
Nonprofit institutions
Total product of the nonprofitsector, as in the case of all the non-business sectors, is estimated on thedebit side of the account, shown intable 3. It is the sum of the incomesof the labor and capital the sectoruses, net revaluations, and capitalconsumption allowances. Laborincome of $86 billion in 1981 consistsoverwhelmingly of compensation ofemployees, with a small addition foremployee training and a $4 billionsubtraction for expenses related towork. The value of output producedby labor also includes $18 billion thatis imputed—on the basis of estimatesof time spent in volunteer activitiesand the average wage of nonsupervi-sory service industry workers—to vol-unteer services.
Capital income of $6 billion is im-puted gross interest on land, struc-tures and equipment, and residentialproperty. It is calculated by applyingto the average of each year's begin-ning and ending stocks (see the sec-tion on capital stocks) a weighted av-erage of the after-tax rate of return tohousehold and business capital. Thisrate of return is obtained by dividingan estimate of total return—the sumof after-tax corporate profits, propri-etors' capital income, interest paid bybusiness and on owner-occupied non-farm housing, rental income, and im-puted interest on household capital,less personal taxes on business cap-
ital—by the total stock of businessand household tangible capital. Nega-tive net revaluations of $5 billion andcapital consumption allowances of $8billion are then added, to bring grossnonprofit product to $113 billion.
On the credit side of the account,the total of this product, expenses re-lated to work, intermediate productpurchased, and intermediate producttransferred from government is allo-cated between consumption and cap-ital accumulation. Consumption in-cludes $63 billion accounted for by ex-penditures in BEA personal consump-tion expenditures and an additionalimputation, amounting to $18 billion,of a portion of the services of capital,as measured by net imputed interest,and of volunteers. The capital accu-mulation total of $66 billion includessomething over $1 billion in R&D, $34billion in education and training, $36billion in health (which is, by assump-tion, one-half of the value of healthproduct), and again $5 billion of nega-tive net revaluations.
Government enterprisesProduct of government enterprises,
in table 4, is estimated on the debitside of the account as the sum oflabor income, $37 billion in 1981,measured net of expenses related towork; capital income and surpluses of$12 billion; and trivial net revalu-ations. The surpluses are the sum ofthe $6 billion that is the BEA itemcalled the current surplus of govern-ment enterprises, which is the net ofthe positive surpluses and negativesurpluses—that is, losses—for the var-ious categories of government enter-prises, and the almost equal amountthat is the sum of the absolute valuesof negative BEA surpluses. The latter,again, are included in order to meas-ure product in terms of factor costrather than, necessarily, the marketvalue of sales.
There are no capital consumptionallowances, and imputed capitalincome is very small, because all ofthe product of tangible governmententerprise capital, other than invento-ries, is attributed to governmentitself. One consideration underlyingthis procedure is that governmentsoften incur direct expenditures forthe provision of fixed capital to gov-ernment enterprises, so that the en-terprises do not, in fact, then cover
Digitized for FRASER http://fraser.stlouisfed.org/ Federal Reserve Bank of St. Louis
January 1985

30 SURVEY OF CURRENT BUSINESS January 1985
capital costs in their sales. The mostimportant consideration, however, isthe need to allocate the imputed prod-uct of this capital by functions inwhich it was employed, and informa-tion for this allocation was generallyavailable only for capital of govern-ment and government enterprisescombined.
As with the business sector, thecredit side of the government enter-prise account starts with a measure ofthe market value of sales, minus, ofcourse, purchases of intermediategoods. Because there is no independ-ent information on intermediategoods, government enterprise netsales becomes the balancing item be-tween total credits and total debits.Credits must also include, then, thevalue of product not paid for by the$43 billion of sales net of purchases.Thus, the credit side shows $11 billionof transfers, stemming from imputedcapital income and negative surplusesthat government enterprises do notcover in their receipts, intermediateproduct from government less indirecttaxes, and employee training expendi-tures. The allocation of these trans-fers between consumption and capitalaccumulation, admittedly ad hoc, isbased on proportions in the rest of theeconomy.
Government
The TISA government sector ac-count, table 5, differs fundamentallyfrom that of BEA. TISA product origi-nating in government includes notonly the value of compensation of em-ployees or, more generally, laborincome, which came to $318 billion in1981; it also includes the value of cap-ital services, the sum of $69 billion ofimputed capital income and $91 bil-lion of capital consumption allow-ances, as well as $25 billion of net re-valuations. In addition, TISA includesthe value of uncompensated factorservices—a tiny item of less than $1billion for jury duty in 1981, but alarger amount in earlier years duringmilitary conscription.
The total of these debit items isgross government product, $504 bil-lion in 1981. This product plus thevalue of intermediate purchases fromother sectors and expenses related towork, but minus change in invento-ries and net revaluations, must thenbe allocated among consumption, cap-
ital accumulation, and intermediateproduct to other sectors. The alloca-tion, which also determines the partto be retained by government and thepart transferred to other sectors (be-cause government output is not, ofcourse, generally sold) involves a com-plicated three-step procedure. First,BEA government expenditures bytype of function are reclassified into10 broad functions: defense (includingpolice and fire protection), space, edu-cation and training, health, housingand community services, transporta-tion and mobility, local parks andrecreation, natural resources, welfare,and general administration. Second,the published data are adjusted toderive TISA measures of product byfunction. Third, for each function,product is allocated to consumption,investment, and intermediate productand among sectors.
Among the major allocations, serv-ices of defense, transportation, andgeneral administration are generallycounted as intermediate to other gov-ernment production or to the outputof other sectors. One-half of the costof manned space flights, which maybe taken as their entertainmentvalue, is viewed as consumption,along with major portions of the prod-uct associated with local parks andrecreation and of the transportationproduct going to households. Educa-tion and training is considered anoutput in the form of capital that istransferred to households. Healthservices are counted as one-half goingto human capital accumulation inhouseholds and one-half maintenance,or current consumption. Investmentin natural resources is counted ascapital accumulated by government.Housing and community services andwelfare are designated as consump-tion. R&D expenditures, associatedwith the defense and space functions,are viewed as creating an output thatis partly retained in government as astock of R&D knowledge and partlytransferred to business.
On the basis of these allocations,government contributes $130 billionof consumption services to householdsin 1981. Government production ofcapital amounts to $315 billion. Ofthis, $25 billion is in the form of R&Dexpenditures viewed as of direct useto business, and $255 billion of outputin the form of capital that goes tohouseholds. The latter includes $225
billion in education and training,mainly the cost of public schools, and$30 billion in health services. TheGovernment retains $35 billion of thecapital it produces, $8 billion in R&D,and $27 billion in natural resources.Further, government contributes $234billion of services that are intermedi-ate to the output of other sectors,chiefly $121 billion to business and$103 billion to the household sector.
Households
Gross household product, in table 6,is the sum of labor income, $1,271 bil-lion in 1981, $143 billion of capitalincome, and $360 billion of tangiblecapital consumption, plus negativenet revaluations of $66 billion. Grosshousehold product in 1981 was thus$1,709 billion—only moderately small-er than gross business product of$2,134 billion.
Actual compensation of employeesin households is, of course, veryminor—only the $7 billion, in 1981,denoted by BEA as household prod-uct. The big items in labor income inthe household sector are the imputa-tions for the opportunity costs of stu-dents, $284 billion, and for unpaidhousehold work, $981 billion. In viewof the size of these items, some moreextended discussion of their deriva-tion may be in order.
Opportunity costs of students relateto those 14 years of age and over. Theestimates were originally prepared byKendrick for 1946-69 and 1973.6 Theyare based on wages estimated to beavailable at the relevant ages andschool enrollments. Kendrick's esti-mates were extended largely on thebasis of later enrollment figures andchanges in average annual compensa-tion of the total labor force, whichwere taken to be proportional tochanges in compensation available tostudents.
The value of unpaid householdwork is taken conservatively to be theproduct of annual hours in relevanthousehold activities and the averagehourly compensation of household do-mestic workers. The time estimateswere derived from the MichiganSurvey Research Center time usestudies of 1965, 1975, and 1981, withthe 1975 survey used as the bench-mark. Mean weekly use of time in a
6. Kendrick, The Formation and Stocks of TotalCapital and unpublished tables.
Digitized for FRASER http://fraser.stlouisfed.org/ Federal Reserve Bank of St. Louis
January 1985

January 1985 SURVEY OF CURRENT BUSINESS 31
set of household activities related towhat is classified as nonmarketoutput was calculated for respondentsand spouses, each cross-classified bysex and as employed or nonemployed.Corresponding figures for 1965 werederived by applying the rates ofchange indicated on a 1965-75 "com-parison tape" to the 1975 data. For1981, a panel of common respondentsin 1975 and 1981 was used to deriveage-adjusted rates of change betweenthose years, and these were applied tothe 1975 data to secure estimates ofmean time use in each of the four cat-egories. Estimates for 1966-74 and1976-80 were derived by geometric in-terpolation. Mean time use for 1946-64, however, was taken to be thesame as in 1965. The mean annualtime use per person in each categoryin each year was multiplied by theapplicable number of persons in theNation to derive figures for total timein activities related to ordinary house-work as well as education of children,medical and health services, volun-teer activities, and travel to work.
The capital income attributed tohouseholds consists of two items. Thelargest is $101 billion for owner-occu-pied nonfarm dwellings. Of this, $91billion is gross imputed interest, leav-ing only some $9 billion for net rentalincome. The remaining $43 billion isimputed interest on the stock of con-sumer goods held by households.
Capital consumption allowances onintangible capital amounted to $351billion. These are subtracted to get ameasure of net income originating,after including net revaluations, of$997 billion. The intangible capitalconsumption allowances, along withtangible capital consumption allow-ances, are added back to get totalgross household product.
Before this product is allocated be-tween consumption and capital accu-mulation, $103 billion of intermediateproduct transferred from governmentand the $1 billion for expenses of do-mestic employees related to travel towork must be added. After accountingfor $19 billion of consumer durablecapital services related to travel towork by members of households,$1,511 billion of household product isconsumed and $283 billion of productis invested. Of the nonmarket prod-uct, $179 billion is the net space rentof owner-occupied nonfarm dwellingsand $332 billion is the value of other
capital services, essentially from thestock of consumer goods. Of imputedlabor services, $944 billion are count-ed as consumption, and the remaining$321 billion go to capital accumula-tion.
Most of that capital accumulation isthe $284 billion for education, whichis equal to the opportunity cost of stu-dents and is considered intangiblecapital accumulated in the household.In addition, $27 billion is for thevalue of time devoted to teaching chil-dren in the home and $18 billion isfor intermediate product of govern-ment to education. One-half of thevalue of time devoted to health, $13billion, is also counted as investment.Net revaluations in 1981 amounted tocapital accumulation of negative $66billion.
III. Constant-Dollar Accountsand Capital Stock Series
The constant-dollar accounts, tables7-12, are generally analogous to thecredit sides of the current-dollar ac-counts. The addenda to table 7 show
constant-dollar NNP and net nationalincome as well as the nonincomecharges against product that must besubtracted from GNP to derive them.Table C shows summary statistics forall years 1946-81.
Constant-dollar series for the BEA-based components of TISA are takendirectly, where possible, from (usuallyunpublished) BEA tables. For otheritems, implicit price deflators provid-ed by BEA, or constructed from BEAseries or from combinations of BEAseries and non-BEA TISA compo-nents, are used to deflate current-dollar measures.
With regard to capital accumula-tion, constant-dollar sectoral invest-ment figures were taken from BEAcapital stock series.7 Investment inhousehold inventories is the differ-ence between successive end-of-yearstocks calculated on the assumption
7. BEA estimates of the stock of privately ownedand government-owned durable equipment and struc-tures and of durable goods owned by consumers for1925-79, as well as investment series used to preparethe estimates, are in Fixed Reproducible TangibleWealth in the United States, 1925-79 (Washington,DC: U.S. Government Printing Office, 1982). Updatedand revised estimates, which were used for the periodbeginning in 1973, are available from BEA.
Table C.—National Income and Product Account: Summary Statistics, 1946-81
[Billions of 1972 dollars]
Year
19461947194819491950.,
19511952195319541955
1956195719581959I960
19611962196319641965
19661967196819691970
19711972197319741975 ..
19761977197819791980
1981
GNP
763.4967.8973.4936.7978.5
1,061.71,035.61,087.71,089.11,178.7
1,212.91,205.31,218.01,254.51,281.9
1,321.61,377.01,418.01,521.71,578.3
1,656.61,688.41,759.61,781.71,802.9
1,844.12,046.82,210.72,140.11,965.3
2,272.22,332.82,446.72,451.02,325.5
2,310.4
Consump-tion
667.6648.4660.2649.3659.4
672.5689.0706.1723.7747.0
765.6783.8797.5820.7839.8
862.4881.8903.4935.0967.5
993.61,016.21,044.11,065.21,091.1
1,110.21,143.71,167.01,176.51,207.8
1,249.11,286.81,327.91,367.31,403.0
1,430.0
Gross domestic capital accumulation
Total
77.9295.4300.1275.0315.0
381.4341.0379.5361.2426.8
439.0410.3415.5431.7434.2
449.7486.2504.1572.9599.1
654.5664.2710.4711.7704.5
729.6902.3
1,030.3952.0736.2
1,012.61,048.81,119.51,075.5
909.0
866.8
Original cost
Tangible
135.1135.5154.6153.8192.4
210.8222.7239.8226.9245.6
243.2235.5229.6252.1248.9
247.4276.8291.9305.4333.6
360.1363.5381.4394.8364.1
388.8421.8458.2432.5392.1
437.8484.4526.0526.6492.1
521.5
Intangible
123.0114.2112.5108.4114.7
120.7125.3133.5137.4149.7
153.4161.4165.3178.6185.7
194.3206.5219.5237.5252.4
274.8296.2310.9323.8334.4
349.4372.0388.6382.2382.6
393.2401.8408.8411.7407.5
414.6
Netexports
17.924.013.112.44.1
7.75.52.14.24.9
8.411.24.92.18.0
9.69.0
10.613.811.8
8.58.05.24.87.3
4.3.7
13.411.621.3
10.4-2.8-.78.1
13.4
13.5
Netnationalincome
566.7771.5791.4746.2776.5
855.0819.7858.4847.8932.2
960.7945.7949.8979.3996.3
1,022.31,062.71,091.11,182.11,227.6
1,289.61,305.01,359.31,355.51,358.1
1,376.31,561.31,705.11,618.51,439.6
1,728.81,774.11,868.21,852.71,705.1
1,678.8
Netnationalproduct
531.8755.7775.7749.4795.9
875.6839.8882.7875.3957.8
986.5972.7979.5
1,009.51,029.4
1,060.51,107.31,137.81,230.21,274.6
1,339.31,353.91,408.01,413.31,418.4
1,445.11,631.91,779.31,695.01,510.5
1,803.51,850.81,948.61,934.11,790.6
1,762.6
Netdomesticcapital
accumula-tion
-153.683.3
102.487.7
132.4
195.3145.3174.5147.4205.9
212.5177.7177.1186.7181.6
188.5216.5223.9281.4295.3
337.2329.7358.8343.3320.0
330.7487.4598.9506.9281.4
544.0566.9621.4558.6374.2
319.2
Digitized for FRASER http://fraser.stlouisfed.org/ Federal Reserve Bank of St. Louis
January 1985

32 SURVEY OF CURRENT BUSINESS January 1985
that nondurable household goodshave a 2-week life. Net revaluationsin constant dollars are calculatedwith the implicit price deflator forfixed investment.
As is BEA procedure, componentsof income are not generally offered inconstant dollars. Since, however, inall sectors except business, total prod-uct is estimated on the debit side, in anumber of important instances cur-rent-dollar debit figures must be de-flated in order to get the constant-dollar credit items that depend uponthem. Thus, for example, the deflatorfor personal consumption expendi-tures is applied to opportunity costs ofstudents, and a domestic wage defla-tor is applied to unpaid householdwork.
TISA departs from convention fornet exports and applies essentiallythe alternative "command" conceptpresented by BEA.8 Instead of defin-ing net exports as constant-dollar ex-ports minus constant-dollar imports,TISA defines them as current-dollarnet exports divided by the GNP im-plicit price deflator. With this meas-ure of net exports, constant-dollarGNP better reflects the goods andservices actually available to the resi-dents of the United States. TISA netexports in constant dollars thus equalthe conventional BEA net exportsplus a "terms of trade effect," reflect-ing the fact that more or less U.S.goods must be produced to get a givenreal quantity of foreign goods. In1981, the terms of trade effectamounted to minus $30 billion 1972dollars, converting a $43 billion BEAnet export surplus to one of only $13billion in TISA.
The capital stock series in currentand constant dollars, shown in tables13 and 14 with corresponding implicitprice deflators in table 15, are consist-ent with the income and product ac-counts. Constant-dollar capital stocksat the end of each year in each sectorequal capital stocks at the end of theprevious year plus gross capital accu-mulation (including net transfer ofcapital into the sector), minus capitalconsumption allowances. Current-dollar capital stocks equal previousstocks plus gross capital accumulation(includes net transfers), minus cur-rent-cost capital consumption allow-
ances, plus gross revaluations. (Netrevaluations of tangible capital in theincome and product accounts maythen be calculated from the gross re-valuations by netting out the portionattributable to changes in the generallevel of prices.)
Tangible capital stocks other thanland are generally BEA series.9 Con-sistent with the inclusion of all in-vestment in the TISA income andproduct accounts, the capital stocksinclude residential and nonresidentialstructures and equipment in all sec-tors—government, government enter-prises, and households, as well asbusiness and nonprofit institutions—and, for households, durables, semi-durables, and inventories, along withhousing. The separate estimates ofland in all sectors are usually fromseries provided by the Flow of FundsSection of the Board of Governors ofthe Federal Reserve System.
Intangible capital relates either toR&D, credited to the business andgovernment accounts, or to health oreducation and training. Stocks relatedto the latter, wherever produced, aredeemed human capital owned byhouseholds.
The methodology for intangible cap-ital stock series is largely similar tothat employed by Kendrick.10 Wherepossible, his series are used for theyears he covered, and they are extrap-olated and interpolated, with the aidof associated series, for other years.His investment in mobility and basicchild-rearing is excluded, however,while TISA adds the value of timespent in education and in medicalcare in the home.
TISA employs the gross simplifyingassumption that most human capitalis general—that is, not tied to anyparticular job or occupation—andthat general human capital has aservice life of 50 years. However, foremployee training, military educa-tion, and safety and health spendingby business, 40 percent of the invest-ment is assumed to be specific—thatis, useful to employees only as long asthey remain in the activity for whichthe capital was provided. Service livesfor specific capital are assumed to beequal to the average length of em-ployment in the sector in which it is
8. See Edward F. Denison, "International Transac-tions in Measures of the Nation's Production," SURVEY61 (May 1981): 17-28.
9. See footnote 7.10. Kendrick, The Formation and Stocks of Total
Capital and unpublished tables.
produced. As indicated earlier, onlyone-half of health services is consid-ered investment. The inference thatmuch of the noninvestment half is for"maintenance" of the elderly maysupport the reasonableness of the as-sumption of the 50-year average lifefor general health capital.
R&D investment series are general-ly from the National Science Founda-tion. Applied R&D capital is assumedto have a service life of 20 years, andbasic R&D capital is assumed to lastforever.
IV. Substantive Highlights
In 1981, TISA NNP was 30 percentmore than the BEA NNP, and 36 per-cent more if the negative net revalu-ations of that year are excluded (tableD). Constant-dollar TISA GNP was 53percent more than BEA GNP in 1981,and 57 percent more if the negativenet revaluations are excluded.
The difference between TISA andBEA measures of product relates pre-ponderantly to TISA's inclusion ofnonmarket product. Over one-half isaccounted for by the TISA imputationfor the product of unpaid householdlabor. The remainder is made upmostly of opportunity costs of stu-dents and capital services in house-holds, government, and nonprofit in-stitutions. The latter was 14.9 percentof TISA GNP in 1981. TISA imputa-tions of labor income were 32.9 per-cent of TISA GNP, thus bringing totallabor income, even after deduction ofexpenses related to work, to 81 per-cent more than BEA's compensationof employees.
TISA picks up a great deal of whatmay be viewed as capital formationthat is not encompassed in the BEAdefinitions of gross and net privatedomestic investment. BEA's gross pri-vate domestic investment—tangibleinvestment by business and nonprofitinstitutions along with housing—ac-counted for only 25.9 percent of TISAgross capital accumulation excludingnet revaluations in 1981. The con-stant-dollar figure was 24.2 percent.TISA net domestic capital accumula-tion in current dollars was 19.5 per-cent of TISA NNP, both excluding netrevaluations; BEA net private domes-tic investment, by contrast, was only
Digitized for FRASER http://fraser.stlouisfed.org/ Federal Reserve Bank of St. Louis
January 1985

January 1985 SURVEY OF CURRENT BUSINESS 33
Table D.—National Income and Product Account: TISA as Percent of BEA
Year or multi-year mean
19461951195619611966197119761981
1946-551956-651966-751976-811946-81
Based on current dollars
GNP/GNP
138.7169.3172.3168.1164.9164.4178.5154.4
166.7167.5167.1168.9167.4
Consumption/PCE
175.3158.0164.5169.0159.5158.5156.2153.8
164.4165.2157.4154.0160.9
GDCA/GPDI
101.6385.8399.4413.7396.5421.7527.6353.3
360.3403.4441.1436.7407.4
NNI/NI
118.8162.4161.1156.3153.9151.4169.0138.2
155.9155.9155.2156.4155.8
NNP/NNP
101.1150.2151.0146.1144.4141.5157.2130.5
142.2145.8145.2146.8144.8
NDCA/NPDI
-373.1389.0419.0455.9392.6455.5867.0373.0
282.6429.1519.5586.1439.7
Based on constant dollars
GNP/GNP
159.6183.3180.6174.7168.2164.3175.0152.6
182.4174.4167.6165.2173.2
Consumption/PCE
221.8196.9188.9186.9169.7159.3151.8149.5
201.7184.2160.3149.2176.6
GDCA/GPDI
109.9406.0427.7432.8401.5419.6548.8381.0
376.2421.5444.8463.9422.5
NNI/NI
140.9178.3172.2164.2158.0151.0165.8138.5
173.8164.5155.9154.0163.0
NNP/NNP
119.7163.9160.4153.3147.8141.4153.7129.8
157.7153.5145.8143.7150.9
NDCA/NPDI
4159401.2461.0485.1399.8449.0915.6445.6
287.3456.9530.7647.6462.1
NOTES.—TISA:
GDCAGNPNDCANNINNP
Gross domestic capital accumulation.Gross national product.Net domestic capital accumulation.Net national income.Net national product.
BEA:GNPGPDININNPNPDIPCE
Gross national product.Gross private domestic investment.National income.Net national product.Net private domestic investment.Personal consumption expenditures.
5.5 percent of BEA NNP. Further,BEA net private domestic investmentwas only 20.9 percent of TISA net do-mestic capital accumulation excludingnet revaluations and 60.7 percent ofTISA net tangible capital accumula-tion at original cost.
Similar proportions show up in themeasures of capital stocks. Businessnonresidential structures and equip-ment, to which much attention is usu-ally given as a source of productivity,amounted to 11.2 percent of totalTISA capital in all sectors—includingintangible capital as well as land andreproducible tangible capital—of some$24 trillion at the end of 1981. Struc-tures and equipment in governmentcame to 6.3 percent and in govern-ment enterprises to another 1.8 per-cent, and the household stock of con-sumer durables and residential cap-ital came to 13.2 percent. The stock ofintangible capital in the form of R&Dwas 2.7 percent of the total, and in-tangible human capital from invest-ment in education and training andin health came to 45.0 percent. Intan-gible capital, thus, was almost one-half—47.7 percent—of the total stockof capital in 1981, while tangible re-producible capital amounted to only41.1 percent, and land, 11.3 percent.
Over the long run, there has appar-ently been some substitution of themarket output generally measured inthe BEA GNP for the nonmarketoutput also included in TISA. Thus,while the average annual rate ofgrowth of BEA real GNP was 3.35percent from 1946 to 1981, thatgrowth rate for TISA GNP excludingnet revaluations was only 2.68 per-cent. Corresponding growth rates for
BEA and TISA real NNP were 3.24percent and 2.74 percent, respectively.Including net revaluations, the aver-age growth rate of TISA GNP was3.21 percent, but that reflected consid-erably the negative net revaluationsfor 1946.
Substantially negative net revalu-ations in 1981 contributed to lowerreal rates of growth in the 1976-81period for TISA measures of totalproduct and, particularly, capital ac-cumulation. Excluding net revalu-ations, however, a marked decline inthe real rate of growth of TISA grossdomestic capital accumulation is stillapparent—to 3.04 percent for 1966-71and only 2.37 percent for 1971-76 and2.43 percent for 1976-81, comparedwith 4.36 percent and 4.83 percent inthe two previous decades. Despitemuch concern expressed in somequarters, BEA gross private domesticinvestment actually had a substan-tially larger real rate of growth in1976-81, 4.28 percent, than the 3.39percent over the entire 1946-81period. (BEA net investment grew lessrapidly, but that may reflect some dis-tortion in the capital consumption ad-justment.) The rate of growth of tan-gible government capital accumula-tion at original cost was only 2.32 per-cent (4.87 percent for government en-terprises), compared with 3.44 percentfor business, 4.45 percent for nonprof-it institutions, and 3.80 percent forhouseholds.
Of particular note are the relativegrowth rates of tangible and intangi-ble investment. Over the entire 1946-81 period, constant-dollar tangiblecapital accumulation at original costgrew at an average annual rate of3.94 percent, while intangible capital
accumulation grew at a rate of 3.53percent. Contrasts over subperiods,however, are sharper. Tangible cap-ital accumulation showed declininggrowth rates in the first two dec-ades—6.06 percent and 4.00 percent—and then only 1.55 percent in 1966-71before rising to 2.40 percent in 1971-76 and 3.56 percent in 1976-81. Thepattern of growth in intangible in-vestment, however, showed an in-crease, from 2.24 percent in 1946-56to 6.01 percent in 1956-66, followed bydeclines to 4.92 percent in 1966-71, to2.39 percent in 1971-76 and to 1.07percent in 1976-81. The last declinestemmed from a falloff, to 0.49 per-cent, in the rate of growth of capitalaccumulation in education and train-ing.
TISA suggests some substantial cor-rection to the views of those who haveasserted that Americans have beenenjoying more and more consumptionat the expense of investment. Whennonmarket product going to consump-tion—chiefly from the householdsector but also from government, non-profit institutions, and business—istaken into account, a different pictureemerges. In contrast to the rates ofgrowth of 3.94 percent and 3.53 per-cent over the 1946-81 period notedabove for constant-dollar tangible andintangible capital accumulation, re-spectively, and 3.36 percent for BEApersonal consumption expenditures,TISA total consumption grew at anaverage annual rate of only 2.20 per-cent. In the first two decades, thegrowth rates of consumption were,consecutively, 1.38 percent and 2.64percent, and then 2.24 percent in1966-71 and 2.39 percent in 1971-76.In 1976-81, that growth rose to 2.74
Digitized for FRASER http://fraser.stlouisfed.org/ Federal Reserve Bank of St. Louis
January 1985

34 SURVEY OF CURRENT BUSINESS January 1985
Table E.—Sector Products
Year
1946 .„19511956 „1961.1966197119761981
1946....~195119561961 ...... .1966197119761981
Current dollars
Total(GNP) Business Non-
profitGovern-
mententerprise
Govern-ment
House-hold
Rest ofworld
Billions of dollars
291.1559.9726.5882.0
1,246.81,771.23,067.24,560.1
118.7278.3347.1400.2584.7795.0
1,452.42,134.5
5.29.6
13.819.429.645.670.8
113.3
3.44.66.58.7
12.219.630.849.8
41.663.888.1
105.2153.6225.7326.4504.3
121.3201.5267.8344.5461.0676.1
1,166.41,708.7
0.82.13.23.95.69.2
20.549.6
Percent of total product
100.0100.0100.0100.0100.0100.0100.0100.0
40.849.747.845.446.944.947.446.8
1.81.71.92.22.42.62.32.5
1.2.8.9
1.01.01.11.01.1
14.311.412.111.912.312.710.611.1
41.736.036.939.137.038.238.037.5
.3
.4
.4
.4
.5
.5
.71.1
Constant dollars
Total(GNP) Business
763.41,061.71,212.91,321.61,656.61,844.12,272.22,310.4
193.9435.0507.5540.5732.1819.9
1,087.71,093.5
Non-profit
Govern-ment
enterpriseGovern-
mentHouse-hold
Rest ofworld
Billions of 1972 dollars
22.124.729.935.445.348.551.851.5
10.812.814.716.219.121.223.128.1
178.3138.8166.4180.2222.8240.8244.6249.4
351.8449.1491.0542.6627.9701.5864.3891.7
6.51.33.46.89.4
12.2.6
3.9
Percent of total product
100.0100.0100.0100.0100.0100.0100.0100.0
25.441.041.840.944.244.547.947.3
2.92.32.52.72.72.62.32.2
1.41.21.21.21.21.11.01.2
23.413.113.713.613.513.110.810.8
46.142.340.541.137.938.038.038.6
.8
.1
.3
.5
.6
.70-.2
percent, but this was still well belowthe corresponding 3.56 percent ratefor tangible capital accumulation atoriginal cost.
Rates of growth of the businesssector were considerably larger overthe entire 1946-81 period than thoseof government and households. Inconstant dollars, the growth rateswere 5.07 percent for business, 0.96percent for government, and 2.69 per-cent for households. The low govern-ment-sector figure reflected, in part,the relatively large government prod-uct in 1946, before World War II de-mobilization had been completed. In1981, TISA gross business product incurrent dollars was still less than one-half—46,8 percent—of TISA GNP(table E). The share of the nonprofitsector was 2.5 percent, that of govern-ment and government enterprisescombined was 12.1 percent, and thatof households was 37.5 percent.
TISA real growth rates should beinterpreted with caution, however. Aswith the BEA figures, their accuracydepends critically on the accuracy ofunderlying price deflators. Manyprice deflators are essentially input-based, and may well omit or under-state significant effects of change inproductivity. It may be observed, inparticular, that while TISA implicitprice deflators for consumption andintangible capital accumulationmoved in quite parallel fashion, thatfor tangible capital formation rosemore slowly (table F). Over the entireperiod 1946-81, deflators for consump-tion and intangible capital accumula-tion rose at average annual rates of4.87 percent and 5.20 percent, respec-tively, but that for tangible capitalformation rose at a rate of only 4.05percent. If the increase in the relativeprice of intangible capital is overstat-ed, the rates of growth in real intan-
gible and total capital formation rela-tive to BEA investment figures arealso correspondingly understated.
Whatever the caveats in this verysummary presentation, a number ofsalient findings demand attention.Nonmarket output provides an enor-mous—even if declining—proportionof total U.S. product. Corresponding-ly, business product, while growing ata more rapid rate than nonbusinessproduct, is still less than one-half ofthe total. Similarly, the great bulk ofcapital accumulation takes place out-side of the business sector, and moreof it takes the form of intangible thantangible capital. Analysts and policy-makers cannot properly ignore themajor contributions of the householdand government sectors to capital ac-cumulation and to total product. Con-sideration of the Nation's fundamen-tal set of choices between current con-sumption and investment for the
Digitized for FRASER http://fraser.stlouisfed.org/ Federal Reserve Bank of St. Louis
January 1985

January 1985 SURVEY OF CURRENT BUSINESS 35
Table F.—Implicit Price Deflators and Inflation Rates, GNP and Components, 1946-81
Year
19461947194819491950
19511952195319541955.
19561957195819591960
19611962196319641965
19661967196819691970
19711972197319741975
19761977197819791980
1981
Implicit price deflators (1972=100)
GNP
38.143.946.747.148.5
52.754.255.756.558.0
59.961.762.864.466.0
66.768.169.270.672.6
75.378.082.386.691.5
96.1100.0105.7116.1125.5
135.0143.9154.4167.5182.3
197.4
Consumption
37.842.143.944.545.3
48.651.253.254.755.7
57.259.360.862.464.5
65.666.868.069.571.7
74.777.482.086.491.5
96.0100.0106.1116.6125.5
135.5144.5154.7168.2183.9
199.7
GDCA
Total
40.047.552.753.055.1
59.960.060.360.362.0
64.666.266.768.068.7
68.870.571.372.473.9
76.178.982.687.091.5
96.2100.0105.2115.4125.7
134.3143.2153.9166.6179.8
193.6
Original cost
Tangible
46.453.159.259.161.0
65.765.164.564.866.4
69.471.471.372.873.2
72.874.374.775.676.6
78.581.084.588.692.4
96.9100.0104.2113.9125.1
131.6140.1149.6161.7173.6
186.5
Intangible
34.840.243.544.145.0
49.251.052.452.954.1
56.058.259.761.262.6
63.665.366.768.270.2
73.076.480.485.090.5
95.4100.0106.1116.6126.9
135.2144.5155.4169.3187.2
205.1
Net exports
43.949.653.052.553.6
57.157.958.859.560.8
62.864.966.067.668.7
69.370.671.772.874.4
76.879.182.586.891.4
96.0100.0105.8115.1125.8
132.3140.1150.4163.4178.4
195.1
NNI
37.443.545.945.947.6
52.153.154.755.457.3
58.660.061.162.864.6
65.667.168.370.072.1
75.077.782.186.591.5
95.9100.0105.9116.2124.6
134.8143.7153.9166.9181.1
195.3
NNP
37.243.445.945.947.7
52.153.254.855.557.3
58.660.161.262.964.8
65.767.368.570.172.2
75.077.782.286.591.6
96.0100.0105.8116.0124.5
134.5143.1153.0165.7179.7
194.3
NDCA
40.451.857.755.359.6
63.862.161.559.563.1
63.763.362.764.865.6
66.069.370.672.173.5
75.778.682.787.091.6
96.399.9
105.2114.7120.0
132.1139.7149.2159.6163.6
169.9
Annual inflation rate
GNP
15.26.4.9
2.9
8.82.72.81.62.6
3.23.01.82.42.5
1.22.01.62.12.7
3.73.65.55.35.7
4.94.15.79.88.2
7.56.67.28.58.8
8.3
Consumption
11.54.21.51.7
7.45.33.82.82.0
2.53.72.62.73.4
1.71.71.82.33.2
4.13.66.05.36.0
4.84.26.19.97.6
8.06.67.18.79.4
8.6
GDCA
18.911.0
.53.9
8.7.3.4
02.8
4.22.5
.72.1
.9
.22.41.11.62.0
3.13.74.75.35.2
5.14.05.29.78.9
6.96.67.48.37.9
7.7
NOTES.—GDCA Gross domestic capital accumulation.GNP Gross national product.NDCA Net domestic capital accumulation.NNI Net national income.NNP Net national product.
future may well take into account theevidence that total consumption hasin fact been growing less rapidly thantotal capital accumulation.
Finally, and not the least, this pres-entation should be an important re-minder that it can be done! A compre-hensive, consistent set of accounts,
patterned after the traditional nation-al income and product accounts, canbe put together to offer a moving pic-ture of total product and income,market and nonmarket, of all sectorsof the economy. It may be hoped thatthese accounts will enhance our abili-ty to measure the state of the Na-
tion's welfare and its progress and toestimate basic macroeconomic rela-tions of the economy. It may also behoped that resources will be found toextend and improve upon these ac-counts in the future.
Tables 1-15 follow on pages 36-^8.
Digitized for FRASER http://fraser.stlouisfed.org/ Federal Reserve Bank of St. Louis
January 1985

36 SURVEY OF CURRENT BUSINESS January 1985
Table 1.—National Income and Product Account
Line
123456789
1011
121314
151617181920212223242526
27282930313233343536
373839404142
43
44
454647
48
49505152
53545556
575859
606162
63
6465666768697071727374
75
Labor incomeCompensation of employees
Domestic .Rest of world
Additional imputationsEmployee trainingExpense account items of consumptionLabor income of self-employedOpportunity costs of studentsUnpaid household work
Less' Expenses related to work
Rental income owner-occupied nonfaim dwellingsGross rental income
Less: Net imputed interest on owner-occupied nonfarm dwellings andland.
Capital incomeInterest paidNet imputed interest (excluding business)
Gross imputed interestLand ~~~ ~~~ ~-Owner-occupied dwellings . ....Structures and equipmentConsumer durables and semidurables .. . ... ....InventoriesGovernment research and development ... ....
Less' Interest paid (excluding business)Net interest, rest of world .
Net operating surplusCorporate profits
DomesticRest of world .
Proprietors' capital incomeProprietors' income . ....Less' Labor income of self-employed
Gross business investment in research and developmentGovernment enterprise surplusesNet rental income of persons
Net revaluationsLand .Owner-occupied dwellingsStructures and equipment other than owner-occupied dwellingsConsumer durables and semidurablesInventories . . .. ..
Net surplus (27+37)
National income (1 + 12-1-15+43)
Less: Intangible capital consumptionCapital consumption on all research and developmentCapital consumption on human capital
Net national income (44—45)
Business transfer paymentsMedia support ..Health and safetyOther
Uncompensated factor servicesVolunteersDrafteesJurors
Net indirect business taxesIndirect business taxes ... ..Less' Intermediate product transferred from government to business
Statistical discrepancyBEA statistical discrepancyTISA statistical discrepancy
Net national product (48+49+53+57+60)
Capital consumption allowancesTangible
Original costRevaluations
IntangibleOriginal cost .
On research and developmentOn human capital
RevaluationsOn research and developmentOn human capital
Charges against gross national product (63+64)
Debits
Billions of dollars
1946
268.9118.0118.1
0153.7
9.61.9
35.311.695.32.9
.11.81.6
14.06.57.4
13.3.8
2.26.02.31.9.1
5.9.2
23.616.615.9
.71.4
36.735.3
.81.23.7
-75.3-21.8-6.1
-22.8-13.9-10.7
-51.6
231.4
19.3.7
18.6
212.1
1.4.6.3.5
3.42.11.30
-19.616.035.6
.5
.50
197.9
93.273.958.515.419.315.8
.515.23.5.1
3.4
291.1
1956
483.1243.5243.6-.1
248.312.64.0
42.325.4
164.18.8
.56.15.6
33.916.417.131.63.58.49.87.12.6
.314.6
.4
56.243.740.92.81.7
43.942.33.32.05.5
27.721.745
14.0-2.6-.8
84.0
601.4
38.42.9
35.5
563.0
3.91.9.7
1.4
10.34.26.0.1
3.131.628.4
-2.1210
578.2
148.3109.992.217.738.424.02.3
21.714.4
.613.8
726.5
1966
841.3439.3439.2
0416.125.46.3
55.660.9
267.914.1
.910.910.0
82.243.537.370.111.717.223.113.63.21.2
32.81.4
108.985.180.94.24.9
60.555.67.23.87.8
12.016.44.13.5
-7.3-4.7
120.8
1,045.2
78.510.168.3
966.7
8.24.01.23.0
17.16.8
10.1.2
10.456.446.0
1.41.40
1,003.8
243.0164.6150.314.378.550.68.7
41.927.81.4
26.4
1,246.8
1971
1,240.7652.2652.1
0609.732.18.9
68.5116.9383.321.1
1.211.210.0
110.174.633.583.112.522.526.017.92.81.4
49.72.0
109.183.276.17.1
.969.468.510.75.39.1
-12.0-9.9
7.714.2
-20.5-3.5
97.1
1,449.2
129.617.8
111.9
1,319.5
11.25.01.84.4
24.910.314.3
.4
28.187.959.8
4.14.10
1,387.9
383.3253.7213.240.5
129.680.513.666.849.24.1
45.1
1,771.2
1976
1,960.11,036.31,036.4
0956.846.613.995.5
188.6612.333.0
2.910.77.8
166.1130.829.0
116.819.134.534.624.12.81.7
87.76.2
174.8138.1123.814.3
-1.494.195.517.47.8
12.8
248.4137.551.512.5
-11.358.3
423.3
2,552.4
221.330.2
191.1
2,331.0
19.08.52.67.9
15.615.00.6
54.4128.674.3
5.15.10
2,425.1
642.1420.8311.9108.8221.3126.419.6
106.894.910.684.3
3,067.2
1981
3,208.71,769.21,769.3
01,502.0
73.724.6
138.8284.2980.762.5
9.313.34.1
369.8332.111.8
209.736.470.154.341.84.92.2
197.926.0
247.7192.3168.723.7
-18.6120.2138.833.912.128.0
-153.7-142.4-13.7
64.9-34.9
277
94.0
3,681.8
402.351.2
351.1
3,279.5
33.515.84.7
12.9
18.718.00.7
98.0219.3121.3
49-4.9
0
3,424.7
1,135.5733.1494.2239.0402.3205.829.0
176.8196.522.2
174.3
4,560.1
Average annual percent change
1946-56
6.0337.5097.509
n.a.4.9112.7367.8281.8118.1035.585
11.732
13.03913.31313.337
9.2079.7638.6569.058
15.97514.1814.979
11.9053.264
13.2539.552
11.235
9.06010.1879.922
15.1052.0731.8211.811
15.8895.2104.032
n.a,n.a.n.a.n.a.n.a.n.a.
n.a.
10.020
7.11415.6736.664
10.253
10.69411.3518.410
11.071
11.5626.908
16.74612.548
n.a.7.027
-2.225
n.a.n.a.
-7.902
11.318
4.7584.0564.6651.3977.1144.280
15.8153.599
15.06815.14615.064
9.579
1956-66
5.7046.0776.073
n.a.5.2987.2684.6292.7849.1505.0254.900
5.9895.9195.913
9.26610.2618.1328.290
12.7307.4819.0186.7042.264
16.8048.472
12.311
6.8316.8827.0524.085
11.3603.2532.7848.2146.5613.591
-8.066-2.731
n.a.12970
n.a.n.a.
3.707
5.682
7.41013.4886.760
5.555
7.8257.9656.2628.328
5.1925.1025.2614.820
12.7685.9704.923
n.a.n.a.
6697
5.671
5.0634.1195.002
-2.0847.4107.761
14.4366.7996.8028.9946.699
5.550
1966-71
8.0818.2248.225
07.9394.8407.1154.246
13.9347.4238.385
7.105.537
-.113
6.02011.397
-2.1473.4561.3845.4622.3925.618
-3.1643.0358.6227.564
.047-.445
-1.21111.068
-28.7692.7734.2468.1046.6982.929
n.a.n.a.
13.30032.456
n.a.n.a.
4.275
6.754
10.56811.94010.359
6.420
6.4174.7277.9757.890
7.8648.4317.304
15.554
22.0629.3045.406
24.29024.319
n.a.
6.695
9.5419.0387.246
23.09310.5689.7099.3859.776
12.06424.18411.259
7.274
1971-76
9.5789.7059.707
n.a.9.4337.7159.3176.869
10.0449.8219.345
19.133-.937
-4.884
8.56611.875
-2.8047.0318.7908.9275.8406.072.471
4.17512.05225.482
9.88410.65810.22314.936
n.a.6.2776.869
10.3548.2167.226
n.a.n.a.
46.243-2.602
n.a.n.a.
34.232
11.986
11.28911.21111.302
12.054
11.08411.0418.052
12.251
-8.9607.973
n.a.7.867
14.1247.9064.412
4.4704.480
n.a.
11.809
10.86710.6487.912
21.84411.2899.4607.4939.844
14.04420.88213.330
11.608
1976-81
10.35911.29011.290
n.a.9.4379.608
12.0917.7698.5449.881
18.617
26.1924.600
-12.143
17.36620.480
-16.50012.42613.78415.2359.442
11.68011.5325.628
17.67133.069
7.2156.8506.377
10.637n.a.
5.0187.769
14.1889.002
16.895
n.a.n.a.n.a.
39.091n.a.n.a.
-25.986
7.603
12.69711.12112.938
7.066
11.96613.27312.60610.267
3.6623.674
n.a.3.335
12.49011.25510.314
n.a.n.a.n.a.
7.146
12.07711.7469.639
17.03812.69710.2398.152
10.60515.66915.87515.643
8.255
1946-81
7.3418.0428.041
n.a.6.7295.9967.6073.9879.5596.8889.184
12.7145.9702.672
9.79611.9171.3228.201
11.51910.3596.4958.6202.762
10.28210.58515.864
6.9457.2546.982
10.623n.a.
3.4483.987
11.4996.7725.946
n.a.n.a.n.a.n.a.n.a.n.a.
n.a.
8.226
9.06413.2148.750
8.138
9.4839.6348.2659.876
4.9456.288
n.a.8.696
n.a.7.7653.563
n.a.n.a.n.a.
8.487
7.4056.7776.2898.1489.0647.617
12.1667.254
12.15915.48711.907
8.179
Digitized for FRASER http://fraser.stlouisfed.org/ Federal Reserve Bank of St. Louis
January 1985

January 1985 SURVEY OF CURRENT BUSINESS 37
Table 1.—National Income and Product Account—Continued
Line
123
456789
1011121314151617181920212223242526272829
303132333435363738394041424344454647484950515253545556575859606162636465666768697071727374757677787980818283848586878889
909192
93
ConsumptionHousehold expenditures for services and nondurables
Gross expenditures included from BEA personal consumption expendi-tures.
Less: Personal consumption expenditures expenses related to workExpense account items of consumptionBEA imputations other than housingSubsidies allocated to consumption
Subsidies included in business incomeLess' Amount allocated to investment
TransfersFrom business
Media supportTotal media support
Health and safetyFrom nonprofit institutionsFrom government enterprisesFrom government
Nonmarket services produced in householdsNet space rent of owner-occupied nonfarm dwellingsOther capital services
DurablesTotal durablesLess' Durables allocated to investmentLess: Services of durables to expenses related to work
SemidurablesInventories
Labor servicesLess: Labor services allocated to investment
Gross domestic capital accumulation . .Original cost
TangibleStructures and equipment and household durables and semidurables
BusinessNonresidential
StructuresEquipment
Residential other than owner-occupied nonfarm dwellingsNonprofit institutions
StructuresEquipment
Government enterprisesStructuresEquipment
GovernmentStructuresEquipmentProduct accumulated
HouseholdsOwner-occupied nonfarm dwellingsDurablesSemidurables
Fixed gross private domestic investment reconciliationNIPA fixed gross private domestic investmentLess: Corresponding sector totals
Government capital accumulation reconciliationNIPA government investmentLess: Government and government enterprise totals
Change in inventoriesBusinessGovernmentHouseholds
Intangible. . . .Research and development
BusinessNonprofit institutionsGovernment
Education ..Health
Subsidies and government enterprise transfers allocated to investmentNet revaluations
Land.BusinessNonprofitGovernment and government enterprisesHouseholds
Structures and equipmentBusinessNonprofit institutionsGovernmentHouseholds (owner-occupied dwellings)
Household durables and semidurablesDurablesSemidurables . ...
Inventories . .Business (including nonprofit)Government enterprisesGovernmentHouseholds
Net exports ..ExportsImports
Gross national product
Credits
Billions of dollars
1946
252.188.790.7
2.01.94.81.01.5.4
30.1.6.4.6.2.1
5.11.1
23.3125.5
5.629.010.311.6
.4
.918.7
.1107.016.1
31.1105.562.766.419.418.16.4
11.71.3.5.4
0.6.6
06.71.82.42.5
41.45.7
15.819.913
24.325.6-.84.04.8376.4
-10.2.1
42.71.6.8
0.8
35.65.5.9
-75.3-21.8-16.5
-.2-3.2-1.9289
-11.2.1
-11.761
-13.9-9.7
42-10.7
0.3
-10.7-.3
7.815.17.3
291.1
1956
437.6158.1162.3
4.34.04.8.5.8.3
37.41.71.31.9.5.3
9.91.7
24.1232.819.057.330.536.11.14.5
26.7.1
189.533.0
283.6254.6168.7162.942.038.714.224.53.32.32.0
.23.53.3
.222.99.5
10.62.8
82.718.137.926.73.9
66.362.45.7
29.323.65.84.71.0.1
85.88.43.3.1
5.065.911.61.3
27.721.711.6
.94.05.19.55.9
.47.745
-2.6-1.1-1.5-.8
.8
.2-1.7-.1
5.325.019.8
726.5
1966
742.0267.4275.7
8.46.37.42.44.01.6
72.63.63.04.0
.9
.618.92.2
47.9385.940.390.050.358.01.95.8
39.5.3
328.973.4
498.3483.4282.6271.977.671.521.949.5
6.25.04.5.5
5.65.2.4
38.319.013.16.2
129.320.768.040.68.3
111.6103.3
7.845.537.710.814.1
-3.6.3
200.721.87.2
.414.2
153.925.13.0
12.016.45.4.6
5.84.67.62.9.5.1
4.1-7.3-5.8
15-4.7
35-.3
90
6.544.638.1
1,246.8
1971
1,065.3378.4391.3
12.98.9
13.32.94.81.9
104.64.73.95.01.2.9
30.02.9
66.9557.258.9
133.777.588.93.28.2
55.9.3
500.2135.6
701.8709.9376.6370.2103.292.630.062.510.65.55.0.5
8.37.6
.744.922.814.57.6
190.037.497.255.412.6
158.8146.1
5.551.145.66.47.7
-1.3.1
333.426.710.7
.615.5
263.942.83.8
-12.09957
-1.5-2.0
721.93.3
.410.67.7
-20.5-18.8-1.7-3.5
25.2
1 1-.1
4.168.864.7
1,771.2
1976
1,693.0605.3626.5
21.213.926.63.45.62.2
161.18.06.78.51.81.3
47.93.0
102.2882.894.9
204.8123.9140.8
5.111.880.5
.4801.0218.0
1,360.41,107.8
576.2563.2167.5156.646.3
110.210.96.25.4.8
13.912.51.3
61.326.123.211.9
293.754.8
156.882.117.5
246.0228.5
3.166.363.213.011.8
.5
.6531.638.817.4
.920.5
418.474.44.2
248.4137.578.30
28.430.764.019.1
-2.343
51.5-11.3-8.4-2.958.361.1-.323-.2
13.8170.9157.1
3,067.2
1981
2,856.01,044.21,088.1
43.924.644.57.3
12.04.7
280.114.812.515.83.42.4
81.06.0
178.21,455.4
178.9332.3209.5237.0
8.918.6
122.0.8
1,265.0320.8
1,677.91,823.0
972.8953.8344.5322.9113.4209.521.610.38.61.7
22.320.12.2
102.732.643.426.7
444.382.5
236.1125.619.1
456.5437.310.6
108.998.319.018.5
.4
.1850.268.533.91.5
33.1640.1141.6
8.51537
-142.4-94.1-1.2294
-17.651.217.74 2
51.4-13.7
349255-9.4
-27.7-30.6
02.7
.2
26.3368.8342.5
4,560.1
Average annual percent change
1946-56
5.6705.9475.996
8.0147.828-.135
-6.424-5.405-3.323
2.19911.57212.53011.3518.8358.4106.8574.337
.3466.371
12.9507.045
11.50312.0029.670
17.2023.6307.4525.8827.434
24.7279.209
10.3999.3908.0367.9158.3577.6679.586
17.45717.53816.77318.51518.52518.35813.08918.18216.113
.8967.176
12.2309.1712.987
n.a.10.5759.332
n.a.22.06917.246
n.a.-3.019
n.a-.2967.219
17.99815.88910.48719.9516.3477.6273.790
n.a.n.a.n.a.n.a.n.a.n.a.n.a.n.a.
12.361n.a.n.a.n.a.n.a.n.a.n.a.n.a.
-3.469n.a.n.a.
-3.8775.176
10.505
9.579
1956-66
5.4225.3955.440
6.9914.6294.518
16.51517.02517.8546.8598.1698.5957.9656.1786.2626.7372.2037.0875.1837.8284.6265.1334.8646.0172.5104.0047.1005.6688.331
5.7986.6225.2935.2526.3326.3174.4157.2956.5098.246 :8.2198.473 •4.8234.7406.0835.2847.1452.1198.5114.5671.3146.0214.2907.7705.3385.1673.2434.4944.7756.381
11.638n.a.
6.9338.869
10.0338.214
12.96911.0248.8538.0498.5718066
-2.731-7.322-4.592
3.779-1.125-2.168-6.884
2.239-35.360
n.a.n.a.n.a.n.a.n.a.n.a.n.a.n.a.n.a.
2.1205.9356.773
5.550
1966-71
7.5027.1967.254
9.0477.115
12.4103.3163.4973.7707.5715.3814.8364.7274.3737.9759.6605.8666.9397.6277.8878.2339.0518.938
10.4317.3967.1853.6778.748
13.075
7.0877.9925.9076.3665.8575.3066.4964.762
11.5332.1222.4731 0998.3558.023
12.6433.2223.6962,0474.1618.014
12.6137.4226.3998.7707.3117.190
-6.6962.3683.893
-9.82711 530
n.a.-18.067
10.6794.1098.1047.8851.697
11.39311.3145.003n.a.n.a.n.a.n.a.n.a.n.a.
23.5632.603
-5.924155.01713.300
n.a.n.a.n.a.n.a.n.a.n.a.n.a.n.a.
88199i080
11.205
7.274
1971-76
9.7079.8479.868
10.4639.317
14.8573.4503.2863.0389.025
10.94911.57311.0419.2198.0529.807
.5948.8379.638
10.0088.9029.8259.627
10.0837.5007.5845.9879.8729.951
14.1549.3078.8788.755
10.17011.0889.062
12.011.489
2.3011,289
10.87310.77510.39814.7506.3992.7239.9019.3649.0997.944
10.0308.1866.7839.1579.352
-11.0115.3276.739
15.1679.094
n.a.45.1729.7837.792
10.3548.8565.8309.660
11.6681.656n.a.n.a.n.a.n.a.n.a.n.a.
23.87942.083
n.a.n.a.
46.248n.a.n.a.n.a.n.a.n.a.n.a.n.a.n.a.
27.41819.95119.409
11.608
1976-81
11.02411.52311.675
15.69412.09110.78216.52416.30515.96911.69713.21013.32613.27313.07612.60611.06815.31211.75710.51713.51810.16011.08210.97011.6329.4698.665
12.3259.5718.037
4.28410.47611.04511.11315.51415.57419.59113.70414.64410.7709.962
15.51610.0009.940
10.55710.8814.606
13.27717.4208.6298.5298.5308.8831.741
13.15613.86428.00210.4519.2537.9129.311
-5.626249899.845
12.01214.18811.13010.0598.875
13.74615.414
n.a.n.a.n.a.n.a.n.a.n.a.
-4.338-1.409
n.a.n.a.n.a.n.a.n.a.n.a.n.a.n.a.n.a.n.a.n.a.
13.76716.63016.868
8.255
1946-81
7.1827.2987.357
9.2807.6076.5425.7656.2007.0376.5829.831
10.2479.6348.0678.2658.2334.8855.9837.252
10.3977.2179.0029.0019.0558.9685.5107.2727.3128.926
12.0668.4838.1477.9108.5678.5838.5698.5918.3279.3599.158
10.66210.70410.57112.3028.1138.6448.6406.9767.0197.9268.0425.408
n.a.8.7458.451
n.a.9.9109.002
n.a.3.081
n.a.201
8.91911.32411.49910.66911.1878.6069.7026.601
n.a.n.a.n.a.n.a.n.a.n.a.n.a.n.a.n.a.n.a.n.a.n.a.n.a.n.a.n.a.n.a.
-5.537n.a.n.a.
3.5159.557
11.633
8.179
Digitized for FRASER http://fraser.stlouisfed.org/ Federal Reserve Bank of St. Louis
January 1985

38 SURVEY OF CURRENT BUSINESS January 1985
Table 1.—National Income and Product Account—Continued
Line
123
45
6789
10111213
141516171819
2021
222324252627
28
Addenda (for acronyms, see notes below):GNP minus NRNNP minus NRNNI minus NR
GDCA minus NRNDCA minus NR
NDCANDCA at original costNDCA tangible, at original costNDCA, intangible, at original cost
GDCA— NR/GNP— NR percentNDCA— NR/NNP—NR, percentNDCA tangible at original cost/NNP — NR percentNDCA, intangible, at original cost/NNP— NR, percent
BEAGNPBEA NNPBEA NIBEAGPDIBEANPDI . . .BEA PCE
BEA GPDI/BEA GNP percentBEA NPDI/BEA NNP, percent
GNPCCACCA, tangibleCCA intangibleNNP.Business transfer payments + uncompensated factor services + net indirect
taxes + statistical discrepancy.NNI
Credits
Billions of dollars
1946
366.3273.1287.4
106.413.2
-62.012.311 123.4
29.04.8
-4.18.6
209.8195.8178.630.716.6
143.8
14.68.5
291.193.273.919.3
197.9-14.3
212.1
1956
698.8550.4535.3
255.9107.6
135.3106.258.847.4
36.619.510.78.6
421.7383.0349.471.032.3
266.0
16.88.4
726.5148.3109.938.4
578.215.2
563.0
1966
1,234.9991.8954.8
486.4243.3
255.3240.3118.0122.3
39.424.511.912.3
756.0695.3628.1125.765.0
465.1
16.69.4
1,246.8243.0164.678.5
1,003.837.1
966.7
1971
1,783.21,399.91,331.5
713.8330.5
318.4326.6122.9203.7
40.023.68.8
14.6
1,077.6981.1871.5166.469.9
672.2
15.47.1
1,771.2383.3253.7129.6
1,387.968.4
1,319.5
1976
2,818.82,176.72,082.6
1,112.0469.9
718.3465.7155.4310.3
39.421.67.1
14.3
1,718.01,543.01,379.2
257.982.8
1,084.3
15.05.4
3,067.2642.1420.8221.3
2,425.194.1
2,331.0
1981
4,713.83,578.43,433.2
1,831.6696.1
542.4687.5239.7447.9
38.919.56.7
12.5
2,954.12,624.62,373.0
474.9145.4
1,857.2
16.15.5
4,560.11,135.5
733.1402.3
3,424.7145.2
3,279.5
Average annual percent change
1946-56
6.6717.2586.416
9.17223.321
n.a.24.051
n.a.7.304
2.34514.975
n.a..043
7.2296.9386.9438.7666.8636.344
1.434-.070
9.5794.7584.0567.114
11.318n.a.
10.253
1956-66
5.8596.0655.957
6.6338.505
6.5548.5047.2149.933
.7312.3001.0833.647
6.0116.1466.0405.8747.2495.747
-.1291.040
5.5505.0634.1197.4105.6719.354
5.555
1966-71
7.6267.1356.879
7.9756.313
4.5216.329.808
10.750
.324-.767
-5.9063.374
7.3477.1296.7715.7751.4607.645
-1.465-5.292
7.2749.5419.038
10.5686.695
13.024
6.420
1971-76
9.5909.2309.358
9.2717.294
17.6677.3544.8098.780
-.291-1.772
4047-.412
9.7779.4799.6169.1543.455
10.033
-.568-5.502
11.60810.86710.64811.28911.8096.594
12.054
1976-81
10.83110.45310.514
10.4968.177
54638.1039.0537.614
-.303-2.061
1268-2.570
11.45011.20911.46412.99111.90711.364
1.383.628
8.25512.07711.74612.6977.1469.061
7.066
1946-81
7.5727.6277.344
8.47011.991
n.a.12.180
n.a.8.795
.8354.054
n.a.1.085
7.8497.6977.6718.1456.3917.583
.274-1.213
8.1797.4056.7779.0648.487
n.a.
8.138
NOTES.—BEA Bureau of Economic Analysis.CCA Capital consumption allowances.GDCA Gross domestic capital accumulation.GNP Gross national product.GPDI Gross private domestic investment.NDCA Net domestic capital accumulation.NI National income.NNI Net national income.NNP Net national product.NPDI Net private domestic investment.NR Net revaluations.PCE Personal consumption expenditures.
Digitized for FRASER http://fraser.stlouisfed.org/ Federal Reserve Bank of St. Louis
January 1985
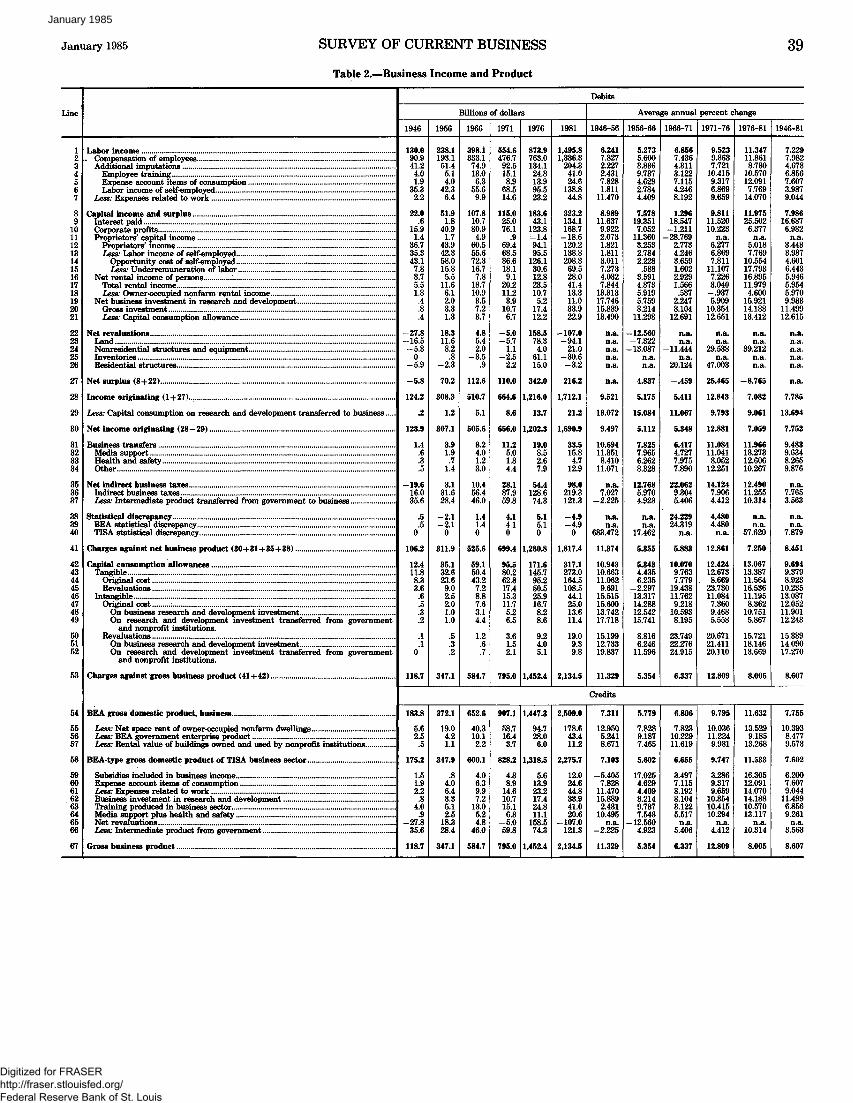
January 1985 SURVEY OF CURRENT BUSINESS
Table 2.—Business Income and Product
39
Line'
1234567
89
101112131415161718192021
2223242526
27
28
29
30
31323334
353637
383940
41
4243444546474849
505152
53
54
555657
58
5960616263646566
67
Labor income- Compensation of employees . .
Additional imputations .Employee trainingExpense account items of consumptionLabor income of self-employed
Less' Expenses related to work
Capital income and surplus
Proprietors' capital incomeProprietors' incomeLess' Labor income of self-employed
Opportunity cost of self-employed »Less' Underremuneration of labor
Net rental income of personsTotal rental incomeLess: Owner-occupied nonfarm rental income ,..
Net business investment in research and developmentGross investmentLess' Capital consumption allowance
Net revaluationsLandNonresidential structures and equipmentInventoriesResidential structures
Net surplus (8+22)
Income originating (1+27).
Less: Capital consumption on research and development transferred to business
Net income originating (28—29)
Business transfersMedia supportHealth and safetyOther
Net indirect business taxesIndirect bvpiness tew>8 , , , , , , , , , , , , „ , .Less' Intermediate product transferred from government to business
Statistical discrepancyBEA statistical discrepancy.TISA statistical discrepancy
Charges against net business product (30+31+35+38)
Capital consumption allowancesTangible
Original costRevaluations
IntangibleOriginal cost :
On hnsinpsH research and development- investmentOn research and development investment transferred from government
and nonprofit institutions.Revaluations
On business research and development investmentOn research and development investment transferred from government
and nonprofit institutions.
Charges against gross business product (41+42) ;
BEA gross domestic product business
Less: Net space rent of owner-occupied nonfarm dwellingsLess' BEA government enterprise productLess: Rental value of buildings owned and used by nonprofit institutions
BEA-type gross domestic product of TISA business sector
Subsidies included in business incomeExpense account items of consumptionLess' Expenses related to workBusiness investment in research and development ....Training produced hi business sector »Media support plus health and safety ;...Net revaluationsLess: Intermediate product from government ...
Gross business product
Debits
Billions of dollars
1946
130.090.941.24.01.9
35.32.2
22.0.6
15.91.4
36.735.343.17.83.75.51.8.4.8.4
-27.8165
-5.30
-5.9
-5.8
124.2
.2
123.9
1.4.6.3.5
-19.616.035.6
.5
.50
106.2
12.411.88.33.6
.6
.5
.3
.2
.1
.10
118.7
1956
238.1193.151.45.14.0
42.36.4
51.91.8
40.91.7
43.942.358.015.85.5
11.66.12.03.31.3
18.311.68.2.8
-2.3
70.2
308.3
1.2
307.1
3.91.9.7
1.4
3.131.628.4
-2.1-2.1
0
311.9
35.132.623.69.02.52.01.01.0
.5
.3
.2
347.1
1966
398.1333.1
74.913.06.3
55.69.9
107.810.780.94.9
60.555.672.316.77.8
18.710.93.57.23.7
4.85.42.0
-3.5.9
112.6
510.7
5.1
505.6
8.24.01.23.0
10.456.446.0
1.41.40
525.6
59.150.443.27.28.87.63.14.4
1.2.6.7
584.7
1971
554.6476.7
92.515.18.9
68.514.6
115.025.076.1
.969.468.586.618.19.1
20.211.23.9
10.76.7
-5.0-5.7
1.1-2.5
2.2
110.0
664.6
8.6
656.0
11.25.01.84.4
28.187.959.8
4.14.10
699.4
95.580.262.817.415.311.75.26.5
3.61.52.1
795.0
1976
873.9763.0134.124.813.995.523.2
183.643.1
123.8-1.494.195.5
126.130.612.823.510.75.2
17.412.2
158.578.34.0
61.115.0
342.0
1,216.0
13.7
1,202.3
19.08.52.67.9
54.4128.674.3
5.15.10
1,280.8
171.6145.795.250.525.916.78.28.6
9.24.05.1
1,452.4
1981
1,495.81,336.3
204.341.024.6
138.844.8
323.2134.1168.7
-18.6120.2138.8208.3
69.528.041.413.311.033.922.9
-107.0-94.1
21.0-30.6-3.2
216.2
1,712.1
21.2
1,690.9
33.515.84.7
12.9
98.0219.3121.3
-4.9-4.9
0
1,817.4
317.1273.0164.5108.544.125.013.611.4
19.09.39.8
2,134.5
Average annual percent change
1946-56
6.2417.8272.2272.4317.8281.811
11.470
8.98911.6379.9222.0731.8211.8113.0117.2734.0327.844
13.31317.74615.88913.490
n.a.n.a.n.a.n.a.n.a.
n.a.
9.521
18.072
9.497
10.69411.3518.410
11.071
n.a.7.0272225
n.a.n.a.
683.472
11.374
10.94310.66311.0629.691
15.51515.60013.74217.718
15.19912.73319.837
11.329
1956-66
5.2735.6003.8369.7374.6292.7844.409
7.57819.3517.052
11.3603.2532.7842.228
.5883.5914.8735.9195.7598.214
11.298
-12.5607322
-13.087n.a.n.a.
4.837
5.175
15.084
5.112
7.8257.9656.2628.328
12.7685.9704.923
n.a.n.a.
17.462
5.355
5.3434.4356.235
-2.29713.31714.28812.54215.741
8.8166.246
11.596
5.354
1966-71
6.8567.4364.3113.1227.1154.2468.192
1.29618.5471 211
-28.7692.7734.2463.6591.6022.9291.566.537
2.2478.104
12.691
n.a.n.a.
-11.444n.a.
20.124
-.459
5.411
11.067
5.348
6.4174.7277.9757.890
22.0629.3045.406
24.22924.319
n.a.
5.883
10.0709.7637.779
19.43811.7629.218
10.5938.195
23.74922.27624.915
6.337
1971-76
9.5239.8637.721
10.4159.3176.8699.659
9.81111.52010.223
n.a.6.2776.8697.811
11.1077.2263.040
-.9375.909
10.35412.651
n.a.n.a.
29.538n.a.
47.003
25.465
12.843
9.793
12.881
11.08411.0418.052
12.251
14.1247.9064.412
4.4804.480
n.a.
12.861
12.42412.6738.669
23.73011.0847.3609.4685.558
20.67121.41120.110
12.809
1976-81
11.34711.8618.780
10.57012.0917.769
14.070
11.97525.5026.377
n.a.5.0187.769
10.55417.79316.89511.9794.600
15.92114.18813.412
n.a.n.a.
39.212n.a.n.a.
-8.765
7.082
9.061
7.059
11.96613.27312.60610.267
12.49011.25510.314
n.a.n.a.
57.620
7.250
13.06713.38711.56416.53611.1958.362
10.7515.867
15.72118.14613.669
8.005
1946-81
7.2297.9824.6786.8567.6073.9879.044
7.98616.6876.982
n.a.3.4483.9874.6016.4435.9465.9545.9709.983
11.49912.615
n.a.n.a.n.a.n.a.n.a.
n.a.
7.785
13.694
7.752
9.4839.6348.2659.876
n.a.7.7653.563
n.a.n.a.
7.879
8.451
9.6949.3798.923
10.23513.08712.05211.90112.243
15.33914.09017.270
8.607
Credits
183.8
5.62.5.5
175.2
1.51.92.2.8
4.0.9
-27.835.6
118.7
372.1
19.04.21.1
347.9
.84.06.43.35.12.5
18.328.4
347.1
652.6
40.310.12.2
600.1
4.06.39.97.2
13.05.24.8
46.0
584.7
907.1
58.716.43.7
828.2
4.88.9
14.610.715.16.850
59.8
795.0
1,447.3
94.728.06.0
1,318.5
5.613.923.217.424.811.1
158.574.3
1,452.4
2,509.0
178.643.411.2
2,275.7
12.024.644.833.941.020.6
1070121.3
2,134.5
7.311
12.9505.2418.671
7.103
-5.4057.828
11.47015.8892.431
10.495n.a.
-2.225
11.329
5.779
7.8289.1877.465
5.602
17.0254.6294.4098.2149.7377.543
-12.5604.923
5.354
6.806
7.82310.22911.619
6.655
3.4977.1158.1928.1043.1225.517
n.a.5.406
6.337
9.795
10.03611.2249.981
9.747
3.2869.3179.659
10.35410.41510.294
n.a.4.412
12.809
11.632
13.5299.185
13.268
11.533
16.30512.09114.07014.18810.57013.117
n.a.10.314
8.005
7.755
10.3938.4779.573
7.602
6.2007.6079.044
11.4996.8569.261
n.a.3.563
8.607
Digitized for FRASER http://fraser.stlouisfed.org/ Federal Reserve Bank of St. Louis
January 1985

40 SURVEY OF CURRENT BUSINESS
Table 3.—Nonprofit Income and Product
January 1985
Line
1234
56789
101112
13141516
17
18
19
20212223
242526
27282930313233343536
37
38
39
40
Labor incomeCompensation of employeesEmployee training ,-,,,,,,,,,,,, ,,,,, ,—, ,,,,,,r--r,-,--Less' ExDenses related to work
Capital incomeInterest paidNet imputed interest .... .
Gross imputed interestLandStructures and equipmentResidential .
Less' Interest Daid
Net revaluationsLand . ..Structures and equipmentResidential structures
Income originating (1+5+13)
Imputed value of volunteer services
Charges against net nonprofit product (17+18)
Capital consumption allowancesOriginal costRevaluations
Charges against gross nonprofit product (19+20)
ConsumptionConsumption in BEA personal consumption expendituresAdditional imputed consumption
Capital accumulationResearch and developmentEducation and training
Investment in BEA personal consumption expendituresAdditional imputed investment .Employee training
Health ,Investment in BEA personal consumption expendituresAdditional imputed investment
Net revaluations
Less! Intermediate product transferred from government
Less: Intermediate product purchased
Less: Expenses related to work. .
Gross nonprofit product
Debits
Billions of dollars
1946
2.42.4.1.1
.4
.1
.4
.4
.1
.2
.1
.1
.1-.2
.4-.3
2.7
2.1
4.8
.4
.2
.25.2
1956
6.36.5.1.3
1.1.1
1.01.1.3.6.2.1
1.3.9.4
0
8.7
4.2
12.9
1.0.6.4
13.8
1966
16.717.1
.4
.8
3.2.4
2.83.2.8
1.9.5.4
1.1.6
-.1.6
21.0
6.8
27.8
1.81.4.4
29.6
1971
30.130.8
.51.3
3.5.8
2.73.5
.72.3.5.8
1 1-1.5
.40
32.4
10.3
42.7
2.91.91.0
45.6
1976
49.050.3
.92.2
4.31.33.04.3
.83.0.5
1.3
230
-2.7.5
51.0
15.0
66.0
4.72.52.2
70.8
1981
86.289.21.34.3
6.32.63.66.31.14.6
.72.6
-5.4-1.2-3.5-.7
87.1
18.0
105.1
8.23.64.6
113.3
Average annual percent change
1946-56
10.24210.6862.302
15.827
10.1404.879
10.83610.14010.72512.6515.0674.879
n.a.n.a.
-1.445n.a.
12.468
6.908
10.314
9.1439.6148.505
10.228
1956-66
10.25010.11213.3328.662
11.38814.12311.08911.38812.34812.1117.735
14.123
-2.048-4.591
n.a.46.426
9.193
5.102
8.018
6.5529.421
.6217.922
1966-71
12.41412.4636.728
10.848
1.95418.304
-1.0711.954
-2.5194.287
-.74718.304
n.a.n.a.n.a.n.a.
9.108
8.431
8.943
10.0916.617
19.2469.015
1971-76
10.26610.2889.901
10.634
4.2669.1822.5364.2661.3365.5421.9179.182
n.a.n.a.n.a.n.a.
9.463
7.973
9.112
10.2025.754
17.0619.183
1976-81
11.97412.1488.718
14.656
7.88515.5703.8357.8856.4458.5725.749
15.570
n.a.n.a.n.a.n.a.
11.299
3.674
9.741
11.5677.236
15.7999.868
1946-81
10.80210.9248.003
12.120
8.11111.4706.9148.1117.2029.6534.607
11.470
n.a.n.a.n.a.n.a.
10.446
6.288
9.205
9.0228.2299.8229.191
Credits
5.12.92.2
2.802.01.2.7.1.8.5.3
-.1
.8
1.8
.1
5.2
9.95.94.0
7.7.1
4.32.81.4.1
2.01.4.6
1.3
.8
2.6
.3
13.8
18.911.47.6
15.8.4
9.36.22.7
.45.03.71.31.1
1.9
2.4
.8
29.6
30.019.710.3
23.4.6
14.210.13.6.5
9.77.81.91 1
2.9
3.6
1.3
45.6
47.934.014.0
38.1.9
21.716.14.7
.917.915.32.623
3.1
10.0
2.2
70.8
81.063.217.8
65.81.5
34.026.85.91.3
35.732.03.7
-5.4
6.2
23.0
4.3
113.3
6.8577.4016.099
10.82210.4907.8218.8906.4942.3029.512
11.3026.276
n.a.
.405
3.930
15.827
10.228
6.7376.7846.668
7.45812.9738.1118.4306.868
13.3329.688
10.3308.0392048
8.932
-.597
8.662
7.922
9.66011.5896.474
8.1357.8848.869
10.0856.1536.728
13.92315.8097.649
n.a.
9.103
7.784
10.848
9.015
9.80711.5416.168
10.2888.8568.7749.8805.2379.901
13.10114.5036.378
n.a.
1.285
22.988
10.634
9.183
11.06813.2184.993
11.51511.1319.463
10.7084.8298.718
14.79015.7977.849
n.a.
14.658
18.107
14.656
9.868
8.2339.2166.166
9.48810.6718.4239.3276.1328.003
11.43812.7447.212
n.a.
6.121
7.610
12.120
9.191
Table 4.—Government Enterprise Income and Product
Line
1234
5
678
9
10
11
12
1314
151617
18
19
20
21
Labor incomeCompensation of employeesEmployee trainingLess' Expenses related to work
Capital income
SurplusesBEA surplusSum of absolute values of negative surpluses
Net revaluations
Net surplus (6+9)
Charges against government enterprise product (1+5 + 10) .
Sales minus purchases of intermediate goods
TransfersCapital income + negative surplus + intermediate product from govern-
ment—indirect taxesConsumptionInvestment
Employee training ..,.,,,,, ,
Net revaluations...
Less: Intermediate product from government
Less: Expenses related to work . ..
Gross government enterprise product
Debits
Billions of dollars
1946
1.91.900
0
1.2.6.6
.3
1.5
3.4
1956
4.04.1.1.1
.3
2.0.1
1.9
.2
2.2
6.5
1966
8.58.5
.2
.3
.3
3.81.52.3
-.3
3.5
12.2
2.5
1.7
1.61.1.5
0
.3
1.0
0
3.4
4.2
2.8
2.71.71.0.1
.2
.6
.1
6.5
10.1
3.8
3.62.21.4.2
3
1.1
.3
12.2
1971
14.014.0
.3
.4
.1
5.32.33.0
.2
5.5
19.6
16.4
5.1
4.82.91.9.3
.2
1.8
.4
19.6
1976
23.223.1
.6
.6
.1
7.84.83.0
-.3
7.6
30.8
28.0
5.5
4.93.01.9.6
-.3
1.9
.6
30.8
1981
37.437.51.01.0
.2
12.15.86.3
0
12.1
49.8
43.4
10.9
9.96.03.91.0
0
3.5
1.0
49.8
Average annual percent change
1946-56
7.7937.8968.354
11.858
22.944
5.210-16.268
12.155
3469
4.019
6.610
Credits
5.241
5.550
5.4734.3377.7968.354
-3.469
-4.823
11.858
6.610
1956-66
7.7697.6729.6716.122
-.259
6.56131.025
1.750
n.a.
4.688
6.543
1966-71
10.57510.5828.8089.301
11.931
6.6988.7095.256
n.a.
9.386
9.916
1971-76
10.60910.46613.8558.336
15.317
8.21615.619
.483
n.a.
6.632
9.433
1976-81
10.09510.1639.653
12.246
32.044
9.0023.647
15.826
n.a.
9.820
10.090
1946-81
8.9078.8999.7539.378
5.768
6.7726.6376.900
-5.537
6.154
7.952
9.187
2.942
2.6502.2033.3769.671
n.a
6.287
6.122
6.542
10.229
6.219
6.0515.8666.3318.808
n.a
9.912
9.301
9.916
11.224
1.552
.434
.594
.19413.855
n.a
1.258
8.336
9.433
9.185
14.517
15.09515.31114.7639.653
n.a
13.413
12.246
10.090
8.477
5.538
5.3164.8856.1479.753
-5.537
3.724
9.378
7.952
Digitized for FRASER http://fraser.stlouisfed.org/ Federal Reserve Bank of St. Louis
January 1985

January 1985 SURVEY OF CURRENT BUSINESS
Table 5.—Government Income and Product
41
Line
1234
56789
10111213
14151617
18
192021
22
232425
26
27
282930313233343536373839
4041424344
45
46
47
48
49
50
51
Labor incomeCompensation of employees.Employee trainingLess: Expenses related to work
Capital incomeInterest paidNet imputed interest
Gross imputed interestLandStructures and equipmentInventoriesResearch and development
Less' Interest paid
Net revaluationsLandStructures and equipmentInventories
Income originating (1+5+14)
Uncompensated factor servicesDrafteesJurors
Charges against net government product (18+19)
Capital consumption allowancesOriginal costReval uati on s
Charges against gross government product (22+23)
Consumption (to households)
Capital accumulationTO business (research and development)To households
Education and trainingPublic schoolsRrnployee training
NonmilitarvHealth
To governmentResearch and developmentNatural resources
Intermediate productTo businessTo nonprofitTo government enterpriseTo households
Gross credits exclusive of change in inventories and net revaluations
Change in inventories
Less: Intermediate purchases from other sectors
Less: Expenses related to work
Gross government product exclusive of net revaluations
Net revaluations
Gross government product . .
Debits
Billions of dollars
1946
25.720.85.4.5
7.94.13.87.9.3
5.71.8.1
4.1
-25.5-3.2
-11.7-10.7
8.1
1.31.30
9.4
32.326.06.3
41.6
1956
42.336.67.21.5
13.25.28.0
13.21.88.92.2.3
5.2
10.04.07.7
-1.7
65.4
6.16.0.1
71.6
16.611.94.6
88.1
1966
85.576.511.72.7
30.88.5
22.330.86.1
20.82.71.28.5
5.05.8.1
-.9
121.3
10.210.1
.2
131.5
22.117.44.7
153.6
1971
137.9126.016.14.2
32.612.420.232.65.6
23.32.31.4
12.4
7.5-2.010.6
-1.1
177.9
14.714.3
.4
192.6
33.122910.2
225.7
1976
208.4194.620.26.4
43.523.120.443.58.4
31.12.31.7
23.1
21.828.4
-4.3-2.3
273.7
.60.6
274.3
52.130.222.0
326.4
1981
318.2299.330.311.4
69.453.915.569.414.249.13.82.2
53.9
24.7-29.4
51.42.7
412.3
.70
.7
412.9
91.343.248.1
504.3
Average annual percent change
1946-56
5.1215.8162.987
11.768
5.2602.3347.7675.260
17.7434.6292.090
13.2532.334
n.a.n.a.n.a.n.a.
23.313
16.64916.74612.562
22.554
-6.452-7.494-2.973
7.791
1956-66
7.2977.6594.9736.080
8.8645.130
10.7728.864
13.0178.8112.156
16.8045.130
-6.6673.779
-35.360n.a.
6.364
5.2535.2614.824
6.272
2.9313.854.133
5.713
1966-71
10.02210.4836.5309.004
1.1737.885
-1.9391.173
-1.4112.281
-3.2693.0357.885
8.226n.a.
155.017n.a.
7.963
7.4787.304
15.546
7.926
8.4095.643
16.781
7.996
1971-76
8.6209.0844.6828.657
5.93313.245
.1735.9338.2775.940.271
4.17513.245
23.894n.a.n.a.n.a.
8.996
-47.991n.a.
7.867
7.323
9.5125.641
16.643
7.655
1976-81
8.8268.9868.446
12.294
9.78818.426
-5.3279.788
11.0779.581
10.6035.627
18.426
2.599n.a.n.a.n.a.
8.539
3.338n.a.
3.338
8.529
11.8657.466
16.960
9.090
1946-81
7.4587.9175.0679.351
6.4137.6444.1056.413
11.1796.3532.229
10.2827.644
n.a.n.a.n.a.n.a.
11.902
-1.958n.a.
8.700
11.424
3.0181.4626.002
7.387
Credits
7.9
16.2.6
12.911.86.45.44.9
.41.12.8
.22.5
56.535.6
.81.0
19.1
80.6
-10.2
2.8
.5
67.1
-25.5
41.6
9.5
31.03.9
23.321.013.87.26.4.8
2.33.91.12.8
51.728.4
.8
.621.8
92.2
1.0
13.5
1.5
78.1
10.0
88.1
27.8
77.910.957.552.440.711.79.72.05.19.53.36.2
86.046.01.91.1
37.0
191.6
-3.6
36.7
2.7
148.6
5.0
153.6
45.2
121.611.198.589.173.116.113.13.09.4
12.04.47.6
114.759.82.91.8
50.2
281.5
-1.3
57.7
4.2
218.3
7.5
225.7
79.7
191.114.7
158.7142.0121.820.214.85.4
16.717.85.9
11.9
140.874.33.11.9
61.5
411.7
.5
101.2
6.4
304.6
21.8
326.4
129.5
314.924.9
255.1225.2194.930.321.98.4
30.034.98.2
26.7
233.6121.3
6.23.5
102.5
678.0
.4
187.5
11.4
479.5
24.7
504.3
1.903
6.71221.1096.1015.9898.0272.9872.6456.3467.2183.480
16.727.896
-.892-2.225
.406-4.824
1.322
1.356
n.a.
17.173
11.768
1.532
n.a.
7.791
11.332
9.64210.9339.4549.554
11.3944.9734.2539.6078.4829.401
11.3308.511
5.2234.9238.9326.2885.416
7.592
n.a.
10.504
6.080
6.641
-6.667
5.713
10.229
9.317.267
11.38411.22512.4416.5306.0798.648
12.9684.7825.9144.161
5.9445.4069.1039.9116.305
7.997
n.a.
9.514
9.004
7.988
8.226
7.996
12.030
9.4625.8359.9979.761
10.7604.6822.532
12.45212.1468.1205.8199.364
4.1814.4121.2851.2584.161
7.895
n.a.
11.883
8.657
6.896
23.894
7.655
10.191
10.50311.1699.9659.6579.8538.4468.1569.228
12.46014.4157.060
17.420
10.65210.31414.65813.41310.751
10.494
-5.626
13.127
12.294
9.498
2.599
9.090
8.335
8.84711.4028.9068.802
10.2595.0674.3488.8739.8287.520
10.6156.976
4.1383.5636.1213.7244.914
6.275
n.a.
12.802
9.351
5.779
n.a.
7.387
Digitized for FRASER http://fraser.stlouisfed.org/ Federal Reserve Bank of St. Louis
January 1985

42 SURVEY OF CURRENT BUSINESS January 1985
Table 7.—Constant-Dollar National Income and Product Account
Line
123456789
1011121314151617181920212223242526272829
303132333435363738394041424344454647484950515253545556575859606162636465666768697071727374757677787980818283848586878889
90919293949596
97
Consumption .Household expenditures for services and nondurables
Gross expenditures included from BEA personal consumption expenditures ....Less: Personal consumption expenditures related to work
Expense account items of consumptionBEA imputations other than housingSubsidies allocated to consumption ...
Subsidies included in business incomeLess: Amount allocated to investment
TransfersFrom business ,,,„,,,,,„ , ,„ ,
Media supportTotal media supportLess: Media support allocated to investment
Health and safetyFrom nonprofit institutionsFrom government enterprisesFrom government
Nonmarket services produced in householdsNet space rent of owner-occupied nonfarm dwellingsOther capital services .
DurablesTotal durables . .Less' Durables allocated to investmentLess: Services of durables to expenses related to work
SemidurablesInventories
Labor servicesLess: Labor services allocated to investment
Gross domestic capital accumulationOriginal cost..
TangibleStructures and equipment and household durables and semidurables ,
BusinessNonresidential
Structures .. . :...Equipment
Residential other than owner-occupied nonfarm dwellingsNonprofit institutions
Structures.Equipment
Government enterprises .StructuresEquipment
GovernmentStructuresEquipment ,Product accumulated
HouseholdsOwner-occupied nonfarm dwellingsDurablesSemidurables
Fixed gross private domestic product reconciliationNIPA fixed gross private domestic productLess' Corresponding sector totals
Government capital accumulation reconciliationNIPA government investmentLess' Government and government enterprise totals
Change in inventoriesBusinessGovernmentHouseholds
IntangibleResearch and development
Business . ...Nonprofit institutionsGovernment
Education and trainingHealth . .
Subsidies and government enterprise transfers allocated to investmentNet revaluations
LandBusinessNonprofitGovernment and government enterprisesHouseholds
Structures and equipment . . .BusinessNonprofit institutionsGovernmentHouseholds (owner-occupied dwellings)
Household durables and semidurablesDurablesSemidurables
InventoriesBusiness (including nonprofit)Government enterprisesGovernmentHouseholds
Net exportsNet BEA exports
ExportsImports
Terms of trade effectNet exports in current dollars deflatedLess: Net exports in constant dollars without terms of trade effect
Gross national product
Credits
Billions of 1972 dollars
1946
667.6194.6199.5
4.93.9
10.82.63.61.0
96.81.3.9
1.3.5.4
17.22.4
75.8359.011.347.614.117.2
.82.3
33.4.1
339.139.0
77.9258.1135.1137.550.948.319.029.32.61.11.1.1
1.91.8.1
21.84.46.3
11.171.713.325.433.0
-6.758.765.4
-3.39.2
12.6-2.412.2
-14.8.3
123.04.51.7.1
2.799.419.12.1
-182.2-52.7
401-.5
-7.6-4.5699272
.3282
-14.8336
-23.5102
-26.00
.7258-.8
17.913.227.314.04.6
17.913.2
763.4
1956
765.6249.3255.2
6.05.69.2
.91.4.5
70.12.72.02.8.8.7
18.22.8
46.4430.526.376.838.646.41.56.3
38.0.2
381.954.5
439.0396.6243.2236.062.257.823.134.74.43.63.4.3
5.85.5.3
38.615.915.77.0
112.426.048.837.65.0
96.891.88.3
45.737.47.35.81.3.2
153.415.05.2.2
9.6114.923.41.9
40.531.616.91.35.97.5
13.88.6
.611.2
-6.6-3.8-1.6-2.1-1.2
1.2.3
-2.5-.1
8.410.135.325.2178.4
10.1
1,212.9
1966
993.6340.3350.310.07.8
10.63.35.42.1
102.84.73.85.01.2.9
26.62.7
68.7528.848.9
109.157.766.92.36.9
51.0.3
465.794.8
654.5634.9360.1347.2101.092.931.961.08.17.26.6.6
8.17.6
.453.527.716.29.6
157.827.878.451.610.2
146.2136.0
9.561.451.912.816.8
-4.3.3
274.830.49.4.5
20.5208.236.13.9
15.721.57.1
.87.76.0
10.03.8.7.1
5.4-9.6-7.6
20-6.2-4.6-.4
-1.20
8.56.5
54.447.92.08.56.5
1,656.6
1971
1,110.2394.7407.813.09.1
14.32.94.81.9
111.14.94.05.21.2.9
31.83.0
71.5578.061.0
136.878.389.83.28.3
58.2.3
520.9140.7
729.6738.2388.8382.0106.095.731.963.710.45.95.4.5
9.08.3
.746.924.214.87.9
194.940.198.256.713.8
165.8152.0
5.453.448.06.88.1
-1.4.1
349.428.211.1
.616.5
276.245.03.9
-12.5-10.4
60-1.5-2.1-.722.93.4
.411.08.0
214-19.6
18-3.7-2.6
.21 1-.1
4.31.6
71.069.32.74.31.6
1,844.1
1976
1,249.1443.2459.015.810.820.02.74.51.8
117.56.05.06.41.41.0
35.22.2
74.0655.078.0
169.7100.4113.7
4.48.8
68.9.3
571.0163.7
1,012.6831.0437.8429.2119.8112.031.180.97.84.74.0
.79.18.3.8
44.918.518.08.3
234.539.0
126.669.013.3
176.7163.4
2.848.545.78.67.8
.4
.4393.229.013.2
.715.1
310.453.93.2
178.598.756.30
20.422.145.913.7
-1.6-3.137.0
-8.1-6.0-2.141.943.9-.2
-1.7-.1
10.425.4
110.184.7
-15.010.425.4
2,272.2
1981
1,430.0500.1519.519.413.323.04.16.92.7
125.77.56.48.11.71.1
35.83.1
79.4763.9102.3215.3127.3141.5
6.08.2
87.7.4
609.7163.4
866.8936.1521.5512.8166.3156.744.7
112.09.65.24.01.29.98.81.2
48.714.320.813.6
264.534.9
141.288.412.7
219.1206.4
5.550.545.08.78.5
.2
.1414.634.017.3
.816.0
318.062.54.6
-73.9-68.4
452-.6
-14.1-8.524.68.5
-2.024.7
-6.6-16.8-12.3-4.5
-13.3-14.7
.01.3.1
13.543.0
159.7116.729613.543.0
2,310.4
Average annual percent change
1946-56
1.3792.5092.4941.8873.789
-1.6129732
-8.915-7.075-3.178
7.5648.8027.6635.2314.525.556
1.270-4.786
1.8328.8254.903
10.62710.4376.048
10.5541.2974.4781.1963.418
18.8744.3916.0565.5512.0161.8041.9461.7105.336
12.29611.89618.36911.91011.97610.7405.883
13.7819.549
-4.4864.5956.8946.7551.319
n.a.5.1253.447
n.a.17.35011.529
n.a.-7.123
n.a.-3.064
2.23512.73811.8106.599
13.4531.4672.077
-1.227n.a.n.a.n.a.n.a.n.a.n.a.n.a.n.a.
6.817n.a.n.a.n.a.n.a.n.a.n.a.n.a.
8232n.a.n.a.
7.261-2.665
2.6106.012
n.a.-7.261-2.665
4.739
1956-66
2.6423.1613.2165.3273.3431.512
13.52314.40415.9443.9045.9116.7546.1374.3852.8633.845
-.0674.0012.0796.3983.5634.0893.7214.566.916
2.9935.0532.0045.688
4.0764.8184.0013.9394.9684.8703.3025.8076.1737.0527.0137.4803.3963.3534.1623.3015.694.312
3.1493.455
.6974.8573.2117.3144.2084.0111.3373.0043.3445.849
11.209n.a.
4.9106.0067.3156.061
10.7297.8726.1254.4327.844
-9.052-3.774-8.316-5.615
2.6662186
-3.217-7.883
1.142-36.053
n.a.n.a.n.a.n.a.n.a.n.a.n.a.n.a.n.a.
.089-4.351
4.4266.645
n.a..089
-4.351
3.167
1966-71
2.2443.0133.0865.4263.2546.0802626
-2.324-1.862
1.581.909.741.639.309
1.6463.6281.679.787
1.7934.5114.6396.2926.0857.3733.8292.666.029
2.2668.216
2.1963.0621.5471.927.980.584.023.872
5.146-3.830
3831-3.815
2.1361.6719.094
-2.568-2.650-1.749
37644.3167.5614.6071.8996.2602.5502.249
-10.7252771
-1.567-11.981-13.662
n.a.-20.903
4.921-1.490
3.3733.163
-4.2265.8104.483
-.081n.a.n.a.n.a.n.a.n.a.n.a.
18.089-1.94210091
143.7218.281
n.a.n.a.n.a.n.a.n.a.n.a.n.a.n.a.
-12.80924 2355.4607.6665.699
12809-24.235
2.167
1971-76
2.3872.3422.3953.9463.4216.978
-1.4261433
-1.4441.1114.1234.8134.3112.592.963
2.0695615.699
2.5335.0594.4035.1174.8166.2491.1583.446
-1.9621.8533.080
6.7762.3962.4022.3572.4663.194
5344.877
-5.488-4.700-6.063
6.588.356.043
3.875-.883
-5.2054.0221.0143.769
-.5515.2054.021
6671.2841.453
-12.135-1.886-.9714.830
-.733n.a.
34.1832.389.521
3.4932.087
-1.7562.3613.656
-4.036n.a.n.a.n.a.n.a.n.a.n.a.
14.93531.825
n.a.n.a.
35.689n.a.n.a.n.a.n.a.n.a.n.a.n.a.n.a.
19.49773.5409.1764.071
n.a.19.49773.540
4.264
1976-81
2.7422.4462.5074.1834.1742.8119.0288.8988.7021.3584.3944.8394.7754.5381.984.323
6.5881.4033.1245.5714.8794.8524.4766.367
-1.4234.9272.7061.320
-.037
-3.0612.4123.5633.6236.7816.9557.5096.7394.1502.380.340
11.7501.6711.0876.9171.634
-5.0562.854
10.3442.430
-2.1932.2095.07710504.3864.783
14.397.806
-.315.352
1.805-14.634
316271.0663.2755.6152.7901.071.488
3.0357.556
n.a.n.a.n.a.n.a.n.a.n.a.
11722-9.019
n.a.n.a.n.a.n.a.n.a.n.a.n.a.n.a.n.a.n.a.n.a.
5.26511.1127.7356.634
n.a.5.265
11.112
.334
1946-81
2.2002.7342.7723.9883.5872.1911.3571.8702.887.749
5.1745.8975.3083.7972.7592.106.667.130
2.1816.5014.4066.4946.2075.8843.6902.7962.8011.6904.182
7.1273.7503.9353.8333.4383.4202.4703.9083.7574.4473.8169.2234.8734.6787.0602.3213.4403.467.578
3.8002.7875.0252.857
n.a.3.8323.338
n.a.4.9783.714
n.a.-1.019
n.a.40173.5345.9326.8396.0465.1843.3803.4512.271
n.a.n.a.n.a.n.a.n.a.n.a.n.a.n.a.n.a.n.a.n.a.n.a.n.a.n.a.n.a.n.a.
-9.801n.a.n.a.
-.8063.4305.1816.236
n.a.-.8063.430
3.215
Digitized for FRASER http://fraser.stlouisfed.org/ Federal Reserve Bank of St. Louis
January 1985

January 1985 SURVEY OF CURRENT BUSINESS 43
Table 6.—Household Income and Product
Line
1234567
89
1011121314151617181920212223242526
27282930313233
34
35
36
37383940414243
44
4546474849505152535455565758596061
62636465666768697071
72
73
74
75
L&bor incomeCompensation of employeesImputations
Employee trainingOpportunity costs of studentsUnpaid household work
Less: Expenses related to work
Capital incomeOwner-occupied housing
Interest paidNet imputed interest . .
Gross imputed interestLandOwner-occupied dwellings
Less' Interest paidNet rental income
Rental income on nonfarm own-occupied dwellings and landLess' Net imputed interest . . .
Consumer goodsConsumer interestNet imputed interest
Gross imputed interest 1 .DurablesSemidurablesInventories
Less: Consumer interest
Net revaluationsLand .Owner-occupied dwellingsConsumer goods ... .
DurablesSemidurablesInventories
Income originating (1+8+27)
Less: Intangible (human) capital consumption
Net income originating and charges against net household product (34—35)
Capital consumption allowancesTangible (nonhuman)
Original costRevaluations . . . . . .
Intangible (human)Original costReval u ations
Charges against gross household product (36+37)
ConsumptionMarket (labor services in households)Nonmarket
Net space rent on owner-occupied nonfarm dwellingsBEA net space rent on owner-occupied nonfarm dwellingsSubsidies..*. .*.
Capital services other than on owner-occupied dwellingsDurables
GrossLess: Services allocated to investmentLess: Services to expenses related to work
SemidurablesInventories
Labor servicesTotal imputed labor servicesLess: Labor services allocated to investment
Intermediate product of government to consumption
Capital accumulationIntangible at original cost
EducationTe»ehing children in home T . T T t T I t T t l t I t
Opportunity cost of studentsDurable services allocated to educationIntermediate product of government to education
HealthEmployee training , ,,,.,,,,,
Net revaluations
Services to expenses related to work
Less: Intermediate product transferred from government
Less: Expenses related to work
Gross household product
Debits
Billions of dollars
1946
109.02.1
107.0
1L695.3
.1
5.12.71.01.62.6
.42.21.0.1
1.81.62.4
.71.72.41.5.8.1.7
-22.219
-6.1142
-9.742-.3
91.9
18.6
73.3
48.029.424.05.4
18.615.23.4
121.3
1956
192.43.3
189.5.1
25.4164.1
.4
17.610.34.25.69.91.58.44.2.5
6.15.67.35.12.27.35.71.4.1
5.1
-2.15.1
-4.527
-1.115-.1
208.0
35.5
172.5
95.359.856.13.6
35.521.713.8
267.8
1966
332.44.0
328.9.1
60.9267.9
.5
36.822.912.010.022.04.8
17.212.0
.910.910.013.912.02.0
13.911.12.6.3
12.0
1.44.64.1
-7.3-5.8-1.5
0
370.7
68.3
302.3
158.790.388.32.1
68.341.926.4
461.0
1971
504.24.6
500.2.1
116.9383.3
.6
48.129.918.710.028.66.2
22.518.71.2
11.210.018.317.7
.518.314.93.1
.317.7
-13.67
7.7206
-18.817-.1
538.7
111.9
426.8
249.3137.4125.511.9
111.966.845.1
676.1
1976
805.65.4
801.0.1
188.6612.3
.7
71.847.336.67.8
44.49.9
34.536.62.9
10.77.8
24.526.7
-2.224.520.33.8
.426.7
70.830.751.5115
-8.429-.2
948.2
191.1
757.1
409.3218.2184.134.1
191.1106.8
84.3
1,166.4
1981
1,271.17.0
1,265.0.1
284.2980.7
1.0
143.1100.5
87.24.1
91.221.170.187.29.3
13.34.1
42.654.3
-11.642.635.76.1
.854.3
-66.0-17.6-13.7
347-25.5-9.4
.2
1,348.1
351.1
997.0
711.7360.6282.9
77.7351.1176.8174.3
1,708.7
Average annual percent change
1946-56
5.8464.4165.882
-3.6248.1035.585
13.186
13.17714.26915.83113.33614.33315.22914.18115.83113.04113.31313.33611.79921.4862.774
11.79914.0356.0457.456
21.486
n.a.n.a.n.a.n.a.n.a.n.a.n.a.
8.506
6.664
8.932
7.1017.3708.88638526.6643.599
15.064
8.240
1956-66
5.6192.1015.6685.2039.1505.0253.426
7.6528.271
11.0265.9138.371
12.4447.481
11.0265.9895.9195.9136.7128.92110886.7126.7986.3067.0988.921
n.a.1 125
n.a.n.a.n.a.n.a.n.a.
5.948
6.760
5.774
5.2284.2134.62855006.7606.7996.699
5.582
1966-71
8.6882.5128.748
-2.72513.9347.4233.833
5.4955.4429.207
-.1135.3755.0625.4629.2077.106
.537-.1135.5818.196
233465.5816.0383.7123.6778.196
n.a.n.a.
13.300n.a.n.a.n.a.n.a.
7.764
10.359
7.141
9.4598.7587.299
41.93510.3599.776
11.259
7.961
1971-76
9.8263.3189.8722.802
10.0449.8213.568
8.3419.641
14.423-4.884
9.1609.9968.927
14.42319.133-.937
-4.8846.0708.503
n.a.6.0706.4094.3735.9868.503
n.a.n.a.
46.248n.a.n.a.n.a.n.a.
11.973
11.302
12.146
10.4219.6847.957
23.41311.3029.844
13.330
11.522
1976-81
9.5485.6149.5712.4578.5449.8817.608
14.78716.26918.923
-12.14315.48916.35915.23518.92326.1924.600
-12.14311.69115.252
n.a.11.69112.0009.901
12.32215.252
n.a.n.a.n.a.n.a.n.a.n.a.n.a.
7.291
12.938
5.659
11.70010.5688.973
17.89112.93810.60515.643
7.935
1946-81
7.2693.4897.312
.7449.5596.8886.809
9.99010.85713.7082.672
10.71812.33510.35913.70812.7155.9702.6728.589
13.113n.a.
8.5899.3916.0837.272
13.113
n.a.n.a.n.a.n.a.n.a.n.a.n.a.
7.974
8.750
7.743
8.0097.4297.3077.9188.7507.254
11.907
7.851
Credits
143.12.1
125.55.65.60
29.010.311.6
.4
.918.7
.190.9
107.016.115.5
-3.518.717.53.5
11.6.3
2.01.2.1
-22.2
.9
19.1
.1
121.3
250.73.3
232.819.019.00
57.330.536.11.14.5
26.7.1
156.6189.5
33.014.6
34.736.834.86.1
25.4.8
2.61.9.1
-2.1
4.5
21.8
.4
267.8
410.04.0
385.940.340.30
90.050.358.01.95.8
39.5.3
255.5328.9
73.420.1
82.781.378.010.060.91.35.73.2.1
1.4
5.8
37.0
.5
461.0
583.54.6
557.258.958.7
.2133.7
77.588.93.28.2
55.9.3
364.6500.2135.6
21.8
135.1148.8143.815.1
116.92.29.64.9.1
-13.6
8.2
50.2
.6
676.1
910.65.4
882.894.994.7
.2204.8123.9140.8
5.111.880.5
.4583.0801.0218.0
22.5
306.2235.4227.4
23.3188.6
3.511.97.9.1
70.8
11.8
61.5
.7
1,166.4
1,511.17.0
1,455.4178.9178.6
.2332.3209.5237.0
8.918.6
122.0.8
944.31,265.0
320.848.7
282.5348.6335.5
26.8284.2
6.318.213.0
.1-66.0
18.6
102.5
1.0
1,708.7
5.7684.4166.371
12.95012.950
n.a.7.045
11.50312.0029.670
17.2023.6307.4565.5855.8827.434
-.538
n.a.6.9947.1405.6258.103
11.2612.4305.217
-4.075n.a.
17.202
1.322
13.186
8.240
5.0412.1015.1837.8287.828
n.a.4.6265.1334.8646.0172.5104.0047.0985.0215.6688.3313.218
9.0618.2518.4015.1129.1505.8648.2385.2875.191
n.a.
2.510
5.416
3.426
5.582
7.3152.5127.6277.8877.823
n.a.8.2339.0518.938
10.4317.3967.1853.6777.3698.748
13.0751.598
10.32012.84513.0258.541
13.93410.82710.8658.531
-2.867n.a.
7.396
6.305
3.833
7.961
9.3083.3189.638
10.00810.036
-1.4118.9029.8259.627
10.0837.5007.5845.9869.8439.8729.951
.670
17.7739.6189.6009.096
10.0449.8494.419
10.2542.488
n.a.
7.500
4.161
3.568
11.522
10.6615.614
10.51713.51813.5296.469
10.16011.08210.97011.6329.4698.665
12.32210.123
9.5718.037
16.698
1.5988.1638.0842.8168.544
12.1788.753
10.3912.493
n.a.
9.469
10.751
7.608
7.935
6.9663.4897.252
10.39710.393
n.a.7.2179.0029.0019.0558.9685.5107.2726.9167.3128.9263.333
n.a.8.7158.8115.9719.5599.5596.4367.145
.546n.a.
8.968
4.914
6.809
7.851
Digitized for FRASER http://fraser.stlouisfed.org/ Federal Reserve Bank of St. Louis
January 1985

44 SURVEY OF CURRENT BUSINESS January 1985
Table 7.—Constant-Dollar National Income and Product Account—Continued
Line
123
45
6789
10111213
141516171819
2021
222324252627
28
Addenda (for acronyms, see notes below):GNP minus NRNNP minus NRNNT minus NR
GDCA minus NRNDCA minus NR . .
NDCANDCA at original costNDCA tangible original costNDCA, intangible, at original cost
GDCA— NR/GNP— NR, percentNDCA— NR/NNP— NR percentNDCA, tangible, at original cost/NNP— NR, percentNDCA, intangible at original cost/NNP — NR percent
BEA GNPBEA NNPBEA NIBEA GPDIBEA NPDI..BEA PCE
BEA GPDI/BEA GNP percentBEA NPDI/BEA NNP, percent . .
GNPCCACCA, tangibleCCA intangibleNNPBusiness transfer payments + uncompensated factor services + net
indirect taxes + statistical discrepancy.NNI
Credits
Billions of 1972 dollars
1946
945.6714.1749.0
260.128.6
-153.626.5
-43.870.3
27.54.0
-6.19.8
478.3444.3402.1
70.936.9
301.0
14.88.3
763.4231.5178.952.7
531.8-34.9
566.7
1956
1,172.4945.9920.2
398.4172.0
212.5170.182.887.4
34.018.28.79.2
671.6615.1558.0102.646.1
405.4
15.37.5
1,212.9226.5160.566.0
986.525.8
960.7
1966
1,640.91,323.61,273.9
638.8321.5
337.2317.5146.6171.0
38.924.311.112.9
984.8906.2816.0163.084.3
585.7
16.69.3
1,656.6317.3213.5103.9
1,339.349.7
1,289.6
1971
1,856.61,457.71,388.8
742.1343.2
330.7339.3125.3214.0
40.023.58.6
14.7
1,122.41,022.2
911.8173.973.6
696.8
15.57.2
1,844.1398.9263.5135.4
1,445.168.9
1,376.3
1976
2,093.71.625.11,550.3
834.2365.5
544.0362.3137.0225.3
39.822.58.4
13.9
1,298.21,173.11,043.0
184.559.4
823.1
14.25.1
2,272.2468.7300.8167.9
1,803.574.8
1,728.8
1981
2,384.21,836.61,752.7
940.7393.1
319.2388.5174.6213.8
39.521.49.5
11.6
1,513.81,357.91,212.6
227.671.6
956.8
15.05.3
2,310.4547.7346.9200.8
1,762.783.8
1,678.9
Average annual percent change
1946-56
2.1732.8522.080
4.35519.641
n.a.20.425
n.a.2.201
2.13616.323
n.a.-.633
3.4533.3053.3293.7692.2383.021
.3051033
4,739-.22110792.2806.373
n.a.
5.420
1956-66
3.4193.4163.306
4.8346.455
4.7256.4395.8846.942
1.3682.9392.3873.409
3.9033.9513.8754.7366.2273.748
.8022.189
3.1673.4322.8954.6403.1056.788
2.988
1966-71
2.5011.9491.743
3.0441.316
3891.333
-3.0904.592
.530-.621
-4.9432.593
2.6492.4382.2441.30026743.535
-1.315-4.990
2.1674.6834.3005.4531.5336.736
1.310
1971-76
2.4332.1982.224
2.3661.267
10.4691.3221.8041.035
066-.911-.385
-1.137
2.9532.7932.7251.194
-4.2053.389
-1.709-6.808
4,2643.2752.6814.3914.5311.660
4.666
1976-81
2.6332.4772.485
2.4331.464
-10.1141.4034.9691038
-.194-.9882.432
-3.430
3.1212.9693.0604.2823.8133.054
1.126.819
.3343.1652.8963.639
4572.319
-.584
1946-81
2.6772.7362.459
3.7417.772
n.a.7.971
n.a.3.230
1.0364.902
n.a..481
3.3473.2443.2043.3881.9103.359
.0401292
3.2152.4901.9113.8973.483
n.a.
3.151
NOTES. — BEA Bureau of Economic Analysis.CCA Capital consumption allowances.GDCA Gross domestic capital accumulation.GNP Gross national product.GPDI Gross private domestic investment.NDCA Net domestic capital accumulation.NI National income.NNI Net national income.NNP Net national product.NPDI Net private domestic investment.NR Net revaluations.PCE Personal consumption expenditures.
Digitized for FRASER http://fraser.stlouisfed.org/ Federal Reserve Bank of St. Louis
January 1985

January 1985 SURVEY OF CURRENT BUSINESS 45
Table 8.—Constant-Dollar Business Income and Product
Line
1
234
5
6789
10111213
14
BEA gross domestic product, business
Less' Net space rent of owner-occupied nonfarm dwellingsLess: BEA government enterprise productLess: Rental value of buildings owned and used by nonprofit institu-
tions.
BEA-type gross domestic product of TISA business sector . ..
Subsidies included in business incomeExpense account items of consumptionLess: Expenses related to workBusiness investment in research and developmentTraining produced in business sectorMedia support plus health and safetyNet revaluationsLess' Intermediate product from government
Gross business product
Credits
Billions of 1972 dollars
1946
385.5
11.39.81.1
363.2
3.63.95.41.78.82.2
-67.2116.8
193.9
1956
557.4
26.311.41.7
518.0
1.45.69.05.27.74.1
26.752.2
507.5
1966
824.0
48.916.42.9
755.8
5.47.8
11.89.4
16.56.86.3
64.0
732.1
1971
938.6
60.817.93.8
856.0
4.89.1
14.811.115.77.1
-5.263.9
819.9
1976
1,095.4
77.921.14.7
991.7
4.510.817.313.218.58.4
113.855.9
1,087.7
1981
1,285.8
102.224.95.2
1,153.6
6.913.319.817.320.610.3
-51.457.2
1,093.5
Average annual percent change
1946-56
3.756
8.8251.4714.179
3.613
89153.7895.148
11.81013646.546
n.a.-7.744
10.101
1956-66
3.988
6.3983.7525.615
3.850
14.4043.3432.7866.0617.9605.188
-13.4982.065
3.732
1966-71
2.637
4.4481.7356.020
2.521
-2.3243.2544.5993.373
-1.028.900n.a.
-.033
2.291
1971-76
3.140
5.0863.2804.247
2.988
-1.4333.4213.1903.4933.3103.465
n.a.-2.655
5.815
1976-81
3.257
5.5813.360
, 1.883
3.070
8.8984.1732.7205.6152.1934.147
. n.a..458
.107
1946-81
3.502
6.4972.6844.526
3.357
1.8703.5873.7636.8392.4534.553
n.a.-2.022
5.067
Table 9.—Constant-Dollar Nonprofit Income and Product
Line
123
456789
10111213
14
15
16
17
ConsumptionConsumption in BEA personal consumption expendituresAdditional imputed consumption
Capital accumulationResearch and developmentEducation and training
Investment in BEA personal consumption expendituresAdditional imputed investmentEmployee training
Health.. . .Investment in BEA personal consumption expendituresAdditional imputed investment
Net revaluations
Less: Intermediate product transferred from government
Less: Intermediate product purchased
Less: Expenses related to work
Gross nonprofit product
Credits
Billions of 1972 dollars
1946
17.27.89.5
9.9.1
6.43.03.2
.23.61.71.9
2
2.5
2.3
.2
22.1
1956
18.210.18.1
14.3.2
7.94.82.9
.24.32.81.51.9
1.5
.7
.5
29.9
1966
26.615.411.2
22.3.5
12.98.44.0.5
7.55.42.11.4
2.6
0
.9
45.3
1971
31.820.811.0
24.6.6
15.010.63.8
.610.28.22.011
3.1
3.4
1.3
48.5
1976
35.225.210.0
27.0.7
15.311.43.2
.712.711.01.7
-1.7
2.3
6.4
1.6
51.8
1981
35.829.26.5
28.2.8
15.012.32.1
.715.013.91.1
-2.6
2.9
7.7
1.9
51.5
Average annual percent change
1946-56
0.5562.666
-1.538
3.8006.6012.1364.715-.801
-1.5711.7675.1332457
n.a
-5.261
-11.310
9.257
3.063
1956-66
3.8454.2633.300
4.55110.7275.0615.7173.320
11.5465.6836.6613.565
-3.099
5.965
-24.441
6.973
4.240
1966-71
3.6286.195
-.366
1.9393.1622.9444.6811 0242.4566.3618.7621 001n.a.
3.473
142.451
7.166
1.355
1971-76
2.0693.950
-1.912
1.8702.088.383
1.60737702.7924.5576.1233068
n.a.
-5.571
13.078
4.107
1.354
1976-81
0.3233.022
-8.184
.8572/787
-.3171.400
-7.998.485
3.3554.7418038n.a.
4.414
3.739
3.248
-.147
1946-81
2.1063.855
-1.058
3.0436.0462.4684.0651 1773.5404.1536.166
-1.485n.a.
.398
3.557
6.690
2.441
Table 10.—Constant-Dollar Government Enterprise Income and Product
Line
1
23
456
78
9
10
Sales minus purchases of intermediate goods
TransfersCapital income + negative surplus + intermediate product from
government — indirect taxes.Consumption 'Investment
Employee training
Net revaluationsLess: Intermediate product from government
Less' Expenses related to work
Gross government enterprise product .
Credits
Billions of 1972 dollars
1946
9.8
3.73.5
2.41.1.1
.73.2
.1
10.8
1956
11.4
4.34.1
2.81.4.2
.31.1
.2
14.7
1966
16.4
4.94.6
2.71.8.3
.41.5
.3
19.1
1971
17.9
5.35.0
3.02.0
.4
.21.9
.4
21.2
1976
21.1
4.13.6
2.21.4.5
-.21.4
.4
23.1
1981
24.9
5.45.0
3.11.9.5
01.7
.5
28.2
Average annual percent change
1946-56
1.471
1.6321.598
1.2702.2952.502
-8.232-10.195
5.460
3.081
1956-66
3.752
1.2881.015
-.0672.9156.492
n.a.3.393
4.456
2.669
1966-71
1.735
1.7771.741
1.6791.8332.290
n.a.4.239
5.603
2.118
1971-76
3.280
5.109-6.096
-5.615-6.827
5.683
n.a.5.597
2.000
1.757
1976-81
3.360
5.8306.413
6.6316.064
.799
n.a,3.193
1.080
4.045
1946-81
2.684
1.147.982
.6731.5723.800
-9.801-1.882
4.060
2.772
Digitized for FRASER http://fraser.stlouisfed.org/ Federal Reserve Bank of St. Louis
January 1985

46 SURVEY OF CURRENT BUSINESS January 1985
Table 11.—Constant-Dollar Government Income and Product
Line
1
23456789
io111213
1415161718
19
20
21
22
23
24
25
Consumption (to households)
Capital accumulationTo business (research and development)To households
Education and trainingPublic schoolsEmployee training
Military.Nonmilitary
HealthTo government
Research and developmentNatural resources
Intermediate product . . . . . .To businessTo nonprofit .To government enterpriseTo household
Gross credits exclusive of change in inventories and net revaluations
Change in inventories
Less: Intermediate purchases from other sectors
Less: Expenses related to work
Gross government product exclusive of net revaluations
Net revaluations
Gross government product
Credits
Billions of 1972 dollars
1946
21.7
57.31.9
43.440.222.417.816.41.43.2
11.9.8
11.1
185.1116.8
2.53.2
62.5
264.1
148
8.0
1.3
240.0
-61.7
178.3
1956
16.5
62.37.5
45.741.227.513.712.11.54.59.22.17.0
95.052.21.51.1
40.2
173.8
1.3
21.1
2.1
151.8
14.6
166.4
1966
37.4
113.815.883.776.459.616.813.92.97.3
14.34.79.6
120.164.02.61.5
51.9
271.3
4.3
47.4
3.3
216.3
6.6
222.8
1971
47.0
128.911.8
104.494.577.217.314.13.29.9
12.74.87.9
122.763.93.11.9
53.8
298.6
-1.4
60.0
4.3
233.0
7.8
240.8
1976
58.8
139.110.7
115.7103.188.115.011.13.9
12.612.74.48.3
105.855.92.31.4
46.2
303.7
.4
70.3
4.8
229.0
15.6
244.6
1981
60.3
151.612.0
122.1108.393.714.610.64.0
13.817.64.0
13.6
110.557.22.91.7
48.7
322.4
.2
80.0
5.0
237.5
11.9
249.4
Average annual percent change
1946-56
-2.709
.84514.540
.503
.2402.082
-2.618-2.950
.5743.349
-2.59410.3644486
-6.453-7.744
5261-10.195-4.310
-4.098
n.a.
10.211
5.428
4.479
n.a.
-.688
1956-66
8.540
6.2067.7616.2436.3718.0322.0701.3736.4735.0074.5538.2553.149
2.3742.0655.9653.3932.583
4.554
n.a.
8.419
4.430
3.604
-7.666
2.964
1966-71
4.720
2.516-5,698
4.5214.3395.295.619.284
2.1886.349
-2.410.129
3764
.428-.0333.4734.240.703
1.939
n.a.
4.813
5.384
1.499
3.427
1.558
1971-76
4.559
1.549-1.809
2.0741.7702.681
-2.754-4.682
4.3274.794.056
-1.6251.014
-2.923-2.655-5.571-5.596-3.008
.341
n.a.
3.234
2.247
.343
14.949
.320
1976-81
0.518
1.7332.2121.076.978
1.237-.593
QftA— .J7DD.428
1.8616.716
-1.96910.344
.869
.4584.4143.1931.094
1.202
-14.634
2.619
1.120
.732
5320
.387
1946-81
2.970
2.8205.3672.9962.8704.171
-.567-1.241
2.9744.2361.1154.690
.578
- 1.464-2.022
.398-1.882-.709
.572
n.a.
6.804
4.055
-.030
n.a.
.964
Table 12.—Constant-Dollar Household Income and Product
Line
123456789
1011121314151617
18192021222324252627
28
29
30
31
ConsumptionMarket (labor services in households)Nonmarket
Net space rent on owner-occupied nonfarm dwellingsBEA net space rent on owner-occupied nonfarm dwellingsSubsidies
Capital services other than on owner-occupied dwellingsDurables
GrossLess: Services allocated to investmentLess' Services to expenses related to work
SemidurablesInventories
Labor servicesTotal imputed labor services . . . . . .Less: Labor services allocated to investment
Capital accumulation .Intangible at original cost
EducationTeaching children in homeOpportunity cost of studentsDurable services allocated to eduction
HealthEmployee training
Net revaluations
Services to expenses related to work
Less: Intermediate product transferred from government
Less: Expenses related to work
Gross household product
Credits
Billions of 1972 dollars
1946
419.05.8
359.011.311.30
47.614.117.2
.82.3
33.4.1
300.1339.1
39.054.2
-6.847.043.111.624.4
.55.63.6
.2-53.7
2.3
62.5
.3
351.8
1956
467.36.9
430.526.326.30
76.838.646.41.56.3
38.0.2
327.4381.9
54.530.0
58.161.157.112.738.7
.94.33.9.1
-3.0
6.3
40.2
.5
491.0
1966
566.15.9
528.848.948.90
109.057.766.92.36.9
51.0.3
370.9465.7
94.831.4
107.3105.5100.8
14.576.71.57.64.6.1
1.8
6.9
51.9
.6
627.9
1971
607.24.8
578.061.060.8
.2136.878.389.83.28.3
58.2.3
380.2520.9140.724.4
140.4154.6149.415.7
121.12.3
10.35.1.1
-14.2
8.3
53.8
.6
701.5
1976
674.03.7
655.078.077.9
.1169.7100.4113.7
4.48.8
68.9.3
407.3571.0163.715.2
228.2177.4171.616.3
143.23.19.15.7.1
50.8
8.8
46.2
.5
864.3
1981
786.13.1
763.9102.3102.2
.1215.3127.3141.5
6.08.2
87.7.4
446.2609.7163.419.0
146.6178.3171.912.7
146.14.58.56.4.1
-31.7
8.2
48.7
.5
891.7
Average annual percent change
1946-56
1.0981.6901.8328.8258.825n.a.
4.90310.62710.4376.048
10.5541.2974.481.873
1.1963.4185745
n.a.2.6612.849.912
4.7346.7832735.614
-7.677n.a.
10.554
4310
6.766
3.391
1956-66
1.93614902.0796.3986.398
n.a.3.5634.0893.7214.566.916
2.9935.0531.2562.0045.688
.462
6.3355.6195.8411.3447.0864.7305.9671.7783.341
n.a.
.916
2.583
1.818
2.489
1966-71
1.410-4.182
1.7934.5114.448
4.6396.2926.0857.3733.8292.666
.029
.4972.2668.2164876
5.5117.9428.1991.5959.5758.7686.2081.967
-6.713n.a.
3.829
.703
.384
2.243
1971-76
2.108-4.772
2.5335.0595.08658464.4035.1174.8166.2491.1583.446
-1.9641.3841.8533.0809027
10.2112.7892.809
.6953.4086.920
-2.4782.290
-3.909n.a.
1.158
-3.008
-2.542
4.262
1976-81
3.126-3.425
3.1245.5715.581
9854.8794.8524.4766.367
-1.4234.9272.7091.8451.320
-.0374.555
8471.110.034
-4.914.402
7.349-1.318
2.375-5.480
n.a.
-1.423
1.094
-3.099
.626
1946-81
1.814-1.742
2.1816.5016.497
n.a.4.4066.4946.2075.8843.6902.7962.8021.1401.6904.182
- 2944
n.a.3.8864.030
.2465.2536.5721.1831.628
-3.643n.a.
3.690
-.709
1.636
2.693
Digitized for FRASER http://fraser.stlouisfed.org/ Federal Reserve Bank of St. Louis
January 1985

January 1985 SURVEY OF CURRENT BUSINESS
Table 13.—Total Capital, Year-End Totals
47
Line
1
2345678
9101112
131415161718
19202122
2324252627282930
Total capital
BusinessTangible
LandStructures and equipmentResidentialInventories
Intangible (research and development)
NonprofitLapd , ---„Structures and equipmentResidential
GovernmentLandStructures and equipmentResidentialInventoriesIntangible (research and development)
Government enterpriseStructures and equipmentResidentialInventories
HouseholdTangible
LandResidentialDurablesSemidurablesInventories
Intangible (human capital) .
Billions of dollars
1945
1,195.8
331.1319.7115.290.163.351.111.4
11.82.75.04.0
243.821.9
161.12.1
58.72.1
17.515.21.11.3
589.5154.311.767.848.624.12.1
435.2
1955
2,411.2
724.8686.0197.4274.5104.3109.838.8
29.16.8
16.06.3
304.048.1
199.41.9
54.66.7
49.337.54.96.9
1,297.3454.337.8
223.1151.937.63.7
843.1
1965
4,454.7
1,238.71,104.3
355.6451.5126.7170.5134.4
60.916.135.89.0
494.1117.4323.6
4.0.49.122.8
83.367.79.06.7
2,554.9760.0101.8365.1233.154.25.8
1,795.0
1970
6,917.8
1,809.01,592.6
426.7744.8177.1244.0216.4
95.620.762.412.4
722.0156.5499.6
5.260.637.5
127.5109.714.43.5
4,126.21,151.2
153.7545.0368.375.98.2
2,975.0
1975
11,901.4
3,082.32,759.9
748.81,336.6
292.9381.5322.4
147.526.5
104.216.8
1,177.3273.9814.011.078.457.9
235.0208.524.81.8
7,201.31,958.1
276.3973.8585.0110.312.7
5,243.2
1981
23,746.4
6,085.95,528.91,465.12,668.4
557.7837.8557.0
248.241.7
180.825.7
2,220.4552.6
1,502.820.0
145.089.5
476.3421.845.29.3
14,626.03,949.7
615.12,078.81,052.7
179.623.4
10,676.3
Average annual percent change
1945-55
7.265
8.1517.9355.534
11.7885.1117.959
13.041
9.4479.517
12.2764.537
2.2328.1622.159
-1.173-.71812.157
10.8799.450
16.28518.460
8.20711.40412.47312.65412.0744.5475.8806.835
1955-65
6.331
5.5064.8766.0615.1011,9684.500
13.235
7.6709.0248.3593.715
4.9769.3334.9588.007
-1.06112.977
5.4016.0906.339
-.340
7.0125.281
10.3995.0464.3743.7204.5157.850
1965-70
9.201
7.8697.5993.716
10.5336.9277.4259.988
9.4405.197
11.7826.597
7.8825.9259.0775.3764.310
10.409
8.87810.1339.880
-12.196
10.0618.6618.5998.3459.5776.9857.192
10.633
1970-75
11.462
11.24711.62311.90412.40610.5839.3578.305
9.0685.103
10.7836.171
10.27411.83410.25616.2015.2719.109
13.00313.70911.507
-12.855
11.78211.20812.43812.3089.6967.7539.116
12.001
1975-81
12.202
12.00612.27711.83612.21211.33114.0079.538
9.0627.8059.6237.401
11.15512.41110.75810.48210.8087.513
12.49712.46310.56131.976
12.53412.40614.27313.47310.2878.462
10.68412.582
1945-81
8.656
8.4238.2407.3199.8706.2298.082
11.412
8.8337.867
10.4595.290
6.3299.3746.4006.4882.545
10.926
9.6059.673
10.9525.673
9.3309.425
11.6409.9768.9195.7376.9109.296
Table 14.—Constant-Dollar Total Capital, Year-End Totals
Line
1
2345678
9101112
131415161718
19202122
2324252627
2930
Total capital
BusinessTangible
LandStructures and equipmentResidentialInventories
Intagible (research and development)
NonprofitLandStructures and equipmentResidential
GovernmentLandStructures and equipmentResidentialInventoriesIntangible (research and development).. .
Government enterpriseStructures and equipmentResidential .Inventories
HouseholdTangible
LandResidentialDurablesSemidurablesInventories
Intangible (humaii capital)
Billions of 1972 dollars
1945
2,941.7
805.3786.1281.7249.3151.0104.219.2
32.56.7
16.29.6
595.253.7
450.25.2
86.12.8
51.046.22.62.3
1,454.8320.028.6
161.977.447.64.5
1,134.8
1955
3,989.2
1,109.91,056.0
319.4432.6151.2152.853.9
47.511.027.49.2
483.577.8
335.02.7
68.08.4
86.266.87.1
12.4
2,253.7633.661.2
325.3187.553.95.7
1.620.1
1965
5,997.0
1,622.41,460.7
470.6609.1 j174.9206.1161.7
87.621.353.812.5
680.8155.4461.3
5.858.426.9
119.398.712.48.2
3,460.0987.5134.7505.8268.371.27.5
2,472.4
1970
7.471.4
1,921.81,698.1
455.3791.9192.0258.9223.6
103.722.168.113.5
777.7167.0541.8
5.763.139.3
141.5121.815.64.1
4,487.51.219.0
164.0591.4372.981.98.8
3,268.4
1975
9,301.9
2,331.52,052.7
581.2957.5214.7299.2278.8
109.120.676.212.2
864.7212.6590.6
7.653.951.7
163.8144.618.11.2
5,781.11,520.5
214.4711.4487.697.89.3
4,260.6
1981
1,1487.8
2,893.12,496.6
731.11,188.0
228.9348.6396.5
111.720.880.510.4
961.2275.7621.7
7.156.768.9
194.3172.118.24.0
7,258.41,914.6
306.9842.4625.4129.310.5
5,343.9
Average annual percent change
1945-55
3.093
3.2602.9951.2635.668.019
3.90010.904
3.8595.0855.368
492
-2.0573.7842914
-6.207-2.33811.656
5.3893.756
10.68318.476
4.4747.0687.9217.2259.2551.2412.3223.625
1955-65
4.161
3.8693.2983.9533.4811.4663.038
11.606
6.3106.8576.9833.188
3.4827.1603.2527.733
-1.50512.375
3.2953.9825.797
-4.091
4.3804.5388.2044.5113.6512.8312.7654.318
1965-70
4.495
3.4453.058
-.6595.3901.8804.6706.707
3.441.760
4.8421.506
2.6951.4563.270
2021.5627.850
3.4774.3014.621
12805
5.3384.3024.0183.1796.8022.8353.2605.741
1970-75
4.480
3.9413.8655.0063.8692.2652.9384.510
1.01013762.2701.955
2.1454.9411.7405.906
-3.1045.630
2.9713.4892.957
21993
5.1974.5195.5083.7635.5113.6111.1005.445
1975-81
3.580
3.6633.3173.8963.6621.0712.5796.043
.401
.152
.916-2.655
1.7794.431.858
1068.831
4.912
2.8872.943.172
22.579
3.8663.9156.1602.8584.2364.7582.0723.848
1945-81
3.857
3.6163.2622.6844.4331.1633.4128.782
3.4873.2084.548.220
1.3404.651.900.883
-1.1569.322
3.7843.7215.5971.602
4.5665.0946.8184.6875.9772.8122.3624.398
Digitized for FRASER http://fraser.stlouisfed.org/ Federal Reserve Bank of St. Louis
January 1985

48 SURVEY OF CURRENT BUSINESS January 1985
Table 15.—Year-End Implicit Price Deflators for Capital
Line
1
2345678
9101112
131415161718
19202122
2324252627282930
Total capital
BusinessTangible
LandStructures and equipmentResidentialInventories
Intangible (research and development)....
NonprofitLandStructures and EquipmentResidential
GovernmentLandStructures and equipmentResidentialInventoriesIntangible (research and development)
Government enterpriseStructures and equipmentResidentialInventories
HouseholdTangible .. .. ..
LandResidentialDurablesSemidurables '.Inventories . . .
Intangible (human capital)
Mid-1972 =100
1945
40.7
41.140.740.936.142.049.059.4
36.240.931.041.8
41.040.935.840.268.176.8
34.432.941.856.0
40.548.240.941.962.850.646.538.4
1955
60.4
65.365.061.863.568.971.971.9
61.261.858.568.5
62.961.859.567.880.380.3
57.156.168.555.9
57.671.761.868.681.169.865.552.0
1965
74.3
76.475.675.674.172.482.883.2
69.575.666.572.1
72.675.670.169.584.084.7
69.968.672.082.0
73.877.075.672.286.976.177.572.6
1970
92.6
94.193.893.794.192.294.296.7
92.193.791.792.0
92.893.792.291.296.095.3
90.190.092.185.0
91.994.493.792.298.892.793.591.0
1975
127.9
132.2134.5128.8139.6136.4127.5115.6
135.2128.8136.7137.0
136.1128.8137.8145.1145.3112.0
143.5144.2137.2147.8
124.6128.8128.8136.9120.0112.8136.9123.1
1981
206.7
210.4221.5200.4224.6243.6240.3140.5
222.2200.4224.6247.2
231.0200.4241.7281.5256.0129.8
245.1245.2248.0230.2
201.5206.3200.4246.8168.3138.9222.5199.8
Average annual percent change
1945-55
4.046
4.7364.7964.2185.7925.0913.9061.926
5.3814.2186.5565.054
4.3794.2185.2265.3671.659.448
5.2085.4885.061
-.014
3.5734.0494.2185.0642.5803.2663.4773.098
1955-65
2.083
1.5751.5282.0281.565.496
1.4191.460
1.2792.0281.287.511
1.4432.0281.652.254.451.535
2.0392.027
.5123.911
2.522.711
2.028.512.698.865
1.7033.386
1965-70
4.504
4.2764.4074.4044.8804.9542.6323.076
5.8004.4046.6195.016
5.0514.4045.6235.5892.7052.373
5.2195.5925.026.698
4.4834.1784.4045.0072.5984.0363.8084.627
1970-75
6.682
7.0297.4696.5698.2198.1346.2363.631
7.9786.5698.3248.288
7.9586.5698.3709.7228.6443.294
9.7439.8768.304
11.714
6.2606.3996.5698.2353.9673.9977.9286.218
1975-81
8.324
8.0488.6727.6418.248
10.15111.1403.296
8.6267.6418.628
10.330
9.2127.6419.817
11.6759.8952.479
9.3399.248
10.3717.667
8.3468.1707.641
10.3205.8053.5368.4378.411
1945-81
4.621
4.6394.8214.5145.2065.0074.5162.418
5.1664.5145.6535.059
4.9234.5145.4505.5563.7451.467
5.6095.7385.0714.006
4.5564.1214.5145.0522.7762.8454.4434.691
Digitized for FRASER http://fraser.stlouisfed.org/ Federal Reserve Bank of St. Louis
January 1985