total maximum daily loads for phosphorus to address 4 ... lakes.pdf · 5 1.0 executive summary the...
TRANSCRIPT

1
Amendment to the Upper Delaware Water Quality Management Plan
Northeast Water Quality Management Plan Upper Raritan Water Quality Management Plan Sussex County Water Quality Management Plan
Total Maximum Daily Loads for Phosphorus
To Address 4 Eutrophic Lakes in the Northwest Water Region
CRANBERRY LAKE, SUSSEX COUNTY GHOST LAKE, WARREN COUNTY
LAKE HOPATCONG, SUSSEX COUNTY LAKE MUSCONETCONG, SUSSEX COUNTY
Watershed Management Area 1
(Upper Delaware River Watershed)
Proposed: January 21, 2003 Established: March 28, 2003 Approved (by EPA Region 2): September 17, 2003 Adopted:
New Jersey Department of Environmental Protection Division of Watershed Management
P.O. Box 418 Trenton, New Jersey 08625-0418

2

3
Contents 1.0 Executive Summary........................................................................................................... 5 2.0 Introduction ........................................................................................................................ 6 3.0 Background......................................................................................................................... 6
3.1 305(b) Report and 303(d) List ........................................................................................... 6 3.2 Total Maximum Daily Loads (TMDLs) .......................................................................... 8 3.3 Integrated List of Waterbodies ........................................................................................ 8
4.0 Pollutant of Concern and Area of Interest ..................................................................... 8 4.1 Cranberry Lake................................................................................................................. 11 4.2 Ghost Lake ........................................................................................................................ 14 4.3 Lake Hopatcong ............................................................................................................... 15 4.4 Lake Musconetcong......................................................................................................... 18 4.5 Swartswood Lake............................................................................................................. 19 4.6 Clove Acres Lake ............................................................................................................. 20
5.0 Applicable Surface Water Quality Standards.............................................................. 20 6.0 Source Assessment........................................................................................................... 21
6.1 Assessment of Point Sources other than Stormwater................................................. 21 6.2 Assessment of Nonpoint Sources and Stormwater..................................................... 22
7.0 Water Quality Analysis................................................................................................... 23 7.1 Current Condition ........................................................................................................... 25 7.2 Reference Condition ........................................................................................................ 28 7.3 Seasonal Variation/Critical Conditions ....................................................................... 28 7.4 Margin of Safety............................................................................................................... 28 7.5 Target Condition .............................................................................................................. 30
8.0 TMDL Calculations.......................................................................................................... 30 8.1 Loading Capacity............................................................................................................. 30 8.2 Reserve Capacity.............................................................................................................. 30 8.3 Allocations ........................................................................................................................ 31
9.0 Follow-up Monitoring..................................................................................................... 36 10.0 Implementation ................................................................................................................ 36
10.1 Lake Characterization ..................................................................................................... 37 10.2 Reasonable Assurance..................................................................................................... 38
11.0 Public Participation ......................................................................................................... 38 Appendix A: References ..................................................................................................................... 40 Appendix B: Database of Phosphorus Export Coefficients .......................................................... 44 Appendix C: Summary of Reckhow (1979a) model derivation.................................................... 48 Appendix D: Derivation of Margin of Safety from Reckhow et al (1980).................................... 49

4
Figures Figure 1 Eutrophic lakes in the Northwest Water Region on Sublist 5 of 2002 Integrated
List .................................................................................................................................... 10 Figure 2 Lakeshed of Cranberry Lake ......................................................................................... 13 Figure 3 Lakeshed of Ghost Lake................................................................................................. 15 Figure 4 Lakeshed of Lake Hopatcong........................................................................................ 17 Figure 5 immediate Lakeshed of Lake Musconetcong ............................................................. 19 Figure 6 Current distribution of phosphorus load for Cranberry Lake ................................. 26 Figure 7 Current distribution of phosphorus load for Ghost Lake......................................... 26 Figure 8 Current distribution of phosphorus load for Lake Hopatcong................................ 27 Figure 9 Current distribution of phosphorus load for Lake Musconetcong ......................... 27 Figure 10 Phosphorus allocations for Cranberry Lake TMDL .................................................. 34 Figure 11 Phosphorus allocations for Ghost Lake ....................................................................... 34 Figure 12 Phosphorus allocations for Lake Hopatcong TMDL ................................................. 35 Figure 13 Phosphorus allocations for Lake Musconetcong TMDL........................................... 35 Tables Table 1 Eutrophic Lakes for which Phosphorus TMDLs are being established..................... 5 Table 2 Abridged Sublist 5 of the 2002 Integrated List of Waterbodies, eutrophic lakes ..... 9 Table 3 Point Source Phosphorus Loads .................................................................................... 22 Table 4 Phosphorus export coefficients (Unit Areal Loads).................................................... 22 Table 5 Nonpoint and Stormwater Sources of Phosphorus Loads*...................................... 23 Table 6 Empirical models considered by the Department ...................................................... 23 Table 7 Hydrologic and loading characteristics of lakes ......................................................... 25 Table 8 Current condition, reference condition, target condition and overall percent
reduction for each lake .................................................................................................. 30 Table 9 Distribution of WLAs and LAs among source categories ........................................ 32 Table 10 TMDL calculations for each lake (annual loads and percent reductionsa).............. 33 Table 11 Implementation Schedule............................................................................................... 38

5
1.0 Executive Summary The State of New Jersey’s 2002 Integrated List of Waterbodies identified several lakes in the Northwest Water Region as being eutrophic. This report establishes total maximum daily loads (TMDLs) for total phosphorus (TP) that address eutrophication of the lakes listed in Table 1. Table 1 Eutrophic Lakes for which Phosphorus TMDLs are being established
TMDL Number Lake Name Municipality WMA Acres
1 Cranberry Lake Byram Township, Sussex County 01 190 2 Ghost Lake Independence Township, Warren County 01 18.3
3 Lake Hopatcong Hopatcong Borough, Sussex County; Mt. Arlington Borough, Jefferson & Roxbury Townships; Morris County
01 2,410
4 Lake Musconetcong Stanhope, Byram, Netcong and Roxbury Townships; Sussex County 01 314
These TMDLs serve as the foundation on which restoration plans will be developed to restore eutrophic lakes and thereby attain applicable surface water quality standards. A TMDL is developed as a mechanism for identifying all the contributors to surface water quality impacts and setting goals for load reductions for pollutants of concern as necessary to meet Surface Water Quality Standards (SWQS). The pollutant of concern for these TMDLs is phosphorus, since phosphorus is generally the nutrient responsible for overfertilization of inland lakes leading to cultural eutrophication. The Department's Geographic Information System (GIS) was used extensively to describe the lakes and lakesheds (drainage basins of the lakes). In order to prevent excessive primary productivity1 and consequent impairment of recreational, water supply and aquatic life designated uses, the SWQS define both numerical and narrative criteria that address eutrophication in lakes due to overfertilization. Phosphorus sources were characterized on an annual scale (kg TP/yr) for both point and nonpoint sources. Runoff from land surfaces comprises a substantial source of phosphorus into lakes. An empirical model was used to relate annual phosphorus load and steady-state in-lake concentration of total phosphorus. To achieve the TMDLs, overall load reductions were calculated for at least eight source categories. In order to track effectiveness of remediation measures (including TMDLs) and to develop baseline and trend information on lakes, the Department will augment its ambient monitoring program to include lakes on a rotating schedule. The implementation plan also calls for the collection of additional monitoring data and the development of a Lake Restoration Plan for each lake for which TMDLs are being established. These plans will consider what specific measures are necessary to achieve the nutrient reductions required by the TMDL, as well as what in-lake measures need to be taken to supplement the nutrient reductions required by the TMDL.
1 Primary productivity refers to the growth rate of primary producers, namely algae and aquatic plants, which form the base of the food web.

6
Each TMDL shall be proposed and adopted by the Department as an amendment to the appropriate areawide water quality management plan(s) in accordance with N.J.A.C. 7:15-3.4(g). This TMDL Report is consistent with EPA’s May 20, 2002 guidance document entitled: “Guidelines for Reviewing TMDLs under Existing Regulations issued in 1992,” (Suftin, 2002) which describes the statutory and regulatory requirements for approvable TMDLs. 2.0 Introduction Sublist 5 (also known as List 5 or, traditionally, the 303(d) List) of the State of New Jersey’s 2002 Integrated List of Waterbodies identified several lakes in the Northwest Water Region (WMAs 1, 2, and 11) as being eutrophic, as evidenced by elevated total phosphorus (TP), elevated chlorophyll-a, and/or macrophyte density that impairs recreational use (a qualitative assessment). Total phosphorus was used as the pollutant of concern, since this “independent” causal pollutant causes “dependent “ responses in chlorophyll-a concentrations and/or macrophyte density. This report establishes four total maximum daily loads (TMDLs) that address total phosphorus loads to the identified lakes. These TMDLs serve as the foundation on which management approaches or restoration plans will be developed to restore eutrophic lakes and thereby attain applicable surface water quality standards. Several of the lakes are listed on Sublist 5 for impairments caused by other pollutants. These TMDLs address only the impairment of lakes due to eutrophication. Separate TMDL evaluations will be developed to address the other pollutants of concern. The waterbodies will remain on Sublist 5 until such time as TMDL evaluations for all pollutants have been completed and approved by the United States Environmental Protection Agency (USEPA). A TMDL is considered "proposed" when NJDEP publishes the TMDL Report as a proposed Water Quality Management Plan Amendment in the New Jersey Register (NJR) for public review and comment. A TMDL is considered to be "established" when NJDEP finalizes the TMDL Report after considering comments received during the public comment period for the proposed plan amendment and formally submits it to EPA Region 2 for thirty (30)-day review and approval. The TMDL is considered "approved" when the NJDEP-established TMDL is approved by EPA Region 2. The TMDL is considered to be "adopted" when the EPA-approved TMDL is adopted by NJDEP as a water quality management plan amendment and the adoption notice is published in the NJR. 3.0 Background
3.1 305(b) Report and 303(d) List In accordance with Section 305(b) of the Federal Clean Water Act (CWA) (33 U.S.C. 1315(B)), the State of New Jersey is required to biennially prepare and submit to the United States

7
Environmental Protection Agency (USEPA) a report addressing the overall water quality of the State's waters. This report is commonly referred to as the 305(b) Report or the Water Quality Inventory Report. In accordance with Section 303(d) of the CWA, the State is also required to biennially prepare and submit to USEPA a report that identifies waters that do not meet or are not expected to meet surface water quality standards (SWQS) after implementation of technology-based effluent limitations or other required controls. This report is commonly referred to as the 303(d) List. The listed waterbodies are considered water quality-limited and require total maximum daily load (TMDLs) evaluations. For waterbodies identified on the 303(d) List, there are three possible scenarios that may result in a waterbody being removed from the 303(d) List:
Scenario 1: A TMDL is established for the pollutant of concern; Scenario 2: A determination is made that the waterbody is meeting water quality standards (no TMDL is required); or Scenario 3: A determination is made that a TMDL is not the appropriate mechanism for achieving water quality standards and that other control actions will result in meeting standards.
Where a TMDL is required (Scenario 1), it will: 1) specify the maximum amount of a pollutant that a waterbody can receive and still meet water quality standards; and 2) allocate pollutant loadings among point and nonpoint pollutant sources. Recent EPA guidance (Suftin, 2002) describes the statutory and regulatory requirements for approvable TMDLs, as well as additional information generally needed for USEPA to determine if a submitted TMDL fulfills the legal requirements for approval under Section 303(d) and EPA regulations. The Department believes that this TMDL report, which includes four TMDLs, addresses the following items in the May 20, 2002 guideline document:
1. Identification of waterbody(ies), pollutant of concern, pollutant sources and priority ranking.
2. Description of applicable water quality standards and numeric water quality target(s). 3. Loading capacity – linking water quality and pollutant sources. 4. Load allocations. 5. Wasteload allocations. 6. Margin of safety. 7. Seasonal variation. 8. Reasonable assurances. 9. Monitoring plan to track TMDL effectiveness. 10. Implementation (USEPA is not required to and does not approve TMDL
implementation plans). 11. Public Participation. 12. Submittal letter.

8
3.2 Total Maximum Daily Loads (TMDLs) A TMDL represents the assimilative or carrying capacity of a waterbody, taking into consideration point and nonpoint source of pollutants of concern, natural background and surface water withdrawals. A TMDL quantifies the amount of a pollutant a water body can assimilate without violating a state’s water quality standards and allocates that load capacity to known point sources in the form of wasteload allocations (WLAs), nonpoint sources in the form of load allocations (LAs), and a margin of safety. A TMDL is developed as a mechanism for identifying all the contributors to surface water quality impacts and setting goals for load reductions for pollutants of concern as necessary to meet SWQS. Once one of the three possible delisting scenarios, noted above, is completed, states have the option to remove the waterbody and specific pollutant of concern from the 303(d) List or maintain the waterbody on the 303(d) list until SWQS are achieved. The State of New Jersey will be removing lakes from the 303(d) List for eutrophication once their TMDLS are approved by USEPA.
3.3 Integrated List of Waterbodies In November 2001, USEPA issued guidance that encouraged states to integrate the 305(b) Report and the 303(d) List into one report. This integrated report assigns waterbodies to one of five categories. In general, Categories 1 through 4 include a range of designated use impairments with a discussion of enforceable management strategies, whereas Sublist 5 constitutes the traditional 303(d) List for waters impaired or threatened by a pollutant for which one or more TMDL evaluations are needed. Where more than one pollutant is associated with the impairment for a given waterbody, that waterbody will remain on Sublist 5 until one of the three possible delisting scenarios is completed. In the case of an Integrated List, however, the waterbody is not delisted but moved to one of the other categories. Following USEPA’s guidance, the Department chose to develop an Integrated Report for New Jersey. New Jersey’s 2002 Integrated List of Waterbodies is based upon these five categories and identifies water quality limited surface waters in accordance with N.J.A.C. 7:15-6 and Section 303(d) of the CWA. These TMDLs address eutrophic lakes, as listed on Sublist 5 of the State of New Jersey’s 2002 Integrated List of Waterbodies. 4.0 Pollutant of Concern and Area of Interest Lakes were designated as eutrophic on Sublist 5 of the 2002 Integrated List of Waterbodies as a result of evaluations performed through the State’s Clean Lakes Program. Indicators used to determine trophic status included elevated total phosphorus (TP), elevated chlorophyll-a, and/or macrophyte density. The pollutant of concern for these TMDLs is total phosphorus. The mechanism by which phosphorus can cause use impairment is via excessive primary productivity. Phosphorus is an essential nutrient for plants and algae, but is considered a pollutant because it can stimulate excessive growth (primary production). Phosphorus is
9
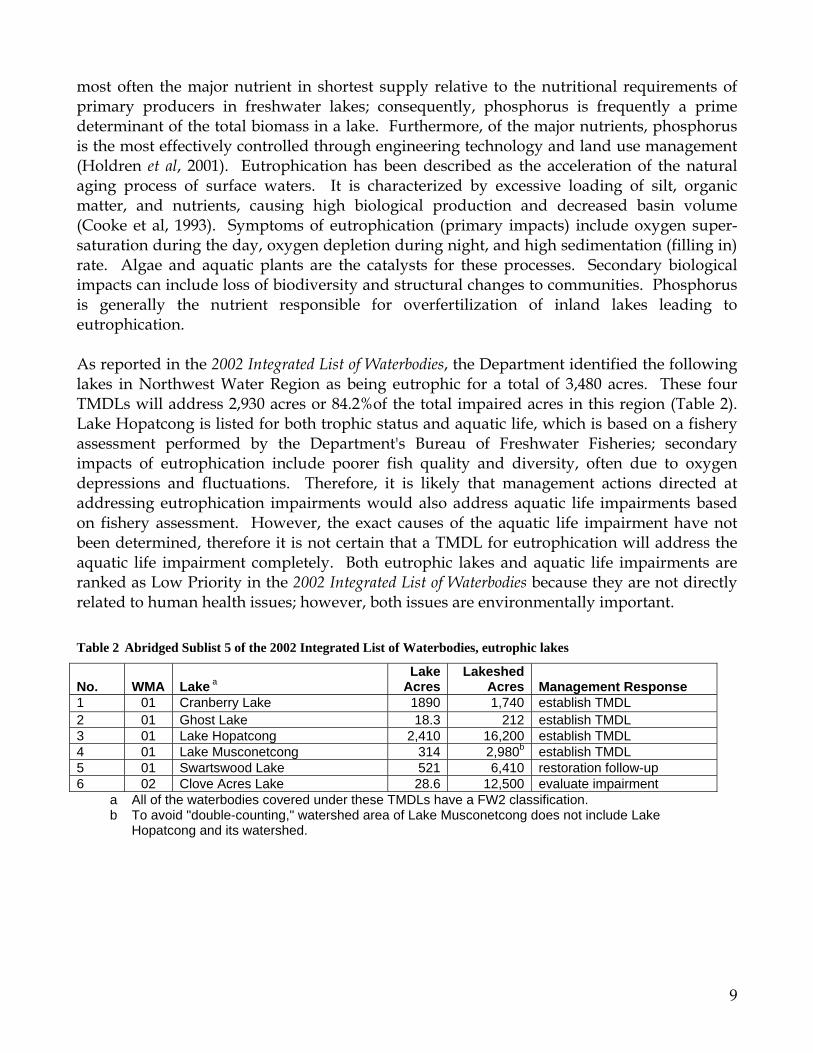
most often the major nutrient in shortest supply relative to the nutritional requirements of primary producers in freshwater lakes; consequently, phosphorus is frequently a prime determinant of the total biomass in a lake. Furthermore, of the major nutrients, phosphorus is the most effectively controlled through engineering technology and land use management (Holdren et al, 2001). Eutrophication has been described as the acceleration of the natural aging process of surface waters. It is characterized by excessive loading of silt, organic matter, and nutrients, causing high biological production and decreased basin volume (Cooke et al, 1993). Symptoms of eutrophication (primary impacts) include oxygen super-saturation during the day, oxygen depletion during night, and high sedimentation (filling in) rate. Algae and aquatic plants are the catalysts for these processes. Secondary biological impacts can include loss of biodiversity and structural changes to communities. Phosphorus is generally the nutrient responsible for overfertilization of inland lakes leading to eutrophication. As reported in the 2002 Integrated List of Waterbodies, the Department identified the following lakes in Northwest Water Region as being eutrophic for a total of 3,480 acres. These four TMDLs will address 2,930 acres or 84.2%of the total impaired acres in this region (Table 2). Lake Hopatcong is listed for both trophic status and aquatic life, which is based on a fishery assessment performed by the Department's Bureau of Freshwater Fisheries; secondary impacts of eutrophication include poorer fish quality and diversity, often due to oxygen depressions and fluctuations. Therefore, it is likely that management actions directed at addressing eutrophication impairments would also address aquatic life impairments based on fishery assessment. However, the exact causes of the aquatic life impairment have not been determined, therefore it is not certain that a TMDL for eutrophication will address the aquatic life impairment completely. Both eutrophic lakes and aquatic life impairments are ranked as Low Priority in the 2002 Integrated List of Waterbodies because they are not directly related to human health issues; however, both issues are environmentally important. Table 2 Abridged Sublist 5 of the 2002 Integrated List of Waterbodies, eutrophic lakes
No. WMA Lake a Lake
Acres Lakeshed
Acres Management Response 1 01 Cranberry Lake 1890 1,740 establish TMDL 2 01 Ghost Lake 18.3 212 establish TMDL 3 01 Lake Hopatcong 2,410 16,200 establish TMDL 4 01 Lake Musconetcong 314 2,980b establish TMDL 5 01 Swartswood Lake 521 6,410 restoration follow-up 6 02 Clove Acres Lake 28.6 12,500 evaluate impairment
a All of the waterbodies covered under these TMDLs have a FW2 classification. b To avoid "double-counting," watershed area of Lake Musconetcong does not include Lake
Hopatcong and its watershed.

10
Figure 1 Eutrophic lakes in the Northwest Water Region on Sublist 5 of 2002 Integrated List

11
These TMDLs will address a total of 2,930 acres of lakes with a corresponding total of 21,110 acres of land. Traditionally, land use has been dictated by the topography and transportation system of the area. The Upper Delaware Watershed (WMA-01) exhibits an accelerated pattern of growth, especially around its lakes. In spite of the area's relatively low population density and numerous protected lands, these development trends are likely to negatively impact surrounding water quality and quantity. The Department's Geographic Information System (GIS) was used extensively to describe the lakes and lakesheds (watersheds of the lakes), specifically the following data coverages: 1995/97 Land use/Land cover Update, published 12/01/2000 by NJDEP Bureau of
Geographic Information and Analysis , delineated by watershed management area. NJDEP Statewide Lakes (Shapefile) with Name Attributes (from 95/97 Land Use/Land
Cover) in New Jersey, published 7/13/2001 by NJDEP - Bureau of Freshwater and Biological Monitoring, http://www.state.nj.us/dep/gis/digidownload/zips/statewide/njlakes.zip.
Lakesheds were delineated based on 14-digit hydrologic unit code coverage (HUC-14) elevation contours, and 10 meter digital elevation model grids. NJDEP 14 Digit Hydrologic Unit Code delineations (DEPHUC14), published 4/5/2000
by New Jersey Geological Survey, http://www.state.nj.us/dep/gis/digidownload/zips/statewide/dephuc14.zip.
Statewide Elevation Contours (10 Foot Intervals), unpublished, auto-generated from: 7.5 minute Digital Elevation Models, published 7/1/1979 by U.S. Geological Survey.
NJDEP Statewide Elevation Contours (20 Foot Intervals), published 1987 by Bureau of Geographic Information and Analysis (BGIA), http://www.state.nj.us/dep/gis/digidownload/zips/statewide/stcon.zip.
NJDEP 10-meter Digital Elevation Grids, published 06/01/2002 by Bureau of Geographic Information and Analysis (BGIA), delineated by watershed management area.
NJPDES Surface Water Discharges in New Jersey, (1:12,000), published 02/02/2002 by Division of Water Quality (DWQ), Bureau of Point Source Permitting - Region 1 (PSP-R1).
4.1 Cranberry Lake
Cranberry Lake is a 190-acre public lake located in Byram Township, Sussex County, and drains a lakeshed of 1744 acres almost completely within Byram Township. The lakeshed is 9.2 times the area of the lake, making it moderately sized2. The lake consists of two basins, each with numerous coves, separated by a large peninsula (Strawberry Point). Tributaries of Lubber's Run feed both basins. Mean depth (2.13m) and total inflow (3,783,000 m³/yr) were obtained from the Diagnostic Feasibility Study for Cranberry Lake (Coastal Environmental Services, 1992).
2 A lakeshed seven times the area of its lake is considered small, whereas a lakeshed ten times the area of its lake is considered large (Holdren et al, 2001).

12
Cranberry Lake is a shallow lake within the Musconetcong Watershed, having a mean depth of seven feet and a maximum depth of 15 feet. The lakeshed of Cranberry Lake primarily consists of 1,219 acres of forest, or 70 percent of the entire lakeshed. Approximately half of the land adjacent to the lakeshore is used for medium density residential development, while the remainder is undeveloped (forest cover). Cranberry Lake offers fishing and boating services at the northern end of the lake, where there are boat launch areas (including one trailer launch ramp) and a floating dock. Swimming is available at Cranberry Lake Rose Beach and the Cranberry Lake Club House. The lake is known to have a major septic problem, as indicated in the Phase I Inventory of Current EPA Efforts to Protect Ecosystems report. New Jersey received a Clean Lakes Program Phase II Restoration/Implementation grant in 1992 for Cranberry Lake. The ongoing project entails implementation of in-lake restoration work as well as critical nonpoint source pollution control activities. In 2000 the Weaver House Cove dredging project, which required the lake to be lowered five feet, was nearing completion. In 2001 the Cranberry Lake community was battling watermilfoil vegetation with the herbicide SONAR.

13
Figure 2 Lakeshed of Cranberry Lake

14
4.2 Ghost Lake
Ghost Lake is located within Jenny Jump State Forest in Independence Township, Warren County, and drains a lakeshed of 212 acres that extends into parts of Frelinghuysen and Allamuchy Townships. The lakeshed is 11.5 times the area of the lakes, making it somewhat large. Ghost Lake has no tributaries; most of the lake's inflow is comprised of groundwater and surface runoff. Mean depth (1.34m) and total inflow (449,000 m³/yr) were obtained from the Phase 1 Diagnostic / Feasibility Study of Ghost Lake (Princeton Hydro, 2002). This man-made, shallow lake is 18 acres in size and part of the Pequest River Watershed. A narrow band of land separates the larger upper portion of the lake from the much smaller lower portion. The lakeshed is heavily forested and consists of 187 acres of forest (88 percent). However, in the southeast quadrant of the lakeshed, there are two small clusters of low density/rural development, comprising three acres. Ghost Lake offers fishing and boating (car-top launch only) services at the north end of the lake. Although phosphorus loading to Ghost Lake is currently not excessive, a TMDL is being established to ensure that phosphorus levels do not increase in the future and to establish in-lake measures necessary to restore the lake. To that end, the Department plans to implement as appropriate the recommendations in USEPA Clean Lakes Project Phase I Diagnostic/Feasibility Study, dated February 2002.

15
Figure 3 Lakeshed of Ghost Lake
4.3 Lake Hopatcong Lake Hopatcong is a 2,406-acre public lake located on the border of Morris and Sussex counties in the municipalities of Mount Arlington Borough, Hopatcong Borough, Jefferson Township, and Roxbury Township. The lake drains a lakeshed of 16,216 acres within the headwaters of the Musconetcong River Watershed. The lakeshed is 6.7 times the area of the lakes, making it fairly small relative to the size of the lake. Lake Hopatcong is a large, irregularly shaped lake composed of many shallow coves around the perimeter. About 50% of the flow into the lake is provided through headwater tributaries of the Musconetcong River, while groudwater inflow comprises about 25% of the flow. Mean depth (5.5m) and total inflow (39,700,000 m³/yr) were obtained from the Clean Lakes Report for Lake Hopatcong (Princeton Aqua Science, 1983). Lake Hopatcong is the largest freshwater lake in New Jersey and measures 9.5 miles long with a maximum depth of 58 feet. Originally, Hopatcong consisted of two separate lakes, but a dam built in what is now Lake Hopatcong State Park for the Morris Canal Company linked them together in 1837 to form one large lake. Lake Hopatcong was the major source of water

16
for the 90-mile waterway that stretched from Newark to Phillipsburg. (The lake is also currently a designated emergency source of drinking water.) The predominant land uses in this lakeshed consist of 9,671 acres of forest and wetlands (including bodies of water other than Lake Hopatcong) and 3,974 acres urban, or 60% and 25%, respectively. About 90% of the land adjacent to the 40-mile lake shore is developed, with the majority in seasonal and year-round low, medium, and high density residential land uses. An estimated 500,000 visitors use Lake Hopatcong's recreational facilities each year for fishing, boating, swimming, sailing, jet skiing, and passive recreation. The lake is known to have some good size fish, with largemouth bass averaging two to five pounds. However, several of its beaches are impaired for fecal coliform, and nonpoint source pollution into the lake has become a critical problem. The Lake Hopatcong Commission is the entity that has taken control of the lake's improvement and was created in January 2001 under a $3 million startup grant from the State of New Jersey. The Commission’s mandate is to safeguard the lake as a natural, scenic, and recreational resource. Some of the tools available to the Commission to accomplish this mandate are monitoring the lake’s water quality and quantity; evaluating land use impacts; developing plans, strategies, policies, ordinances, and funding mechanisms; conducting lake management projects; and educating the public on how to protect the lake. A major component of the Lake Hopatcong Commission’s protection effort is mechanical harvesting of the overgrowth of aquatic vegetation caused by the influx of phosphorus in the lake. The activity of aquatic plant harvesting began in Lake Hopatcong by the Lake Hopatcong Regional Planning Board and was transferred to the Lake Hopatcong Commission upon its creation. In 2002, the Commission removed over 4.8 million pounds of vegetation from the lake. The Commission has been engaged in a cooperative research effort with the U.S. Geological Survey to conduct a water budget study of Lake Hopatcong. The Commission has initiated plans to address stormwater discharges into Lake Hopatcong, because discharges from such nonpoint sources and catch basins are believed to be a major source of phosphorus in the lake. The Commission also has prepared a geomorphological report describing the Lake Hopatcong area.

17
Figure 4 Lakeshed of Lake Hopatcong

18
4.4 Lake Musconetcong
Lake Musconetcong is a 314-acre public lake located on the border of Morris and Sussex counties in the municipalities of Netcong, Stanhope, Byram and Roxbury. The lake drains an immediate lakeshed of 2,977 acres within the headwaters of the Musconetcong River Watershed. In addition, Lake Hopatcong drains into the immediate Lake Musconetcong lakeshed, adding 12,091 acres to the total lakeshed. Including the Lake Hopatcong lakeshed, the total lakeshed of Lake Musconetcong is 48 times the area of the lakes, making it very large relative to the size of the lake. Over 80% of the total flow into the lake consists of inflow from Lake Hopatcong through the Musconetcong River. Mean depth (1.5m) and total inflow (48,400,000 m³/yr) were obtained from the Diagnostic / Feasibility Study for Lake Musconetcong (Coastal Environmental Services, 1993). By far, the predominant land uses in the Lake Musconetcong lakeshed are forest, with 1,199 acres (40%), and urban, with 1,222 acres (41%). Low and medium density residential land uses surround most of the lakeshore itself. Fishing and boating accommodations are offered at the southern end of Lake Musconetcong. There are several municipal and State park areas on the lake available for fishing, one having a boat launch area. Several dozen private docks, but no public ones, can be found on the lake. Stanhope Beach was dredged several years ago, but it is used for fishing only, due to water conditions. The lake is being aided by two entities, the Musconetcong Regional Planning Board, which advises on land use matters affecting the lake, and the Musconetcong Watershed Association. As a result of the Phase I Clean Lakes project, the area immediately around the lake has been sewered and they have implemented weed harvesting, dredging, and various nonpoint source pollution controls. Lake Musconetcong has received Clean Water Act Section 319(h) funding for best management practices.

19
Figure 5 immediate Lakeshed of Lake Musconetcong
4.5 Swartswood Lake This glacier lake, with a mean depth of 22 feet (deep lake) and a maximum depth of 42 feet, is 505 acres in size and located at Swartswood State Park in the Paulins Kill Watershed. Fishing and boating services are available on the east and south sides of the lake, and a swimming area is located on the border of the eastern shore and the State Park. The Swartwood Lakes and Watershed Association has been involved in stormwater projects funded by the Clean Water Act Section 319(h) grants to improve water quality, such as the recently completed five-unit hypolimnetic aeration system to halt deterioration and save the trout fishery. The lake had been suffering from large growths of aquatic weeds, algae, and low dissolved oxygen in deeper waters. Now that this public lake is being restored as a result of remediation projects involving weed harvesting, aeration, and nonpoint source controls, the Department agrees to follow up on its restoration to determine whether uses are still impaired. Malcolm Pirnie is currently performing a diagnostic/feasibility study of Swartswood Lake.

20
4.6 Clove Acres Lake Clove Acres Lake is located in Wantage Township and Sussex Borough, Sussex County within the Wallkill River Watershed. The initial water quality evaluation for this shallow lake was completed approximately 20 years ago. Subsequently, the dam broke and the 28-acre lake drained. The lake has not been filled for most of the last fifteen years, during which time a limited amount of dredging took place. The dam was rebuilt and, during the summer of 2002, the lake started to refill. The Department will collect information and determine if the new lake is impaired. It should be noted that, based on the previous morphological and hydrological conditions and land use characteristics as of 1995, the Department estimates that the overall nonpoint source load of total phosphorus would have to be reduced by at least 64%. Currently, a consultant Fred Yoerg/Associates has been engaged to begin working on a lake management plan. 5.0 Applicable Surface Water Quality Standards In order to prevent excessive primary productivity and consequent impairment of recreational, water supply and aquatic life designated uses, the Surface Water Quality Standards (SWQS, N.J.A.C. 7:9B) define both numerical and narrative criteria that address eutrophication in lakes due to overfertilization. The total phosphorous (TP) criterion for freshwater lakes at N.J.A.C. 7:9B – 1.14(c)5 reads as follows:
For freshwater 2 classified lakes, Phosphorus as total phosphorus shall not exceed 0.05 mg/l in any lake, pond or reservoir or in a tributary at the point where it enters such bodies of water, except where site-specific criteria are developed to satisfy N.J.A.C. 7:9B-1.5(g)3.
N.J.A.C. 7:9B-1.5(g)3 states:
The Department may establish site-specific water quality criteria for nutrients in lakes, ponds, reservoirs or stream, in addition to or in place of the criteria in N.J.A.C. 7:9B-1.14, when necessary to protect existing or designated uses. Such criteria shall become part of the SWQS.
Presently, no site-specific criteria apply to any of these lakes. Also at N.J.A.C. 7:9B-1.5(g)2, the following is discussed:
Except as due to natural conditions, nutrients shall not be allowed in concentrations that cause objectionable algal densities, nuisance aquatic vegetation, or otherwise render the waters unsuitable for the designated uses.
These TMDLs are designed to meet both numeric and narrative criteria of the SWQS.
21
All of the waterbodies covered under these TMDLs have a FW2 classification. The designated uses, both existing and potential, that have been established by the Department for waters of the State classified as such are as stated below: In all FW2 waters, the designated uses are (N.J.A.C. 7:9B-1.12): 1. Maintenance, migration and propagation of the natural and established aquatic biota; 2. Primary and secondary contact recreation; 3. Industrial and agricultural water supply; 4. Public potable water supply after conventional filtration treatment (a series of processes
including filtration, flocculation, coagulation and sedimentation, resulting in substantial particulate removal but no consistent removal of chemical constituents) and disinfection; and
5. Any other reasonable uses. 6.0 Source Assessment Phosphorus sources were characterized on an annual scale (kg TP/yr). Long-term pollutant loads are typically more critical to overall lake water quality than the load at any particular short-term time period (e.g. day). Storage and recycling mechanisms in the lake, such as luxury uptake and sediments dynamics, allow phosphorus to be used as needed regardless of the rate of delivery to the system. Also, empirical lake models use annual loads rather than daily or monthly loads to estimate in-lake concentrations.
6.1 Assessment of Point Sources other than Stormwater Point sources of phosphorus other than stormwater were identified using the Department's GIS as all Major Municipal (MMJ), Minor Municipal (MMI), and Combined Sewer Overflow (CSO) discharges within each lakeshed. Other types of discharges, such as Industrial, were not included because their contribution, if any, is negligible compared to municipal discharges and runoff from land surfaces. No municipal point sources exist anywhere within the lakesheds of Cranberry Lake or Ghost Lake. One MMI, Arthur Stanlick School, discharges within the Lake Hopatcong lakeshed. The current annual TP load was estimated by multiplying the monthly average TP concentration of 0.314 mg TP/l by the average flow of 0.0014 million gallons per day (MGD), and converting to units of kg/yr. Average flow and concentration were calculated from data submitted to the Department as required in the form of Discharge Monitoring Reports. Similarly, the currently permitted annual TP load was estimated by multiplying the current TP concentration limit of 1.0 mg TP/l by the permitted flow of 0.013 MGD, and converting to units of kg/yr. Since Lake Hopatcong discharges into the Lake Musconetcong lakeshed, the point source was included only indirectly as part of the tributary load into Lake Musconetcong.

22
Table 3 Point Source Phosphorus Loads
Lake NJPDES # Facility Name receiving water
current P load (kg TP/yr)
permitted P load (kg TP/yr)
Lake Hopatcong NJ0021105 Arthur Stanlick School Lake Shawnee 0.6 18.0
6.2 Assessment of Nonpoint Sources and Stormwater Runoff from land surfaces comprises most of the nonpoint and stormwater sources of phosphorus into lakes. Watershed loads for total phosphorus were therefore estimated using the Unit Areal Load (UAL) methodology, which applies pollutant export coefficients obtained from literature sources to the land use patterns within the watershed, as described in USEPA’s Clean Lakes Program guidance manual (Reckhow,1979b). Land use was determined using the Department’s GIS system using the 1995/1997 land use coverage. The Department reviewed phosphorus export coefficients from an extensive database (Appendix B) and selected the land use categories and values shown in Table 4. Table 4 Phosphorus export coefficients (Unit Areal Loads)
land use / land cover LU/LC codes3 UAL (kg TP/ha/yr)
medium / high density residential 1110, 1120, 1150 1.6 low density / rural residential 1130, 1140 0.7 Commercial 1200 2.0 Industrial 1300, 1500 1.7 mixed urban / other urban other urban codes 1.0 Agricultural 2000 1.5 forest, wetland, water 4000, 6000, 5000 0.1 barren land 7000 0.5
Units: 1 hectare (ha) = 2.47 acres 1 kilogram (kg) = 2.2 pounds (lbs) 1 kg/ha/yr = 0.89 lbs/acre/yr
For all lakes in this TMDL document, a UAL of 0.07 kg TP/ha/yr was used to estimate air deposition of phosphorus directly onto the lake surface. This value was developed from statewide mean concentrations of total phosphorus from the New Jersey Air Deposition Network (Eisenreich and Reinfelder, 2001). For Lake Musconetcong, land use runoff loads were only calculated for the immediate watershed downstream of Lake Hopatcong. An additional annual tributary load from Lake Hopatcong into Lake Musconetcong was estimated by multiplying the annual discharge from the lake by the mean phosphorus concentration as calculated under Current Condition in section 7.1 below. Land uses and calculated runoff loading rates for each of the lakes are shown in Table 5. Also included in Table 5 are estimates of loading rates from septic systems and from internal sources (sediment regeneration, macrophyte decomposition, and/or groundwater) developed
3 LU/LC code is an attribute of the land use coverage that provides the Anderson classification code for the land use. The Anderson classification system is a hierarchical system based on four digits. The four digits represent one to four levels of classification, the first digit being the most general and the fourth digit being the most specific description.

23
previously (Coastal Environmental Services, 1992; Princeton Aqua Science, 1983; Coastal Environmental Services, 1993; Princeton Hydro, 2002) for each of the lakes. Table 5 Nonpoint and Stormwater Sources of Phosphorus Loads*
Cranberry Lake Lake HopatcongLake
Musconetcong Ghost Lake Nonpoint Source acres Kg TP/yr acres Kg TP/yr acres Kg TP/yr acres Kg TP/yr
medium / high density residential 156 101 2,790 1,800 759 492 0.0 0.0low density / rural residential 9.0 2.5 423 120 116 32.9 3.2 0.9
commercial 1.5 1.2 237 192 107 86.9 0.0 0.0industrial 0.0 0.0 7.7 5.3 37.1 25.6 0.0 0.0
mixed urban / other urban 0.0 0.0 521 211 207 83.7 0.0 0.0agricultural 0.4 0.2 0 0 0.9 0.5 0.4 0.3
forest, wetland, water 1,380 55.9 9,670 391 1,360 55.2 190 7.7barren land 6.8 1.4 165 33.3 72.6 14.7 0.0 0.0
Direct air deposition on lake surface 190 5.4 2,410 68.2 314 8.9 18.3 0.5septic systems n/a 731 n/a 1,600 n/a n/a
internal load n/a 104 n/a 595 n/a 151 n/a 12.4tributary load n/a n/a n/a 1,240 n/a
TOTAL 1,740 1,000 16,200 5,020 2,980 2,190 211 21.8 * all figures rounded to not more than three significant digits
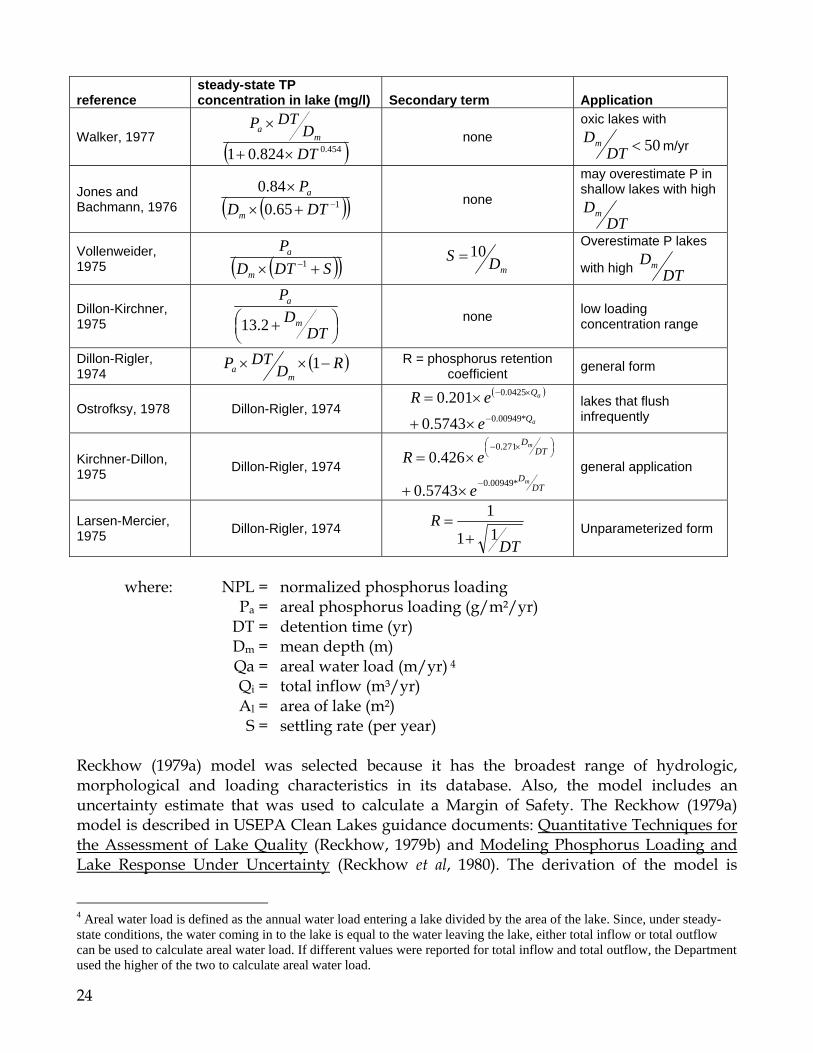
7.0 Water Quality Analysis Empirical models were used to relate annual phosphorus load and steady-state in-lake concentration of total phosphorus. These empirical models consist of equations derived from simplified mass balances that have been fitted to large datasets of actual lake measurements. The resulting regressions can be applied to lakes that fit within the range of hydrology, morphology and loading of the lakes in the model database. The Department surveyed the commonly used models in Table 6. Table 6 Empirical models considered by the Department
reference steady-state TP concentration in lake (mg/l) Secondary term Application
Rast, Jones and Lee, 1983
81.081.1 NPL× ⎟⎟⎟
⎠
⎞
⎜⎜⎜
⎝
⎛
+
×=
DTD
DTPNPL m
a
1 expanded database of
mostly large lakes
Vollenweider and Kerekes, 1982
87.022.1 NPL× ⎟⎟⎟
⎠
⎞
⎜⎜⎜
⎝
⎛
+
×=
DTD
DTPNPL m
a
1 mostly large natural
lakes
Reckhow, 1980 2.13
aP none Upper bound for closed
lake
Reckhow, 1979a ( )a
a
QP
×+ 2.16.11
l
ia A
QQ =
General north temperate lakes, wide range of loading concentration, areal loading, and water load
24
reference steady-state TP concentration in lake (mg/l) Secondary term Application
Walker, 1977 ( )454.0824.01 DT
DDTP
ma
×+
× none
oxic lakes with
50<DTDm m/yr
Jones and Bachmann, 1976 ( )( )165.0
84.0−+×
×DTD
P
m
a none
may overestimate P in shallow lakes with high
DTDm
Vollenweider, 1975 ( )( )SDTD
P
m
a
+× −1 mDS 10=
Overestimate P lakes
with high DTDm
Dillon-Kirchner, 1975 ⎟
⎠⎞⎜
⎝⎛ + DT
DP
m
a
2.13
none low loading concentration range
Dillon-Rigler, 1974
( )RDDTP
ma −×× 1 R = phosphorus retention
coefficient general form
Ostrofksy, 1978 Dillon-Rigler, 1974 ( )
a
a
Q
Q
e
eR*00949.0
0425.0
5743.0
201.0−
×−
×+
×= lakes that flush
infrequently
Kirchner-Dillon, 1975 Dillon-Rigler, 1974
DTD
DTD
m
m
e
eR*00949.0
271.0
5743.0
426.0−
⎟⎠⎞⎜
⎝⎛ ×−
×+
×= general application
Larsen-Mercier, 1975 Dillon-Rigler, 1974
DTR
11
1
+= Unparameterized form
where: NPL = normalized phosphorus loading Pa = areal phosphorus loading (g/m²/yr) DT = detention time (yr) Dm = mean depth (m) Qa = areal water load (m/yr) 4 Qi = total inflow (m³/yr) Al = area of lake (m²) S = settling rate (per year)
Reckhow (1979a) model was selected because it has the broadest range of hydrologic, morphological and loading characteristics in its database. Also, the model includes an uncertainty estimate that was used to calculate a Margin of Safety. The Reckhow (1979a) model is described in USEPA Clean Lakes guidance documents: Quantitative Techniques for the Assessment of Lake Quality (Reckhow, 1979b) and Modeling Phosphorus Loading and Lake Response Under Uncertainty (Reckhow et al, 1980). The derivation of the model is
4 Areal water load is defined as the annual water load entering a lake divided by the area of the lake. Since, under steady-state conditions, the water coming in to the lake is equal to the water leaving the lake, either total inflow or total outflow can be used to calculate areal water load. If different values were reported for total inflow and total outflow, the Department used the higher of the two to calculate areal water load.

25
summarized in Appendix C. The model relates TP load to steady state TP concentration, and is generally applicable to north temperate lakes, which exhibit the following ranges of characteristics (see Symbol definitions after Table 5): phosphorus concentration: 0.004 < P < 0.135 mg/l average influent phosphorus concentration: Pa*DT/Dm < 0.298 mg/l areal water load: 0.75 < Qa < 187 m/yr areal phosphorus load: 0.07 < Pa < 31.4 g/m²/yr For comparison, Table 7 below summarizes the characteristics for each lake based on their current and target conditions as described below. While the target concentration for each lake (section 7) is well within the range, the areal phosphorus load provides a better representation of a lake's intrinsic loading characteristics. Also, it is the model's prediction of target condition that is being used to calculate the TMDL; if current loads are higher than the range that can produce reliable model results, this has no affect on the model's reliability to predict target condition under reduced loads. It should also be noted that no attempt was made to recalibrate the Reckhow (1979a) model for lakes in New Jersey or in this Water Region, since sufficient lake data were not available to make comparisons with model predictions of steady-state in-lake concentration of total phosphorus. The model was already calibrated to the dataset on which it is based, and is generally applicable to north temperate lakes that exhibit the range of characteristics listed previously. Table 7 Hydrologic and loading characteristics of lakes
Lake
Current Avg Influent [TP] (mg/l)
Target Avg Influent [TP] (mg/l)
Current Areal TP load
(g/m²/yr)
Target Areal TP load
(g/m²/yr) Areal Water
Load (m/year)Cranberry Lake 0.265 0.071 1.31 0.35 4.9Ghost Lake 0.049 0.049 0.19 0.19 6.0Lake Hopatcong 0.126 0.080 0.52 0.33 4.1Lake Musconetcong 0.045 0.030 1.73 1.14 38.1
7.1 Current Condition
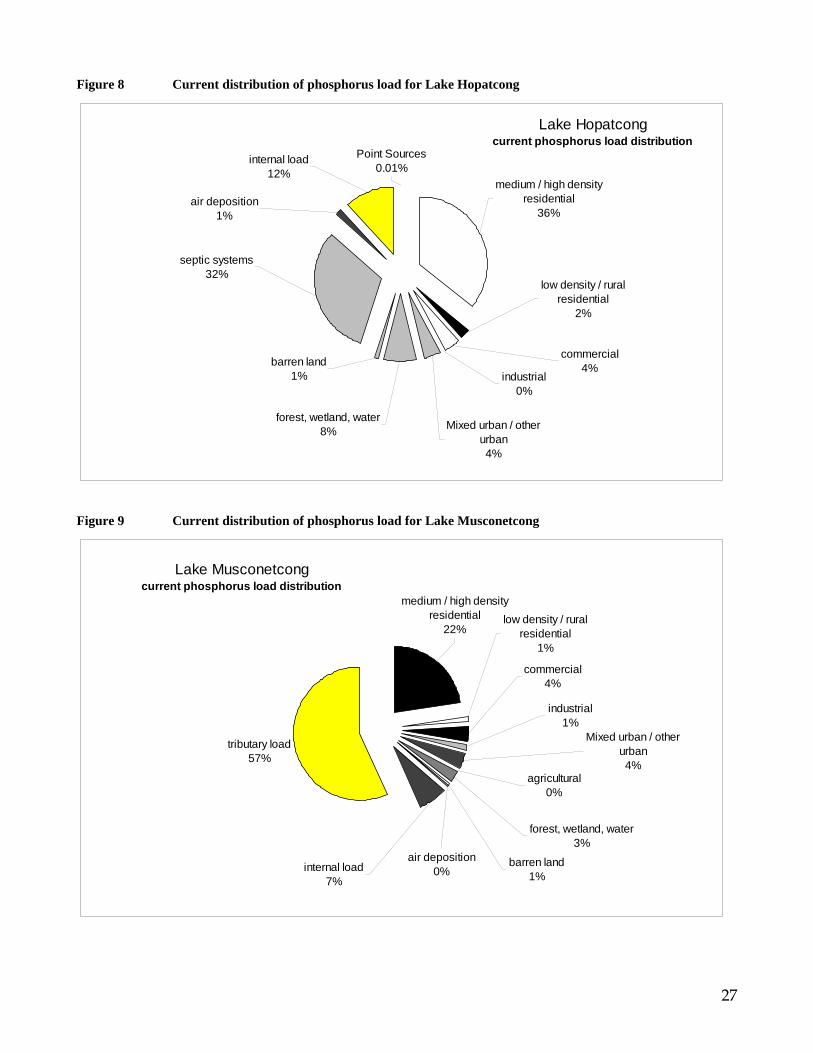
Using these estimated physical parameters and current loads, the predicted steady-state phosphorus concentration of each lake was calculated using the Reckhow (1979a) formulation and listed in Table 8. The current phosphorus load distribution for each lake is shown in Figures 6 to 9 below.

26
Figure 6 Current distribution of phosphorus load for Cranberry Lake
Cranberry Lakecurrent phosphorus load distribution
medium / high density residential
10%internal load10%
forest, wetland, water6%
agricultural0%
commercial0%
barren land0%
septic systems73%
air deposition1%
low density / rural residential
0%
Figure 7 Current distribution of phosphorus load for Ghost Lake
Ghost Lakecurrent phosphorus load distribution
low density / rural residential
4%agricultural
1%
internal load20%
air deposition2%
forest, wetland, water35%
groundwater load38%
27
Figure 8 Current distribution of phosphorus load for Lake Hopatcong
Lake Hopatcongcurrent phosphorus load distribution
internal load12%
Point Sources0.01%
septic systems32%
air deposition1%
medium / high density residential
36%
industrial0%
commercial4%
low density / rural residential
2%
Mixed urban / other urban4%
forest, wetland, water8%
barren land1%
Figure 9 Current distribution of phosphorus load for Lake Musconetcong
Lake Musconetcongcurrent phosphorus load distribution
tributary load57%
barren land1%
forest, wetland, water3%
agricultural0%
commercial4%
industrial1%
Mixed urban / other urban4%
low density / rural residential
1%
internal load7%
air deposition0%
medium / high density residential
22%

28
7.2 Reference Condition A reference condition for each lake was estimated by calculating external loads as if the land use throughout the lakeshed were completely forest and wetlands. Using the same physical parameters and external loads from forest and wetlands, a reference steady-state phosphorus concentration was calculated for each lake using the Reckhow (1979a) formulation and listed in Table 8.
7.3 Seasonal Variation/Critical Conditions These TMDLs will attain applicable surface water quality standards year round. The Reckhow model predicts steady-state phosphorus concentration. To account for data variability, the Department generally interprets threshold criteria as greater than 10% exceedance for the purpose of defining impaired waterbodies. Data from two lakes in New Jersey for which the Department had ready access to data (Strawbridge Lake, NJDEP 2000a; Sylvan Lake, NJDEP 2000b) exhibit peak (based on the 90th percentile) to mean ratios of 1.56 and 1.48, resulting in target phosphorus concentrations of 0.032 and 0.034 mg TP/l, respectively. Since the peak to mean ratios were close and the target concentration not very sensitive to differences in peak to mean ratios, the Department determined that a target phosphorus concentration of 0.03 mg TP/l is reasonably conservative. The seasonal variation was therefore assumed to be 67%, resulting in a target phosphorus concentration of 0.03 mg TP/l. Since it is the annual pollutant load rather than the load at any particular time that determines overall lake water quality (section 6), the target phosphorus concentration of 0.03 mg TP/l accounts for critical conditions.
7.4 Margin of Safety A Margin of Safety (MOS) is provided to account for “lack of knowledge concerning the relationship between effluent limitations and water quality.” (40 CFR 130.7(c)). A MOS is required in order to account for uncertainty in the loading estimates, physical parameters and the model itself. The margin of safety, as described in USEPA guidance (Sutfin, 2002), can be either explicit or implicit (i.e., addressed through conservative assumptions used in establishing the TMDL). For these TMDL calculations, an implicit as well as explicit Margin of Safety (MOS) is provided. These TMDLs contain an implicit margin of safety by using conservative critical conditions, over-estimated loads, and total phosphorus. Each conservative assumption is further explained below. Critical conditions are accounted by comparing peak concentrations to mean concentrations and adjusting the target concentration accordingly (0.03 mg TP/l instead of 0.05 mg TP/l). In addition to the conservative approach used for critical conditions, the land use export methodology does not account for the distance between the land use and the lake, which will result in phosphorus reduction due to adsorption onto land surfaces and in-stream kinetic processes. Furthermore, the lakesheds are based on topography without accounting for the

29
diversion of stormwater from lakes, which is common in urban areas. Neither are any reductions assumed due to the addition of lakeside vegetative buffer construction or other management practices aimed at minimizing phosphorus loads. Finally, the use of total phosphorus, as both the endpoint for the standard and in the loading estimates, is a conservative assumption. Use of total phosphorous does not distinguish readily between dissolved orthophosphorus, which is available for algal growth, and unavailable forms of phosphorus (e.g. particulate). While many forms of phosphorus are converted into orthophosphorus in the lake, many are captured in the sediment, for instance, and never made available for algal uptake. In addition to the multiple conservative assumptions built in to the calculation, an additional explicit margin of safety was included to account for the uncertainty in the model itself. As described in Reckhow et al (1980), the Reckhow (1979a) model has an associated standard error of 0.128, calculated on log-transformed predictions of phosphorus concentrations. Transforming the terms in the model error analysis from Reckhow et al (1980) yields the following (Appendix D):
( )( ) ( )1105.4*11 128.0 −×−= ρpMoS ,
where: MoSp = margin of safety as a percentage over the predicted phosphorus concentration;
ρ = the probability that the real phosphorus concentration is less than or equal to the predicted phosphorus concentration plus the margin of safety as a concentration.
Setting the probability to 90% yields a margin of safety of 51% when expressed as a percentage over predicted phosphorus concentration or estimated external load. The external load for each lake was therefore multiplied by 1.51 to calculate an "upper bound" estimate of steady-state phosphorus concentration. An additional explicit margin of safety was included in the analyses by setting the upper bound calculations equal to the target phosphorus concentration of 0.3 mg TP/l, as described in the next section and shown in Table 8. Note that the explicit Margin of Safety is equal to 51% when expressed as a percentage over the predicted phosphorus concentration; when expressed as a percentage of total loading capacity, the Margin of Safety is equal to 34%:
( ) ⎟⎟⎠
⎞⎜⎜⎝
⎛==
+=
×+
×= 34.0
51.151.0
1 p
p
p
plc MoS
MoSPMoSP
PMoSMoS ,
where: MoSp = margin of safety expressed as a percentage over the predicted phosphorus concentration or external load;
MoSlc = margin of safety as a percentage of total loading capacity; P = predicted phosphorus concentration (or external load).

30
7.5 Target Condition As discussed above, the current steady state concentration of phosphorus in each lake must be reduced to a steady state concentration of 0.03 mg/l to avoid exceeding the 0.05 mg/l phosphorus criterion. Using the Reckhow (1979a) formulation, the target conditions were calculated by reducing the loads as necessary to make the upper bound predictions (which incorporate the Margin of Safety) equal to the target phosphorus concentration of 0.03 mg TP/l. The target condition for Ghost Lake was set equal to the current condition, since the upper bound prediction assuming current loads is already less than the target phosphorus concentration of 0.03 mg TP/l. The target condition for Lake Hopatcong was used to calculate the tributary load for the target condition of Lake Musconetcong. Overall reductions necessary to attain the target steady state concentration of total phosphorus in each lake were calculated by comparing the current condition to the target condition (Table 8). Table 8 Current condition, reference condition, target condition and overall percent reduction for each lake
Lake
current condition [TP] (mg/l)
reference condition [TP] (mg/l)
upper bound target condition
[TP] (mg/l)
target condition [TP] (mg/l)
% overall TP load
reduction Cranberry Lake 0.075 0.005 0.030 0.020 73%Ghost Lake 0.016 0.006 0.024 0.016 0%Lake Hopatcong 0.031 0.004 0.030 0.020 36%Lake Musconetcong 0.030 0.011 0.030 0.020 34% 8.0 TMDL Calculations
8.1 Loading Capacity The Reckhow (1979a) model was used to solve for loading rate given the upper bound target concentration of 0.03 mg/l (which incorporates the Margin of Safety). Reducing the current loading rates by the percentages in Table 8 yields the same results. The acceptable loading capacity for each lake is provided in Table 10.
8.2 Reserve Capacity Reserve capacity is an optional means of reserving a portion of the loading capacity to allow for future growth. Reserve capacities are not included at this time. Therefore, the loading capacities and accompanying WLAs and LAs must be attained in consideration of any new sources that may accompany future development. The primary means by which future growth could increase phosphorus load is through the development of forest land within the lakesheds. The implementation plan includes the development of Lake Restoration Plans that require the collection of more detailed information about each lakeshed. If the development of forest with the watershed of a particular lake is planned, the issue of reserve capacity to account for the additional runoff load of phosphorus may be revisited.

31
8.3 Allocations USEPA regulations at 40 CFR § 130.2(i), state that “pollutant loadings may be expressed in terms of either mass per time, toxicity, or other appropriate measure.” For lake nutrient TMDLs, it is appropriate to express the TMDL on a yearly basis. Long-term average pollutant loadings are typically more critical to overall lake water quality due to the storage and recycling mechanisms in the lake. Also, most available empirical lake models, such as the Reckhow model used in this analysis, use annual loads rather than daily loads to estimate in-lake concentrations. The TMDLs for total phosphorus are therefore calculated as follows (Table 10): TMDL = loading capacity = Sum of the wasteload allocations (WLAs) + load allocations (LAs) + margin of
safety + reserve capacity. WLAs are hereby established for all NJPDES-regulated point sources within each source category, while LAs are established for stormwater sources that are not subject to NJPDES regulation and for all nonpoint sources. This distribution of loading capacity between WLAs and LAs is consistent with recent EPA guidance that clarifies existing regulatory requirements for establishing WLAs for stormwater discharges (Wayland, November 2002). Stormwater discharges are captured within the runoff sources quantified according to land use, as described previously. Distinguishing between regulated and unregulated stormwater is necessary in order to express WLAs and LAs numerically; however, "EPA recognizes that these allocations might be fairly rudimentary because of data limitations and variability within the system." (Wayland, November 2002, p.1) While the Department does not have the data to actually delineate lakesheds according to stormwater drainage areas subject to NJPDES regulation, the land use runoff categories previously defined can be used to estimate between them. Therefore allocations are established according to source categories as shown in Table 9. This demarcation between WLAs and LAs based on land use source categories is not perfect, but it represents the best estimate defined as narrowly as data allow. The Department acknowledges that there may be stormwater sources in the residential, commercial, industrial and mixed urban runoff source categories that are not NJPDES-regulated. Nothing in these TMDLs, including Table 9, shall be construed to require the Department to regulate a stormwater source under NJPDES that would not already be regulated as such, nor shall anything in these TMDLs be construed to prevent the Department from regulating a stormwater source under NJPDES. WLAs are hereby established for all NJPDES-regulated point sources, including stormwater, according to their source category. Quantifying WLAs and LAs according to source categories provides the best estimation defined as narrowly as data allow. However it is clearly noted that WLAs are hereby established for all NJPDES-regulated point sources within each source category, while LAs are established for stormwater sources that are not subject to NJPDES regulation and for all nonpoint sources. The WLAs and LAs in Table 9 are not themselves "Additional Measures" under proposed N.J.A.C. 7:14A-25.6 or 25.8.

32
Table 9 Distribution of WLAs and LAs among source categories
Source category TMDL allocation Point Sources other than Stormwater WLA Nonpoint and Stormwater Sources
medium / high density residential WLA low density / rural residential WLA
commercial WLA industrial WLA
Mixed urban / other urban WLA agricultural LA
forest, wetland, water LA barren land LA
air deposition onto lake surface LA septic systems LA
internal load LA tributary load LA
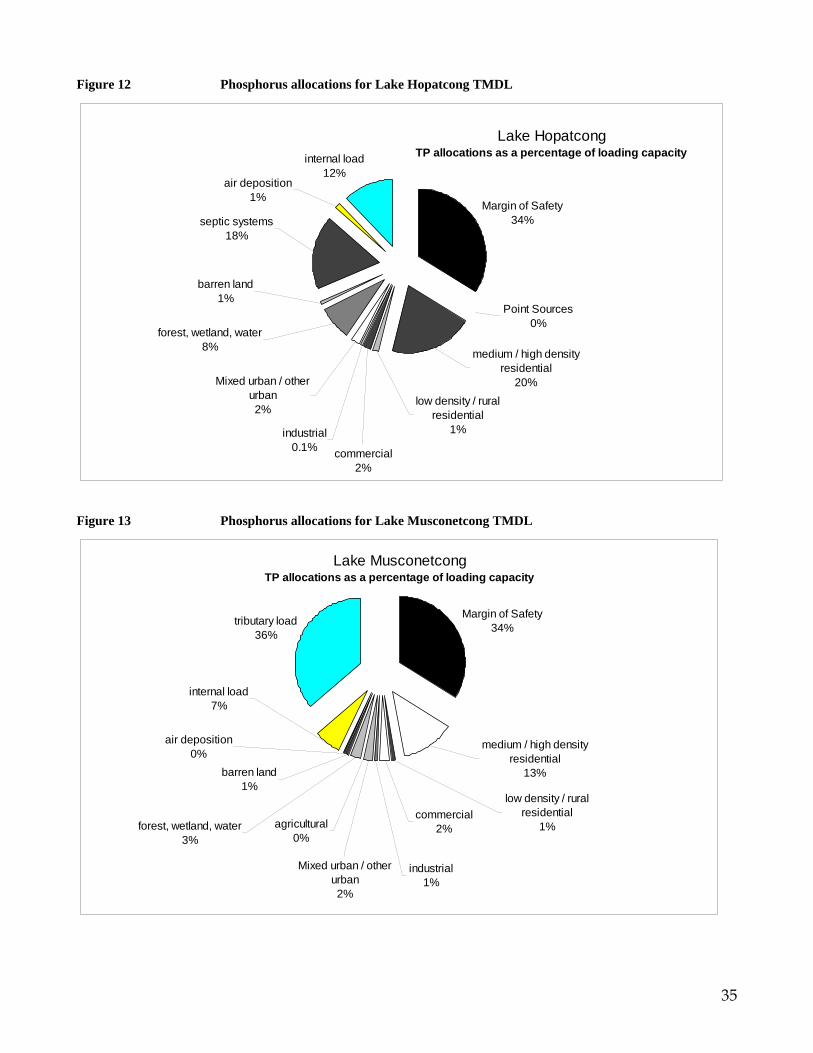
In order to attain the TMDLs, the overall load reductions shown in Table 8, or those determined through additional monitoring, must be achieved. Since loading rates have been defined for at least eight source categories, countless combinations of source reductions could be used to achieve the overall reduction target. The selected scenarios focus on land use and septic sources that can be affected by BMP implementation or NJPDES regulation, requiring equal percent reductions from each in order to achieve the necessary overall load reduction (Table 10). The Lake Restoration Plans developed for each lake as part of the TMDL implementation (section 10) may revisit the distribution of reductions among the various sources in order to better reflect actual implementation projects. The resulting TMDLs, rounded to two significant digits, are shown in Table 10 and illustrated in Figures 10 to 13. The WLA of 5.5 kg TP/yr for Arthur Stanlick School was calculated by multiplying the current TP concentration limit of 1.0 mg TP/l by the 20-year planned flow of 0.004 MGD, and converting to units of kg/yr. This WLA represents about a 70% decrease from currently permitted annual TP load of 18 kg/yr; however, the actual current annual TP load is only 0.6 kg/yr (section 6.1). Since the WLA represents only 0.1% of the loading capacity for Lake Hopatcong, reduction of the currently permitted concentration limit is not justified. However a WLA was established for this facility in order to prevent the source from becoming significant by incorporating the 20-year planned flow into the next permit. The resulting TMDLs, rounded to two significant digits, are shown in Table 10 and illustrated in Figures 10 to 13.

33
Table 10 TMDL calculations for each lake (annual loads and percent reductionsa)
Cranberry Lake Ghost Lake lake kg TP/yr % of LC %
reduction kg TP/yr % of LC %
reduction loading capacity (LC) 400 100% n/a 33 100% n/a
Point Sources other than Stormwater n/a n/a
Nonpoint and Stormwater Sources
medium / high density residential 12 3.0% 88% 0.00 0.0% n/alow density / rural residential 0.30 0.08% 88% 0.91 2.8% 0%
commercial 0.15 0.04% 88% 0.00 0.0% n/aindustrial 0.00 0.00% n/a 0.00 0.0% n/a
Mixed urban / other urban 0.00 0.00% n/a 0.00 0.0% n/aagricultural 0.23 0.06% 0% 0.27 0.81% 0%
forest, wetland, water 56 14% 0% 7.7 23% 0%barren land 1.4 0.34% 0% 0.00 0.0% n/a
air deposition onto lake surface 5.4 1.3% 0% 0.52 1.6% 0%septic systems 87 22% 88%
internal load 100 26% 0% 12 38% 0%Other Allocations
explicit Margin of Safety 140 34% n/a 11 34% n/aReserve Capacity n/a n/a
Lake Hopatcong Lake Musconetcong lake kg TP/yr % of LC
% reduction kg TP/yr % of LC
% reduction
loading capacity (LC) 4800 100% n/a 2200 100% n/aPoint Sources other than Stormwater
5.5 0.11% 69%b n/a
Nonpoint and Stormwater Sources
medium / high density residential 960 20% 47% 290 13% 41%low density / rural residential 64 1.3% 47% 20 0.89% 41%
commercial 100 2.1% 47% 52 2.4% 41%industrial 2.8 0.06% 47% 15 0.69% 41%
Mixed urban / other urban 110 2.3% 47% 50 2.3% 41%agricultural 0.0 0.0% n/a 0.52 0.02% 0%
forest, wetland, water 390 8.1% 0% 55 2.5% 0%barren land 33 0.69% 0% 15 0.67% 0%
air deposition onto lake surface 68 1.4% 0% 8.9 0.41% 0%septic systems 850 18% 47% n/a
internal load 600 12% 0% 150 6.9% 0%tributary load n/a 790 36% 36%
Other Allocations explicit Margin of Safety 1600 34% n/a 740 34% n/a
Reserve Capacity n/a n/a a Percent reductions shown for individual sources are necessary to achieve overall reductions in
Table 7. b Percent reduction for point source is compared to currently permitted annual load, not actual
current load.

34
Figure 10 Phosphorus allocations for Cranberry Lake TMDL
Cranberry LakeTP allocations as a percentage of loading capacity
Margin of Safety34%
air deposition1%
internal load26%
agricultural0%
commercial0%
low density / rural residential
0%
forest, wetland, water14%
barren land0%
septic systems22%
medium / high density residential
3%
Figure 11 Phosphorus allocations for Ghost Lake
Ghost LakeTP allocations as a percentage of loading capacity
Margin of Safety34%
low density / rural residential
3%
air deposition2% forest, wetland, water
23%
agricultural1%
internal load13%
groundwater load24%
35
Figure 12 Phosphorus allocations for Lake Hopatcong TMDL
Lake HopatcongTP allocations as a percentage of loading capacityinternal load
12%
Margin of Safety34%
air deposition1%
barren land1%
septic systems18%
Point Sources0%
commercial2%
low density / rural residential
1%
medium / high density residential
20%
industrial0.1%
Mixed urban / other urban2%
forest, wetland, water8%
Figure 13 Phosphorus allocations for Lake Musconetcong TMDL
Lake MusconetcongTP allocations as a percentage of loading capacity
Margin of Safety34%tributary load
36%
internal load7%
barren land1%
air deposition0%
medium / high density residential
13%
industrial1%
commercial2%
low density / rural residential
1%
Mixed urban / other urban2%
agricultural0%
forest, wetland, water3%

36
9.0 Follow-up Monitoring In order to track effectiveness of remediation measures (including TMDLs) and to develop baseline and trend information on lakes, the Department will augment its ambient monitoring program to include lakes on a rotating schedule. The details of a new Lakes Monitoring Network will be published by December 31, 2003. Lakes for which remediation measures have been performed will be given top priority on whatever rotating schedule is developed. Follow-up monitoring will include evaluations (qualitative using a field index or quantitative) of algal blooms (presence, severity, extent) and aquatic vegetation (density, extent, diversity). Measurements such as secchi depths, nutrient concentrations, and chlorophyll-a will be included, in addition to dissolved oxygen, temperature and pH profiles. Basic hydrologic and morphometric information will be measured as necessary to obtain current data, including discharge and bathymetry. The details as to what data will be collected by the Lakes Monitoring Network will be included in the network description. 10.0 Implementation The next steps toward implementation are preparation of lake characterizations and lake restoration plans, where they have not already been developed. In the development of these plans, the loads by source will be revised, as necessary, to reflect refinements in source contributions. It will be on the basis of refined source estimates that specific strategies for reduction will be developed. These will consider issues such as cost and feasibility when specifying the reduction target for any source or source type. As appropriate, WLAs or other measures to be applied to traditional or stormwater point sources through NJPDES permits will be adopted by the Department as amendments to the applicable areawide Water Quality Management Plan. The Department recognizes that TMDLs alone are not sufficient to restore eutrophic lakes. The TMDL establishes the required nutrient reduction targets and provides the regulatory framework to effect those reductions. However, the nutrient load only affects the eutrophication potential of a lake. The implementation plan therefore calls for the collection of additional monitoring data and the development of a Lake Restoration Plan for each lake. The plans will consider in-lake measures that need to be taken to supplement the nutrient reduction measures required by the TMDL. In addition, the plans will consider the ecology of the lake and adjust the eutrophication indicator target as necessary to protect the designated uses. For instance, with the exception of Lake Hopatcong, all of these lakes are shallow lakes, as defined by having a mean depth less than 3 meters. Even Lake Hopatcong includes many basins that behave like shallow lakes, such as Woodport Bay. For a lake to be shallow means that most of the lake volume is within the photic zone and therefore more able to support aquatic plant growth (Holdren et al, 2001). Shallow lakes are generally characterized by either

37
abundant submerged macrophytes and clear water or by abundant phytoplankton and turbid water. From an aquatic life and biodiversity perspective, it is desirable for shallow lakes to be dominated by aquatic plants rather than algae, especially phytoplankton. While lower nutrient concentrations favor the clear/plant state, either state can persist over a wide range of nutrient concentrations. Shallow lakes have ecological stabilizing mechanisms that tend to resist switches from clear/plant state to turbid/algae state, and vice-versa. The clear/plant state is more stable at lower nutrient concentrations and irreversible at very low nutrient concentrations; the turbid/algae state is more stable at higher nutrient concentrations. The Lake Restoration Plans for each lake will need to consider the ecological nuances of shallow and deep lakes. The State of New Jersey has adopted a watershed approach to water quality management. That plan divides the state into five watershed management regions, one of which is the Northwest Region. The Department recognizes that lake restoration requires a watershed approach. Lake Restoration Plans will be used as a basis to address overfertilization and sedimentation issues in watersheds that drain to these sensitive lakes. In addition, the Department will direct research funds to understand and demonstrate biomanipulation and other techniques that can be applied in New Jersey lakes to promote the establishment of healthy and diverse aquatic plant communities in shallow lakes. Finally, public education efforts will focus on the benefits of aquatic plants in shallow lakes and the balance of aquatic life uses with recreational uses of these lakes. With the combination of New Jersey’s strong commitment to the collection and use of high quality data to support environmental decisions and regulatory programs, including TMDLs, the Department is reasonably assured compliance with the total phosphorus criteria applicable to these eutrophic lakes.
10.1 Lake Characterization Additional monitoring may be performed in order to develop the Lake Restoration Plans to implement these TMDLs. The level of characterization necessary to plan restoration will be specific to individual lakes depending on the remedial options being considered. During at least one or two summer trips, the following information may be collected as necessary. • for shallow lakes, vegetation mapping using shore to center transects, measuring density
and composition (emergents, rooted floaters, submergents, free-floating plants, submerged macro-algae)
• 1-5 mid-lake sampling stations as needed to characterize the lake o at least 2 samples per station per day; min 4 samples per trip o secchi depths
• chemistry (nutrients, chlorophyll-a, etc.) o surface, metalimnion, hypolimnion, and bottom if stratified o otherwise surface and bottom
• biology (integrated sample from mixed surface layer) o algal abundance and composition (greens, diatoms, blue-greens) o zooplankton abundance, composition and size ranges
• DO, temperature and pH profiles (hourly throughout day)

38
Where necessary, flow and water quality measurements of influent and effluent streams will be taken periodically from Spring to Fall, and fish abundance and composition will be assessed in early autumn. The schedules for lake characterization and development of Lake Restoration Plans to implement these TMDLs are provided in Table 11. Table 11 Implementation Schedule
Lake Lake Characterization Lake Restoration Plan Cranberry Lakea Summer 2004 Spring 2005 Ghost Lakeb Completed 2000 and 2001 Completed February 2002 Lake Hopatcong Summer 2003 Spring 2004 Lake Musconetcong Summer 2003 Spring 2004 a While Phase 2 remediation of Cranberry Lake is already underway, the TMDL implementation will focus on
how successful the nutrient reduction efforts have been, and what additional measures are necessary to restore the lake.
b The Diagnostic / Feasibility study for Ghost Lake (Princeton Hydro, 2002) fulfills the TMDL requirements for lake characterization and lake restoration planning. While nutrient reductions are not required, the report specifies a management plan to restore the lake, including biomanipulation through fishery management.
10.2 Reasonable Assurance
Reasonable assurance for the implementation of these TMDLs has been considered for point and nonpoint sources for which phosphorus load reductions are necessary. These TMDLs obligate the Department to routinely monitor lake water quality as well as characterize and develop specific restoration plan for these particular lakes according to the schedule in Table 11. Moreover, stormwater sources for which WLAs have been established will be regulated as NJPDES point sources. With the implementation of follow-up monitoring and development of Lake Restoration Plans through watershed management process, the Department is reasonably assured that New Jersey’s Surface Water Quality Standards will be attained for these lakes. Activities directed in the watersheds to reduce nutrient loadings shall include a whole host of options, included but not limited to education projects that teach best management practices, approval of projects funded by CWA Section 319 Nonpoint Source (NPS) Grants, recommendations for municipal ordinances regarding feeding of wildlife, and pooper-scooper laws, and stormwater control measures. 11.0 Public Participation Presently, the Upper Delaware Watershed public participation process is being managed by the Department under a contract with the North Jersey Resource Conservation and Development Council. It is comprised of the Project Work Group, an Action Now Committee, an Education and Outreach Committee, an Open Space and Farmland Preservation Committee, and a Characterization and Assessment Committee. It holds regular meetings and relies on its diverse partners and the general public to work on

39
watershed tasks and issues. In June 2002 the Department gave a presentation to the Upper Delaware Watershed Project Work Group on the New Jersey 2002 Integrated List of Waterbodies and the Water Quality Monitoring and Assessment Methodology, and also encouraged submittal of any comments. In accordance with N.J.A.C. 7:15–7.2(g), these TMDLs are hereby proposed by the Department as an amendment to the Upper Delaware Water Quality Management Plan, Northeast Water Quality Management Plan, Upper Raritan Water Quality Management Plan, and Sussex County Water Quality Management Plan. N.J.A.C. 7:15-3.4(g)5 states that when the Department proposes to amend the areawide plan on its own initiative, the Department shall give public notice by publication in a newspaper of general circulation in the planning area, shall send copies of the public notice to the applicable designated planning agency, if any, and may hold a public hearing or request written statements of consent as if the Department were an applicant. The public notice shall also be published in the New Jersey Register. Notice of these TMDLs was published January 21, 2003 pursuant to the above noted Administrative Code, in order to provide the public an opportunity to review the TMDLs and submit comments. The Department has determined that due to the level of interest in these TMDLs, a public hearing will be held. Public notice of the hearing, provided at least 30 days before the hearing, was published in the New Jersey Register and in two newspapers of general circulation and will be mailed to the applicable designated planning agency, if any, and to each party, if any, who was requested to issue written statement of consents for the amendment. All comments received during the public notice period and at any public hearings will become part of the record for these TMDLs. All comments will be considered in the establishment of these TMDLs and the ultimate adoption of these TMDLs. When the Department takes final agency action to establish these TMDLs, the final decision and supporting documentation will be sent to U.S.E.P.A. Region 2 for review and approval pursuant to 303(d) of the Clean Water Act (33 U.S.C. 1313(d)) and 40 CFR 130.7.

40
Appendix A: References Annadotter, H., G. Cronberg, R. Aagren, B. Lundstedt, P.-A. Nilsson and S. Ströbeck, 1999. Multiple techniques for lake restoration. Hydrobiologia 395/396:77-85. Birch, S. and J. McCaskie, 1999. Shallow urban lakes: a challenge for lake management. Hydrobiologia 395/396:365-377. Center for Watershed Protection, 2001. Watershed Protection Techniques: Urban Lake Management. T.R. Schueler, Ed.in Chief. Ellicott City, MD. www.cwp.org. Cirello, J., J.D. Koppen, S.J. Souza, R. Conner, D. Dorfman, M.A. Foote. 1983. Phase 1: Diagnostic-Feasibility Study of Greenwood Lake, New Jersey and New York. Princeton Aqua Science. Coastal Environmental Services, Inc. 1993. Diagnostic / Feasibility Study of Lake Musconetcong, Sussex/Morris Counties, New Jersey. Prepared for Lake Musconetcong Regional Planning Board, Stanhope, New Jersey. Coastal Environmental Services, Inc. 1992. Cranberry Lake Diagnostic Feasibility Study. Prepared for Township of Byram, Stanhope, New Jersey. Cooke, G.D., P. Lombardo and C. Brant, 2001. Shallow and deep lakes: determining successful maangement options. Lakeline, Spring 2001, 42-46. CH2MHILL (2000) PLOAD Version 3.0 An Arc View GIS Tool to calculate Nonpoint Sources of Pollution in Watershed and Stomwater projects, CH2MHILL, Herndon, VA Cooke, G.D., E.B. Welch, S.A. Peterson, P.R. Newroth. 1993. Restoration and Management of Lakes and Reservoirs. Lewis Publishers. Dillon, P.J. and F.H. Rigler, 1974. A test of a simple nutrient budget model predicting the phosphorus concentration in lake water. J. Fish. Res. Board Can. 31:1771-1778. Donabaum, K., M. Schagerl and M.T. Dokulil, 1999. Integrated management to restore macrophyte domination. Hydrobiologia 395/396:87-97. Eisenreich, S.J. and J. Reinfelder. 2001. The New Jersey Air Deposition Network: Interim Report. Department Environmental Sciences, Rutgers University. Holdren, C., W. Jones, and J. Taggart, 2001. Managing Lakes and Reservoirs. North American Lake Management Society and Terrene Institute, in cooperation with U.S. Environmental Protection Agency. Madison, WI.

41
Hosper, S.H., 1998. Stable states, buffer and switches: an ecosystem approach to the restoration and management of shallow lakes in The Netherlands. Water Science Technology 37(3):151-164. Madgwick, F.J., 1999. Strategies for conservation management of lakes. Hydrobiologia 395/396:309-323. Melzer, A., 1999. Aquatic macrophytes as tools for lake management. Hydrobiologia 395/396:181-190. Moss, B., J. Madgwick, G. Phillips, 1996. A Guide to the restoration of nutrient-enriched shallow lakes. Norfolk Broads Authority, 18 Colegate, Norwich, Norfolk NR133 1BQ, Great Britain. Moss, B., M. Beklioglu, L. Carvalho, S. Kilinc, S. McGowan and D. Stephen. Vertically-challenged limnology; contrasts between deep and shallow lakes. Hydrobiologia 342/343:257-267. National Research Council, Assessing the TMDL Approach to water quality management. National Academy Press, Washington, D.C. 2001 New Jersey Department of Environmental Protection. 2001. Status of Use Impairment of Public Lakes. Bureau of Freshwater and Biological Monitoring, Lakes Management Program. New Jersey Department of Environmental Protection. 2000a. Report on the Establishment of TMDL for Phosphorus in Strawbridge Lake. Amendment to Tri-County WQMP. New Jersey Department of Environmental Protection. 2000b. Report on the Establishment of TMDL for Phosphorus in Lower Sylvan Lake. Amendment to Tri-County WQMP. New Jersey Department of Environmental Protection. 1998. Identification and Setting of Priorities for Section 303(d) Water Quality Limited Waters in New Jersey, Office of Environmental Planning. New Jersey Department of Environmental Protection. 1983a. New Jersey Lakes Management Program Lakes Classification Study: Clove Lake. Bureau of Monitoring and Data Management in association with Princeton Aqua Science. North Jersey Resource Conservation and Development Council. July 2002. Recreational Resources in the Upper Delaware Watershed. A Technical Report for the Upper Delaware Watershed Management Project. North Jersey Resource Conservation and Development Council. November 2001. Setting of the Upper Delaware Watershed. A Technical Report for the Upper Delaware Watershed Management Project.

42
Ostrofsky, M.L., 1978. Modification of phosphorus retention models for use with lakes with low areal water loading. J. Fish. Res. Bd. Can. 35(12):1532-1536. Perrow, M.R., A.J.D. Jowitt, J.H. Stansfield, G.L. Phillips, 1999. The practical importance of the interaction between fish, zooplankton and macrophytes in shallow lake restoration. Hydrobiologia 395/396:199-210. Phillips, G., A. Bramwell, J. Pitt, J. Stansfield and M. Perrow, 1999. Practical application of 25 years' research into the management of shallow lakes. Hydrobiologia 395/395:61-76. Princeton Aqua Science. 1983. Lake Hopatcong Management / Restoration Plan. Prepared for Lake Hopatcong Regional Planning Board, Landing, New Jersey. Princeton Hydro, LLC. 2002. Phase I Diagnostic / Feasibility Study of Ghost Lake. Prepared for Jenny Jump State Forest. Project No. 209.03. Rast, W., A. Jones and G.F. Lee, 1983. Predictive capability of U.S. OECD phosphorus loading-eutrophication response models. Journal WPCF 55(7):990-1002. Reckhow, K.H., 1979a. Uncertainty analysis applied to Vollenweider's phosphorus loading criterion. J. Water Pollution Control Federation 51(8):2123-2128. Reckhow, K.H., 1979b. Quantitative Techniques for the Assessment of Lake Quality. EPA-440/5-79-015. Reckhow, K.H., 1977. Phosphorus Models for Lake Management. Ph.D. dissertation, Harvard University. Reckhow, K.H., M.N. Beaulac and J.T. Simpson, 1980. Modeling phosphorus loading and lake response under uncertainty: a manual and compilation of export coefficients. EPA 440/5-80-011. Rodiek, R.K., 1979. Some watershed analysis tools for lake management. In Lake Restoration, EPA 400/5-79-001. Scheffer, M., 1990. Multiplicity of stable states in freshwater systems. Hydrobiologia 200/201:475-486. State of New Jersey, Lake Hopatcong Commission Enactment Bill, Website: www.njleg.state.nj.us/2000Bills/93000/2604_e1.pdf, accessed 11/7/02. Sutfin, C.H. May, 2002. Memo: EPA Review of 2002 Section 303(d) Lists and Guidelines for Reviewing TMDLs under Existing Regulations issued in 1992. Office of Wetlands, Oceans and Watersheds, U.S.E.P.A.
43
U.S. Environmental Protection Agency, Region 2 Water, Lake Hopatcong, Website: www.epa.gov/region02/water/lakes/hopatcong.htm, accessed 10/31/02. U.S. Environmental Protection Agency, Region 2, A Phase I Inventory of Current EPA Efforts to Protect Ecosystems, for Lake Musconetcong and Cranberry Lake, Website: www.epa.gov/ecoplaces/part2/region2/site13.html and www.epa.gov/ecoplaces/part2/region2/site4.html, respectively, accessed 9/24/02. U.S.E.P.A., 1999. Protocol for Developing Nutrient TMDLs. Watershed Branch, Assessment and Watershed Protection Division, Washington, DC. Vollenweider, R.A., and J. Kerekes, 1982. Eutrophication of Waters: Monitoring, Assessment and Control. Organization for Economic Cooperation and Development (OECD), Paris. 156 p. Wayland, R.H. III. November 22, 2002. Memo: Establishing Total Maximum Daily Load (TMDL) Wasteload Aloocations (WLAs) for Storm Water Sources and NPDES Permit Requirements Based on Those WLAs. Office of Wetlands, Oceans and Watersheds, U.S.E.P.A.
44
Appendix B: Database of Phosphorus Export Coefficients In December 2001, the Department concluded a contract with the USEPA, Region 2, and a contracting entity, TetraTech, Inc., the purpose of which was to identify export coefficients applicable to New Jersey. As part of that contract, a database of literature values was assembled that includes approximately four-thousand values accompanied by site-specific characteristics such as location, soil type, mean annual rainfall, and site percent-impervious. In conjunction with the database, the contractor reported on recommendations for selecting values for use in New Jersey. Analysis of mean annual rainfall data revealed noticeable trends, and, of the categories analyzed, was shown to have the most influence on the reported export coefficients. Incorporating this and other contractor recommendations, the Department took steps to identify appropriate export values for these TMDLs by first filtering the database to include only those studies whose reported mean annual rainfall was between 40 and 51 inches per year. From the remaining studies, total phosphorus values were selected based on best professional judgement for eight land uses categories. The sources incorporated in the database include a variety of governmental and non-governmental documents. All values used to develop the database and the total phosphorus values in this document are included in the below reference list. Export Coefficient Database Reference List
Allison, F.E., E.M. Roller, and J.E. Adams, 1959. Soil Fertility Studies in Lysimeters Containing Lakeland Sand. Tech. Bull. 1199, U.S. Dept. of Agriculture, Washington, D.C. p. 1-62. Apicella, G., 2001. Urban Runoff, Wetlands and Waterfowl Effects on Water Quality in Alley Creek and Little Neck Bay. TMDL Science Issues Conference, WEF Specialty Conference. Athayde, D. N, P. E. Shelly, E. D. Driscoll, D. Gaboury and G.B. Boyd, 1983. Results of the Nationwide Urban Runoff Program: Final Report. USEPA Water Planning Division. Washington, DC. Avco Economic Systems Corporation, 1970. Storm Water Pollution from Urban Land Activity. Rep.11034 FKL 07/70, Federal Water Qual. Adm., U.S. Dept. of Interior, Washington, D.C. p. 325. Bannerman, R., K. Baun, M. Bohm, P. E. Hughes, and D. A. Graczyk, 1984. Evaluation of Urban Nonpoint Source Pollution Management in Milwaukee, County, Eisconsin, Report No. PB84-114164, U.S. Environmental Protection Agency, Region V, Chicago, IL. Bengtson, R.L. and C.E. Carter, 1989. Simulating Soil Erosion in the Lower Mississippi Valley with the CREAMS Model. From: Application of Water Quality Models for Agricultural and Forested Watersheds, edited by D.B. Beasley and D.L Thomas. Southern Cooperative Series Bulletin No. 338. Broadbent, F.E., and H.D. Chapman, 1950. A Lysimeter Investigation of Gains, Losses and Balance of Salts and Plant Nutrients in an Irrigated Soil. Soil Sci. Soc. Amer. Proc. 14:261-269. Carter, Gail P., 1998. Estimation of Nonpoint Source Phosphorus and Nitrogen Loads in Five Watersheds in New Jersey's Atlantic Coastal Drainage Basin. Surveying and Land Information Systems, Vol. 58, no 3. pp167-177.

45
CH2M Hill, 2000. Technical Memorandum 1, Urban Stormwater Pollution Assessment, prepared for North Carolina Department of Environment and Natural Resources, Division of Water Quality. Claytor, R.A. and T.R. Schueler, 1996. “Design of Stormwater Filtering Systems,” The Center for Watershed Protection, Prepared for Chesapeake Research Consortium, Inc. Corsi, S.R., D.J. Graczyk, D.W. Owens, R.T. Bannerman, 1997. Unit-Area Loads of Suspended Sediment, Suspended Solids, and Total Phosphorus From Small Watersheds of Wisconsin. USGS FS-195-97. Delaware Valley Regional Planning Commission, 1977. Average Pollutant Concentrations Associated with Urban Agriculture and Forest Land Use. Working Paper 5.01-1, Extent of NPS Problems. Eck, P., 1957. Fertility Erosion Selectiveness on Three Wisconsin Soils. Ph. D. Thesis, Univ. of Wisconsin, Madison, WI. F.X. Brown, Inc., 1993. Diagnostic-Feasibility Study of Strawbridge Lake. FXB Project Number NJ1246-01. Frink, C.R., 1991. Estimating Nutrient Exports to Estuaries. Journal of Environmental Quality. 20:717-724. Horner, R., B. W. Mar, L. E. Reinelt, J. S. Richey, and J. M. Lee, 1986. Design of monitoring programs for determination of ecological change resulting from nonpoint source water pollution in Washington State. University of Washington, Department of Civil Engineering, Seattle, Washington. Horner, R.R., 1992. Water Quality Criteria/Pollutant Loading Estimation/Treatment Effectiveness Estimation. In R.W. Beck and Associates. Covington Master Drainage Plan. King County Surface Water Management Division., Seattle, WA. Horner, Richard R., Joseph J. Skupien, Eric H. Livingston, and H. Earl Shaver, 1994. Fundamentals of Urban Runoff Management: Technical and Institutional Issues. Prepared by the Terrene Institute, Washington, DC, in cooperation with the U.S. Environmental Protection Agency. EPA/840/B-92/002. Johnston, W.R., F. Ittihadieh, R.M. Daum, and A.F. Pillsbury, 1965. Nitrogen and Phosphorus in Tile Drainage Effluent. Soil Sci. Soc. Amer. Proc. 29:287-289. Knoblauch, H.C., L. Kolodny, and G.D. Brill, 1942. Erosion Losses of Major Plant Nutrients and Organic Matter from Collington Sandy Loam. Soil Sci. 53:369-378. Loehr, R.C., 1974. Characteristics and comparative magnitude of non-point sources. Journal of WPCF 46(11):1849-1872. Lopes, T.J., S.G. Dionne, 1998. A Review of Semivolatile and Volatile Organic Compounds in Highway Runoff and Urban Stormwater. U.S. Geological Survey, U.S. Department of Interior. Marsalek, J., 1978. Pollution Due to Urban Runoff: Unit Loads and Abatement Measure, Pollution from Land Use Activities Reference Group. International Joint Commission, Windsor, Ontario. McFarland, Anne M.S and L. M. Hauck, 2001. Determining Nutrient Export Coefficients and Source Loading Uncertainty Using In-stream Monitoring Data. Journal of the American Water Resources Association, pp. 223, 37. No. 1, February. Menzel, R. G., E. D. Rhoades, A. E. Olness, and S. J. Smith, 1978. Variability of Annual Nutrient and Sediment Discharges in Runoff from Oklahoma Cropland and Rangeland. Journal of Environmental Quality, 7:401-406. Mills, W.B., D.B. Porcella, M.J. Ungs, S.A. Gherini, K.V. Summers, L. Mok, G.L. Rupp, G.L. Bowie, 1985. Water Quality Assessment – A Screening Procedure for Toxic and Conventional Pollutants in Surface and Ground Water – Part I and II. EPA-600/6-85-002A&B.

46
Minshall, N.E., M.S. Nichols, and S.A. Witzel, 1969. Plant Nutrients in Base Flow of Streams in Southwestern Wisconsin. Water Resources. 5(3):706-713. Mundy, C., M. Bergman, 1998. Technical Memorandum No. 29, The Pollution Load Screening Model: A tool for the 1995 District Water Management Plan and the 1996 Local Government Water Resource Atlases, Department of Water Resources, St. Johns River Water Management District. NCDWQ, 1998. Neuse River Basinwide Water Quality Plan, Chapter 5, Section A. Nelson, M.E., 1989. Predicting Nitrogen Concentrations in Ground Water An Analytical Model. IEP, Inc. Northeast Florida Water Management District, 1994. St. Marks and Wakulla Rivers Resource Assessment and Greenway Protection Plan. Appendix 4. Northern Virginia Planning District Commision, 1979. Guidebook for Screening Urban Nonpoint Pollution Management Strategies. Prepared for the Metropolitan Washington Council of Governments. Novotny, V., H. Olem, 1994. Water Quality: Prevention, Identification, and Management of Diffuse Pollution. Van Nostrand Reinhold, NY Omernik, J. M., 1976. The influence of land use on stream nutrient levels, US EPA January. EPA-60/3-76-014 Omni Environmental Corporation, 1991. Literature Search on Stormwater Pollutant Loading Rates. Literature cited from DVRPC 1977; Wanielista et al. 1977; Whipple and Hunter 1977; NVPDC 1980; USEPA 1983; Mills et al. 1985; Nelson 1989; Walker et al. 1989. Omni Environmental Corporation, 1999. Whippany River Watershed Program Stormwater Model Calibration and Verification Report. Overcash, M. R., F. J. Humenik, and J. R. Miner, 1983. Livestock Waste Management, Vol. II, CRC Press, Inc., Boca Raton, Florida. Pacific Northwest Environmental Research Laboratory, 1974. Relationships Between Drainage Area Characteristics and Non-Point Source Nutrients in Streams. Prepared for the National Environmental Research Center, August 1974. Panuska, J.C. and R.A. Lillie, 1995. Phosphorus Loadings from Wisconsin Watersheds: Recommended Phosphorus Export Coefficients for Agricultural and Forested Watersheds. Research Management Findings, Bureau of Research, Wisconsin Department of Natural Resources, Number 38. Pitt, R.E., 1991. Nonpoint Source Water Pollution Management. Dep. Civil Eng., Univ. Alabama, Birmingham, AL. Polls, Irwin and Richard Lanyon, 1980. Pollutant Concentrations from Homogeneous Land Uses. Journal of the Environmental Engineering Division. Prey, J., D. Hart, A. Holy, J. Steuer, J. Thomas, 1996. A Stormwater Demonstration Project in Support of the Lake Superior Binational Program: Summary. Wisconsin Dept. of Natural Resources. (http://www.dnr.state.wi.us/org/water/wm/nps/tpubs/summary/lakesup.htm) Rast, W. and G.F. Lee, 1978. Summary Analysis of the North American (U.S. Portion) OECD Eutrophication Project: Nutrient Loading -- Lake Response Relationships and Trophic State Indices., EPA-600/3-78-008. Reckhow, K.H., M.N. Beaulac and J.T. Simpson, 1980. Modeling of Phosphorus Loading and Lake Response Under Uncertainty: A Manual and Compilation of Export Coefficients. Report No. EPA 440/5-80-011. U.S. EPA, Washington, D.C.

47
Ryding, S. and W. Rast, 1989. The Control of Eutrophication of Lakes and Reservoirs. Man and the Biosphere Series, United Nations Educational Scientific and Cultural Organization, Paris, France. Schueler, T.R., 1987. Controlling Urban Runoff: A Practical Manual for Planning and Designing Urban BMPs. Prepared for the Metropolitan Washington Council of Governments. Sonzogni, W.C. and G.F. Lee, 1974. Nutrient Sources for Lake Mendota - 1972. Trans. Wisc. Acad. Sci. Arts Lett. 62:133-164. Uchrin, C.G. and T.J. Maldanato, 1991. Evaluation of Hydrocarbons in Urban Runoff and in Detention Basins. Water Writes. Water Research Institute, Division of Coastal and Environmental Studies, Rutgers University. United States Geological Survey, U.S. Department of the Interior, 1998. Comparison of NPDES Program Findings for Selected Cities in the United States, USGS Fact Sheet, January USEPA, 1987. Guide to Nonpoint Source Pollution Control. U.S. EPA, Criteria and Standards Division, Washington D.C. USEPA, 1993. Urban Runoff Pollution Prevention and Control Planning (handbook). EPA/625/R-93/004. USEPA, 2000. Watershed Analysis and Management (WAM) Guide for Tribes. (http://www.epa.gov/owow/watershed/wacademy/wam/) Uttormark, P.D., J.D. Chapin, and K.M. Green, 1974. Estimating nutrient loadings of lakes from non-point sources. U.S. Environmental Protection Agency, Washington, D.C. 112 p. (WRIL 160609). EPA-660/3-74-020. Walker, J.F., 1989. Spreadsheet Watershed Modeling for Nonpoint Source Pollution Management in a Wisconsin Basin, Water Resources Bulletin, Vol. 25, no. 1, pp. 139-147. Wanielista, M.P., Y.A. Yousef, and W.M. McLellon, 1977. Nonpoint Source Effects on Water Quality, Journal Water Pollution Control Federation, Part 3, pp. 441-451. Washington State Department of Ecology, 2000. Stormwater Management Manual for Western Washington: Volume I Minimum Technical Requirements. Publication No. 99-11. Weidner, R.B., A.G. Christianson, S.R. Weibel, and G.G. Robeck, 1969. Rural Runoff as a Factor in Stream Pollution. J. Water Pollution. Con. Fed. 36(7):914-924. Whipple, W. and J.V. Hunter, 1977. Nonpoint Sources and Planning for Water Pollution Control. Journal Water Pollution Control Federation. pp. 15-23. Whipple, W., et al., 1978. Effect of Storm Frequency on Pollution from Urban Runoff, J. Water Pollution Control Federation. 50:974-980. Winter, J.G. and H.C. Duthie, 2000. Export Coefficient Modeling to assess phosporus loading in an urban watershed. Journal of American Water Resources Association. Vol. 36 No. 5. Zanoni, A.E., 1970. Eutrophic Evaluation of a Small Multi-Land Use Watershed. Tech. Completion Rep. OWRR A-014-Wis., Water Resources Center, Univ. of Wisconsin, Madison, WI.

48
Appendix C: Summary of Reckhow (1979a) model derivation The following general expression for phosphorus mass balance in lake assumes the removal of phosphorus from a lake occurs through two pathways, the outlet (Mo) and the sediments (φ):
φ−−=⋅ oi MMdtdPV Equation 1
where: V = lake volume (103 m³) P = lake phosphorus concentration (mg/l) Mi = annual mass influx of phosphorus (kg/yr) Mo = annual mass efflux of phosphorus (kg/yr) φ = annual net flux of phosphorus to the sediments (kg/yr).
The sediment removal term is a multidimensional variable (dependent on a number of variables) that has been expressed as a phosphorus retention coefficient, a sedimentation coefficient, or an effective settling velocity. All three have been shown to yield similar results; Reckhow's formulation assumes a constant effective settling velocity, which treats sedimentation as an areal sink. Assuming the lake is completely mixed such that the outflow concentration is the same as the lake concentration, the phosphorus mass balance can be expressed as:
QPAPvMdtdPV si ⋅−⋅⋅−=⋅ Equation 2
where: vs = effective settling velocity (m/yr) A = area of lake (103 m²) Q = annual outflow (103 m³/yr).
The steady-state solution of Equation 2 can be expressed as:
as
a
s
a
QvP
Tzv
PP+
=+
= Equation 3
where: Pa = areal phosphorus loading rate (g/m²/yr) z = mean depth (m) T = hydraulic detention time (yr)
Qa = AQ = areal water load (m/yr).
Using least squares regression on a database of 47 north temperate lakes, Reckhow fit the
effective settling velocity using a function of areal water load: a
a
QPP
⋅+=
2.16.11. Equation 4

49
Appendix D: Derivation of Margin of Safety from Reckhow et al (1980) As described in Reckhow et al (1980), the Reckhow (1979a) model has an associated standard error of 0.128, calculated on log-transformed predictions of phosphorus concentrations. The model error analysis from Reckhow et al (1980) defined the following confidence limits:
( )( )PhPP PL −⋅−= − 128.0log10
( )( )PhPP PU −⋅+= + 128.0log10
225.211
h⋅−≥ρ
where: PL = lower bound phosphorus concentration (mg/l); PU = upper bound phosphorus concentration (mg/l); P = predicted phosphorus concentration (mg/l); h = prediction error multiple ρ = the probability that the real phosphorus concentration lies
within the lower and upper bound phosphorus concentrations, inclusively.
Assuming an even-tailed probability distribution, the probability (ρu) that the real phosphorus concentration is less than or equal to the upper bound phosphorus concentration is:
21
21
21
211
221
21
+⋅=+⎟⎠⎞
⎜⎝⎛ −⋅=−+=
−+= ρρρρρρρu
Substituting for ρ as a function of h:
222 5.411
21
5.41
21
21
25.211
21
hhhu ⋅−=+
⋅−=+⎟
⎠⎞
⎜⎝⎛
⋅−⋅=ρ
Solving for h as a function of the probability that the real phosphorus concentration is less than or equal to the upper bound phosphorus concentration:
( )
( )u
u
u
h
h
h
ρ
ρ
ρ
−=
−=
−=⋅
15.41
15.41
15.41
2
2
Expressing Margin of Safety (MoSp) as a percentage over the predicted phosphorus concentration yields:
PPP
PPMoS UU
p−
=−= 1

50
Substituting the equation for PU: ( )( ) ( )( )
( )( )( )
( )128.0log
128.0log
128.0log
128.0log128.0log
10
10
10
1010
+
+
+
++
=+⋅
−=⋅
−⋅=⋅
−⋅=
−−⋅+=
Pp
Pp
Pp
PP
p
Ph
MoSP
Ph
MoSP
PhMoSPP
PhP
PPhPMoS
Taking the log of both sides and solving for margin of safety:
( )110
110
101
128.01log
128.0log1loglog
128.0log1log
128.0loglog
128.0loglog
128.0
128.0
128.0
−=
−=
=+
=⎟⎟⎠
⎞⎜⎜⎝
⎛+
=−⎟⎟⎠
⎞⎜⎜⎝
⎛++
=−⎟⎟⎠
⎞⎜⎜⎝
⎛⎟⎟⎠
⎞⎜⎜⎝
⎛+
=−⎟⎟⎠
⎞⎜⎜⎝
⎛+
⋅
+=⎟⎟⎠
⎞⎜⎜⎝
⎛+
⋅
hMoSh
MoSh
MoSh
MoS
Ph
MoSP
Ph
MoSP
PPh
MoSP
PPh
MoSP
p
p
p
p
p
p
p
p
Finally, substituting for h yields Margin of Safety (MoSp) as a percentage over the predicted phosphorus concentration, expressed as a function of the probability (ρu) that the real phosphorus concentration is less than or equal to the upper bound phosphorus concentration:
( )( ) ( )1105.4*11 128.0 −×−=
upMoS ρ