total quality management (tqm), an overview … total quality management (tqm), an overview dtic ......
TRANSCRIPT
AD-A242 594
RL-TR-91-305In-House ReportSeptember 1991
TOTAL QUALITYMANAGEMENT (TQM), ANOVERVIEW
DTICNOV 1 8 10,91
Anthony Coppola D
APPROVED FOR PUBLIC RELEASE, DISTRIBUTION UNLIMITED
91-15748
Rome LaboratoryAir Force Systems Command
Griffiss Air Force Base, NY 13441-5700
This report has been reviewed by the Rome Laboratory Public Affairs Office
(PA) and is releasable to the National Technical Information Service (NTIS). At NTIS
it will be releasable to the general public, including foreign nations.
RL-TR-91-305 has been reviewed and is approved for publication.
APPROVED:
ANTHONY J. FEDUCCIA, Chief
Systems Reliability Division
FOR THE COMMANDER:
JOHN J. BART
Technical DirectorElectromagnetics & Reliability Directorate
If your address has changed or if you wish to be removed from the Rome Laboratorymailing list, or if the addressee is no longer employed by your organization, please
notify RL(ERSS ) Griffiss AFB NY 13441-5700. This will assist us in maintaining acurrent mailing list.
Do not return copies of this report unless contractual obligations or notices on aspecific document require that it be returned.
Form ApprovedREPORT DOCUMENTATION PAGE 0MB No. 0704-01 88Pbcrepcxtrg b.,dei far &IS ohb d ri-OW~r is eST18ted toww N&" i per repre, rxc*d~-e for t r eieri g rwsri.bpns sendrvVisrg ata sa
gatwng widfrmwwig Un cd.nreesc m-doopst ac~r d rwwrrg tin c9ad ricxrrto So-rdoofrwts regwdrlg is busdmi es5toa or "v Ctr aspea off-coc~m dH ,nn a cIIcr CW~~dz1 suggestion f cx red.ig i-s tbzder- to Was*,wcj, Hedptwes Savxas, Diemct. fo Hx 1crwn Operftn "iReprts. 12 5 .effwsor,Davis Hq,". St-g 1204, firkigboq VA MMt24= and to tin Offloe of Mamngarwt vW1 Budgn Pepwworc Redi boProjec (07U-01 88). Waet~tor DC 20503
1. AGENCY USE ONLY (Leave Blank) 2. REPORT DATE 3. REPORT TYPE AND DATES COVERED
ISeptember 1991 In-Hfouse
4. TITLE AND SUBTITLE 5. FUNDING NUMBERS
TOTAL QUALITY MANAGEMENT (TQM), AN OVERVIEW PE - 62702FPR - 2338
6. AUTHOR($) Top-o0a
Anthoy CopolaWU - TK
7. PERFORMING ORGANIZA-TION NAME(S) AND ADDRESS(ES) 8. PERFORMING ORGANIZATION
Rome Laboratory (ERSS) REPORT NUMBER
Griffiss AFB NY 13441-5700 RL-TR-91-305
9. SPONSORING/MONITORING AGENCY NAME(S) AND ADDRESS(ES) 10. SPONSORINGMONITORING
Rome Laboratory (ERSS) AGENCY REPORT NUMBER
Griffiss AFB NY 13441-5700
11. SUPPLEMENTARY NOTES Rome Laboratory Project Engineer: Anthony Coppola/ERSS/(315) 330-
4758. Report will also be published in Tutqrial Notes of 1992 Annual Reliability andMaintainability Symposium.
1 2a- DISTRIBUTION/AVAiLABIU1TY STATEMENT 12. DISTRIBUTION CODE
Approved for public release; distribution unlimited.
13. ABSTRACT(maxk- 2w -or)
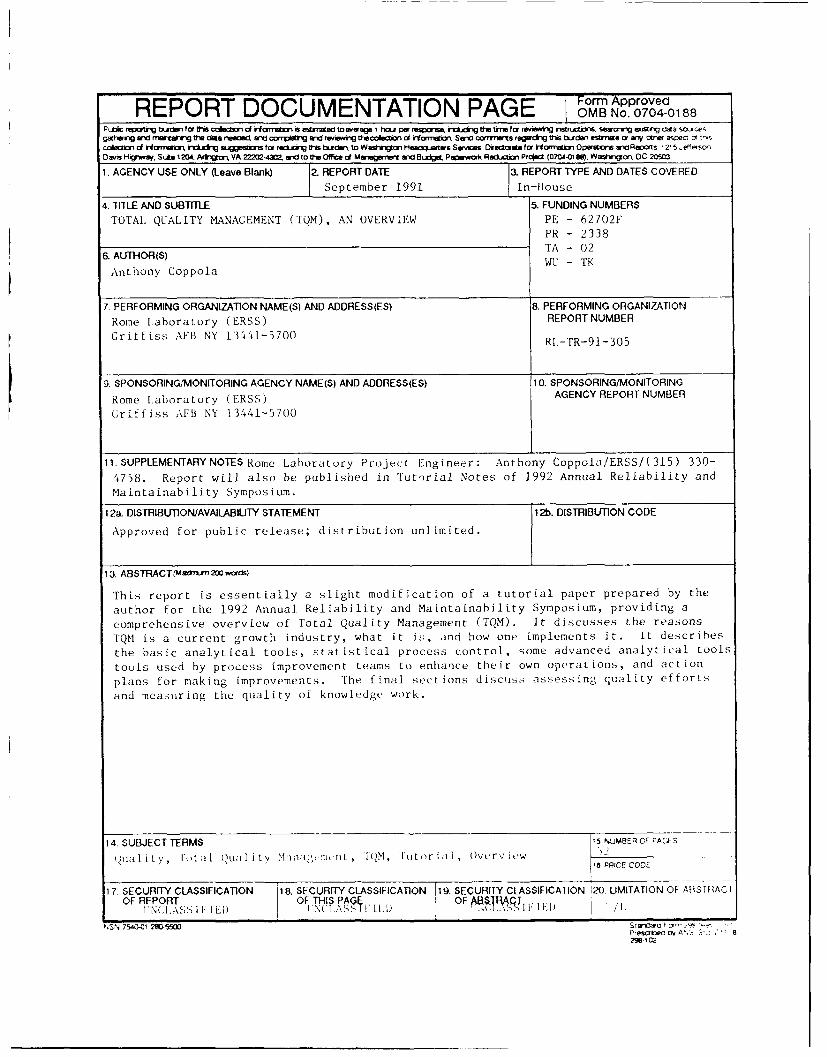
This report is essentially a slight modification of a tutorial paper prepared by the
author for the 1992 Annual Reliability and Maintainability Symposium, providing a
comprehensive overview of Total Quality Management (TQM). It discusses the reasons
TQM is a current growth industry, what it is, and how one implements it. it describes
the basic analytical tools, statistical process control, some advanced analytical tools
tools used by process improvement teams to enhanice their own operations, and action
plans for making improvements. The final sections discuss assessing quality effort-,
and measuring the quality of knowledge work.
14. SUBJECT TERMS 15 NUMBER CF Z'A-ES
Iaty, hdoil oIi ty M[og~tiQM, Tutor iol , Overvijew 16 PRICE CODE
17, SECURITY CLASSIFICATION 18. SECURITY CLASSIFICATION 19. SECURITY CLASSIFICATION 120. LIMITATION OF AIS I IJAC IOF CAS REPOR OF THI PA OF 111)OF*'* REPORT I- OF I NI.AS i OF13 CT 1
N'SN 7540-01 2M~5 Wma~P'escdtedo A%'., S.':-829W- 102
TABLE OF CONTENTS
INTRODUCTION ............................................................... i
WHY TQM? .............................................................. I
WHAT IS TQM? .......................................................... I
IMPLEMENTING TQM ......................................................
TQM TOOLS ................................................................. I0
BASIC ANALYTICAL TOOLS ............................................... Id
STATISTICAL PROCESS CONTROL .......................................... 16
ADVANCED ANALYTICAL TOOLS ............................................ 2U
TEAM TOOLS ................................................................ Z/
TEAM DYNAMICS ..................................................... 28
TEAM PROCESS EVALUATION TOOLS ........................................ 1U
TEAM PROCESS TOOLS ................................................... j1
GETTING STARTED ......................................................
ACTION PLANS ......................................................... 34
ASSESSING QUALITY EFFORTS ................................................. 16
MEASURING THE QUALITY OF KNOWLEDGE WORK .................................... i
CONCLUSION ................................................................ 43
-- - - ---. 4
INTRODUCTION
This report is essentially a slight modification of a tutorial paperprepared by the author for the the 1992 Annual Reliability andMaintainability Symposium. Since it provides a comprehensive overview ofTotal Quality Management (TQM), it was decided to publish it as a technicalreport so that it would be available to all interested parties, rather thanjust tne symposium attendees. It will discuss the reasons TQM is a currentgrowth industry, what it is, and now one implements it. It will thendescribe the basic analytical tools, statistical process control, someadvanced analytical tools, tools used by process improvement teams to enhancetneir own operations, and action plans for making improvements. The finalsections will discuss assessing quality efforts and measuring the quality ofknowledge work.
WHY TQM?
"If we don't change directions soon, we are doomed to end up where weare headed," states an ancient Chinese adage. In 197U, 17 U.S. firmsproduced televisions; today there is only one. Most sets are importedbecause of higher quality and lower cost. In 1975, five of the six largestsemiconductor manufacturers were U.S. companies; today six of the largestseven are Japanese. Are we heading where we want to go?
"If you always do what you always did, you will always get what youalways got." Which is not good enough, as American auto maKers found outwhen they lost market share to imports, again because of quality and cost.
"There ain't no more money," says George Butts, formerly of ChryslerCorp. He hastens to add that there is plenty of money around; there just isnot any new source. So new profits must come from the same sources of incomeas present profits. However, since about 25% of manufacturing costs areabsorbed by scrap, rework and waste, there is plenty of opportunity there.
Total Quality Management promises to improve quality and lower costs.It is therefore a means for survival, a way of increasing profits, and aninsurer of jobs. It is also a way of enhancing job satisfaction byincreasing a worker's pride in his product, and has an appeal to moralitybecause through quality, the customer will be getting good value, themanufacturer enjoys a fair profit, and the worker will have a secure andsatisfying job. Everyone wins.
WHAT IS TQM?
To clarify the concept of Total Quality Management, we will discuss thework of the best known quality "gurus," and examine some definitions used oyvarious agencies. From these we will extract some common principles and somepoints of disagreement.
The most famous names in TQM are: Deming, Juran, Crosby, Fiegenbaum,Ishikawa, and Taguchi. In the author's opinion, however, TQM practitionersshould also be acquainted with some works of Townsend, Augustine, andDrucker.
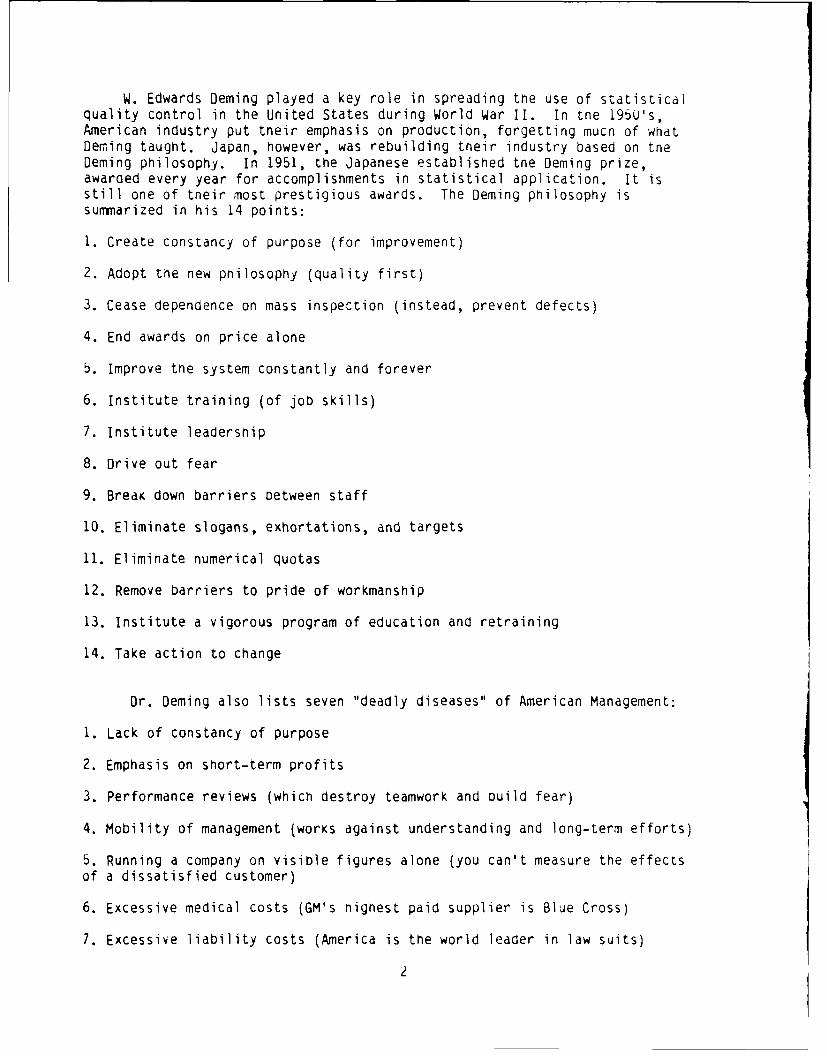
W. Edwards Deming played a key role in spreading the use of statisticalquality control in the United States during World War II. In tne 195U's,American industry put tneir emphasis on production, forgetting much of WhatDeming taught. Japan, however, was rebuilding their industry based on tneDeming philosophy. In 1951, the Japanese established tne Deming prize,awarded every year for accomplishments in statistical application. It isstill one of their most prestigious awards. The Deming philosophy issummarized in his 14 points:
1. Create constancy of purpose (for improvement)
2. Adopt the new philosophy (quality first)
3. Cease dependence on mass inspection (instead, prevent defects)
4. End awards on price alone
5. Improve the system constantly and forever
6. Institute training (of job skills)
7. Institute leadership
8. Drive out fear
9. Break down barriers Detween staff
10. Eliminate slogans, exhortations, and targets
11. Eliminate numerical quotas
12. Remove barriers to pride of workmanship
13. Institute a vigorous program of education and retraining
14. Take action to change
Dr. Deming also lists seven "deadly diseases" of American Management:
1. Lack of constancy of purpose
2. Emphasis on short-term profits
3. Performance reviews (which destroy teamwork and ouild fear)
4. Mobility of management (works against understanding and long-term efforts)
5. Running a company on visible figures alone (you can't measure the effectsof a dissatisfied customer)
6. Excessive medical costs (GM's highest paid supplier is Blue Cross)
7. Excessive liability costs (America is the world leader in law suits)
2
Dr. Deming's advice is now in great demand in the United States. Heconducts four day seminars in quality management from which two exercises,the red bead exercise and the funnel experiment, have become classicillustrations in quality training.
The red bead exercise, briefly, is a simulation of a factory. Willingworkers are taKen from the audience and directed to make white beads. Theirprocess is to dip a paddle into a mixture of white and red Oeads. The paddlehas 50 depressions and extracts that many Deads from tne mixture. No matterhow nard the workers try, they never succeed in producing wnite oeads withoutred ones mixed in. In the course of the exercise (which is far moreinteresting than this summary indicates) the seminar attendees learn severallessons including:
- Willing workers are doing the best they can. Exhortations andthreats cannot improve quality.
- Improvements will come only by changing the process. This ismanagement's job.
- Variation is a part of every process. It must be understood to Decontrolled.
In the funnel experiment, a marble is dropped through a funnel over atarget. If it comes to rest away from the target, the location of the funnelis changed according to a set of rules, and another marble dropped.
One set of rules moves the funnel uoay from the target the samedistance as the marble, out in the opposite direction. This illustrates theattempt to overcome variation by adjusting a process against the direction oferror. For example, if a machine produces a rod longer than target, it wouldbe adjusted to make shorter rods. The result of this tinkering is shown bythe funnel experiment to double the variation in the product from that of aprocess left alone. The lesson is again to understand variation and reduceit by process changes rather than increase it by tinkering.
Another set of rules moves the funnel over the location of the marbleafter each trial. This compoun6i, the errors and ultimately drives thevariance to infinity. The lesson illustrated is Deming's contention that asworker trains worker more and more errors are introduced into the process.It is therefore management's responsibility to provide training andretraining in the proper methods of doing the job.
Deming also claims that quality benefits the worker as shown in theDeming Chain reaction:
IMPROVE QUALITY - COSTS DECREASE - PRODUCTIVITY IMPROVES - BETTER QUALITY ANDLOWER PRICE CAPTURES THE MARKET - BUSINESS SURVIVES AND GROWS - MORE JOBSCREATED.
J. M. Juran was also an advisor to Japan, and is the author of manypractical nandbooks on managing quality. His philosophy is summarized in the"Juran Trilogy": quality planning, quality control, and quality improvement.
3
Quality planning provides the emphasis and resources to meet thecustomer's needs.
Quality control continuously evaluates the product and acts to preventany degradation.
Quality improvement includes creation of an infrastructure conducive toquality improvement, chartering of project teams for specific opportunities,and supply of resources, training, and motivation.
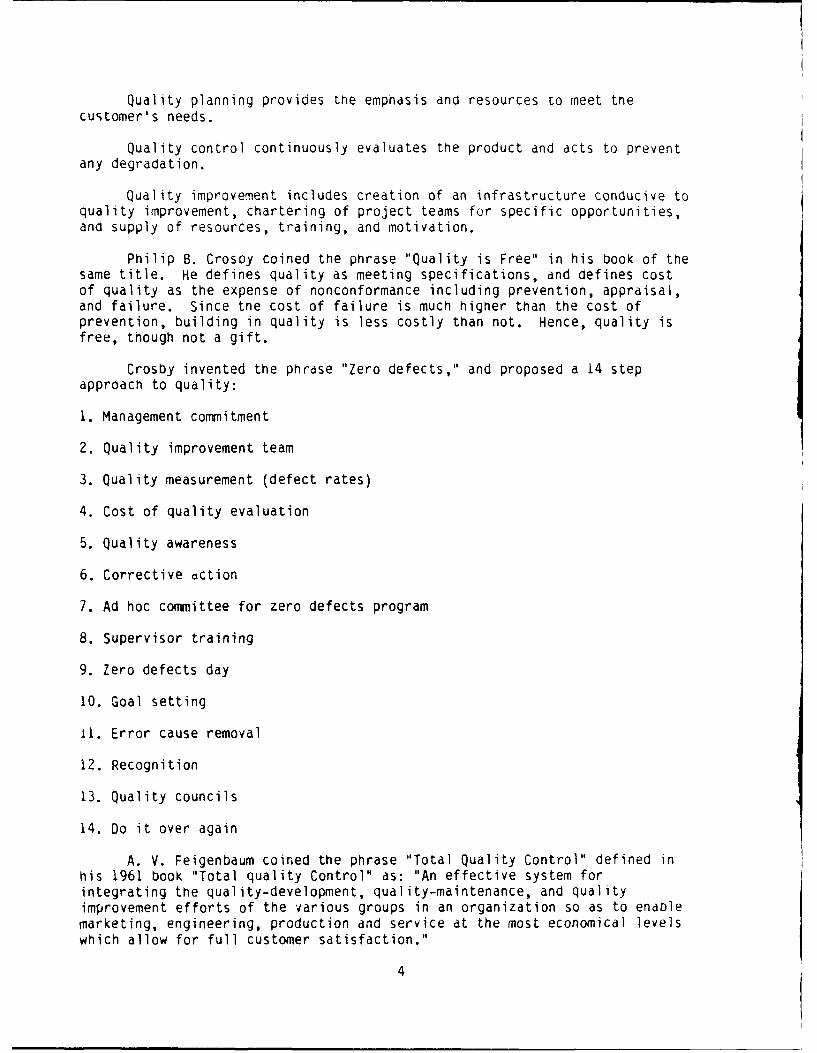
Philip B. Crosoy coined the phrase "Quality is Free" in his book of thesame title. He defines quality as meeting specifications, and defines costof quality as the expense of nonconformance including prevention, appraisal,and failure. Since tne cost of failure is much higher than the cost ofprevention, building in quality is less costly than not. Hence, quality isfree, tnough not a gift.
Crosby invented the phrase "Zero defects," and proposed a 14 step
approach to quality:
1. Management commitment
2. Quality improvement team
3. Quality measurement (defect rates)
4. Cost of quality evaluation
5. Quality awareness
6. Corrective action
7. Ad hoc committee for zero defects program
8. Supervisor training
9. Zero defects day
10. Goal setting
11. Error cause removal
12. Recognition
13. Quality councils
14. Do it over again
A. V. Feigenbaum coined the phrase "Total Quality Control" defined inhis 1961 book "Total quality Control" as: "An effective system forintegrating the quality-development, quality-maintenance, and qualityimprovement efforts of the various groups in an organization so as to enablemarketing, engineering, production and service at the most economical levelswhich allow for full customer satisfaction."
4
Feigenbaum defined quality costs as the sum of prevention costs,appraisal costs, internal failure costs and external failure costs.
Kaoru Isnikawa in "What is Total Quality Control? Tne Japanese Way"emphasized:
- Leadership oy top management- Education from top to bottom- Action Dased on Knowledge and data- Teamwork, elimination of sectionalism- Customer focus- Prevention of defects by eliminating root causes- Elimination of inspection- Use of statistical methods- Long term commitment
In his book he states: "TQC is a thought revolution for management."Also, "QC brings out the best in everyone" and "When QC is implemented,falsehood disappears from tne company."
Genichi Taguchi is noted for his emphasis on the reduction of variationand the creation of robust designs (i.e. designs which continue to performwell as the use environment varies). His contributions include improvedmethods for statistical design of experiments to determine causes ofvariation (though there is some controversy about these). He formulated"loss functions" to quantify the adverse economic effects of variation.
Taguchi's contributions are often explained by considering a designhierarchy: system design, parameter design, and tolerance design. Systemdesign creates the means to accomplish some mission, and American designersare strong in this area. Parameter design is concerned with thespecification of the system components. This is a Japanese strength, and aTaguchi specialty. Tolerance design, the setting of limits on specifiedvalues, is done equally well by both countries.
Though not usually listed among the TQM gurus, Robert Townsendpublished a book, "Up the Organization," in 1970 which recognized many of thePoints made by the usual TQM referents. He preached rebellion againstmindless rules which accumulate in all organizations. He suggested managerscall their own offices to see what impressions a customer gets when hecalls. He noted the importance of leadership, the need for a manager to be acoach, and the general under-utilization of people in an organization. Myfavorite quote:
"If you can't do it excellently, don't do it at all. Because if itsnot excellent it won't be profitable or fun, and if you're not in businessfor fun or profit, what the hell are you doing here?"
Norman Augustine wrote a book, "Augustine's Laws," describing theAmerican aerospace industry in a way which is amusing to those who do notrealize that he is not exaggerating. Some insights of interest to thestudent of TQM: "It costs a lot to build bad oroducts" (cost of quality),"most of our problems are self-imposed," and "rules are no substitute forsound judgement."
5
Finally, Peter Drucker, the noted author of management books, ("TheEffective Executive" and others) states the principle that management's jobis to make a customer. He also repeatedly emphasizes that "doing thingsright" occupies too much management attention which should oe devoted to"doing the right things." Drucker advises managers to "pick the future overthe past," an excellent tenet for a TQM initiative.
Definitions of TQM.
In a draft of DoD 5000.51-G, "Total Quality Management, A Guide forImplementation" The Department of Defense states:
"Total Quality Management (TQM) is both a philosophy and a set of guidingprinciples that represent the foundation of a continuously improvingorganization. TQM is the application of quantitative methods and numanresources to improve the material and services supplied to an organization,all tne processes within an organization, and the degree to which the needsof the customer are met, now and in the future."
The Air Force Systems Command put out a TQM pamphlet in 1990 whichdefined it as:
"A leadership philosophy, organizational structure, and workingenvironment that fosters and nourishes a personal accountability andresponsibility for quality and a quest for continuous improvement inproducts, services, and processes.
The Air Force Electronic Systems Division's pamphlet defined TQM as:
"....The adoption of a customer-oriented operating philosophy committedto excellence in our products, services, and relationships through the totalparticipation of all our employees in the constant improvement of allprocesses."
The Army Material Command uses this concise definition:
"A philosophy of pursuing continuous improvement in every process through tneintegrated efforts of all members of the organization"
A Navy TQM seminar offered:
"Customer-oriented, quality focused management pnilosopny forproviding leadership, training, and motivation to continuously improve anorganization's processes using modern process control techniques"
The Federal Quality Institute's definition:
"TQM is a strategic, integrated management system for achieving customersatisfaction which involves all managers and employees and uses quantitativemethods to continuously improve an organization's processes."
Finally, a NASA contact provided this, by Albert M. Koller:
6
"TQM is an approach to managing work based upon (1) the analyticalevaluation of work processes; (2) the development of a "quality" culture; and(3) the "empowerment" of employees -- all for the purpose of continuousimprovement of your product or service."
Principles and Issues
From the above, we can summarize agreement on these PRINCIPLES OF TQM:
CUSTOMER SATISFACTION
MANAGEMENT LEADERSHIP CREATING A QUALITY CULTURE
IMPROVEMENT OF PROCESSES, NOT "MOTIVATION" OF PEOPLE
EDUCATION AND TRAINING (JOB SKILLS AND TQM TOOLS, AT LEAST)
DEFECT PREVENTION IN LIEU OF INSPECTION
USE OF DATA AND STATISTICAL TOOLS
TEAM APPROACH- HORIZONTAL (BETWEEN DEPARTMENTS)- VERTICAL (CEO TO LOWEST PAID EMPLOYEE)
CONTINUOUS IMPROVEMENT
We can also note that TQM is not: new, a program (as opposed to aprocess or philosophy), a quick fix or magic solution, spiritual guidance, aslogan campaign, a Japanese invention, a suggestion program, or a substitutefor discipline and dedicated effort. It also is definitely not easy.
The TQM gurus are not monolithic in their opinions. There are many issueswhich divide them. These include:
FORMS OF RECOGNITION: Should workers who serve on improvement teams berewarded with money? Is it better to acknowledge their contributions by apublic thanks or certificate? Or should the satisfaction of making animprovement be enough'
USE OF HOOPLA: Some TQM initiatives have been kicked off with parades.Banners and coffee mugs with TQM slogans abound. Crosby would recommendthese; Deming might consider them empty exhortations. Who is right, or doesit depend on the organization?
SETTING GOALS: Is this an essential activity or a counterproductiveexercise? Motorola's so far successful "six-sigma" program has a yearlytarget for defect reduction. Deming might point out that an easy approach tovictory would be to change the definition of defect (something not unknown inmy bureaucracy). Does it take a target to sustain energy, or is it aninvitation to play numbers games?
7
"ZERO DEFECTS": Where ZD nas not been successful, it is called an emptyslogan. As an exhortation for willing workers to do better, it would be justthat. However, it is a concise summary of the goal of all TQM effort. Sinceit represents an unattainable perfection, it implies the need for constantimprovement. The difference in these two viewpoints may De merely areflection of the understanding with whicn a ZD program is applied. (Notethat CrosDy advocates ZD as a program rather than a pnilosopny; ne acnievesconstancy of purpose by repeating the program yearly.)
APPRAISALS: Despite Deming's condemnation, performance appraisals arelikely to be with us a while. Can we live with them? Can we make themuseful (by appraising teamwork, for example)?
TEAMS: Should participation on improvement teams be voluntary ormandatory? Who charters a team? At the Harris Corporation in Melbourne, FL,each activity in the plant is designated a "work cell" and its employeesassigned to a quality improvement team with a goal formulated by management.Tnis is in addition to cross-functional teams created at higher levels for adhoc missions. In some agencies, teams are charted by a TQM Council, andmembership assigned to agencies, if not individuals. At the Rome Laboratory,any level of management can charter a team, and membership is strictlyvoluntary. What's best for your activity?
SUGGESTION BOXES: Often established to get the voice of the employee.Can deteriorate into a means for venting frustration (pernaps a usefulfunction). However, usually a one-way street; the employee does not getfeedback on what was done with his input. Unless visible action is taken ina timely manner, the worker may assume that no one is paying attention.Since not all suggestions can be implemented, the lack of feedback may givean impression of a lack of management support, even when it exists.
IMPLEMENTING TQM
The following is a summary of actions recommended to maKe TQM happen:
1. CREATE VISION (What do you want to be? Consider both goals and values.)
2. PLAN ACTION (How do you get from today to the vision?)
3. CREATE STRUCTURE
- INSTITUTE TRAINING- ELIMINATE HASSLES- INVOLVE EMPLOYEES
- TRUST AND EMPOWER THEM- PERMIT RISK TAKING
- "WALK THE TALK"- ALWAYS PUT QUALITY FIRST- MAKE APPRAISAL/REWARD SYSTEMS SUPPORTIVE
- CREATE CROSS-FUNCTIONAL TEAMS
4. MEASURE PROGRESS
5. UPDATE PLANS AND VISION AS REQUIRED.
8
In implementing TQM, tne chief executive officer must lead tne qay.He cannot delegate leadership, nor can he ever put quality on tne DackOurner, o,, TQM will never mature at nis agency.
If a union represents the employees, they must Decome partners in TQMimplementation. They snould De involved at tne start and all TQM informationmust oe shared with them. The union should define its own role in TQM, outit should be separate from established grievance and bargaining proceaures.
An aggressive training program is necessary to deploy the vision andcreate a quality culture. job skills and oasic quality concepts must beprovided to all employees. Those involved in improvement teams should haveavailable to them training in group dynamics and in TQM analysis tools ofinterest.
Improved quality must never oe seen as a threat. When an improvedprocess needs less man-hours to perform, the people released snould Deconsidered an asset available for other uses and guaranteed continuedemployment.
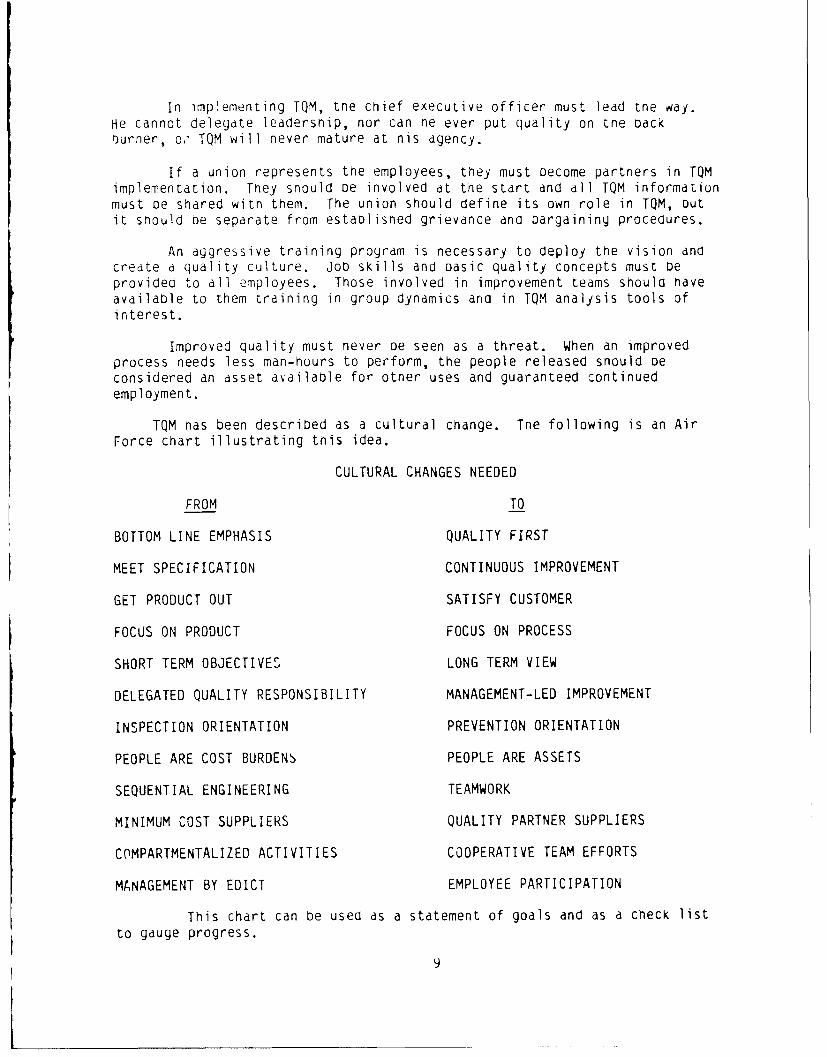
TQM has been described as a cultural change. The following is an Air
Force chart illustrating this idea.
CULTURAL CHANGES NEEDED
FROM TO
BOTTOM LINE EMPHASIS QUALITY FIRST
MEET SPECIFICATION CONTINUOUS IMPROVEMENT
GET PRODUCT OUT SATISFY CUSTOMER
FOCUS ON PRODUCT FOCUS ON PROCESS
SHORT TERM OBJECTIVE, LONG TERM VIEW
DELEGATED QUALITY RESPONSIBILITY MANAGEMENT-LED IMPROVEMENT
INSPECTION ORIENTATION PREVENTION ORIENTATION
PEOPLE ARE COST BURDENS PEOPLE ARE ASSETS
SEQUENTIAL ENGINEERING TEAMWORK
MINIMUM COST SUPPLIERS QUALITY PARTNER SUPPLIERS
COMPARTMENTALIZED ACTIVITIES COOPERATIVE TEAM EFFORTS
MANAGEMENT BY EDICT EMPLOYEE PARTICIPATION
This chart can be used as a statement of goals and as a check listto gauge progress.
9
TQM TOOLS
Tnis section will discuss TQM tools including the basic analyticaltools, statistical process control, advanced analytical tools, special toolsused oy teams, and action plans for improving processes.
BASIC ANALYTICAL TOOLS
First, let's look at the most Dasic tool of all: tne question "wny?"Many TQM references list a technique called "The five whys." Actually, fiveis used just for convenience; the method is simply to get to the root causeof a problem Dy asking "why" as often as necessary. For example:
Why is our mail from our customer in Osnkosn so slow?
It's held up in the mailroom.
Why?
The mail people have to look up our mail code.
Why?
Our customer doesn't put it in our address.
Why?
He doesn't know it.
Why?
We never told him. (root cause - corrective action can be taken)
Ishikawa contends that 95% of a company's problems can be solved withthe use of seven basic tools. Only one of these, control charts, is of anygreat complexity. The author believes any engineer can look at a sample ofthe other six and immediately understand how to use them. The seven basicTQM tools are also popular in the literature. However, every citation seemsto differ from the others by one tool. Here's mine:
THE SEVEN BASIC TOOLS:
- flow charts- Ishikawa diagrams- checklists- histograms- Pareto charts- scattergrams- control charts
This list differs from Isrikawa's in that I substituted flow charts forstratification (which I will include in my discussion of Pareto charts). Aflow chart is simply a diagram showing the inputs and outputs of alloperations in a process. (see figure 1.) Strictly speaking, it should also
10
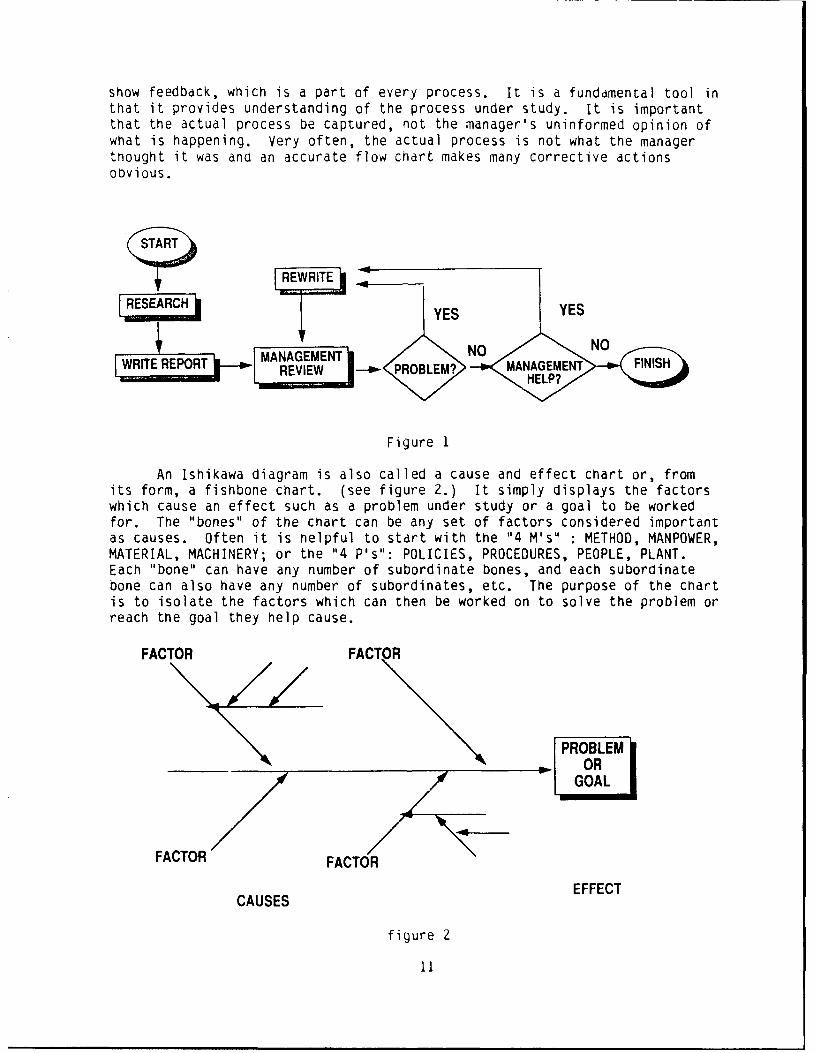
show feedback, which is a part of every process. It is a fundamental tool inthat it provides understanding of the process under study. It is importantthat the actual process be captured, not the manager's uninformed opinion ofwhat is happening. Very often, the actual process is not what the managerthought it was and an accurate flow chart makes many corrective actionsoDvious.
( IREW RITE ,
RSARH kYESYE
~EPO a~.~PROBEMAANAGMENTENTSWRITE REPORT EI -- AGM INS
Figure 1
An Ishikawa diagram is also called a cause and effect chart or, fromits form, a fishbone chart. (see figure 2.) It simply displays the factorswhich cause an effect such as a problem under study or a goal to be workedfor. The "bones" of the chart can be any set of factors considered importantas causes. Often it is helpful to start with the "4 M's" : METHOD, MANPOWER,MATERIAL, MACHINERY; or the "4 P's": POLICIES, PROCEDURES, PEOPLE, PLANT.Each "bone" can have any number of subordinate bones, and each subordinatebone can also have any number of subordinates, etc. The purpose of the chartis to isolate the factors which can then be worked on to solve the problem orreach the goal they help cause.
FACTOR FACTOR
PROBLEMS ORGOAL
FACTOR FACTOR
EFFECTCAUSES
figure 2
11
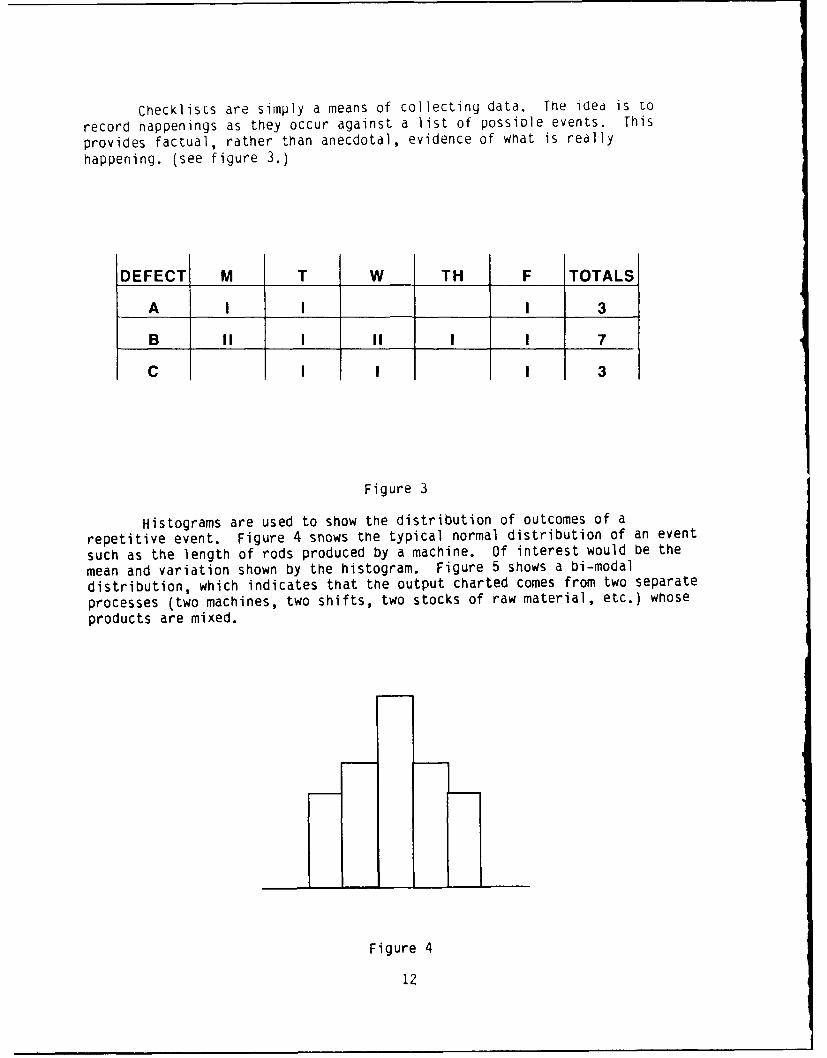
Checkliscs are simply a means of collecting data. The idea is to
record happenings as they occur against a list of possiDle events. This
provides factual, rather than anecdotal, evidence of what is really
happening. (see figure 3.)
DEFECT M T W TH F TOTALS
A I I I 3
B II I II I I 7
C I I 3
Figure 3
Histograms are used to show the distribution of outcomes of a
repetitive event. Figure 4 snows the typical normal distribution of an event
such as the length of rods produced by a machine. Of interest would be the
mean and variation shown by the histogram. Figure 5 shows a bi-modal
distribution, which indicates that the output charted comes from two separate
processes (two machines, two shifts, two stocks of raw material, etc.) whose
products are mixed.
Figure 4
12
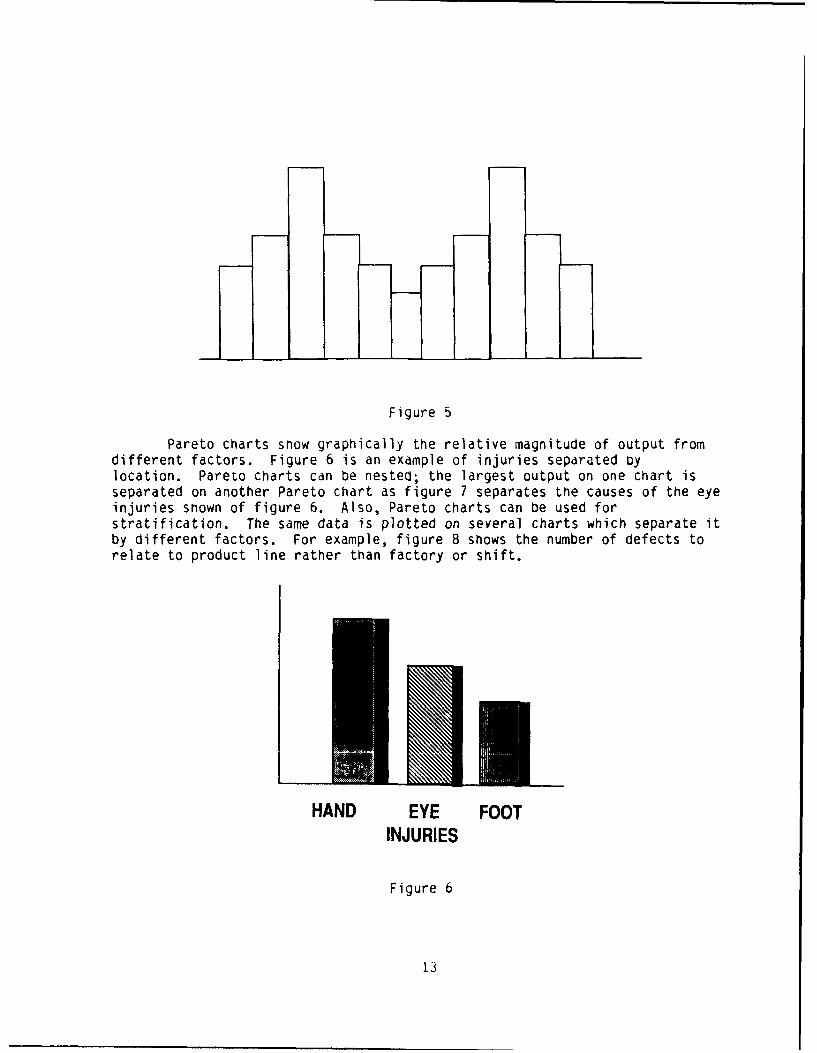
Figure 5
Pareto charts show graphically the relative magnitude of output fromdifferent factors. Figure 6 is an example of injuries separated Dylocation. Pareto charts can be nested; the largest output on one chart isseparated on another Pareto chart as figure 7 separates the causes of the eyeinjuries shown of figure 6. Also, Pareto charts can be used forstratification. The same data is plotted on several charts which separate itby different factors. For example, figure 8 shows the number of defects torelate to product line rather than factory or shift.
HAND EYE FOOTINJURIES
Figure 6
13
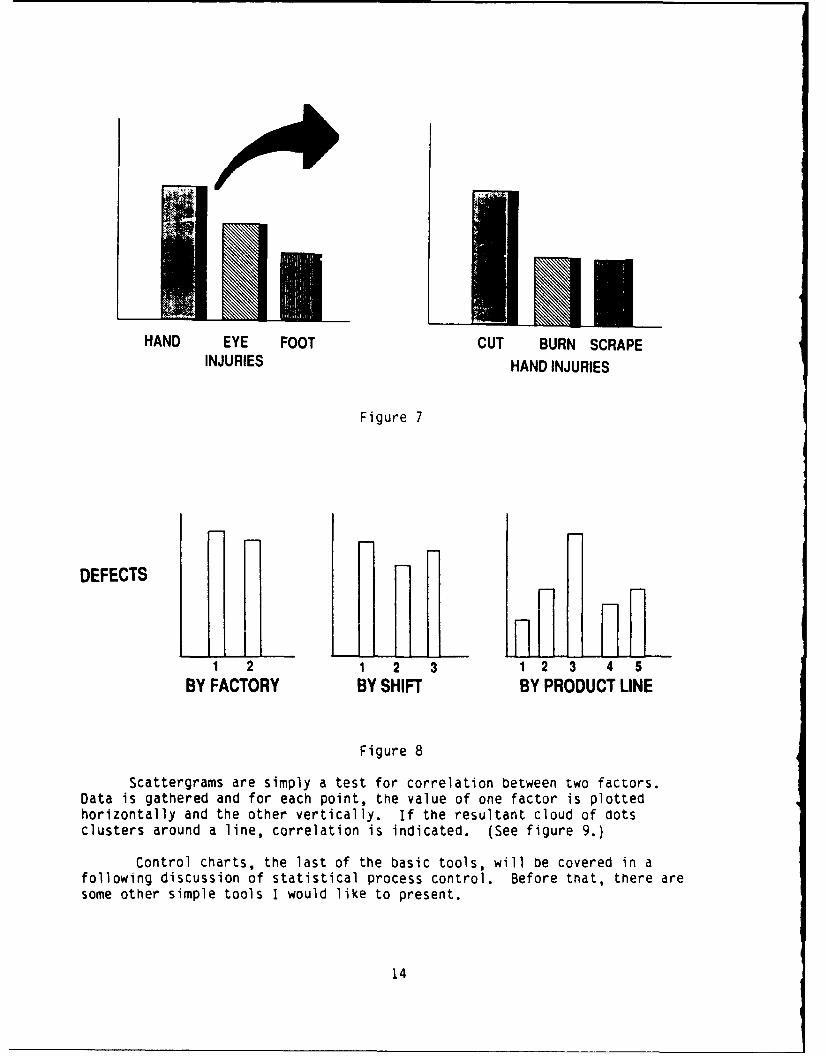
'04
HAND EYE FOOT CUT BURN SCRAPEINJURIES HAND INJURIES
Figure 7
DEFECTS
1 2 1 2 3 1 2 3 4 5
BY FACTORY BY SHIFT BY PRODUCT LINE
Figure 8
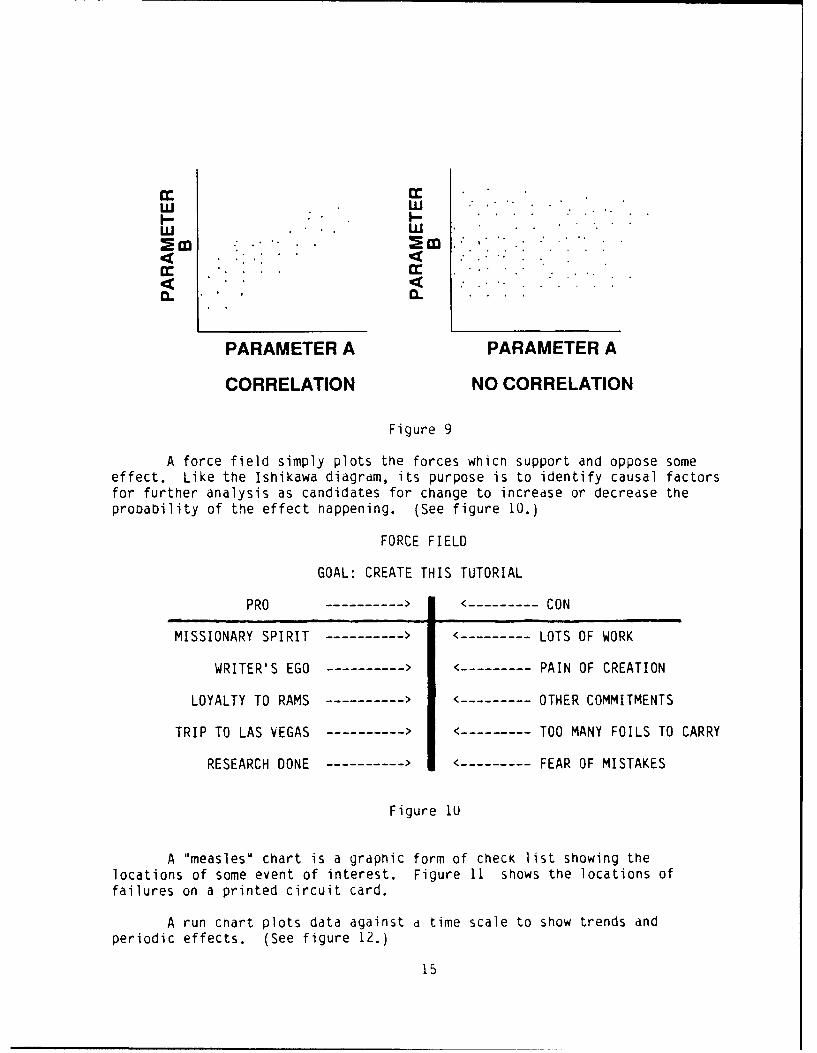
Scattergrams are simply a test for correlation between two factors.Data is gathered and for each point, the value of one factor is plottedhorizontally and the other vertically. If the resultant cloud of dotsclusters around a line, correlation is indicated. (See figure 9.)
Control charts, the last of the basic tools, will be covered in afollowing discussion of statistical process control. Before that, there aresome other simple tools I would like to present.
14
2 im n co ,
C. C .- .w. .
PARAMETER A PARAMETER A
CORRELATION NO CORRELATION
Figure 9
A force field simply plots the forces which support and oppose someeffect. Like the Ishikawa diagram, its purpose is to identify causal factorsfor further analysis as candidates for change to increase or decrease theprooability of the effect happening. (See figure 10.)
FORCE FIELD
GOAL: CREATE THIS TUTORIAL
PRO > < CON
MISSIONARY SPIRIT > < LOTS OF WORK
WRITER'S EGO > < PAIN OF CREATION
LOYALTY TO RAMS > < OTHER COMMITMENTS
TRIP TO LAS VEGAS > < TOO MANY FOILS TO CARRY
RESEARCH DONE > < FEAR OF MISTAKES
Figure 1U
A "measles" chart is a graphic form of check list showing thelocations of some event of interest. Figure 11 shows the locations offailures on a printed circuit card.
A run chart plots data against a time scale to show trends and
periodic effects. (See figure 12.)
15
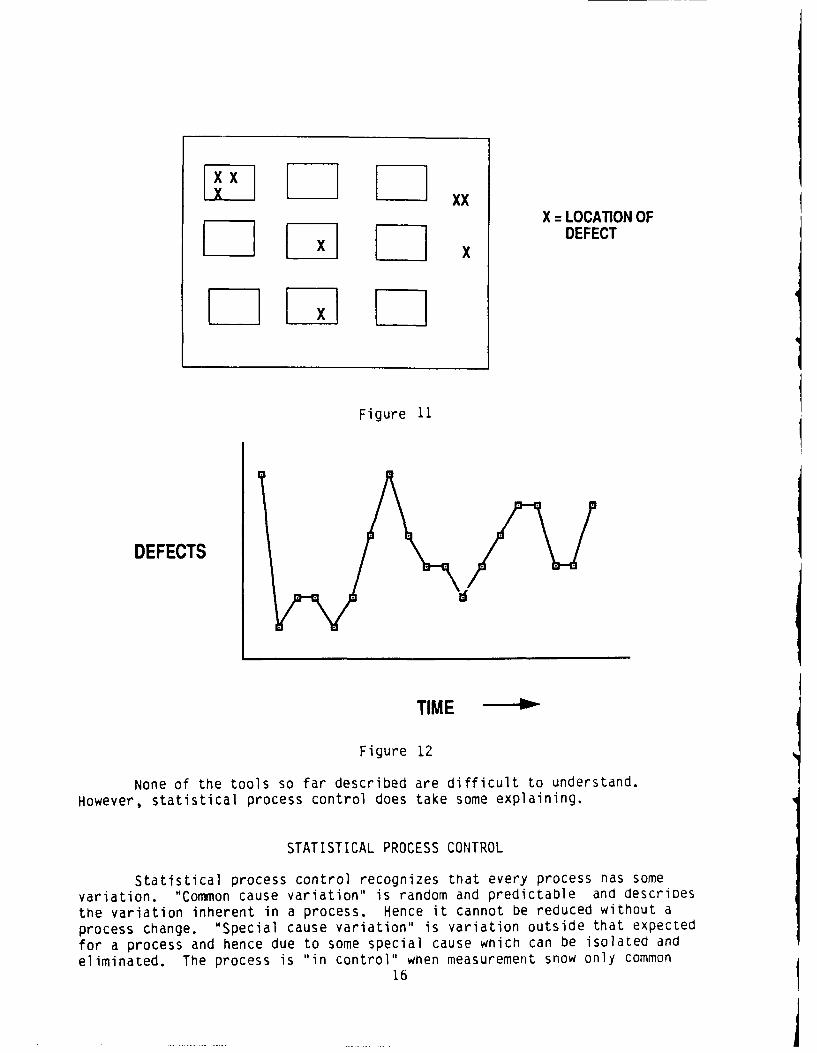
XX X = LOCAION OF
x DEFECT
Figure I1
DEFECTS
TIME
Figure 12
None of the tools so far described are difficult to understand.However, statistical process control does take some explaining.
STATISTICAL PROCESS CONTROL
Statistical process control recognizes that every process has somevariation. "Common cause variation" is random and predictable and descriDesthe variation inherent in a process. Hence it cannot be reduced without aprocess change. "Special cause variation" is variation outside that expectedfor a process and hence due to some special cause which can be isolated andeliminated. The process is "in control" when measurement snow only common
16
cause variation. Note that "in control" does not necessarily mean tneprocess is producing products in specification. It can De in control andalso not capable of producing the desired products. If so, only a oetterprocess can provide the desired product; a process in control is doing thebest it can.
If samples taken from a process in control are measured, the centrallimit theorem states the overall mean of the means of the samples will equalthe process mean, and the sample means will be normally distriDuted, whicnimplies that 99.7% of the sample means will De within three standarddeviations of the overall mean. Therefore, when sample means vary randomlywithin three standard deviations, the process is in control. Otherwisecorrective action may be required to eliminate a special cause of variation.
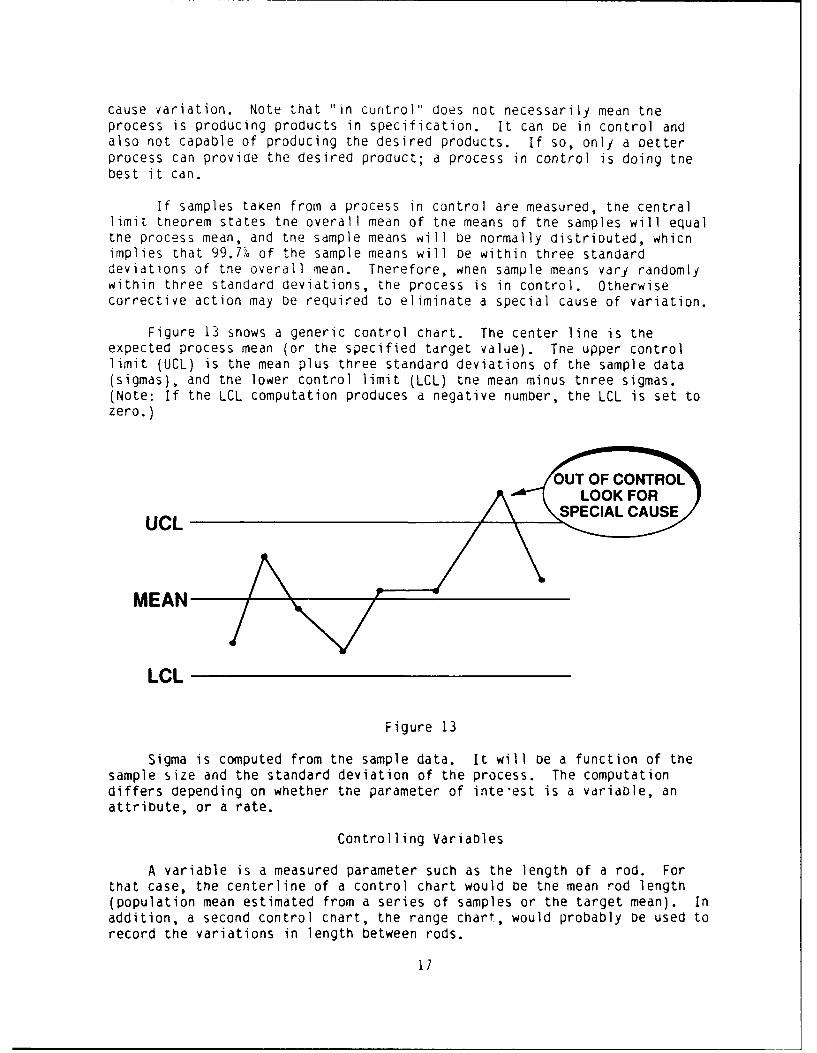
Figure 13 snows a generic control chart. The center line is theexpected process mean (or the specified target value). The upper controllimit (UCL) is the mean plus three standard deviations of the sample data(sigmas), and the lower control limit (LCL) tne mean minus tnree sigmas.(Note: If the LCL computation produces a negative number, the LCL is set tozero.)
MEAN -
LCL
Figure 13
Sigma is computed from the sample data. It will be a function of thesample size and the standard deviation of the process. The computationdiffers depending on whether the parameter of inte'est is a variable, anattribute, or a rate.
Controlling Variables
A variable is a measured parameter such as the length of a rod. Forthat case, the centerline of a control chart would be the mean rod length(population mean estimated from a series of samples or the target mean). Inaddition, a second control chart, the range chart, would probably be used torecord the variations in length between rods.
IC
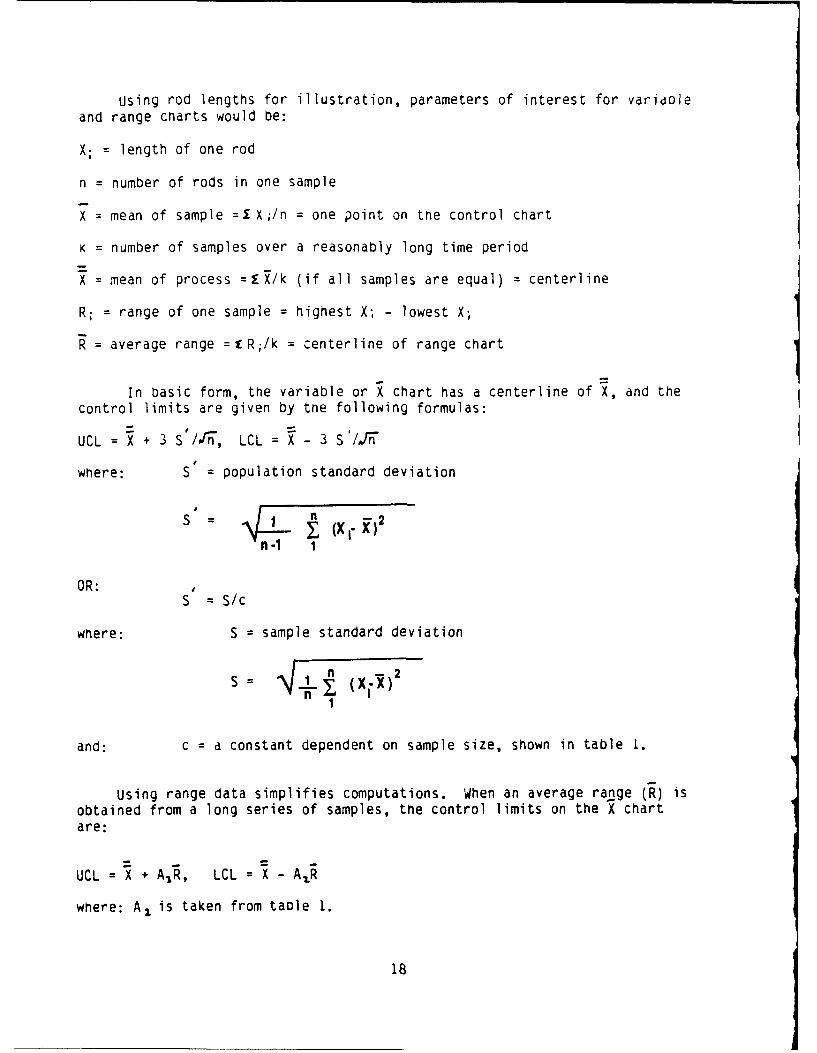
using rod lengths for illustration, parameters of interest for varidoleand range charts would be:
X; =length of one rod
n = number of rods in one sample
X = mean of sample =iX;/n = one point on tne control chart
K = number of samples over a reasonably long time period
X = mean of process =EX/k (if all samples are equal) = centerline
R; range of one sample = highest X; - lowest X;
= average range =fR;/k = centerline of range chart
In basic form, the variable or X chart has a centerline of X, and thecontrol limits are given by tne following formulas:
UCL = X + 3 S /df, LCL = X - 3 S'/.r"
where: S = population standard deviation
S - I -X. 2S(X I"X)
n -1 1
OR: SR: S/c
where: S = sample standard deviation
S = -if"g)
and: c = a constant dependent on sample size, shown in table 1.
Using range data simplifies computations. When an average range (R) isobtained from a long series of samples, the control limits on the X chartare:
UCL = X + AR, LCL = X - AR
where: A1 is taken from table 1.
18
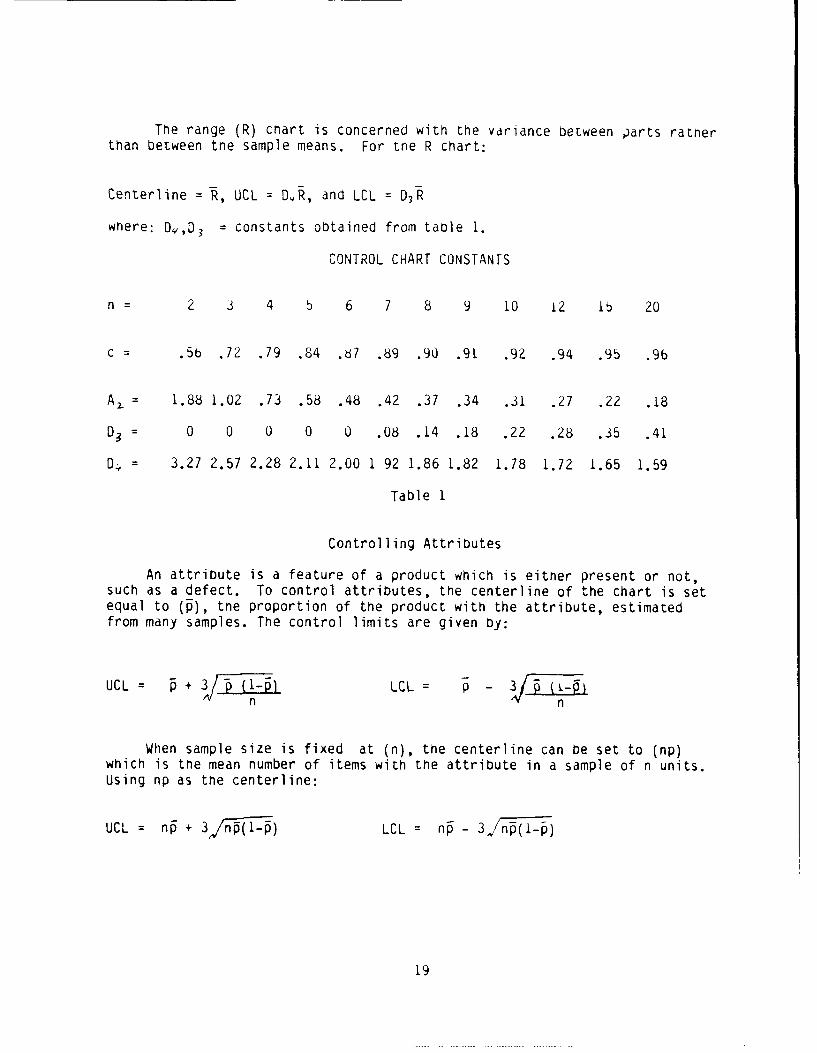
The range (R) chart is concerned with the variance between parts ratherthan between the sample means. For the R chart:
Centerline = R, UCL = DR, and LCL = D3R
where: D,,D 3 constants obtained from table 1.
CONTROL CHART CONSTANTS
n = 2 3 4 5 6 7 8 9 10 12 Ib 20
C = .5b .72 .79 .84 .87 .89 .90 .91 .9Z .94 .95 .96
A2 = 1.88 1.02 .73 .58 .48 .42 .37 .34 .31 .27 .22 .18
D3 = 0 0 0 0 0 .08 .14 .18 .22 .28 .35 .41
D4 = 3.27 2.57 2.28 2.11 2.00 1 92 1.86 1.82 1.78 1.72 1.65 1.59
Table 1
Controlling Attributes
An attribute is a feature of a product which is either present or not,such as a defect. To control attributes, the centerline of the chart is setequal to (p), tne proportion of the product with the attribute, estimatedfrom many samples. The control limits are given by:
UCL + LCL p -3V n n
When sample size is fixed at (n), the centerline can be set to (np)which is the mean number of items with the attribute in a sample of n units.Using np as the centerline:
UCL = n + 3 n'(1- ) LCL = n - 3j/np(1-h)
19
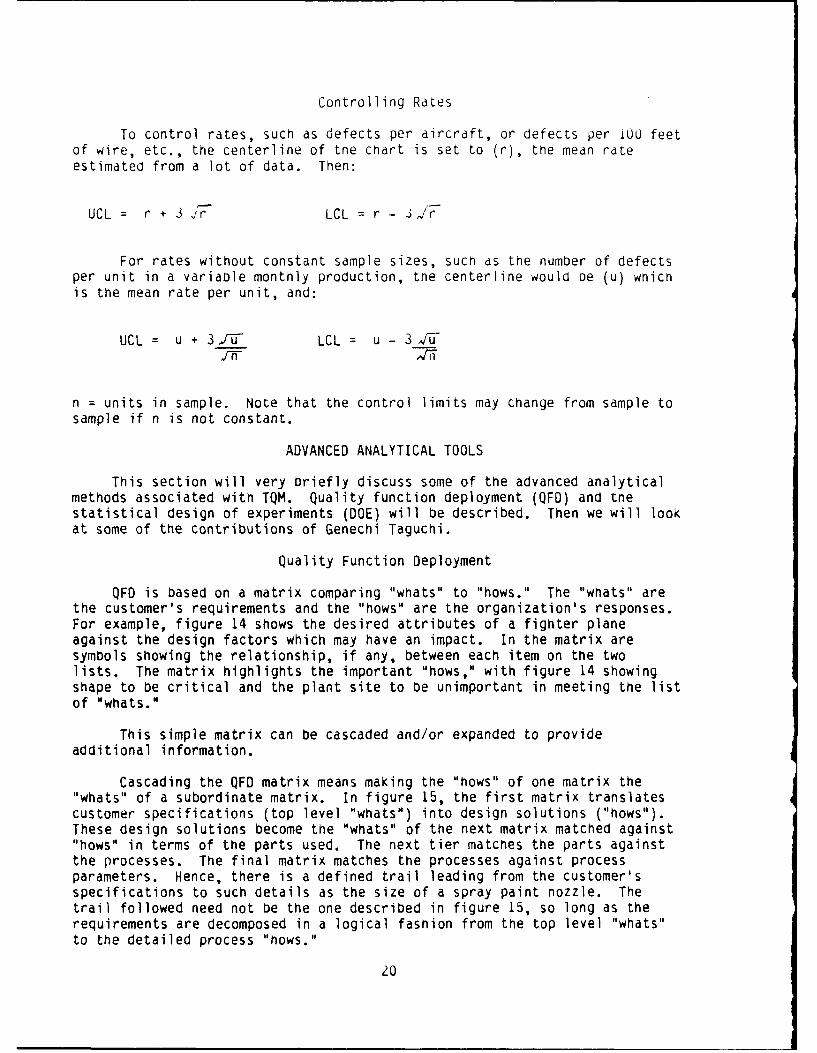
Controlling Rates
To control rates, such as defects per aircraft, or defects per IoU feetof wire, etc., the centerline of the chart is set to (r), the mean rateestimated from a lot of data. Then:
UCL = r + 3 jr LCL = r - 3w'r
For rates without constant sample sizes, such as the number of defectsper unit in a variable monthly production, the centerline would be (u) whichis the mean rate per unit, and:
UCL = u + 3J LCL = u - 3 f
n = units in sample. Note that the control limits may change from sample to
sample if n is not constant.
ADVANCED ANALYTICAL TOOLS
This section will very briefly discuss some of the advanced analyticalmethods associated with TQM. Quality function deployment (QFD) and tnestatistical design of experiments (DOE) will be described. Then we will lookat some of the contributions of Genechi Taguchi.
Quality Function Deployment
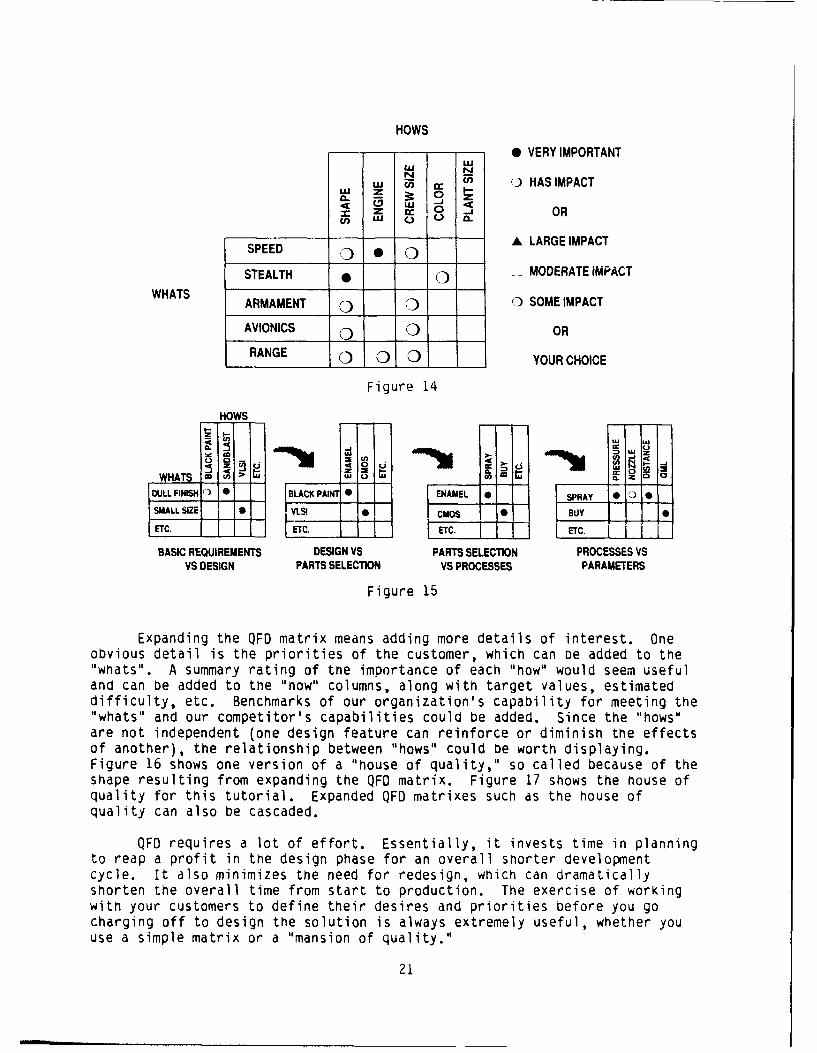
QFD is based on a matrix comparing "whats" to "hows." The "whats" arethe customer's requirements and the "hows" are the organization's responses.For example, figure 14 shows the desired attributes of a fighter planeagainst the design factors which may have an impact. In the matrix aresymbols showing the relationship, if any, between each item on the twolists. The matrix highlights the important "hows," with figure 14 showingshape to be critical and the plant site to be unimportant in meeting the listof mwhats."
This simple matrix can be cascaded and/or expanded to provideadditional information.
Cascading the QFD matrix means making the "hows" of one matrix the"whats" of a subordinate matrix. In figure 15, the first matrix translatescustomer specifications (top level "whatsm) into design solutions ("hows").These design solutions become the "whats" of the next matrix matched against"hows" in terms of the parts used. The next tier matches the parts againstthe processes. The final matrix matches the processes against processparameters. Hence, there is a defined trail leading from the customer'sspecifications to such details as the size of a spray paint nozzle. Thetrail followed need not be the one described in figure 15, so long as therequirements are decomposed in a logical fashion from the top level "whats"to the detailed process "hows."
20
HOWS
0 VERYIMPORTANT
N ) i HASIMPACT
Z CC 0 OR
SEC A LARGEIMPACTSPEED o * o __
STEALTH -- MODERATE iMPACTWHATS - -__ _ARMAMENT 0 0 SOME IMPACT
AVIONICS 0 OR
RANGE 0 0 0 YOUR CHOICE
Figure 14
HOWS
~0 0 Z~n~W HATS 0 CL ; o o
DULLFINSHIC 0 LACK PAI 0I-H ENAMEL .0... SPA-00SML U VLSI I__ CMOs BULY LL
BASIC REQUIREMENTS DESIGN VS PARTS SELECTION PROCESSES VSVS DESIGN PARTS SELECTION VS PROCESSES PARAMETERS
Figure 15
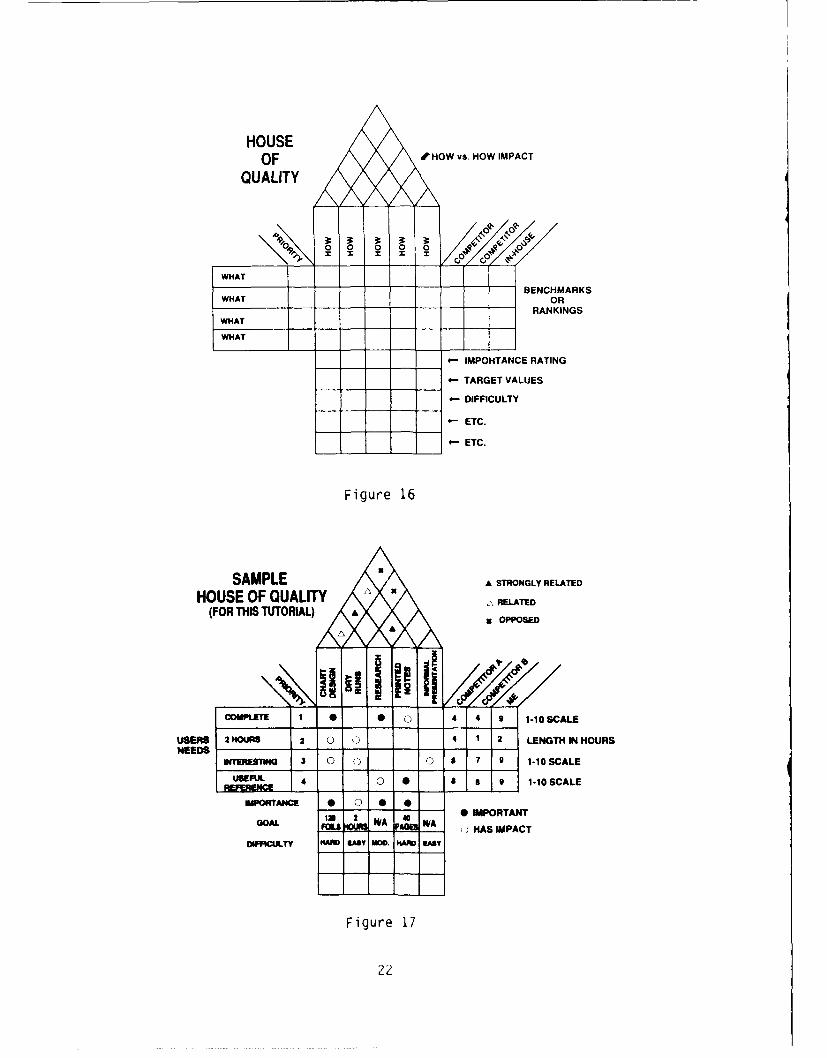
Expanding the QFD matrix means adding more details of interest. Oneobvious detail is the priorities of the customer, which can De added to the"whats". A summary rating of the importance of each "how" would seem usefuland can be added to the "how" columns, along with target values, estimateddifficulty, etc. Benchmarks of our organization's capability for meeting the"whats" and our competitor's capabilities could be added. Since the "hows"are not independent (one design feature can reinforce or diminish the effectsof another), the relationship between "hows" could be worth displaying.Figure 16 shows one version of a "house of quality," so called because of theshape resulting from expanding the QFO matrix. Figure 17 shows the house ofquality for this tutorial. Expanded QFD matrixes such as the house ofquality can also be cascaded.
QFO requires a lot of effort. Essentially, it invests time in planningto reap a profit in the design phase for an overall shorter developmentcycle. It also minimizes the need for redesign, which can dramaticallyshorten the overall time from start to production. The exercise of workingwith your customers to define their desires and priorities before you gocharging off to design the solution is always extremely useful, whether youuse a simple matrix or a "mansion of quality."
21
HOUSEOF tHOW vs. HOW IMPACT
QUALITY
0 0 000 a
WHAT
.BENCHMARKSWHAT OR
RANKINGSWHAT
WHAT
- IMPOHTANCE RATING
4- TARGET VALUES
- DIFFICULTY
4- ETC.
- ETC.
Figure 16
SAMPLE A STRONGLY RELATED
HOUSE OF QUALITY A U RELTEo(FOR THIS TUTORIAL)X OPPOSED
COMPLETE 1 (4 9 1-10 SCALE
USERS 2 HOURS 2 ( 1 2 LENGTH IN HOURSNEEDS -
IINusmG 3 0 o 0 7 9 1-10 SCALE
USEFUL 4 0 0 11 9 1-10 SCALE
IPORTANCE 0 0 0 *GL 12 WA IF *WA 0 IMPORTANT
GOAL FA A .j HAS IMPACT
OIKC"LTY PA EASY MOO. IA~ .AIY
Figure 17
22
Statistical Design of Experiments
Statistical design of experiments (DOE) is an organized approach todetermining the effects of process parameters on its output. For example, wecould do experiments on soldering with temperature, solder tin-lead ratio,wave machine neight setting, etc. as test factors and the solder defect rateas output. From this, we wish to determine the setting for each factor whichwill give us the lowest defect rate. There are many different ways we couldrun tests, ranging from varying one factor at a time to complex comoinationsof factors and setting. DOE procedures are designed to provide results wnicnare statistically valid, unambiguous, and economical. The general procedureis:
1. Select factors. It is not always obvious wnich factors are important.Factors are often selected after a brainstorming session has filled in anIsnikawa chart, and the team involved has ranked the hypothesized causalfactors in their consensus of priority.
2. Select test settings: Usually, a high and low setting are selected. Forsomething like the presence or absence of a a.ur, ti'e high setting ispresent and the low factor, absent. Sone items cannot be done in twosettings. For example, we may h'w five different fluxes we can put in thesolder. This requires five "settings," at least. While DOE can handle suchcases, this discussion will e limited to two value experiments.
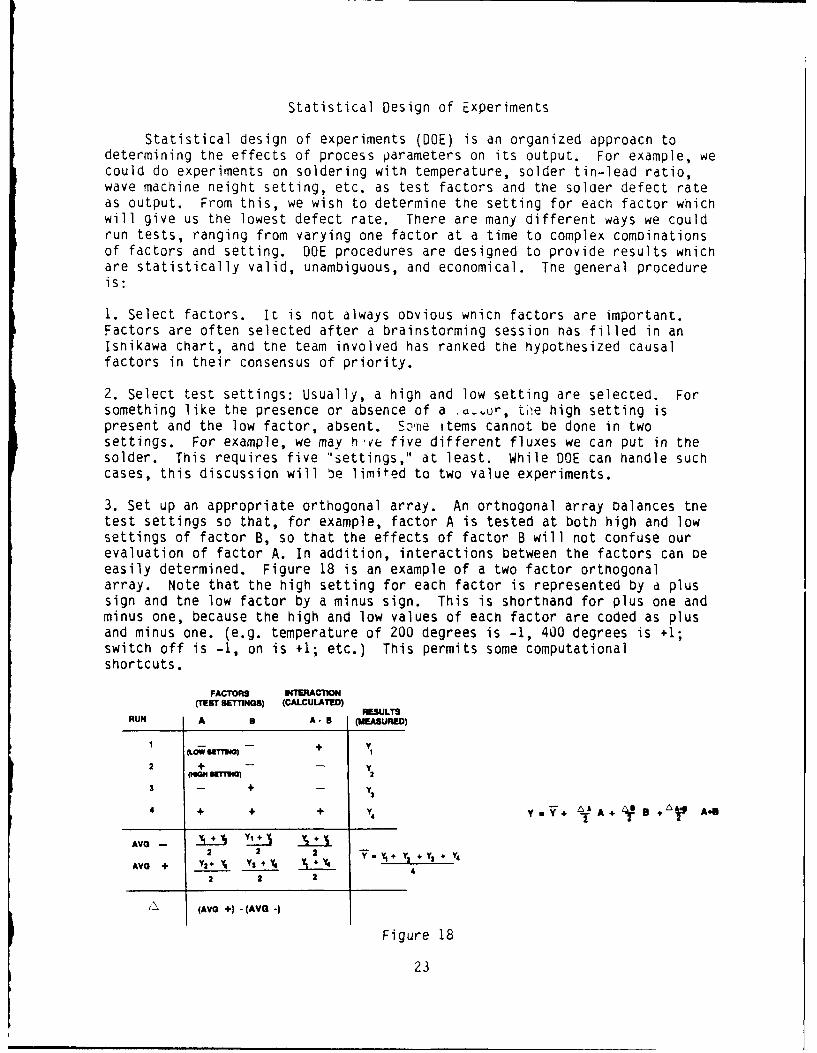
3. Set up an appropriate orthogonal array. An orthogonal array balances thetest settings so that, for example, factor A is tested at both high and lowsettings of factor B, so that the effects of factor B will not confuse ourevaluation of factor A. In addition, interactions between the factors can beeasily determined. Figure 18 is an example of a two factor orthogonalarray. Note that the high setting for each factor is represented by d plussign and the low factor by a minus sign. This is shorthand for plus one andminus one, because the high and low values of each factor are coded as plusand minus one. (e.g. temperature of 200 degrees is -1, 400 degrees is +1;switch off is -1, on is +1; etc.) This permits some computationalshortcuts.
FACTORS INTERACION(TEST SETTINGS) (CALCULATED)
RESULTSRUN A U A- B (MEASURED)
1 -- - + yXOW slrIIM 1
2 + - - y
3 (A + 2A -Y3
4 + + + 4Y + 2AA+ a+ A-9
AVG - iJ+ J X.+i22 2 2
AVG + Y2 + 4 YS+Y + .XY4 .. Y +Y
2 2 2
(AVG +) - (AVG .
Figure 18
23
3. Run the tests. The tests can be run once at each setting shown in therows of the array, or multiple times to gather information on the variabilityof the measured results.
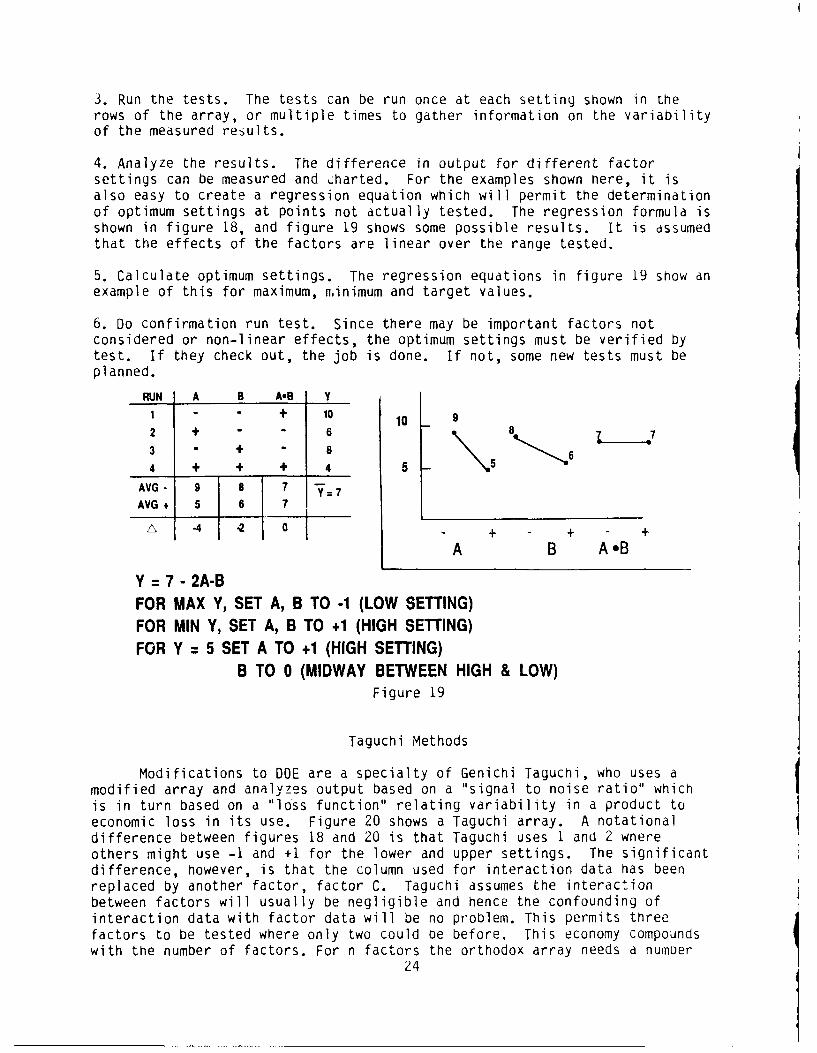
4. Analyze the results. The difference in output for different factorsettings can be measured and charted. For the examples shown here, it isalso easy to create a regression equation which will permit the determinationof optimum settings at points not actually tested. The regression formula isshown in figure 18, and figure 19 shows some possible results. It is assumedthat the effects of the factors are linear over the range tested.
5. Calculate optimum settings. The regression equations in figure 19 show anexample of this for maximum, minimum and target values.
6. Do confirmation run test. Since there may be important factors notconsidered or non-linear effects, the optimum settings must be verified bytest. If they check out, the job is done. If not, some new tests must beplanned.
RUN A B AeB Y
1 - " + 10 1092 + " 6 8 73 " + 8 \
4 + + + 4
AVG - 9 8 7 -Y=7
AVG + 5 6 7
4 2 0 + - + +A B AB
Y 7 - 2A-B
FOR MAX Y, SET A, B TO -1 (LOW SETTING)FOR MIN Y, SET A, B TO +1 (HIGH SETTING)FOR Y = 5 SET A TO +1 (HIGH SETTING)
B TO 0 (MIDWAY BETWEEN HIGH & LOW)Figure 19
Taguchi Methods
Modifications to DOE are a specialty of Genichi Tagucni, who uses amodified array and analyzes output based on a "signal to noise ratio" whichis in turn based on a "loss function" relating variability in a product toeconomic loss in its use. Figure 20 shows a Taguchi array. A notationaldifference between figures 18 and 20 is that Taguchi uses I and 2 wnereothers might use -1 and +1 for the lower and upper settings. The significantdifference, however, is that the column used for interaction data has beenreplaced by another factor, factor C. Taguchi assumes the interactionbetween factors will usually be negligible and hence the confounding ofinteraction data with factor data will be no problem. This permits threefactors to be tested where only two could be before. This economy compoundswith the number of factors. For n factors the orthodox array needs a numoer
24
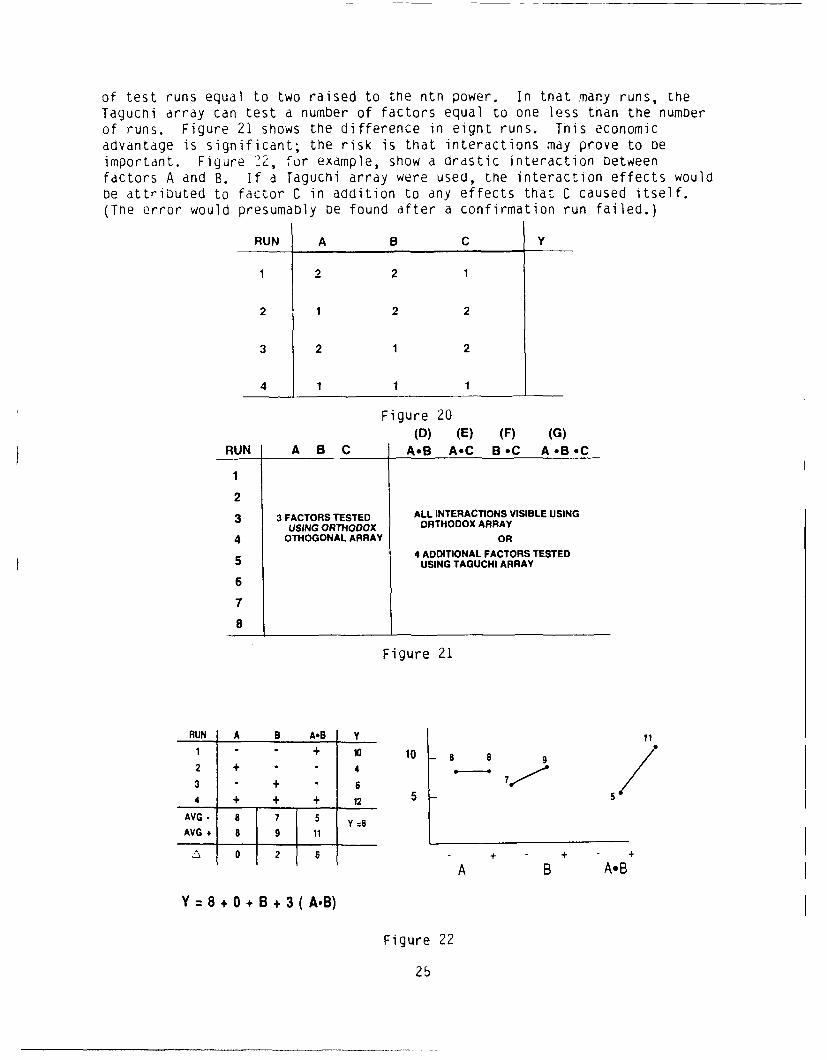
of test runs equal to two raised to the ntn power. In that many runs, theTaguchi array can test a number of factors equal to one less than the numDerof runs. Figure 21 shows the difference in eight runs. This economicadvantage is significant; the risk is that interactions may prove to Deimportant. Figure '22, for example, show a drastic interaction betweenfactors A and B. If a Taguchi array were used, the interaction effects wouldbe attributed to factor C in addition to any effects that C caused itself.(The error would presumably De found after a confirmation run failed.)
RUN A B C Y
1 2 2 1
2 1 2 2
3 2 1 2
4 1 1 1
Figure 20(D) (E) (F) (G)
RUN A B C AB A-C B.C A.B.C
1
2
3 3 FACTORS TESTED ALL INTERACTIONS VISIBLE USINGUSING ORTHODOX ORTHODOX ARRAY
4 OTHOGONAL ARRAY OR
4 ADDITIONAL FACTORS TESTED5 USING TAGUCHI ARRAY
6
7
8
Figure 21
RUN A B AB Y 11
1 + 0 10 8 8 92 + 4
3 + 6
4 + + + 12 5
AVG - 8 7 Y8
AVG. 8 9 11
, 0 2 6 - + B + - +A B A.B
Y 8 + 0 + B + 3 (AB)
Figure 22
25
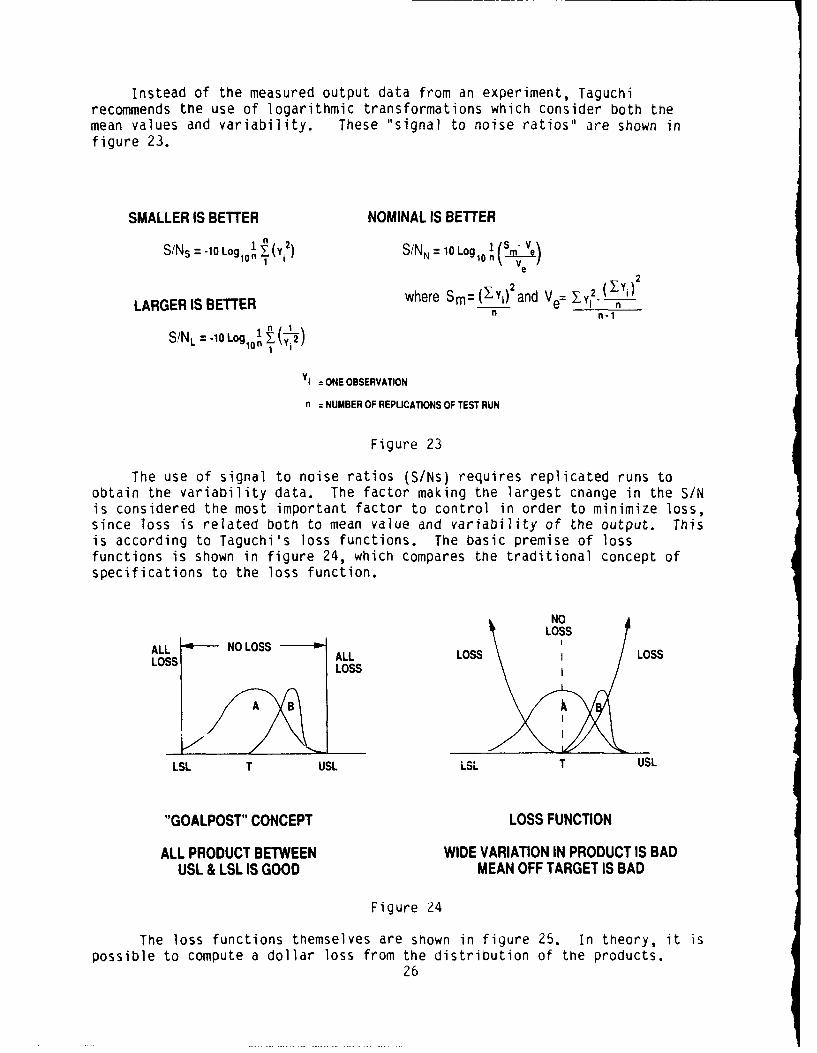
Instead of the measured output data from an experiment, Taguchirecommends the use of logarithmic transformations which consider both themean values and variability. These "signal to noise ratios" are shown infigure 23.
SMALLER IS BETTER NOMINAL IS BETTER
S/Ns = -10 Log 101 Y(Yi) S/N = 10Log Sm"Ve1 10 n V
2
LARGER IS BETTER where Sm=(Yi) and Ve= yi2 inn n-1
S!NL -10 Logion , 2
Y1 = ONE OBSERVATION
n = NUMBER OF REPLICATIONS OF TEST RUN
Figure 23
The use of signal to noise ratios (S/Ns) requires replicated runs toobtain the variability data. The factor making the largest change in the S/Nis considered the most important factor to control in order to minimize loss,since loss is related both to mean value and variability of the output. Thisis according to Taguchi's loss functions. The basic premise of lossfunctions is shown in figure 24, which compares the traditional concept ofspecifications to the loss function.
NOLOSS
ALL NO LOSSLOSS ALL LOSS LOSSLOSS LOSS
A B
LSL T USL LSL T USL
"GOALPOST" CONCEPT LOSS FUNCTION
ALL PRODUCT BETWEEN WIDE VARIATION IN PRODUCT IS BADUSL & LSL IS GOOD MEAN OFF TARGET IS BAD
Figure 24
The loss functions themselves are shown in figure 25. In theory, it ispossible to compute a dollar loss from the distribution of the products.
26
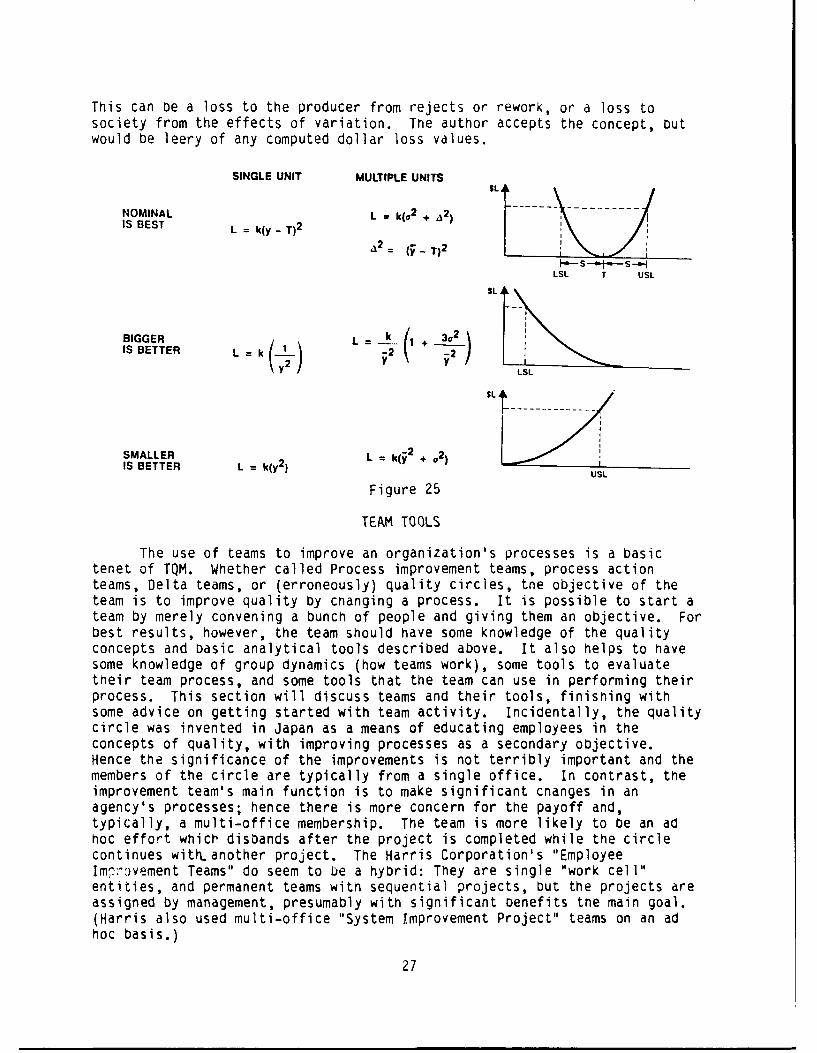
This can be a loss to the producer from rejects or rework, or a loss tosociety from the effects of variation. The author accepts the concept, butwould be leery of any computed dollar loss values.
SINGLE UNIT MULTIPLE UNITS
NOMINAL L = k1o 2 +
IS BEST L = k(y - T)2
A2= (yT) 2
S- SS-
ISI T USI
IS BETTER L k 2 i2 2
Y LSL
SMALLER L = k(j 2 + a )IS BETTER L = k(y 2) US
Figure 25
TEAM TOOLS
The use of teams to improve an organization's processes is a basictenet of TQM. Whether called Process improvement teams, process actionteams, Delta teams, or (erroneously) quality circles, the objective of theteam is to improve quality by cnanging a process. It is possible to start ateam by merely convening a bunch of people and giving them an objective. Forbest results, however, the team should have some knowledge of the qualityconcepts and basic analytical tools described above. It also helps to havesome knowledge of group dynamics (how teams work), some tools to evaluatetheir team process, and some tools that the team can use in performing theirprocess. This section will discuss teams and their tools, finishing withsome advice on getting started with team activity. Incidentally, the qualitycircle was invented in Japan as a means of educating employees in theconcepts of quality, with improving processes as a secondary objective.Hence the significance of the improvements is not terribly important and themembers of the circle are typically from a single office. In contrast, theimprovement team's main function is to make significant cnanges in anagency's processes; hence there is more concern for the payoff and,typically, a multi-office membership. The team is more likely to be an adhoc effort which disbands after the project is completed while the circlecontinues withanother project. The Harris Corporation's "EmployeeIm"r-9vement Teams" do seem to be a hybrid: They are single "work cell"entities, and permanent teams with sequential projects, but the projects areassigned by management, presumably with significant benefits the main goal.(Harris also used multi-office "System Improvement Project" teams on an adhoc basis.)
27
TEAM DYNAMICS
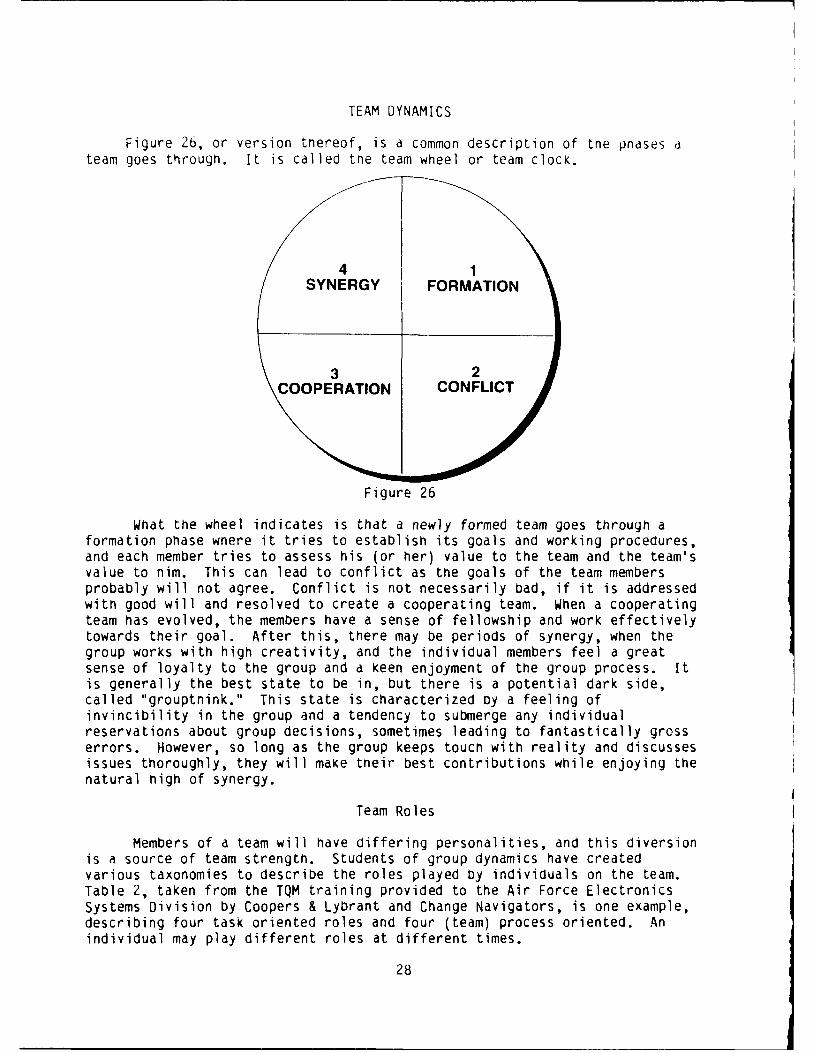
Figure 26, or version tnereof, is a common description of the pnases ateam goes through. It is called the team wheel or team clock.
4SYNERGY FORMATION
3 2COOPERATION CONFLICT
Figure 26
What the wheel indicates is that a newly formed team goes through aformation phase wnere it tries to establish its goals and working procedures,and each member tries to assess his (or her) value to the team and the team'svalue to him. This can lead to conflict as the goals of the team membersprobably will not agree. Conflict is not necessarily bad, if it is addressedwith good will and resolved to create a cooperating team. When a cooperatingteam has evolved, the members have a sense of fellowship and work effectivelytowards their goal. After this, there may be periods of synergy, when thegroup works with high creativity, and the individual members feel a greatsense of loyalty to the group and a keen enjoyment of the group process. Itis generally the best state to be in, but there is a potential dark side,called "grouptnink." This state is characterized by a feeling ofinvincibility in the group and a tendency to submerge any individualreservations about group decisions, sometimes leading to fantastically grosserrors. However, so long as the group keeps touch with reality and discussesissues thoroughly, they will make tneir best contributions while enjoying thenatural high of synergy.
Team Roles
Members of a team will have differing personalities, and this diversionis a source of team strength. Students of group dynamics have createdvarious taxonomies to describe the roles played by individuals on the team.Table 2, taken from the TQM training provided to the Air Force ElectronicsSystems Division by Coopers & Lybrant and Change Navigators, is one example,describing four task oriented roles and four (team) process oriented. Anindividual may play different roles at different times.
28
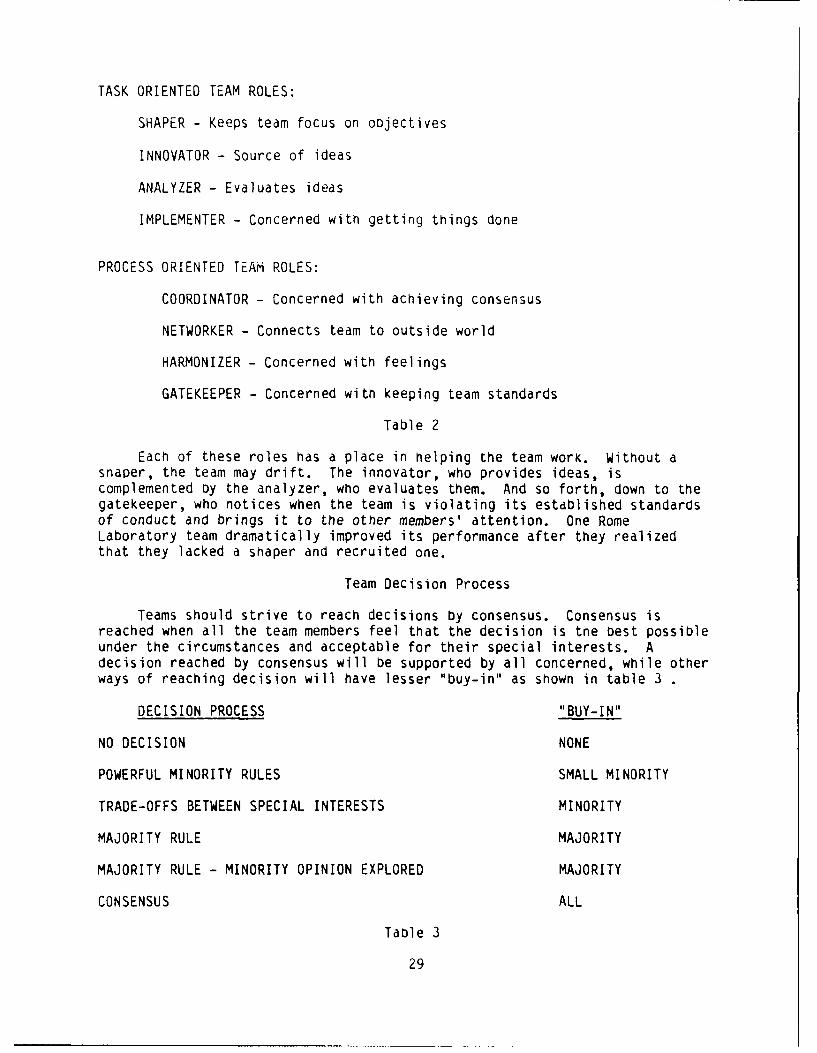
TASK ORIENTED TEAM ROLES:
SHAPER - Keeps team focus on objectives
INNOVATOR - Source of ideas
ANALYZER - Evaluates ideas
IMPLEMENTER - Concerned with getting things done
PROCESS ORIENTED TEAM ROLES:
COORDINATOR - Concerned with achieving consensus
NETWORKER - Connects team to outside world
HARMONIZER - Concerned with feelings
GATEKEEPER - Concerned with keeping team standards
Table 2
Each of these roles has a place in helping the team work. Without asnaper, the team may drift. The innovator, who provides ideas, iscomplemented Dy the analyzer, who evaluates them. And so forth, down to thegatekeeper, who notices when the team is violating its established standardsof conduct and brings it to the other members' attention. One RomeLaboratory team dramatically improved its performance after they realizedthat they lacked a shaper and recruited one.
Team Decision Process
Teams should strive to reach decisions by consensus. Consensus isreached when all the team members feel that the decision is the best possibleunder the circumstances and acceptable for their special interests. Adecision reached by consensus will be supported by all concerned, while otherways of reaching decision will have lesser "buy-in" as shown in table 3
DECISION PROCESS "BUY-IN"
NO DECISION NONE
POWERFUL MINORITY RULES SMALL MINORITY
TRADE-OFFS BETWEEN SPECIAL INTERESTS MINORITY
MAJORITY RULE MAJORITY
MAJORITY RULE - MINORITY OPINION EXPLORED MAJORITY
CONSENSUS ALL
Table 3
29
TEAM PROCESS EVALUATION TOOLS
A team should periodically evaluate its own process. There are avariety of nelpful tools for this. Using the information in the previoussection, a team can evaluate its position on the team wheel, assess tne rolesplayed by the team members (are all necessary roles present?), and discussthe degree of participation in the decision making process. They can alsorate the team climate with a variety of surveys. Generally, tnese use ascale rating each member's agreement with such statements as:
- We are addressing the proper issues- We are able to openly express ideas- We feel comfortable giving feedback- We spend our time well- We often stray from the issue- Everyone is participating- We are following our code of conduct well- Our goals are clear- We have a high level of energy- We usually achieve consensus-etc.
The insight provided by the discussion of the survey results will helpkeep the team operating effectively. Surveys are available in text books andconsultant's manuals. With a little thought, the user can probably create aneffective survey on his own.
Facilitators
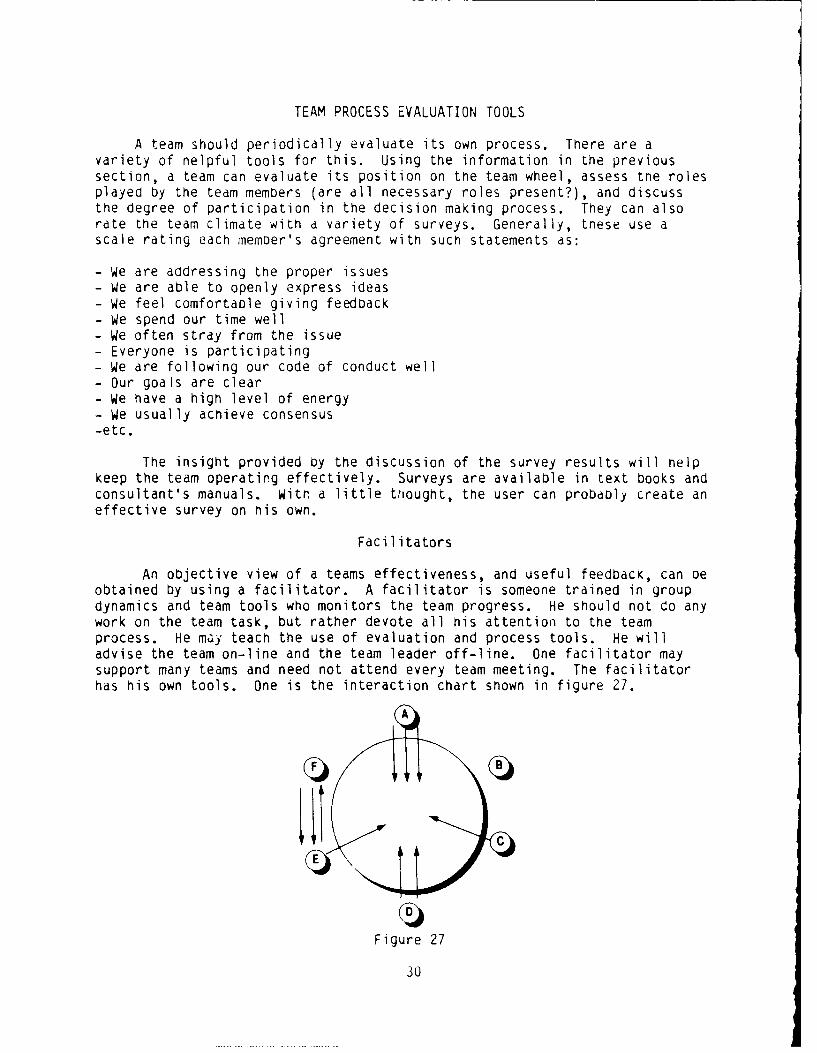
An objective view of a teams effectiveness, and useful feedback, can Deobtained by using a facilitator. A facilitator is someone trained in groupdynamics and team tools who monitors the team progress. He should not do anywork on the team task, but rather devote all his attention to the teamprocess. He may teach the use of evaluation and process tools. He willadvise the team on-line and the team leader off-line. One facilitator maysupport many teams and need not attend every team meeting. The facilitatorhas his own tools. One is the interaction chart shown in figure 27.
Figure 27
30
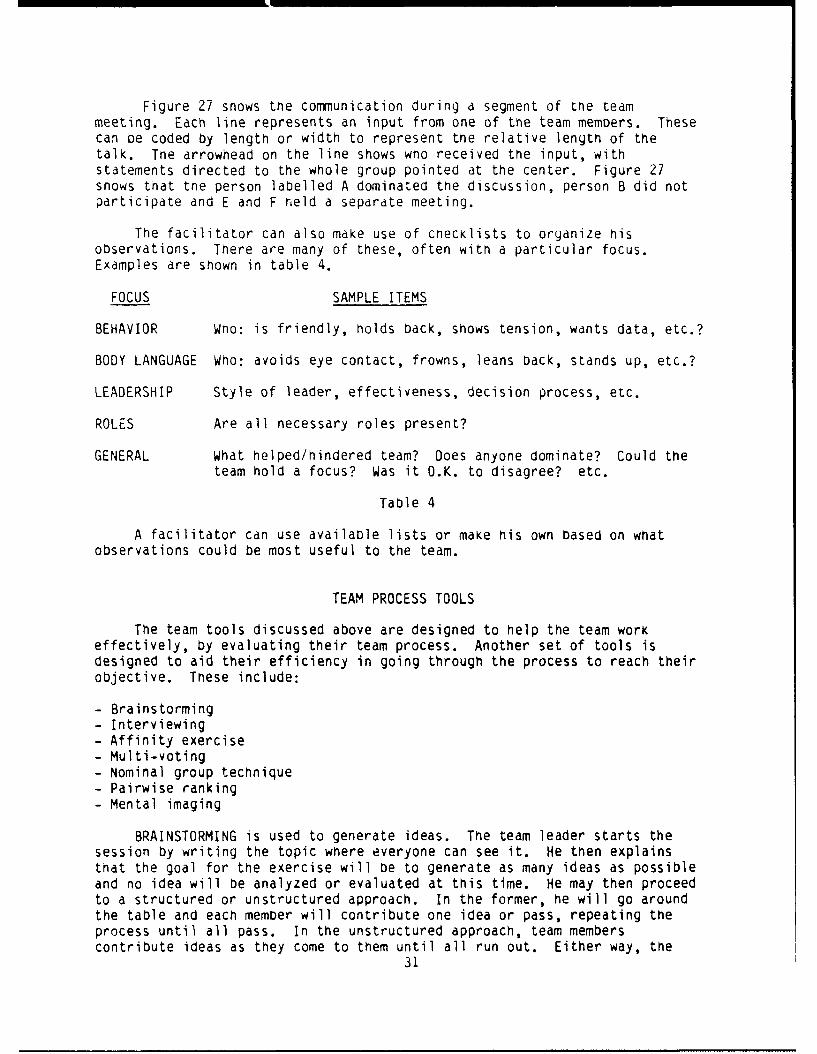
Figure 27 snows the communication during a segment of the teammeeting. Each line represents an input from one of the team members. Thesecan be coded by length or width to represent the relative length of thetalk. Tne arrowhead on the line shows who received the input, withstatements directed to the whole group pointed at the center. Figure 27shows that tne person labelled A dominated the discussion, person B did notparticipate and E and F held a separate meeting.
The facilitator can also make use of cnecKlists to organize hisobservations. There are many of these, often with a particular focus.Examples are shown in table 4.
FOCUS SAMPLE ITEMS
BEHAVIOR Who: is friendly, holds back, shows tension, wants data, etc.?
BODY LANGUAGE Who: avoids eye contact, frowns, leans back, stands up, etc.?
LEADERSHIP Style of leader, effectiveness, decision process, etc.
ROLES Are all necessary roles present?
GENERAL What helped/hindered team? Does anyone dominate? Could theteam hold a focus? Was it O.K. to disagree? etc.
Table 4
A facilitator can use available lists or make his own based on whatobservations could be most useful to the team.
TEAM PROCESS TOOLS
The team tools discussed above are designed to help the team workeffectively, by evaluating their team process. Another set of tools isdesigned to aid their efficiency in going through the process to reach theirobjective. These include:
- Brainstorming- Interviewing- Affinity exercise- Multi-voting- Nominal group technique- Pairwise ranking- Mental imaging
BRAINSTORMING is used to generate ideas. The team leader starts thesession by writing the topic where everyone can see it. He then explainsthat the goal for the exercise will be to generate as many ideas as possibleand no idea will be analyzed or evaluated at this time. He may then proceedto a structured or unstructured approach. In the former, he will go aroundthe table and each member will contribute one idea or pass, repeating theprocess until all pass. In the unstructured approach, team memberscontribute ideas as they come to them until all run out. Either way, the
31
ideas are written down as they come. A brainstorming session typically runsabout 15 minutes; the results are often amazing. Once the ideas arecaptured, they can be discussed, organizeo, and evaluated.
INTERVIEWING is the way Lne team obtains inputs from stakeholders inthe project who are not on the team. The process starts with theidentification of the stakeholders, and the team should strive to include allpossiole viewpoints. A list of questions snould then be prepared (or a setof lists, if appropriate), and appointments made with the people to beinterviewed. Two interviewers are recommended; one does the talKing and theother takes notes. The stakeholder should do most of the talking and shouldbe encouraged to fully express nis views. The team members should neverargue or judge the input during the interview. The stakenolder should bethanked for nis input, and the team must scrupulously perform any follow upactivity promised to the stakeholder. It is usually appropriate to give thestakeholder some feedback of results, sucn as a copy of the team's finalreport.
THE AFFINITY EXERCISE is another idea generator. It starts with asilent brainstorming session. For 15 minutes, the participants write theirideas on post-it notes, one idea per note, without any discussion. All notesare then posted on a wall, and for 20 minutes the participants read the notesand group similar idea by putting the notes together. This also is donewithout discussion. Then a discussion is held to develop a theme for eachgroup of notes. The theme will be a noun-verb combination such as "reducepaperwork." The themes are then grouped into action plans for makingimprovements. The silent brainstorming is used as it produces far more ideasthan the usual procedures, despite the fact that people cannot build on eachothers ideas.
MULTI VOTING is a way to reduce a list of ideas or recommendations tothose most important. Each member of the team is given a number of votesequal to about half the number of items on the list. Everyone votes for theitems they consider most important. The four to six items getting the mostvotes get the priority. If votes are too close to isolate the top items, theitems receiving few votes can be eliminated and a new multi vote taken on theremainder.
THE NOMINAL GROUP TECHNIQUE is another way to prioritize a list. Aftersimilar ideas have been combined, each item on the list is ranked by eachteam member. Item I is the least important, item 2 the next least important,etc. The individual scores from each team member are then added together,and the item with the hignest score is the most important.
PAIRWISE RANKING assigns priorities by comparing the items on a list toeach other one by one. A matrix is used, as shown in figure 28. The team isasked to compare list item I against 2 and the number of the preferred itemis recorded in the top box of tne matrix. The next row snows the winners ofcomparisons between items I and 3 and between items 2 and 3. After all itemshave been compared, the number of times each item number has been recorded inthe matrix is calculated. The item whose number is recorded most is the mostimportant. Should two items tie, the winner of the comparison between thetwo takes precedence.
32
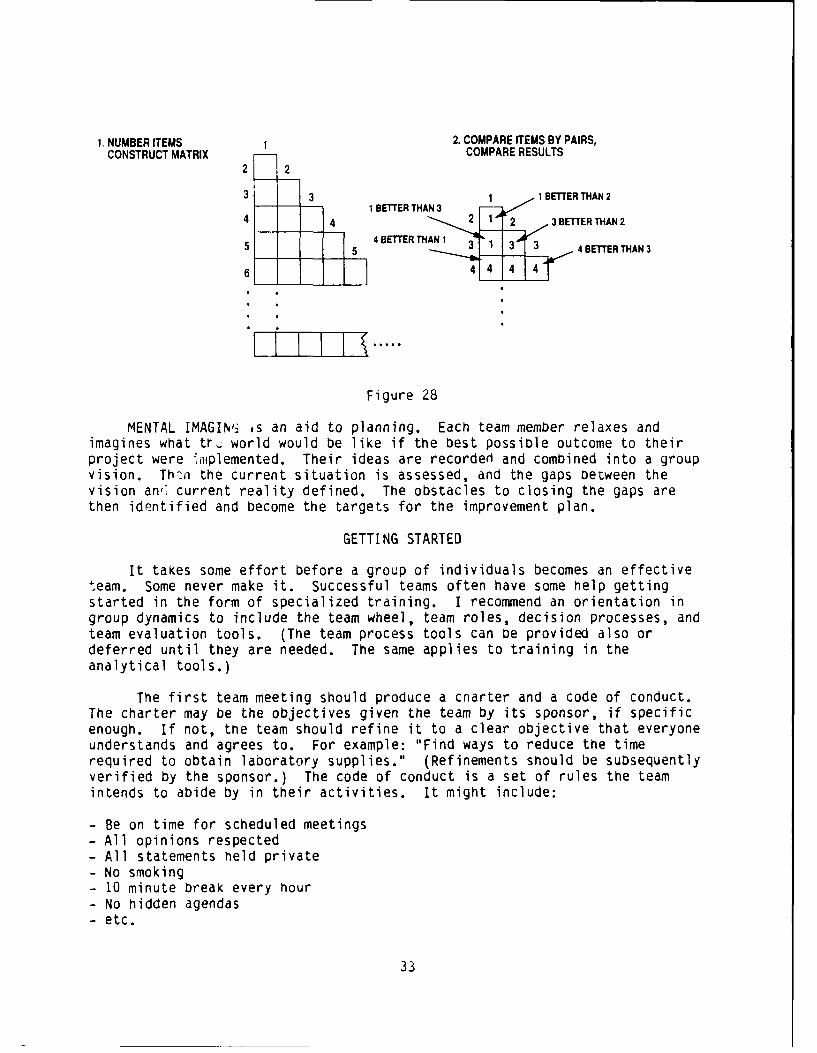
1. NUMBER ITEMS 1 2. COMPARE ITEMS BY PAIRS,CONSTRUCT MATRIX COMPARE RESULTS
2 2
3 1 IBETTER THAN 21 BETTER THAN 3
4 4 2 1 2 3BETTERTHAN24BETTER THAN 1 1J3
5 5BTERHN 3 1 3 3 4 BETTER THAN 3
6 44 4
I1 1111 ..
Figure 28
MENTAL IMAGIN 2 is an aid to planning. Each team member relaxes andimagines what tr. world would be like if the best possible outcome to theirproject were ,inplemented. Their ideas are recorded and combined into a groupvision. Then the current situation is assessed, and the gaps Detween thevision an, current reality defined. The obstacles to closing the gaps arethen identified and become the targets for the improvement plan.
GETTING STARTED
It takes some effort before a group of individuals becomes an effectiveteam. Some never make it. Successful teams often have some help gettingstarted in the form of specialized training. I recommend an orientation ingroup dynamics to include the team wheel, team roles, decision processes, andteam evaluation tools. (The team process tools can be provided also ordeferred until they are needed. The same applies to training in theanalytical tools.)
The first team meeting should produce a cnarter and a code of conduct.The charter may be the objectives given the team by its sponsor, if specificenough. If not, the team should refine it to a clear objective that everyoneunderstands and agrees to. For example: "Find ways to reduce the timerequired to obtain laboratory supplies." (Refinements should be subsequentlyverified by the sponsor.) The code of conduct is a set of rules the teamintends to abide by in their activities. It might include:
- Be on time for scheduled meetings- All opinions respected- All statements held private- No smoking- 10 minute break every hour- No hidden agendas- etc.
33
With the charter adrd ?:-de f conduct, the team: s sarting in anorganized fashion, The nelr of d trained facilitdtor is probably the mostvaluable in start up, to head off any Dad nabits. Some good naoits to startwith are the recording of minutes, the making and following of agendas, andthe evaluation of task progress and team process at the end of each meeting.A simple evaluation should usually suffice (Is progress good or not, andwnere are we on the team wheel?) with more involved evaluation used wnen tnesimple answers are not good (getting nowhere and still in conflict).
ACTION PLANS
Action plans are ways of organizing quality improvement efforts. Tnemost well known are the Shewhart cycle and the Quality Improvement Story.The Air Force Electronic Systems Division uses one called "Chart It - CheckIt - Cnange It" (C-cubed-I) whicn tracks, nomenclature-wise, with its missionto provide Command, Control, Communications and Intelligence (C-cubed-I)systems. Boeing uses a procedure simply called a seven step model forprocess improvement.
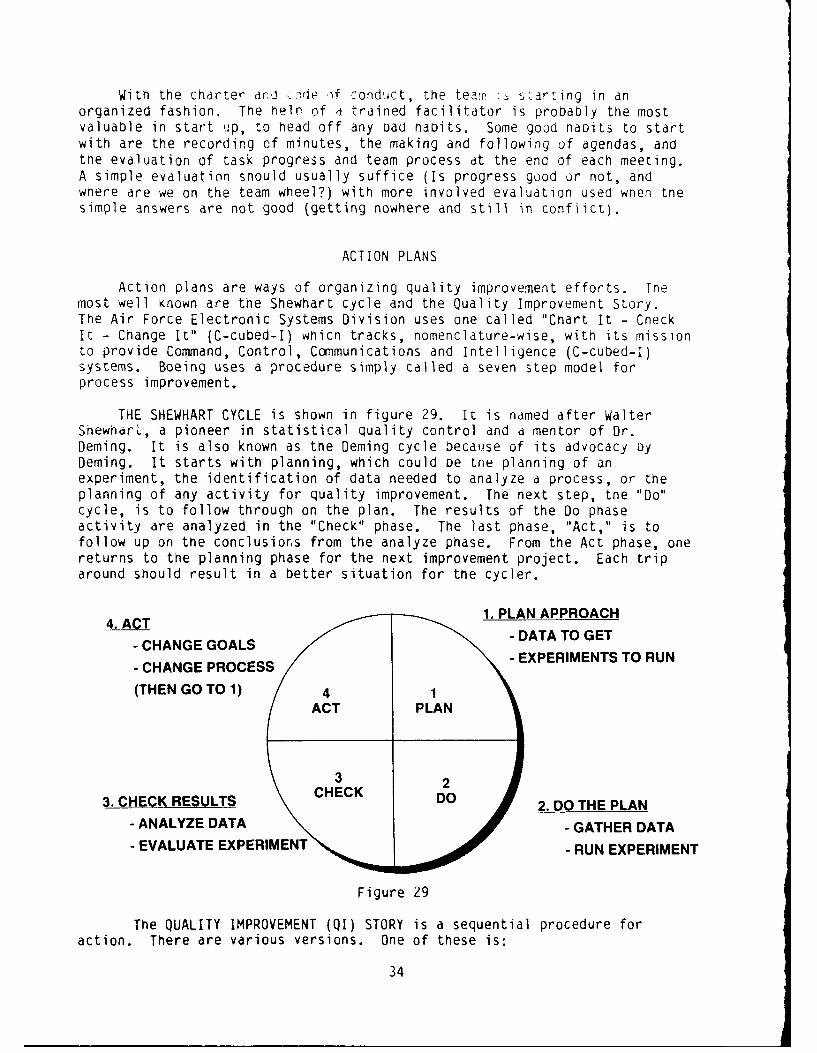
THE SHEWHART CYCLE is shown in figure 29. It is named after WalterShewnarL, a pioneer in statistical quality control and a mentor of Dr.Deming. It is also known as the Deming cycle because of its advocacy byDeming. It starts with planning, which could oe tne planning of anexperiment, the identification of data needed to analyze a process, or theplanning of any activity for quality improvement. The next step, tne "Do"cycle, is to follow through on the plan. The results of the Do phaseactivity are analyzed in the "Check" phase. The last phase, "Act," is tofollow up on the conclusions from the analyze phase. From the Act phase, onereturns to the planning phase for the next improvement project. Each triparound should result in a better situation for the cycler.
4. AC. 1. PLAN APPROACH
- CHANGE GOALS - DATA TO GET
- CHANGE PROCESS - EXPERIMENTS TO RUN
(THEN GO TO 1) 4rACT PLAN
3 2
3. CHECK RESULTS CHECK DO 2. DO THE PLAN
- ANALYZE DATA - GATHER DATA
-EVALUATE EXPERIMENT - RUN EXPERIMENT
Figure 29
The QUALITY IMPROVEMENT (QI) STORY is a sequential procedure foraction. There are various versions. One of these is:
34
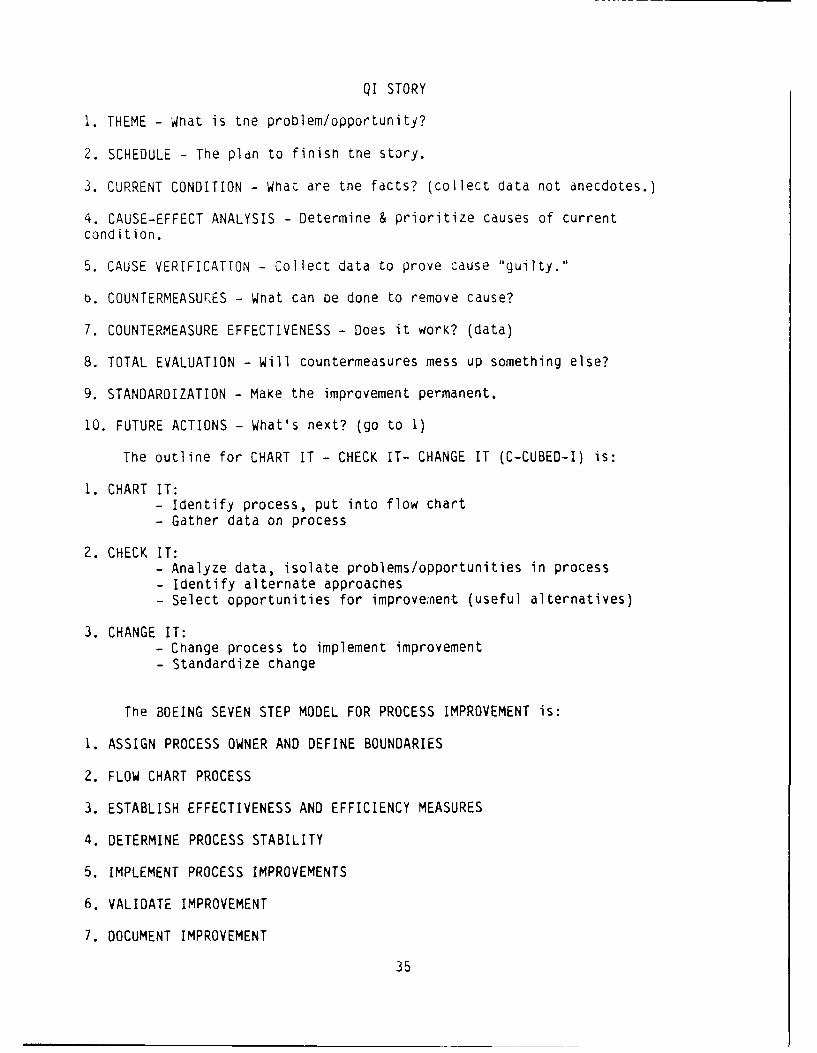
QI STORY
1. THEME - What is the problem/opportunity?
2. SCHEDULE - The plan to finish the story.
3. CURRENT CONDITION - What are the facts? (collect data not anecdotes.)
4. CAUSE-EFFECT ANALYSIS - Determine & prioritize causes of currentcondition.
5. CAUSE VERIFICATTON - Collect data to prove cause "guilty."
6. COUNTERMEASUPES - What can be done to remove cause?
7. COUNTERMEASURE EFFECTIVENESS - Does it work? (data)
8. TOTAL EVALUATION - Will countermeasures mess up something else?
9. STANDARDIZATION - Make the improvement permanent.
10. FUTURE ACTIONS - What's next? (go to 1)
The outline for CHART IT - CHECK IT- CHANGE IT (C-CUBED-I) is:
1. CHART IT:- Identify process, put into flow chart- Gather data on process
2. CHECK IT:- Analyze data, isolate problems/opportunities in process- Identify alternate approaches- Select opportunities for improve;nent (useful alternatives)
3. CHANGE IT:- Change process to implement improvement- Standardize change
The BOEING SEVEN STEP MODEL FOR PROCESS IMPROVEMENT is:
1. ASSIGN PROCESS OWNER AND DEFINE BOUNDARIES
2. FLOW CHART PROCESS
3. ESTABLISH EFFECTIVENESS AND EFFICIENCY MEASURES
4. DETERMINE PROCESS STABILITY
5. IMPLEMENT PROCESS IMPROVEMENTS
6. VALIDATE IMPROVEMENT
7. DOCUMENT IMPROVEMENT
35
ASSESSING QUALITY EFFORTS
The Malcolm Baldridge National Quality Award
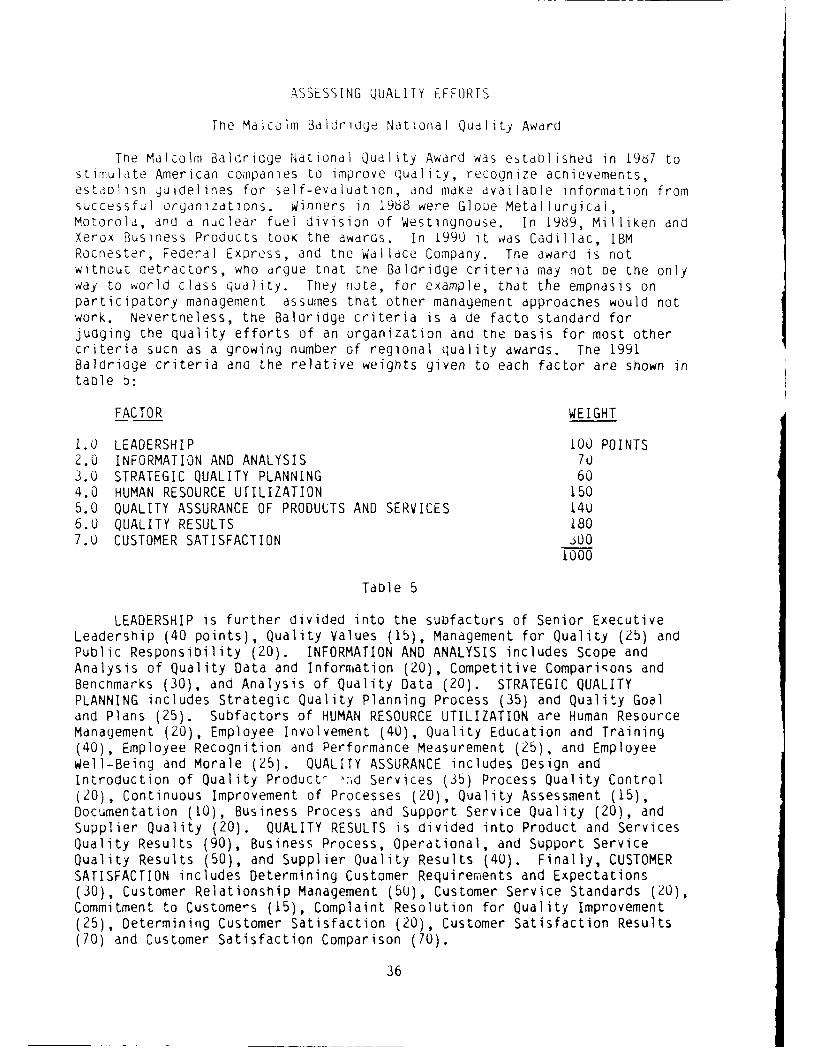
The Malcolm Baldridge National Quality Award was e tdblisned in 1967 tostimulate American companies to improve quality, recognize achievements,esta.olsn guidelines for self-evaluation, and make available information fromsuccessful organizations. Winners in 1988 were Glooe Metallurgical,Motorola, and a nuclear fuel division of Westingnouse. In 1989, Milliken andXerox Business Products took the awards. In 1990 it was Cadillac, IBMRocnester, Federal Express, and the Wallace Company. Tne award is notwithout detractors, who argue tnat the Baldridge criteria may not be the onlyway to world class quality. They note, for example, that the empnasis onparticipatory management assumes that other management approaches would notwork. Nevertneless, the Baldridge criteria is a de facto standard forjudging the quality efforts of an organization and the oasis for most othercriteria such as a growing number of regional quality awards. The 1991Baldridge criteria and the relative weights given to each factor are shown intable 5:
FACTOR WEIGHT
1.0 LEADERSHIP 100 POINTS2.0 INFORMATION AND ANALYSIS 7U3.0 STRATEGIC QUALITY PLANNING 604.0 HUMAN RESOURCE UTILIZATION 1505.0 QUALITY ASSURANCE OF PRODUCTS AND SERVICES 14U6.0 QUALITY RESULTS 1807.0 CUSTOMER SATISFACTION i00
1000
Table 5
LEADERSHIP is further divided into the subfactors of Senior ExecutiveLeadership (40 points), Quality Values (15), Management for Quality (25) andPublic Responsibility (20). INFORMATION AND ANALYSIS includes Scope andAnalysis of Quality Data and Information (20), Competitive Comparisons andBenchmarks (30), and Analysis of Quality Data (20). STRATEGIC QUALITYPLANNING includes Strategic Quality Planning Process (35) and Quality Goaland Plans (25). Subfactors of HUMAN RESOURCE UTILIZATION are Human ResourceManagement (20), Employee Involvement (40), Quality Education and Training(40), Employee Recognition and Performance Measurement (25), and EmployeeWell-Being and Morale (25). QUALITY ASSURANCE includes Design andIntroduction of Quality Product - ,-,d Services (35) Process Quality Control(20), Continuous Improvement of Processes (20), Quality Assessment (15),Documentation (10), Business Process and Support Service Quality (20), andSupplier Quality (20). QUALITY RESULTS is divided into Product and ServicesQuality Results (90), Business Process, Operational, and Support ServiceQuality Results (50), and Supplier Quality Results (40). Finally, CUSTOMERSATISFACTION includes Determining Customer Requirements and Expectations(30), Customer Relationship Management (5U), Customer Service Standards (20),Commitment to Customers (15), Complaint Resolution for Quality Improvement(25), Determining Customer Satisfaction (20), Customer Satisfaction Results(70) and Customer Satisfaction Comparison (70).
36
Each of these subfactors is further divided into two to four areas toaddress. As a result, Baldridge applications take significant effort.However, the process gives the preparer a deep insight into nisorganization's quality efforts. Without any intent to apply for the award,an organization can take advantage of the criteria for a self-assessment. Acopy of the Applications Guidelines can be obtained, free, from:
Malcolm Baldridge National Quality AwardNational Institute of Standards and TechnologyRoute 270 & Quince Orchard RoadAdministration BLDG, Room A537Gdithersberg MD 20899(Telephone 301-975-2036)
The Quality Improvement Prototype (QIP) Award
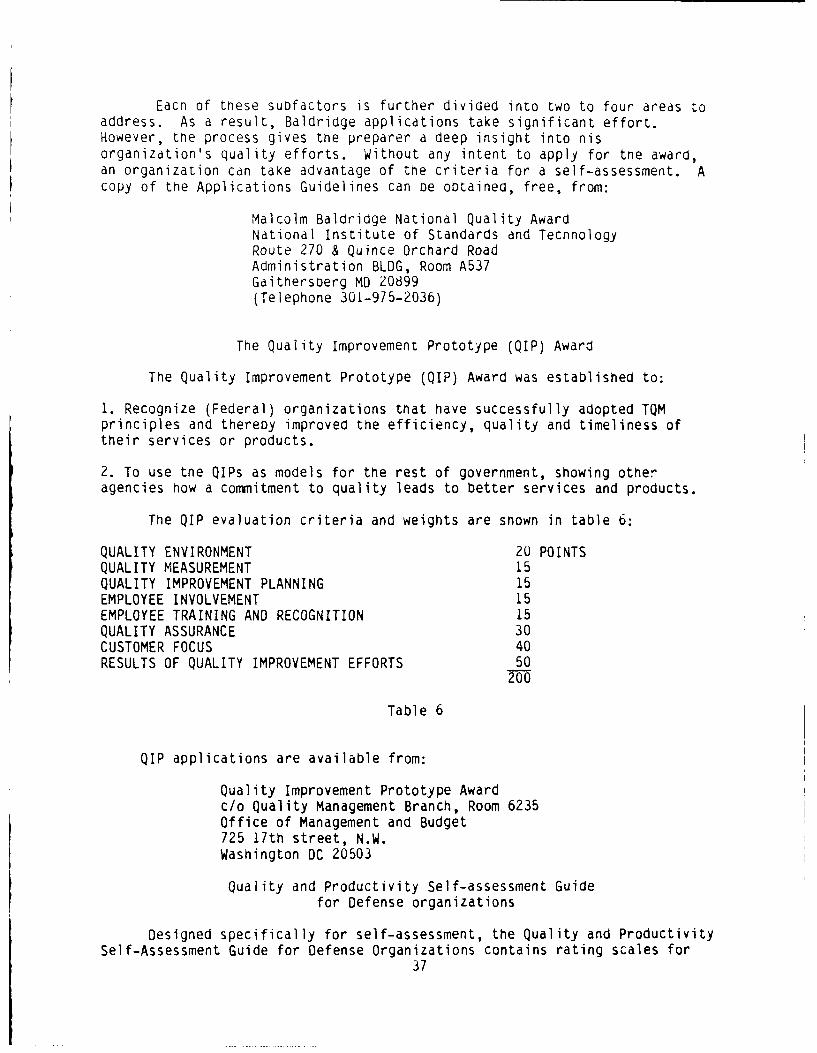
The Quality Improvement Prototype (QIP) Award was established to:
1. Recognize (Federal) organizations that have successfully adopted TQMprinciples and thereby improved the efficiency, quality and timeliness oftheir services or products.
2. To use the QIPs as models for the rest of government, showing otheragencies how a commitment to quality leads to better services and products.
The QIP evaluation criteria and weights are shown in table 6:
QUALITY ENVIRONMENT 20 POINTSQUALITY MEASUREMENT 15QUALITY IMPROVEMENT PLANNING 15EMPLOYEE INVOLVEMENT 15EMPLOYEE TRAINING AND RECOGNITION 15QUALITY ASSURANCE 30CUSTOMER FOCUS 40RESULTS OF QUALITY IMPROVEMENT EFFORTS 50
200
Table 6
QIP applications are available from:
Quality Improvement Prototype Awardc/o Quality Management Branch, Room 6235Office of Management and Budget725 17th street, N.W.Washington DC 20503
Quality and Productivity Self-assessment Guidefor Defense organizations
Designed specifically for self-assessment, the Quality and ProductivitySelf-Assessment Guide for Defense Organizations contains rating scales for
37
Climate (peoples perceptions about the organization), Processes (tneorganizations policies and practices), Tools (specific techniques used topromote quality) and Outcomes (results). The climate questions can be givenseparately with the idea that a broad survey of climate and a smaller sampleof the other factors would be effective. A scoring guide includessuggestions to help raise low ratings. The guide is available in anautomated format for use with a personal computer.
Copies may be requested from:
John DenslowOASD/DPPOTwo Skyline Place, Room 14U45203 Leesburg TurnpikeFalls Church VA 22041-3466(Telephone 703-756-2346)
MEASURING THE QUALITY OF KNOWLEDGE WORK
Measuring quality is most difficult for the managers of knowledgeworkers. One reason is that there is no universally accepted standarddefinition for quality. Indeed, David A. Garvin identified five categoriesof definitions for quality. These are:
1. Transcendent quality: a subjective feeling of "goodness".
2. Product-based quality: measured by attributes of the product
3. Manufacturing-based quality: conformance to the specifications
4. Value-based quality: "goodness" for the price
5. User-based quality: the capacity to satisfy the customer
One should note that the categories are not mutually exclusive. Inparticular, no matter which definition is used, quality is always ultimatelydefined oy the customer (i.e. user-based). Let's look at these categoriesand see how they apply to knowledge work.
Transcendent Quality Measures
Transcendent quality measures are merely means for capturing subjectiveopinions. The most common tool used is the rating scale. For example, cakemixes are tested by submitting their products to a panel which rates thetaste of the cake on a scale from one to five, with five being the Destpossible. Knowledge workers sometimes use peer ratings in a similar manner.When an attribute is actually subjective, like taste, the transcendent cannotbe challenged. In areas where other measures are possible, the moreobjective measures are generally preferable. Even so, the transcendentopinion of the customer is the most important measure of one's quality.
In the author's opinion, a useful area for transcendent measures ofquality is in the appraisal of individual performance. Dr. Deming condemns
38
the use of annual appraisals for several reasons. However, appraisal systemswill probably oe with us for a while, and the use of transcendent measuresmay be one way to make them work. My recommendation is to use generalcategories (e.g. shows initiative) scored by the suDjective opinion of theemployee's supervisor, on tne assumption that the supervisor's transcendentquality judgement of the employee is likely to be an accurate measure (Hewill know quality work when ne sees it).
Even when using more objective quality definitions, tne transcendent canbe useful as a "sanity check". If a measured quality value "feels" too nighor too low, pernaps your intuition is calling for you to reevaluate yourselection of measures.
Product-based Quality Measures
Product-based quality is measured by the amount of some desiredingredient or attribute. For example, the speed of a computer. In Knowledgework, one desired attribute may be innovation. The difference is, of course,that it is much easier to measure speed.
Since innovation and other intangible features are desired not forthemselves, but for their impact on the product, measurable units such asspeed will reflect the quality of knowledge work once the worK istransitioned into hardware or software. Under such circumstances, systemparameters can be measured to establish the quality of the underlyingknowledge work. One would select the only most meaningful measures. To beeffective as quality measures, however, the measured values must bereferenced to some benchmarks. For example, the speed of a computer isuseless for quality evaluation unless the analyst knows what other machinesdeliver.
A problem with attribute measures is that trade-offs may not berecognized. Speed may be enhanced at the expense of payload which may or maynot be an improvement overall. One way to evaluate this is the use of all-encompassing measures such as "systems effectiveness," defined as a functionof a system's availability, dependability and capability against a specifiedthreat. In the simplest case, availability is the probability of a systembeing operable when needed, dependability the probability that it will remainoperable for the length of a mission and capability the conditionalprobability that, if operating, it will successfully complete the mission.For this simple case:
System Effectiveness = (Availability)x(Dependability)x(Capability)
An approach between the measurement of a few selected parameters and thecalculation of system effectiveness is the use of indexes. Indexes areartificial, but supposedly not arbitrary, groupings of measures into anoverall single measure. Examples are the consumer price index and the indexof leading economic indicators. Similarly, a quality index can be created byidentifying parameters of interest, establishing measures, weighing themeasures and combining them into one. As a simple example, Robert Gunninginvented a "fog index" for evaluating understandability of text, calculatedby computing the average sentence length, adding this to the number of wordsof three syllables or more in 100 words, then multiplying by 0.4. Though
39
Gunning claims nis index corresponds rougnly witn tne number of years ofschooling a person would require to read tne text 4ith reasonable ease, anindex figure is generally not meaningful in absolute terms, out, rather,useful for showing trends.
The more tangiole the product, the oetter product-oased measures work.However, in knowledge work the product is often intangible, sucn as a set ofrecommendations, so product parameters cannot be measured. One alternativeis to use even more indirect measures so long as they also correlate with thethe attributes desired. For example, a large number of patents held snouldindicate an innovative agency. Some other measures might be the ratio of in-house to contracted work, numbers of papers published, resources spent oneducation and training activities, advanced degrees earned, name requests forconsulting committees received, and the amount of national/internationalprofessional activity among the knowledge workers. These are measures of thelaboratory climate or environment favoring quality knowledge work.
One could also measure the climate opposing quality in knowledge work.Common measures indirectly showing unfavorable climates include absenteeism,turnover percentage, average sick days taken per employee, etc. Poorenvironments could perhaps be more directly measured by the number ofapprovals required to do work, the ratio of overhead to productive activity,the length of time required to obtain a part or a piece of test equipment,etc. These could be labelled "Hassle Indexes."
Manufacturing-based Quality Measures
Perhaps the best illustration of manufacturing-based quality definitionswas proposed by Philip Crosby, who equated quality to compliance with
specifications. This, of course presumes tangible products or services,which for knowledge work could include such items as technical reports andbriefings as well as the more obvious hardware and software end products.
The most commonly used manufacturing-based quality measure is defectrate (i.e. the percent of the product not in compliance to specifications).Defect rate is a universal quality measure and can be applied to knowledgework as well as manufacturing by formulating an appropriate operatingdefinition of defect. Cycle time is another widely used manufacturing-basedmeasure which is easily applied to knowledge work.
Another manufacturing-based quality measure is the variation amongproducts. All products will have some variation, and the greater this is,the more defects there will be. Variance can be measured in various ways,such as by range or by standard deviation (sigma). The lower the value ofsigma, the more uniformity in the product. Variance, however, is not thewhole story. Both the mean and variance are important. A measure whichconsiders both is called process capability (Cp). It compares the mean andvariance of a product parameter to specified limits.
Cp = (upper specification limit - lower specification limit)6 sigma
40
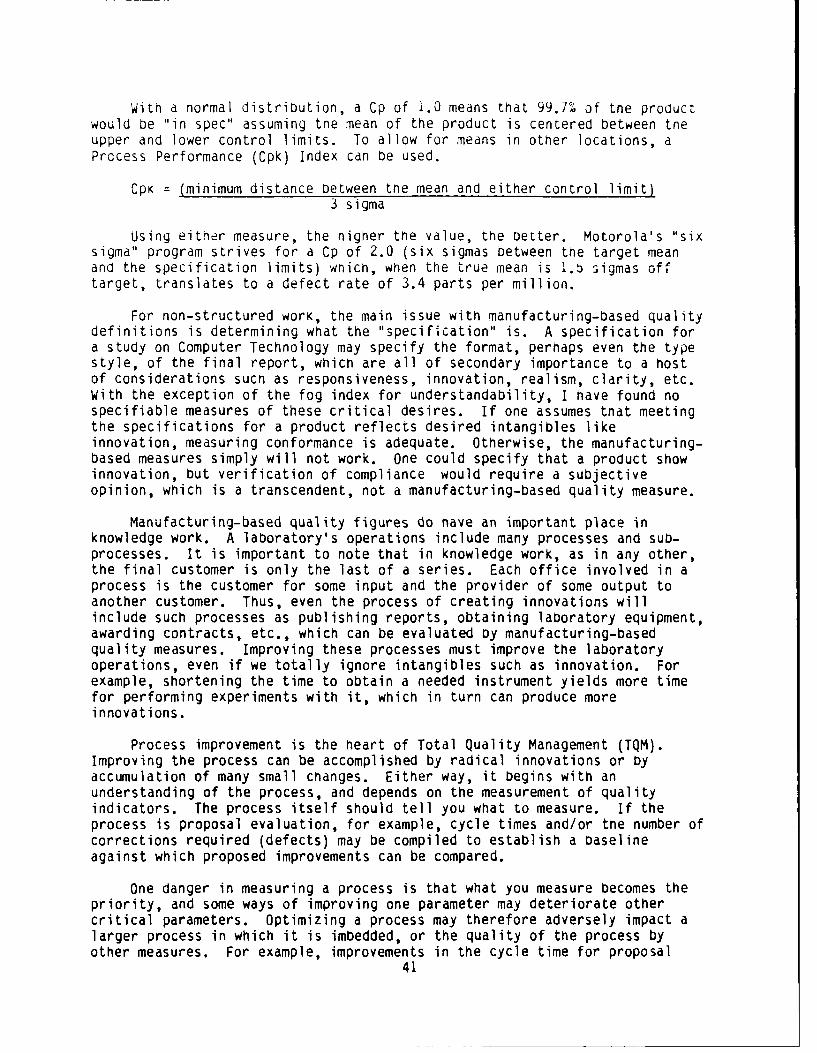
With a normal distribution, a Cp of 1.0 means that 99.70 of the productwould De "in spec" assuming the mean of the product is centered between tneupper and lower control limits. To allow for means in other locations, aProcess Performance (Cpk) Index can be used.
CpK = (minimum distance between tne mean and either control limit)3 sigma
Using either measure, the higher the value, the Detter. Motorola's "sixsigma" program strives for a Cp of 2.0 (six sigmas between the target meanand the specification limits) which, when the true mean is 1.t sigmas offtarget, translates to a defect rate of 3.4 parts per million.
For non-structured work, the main issue with manufacturing-based qualitydefinitions is determining what the "specification" is. A specification fora study on Computer Technology may specify the format, perhaps even the typestyle, of the final report, which are all of secondary importance to a hostof considerations sucn as responsiveness, innovation, realism, clarity, etc.With the exception of the fog index for understandability, I have found nospecifiable measures of these critical desires. If one assumes that meetingthe specifications for a product reflects desired intangibles likeinnovation, measuring conformance is adequate. Otherwise, the manufacturing-based measures simply will not work. One could specify that a product showinnovation, but verification of compliance would require a subjectiveopinion, which is a transcendent, not a manufacturing-based quality measure.
Manufacturing-based quality figures do nave an important place inknowledge work. A laboratory's operations include many processes and sub-processes. It is important to note that in knowledge work, as in any other,the final customer is only the last of a series. Each office involved in aprocess is the customer for some input and the provider of some output toanother customer. Thus, even the process of creating innovations willinclude such processes as publishing reports, obtaining laboratory equipment,awarding contracts, etc., which can be evaluated by manufacturing-basedquality measures. Improving these processes must improve the laboratoryoperations, even if we totally ignore intangibles such as innovation. Forexample, shortening the time to obtain a needed instrument yields more timefor performing experiments with it, which in turn can produce moreinnovations.
Process improvement is the heart of Total Quality Management (TQM).Improving the process can be accomplished by radical innovations or byaccumulation of many small changes. Either way, it begins with anunderstanding of the process, and depends on the measurement of qualityindicators. The process itself should tell you what to measure. If theprocess is proposal evaluation, for example, cycle times and/or the number ofcorrections required (defects) may be compiled to establish a baselineagainst which proposed improvements can be compared.
One danger in measuring a process is that what you measure becomes thepriority, and some ways of improving one parameter may deteriorate othercritical parameters. Optimizing a process may therefore adversely impact alarger process in which it is imbedded, or the quality of the process byother measures. For example, improvements in the cycle time for proposal
41
evaluations can be made by taking less care in doing the work, for a loss inquality measured by the number of errors. As always, the test of value addedis the overall impact on the customer.
Value-based Quality Measures
In value-based quality definitions, cost is d consideration. A low costautomobile which provides dependable and reasonably comfortaoletransportation would De considered a quality vehicle even if it does not havethe features of a Rolls-Royce. In fact, the Rolls-Royce may De consideredtoo expensive for what it provides and hence not good value for the averageconsumer. Quality is also not independent of schedule. As discussed aDo.e,cycle time is a measure of quality, but improving cycle time can adverselyaffect other facets of quality such as product defect rates. Conversely, agood product delivered too late may be of no use to tne customer.
The author's view of value-based quality is that every product, serviceor process can be measured in three dimensions: cost, time, and some measureof "goodness," such as percent defects. Improvements wnich change onewithout detriment to the other two are always worthwhile. Other changes mayor may not be worthwhile depending on the overall effect on the customer.While the trade-offs between cost, schedule and "goodness" can be asubjective matter, all quality decisions snould try to balance the threeconsiderations. For example, contracting can be measured by cycle time(schedule), overhead man-hours (cost) and number of protests per contract(defects). Measuring only one of these invites sacrificing the others. Forease of reference, let's call a balanced combination of cost, schedule and"goodness" measurements a "quality troika."
Another approach to using value-based measures is to distinguish betweeneffectiveness and efficiency. Effectiveness measures the "goodness" of aproduct or service for its user, while efficiency considers the cost ofmaking it happen. To illustrate the difference, consider tne example ofsupplying integrated circuits meeting the customers needs Dy making much morethan ordered and screening the output. The customer may be pleased with theproduct (high effectiveness), but the cost of quality will be higher than itshould be (low efficiency). Effectiveness can be measured perhaps by sales(or the laboratory equivalent: amount of external funding), market snare, orone of the product-based measures. Efficiency is measured by tne cost ofquality, overhead rates, or one of the manufacturing-based measures.
The Cost of quality includes the cost of preventing defects, the cost ofinspection, the cost of rework and the cost of waste. Many companiesconsider only the money spent by their quality professionals (in preventionand inspection) as the cost of quality. In reality, a typical company may bespending 25% of its manufacturing costs on rework and scrap. One way ofmeasuring quality could therefore be the determination of all the measurablecomponents of the cost of quality. The lower the cost of quality, the nigherthe efficiency of the quality effort.
Still another approach is the use of calculations based on the Taguchiloss functions. The computed loss can represent actual costs for repair of adefect, or immeasurable costs such as lost business or the "loss to society"because of poor quality.
42
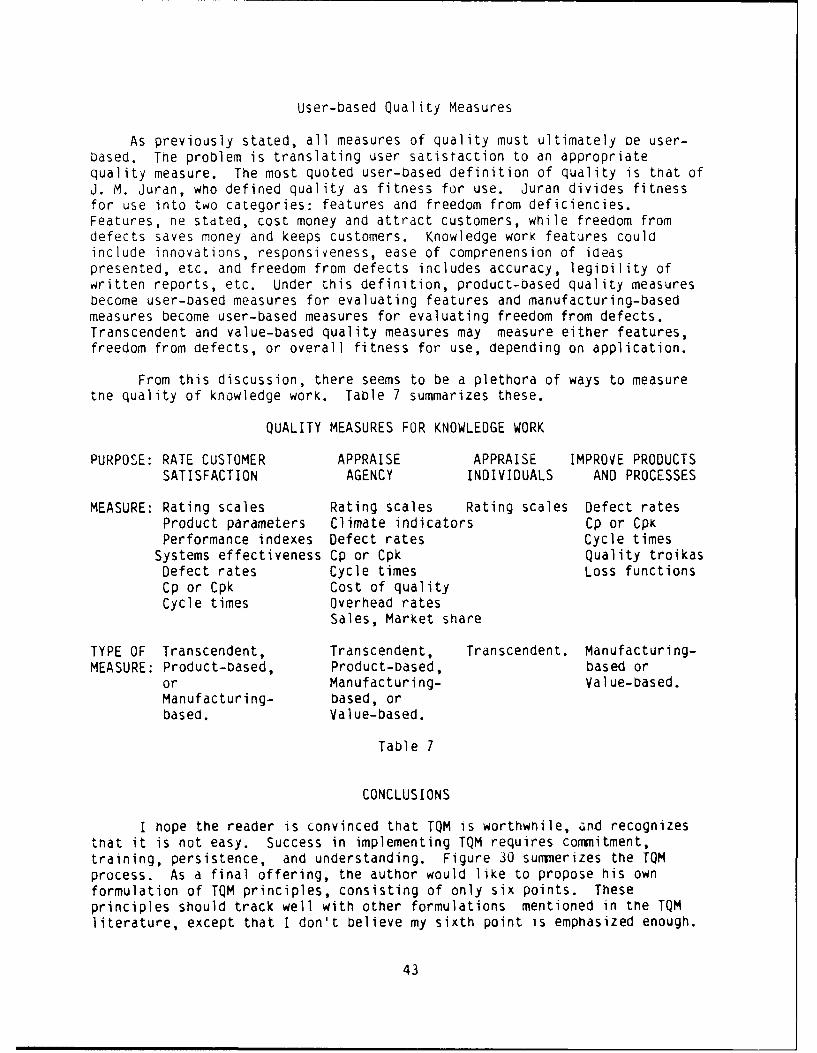
User-based Quality Measures
As previously stated, all measures of quality must ultimately oe user-based. The problem is translating user satisfaction to an appropriatequality measure. The most quoted user-based definition of quality is that ofJ. M. Jurdn, who defined quality as fitness for use. Juran divides fitnessfor use into two categories: features and freedom from deficiencies.Features, ne stated, cost money and attract customers, while freedom fromdefects saves money and keeps customers. Knowledge work featires couldinclude innovations, responsiveness, ease of comprenension of ideaspresented, etc. and freedom from defects includes accuracy, legioility ofwritten reports, etc. Under this definition, product-based quality measuresbecome user-based measures for evaluating features and manufacturing-basedmeasures become user-based measures for evaluating freedom from defects.Transcendent and value-based quality measures may measure either features,freedom from defects, or overall fitness for use, depending on application.
From this discussion, there seems to be a plethora of ways to measuretne quality of knowledge work. Table 7 summarizes these.
QUALITY MEASURES FOR KNOWLEDGE WORK
PURPOSE: RATE CUSTOMER APPRAISE APPRAISE IMPROVE PRODUCTSSATISFACTION AGENCY INDIVIDUALS AND PROCESSES
MEASURE: Rating scales Rating scales Rating scales Defect ratesProduct parameters Climate indicators Cp or CpKPerformance indexes Defect rates Cycle times
Systems effectiveness Cp or Cpk Quality troikasDefect rates Cycle times Loss functionsCp or Cpk Cost of qualityCycle times Overhead rates
Sales, Market share
TYPE OF Transcendent, Transcendent, Transcendent. Manufacturing-MEASURE: Product-based, Product-based, based or
or Manufacturing- Value-based.Manufacturing- based, orbased. Value-based.
Table 7
CONCLUSIONS
I hope the reader is convinced that TQM is worthwhile, and recognizesthat it is not easy. Success in implementing TQM requires commitment,training, persistence, and understanding. Figure 30 summerizes the TQMprocess. As a final offering, the author would like to propose his ownformulation of TQM principles, consisting of only six points. Theseprinciples should track well with other formulations mentioned in the TQMliterature, except that I don't believe my sixth point is emphasized enough.
43
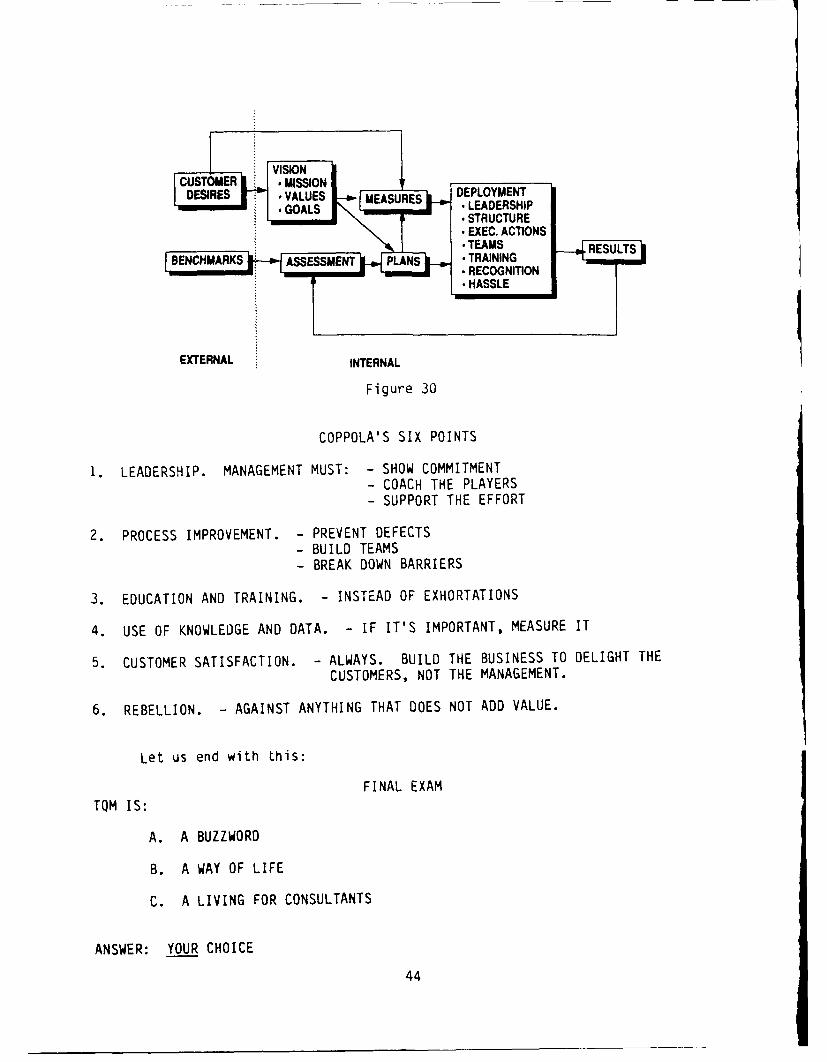
CUSTOMER .MISSIONDESIRES CVALUES DEPASOS
GOALS LEADERSHIPENTE . •STRUCTURE
•EXEC. ACTIONS
TEAMS RESULTS
SRECOGNIBRON-HASSLE
EXTERNAL INTERNAL
Figure 30
COPPOLA'S SIX POINTS
4. LEADERSHIP. MANAGEMENT MUST: - SHOW COMMITMENT- COACH THE PLAYERS- SUPPORT THE EFFORT
2. PROCESS IMPROVEMENT. - PREVENT DEFECTS- BUILD TEAMS- BREAK DOWN BARRIERS
3. EDUCATION AND TRAINING. - INSTEAD OF EXHORTATIONS
4. USE OF KNOWLEDGE AND DATA. - IF IT'S IMPORTANT, MEASURE IT
5. CUSTOMER SATISFACTION. - ALWAYS. BUILD THE BUSINESS TO DELIGHT THE
CUSTOMERS, NOT THE MANAGEMENT.
6. REBELLION. - AGAINST ANYTHING THAT DOES NOT ADD VALUE.
Let us end with Lhis:
FINAL EXAM
TQM IS:
A. A BUZZWORD
B. A WAY OF LIFE
C. A LIVING FOR CONSULTANTS
ANSWER: YOUR CHOICE
44
MISSION
OF
ROME LABORATORY
Rome Laboratory plans and executes an interdisciplinary program in re-
search, development, test, and technology transition in support of Air
Force Command, Control, Communications and Intelligence (C 31) activities
for all Air Force platforms. It also executes selected acquisition programs
in several areas of expertise. Technical and engineering support within
areas of competence is provided to ESD Program Offices (POs) and other
ESD elements to perform effective acquisition of C 31 systems. In addition,
Rome Laboratory's technology supports other AFSC Product Divisions, the
Air Force user community, and other DOD and non-DOD agencies. Rome
Laboratory maintains technical competence and research programs in areas
including, but not limited to, communications, command and control, battle
management, intelligence information processing, computational sciences
and software producibility, wide area surveillance/sensors, signal proces-
sing, solid state sciences, photonics, electromagnetic technology, super-
conductivity, and electronic reliability/maintainability and testability.