tourism survey for the state of haryana (april 2011...
TRANSCRIPT

Tourism Survey for the State Of Haryana
(April 2011 – March 2012)
Submitted to:
Ministry of Tourism (Market Research Division)
Government of India
By
Annual Report
Ministry of Tourism, Government of India ACNielsen ORG-MARG
State Report for Haryana 2
ACKNOWLEDGEMENT
We are thankful to the Ministry of Tourism, Government of India for assigning this Study on Tourism Survey for the state of Haryana. We are grateful to Shri Parvez Dewan, the Secretary, (Tourism) for this prestigious assignment
The consultant had the pleasure of interacting with the state tourism officials Shri Vijay Vardhan, Secretary (Tourism), Shri Sunil Bhatia, Head Marketing, Haryana Tourism.
We are also grateful to Dr. R. N. Pandey, Former Additional Director General (MR), Shri R.K. Bhatnagar, Additional Director General (MR), Ms. Sandhya Singh, Former Dy. Director (MR), Ms. Neha Srivastava, Dy. Director (MR) for providing us the necessary guidance and periodical support for conducting the study. We would also like to thank Shri S.K. Mahanta, DPA, Grade’B’ (MR) for providing us the required support and help from time to time.
Last but not the least we would like to thank our entire team of research professionals as well as our field staff and support team for their co-operation and team spirit for keeping up the momentum and time schedule of the study.
Ministry of Tourism, Government of India ACNielsen ORG-MARG
State Report for Haryana 3
Executive Summary
E.0 Introduction
Haryana is a part of the Kuru region in North India. A large area of Haryana lies in the National
Capital region. Haryana encompasses the Indus Valley and Vedic civilizations. Haryana also has
a very rich cultural heritage which goes back to the vedic times. Haryana is also well known for its
misic and folk dance.
Haryana is known as the “Green Land” of India and is known for its magnificent growth in the field
of agriculture. The most visited tourist places in Haryana are Kurukshetra, Gurgaon, Faridabad
and Chandigarh. Haryana has many interesting and unique tourism offerings i.e. Highway
Tourism, Farm Tourism, Golf Tourism, Pilgrim Tourism, MICE Tourism, Heritage Tourism and
Adventure Tourism. The distinctive offerings of Haryana, makes it a perfect vacation destination
for many a travelers.
Keeping this in mind the Ministry of Ministry of Tourism, Government of India has awarded
ACNielsen ORG-MARG, one of the largest market research and consultancy organizations in this part of the continent, to conduct an study for a period of one year for collection of Tourism Statistics.
E.1 Research Aim Aim of the proposed research would be to collect relevant tourist related statistics, from the State
of Haryana, which would enable analyzing subtle trends as well as preparation of month wise and
annual estimates separately for foreign and domestic visitors –with a break –up of overnight
tourists & same day visitors for the selected tourist places.
E.2 Research Objectives To achieve the aim of the study, the objectives for the proposed research, would be as follows:-
To enlist prime tourist locations in the state and available accommodation facility thereof.
To generate details about available infrastructural facility at the prime tourist spots in the
State.
To collate month wise information about domestic as well as foreign tourists availing
accommodation in all facilities in those locations

Ministry of Tourism, Government of India ACNielsen ORG-MARG
State Report for Haryana 4
To collate month wise expenditures made by the State Government for development of
tourism and its potential earnings
To accrue information on employment in the accommodation units, estimate direct
employment generated in accommodation units at district & state level.
The field survey in a State will be conducted for a period of 12 months in all districts of the State.
The survey will be used to obtain the following month-wise information for each district:
Estimated number of visits
(i) Visits by overnight visitors- staying at accommodation units;
a. Staying with friends and relatives
b. Others, such as those staying in tented accommodations provided by
State Govt. or by any other charitable organizations, etc.
(ii) Visits by same-day visitors
a. Profile of visitors, their expenditure pattern, purpose of visits, etc.
b. Occupancy rates and direct employment in accommodation units.
E.3 Terms of Reference The terms of reference of the study as indicated are as under
i. Prepare a frame/ list of all important tourist places in the State.
ii. Formulate a methodology for preparation of month wise and annual estimates of the
following, separately for foreign and domestic visitors (with break –up of overnight tourists &
same day visitors) for the selected tourist places at district & state level:
o Total no: of tourists (overnight)
o Total number of same day visitors
o Total number of tourists staying with friends /relatives
o Expenditure incurred by tourists (overnight)
o Expenditure incurred by same day visitors
o Expenditure incurred by tourists staying with friends / relatives
o Profiling the tourists /visitors at district and state level in respect of age, sex,
occupation, purpose of visit,, state /UT of residence or country of origin, duration of
stay, mode of journey, use of package tour etc.
Ministry of Tourism, Government of India ACNielsen ORG-MARG
State Report for Haryana 5
iii. To prepare a suitable methodology for the parameters mentioned at S.No.(ii) above. A
comprehensive list of tourist places at district level in the State is to be prepared.
iv. Formulate a methodology and prepare month-wise and annual estimates of occupancy rate
of accommodation units at district and State levels.
v. Conduct one-day workshop for the officers of the State to be surveyed and a few other
States and organizations. Total number of participants would be about 30. Details of the
exercise and the proposed methodology to be adopted for estimating the number of tourists
and other parameters mentioned in other paras of TOR will be explained by the consultants
in the workshop. The methodology may have to be revised based on discussions in the
workshop and inputs from Ministry of Tourism and other experts.
vi. Prepare a frame/list of tourist place-wise all accommodation units, like Hotels,
Dharamshallas, Guest houses, etc. for conduction State level survey on tourism, Update this
frame/list on quarterly basis; and accordingly revise the coverage, This frame should include
information on rooms, beds and employment, etc. Also conduct survey of selected tourists
staying in accommodation units to identify the purpose of their visits.
o Based on the methodology finalized, collect, compile data about domestic and foreign
tourists to provide information as mentioned at S. No. (ii) Above.
o Based on the information on employment in the accommodation units in the sampling
frame, estimate direct employment generated in accommodation units at district and
State levels.
o Collect information on the annual expenditure incurred by State Government at the
selected tourist places, at district level and at the State level for development of
tourism.

Ministry of Tourism, Government of India ACNielsen ORG-MARG
State Report for Haryana 6
E.4 Tourist Destinations Surveyed
The destinations which were included in the study are given below. These destinations were
included, based on secondary research and after discussions with officials from MR division of
Ministry of Tourism, Government of India and officials from Haryana Tourism Ministry.
Districts Towns Destination Ambala Ambala city Badshahi Bag Gurudwara
Ambala city Lakhi Shah Mosque Ambala city Bhawani Amba Temple Ambala city Sis Ganj Gurudwara Ambala city Manji Sahib Gurudwara
Bhiwani Bhiwani Prithiviraj ki Kutchery Bhiwani Lohar pir Bhiwani Loharu fort
Faridabad Faridabad Baba Farid's Tomb Faridabad Surajkund Faridabad Badkhal Lake
Fatehabad Fatehabad Humayun Mosque Gurgaon Gurgaon Sheetla Mata Temple
Manesar Damdama Lake Manesar Sultanpur Bird Sanctuary Sohna Sohna Lake
Hisar Hisar Gujri Mahal Hansi The Bisnoi Mandir Hansi Fort Gate Hansi Asigarh Fort Agroha Agroha
Jhajjar Jhajjar Bhinawash Bird Sanctuary Jhajjar Museum / Gurukul Beri Pandava's Bhimeshwari devi
Jind Jind Temple Of Jainti Devi Jind Bhuteshwer Temple/Rani Ka Talab
Kaithal Kaithal Phelgu Tank & Temple Kaithal Bidkiyar Lake & Teerath Kaithal Tomb of Razia Sultan
Karnal Karnal Karnal Lake Karnal Old Fort Karnal Golf Course & Osis Complex
Kurukshetra Kurukshetra Jyotisar

Ministry of Tourism, Government of India ACNielsen ORG-MARG
State Report for Haryana 7
Kurukshetra Brahma Sarovar Kurukshetra Sri Krishna Museum and Science
Museum Kurukshetra Pehowa Kurukshetra Sannihit Sarovar
Mahendragarh Narnaul Jal Mahal Narnaul Tomb of Shah Waliyat Narnaul Chor Gumbad Narnaul Mausoleum of Ibraham Khan Narnaul Chhata Rai Balmukund Das
Mewat Mewat Saint Shah Choka Punchkula Pinjor Pijjor Garden
Pinjor Bhima devi Temple Morni Hills Gurudwara Nada Sahib Morni Hills Mansa Devi Temple Morni Hills Bird Watching
Panipat Panipat Ibrahim Lodi’s Tomb Panipat Jain Temples
Rewari Rewari Lal Masjid Rewari Lord Hanuman
Rohtak Rohtak Khokar Fort Rohtak Bhinwas Lake Rohtak Tilyar Lake
Sirsa Sirsa Dera Sachcha Sauda Sonipat Sonipat Tombof Khwaja Khizr
Sonipat Geeta Bhawan Mandir Yamunanagar Yamunanager Punchmukhi Hanuman Mandir
Chhachharauli Chhachhrauli Fort
Ministry of Tourism, Government of India ACNielsen ORG-MARG
State Report for Haryana 8
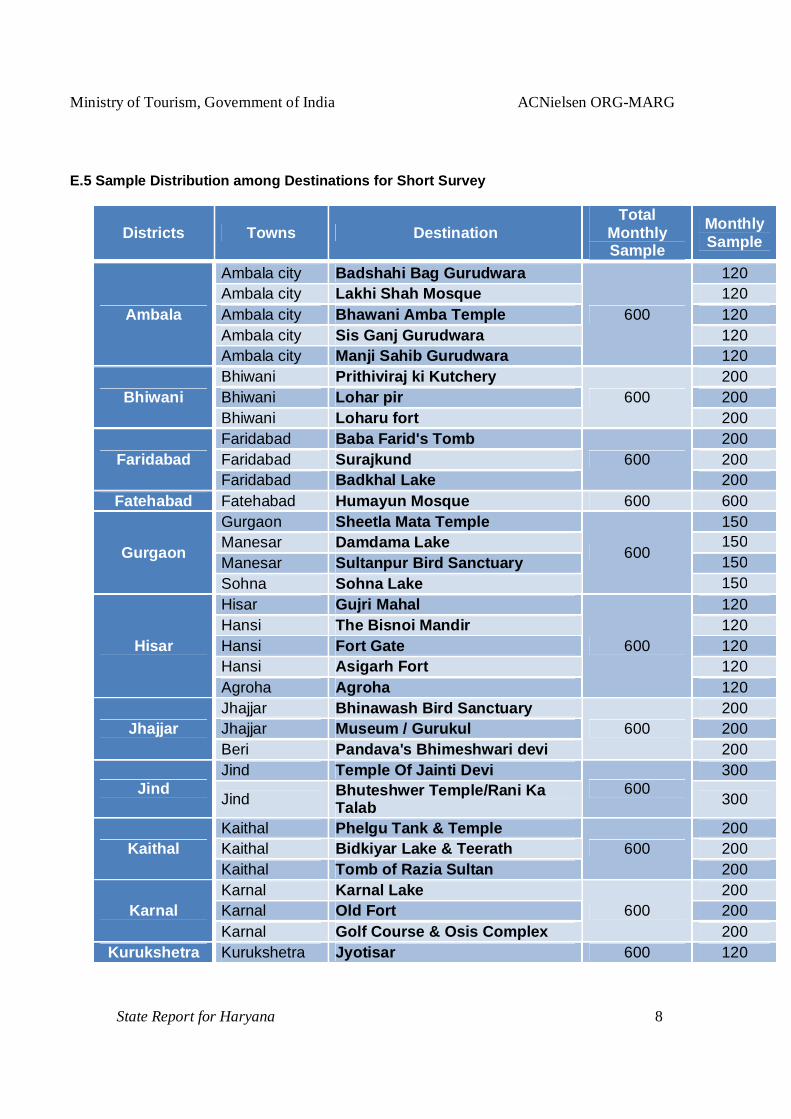
E.5 Sample Distribution among Destinations for Short Survey
Districts Towns Destination Total
Monthly Sample
Monthly Sample
Ambala
Ambala city Badshahi Bag Gurudwara
600
120 Ambala city Lakhi Shah Mosque 120 Ambala city Bhawani Amba Temple 120 Ambala city Sis Ganj Gurudwara 120 Ambala city Manji Sahib Gurudwara 120
Bhiwani Bhiwani Prithiviraj ki Kutchery
600 200
Bhiwani Lohar pir 200 Bhiwani Loharu fort 200
Faridabad Faridabad Baba Farid's Tomb
600 200
Faridabad Surajkund 200 Faridabad Badkhal Lake 200
Fatehabad Fatehabad Humayun Mosque 600 600
Gurgaon
Gurgaon Sheetla Mata Temple
600
150 Manesar Damdama Lake 150 Manesar Sultanpur Bird Sanctuary 150 Sohna Sohna Lake 150
Hisar
Hisar Gujri Mahal
600
120 Hansi The Bisnoi Mandir 120 Hansi Fort Gate 120 Hansi Asigarh Fort 120 Agroha Agroha 120
Jhajjar Jhajjar Bhinawash Bird Sanctuary
600 200
Jhajjar Museum / Gurukul 200 Beri Pandava's Bhimeshwari devi 200
Jind Jind Temple Of Jainti Devi
600 300
Jind Bhuteshwer Temple/Rani Ka Talab 300
Kaithal Kaithal Phelgu Tank & Temple
600 200
Kaithal Bidkiyar Lake & Teerath 200 Kaithal Tomb of Razia Sultan 200
Karnal Karnal Karnal Lake
600 200
Karnal Old Fort 200 Karnal Golf Course & Osis Complex 200
Kurukshetra Kurukshetra Jyotisar 600 120

Ministry of Tourism, Government of India ACNielsen ORG-MARG
State Report for Haryana 9
Kurukshetra Brahma Sarovar 120
Kurukshetra Sri Krishna Museum and Science Museum (Panorama) 120
Kurukshetra Pehowa 120 Kurukshetra Sannihit Sarovar 120
Mahendragarh
Narnaul Jal Mahal
600
120 Narnaul Tomb of Shah Waliyat 120 Narnaul Chor Gumbad 120 Narnaul Mausoleum of Ibraham Khan 120 Narnaul Chhata Rai Balmukund Das 120
Mewat Mewat Saint Shah Choka 600 600
Punchkula
Pinjor Pijjor Garden
600
120 Pinjor Bhima devi Temple 120 Morni Hills Gurudwara Nada Sahib 120 Morni Hills Mansa Devi Temple 120 Morni Hills Bird Watching 120
Panipat Panipat Ibrahim Lodi’s Tomb 600 300 Panipat Jain Temples 300
Rewari Rewari Lal Masjid 600
300 Rewari Lord Hanuman 300
Rohtak Rohtak Khokar Fort
600 200
Rohtak Bhinwas Lake 200 Rohtak Tilyar Lake 200
Sirsa Sirsa Dera Sachcha Sauda 600 600
Sonipat Sonipat Tombof Khwaja Khizr 600
300 Sonipat Geeta Bhawan Mandir 300
Yamunanagar Yamunanager Punchmukhi Hanuman Mandir 600 300 Chhachharauli Chhachhrauli Fort 300

Ministry of Tourism, Government of India ACNielsen ORG-MARG
State Report for Haryana 10
E.6 Sample Distribution among States for the Exit Survey
The sample size for each district to be covered in the Exit Survey was 400 per quarter. Initially equal number of domestics and foreign
visitors were to be covered, but as adequate foreign visitors were not available throughout the month, the sample size allocated for
them was allocated to domestic visitors as specified in the RFP. The distribution of tourists interviewed in the Exit survey for each of the
4 Quarters (April 2011, July 2011, October 2011, and January 2012) is given below.
District April July October January Total Gross Total
Domestic Foreign Domestic Foreign Domestic Foreign Domestic Foreign Domestic Foreign Ambala 393 7 391 9 390 10 388 12 1562 38 1600 Bhiwani 400 0 400 0 400 0 400 0 1600 0 1600 Faridabad 388 12 381 19 380 20 382 18 1531 69 1600 Fatehabad 400 0 400 0 400 0 400 0 1600 0 1600 Gurgaon 378 22 379 21 381 19 367 33 1505 95 1600 Hisar 400 0 400 0 400 0 400 0 1600 0 1600 Jhajjar 400 0 400 0 400 0 400 0 1600 0 1600 Jind 400 0 400 0 400 0 400 0 1600 0 1600 Kaithal 400 0 400 0 400 0 400 0 1600 0 1600 Karnal 391 9 390 10 388 12 382 18 1551 49 1600 Kurukshetra 388 12 392 8 367 33 379 21 1526 74 1600 Mahendragarh 400 0 400 0 400 0 400 0 1600 0 1600 Mewat 400 0 400 0 400 0 400 0 1600 0 1600 Punchkula 381 19 389 11 372 28 369 31 1511 89 1600 Panipat 400 0 400 0 400 0 400 0 1600 0 1600 Rewari 400 0 400 0 400 0 400 0 1600 0 1600 Rohtak 400 0 400 0 400 0 400 0 1600 0 1600 Sirsa 378 22 381 19 371 29 368 32 1498 102 1600 Sonepat 400 0 400 0 400 0 400 0 1600 0 1600 Yamunanagar 400 0 400 0 400 0 400 0 1600 0 1600 Total 7897 103 7903 97 7849 151 7835 165 31484 516 32000

Ministry of Tourism, Government of India ACNielsen ORG-MARG
State Report for Haryana 11
E.7 Month Wise Short Survey Sample Covered in the Study
Month April May June July August Sept Oct Aggregate Sample Size
12005 12052 11995 12002 11990 11993 12008
Overnight Tourists
Foreigner 4% 3% 2% 3% 4% 6% 7% Domestic (from within the state) 21% 24% 25% 19% 20% 22% 23%
Domestic (from outside the state) 21% 23% 19% 20% 21% 24% 25%
Same Day Visitor
Foreigner 0% 0% 0% 0% 0% 0% 0% Domestic (from within the state) 49% 46% 48% 55% 53% 43% 38%
Domestic (from outside the state) 5% 4% 6% 3% 2% 5% 7%
Total 100% 100% 100% 100% 100% 100% 100%

Ministry of Tourism, Government of India ACNielsen ORG-MARG
State Report for Haryana 12
E.8 Month Wise and District Wise Domestic Visitor Arrival in Haryana
District April May June July August Sept Oct Nov Dec
Ambala 36589 37621 39361 35730 35602 40735 44611 43067 41010 Bhiwani 10783 9939 10476 7584 9190 9190 10677 9626 6944 Faridabad 30563 31720 32458 43552 47780 40327 43628 42286 40858 Fatehabad 2875 3096 3299 3344 3452 3345 3672 3211 2766 Gurgaon 58896 57239 60686 60569 88889 65825 72532 66751 57128 Hisar 19394 18953 19713 16897 15586 19809 21334 19642 16136 Jhajjar 11213 11153 12008 9617 10643 25827 27731 26707 23979 Jind 10508 10918 11913 7958 8644 9830 11229 10283 9145 Kaithal 5061 4637 4966 5071 4667 4892 5493 4714 4041 Karnal 40943 43553 46766 32058 40353 45842 47736 46558 44353 Kurukshetra 72022 77470 82660 83589 62913 67210 73384 68233 71666 Mahendragarh 8278 9124 9275 6108 7461 8516 9536 8651 7450 Mewat 4568 4973 5280 7116 6102 4884 5532 5237 4602 Punchkula 53453 57040 58417 58234 49458 56531 64432 59114 53997 Panipat 8562 9312 10124 10626 10625 10824 12622 11047 9822 Rewari 4786 5172 5402 4094 3955 3676 4733 4336 3423 Rohtak 16905 18131 19761 14330 19868 18760 21050 19751 17658 Sirsa 255060 281105 306812 59274 64134 83381 83069 90603 86088 Sonipat 14356 14781 16078 18634 16614 20804 23094 21929 19388 Yamunanager 48851 49826 54344 45548 42038 33974 37165 33851 32558 Total 713667 755758 809800 529931 547973 574183 623258 595597 553013

Ministry of Tourism, Government of India ACNielsen ORG-MARG
State Report for Haryana 13
E.9 Month Wise and District Wise Foreign Visitor Arrival in Haryana
District April May June July August Sept Oct Nov Dec
Ambala 9 10 16 38 11 48 52 40 31 Bhiwani 0 0 0 0 0 0 0 0 0 Faridabad 67 64 77 1569 1286 1354 1651 1525 1439 Fatehabad 0 0 0 0 0 0 0 0 0 Gurgaon 385 318 108 10173 8029 9248 8824 8226 7447 Hisar 0 0 0 0 0 0 0 0 0 Jhajjar 0 0 0 0 0 0 0 0 0 Jind 0 0 0 0 0 0 0 0 0 Kaithal 0 0 0 0 0 0 0 0 0 Karnal 10 5 8 0 0 8 8 8 8 Kurukshetra 108 142 142 121 64 18 10 8 7 Mahendragarh 0 0 0 0 0 0 0 0 0 Mewat 0 0 0 0 0 0 0 0 0 Punchkula 114 123 126 110 76 98 110 78 71 Panipat 31 37 41 46 68 84 74 63 60 Rewari 0 0 0 0 0 0 0 0 0 Rohtak 0 0 0 0 0 0 0 0 0 Sirsa 434 478 522 5 0 138 138 105 98 Sonipat 0 0 0 0 0 0 0 0 0 Yamunanager 0 0 0 0 0 0 0 0 0 Total 1159 1177 1039 12061 9534 10995 10867 10055 9161
Ministry of Tourism, Government of India ACNielsen ORG-MARG
State Report for Haryana 14
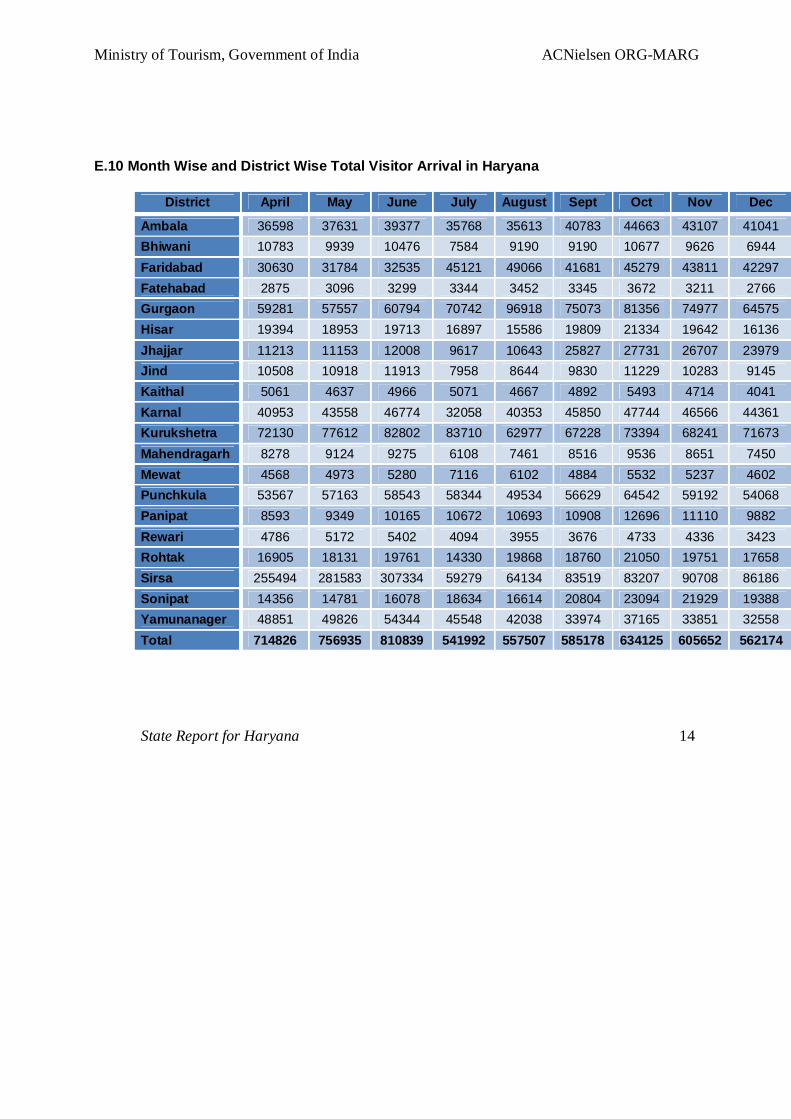
E.10 Month Wise and District Wise Total Visitor Arrival in Haryana
District April May June July August Sept Oct Nov Dec
Ambala 36598 37631 39377 35768 35613 40783 44663 43107 41041 Bhiwani 10783 9939 10476 7584 9190 9190 10677 9626 6944 Faridabad 30630 31784 32535 45121 49066 41681 45279 43811 42297 Fatehabad 2875 3096 3299 3344 3452 3345 3672 3211 2766 Gurgaon 59281 57557 60794 70742 96918 75073 81356 74977 64575 Hisar 19394 18953 19713 16897 15586 19809 21334 19642 16136 Jhajjar 11213 11153 12008 9617 10643 25827 27731 26707 23979 Jind 10508 10918 11913 7958 8644 9830 11229 10283 9145 Kaithal 5061 4637 4966 5071 4667 4892 5493 4714 4041 Karnal 40953 43558 46774 32058 40353 45850 47744 46566 44361 Kurukshetra 72130 77612 82802 83710 62977 67228 73394 68241 71673 Mahendragarh 8278 9124 9275 6108 7461 8516 9536 8651 7450 Mewat 4568 4973 5280 7116 6102 4884 5532 5237 4602 Punchkula 53567 57163 58543 58344 49534 56629 64542 59192 54068 Panipat 8593 9349 10165 10672 10693 10908 12696 11110 9882 Rewari 4786 5172 5402 4094 3955 3676 4733 4336 3423 Rohtak 16905 18131 19761 14330 19868 18760 21050 19751 17658 Sirsa 255494 281583 307334 59279 64134 83519 83207 90708 86186 Sonipat 14356 14781 16078 18634 16614 20804 23094 21929 19388 Yamunanager 48851 49826 54344 45548 42038 33974 37165 33851 32558 Total 714826 756935 810839 541992 557507 585178 634125 605652 562174

Ministry of Tourism, Government of India ACNielsen ORG-MARG
State Report for Haryana 15
Tourism Survey for the State of
Haryana

Ministry of Tourism, Government of India ACNielsen ORG-MARG
State Report for Haryana 17
Table – 1
Total number of visits to Tourist Destinations by Domestic and Foreign Leisure Visitors
No. of visits by Domestic Tourists /
Same Day Visitors No of visits by Foreign Tourists /
Same Day Visitor Overnight Tourists
Same Day Visitors Total Overnight
Tourists Same Day
Visitors Total Month (1) (2) (3) (4) (5) (6) (7)
April 2011 121314 460083 581397 855
Foreign same day
visitors were not
encountered in the survey
855 May 2011 129828 492547 622375 914 914 June 2011 139462 526409 665871 917 917 July 2011 89199 315902 405101 4853 4853 August 2011 115827 285934 401761 3817 3817 September 2011 108126 323166 431292 4399 4399 October 2011 125534 360665 486199 4570 4570 November 2011 121985 343546 465531 4192 4192 December 2011 115856 326795 442651 3852 3852 January 2012 131721 343636 475357 4189 4189 February 2012 95317 1201416 1296733 36887 36887 March 2012 128712 353042 481754 4286 4286
Total 1422881 5333141 6756022 73731 73731 As inferred from the table above, the maximum no. of visits by domestic leisure visitors to tourist destinations in Haryana have been in the winter month of February. As far as foreign leisure tourists are concerned, maximum no. of visits to tourist destinations in Haryana are again in the month of February.
Table – 2
Total number of Domestic and Foreign Leisure Tourists / Same Day Visitors
No. Domestic Tourists / Visitor No of Foreign Tourists / Visitor
Overnight Tourists
Same Day Visitors Total Overnight
Tourists Same Day
Visitors Total Month (1) (2) (3) (4) (5) (6) (7)
April 2011 115694 544192 659886 854
Foreign same day
visitors were not
encountered in the survey
854 May 2011 123757 575568 699325 914 914 June 2011 132940 616704 749644 916 916 July 2011 83209 394176 477385 4852 4852 August 2011 109117 382175 491292 3817 3817 September 2011 102357 410865 513222 4397 4397 October 2011 115807 440436 556243 4568 4568 November 2011 113682 417899 531581 4191 4191 December 2011 107162 387145 494307 3851 3851 January 2012 121891 406062 527953 4187 4187 February 2012 89824 1388580 1478404 36885 36885 March 2012 116813 418056 534869 4286 4286 Total 115694 544192 659886 854 854
The maximum no. of domestic leisure visitors to Haryana are spread across the months of June and February. For foreign leisure visitors to Haryana February has been the preferred month for visit.
Ministry of Tourism, Government of India ACNielsen ORG-MARG
State Report for Haryana 18
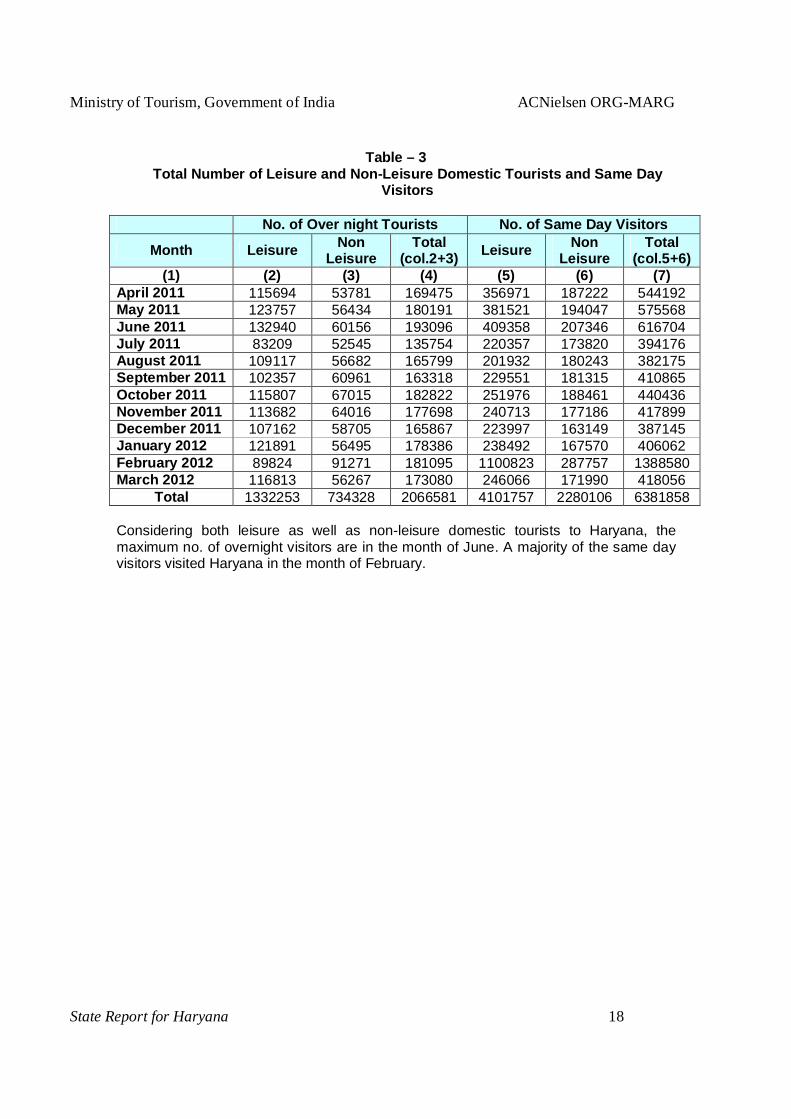
Table – 3 Total Number of Leisure and Non-Leisure Domestic Tourists and Same Day
Visitors
No. of Over night Tourists No. of Same Day Visitors Month Leisure Non
Leisure Total
(col.2+3) Leisure Non Leisure
Total (col.5+6)
(1) (2) (3) (4) (5) (6) (7) April 2011 115694 53781 169475 356971 187222 544192 May 2011 123757 56434 180191 381521 194047 575568 June 2011 132940 60156 193096 409358 207346 616704 July 2011 83209 52545 135754 220357 173820 394176 August 2011 109117 56682 165799 201932 180243 382175 September 2011 102357 60961 163318 229551 181315 410865 October 2011 115807 67015 182822 251976 188461 440436 November 2011 113682 64016 177698 240713 177186 417899 December 2011 107162 58705 165867 223997 163149 387145 January 2012 121891 56495 178386 238492 167570 406062 February 2012 89824 91271 181095 1100823 287757 1388580 March 2012 116813 56267 173080 246066 171990 418056
Total 1332253 734328 2066581 4101757 2280106 6381858 Considering both leisure as well as non-leisure domestic tourists to Haryana, the maximum no. of overnight visitors are in the month of June. A majority of the same day visitors visited Haryana in the month of February.
Ministry of Tourism, Government of India ACNielsen ORG-MARG
State Report for Haryana 19
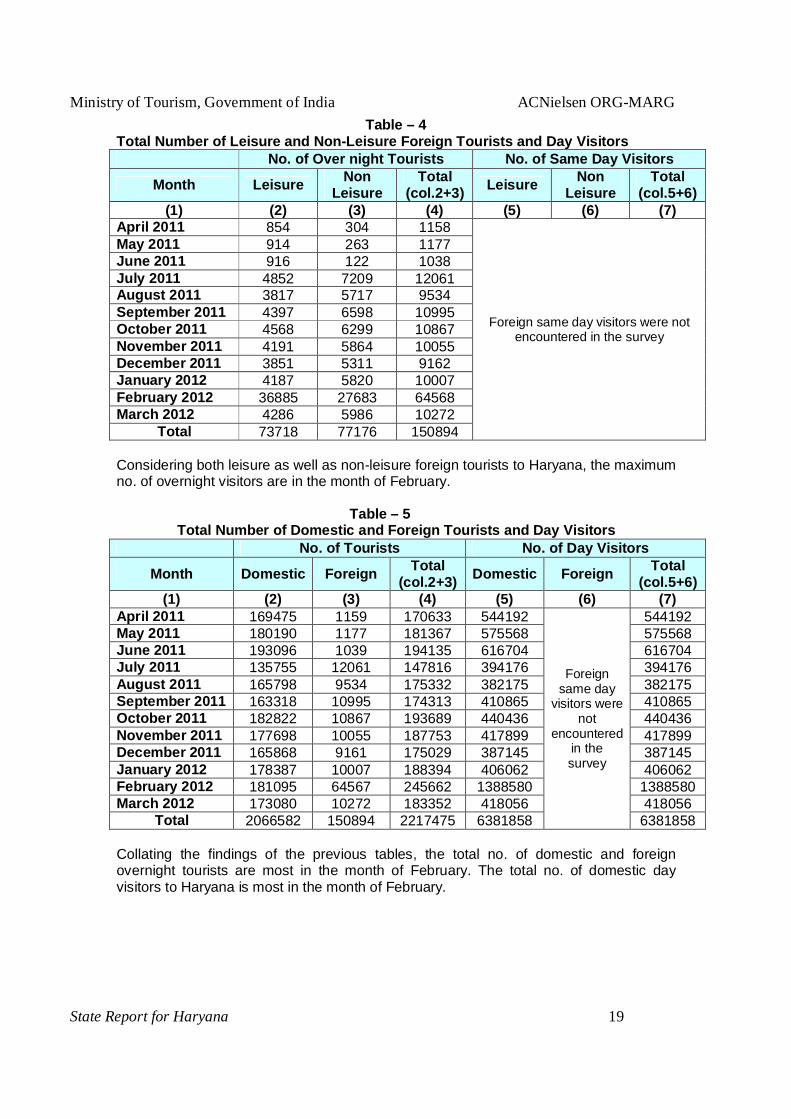
Table – 4 Total Number of Leisure and Non-Leisure Foreign Tourists and Day Visitors
No. of Over night Tourists No. of Same Day Visitors Month Leisure Non
Leisure Total
(col.2+3) Leisure Non Leisure
Total (col.5+6)
(1) (2) (3) (4) (5) (6) (7) April 2011 854 304 1158
Foreign same day visitors were not encountered in the survey
May 2011 914 263 1177 June 2011 916 122 1038 July 2011 4852 7209 12061 August 2011 3817 5717 9534 September 2011 4397 6598 10995 October 2011 4568 6299 10867 November 2011 4191 5864 10055 December 2011 3851 5311 9162 January 2012 4187 5820 10007 February 2012 36885 27683 64568 March 2012 4286 5986 10272
Total 73718 77176 150894 Considering both leisure as well as non-leisure foreign tourists to Haryana, the maximum no. of overnight visitors are in the month of February.
Table – 5
Total Number of Domestic and Foreign Tourists and Day Visitors No. of Tourists No. of Day Visitors
Month Domestic Foreign Total (col.2+3) Domestic Foreign Total
(col.5+6) (1) (2) (3) (4) (5) (6) (7)
April 2011 169475 1159 170633 544192
Foreign same day
visitors were not
encountered in the survey
544192 May 2011 180190 1177 181367 575568 575568 June 2011 193096 1039 194135 616704 616704 July 2011 135755 12061 147816 394176 394176 August 2011 165798 9534 175332 382175 382175 September 2011 163318 10995 174313 410865 410865 October 2011 182822 10867 193689 440436 440436 November 2011 177698 10055 187753 417899 417899 December 2011 165868 9161 175029 387145 387145 January 2012 178387 10007 188394 406062 406062 February 2012 181095 64567 245662 1388580 1388580 March 2012 173080 10272 183352 418056 418056
Total 2066582 150894 2217475 6381858 6381858
Collating the findings of the previous tables, the total no. of domestic and foreign overnight tourists are most in the month of February. The total no. of domestic day visitors to Haryana is most in the month of February.
Ministry of Tourism, Government of India ACNielsen ORG-MARG
State Report for Haryana 20
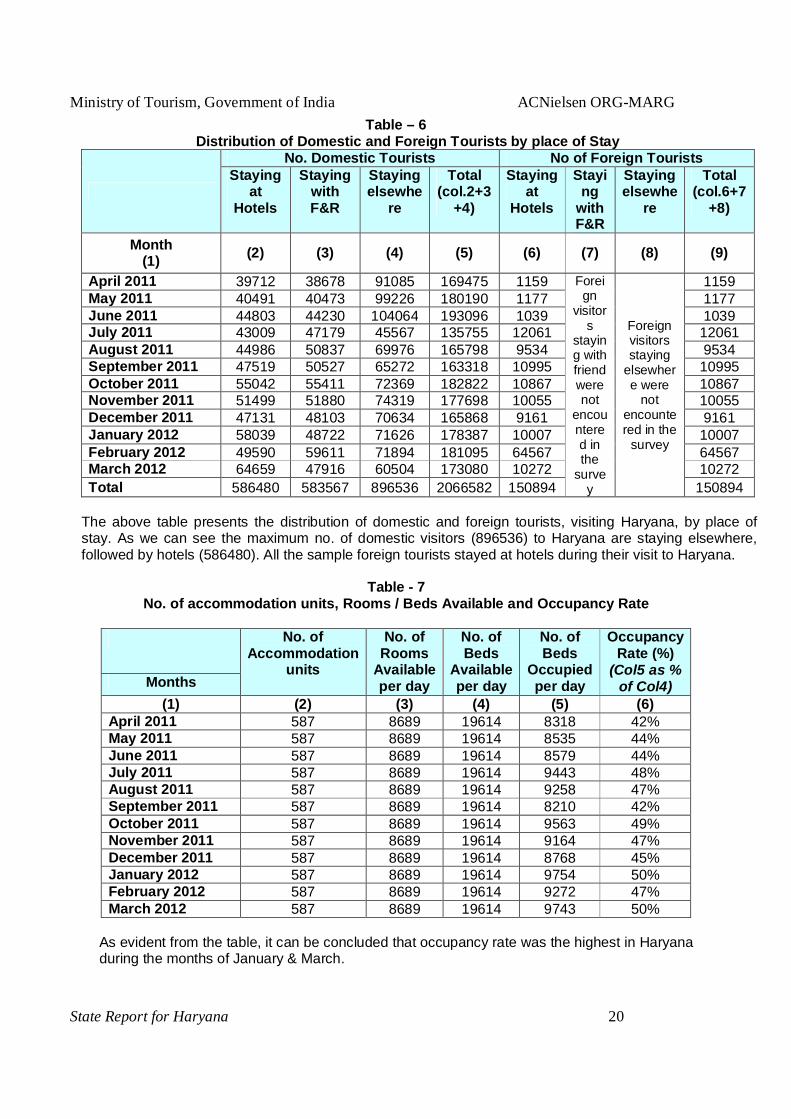
Table – 6 Distribution of Domestic and Foreign Tourists by place of Stay
No. Domestic Tourists No of Foreign Tourists Staying
at Hotels
Staying with F&R
Staying elsewhe
re
Total (col.2+3
+4)
Staying at
Hotels
Staying
with F&R
Staying elsewhe
re
Total (col.6+7
+8)
Month (1) (2) (3) (4) (5) (6) (7) (8) (9)
April 2011 39712 38678 91085 169475 1159 Foreign
visitors
staying with friend were not
encountered in the
survey
Foreign visitors staying
elsewhere were
not encountered in the
survey
1159 May 2011 40491 40473 99226 180190 1177 1177 June 2011 44803 44230 104064 193096 1039 1039 July 2011 43009 47179 45567 135755 12061 12061 August 2011 44986 50837 69976 165798 9534 9534 September 2011 47519 50527 65272 163318 10995 10995 October 2011 55042 55411 72369 182822 10867 10867 November 2011 51499 51880 74319 177698 10055 10055 December 2011 47131 48103 70634 165868 9161 9161 January 2012 58039 48722 71626 178387 10007 10007 February 2012 49590 59611 71894 181095 64567 64567 March 2012 64659 47916 60504 173080 10272 10272 Total 586480 583567 896536 2066582 150894 150894
The above table presents the distribution of domestic and foreign tourists, visiting Haryana, by place of stay. As we can see the maximum no. of domestic visitors (896536) to Haryana are staying elsewhere, followed by hotels (586480). All the sample foreign tourists stayed at hotels during their visit to Haryana.
Table - 7
No. of accommodation units, Rooms / Beds Available and Occupancy Rate
No. of Accommodation
units
No. of Rooms
Available per day
No. of Beds
Available per day
No. of Beds
Occupied per day
Occupancy Rate (%)
(Col5 as % of Col4) Months
(1) (2) (3) (4) (5) (6) April 2011 587 8689 19614 8318 42% May 2011 587 8689 19614 8535 44% June 2011 587 8689 19614 8579 44% July 2011 587 8689 19614 9443 48% August 2011 587 8689 19614 9258 47% September 2011 587 8689 19614 8210 42% October 2011 587 8689 19614 9563 49% November 2011 587 8689 19614 9164 47% December 2011 587 8689 19614 8768 45% January 2012 587 8689 19614 9754 50% February 2012 587 8689 19614 9272 47% March 2012 587 8689 19614 9743 50%
As evident from the table, it can be concluded that occupancy rate was the highest in Haryana during the months of January & March.
Ministry of Tourism, Government of India ACNielsen ORG-MARG
State Report for Haryana 21
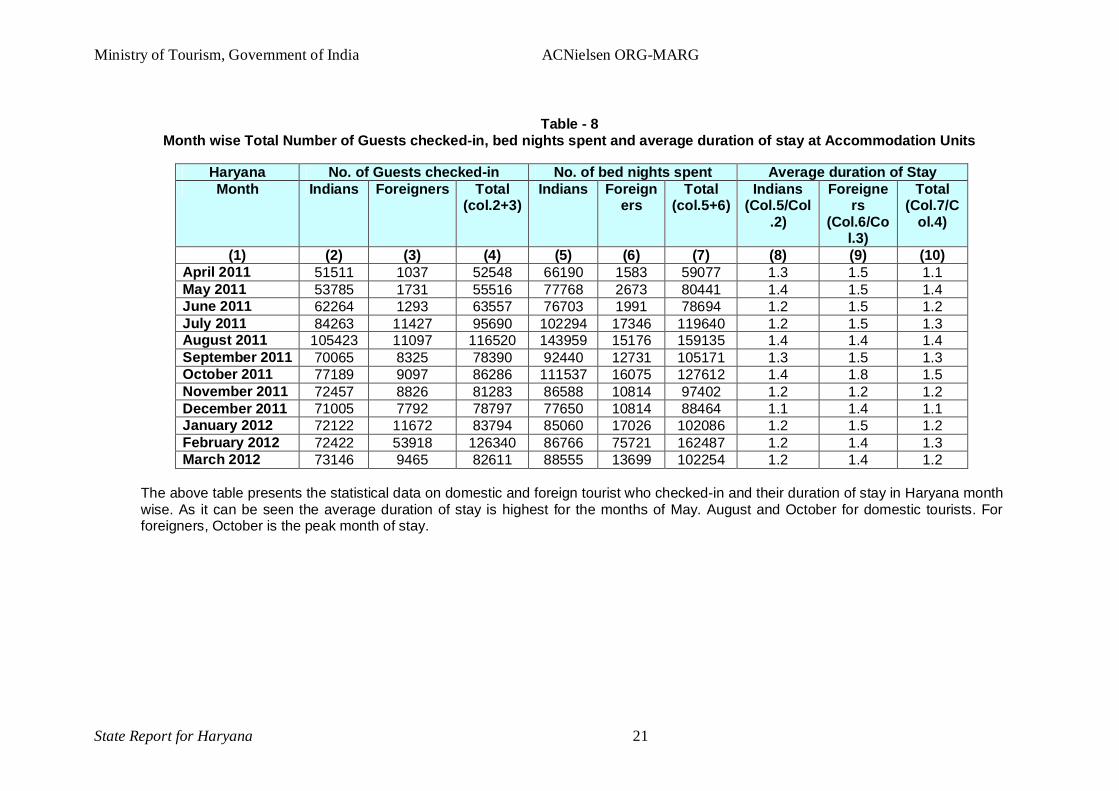
Table - 8 Month wise Total Number of Guests checked-in, bed nights spent and average duration of stay at Accommodation Units
The above table presents the statistical data on domestic and foreign tourist who checked-in and their duration of stay in Haryana month wise. As it can be seen the average duration of stay is highest for the months of May. August and October for domestic tourists. For foreigners, October is the peak month of stay.
Haryana No. of Guests checked-in No. of bed nights spent Average duration of Stay Month Indians Foreigners Total
(col.2+3) Indians Foreign
ers Total
(col.5+6) Indians
(Col.5/Col.2)
Foreigners
(Col.6/Col.3)
Total (Col.7/C
ol.4)
(1) (2) (3) (4) (5) (6) (7) (8) (9) (10) April 2011 51511 1037 52548 66190 1583 59077 1.3 1.5 1.1 May 2011 53785 1731 55516 77768 2673 80441 1.4 1.5 1.4 June 2011 62264 1293 63557 76703 1991 78694 1.2 1.5 1.2 July 2011 84263 11427 95690 102294 17346 119640 1.2 1.5 1.3 August 2011 105423 11097 116520 143959 15176 159135 1.4 1.4 1.4 September 2011 70065 8325 78390 92440 12731 105171 1.3 1.5 1.3 October 2011 77189 9097 86286 111537 16075 127612 1.4 1.8 1.5 November 2011 72457 8826 81283 86588 10814 97402 1.2 1.2 1.2 December 2011 71005 7792 78797 77650 10814 88464 1.1 1.4 1.1 January 2012 72122 11672 83794 85060 17026 102086 1.2 1.5 1.2 February 2012 72422 53918 126340 86766 75721 162487 1.2 1.4 1.3 March 2012 73146 9465 82611 88555 13699 102254 1.2 1.4 1.2

Ministry of Tourism ACNielsen ORG-MARG Pvt. Government of India
Final Report for Haryana – Tourism Survey 22
Tables 11 – 16 give the quarterly data pertaining to information collected from accommodation survey held in the district of Haryana. As shown in the tables below, the no. of accommodation units was 587 during the period April 2011 – March 2012. These accommodation units employ nearly 4209 persons. A majority of the accommodation units (425) fall under the Non- Star category. The survey reveals that there are 533 Non- Classified accommodation units in Haryana.
Table - 9
Number of Accommodation units, Rooms, Beds and Employment
Haryana No. of AUs
No. of Rooms
No. of Beds
No. of Employees Quarter
(1) (2) (3) (4) Temporary Permanent Total
(5) (6) (7) Quarter – 1 587 8699 19524 2883 1326 4209 Quarter – 2 587 8699 19524 2883 1326 4209 Quarter – 3 587 8699 19524 2883 1326 4209 Quarter – 4 587 8699 19524 2883 1326 4209
Table - 10 Distribution of Employees in Accommodation Units by Age Group
Haryana No. of
AUs No. of
Employees Distribution of employees by age-
group Quarter
(1) (2) (3)
18-25 yrs
26-30 yrs
31-40 yrs
41-50 yrs
> 51 yrs
(4) (5) (6) (7) (8) Quarter – 1 587 4209 33% 38% 19% 7% 3% Quarter – 2 587 4209 33% 38% 19% 7% 3% Quarter – 3 587 4209 33% 38% 19% 7% 3% Quarter – 4 587 4209 33% 38% 19% 7% 3%
Table - 11
Distribution of Employees in Accommodation Units by Service
Haryana No. of AUs
No. of Employees
Distribution of employees by service Quarter
(1) (2) (3)
Management F&B House Keeping
Others
(4) (5) (6) (7) Quarter – 1 587 4209 28% 43% 20% 9% Quarter – 2 587 4209 28% 43% 20% 9% Quarter – 3 587 4209 28% 43% 20% 9% Quarter – 4 587 4209 28% 43% 20% 9%

Ministry of Tourism ACNielsen ORG-MARG Pvt. Government of India
Final Report for Haryana – Tourism Survey 23
Table - 12 Category-wise Distribution Accommodation Units
Haryana
No. of Accommodation units
Quarter Classified
Non-classified Total Having
more than 20 rooms
10-20 rooms
Less than 10 rooms
Sub-Total (Col.
3+4+5) (1) (2) (3) (4) (5) (6) (7)
Quarter – 1 54 22 103 408 533 587 Quarter – 2 54 22 103 408 533 587 Quarter – 3 54 22 103 408 533 587 Quarter – 4 54 22 103 408 533 587
Table - 13
Distribution Accommodation Units by Types
Haryana No. of Accommodation units Quarter Star
Hotels Apartment
Hotels Non-Star
Hotels
Youth/ YMCA
Hostels
Dharamshalas/ Sarais/
Musafirkhanas
Gurudwaras/ Temples/
Monastries
Bed & Breakfast
Units
Motels Total
(1) (2) (3) (4) (5) (6) (7) (8) (9) (10) Quarter – 1 54 0 425 1 48 7 2 26 587
Quarter – 2 54 0 425 1 48 7 2 26 587
Quarter – 3 54 0 425 1 48 7 2 26 587
Quarter – 4 54 0 425 1 48 7 2 26 587
Ministry of Tourism ACNielsen ORG-MARG Pvt. Government of India
Final Report for Haryana – Tourism Survey 24
Visitors Profiling Tables
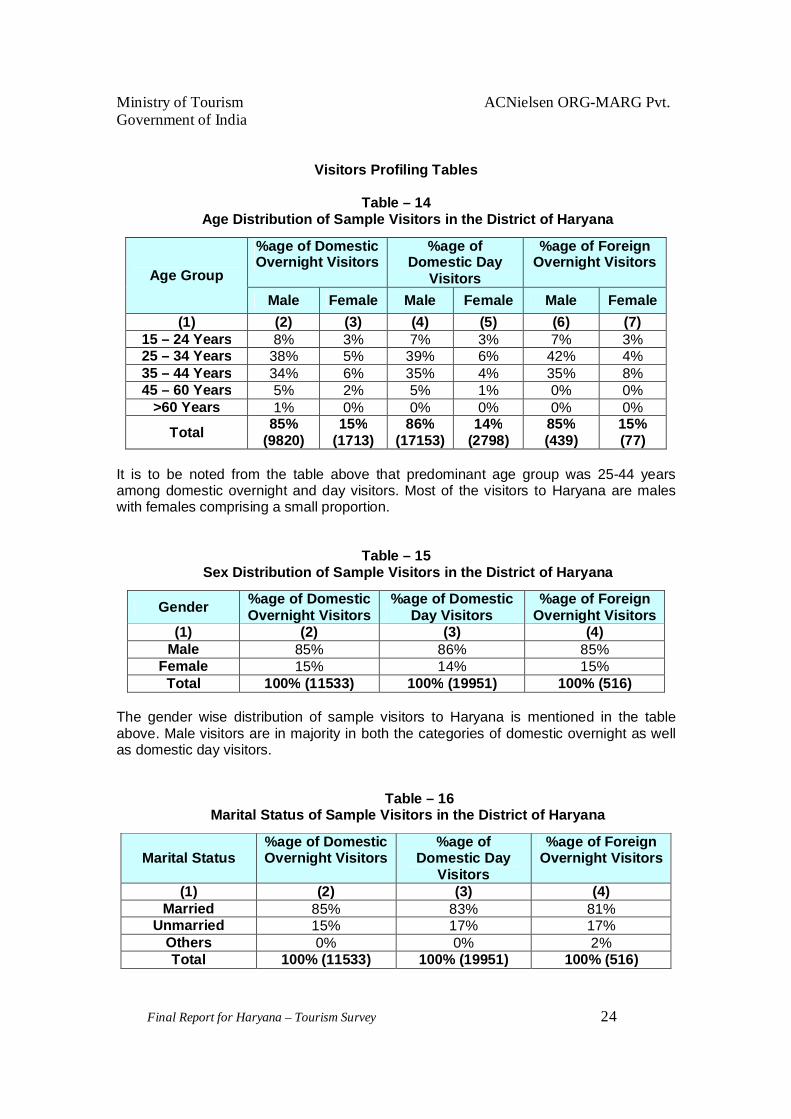
Table – 14
Age Distribution of Sample Visitors in the District of Haryana
It is to be noted from the table above that predominant age group was 25-44 years among domestic overnight and day visitors. Most of the visitors to Haryana are males with females comprising a small proportion.
Table – 15 Sex Distribution of Sample Visitors in the District of Haryana
The gender wise distribution of sample visitors to Haryana is mentioned in the table above. Male visitors are in majority in both the categories of domestic overnight as well as domestic day visitors.
Table – 16 Marital Status of Sample Visitors in the District of Haryana
Age Group
%age of Domestic Overnight Visitors
%age of Domestic Day
Visitors
%age of Foreign Overnight Visitors
Male Female Male Female Male Female (1) (2) (3) (4) (5) (6) (7)
15 – 24 Years 8% 3% 7% 3% 7% 3% 25 – 34 Years 38% 5% 39% 6% 42% 4% 35 – 44 Years 34% 6% 35% 4% 35% 8% 45 – 60 Years 5% 2% 5% 1% 0% 0%
>60 Years 1% 0% 0% 0% 0% 0% Total 85%
(9820) 15%
(1713) 86%
(17153) 14%
(2798) 85% (439)
15% (77)
Gender %age of Domestic Overnight Visitors
%age of Domestic Day Visitors
%age of Foreign Overnight Visitors
(1) (2) (3) (4) Male 85% 86% 85%
Female 15% 14% 15% Total 100% (11533) 100% (19951) 100% (516)
Marital Status %age of Domestic Overnight Visitors
%age of Domestic Day
Visitors
%age of Foreign Overnight Visitors
(1) (2) (3) (4) Married 85% 83% 81%
Unmarried 15% 17% 17% Others 0% 0% 2% Total 100% (11533) 100% (19951) 100% (516)

Ministry of Tourism ACNielsen ORG-MARG Pvt. Government of India
Final Report for Haryana – Tourism Survey 25
It is clear from the table above that most of the sample visitors to Haryana have marital status as married. Unmarried visitors comprise of a small number. Others mentioned above cover the Widows, Divorcee etc.
Table – 17
Educational Level of Sample Visitors in the District of Haryana
The above table represents the education level of sample visitors to Haryana. It is evident from the table that more than majority of the sample visitors have educational qualification as graduate & above. There were no respondents in the survey who did not have any formal education or were educated till the primary level.
Table – 18
Occupation Pattern of Sample Visitors in the District of Haryana
It can be inferred from the table, most of the domestic tourists who visit Haryana are mostly in Government service and foreign tourists who visit Haryana are self employed professionals followed by people into Private Service. None of the respondents amongst the sample studied were students or researchers.
Level of Education %age of Domestic Overnight Visitors
%age of Domestic Day Visitors
%age of Foreign Overnight Visitors
(1) (2) (3) (4) Secondary 3% 5% 1% Higher Secondary 11% 11% 7% Graduate & Above 73% 70% 74% Technical & Professional of All Level 13% 13% 18%
Total 100% (11533) 100% (19951) 100% (516)
Occupation %age of Domestic Overnight Visitors
%age of Domestic Day Visitors
%age of Foreign Overnight Visitors
(1) (2) (3) (4) Industrialist / Trader / Shop Owner 8% 8% 0% Self Employed Professional 13% 14% 47% Government Service 37% 37% 11% Private Service 18% 17% 41% Business 11% 12% 0% Agriculture 8% 8% 0% Housewife 6% 6% 0%
Total 100% (11533) 100% (19951) 100% (516)

Ministry of Tourism ACNielsen ORG-MARG Pvt. Government of India
Final Report for Haryana – Tourism Survey 26
Table – 19
Purpose of visit by Sample Visitors in the District of Haryana
As it can be concluded from the table above, about 21% of domestic overnight and 53% foreign visitors to Haryana, were for the purpose of Business. Domestic day visitors come to Haryana for Business purposes or for getting work done. Purpose of visit didn’t include education/training for any of the respondents who participated in the survey.
Table – 20 Mode of Transportation of Sample Domestic Visitors in the District of Haryana
Mode of Transportation
%age of domestic visitors from within
the State
%age of Domestic visitors from
Outside the State
%age of Foreign visitors
from within the
State
%age of Foreign visitors
from Outside the State
Overnight Visitors
Same day
Visitors
Overnight Visitors
Same day
Visitors
Overnight Visitors
Overnight Visitors
(1) (2) (3) (4) (5) (6) (7) Train 49% 50% 35% 34% Foreign
visitors from within the state were
not encountered
in the survey
40% Bus 34% 33% 22% 24% 24% Air 1% 1% 0% 0% 1% Personal Vehicle 10% 7% 26% 19% 0%
Taxi 7% 10% 16% 23% 35% Total 0% 100% 100% 100% 0% 100% The above table presents the mode of transportation used by sample domestic visitors in Haryana. Most of the same day visitors from within the Haryana used train and bus to
Purpose %age of Domestic Overnight Visitors
%age of Domestic Day Visitors
%age of Foreign Overnight Visitors
(1) (2) (3) (4) Business 21% 37% 53% Holidays, Leisure & Recreation 34% 1% 4% Social Activity 18% 21% 29% Pilgrimage / religious Activity 13% 14% 3% Health & Medical 0% 1% 0% Shopping 0% 2% 0% For getting work done 13% 22% 11% Other 0% 2% 0% Total 100% (11533) 100% (19951) 100% (516)

Ministry of Tourism ACNielsen ORG-MARG Pvt. Government of India
Final Report for Haryana – Tourism Survey 27
travel. For overnight visitors as well as day visitors from outside Haryana, train is the prominent mode of transportation.
Table – 21 Travel Behavior of Sample Visitors in the District of Haryana
The above table evaluates the travel behavior of sample visitors to Haryana. It is clear from the table above that for most of the domestic overnight visitors to Haryana; the frequency of visit is once in six months or once in a year. For domestic day visitors, frequency of visit is once in 3 months and Foreign visitors prefer to travel less once in a year.
Table – 22
Propensity of availing package tour of Sample Visitors in the District of Haryana
The above mentioned is the measure the propensity of availing package tour among the sample visitors in Haryana. The percentage of Foreign Tourists availing packed tours to Haryana is more than the domestic visitors.
Table – 23
Frequency of Visits %age of Domestic Overnight Visitors
%age of Domestic Day
Visitors
%age of Foreign Visitors
(1) (2) (3) (4) Once a week or more often 0% 21% 0% Once a fortnight 0% 20% 0% Once a month 0% 25% 0% Once in 3 months 19% 34% 0% Once in 6 months 28% 0% 26% Once in a Year 35% 0% 49% Less Often 18% 0% 26% Total 100% (11533) 100% (19951) 100% (516)
%age of Domestic Overnight Visitors
%age of Domestic Day Visitors
%age of Foreign
Overnight Visitors
(1) (2) (3) (4) Percentage of Tourists availing package tour
6% 0% 8%
Travel Arrangement Mode % Dom
Overnight % Dom Day % Foreign
(1) (2) (3) (4) Travel + Food 84% Domestic day
visitors in the sample did not
83% Travel + Accommodation 16% 17% Travel + Transport Accommodation 0% 0%

Ministry of Tourism ACNielsen ORG-MARG Pvt. Government of India
Final Report for Haryana – Tourism Survey 28
Table – 24
Travel Arrangement Mode of Sample Visitors in the District of Haryana
As concluded from the previous table that few people avail package tour, thus most of the visitors traveling to Haryana make their travel arrangements themselves, which can be justified from the findings presented in the above table.
Table – 25
Distribution of overnight visitors by place of stay of Sample Visitors in the State
The category wise details regarding the place of stay are presented above. It may be seen from the table above that most of the domestic overnight and foreign tourist preferred Non star hotels as the place of stay. Private Guest houses, Inn, Rest houses, etc. are the other prominent choice for place of stay. No respondents in the survey sample, stayed in star hotels, government guest houses.
Travel +Transport+Accommodation+Food 0% opt for any travel package
0% Any Other 0% 0% Total 100% 0% 100%
Travel Arrangement Mode
%age of Domestic Overnight Visitors
%age of Domestic Day Visitors
%age of Foreign Overnight Visitors
(1) (2) (3) (4) Self 74% 75% 46% Office / Employer 22% 22% 43% Tour Operator 4% 3% 11% Total 100% (11533) 100% (19951) 100% (516)
Place of Stay %age of Domestic Overnight Visitors
%age of Foreign Visitors
(1) (2) (3) Non-Star Hotel 67% 88% Private Guest House / Inn / Rest House / Tourist Bungalow 17% 11% Gurudwara / Temple / Monastery / Other Temporary free stay in tent etc. 5% 0% Friends & Relative 11% 1% Total 100% (11533) 100% (19951)

Ministry of Tourism ACNielsen ORG-MARG Pvt. Government of India
Final Report for Haryana – Tourism Survey 29
Table – 26
Distribution of visitor by their preferred eating place of Sample Visitors in the District of Haryana
The above table gives the percentage distribution of visitor by their preferred eating place of sample visitors in the District of Haryana. It may be seen that proportion of domestic overnight and day visitors who preferred dhabas for eating are the maximum. Foreign visitors preferred Fast food outlets and Restaurants. No respondents in the survey sample, preferred to eat at mobile vans, food kiosks and refreshment stands.
Eating Place %age of Domestic Overnight Visitors
%age of Domestic Day Visitors
%age of Foreign Overnight Visitors
(1) (2) (3) (4) Restaurant 17% 12% 26% Fast Food Outlets 23% 19% 37% Cafeteria 6% 4% 10% Dhaba 30% 39% 4% Bars 3% 0% 10% Place of Lodging 5% 6% 4% Sharamshala / Sarai 2% 2% 0% Gurudwara / Temple / Monastery / Other free accommodation 6% 8% 9% Friends & Relatives 9% 10% 0% Total 100% (11533) 100% (19951) 100% (516)

Ministry of Tourism ACNielsen ORG-MARG Pvt. Government of India
Final Report for Haryana – Tourism Survey 30
Table – 27 Satisfaction level of services by Sample Visitors in the District of Haryana
The above table presents the percentage distribution of satisfaction levels amongst domestic and foreign tourists for different service parameters. There is a strong positive trend as most of the visitors found various service delivery parameters satisfactory.
Services %age of Domestic Overnight Visitors
%age of Domestic Day Visitors
%age of Foreign Overnight Visitors
Satisfied Dissatisfied
Satisfied Dissatisfied Satisfied Dissatisfied
(1) (2) (3) (4) (5) (6) (7) Availability of Tour Operator 84% 15% 97% 3% 94% 6% Availability of Transportation 88% 12% 97% 3% 94% 6% Availability of Tourist Guide 88% 13% 99% 1% 93% 7% Availability of good quality accommodation 90% 10% 98% 2% 93% 7% Public Convenience 91% 9% 91% 9% 95% 5% Eating Places 95% 6% 96% 4% 92% 8% Information Centers 96% 4% 94% 7% 94% 6% Souvenir Shops 95% 5% 98% 2% 96% 4% Entertainment Places 95% 5% 94% 5% 94% 6% Quality of Roads 95% 5% 89% 11% 94% 6% Security 99% 1% 93% 7% 95% 5% Behavior of Local People 100% 0% 100% 0% 100% 0% Shops other than souvenir ones 99% 1% 99% 1% 100% 0% Upkeep of tourist sites 100% 0% 99% 1% 100% 0% Accommodation tariff 92% 8% 99% 1% 99% 1% Quality of Information 93% 7% 96% 4% 96% 4%
Total Total number of Visitors who responded: 11533
Total number of Visitors who responded: 19951
Total number of Visitors who responded: 516

Ministry of Tourism ACNielsen ORG-MARG Pvt. Government of India
Final Report for Haryana – Tourism Survey 31
Table – 28 Expectation level of their visit to district / State of Sample Visitors in the District of
Haryana
The above table presents the percentage distribution across different expectation levels. There is a strong positive trend as most of the visitors found their visit to Haryana somewhat better than expectation or as per expectation.
Table – 29
Most visited tourist destination of Sample Visitors in the District of Haryana
Expectation level %age of Domestic Overnight Visitors
%age of Domestic Day Visitors
%age of Foreign Overnight Visitors
(1) (2) (3) (4) Much Better than expectation 9% 9% 9% Somewhat better than expectation 66% 66% 68% As per expectation 14% 14% 12% Worse than expectation 7% 8% 7% Much worse than expectation 4% 4% 4% Total 100% (11533) 100% (19951) 100% (516)
Most Visited Tourist Destination %age of Visitors
%age of Domestic Overnight Visitors
%age of Domestic
Day Visitors
%age of Foreign
Overnight Visitors
(1) (2) (3) (4) (5) Dera Sachcha Sauda 19.17% 7.48% 11.66% 0.03% Surajkund 15.84% 0.84% 14.48% 0.52% Sri Krishna Museum / Science Museum 6.35% 1.83% 4.53% 0.00% Sheetla Mata Temple 5.49% 1.79% 3.41% 0.29% Jyotisar 5.28% 0.94% 4.34% 0.00% Pijjor Garden 4.81% 0.37% 4.43% 0.01% Karnal Lake 4.22% 0.15% 4.07% 0.00% Golf Course & Osis Complex 4.07% 0.14% 3.93% 0.00% Brahma Sarovar 3.00% 0.62% 2.38% 0.00% Sannihit Sarovar 2.34% 0.24% 2.10% 0.01% Mansa Devi Temple 2.20% 0.22% 1.98% 0.00% Punchmukhi Hanuman Mandir 2.10% 0.18% 1.91% 0.00% Pehowa 1.84% 0.22% 1.61% 0.00% Tilyar Lake 1.43% 0.24% 1.19% 0.00% Badkhal Lake 1.37% 0.38% 0.97% 0.02% Bhima devi Temple 1.24% 0.24% 0.99% 0.00% Geeta Bhawan Mandir 1.16% 0.01% 1.16% 0.00% Gurudwara Nada Sahib 1.14% 0.30% 0.84% 0.00% Bird Watching 1.11% 0.22% 0.89% 0.00% Sohna Lake 1.09% 0.14% 0.80% 0.15%

Ministry of Tourism ACNielsen ORG-MARG Pvt. Government of India
Final Report for Haryana – Tourism Survey 32
The above table gives a blue print of most popular tourist destinations in Haryana. While Shirdi is the most popular destination amongst domestic overnight visitors, Siddhi Vinayak score highest amongst preferred tourist spots among the domestic day visitors. Foreigners mostly visit Gateway of India.
Table – 30
Popular Source of Information of tourist destination of the Sample Visitors in the District of Haryana
Information Source %age of Domestic Overnight Visitors
%age of Domestic Day
Visitors
%age of Foreign
Overnight Visitors
(1) (2) (3) (4) Newspaper 43% 38% 14% Radio 11% 11% 1% Television 26% 28% 73% Newspaper & Radio Both 8% 8% 1% Newspaper & Television Both 12% 14% 11% Total 100% (11533) 100% (19951) 100% (516)
The above table represents a list of popular sources from where tourists get information about the state and its districts. Results show that Newspapers and Television, respectively, are most popular source of information for domestic and foreign travelers. For none of the respondents amongst the sample studied, source of information for them was not radio and television only and all three mediums together.
Table – 31
Annual Household income of the Sample Domestic Visitors in the State
The table above is indicative of the fact that majority of the domestic visitors touring Haryana have an annual HH Income from Rs. 2 Lakh – Rs. 5 Lakh. None of the respondents in the sample had an annual household income of less than 1 lakh rupees.
HH Income (Rs.) %age of Domestic Overnight Visitors
%age of Domestic Day Visitors
(1) (2) (3) Rs.1,00,001 – Rs.2,00,000 15% 14% Rs.2,00,001 – Rs.5,00,000 69% 69% Above Rs.5,00,000 16% 16% Total 100% (11533) 100% (19951)

Ministry of Tourism ACNielsen ORG-MARG Pvt. Government of India
Final Report for Haryana – Tourism Survey 33
Table – 32
Annual Household income of the Sample Foreign Visitors in the State
The table above is indicative of the fact that majority of the foreign visitors touring Haryana have an annual HH Income from $ 80001- 100000.
Table – 33
Accommodations
Domestic Over Night Visitors Domestic Day Visitors Foreign Overnight Visitors
Before
During THE TRIP (Amt
in INR)
TOTAL Before
During THE TRIP (Amt
in INR)
TOTAL Before
During THE TRIP (Amt in
INR)
TOTAL
(1) (2) (3) (4) (5) (6) (7) (8) (9) (10) Hotel No
expenses occurred
before the trip for the
sample responden
ts
463.4 463.4 No expense
s occurred before the trip for the sample
respondents
137.25 137.25 No expense
s occurred before the trip for the sample
respondents
1909.714 1909.714 Private Guest House 219.45 219.45 86.5 86.5 1199.286 1199.286
Dharamshala 3.5 3.5 0 0 0 0
Others 2.5 2.5 0 0 0 0
Total 0 688.85 688.85 0 223.75 223.75 0 3109 3109
None of the respondents in the sample incurred any expenditure on government guest houses, rented houses and friend’s houses.
HH Income (US $) %age Foreign Overnight Visitors (1) (2)
Less than $.40,000 9% $.40,001 – $.60,000 13% $.60,001 – $.80,000 27% $.80,001 – $.1,00,000 42% Above $.1,00,000 9% Total 100% (516)

Ministry of Tourism ACNielsen ORG-MARG Pvt. Government of India
Final Report for Haryana – Tourism Survey 34
Table – 34
Food & Drink
Domestic Over Night Visitors Domestic Day Visitors Foreign Overnight Visitors
Before
During THE TRIP (Amt
in INR)
TOTAL Before
During THE TRIP (Amt
in INR)
TOTAL Before
During THE TRIP (Amt in
INR)
TOTAL
(1) (2) (3) (4) (5) (6) (7) (8) (9) (10) In the accommodation unit
No expense
s occurred before the trip for the sample respond
ents
396.2 396.2 No expenses occurred
before the trip for the
sample responde
nts
42.5 42.5 No expenses occurred
before the trip for the
sample responde
nts
802.28 802.28
o/s accommodation unit & during journey and transit
208.2 208.2 204.3 204.3 463.28 463.28
Total 0 604.4 604.4 0 246.8 246.8 0 1265.57 1265.57
Table – 35
Transport
Domestic Over Night Visitors Domestic Day Visitors Foreign Overnight Visitors
Before
During THE TRIP (Amt
in INR)
TOTAL Before
During THE TRIP (Amt
in INR)
TOTAL Before
During THE TRIP (Amt in
INR)
TOTAL
(1) (2) (3) (4) (5) (6) (7) (8) (9) (10) RAILWAYS 543.75 150.5 694.25 226.75 130.2 356.95 1891.28571 679.8571 2571.143 Road 406.35 172.5 578.85 354.95 178.7 533.65 1673 674.4286 2347.429 WATER 20.95 22.75 43.7 16.7 24.65 41.35 43.5714286 48.71429 92.28571 AIR 666.7 18.45 685.15 0 0 0 2773.28571 479.4286 3252.714 Transport equipment rental
0 88.5 88.5 0 89.1 89.1 218.571429 0 218.5714
Total 1637.75 452.7 2090.45 598.4 422.65 1021.05 6599.71429 1882.429 8482.143

Ministry of Tourism ACNielsen ORG-MARG Pvt. Government of India
Final Report for Haryana – Tourism Survey 35
None of the respondents in the sample incurred any expenditure on travel agency services and other aspects of transportation.
Table – 36
Shopping
Domestic Over Night Visitors Domestic Day Visitors Foreign Overnight Visitors
Before
During THE TRIP (Amt
in INR)
TOTAL Before
During THE TRIP (Amt
in INR)
TOTAL Before
During THE TRIP (Amt in
INR)
TOTAL
(1) (2) (3) (4) (5) (6) (7) (8) (9) (10) Clothing & garments No
expenses occurred
before the trip for the
sample responde
nts
0 0 No expenses occurred
before the trip for the
sample responde
nts
0 0 86.67 28.57143 115.2381
Processed food 30.15 30.15 26.55 26.55 25 100.7143 125.7143 Tobacco products 42.4 42.4 35.45 35.45 0 108.4286 108.4286 Alcohol 116.4 116.4 76 76 0 330.8571 330.8571 Books Journals, Magazines, Stationery etc
13.3 13.3 13 13 0 63.57143 63.57143
Total 0 202.25 202.25 0 151 151 111.67 632.1429 743.8095 None of the respondents in the sample incurred any expenditure on travel related consumer goods, footwear, toiletries and gems / jewellery.
Table-37
Month: Overnight Visitors Domestic Day Visitors
Absolute Number Percentage Absolute
Number Percentage (1) (2) (3) (4) (5)
April 310 7% 1760 7% May 325 8% 1734 7% June 390 9% 1889 8% July 310 7% 2081 9% August 379 9% 2195 9% September 364 9% 2041 9% October 381 9% 2059 9% November 337 8% 2260 10% December 370 9% 1683 7% January 373 9% 2167 9%

Ministry of Tourism ACNielsen ORG-MARG Pvt. Government of India
Final Report for Haryana – Tourism Survey 36
February 307 7% 2020 8% March 356 8% 1892 8% Total 4202 100% 23781 100%
Table-38
Month: Overnight Visitors Domestic Day Visitors
Absolute Number
Percentage Absolute Number
Percentage
(1) (2) (3) (4) (5) April 2211 8% 4122 11% May 2567 9% 3810 10% June 2609 9% 3869 10% July 1970 7% 4520 12% August 2019 7% 4160 11% September 2274 8% 3116 8% October 2381 8% 2504 7% November 2907 10% 2545 7% December 3236 11% 721 2% January 2148 7% 2034 5% February 2453 8% 3140 8% March 2525 9% 3750 10% Total 29300 100% 38291 100%
Table – 39
Total number of Domestic Visitors from outside the State at the year end
State Overnight Visitors Domestic Day Visitors
Absolute Number
Percentage Absolute Number
Percentage
(1) (2) (3) (4) (5) Himachal Pradesh 1476 5% 189 3% Gujarat 1265 4% 2 0% West Bengal 1148 4% 23 0% Bihar 976 3% 0 0% Orissa 627 2% 0 0% Punjab 6799 21% 1170 16% Delhi 9027 28% 3014 40% Uttrakhand 744 2% 12 0% Chandigarh 9800 30% 3034 41% J & K 919 3% 1 0%

Ministry of Tourism ACNielsen ORG-MARG Pvt. Government of India
Final Report for Haryana – Tourism Survey 37
Total 32781 100% 7445 100%
The above table is a depiction of the proportion of people of respective states from where they come to visit Haryana. Maximum visitors come from its neighboring states like Delhi and Chandigarh.
Table – 40
Total number of Foreign Visitors (Including NRI) by their country of residence
at the year end
The above table is a depiction of the proportion of people of respective countries from where they come to visit Haryana. Maximum visitors come from USA followed by UK.
Table – 41
Total number of Foreign Visitors (Excluding NRI) by their country of residence at the year end
Country Foreigner Overnight Visitors Absolute Number Percentage
(1) (2) (3) UAE 542 15% UK 624 18% Russia 121 3% Australia 567 16% USA 988 28% Canada 272 8% Singapore 239 7% Saudi Arabia 168 5%
Country Foreigner Overnight Visitors
Absolute Number
Percentage
(1) (2) (3) UAE 1366 16% UK 1828 22% Russia 218 3% Australia 1197 14% USA 2083 25% Canada 889 11% Singapore 361 4% Saudi Arabia 302 4% Nepal 41 0%
Total 8285 100%

Ministry of Tourism ACNielsen ORG-MARG Pvt. Government of India
Final Report for Haryana – Tourism Survey 38
Nepal 41 1% Total 3562 100%
The above table is an indicator of foreign visitors excluding NRI’s. If we take this parameter into consideration, even then results show maximum visitors are from USA.
Table – 42 Total number of NRI Visitors by country of residence at the year end
Taking into consideration, the proportion of NRI Visitors, from the above table we can conclude that most of the NRI visitors touring Haryana come from USA.
Country Foreigner Overnight Visitors Absolute Number Percentage
(1) (2) (3) UAE 824 17% UK 1204 25% Russia 97 2% Australia 630 13% USA 1095 23% Canada 617 13% Singapore 122 3% Saudi Arabia 134 3% Nepal 0 0%
Total 4723 100%
Ministry of Tourism ACNielsen ORG-MARG Pvt. Government of India
Final Report for Haryana – Tourism Survey 39
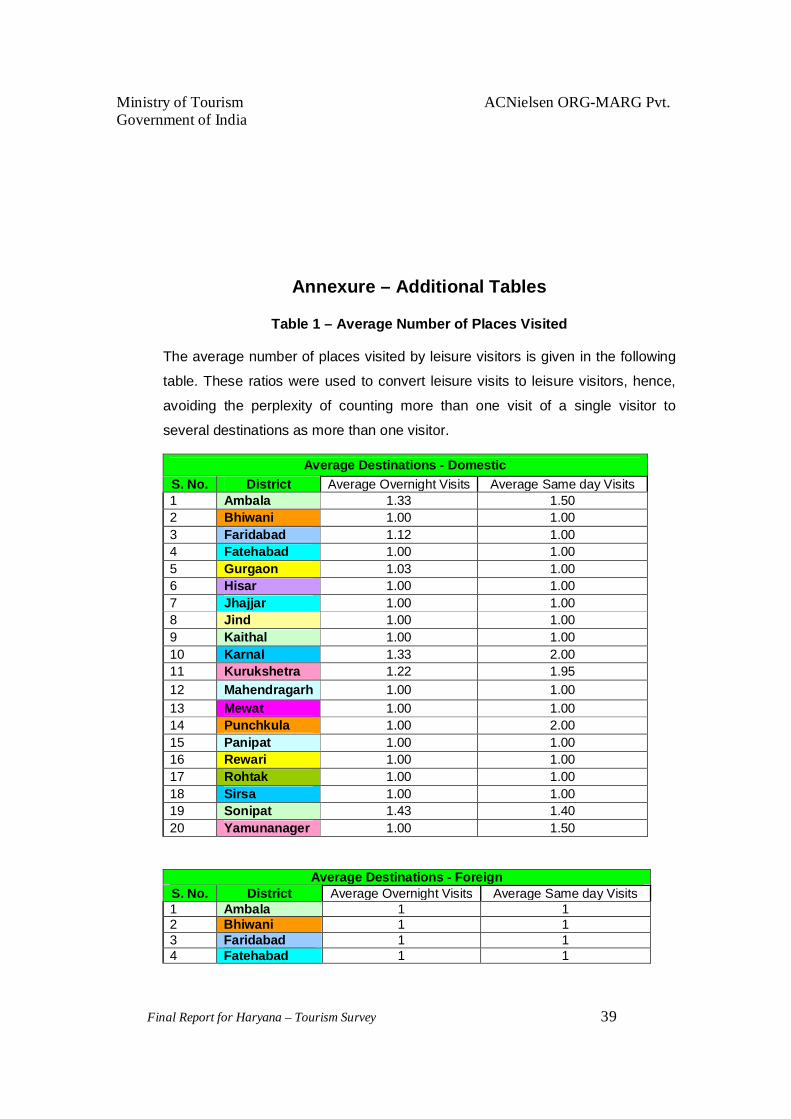
Annexure – Additional Tables
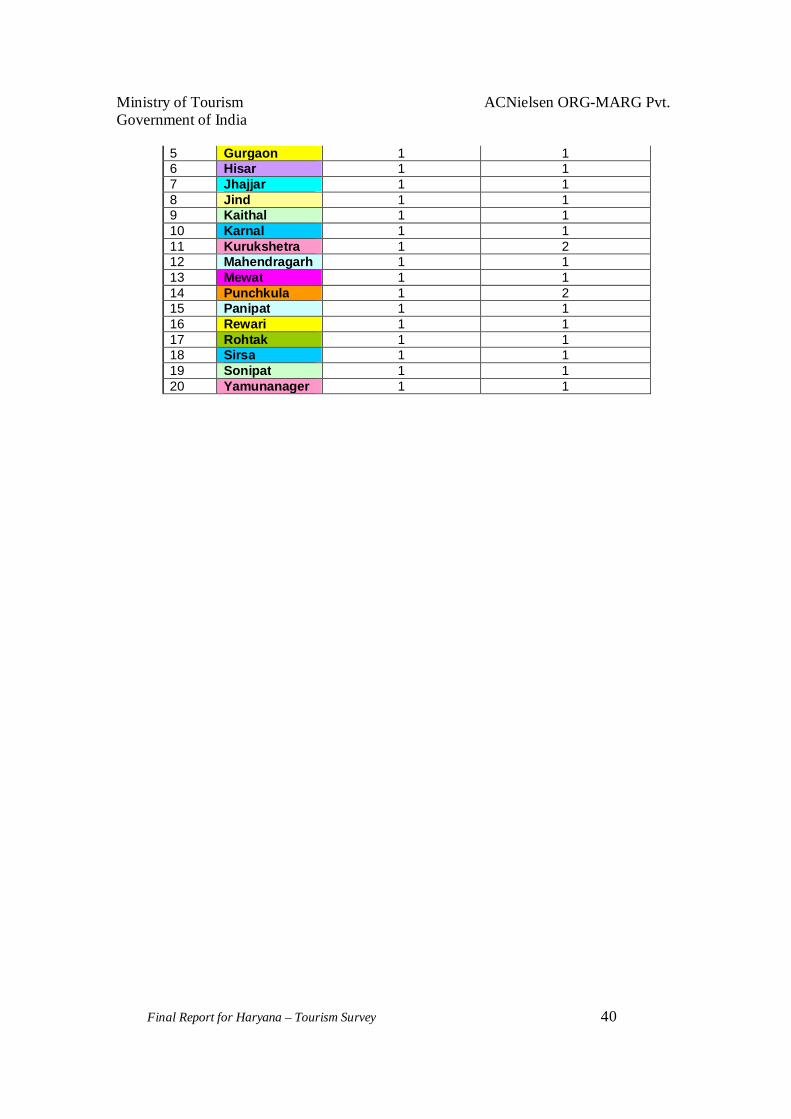
Table 1 – Average Number of Places Visited
The average number of places visited by leisure visitors is given in the following
table. These ratios were used to convert leisure visits to leisure visitors, hence,
avoiding the perplexity of counting more than one visit of a single visitor to
several destinations as more than one visitor.
Average Destinations - Domestic S. No. District Average Overnight Visits Average Same day Visits 1 Ambala 1.33 1.50 2 Bhiwani 1.00 1.00 3 Faridabad 1.12 1.00 4 Fatehabad 1.00 1.00 5 Gurgaon 1.03 1.00 6 Hisar 1.00 1.00 7 Jhajjar 1.00 1.00 8 Jind 1.00 1.00 9 Kaithal 1.00 1.00 10 Karnal 1.33 2.00 11 Kurukshetra 1.22 1.95 12 Mahendragarh 1.00 1.00 13 Mewat 1.00 1.00 14 Punchkula 1.00 2.00 15 Panipat 1.00 1.00 16 Rewari 1.00 1.00 17 Rohtak 1.00 1.00 18 Sirsa 1.00 1.00 19 Sonipat 1.43 1.40 20 Yamunanager 1.00 1.50
Average Destinations - Foreign S. No. District Average Overnight Visits Average Same day Visits 1 Ambala 1 1 2 Bhiwani 1 1 3 Faridabad 1 1 4 Fatehabad 1 1
Ministry of Tourism ACNielsen ORG-MARG Pvt. Government of India
Final Report for Haryana – Tourism Survey 40
5 Gurgaon 1 1 6 Hisar 1 1 7 Jhajjar 1 1 8 Jind 1 1 9 Kaithal 1 1 10 Karnal 1 1 11 Kurukshetra 1 2 12 Mahendragarh 1 1 13 Mewat 1 1 14 Punchkula 1 2 15 Panipat 1 1 16 Rewari 1 1 17 Rohtak 1 1 18 Sirsa 1 1 19 Sonipat 1 1 20 Yamunanager 1 1
Ministry of Tourism ACNielsen ORG-MARG Pvt. Government of India
Final Report for Haryana – Tourism Survey 41
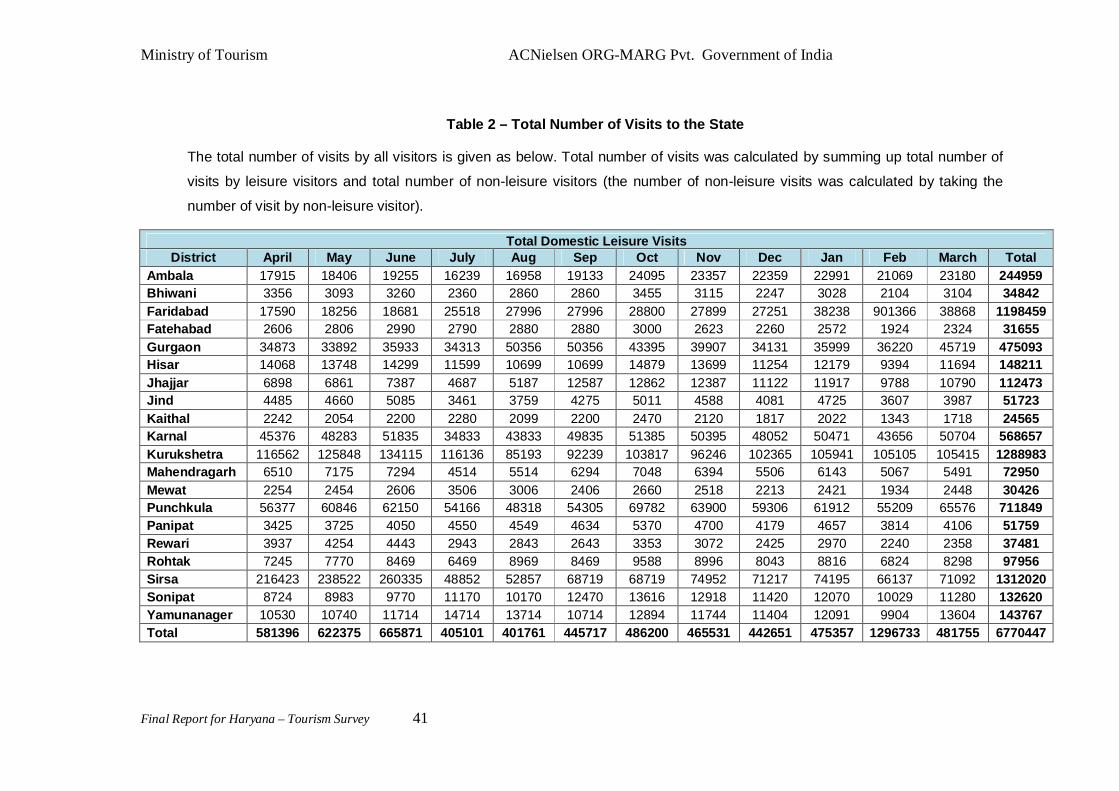
Table 2 – Total Number of Visits to the State
The total number of visits by all visitors is given as below. Total number of visits was calculated by summing up total number of
visits by leisure visitors and total number of non-leisure visitors (the number of non-leisure visits was calculated by taking the
number of visit by non-leisure visitor).
Total Domestic Leisure Visits District April May June July Aug Sep Oct Nov Dec Jan Feb March Total
Ambala 17915 18406 19255 16239 16958 19133 24095 23357 22359 22991 21069 23180 244959 Bhiwani 3356 3093 3260 2360 2860 2860 3455 3115 2247 3028 2104 3104 34842 Faridabad 17590 18256 18681 25518 27996 27996 28800 27899 27251 38238 901366 38868 1198459 Fatehabad 2606 2806 2990 2790 2880 2880 3000 2623 2260 2572 1924 2324 31655 Gurgaon 34873 33892 35933 34313 50356 50356 43395 39907 34131 35999 36220 45719 475093 Hisar 14068 13748 14299 11599 10699 10699 14879 13699 11254 12179 9394 11694 148211 Jhajjar 6898 6861 7387 4687 5187 12587 12862 12387 11122 11917 9788 10790 112473 Jind 4485 4660 5085 3461 3759 4275 5011 4588 4081 4725 3607 3987 51723 Kaithal 2242 2054 2200 2280 2099 2200 2470 2120 1817 2022 1343 1718 24565 Karnal 45376 48283 51835 34833 43833 49835 51385 50395 48052 50471 43656 50704 568657 Kurukshetra 116562 125848 134115 116136 85193 92239 103817 96246 102365 105941 105105 105415 1288983 Mahendragarh 6510 7175 7294 4514 5514 6294 7048 6394 5506 6143 5067 5491 72950 Mewat 2254 2454 2606 3506 3006 2406 2660 2518 2213 2421 1934 2448 30426 Punchkula 56377 60846 62150 54166 48318 54305 69782 63900 59306 61912 55209 65576 711849 Panipat 3425 3725 4050 4550 4549 4634 5370 4700 4179 4657 3814 4106 51759 Rewari 3937 4254 4443 2943 2843 2643 3353 3072 2425 2970 2240 2358 37481 Rohtak 7245 7770 8469 6469 8969 8469 9588 8996 8043 8816 6824 8298 97956 Sirsa 216423 238522 260335 48852 52857 68719 68719 74952 71217 74195 66137 71092 1312020 Sonipat 8724 8983 9770 11170 10170 12470 13616 12918 11420 12070 10029 11280 132620 Yamunanager 10530 10740 11714 14714 13714 10714 12894 11744 11404 12091 9904 13604 143767 Total 581396 622375 665871 405101 401761 445717 486200 465531 442651 475357 1296733 481755 6770447

Ministry of Tourism ACNielsen ORG-MARG Pvt. Government of India
Final Report for Haryana – Tourism Survey 42
Total Foreign Leisure Visits District April May June July Aug Sep Oct Nov Dec
Ambala 7 7 11 27 8 33 37 28 22 Bhiwani 0 0 0 0 0 0 0 0 0 Faridabad 66 63 75 1538 1260 1260 1618 1495 1410 Fatehabad 0 0 0 0 0 0 0 0 0 Gurgaon 115 95 32 3052 2409 2409 2647 2468 2234 Hisar 0 0 0 0 0 0 0 0 0 Jhajjar 0 0 0 0 0 0 0 0 0 Jind 0 0 0 0 0 0 0 0 0 Kaithal 0 0 0 0 0 0 0 0 0 Karnal 10 5 8 0 0 8 8 8 7 Kurukshetra 108 142 142 121 64 18 10 8 7 Mahendragarh 0 0 0 0 0 0 0 0 0 Mewat 0 0 0 0 0 0 0 0 0 Punchkula 114 123 126 110 76 98 110 78 71 Panipat 1 1 1 1 1 3 2 2 2 Rewari 0 0 0 0 0 0 0 0 0 Rohtak 0 0 0 0 0 0 0 0 0 Sirsa 434 478 522 5 0 138 138 105 98 Sonipat 0 0 0 0 0 0 0 0 0 Yamunanager 0 0 0 0 0 0 0 0 0 Total 855 914 917 4853 3817 3964 4569 4192 3852
Ministry of Tourism ACNielsen ORG-MARG Pvt. Government of India
Final Report for Haryana – Tourism Survey 43
Annexure – Supplementary Tables
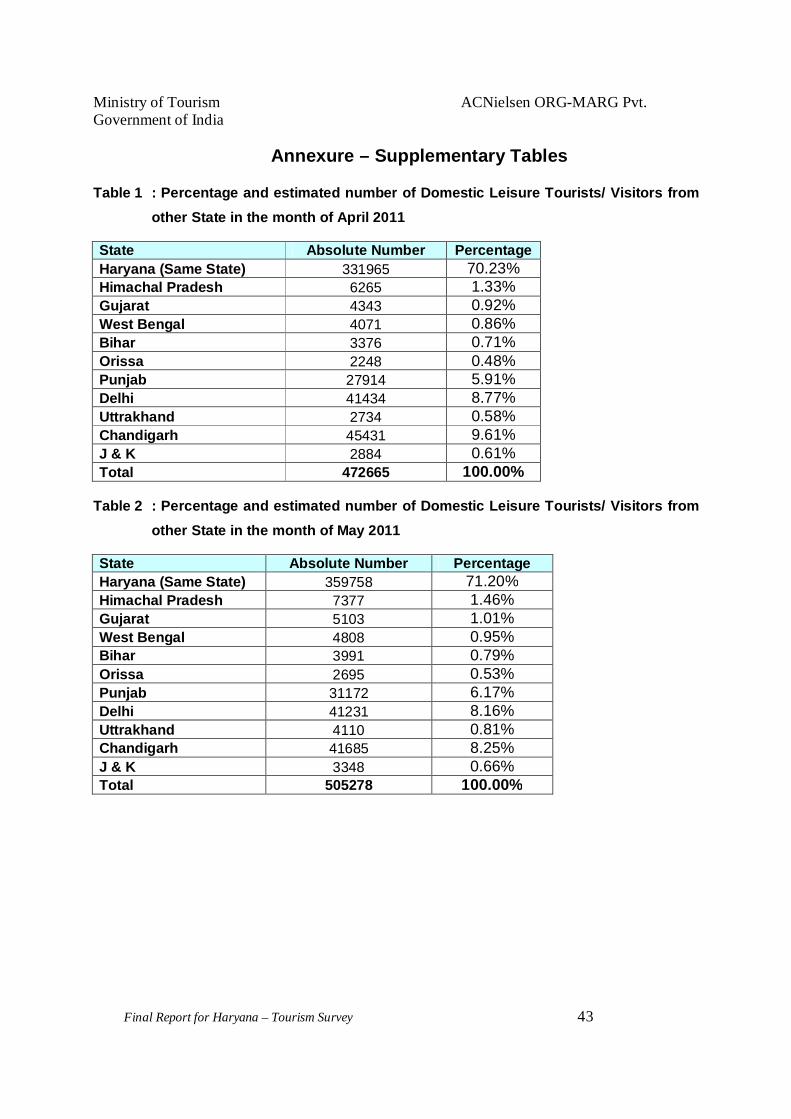
Table 1 : Percentage and estimated number of Domestic Leisure Tourists/ Visitors from other State in the month of April 2011
State Absolute Number Percentage Haryana (Same State) 331965 70.23% Himachal Pradesh 6265 1.33% Gujarat 4343 0.92% West Bengal 4071 0.86% Bihar 3376 0.71% Orissa 2248 0.48% Punjab 27914 5.91% Delhi 41434 8.77% Uttrakhand 2734 0.58% Chandigarh 45431 9.61% J & K 2884 0.61% Total 472665 100.00%
Table 2 : Percentage and estimated number of Domestic Leisure Tourists/ Visitors from
other State in the month of May 2011
State Absolute Number Percentage Haryana (Same State) 359758 71.20% Himachal Pradesh 7377 1.46% Gujarat 5103 1.01% West Bengal 4808 0.95% Bihar 3991 0.79% Orissa 2695 0.53% Punjab 31172 6.17% Delhi 41231 8.16% Uttrakhand 4110 0.81% Chandigarh 41685 8.25% J & K 3348 0.66% Total 505278 100.00%
Ministry of Tourism ACNielsen ORG-MARG Pvt. Government of India
Final Report for Haryana – Tourism Survey 44
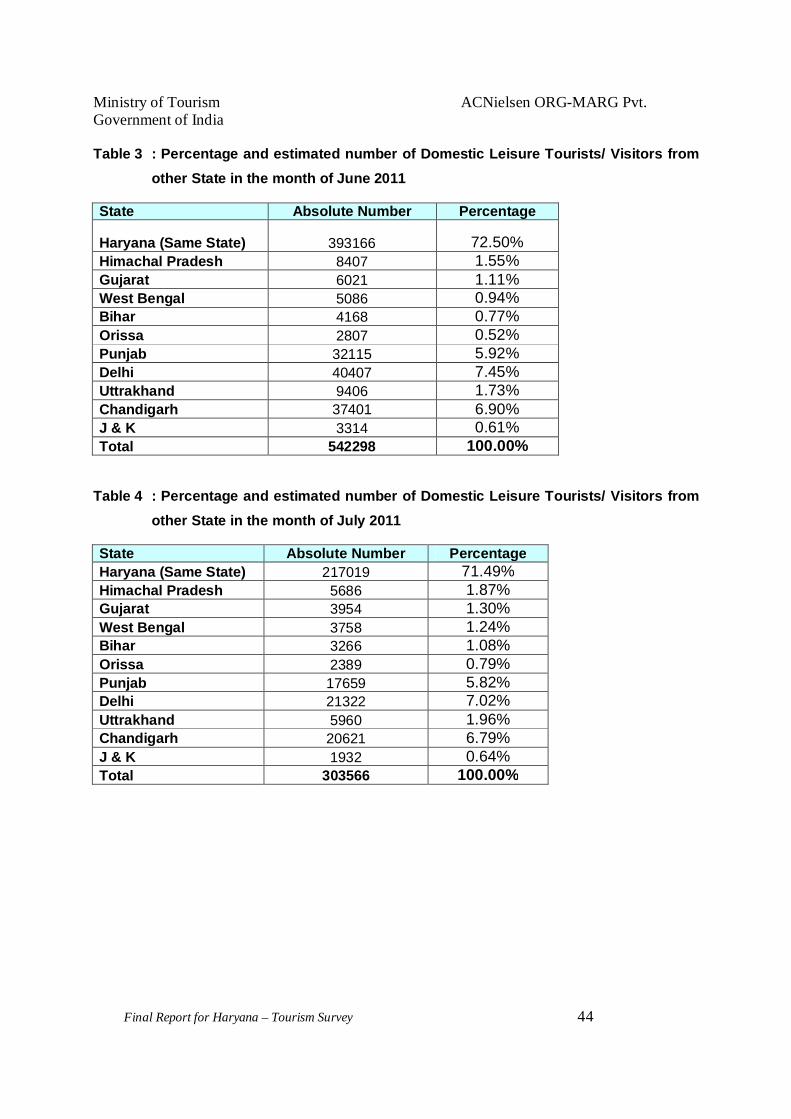
Table 3 : Percentage and estimated number of Domestic Leisure Tourists/ Visitors from other State in the month of June 2011
State Absolute Number Percentage
Haryana (Same State) 393166 72.50% Himachal Pradesh 8407 1.55% Gujarat 6021 1.11% West Bengal 5086 0.94% Bihar 4168 0.77% Orissa 2807 0.52% Punjab 32115 5.92% Delhi 40407 7.45% Uttrakhand 9406 1.73% Chandigarh 37401 6.90% J & K 3314 0.61% Total 542298 100.00%
Table 4 : Percentage and estimated number of Domestic Leisure Tourists/ Visitors from other State in the month of July 2011
State Absolute Number Percentage Haryana (Same State) 217019 71.49% Himachal Pradesh 5686 1.87% Gujarat 3954 1.30% West Bengal 3758 1.24% Bihar 3266 1.08% Orissa 2389 0.79% Punjab 17659 5.82% Delhi 21322 7.02% Uttrakhand 5960 1.96% Chandigarh 20621 6.79% J & K 1932 0.64% Total 303566 100.00%
Ministry of Tourism ACNielsen ORG-MARG Pvt. Government of India
Final Report for Haryana – Tourism Survey 45
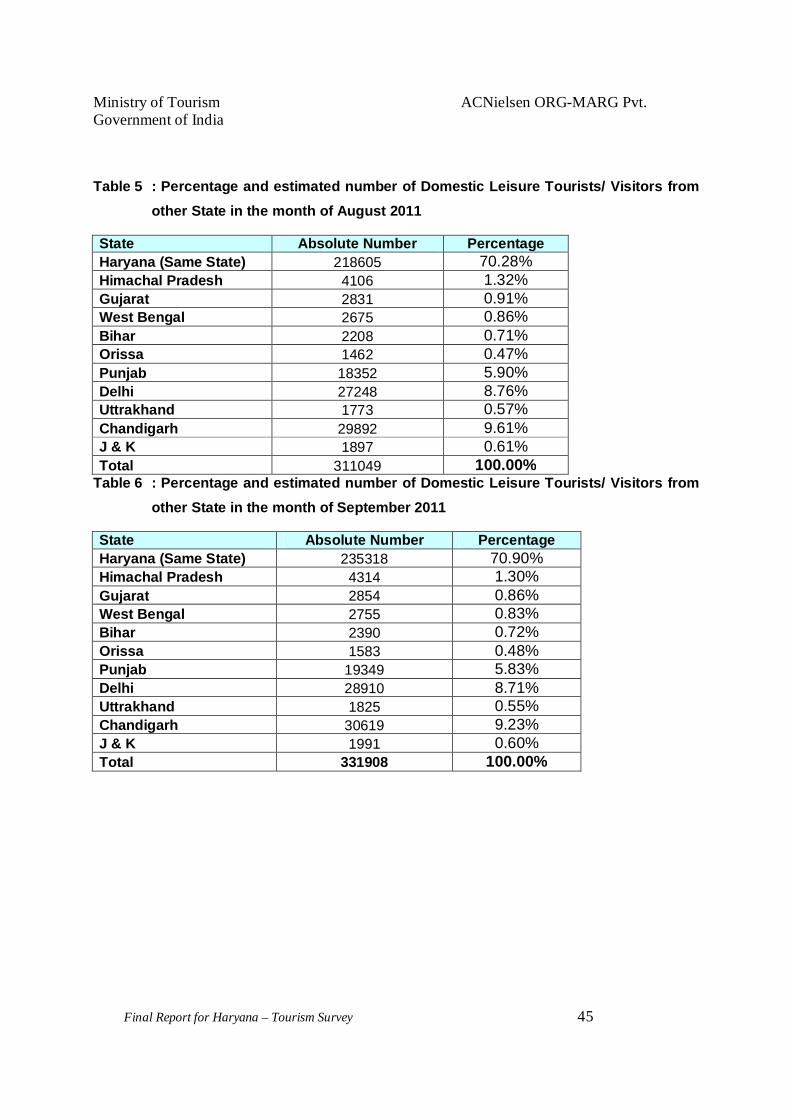
Table 5 : Percentage and estimated number of Domestic Leisure Tourists/ Visitors from other State in the month of August 2011
State Absolute Number Percentage Haryana (Same State) 218605 70.28% Himachal Pradesh 4106 1.32% Gujarat 2831 0.91% West Bengal 2675 0.86% Bihar 2208 0.71% Orissa 1462 0.47% Punjab 18352 5.90% Delhi 27248 8.76% Uttrakhand 1773 0.57% Chandigarh 29892 9.61% J & K 1897 0.61% Total 311049 100.00%
Table 6 : Percentage and estimated number of Domestic Leisure Tourists/ Visitors from other State in the month of September 2011
State Absolute Number Percentage Haryana (Same State) 235318 70.90% Himachal Pradesh 4314 1.30% Gujarat 2854 0.86% West Bengal 2755 0.83% Bihar 2390 0.72% Orissa 1583 0.48% Punjab 19349 5.83% Delhi 28910 8.71% Uttrakhand 1825 0.55% Chandigarh 30619 9.23% J & K 1991 0.60% Total 331908 100.00%

Ministry of Tourism ACNielsen ORG-MARG Pvt. Government of India
Final Report for Haryana – Tourism Survey 46
Table 7 : Percentage and estimated number of Domestic Leisure Tourists/ Visitors from
other State in the month of October 2011
State Absolute Number Percentage Haryana (Same State) 261494 71.10% Himachal Pradesh 4744 1.29% Gujarat 3089 0.84% West Bengal 2942 0.80% Bihar 2613 0.71% Orissa 1802 0.49% Punjab 21368 5.81% Delhi 31960 8.69% Uttrakhand 1986 0.54% Chandigarh 33652 9.15% J & K 2133 0.58% Total 367783 100.00%
Table 8 : Percentage and estimated number of Domestic Leisure Tourists/ Visitors from other State in the month of November 2011
State Absolute Number Percentage Haryana (Same State) 248317 70.07% Himachal Pradesh 4678 1.32% Gujarat 3225 0.91% West Bengal 3048 0.86% Bihar 2587 0.73% Orissa 1625 0.46% Punjab 21909 6.18% Delhi 31045 8.76% Uttrakhand 2087 0.59% Chandigarh 33712 9.51% J & K 2162 0.61% Total 354395 100.00%

Ministry of Tourism ACNielsen ORG-MARG Pvt. Government of India
Final Report for Haryana – Tourism Survey 47
Table 9 : Percentage and estimated number of Domestic Leisure Tourists/ Visitors from other State in the month of December 2011
State Absolute Number Percentage Haryana (Same State) 234759 70.89% Himachal Pradesh 4272 1.29% Gujarat 2815 0.85% West Bengal 2749 0.83% Bihar 2384 0.72% Orissa 1556 0.47% Punjab 19505 5.89% Delhi 28844 8.71% Uttrakhand 1788 0.54% Chandigarh 30533 9.22% J & K 1954 0.59% Total 331159 100.00%
Table 10 : Percentage and estimated number of Domestic Leisure Tourists/ Visitors from other State in the month of January 2012
State Absolute Number Percentage Haryana (Same State) 259838 72.10% Himachal Pradesh 4541 1.26% Gujarat 2631 0.73% West Bengal 2484 0.69% Bihar 2415 0.67% Orissa 1658 0.46% Punjab 20938 5.81% Delhi 30560 8.48% Uttrakhand 1766 0.49% Chandigarh 31714 8.80% J & K 1838 0.51% Total 360383 100.00%

Ministry of Tourism ACNielsen ORG-MARG Pvt. Government of India
Final Report for Haryana – Tourism Survey 48
Table 11 : Percentage and estimated number of Domestic Leisure Tourists/ Visitors from other State in the month of February 2012
State Absolute Number Percentage Haryana (Same State) 863101 72.49% Himachal Pradesh 18455 1.55% Gujarat 13216 1.11% West Bengal 11073 0.93% Bihar 9049 0.76% Orissa 6072 0.51% Punjab 70486 5.92% Delhi 88703 7.45% Uttrakhand 20598 1.73% Chandigarh 82631 6.94% J & K 7263 0.61% Total 1190647 100.00%
Table 12 : Percentage and estimated number of Domestic Leisure Tourists/ Visitors from other State in the month of March 2012
State Absolute Number Percentage Haryana (Same State) 259458 71.50% Himachal Pradesh 5262 1.45% Gujarat 2722 0.75% West Bengal 2540 0.70% Bihar 2504 0.69% Orissa 1851 0.51% Punjab 21374 5.89% Delhi 31171 8.59% Uttrakhand 1851 0.51% Chandigarh 32298 8.90% J & K 1848 0.51% Total 362879 100.00%
Ministry of Tourism ACNielsen ORG-MARG Pvt. Government of India
Final Report for Haryana – Tourism Survey 49
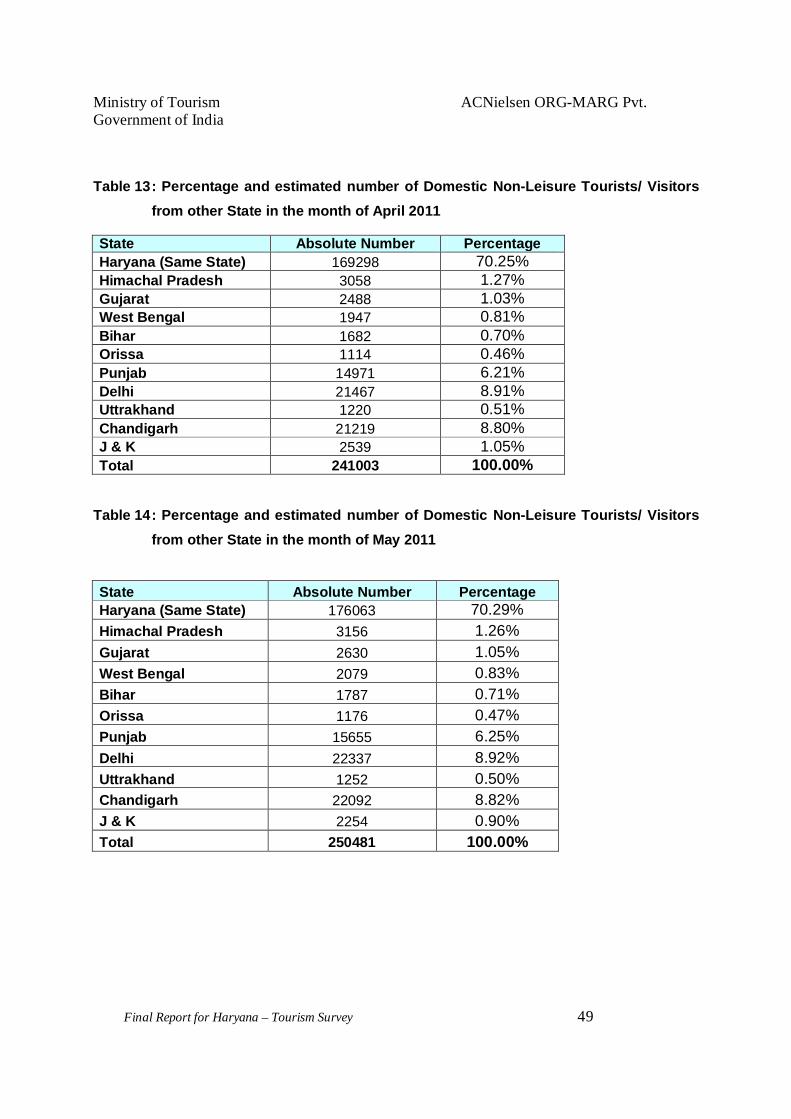
Table 13 : Percentage and estimated number of Domestic Non-Leisure Tourists/ Visitors from other State in the month of April 2011
State Absolute Number Percentage Haryana (Same State) 169298 70.25% Himachal Pradesh 3058 1.27% Gujarat 2488 1.03% West Bengal 1947 0.81% Bihar 1682 0.70% Orissa 1114 0.46% Punjab 14971 6.21% Delhi 21467 8.91% Uttrakhand 1220 0.51% Chandigarh 21219 8.80% J & K 2539 1.05% Total 241003 100.00%
Table 14 : Percentage and estimated number of Domestic Non-Leisure Tourists/ Visitors from other State in the month of May 2011
State Absolute Number Percentage Haryana (Same State) 176063 70.29% Himachal Pradesh 3156 1.26% Gujarat 2630 1.05% West Bengal 2079 0.83% Bihar 1787 0.71% Orissa 1176 0.47% Punjab 15655 6.25% Delhi 22337 8.92% Uttrakhand 1252 0.50% Chandigarh 22092 8.82% J & K 2254 0.90% Total 250481 100.00%

Ministry of Tourism ACNielsen ORG-MARG Pvt. Government of India
Final Report for Haryana – Tourism Survey 50
Table 15 : Percentage and estimated number of Domestic Non-Leisure Tourists/ Visitors from other State in the month of June 2011
State Absolute Number Percentage Haryana (Same State) 189107 70.69% Himachal Pradesh 3920 1.47% Gujarat 2964 1.11% West Bengal 2432 0.91% Bihar 1817 0.68% Orissa 1354 0.51% Punjab 17844 6.67% Delhi 21984 8.22% Uttrakhand 1859 0.69% Chandigarh 21539 8.05% J & K 2682 1.00% Total 267502 100.00%
Table 16 : Percentage and estimated number of Domestic Non-Leisure Tourists/ Visitors from other State in the month of July 2011
State Absolute Number Percentage Haryana (Same State) 157935 69.77% Himachal Pradesh 3246 1.43% Gujarat 2775 1.23% West Bengal 1924 0.85% Bihar 1585 0.70% Orissa 1087 0.48% Punjab 14125 6.24% Delhi 20192 8.92% Uttrakhand 1132 0.50% Chandigarh 19988 8.83% J & K 2376 1.05% Total 226365 100.00%

Ministry of Tourism ACNielsen ORG-MARG Pvt. Government of India
Final Report for Haryana – Tourism Survey 51
Table 17 : Percentage and estimated number of Domestic Non-Leisure Tourists/ Visitors from other State in the month of August 2011
State Absolute Number Percentage Haryana (Same State) 166440 70.25% Himachal Pradesh 3081 1.30% Gujarat 2440 1.03% West Bengal 1895 0.80% Bihar 1635 0.69% Orissa 1090 0.46% Punjab 14713 6.21% Delhi 21110 8.91% Uttrakhand 1208 0.51% Chandigarh 20873 8.81% J & K 2440 1.03% Total 236925 100.00%
Table 18 : Percentage and estimated number of Domestic Non-Leisure Tourists/ Visitors from other State in the month of September 2011
State Absolute Number Percentage Haryana (Same State) 170272 70.28% Himachal Pradesh 3174 1.31% Gujarat 2520 1.04% West Bengal 2011 0.83% Bihar 1720 0.71% Orissa 1114 0.46% Punjab 15118 6.24% Delhi 21611 8.92% Uttrakhand 1187 0.49% Chandigarh 21369 8.82% J & K 2180 0.90% Total 242276 100.00%
Ministry of Tourism ACNielsen ORG-MARG Pvt. Government of India
Final Report for Haryana – Tourism Survey 52
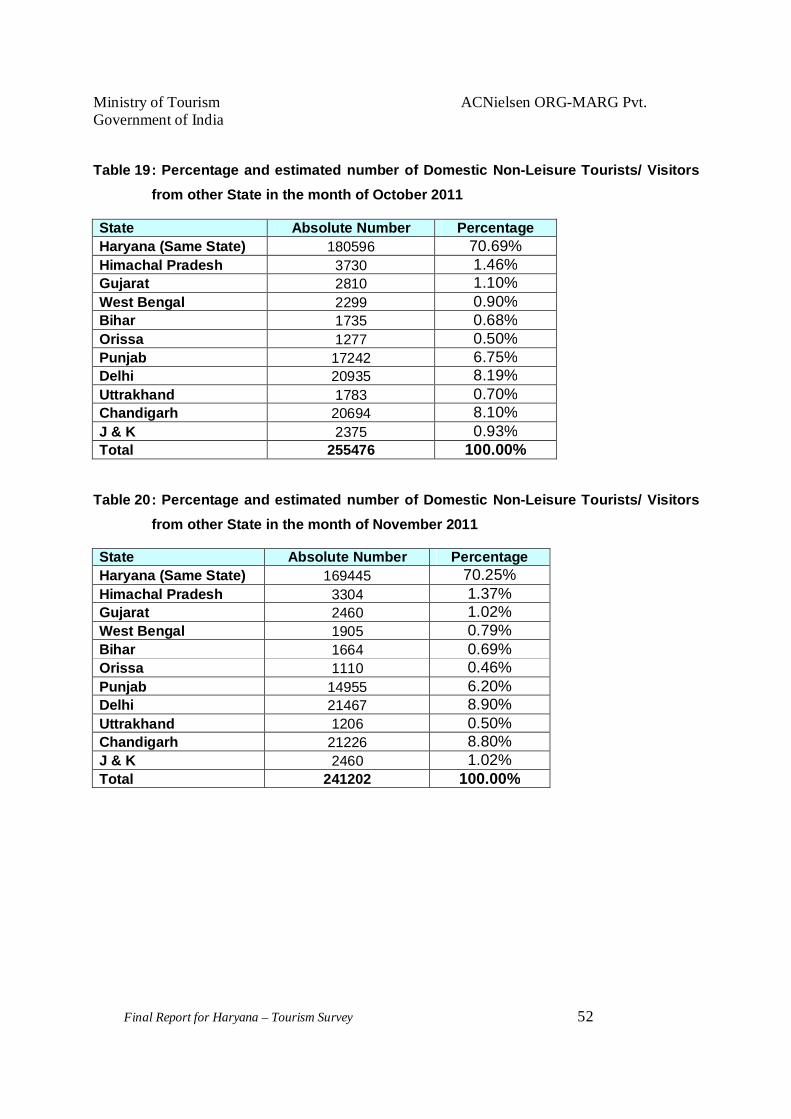
Table 19 : Percentage and estimated number of Domestic Non-Leisure Tourists/ Visitors
from other State in the month of October 2011
State Absolute Number Percentage Haryana (Same State) 180596 70.69% Himachal Pradesh 3730 1.46% Gujarat 2810 1.10% West Bengal 2299 0.90% Bihar 1735 0.68% Orissa 1277 0.50% Punjab 17242 6.75% Delhi 20935 8.19% Uttrakhand 1783 0.70% Chandigarh 20694 8.10% J & K 2375 0.93% Total 255476 100.00%
Table 20 : Percentage and estimated number of Domestic Non-Leisure Tourists/ Visitors from other State in the month of November 2011
State Absolute Number Percentage Haryana (Same State) 169445 70.25% Himachal Pradesh 3304 1.37% Gujarat 2460 1.02% West Bengal 1905 0.79% Bihar 1664 0.69% Orissa 1110 0.46% Punjab 14955 6.20% Delhi 21467 8.90% Uttrakhand 1206 0.50% Chandigarh 21226 8.80% J & K 2460 1.02% Total 241202 100.00%

Ministry of Tourism ACNielsen ORG-MARG Pvt. Government of India
Final Report for Haryana – Tourism Survey 53
Table 21 : Percentage and estimated number of Domestic Non-Leisure Tourists/ Visitors
from other State in the month of December 2011
State Absolute Number Percentage Haryana (Same State) 154898 69.82% Himachal Pradesh 3173 1.43% Gujarat 2707 1.22% West Bengal 1864 0.84% Bihar 1553 0.70% Orissa 1065 0.48% Punjab 13822 6.23% Delhi 19789 8.92% Uttrakhand 1109 0.50% Chandigarh 19567 8.82% J & K 2307 1.04% Total 221854 100.00%
Table 22 : Percentage and estimated number of Domestic Non-Leisure Tourists/ Visitors from other State in the month of January 2012
State Absolute Number Percentage Haryana (Same State) 157407 70.25% Himachal Pradesh 2980 1.33% Gujarat 2285 1.02% West Bengal 1837 0.82% Bihar 1546 0.69% Orissa 1053 0.47% Punjab 13892 6.20% Delhi 19942 8.90% Uttrakhand 1120 0.50% Chandigarh 19718 8.80% J & K 2285 1.02% Total 224065 100.00%

Ministry of Tourism ACNielsen ORG-MARG Pvt. Government of India
Final Report for Haryana – Tourism Survey 54
Table 23 : Percentage and estimated number of Domestic Non-Leisure Tourists/ Visitors from other State in the month of February 2012
State Absolute Number Percentage Haryana (Same State) 269982 71.23% Himachal Pradesh 5345 1.41% Gujarat 4169 1.10% West Bengal 3373 0.89% Bihar 2653 0.70% Orissa 1895 0.50% Punjab 24258 6.40% Delhi 31118 8.21% Uttrakhand 1933 0.51% Chandigarh 30512 8.05% J & K 3790 1.00% Total 379028 100.00%
Table 24 : Percentage and estimated number of Domestic Non-Leisure Tourists/ Visitors from other State in the month of March 2012
State Absolute Number Percentage Haryana (Same State) 159323 69.80% Himachal Pradesh 3264 1.43% Gujarat 2785 1.22% West Bengal 1917 0.84% Bihar 1598 0.70% Orissa 1096 0.48% Punjab 14266 6.25% Delhi 20361 8.92% Uttrakhand 1141 0.50% Chandigarh 20132 8.82% J & K 2374 1.04% Total 228257 100.00%

Ministry of Tourism ACNielsen ORG-MARG Pvt. Government of India
Final Report for Haryana – Tourism Survey 55
Table 25 : Percentage and estimated number of Foreign Leisure Tourists/ Visitors from other State in the month of April 2011
Country Absolute Number Percentage UAE 137 16.04% UK 190 22.25% Russia 26 3.04% Australia 121 14.17% USA 214 25.06% Canada 94 11.01% Singapore 33 3.86% Saudi Arabia 34 3.98% Nepal 5 0.59%
Total 854 100.00%
Table 26 : Percentage and estimated number of Foreign Leisure Tourists/ Visitors from other State in the month of May 2011
Country Absolute Number Percentage UAE 147 16.08% UK 203 22.21% Russia 28 3.06% Australia 132 14.44% USA 227 24.84% Canada 101 11.05% Singapore 33 3.61% Saudi Arabia 36 3.94% Nepal 7 0.77%
Total 914 100.00%
Table 27 : Percentage and estimated number of Foreign Leisure Tourists/ Visitors from other State in the month of June 2011
Country Absolute Number Percentage UAE 145 15.83% UK 204 22.27% Russia 26 2.84% Australia 134 14.63% USA 225 24.56% Canada 103 11.24% Singapore 34 3.71% Saudi Arabia 37 4.04% Nepal 8 0.87%
Total 916 100.00%
Ministry of Tourism ACNielsen ORG-MARG Pvt. Government of India
Final Report for Haryana – Tourism Survey 56
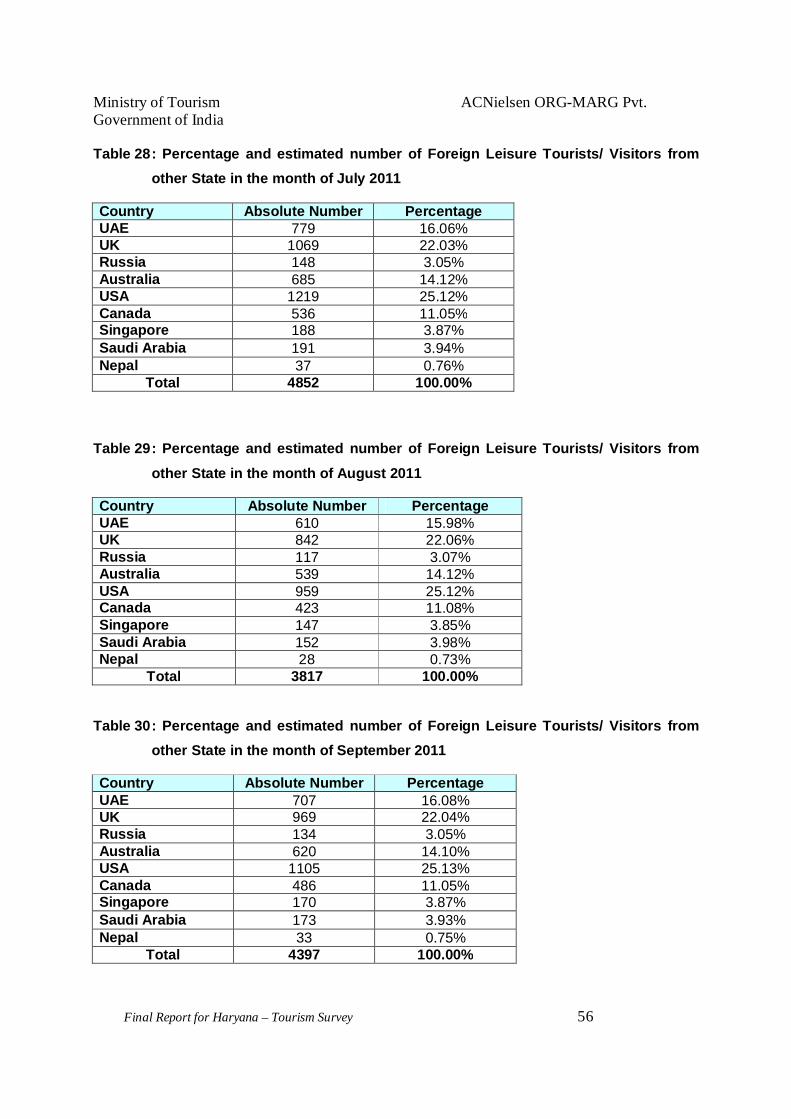
Table 28 : Percentage and estimated number of Foreign Leisure Tourists/ Visitors from other State in the month of July 2011
Country Absolute Number Percentage UAE 779 16.06% UK 1069 22.03% Russia 148 3.05% Australia 685 14.12% USA 1219 25.12% Canada 536 11.05% Singapore 188 3.87% Saudi Arabia 191 3.94% Nepal 37 0.76%
Total 4852 100.00%
Table 29 : Percentage and estimated number of Foreign Leisure Tourists/ Visitors from other State in the month of August 2011
Country Absolute Number Percentage UAE 610 15.98% UK 842 22.06% Russia 117 3.07% Australia 539 14.12% USA 959 25.12% Canada 423 11.08% Singapore 147 3.85% Saudi Arabia 152 3.98% Nepal 28 0.73%
Total 3817 100.00%
Table 30 : Percentage and estimated number of Foreign Leisure Tourists/ Visitors from other State in the month of September 2011
Country Absolute Number Percentage UAE 707 16.08% UK 969 22.04% Russia 134 3.05% Australia 620 14.10% USA 1105 25.13% Canada 486 11.05% Singapore 170 3.87% Saudi Arabia 173 3.93% Nepal 33 0.75%
Total 4397 100.00%

Ministry of Tourism ACNielsen ORG-MARG Pvt. Government of India
Final Report for Haryana – Tourism Survey 57
Table 31 : Percentage and estimated number of Foreign Leisure Tourists/ Visitors from other State in the month of October 2011
Country Absolute Number Percentage UAE 733 16.05% UK 1006 22.02% Russia 140 3.06% Australia 645 14.12% USA 1147 25.11% Canada 504 11.03% Singapore 178 3.90% Saudi Arabia 180 3.94% Nepal 35 0.77%
Total 4568 100.00%
Table 32 : Percentage and estimated number of Foreign Leisure Tourists/ Visitors from other State in the month of November 2011
Country Absolute Number Percentage UAE 674 16.08% UK 923 22.02% Russia 128 3.05% Australia 591 14.10% USA 1054 25.15% Canada 463 11.05% Singapore 162 3.87% Saudi Arabia 165 3.94% Nepal 31 0.74%
Total 4191 100.00%
Table 33 : Percentage and estimated number of Foreign Leisure Tourists/ Visitors from other State in the month of December 2011
Country Absolute Number Percentage UAE 618 16.05% UK 849 22.05% Russia 118 3.06% Australia 543 14.10% USA 967 25.11% Canada 425 11.04% Singapore 150 3.90% Saudi Arabia 152 3.95% Nepal 29 0.75%
Total 3851 100.00%

Ministry of Tourism ACNielsen ORG-MARG Pvt. Government of India
Final Report for Haryana – Tourism Survey 58
Table 34 : Percentage and estimated number of Foreign Leisure Tourists/ Visitors from other State in the month of January 2012
Country Absolute Number Percentage UAE 673 16.07% UK 921 22.00% Russia 129 3.08% Australia 591 14.12% USA 1053 25.15% Canada 462 11.03% Singapore 162 3.87% Saudi Arabia 165 3.94% Nepal 31 0.74%
Total 4187 100.00%
Table 35 : Percentage and estimated number of Foreign Leisure Tourists/ Visitors from other State in the month of February 2012
Country Absolute Number Percentage UAE 5917 16.04% UK 8133 22.05% Russia 1129 3.06% Australia 5204 14.11% USA 9266 25.12% Canada 4068 11.03% Singapore 1435 3.89% Saudi Arabia 1453 3.94% Nepal 280 0.76%
Total 36885 100.00%
Table 36 : Percentage and estimated number of Foreign Leisure Tourists/ Visitors from other State in the month of March 2012
Country Absolute Number Percentage UAE 689 16.08% UK 944 22.03% Russia 131 3.06% Australia 604 14.09% USA 1078 25.15% Canada 474 11.06% Singapore 165 3.85% Saudi Arabia 169 3.94% Nepal 32 0.75%
Total 4286 100.00%

Ministry of Tourism ACNielsen ORG-MARG Pvt. Government of India
Final Report for Haryana – Tourism Survey 59
Table 37 : Percentage and estimated number of Foreign Non-Leisure Tourists/ Visitors from other State in the month of April 2011
Country Absolute Number Percentage UAE 49 16.12% UK 67 22.04% Russia 10 3.29% Australia 43 14.14% USA 76 25.00% Canada 33 10.86% Singapore 11 3.62% Saudi Arabia 12 3.95% Nepal 3 0.99%
Total 304 100.00%
Table 38 : Percentage and estimated number of Foreign Non-Leisure Tourists/ Visitors from other State in the month of May 2011
Country Absolute Number Percentage UAE 42 15.97% UK 58 22.05% Russia 9 3.42% Australia 37 14.07% USA 67 25.48% Canada 29 11.03% Singapore 9 3.42% Saudi Arabia 10 3.80% Nepal 2 0.76%
Total 263 100.00%
Table 39 : Percentage and estimated number of Foreign Non-Leisure Tourists/ Visitors from other State in the month of June 2011
Country Absolute Number Percentage UAE 19 15.57% UK 27 22.13% Russia 4 3.28% Australia 17 13.93% USA 31 25.41% Canada 14 11.48% Singapore 4 3.28% Saudi Arabia 5 4.10% Nepal 1 0.82%
Total 122 100.00%

Ministry of Tourism ACNielsen ORG-MARG Pvt. Government of India
Final Report for Haryana – Tourism Survey 60
Table 40 : Percentage and estimated number of Foreign Non-Leisure Tourists/ Visitors from other State in the month of July 2011
Country Absolute Number Percentage UAE 1162 16.12% UK 1588 22.03% Russia 237 3.29% Australia 1019 14.14% USA 1806 25.05% Canada 782 10.85% Singapore 260 3.61% Saudi Arabia 284 3.94% Nepal 71 0.98%
Total 7209 100.00%
Table 41 : Percentage and estimated number of Foreign Non-Leisure Tourists/ Visitors from other State in the month of August 2011
Country Absolute Number Percentage UAE 914 15.99% UK 1261 22.06% Russia 196 3.43% Australia 804 14.06% USA 1456 25.47% Canada 630 11.02% Singapore 196 3.43% Saudi Arabia 217 3.80% Nepal 43 0.75%
Total 5717 100.00%
Table 42 : Percentage and estimated number of Foreign Non-Leisure Tourists/ Visitors from other State in the month of September 2011
Country Absolute Number Percentage UAE 1066 16.16% UK 1455 22.05% Russia 216 3.27% Australia 932 14.13% USA 1652 25.04% Canada 715 10.84% Singapore 238 3.61% Saudi Arabia 259 3.93% Nepal 65 0.99%
Total 6598 100.00%

Ministry of Tourism ACNielsen ORG-MARG Pvt. Government of India
Final Report for Haryana – Tourism Survey 61
Table 43 : Percentage and estimated number of Foreign Non-Leisure Tourists/ Visitors from other State in the month of October 2011
Country Absolute Number Percentage UAE 1017 16.15% UK 1388 22.04% Russia 208 3.30% Australia 889 14.11% USA 1579 25.07% Canada 682 10.83% Singapore 227 3.60% Saudi Arabia 247 3.92% Nepal 62 0.98%
Total 6299 100.00%
Table 44 : Percentage and estimated number of Foreign Non-Leisure Tourists/ Visitors from other State in the month of November 2011
Country Absolute Number Percentage UAE 938 16.00% UK 1293 22.05% Russia 201 3.43% Australia 826 14.09% USA 1492 25.44% Canada 647 11.03% Singapore 201 3.43% Saudi Arabia 222 3.79% Nepal 44 0.75%
Total 5864 100.00%
Table 45 : Percentage and estimated number of Foreign Non-Leisure Tourists/ Visitors from other State in the month of December 2011
Country Absolute Number Percentage UAE 857 16.14% UK 1170 22.03% Russia 176 3.31% Australia 750 14.12% USA 1331 25.06% Canada 575 10.83% Singapore 192 3.62% Saudi Arabia 208 3.92% Nepal 52 0.98%
Total 5311 100.00%

Ministry of Tourism ACNielsen ORG-MARG Pvt. Government of India
Final Report for Haryana – Tourism Survey 62
Table 46 : Percentage and estimated number of Foreign Non-Leisure Tourists/ Visitors from other State in the month of January 2012
Country Absolute Number Percentage UAE 931 16.00% UK 1283 22.04% Russia 199 3.42% Australia 821 14.11% USA 1480 25.43% Canada 642 11.03% Singapore 200 3.44% Saudi Arabia 220 3.78% Nepal 44 0.76%
Total 5820 100.00%
Table 47 : Percentage and estimated number of Foreign Non-Leisure Tourists/ Visitors from other State in the month of February 2012
Country Absolute Number Percentage UAE 4479 16.18% UK 6108 22.06% Russia 908 3.28% Australia 3912 14.13% USA 6925 25.02% Canada 2998 10.83% Singapore 997 3.60% Saudi Arabia 1085 3.92% Nepal 271 0.98%
Total 27683 100.00%
Table 48 : Percentage and estimated number of Foreign Non-Leisure Tourists/ Visitors from other State in the month of March 2012
Country Absolute Number Percentage UAE 957 15.99% UK 1322 22.08% Russia 205 3.42% Australia 843 14.08% USA 1522 25.43% Canada 660 11.03% Singapore 205 3.42% Saudi Arabia 227 3.79% Nepal 45 0.75%
Total 5986 100.00%