tourism toronto annual report 2014 · tourism toronto annual report 2014. 2. table of contents ......
TRANSCRIPT
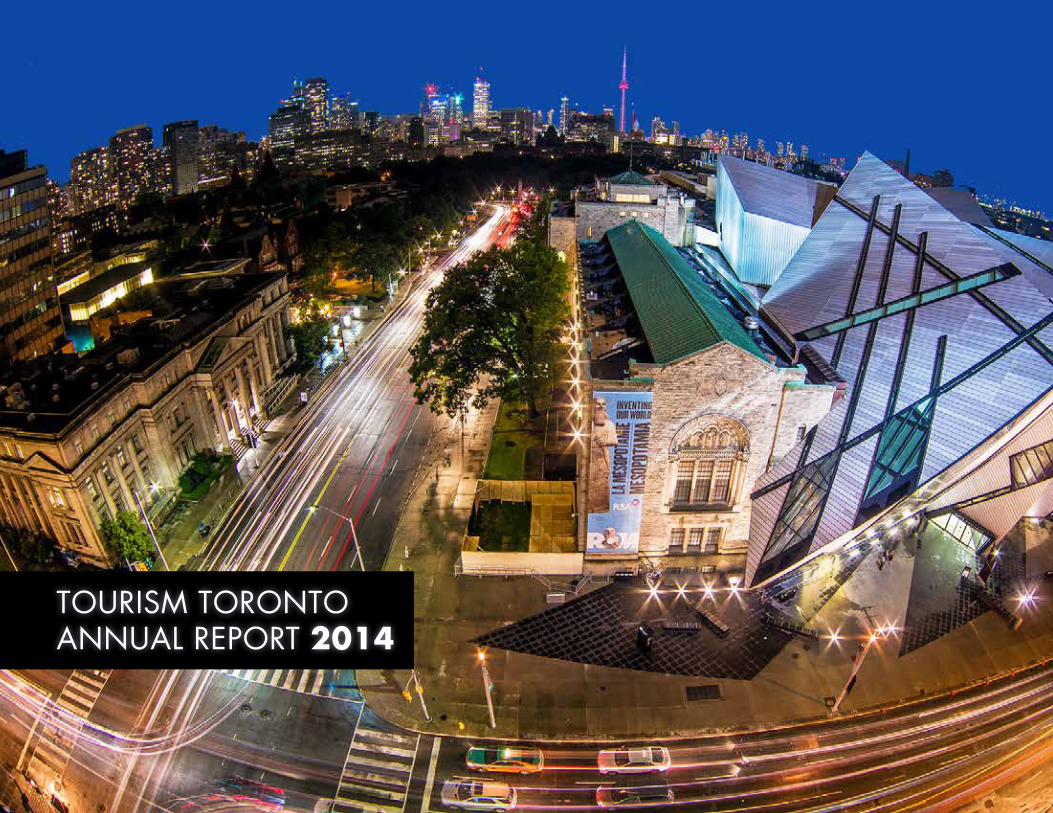
TOURISM TORONTO ANNUAL REPORT 2014
2
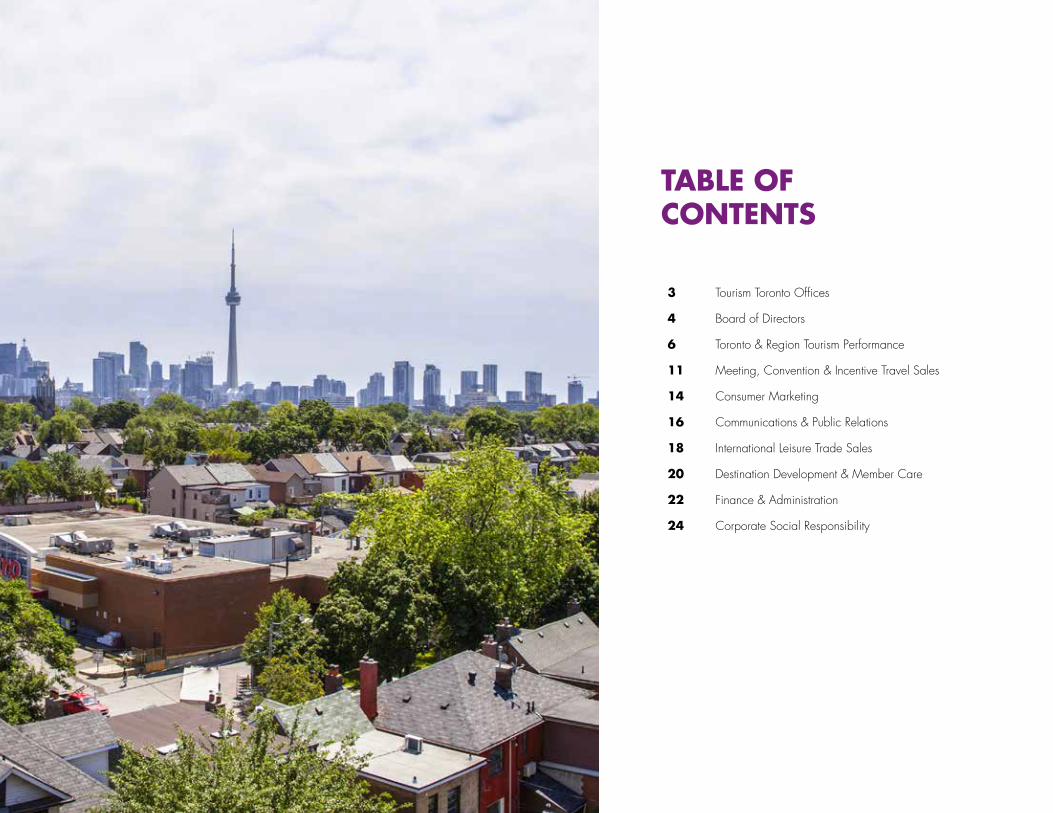
TABLE OFCONTENTS
3 Tourism Toronto Offices
4 Board of Directors
6 Toronto & Region Tourism Performance
11 Meeting, Convention & Incentive Travel Sales
14 Consumer Marketing
16 Communications & Public Relations
18 International Leisure Trade Sales
20 Destination Development & Member Care
22 Finance & Administration
24 Corporate Social Responsibility

2
We zijn blij
TOURISM TORONTO
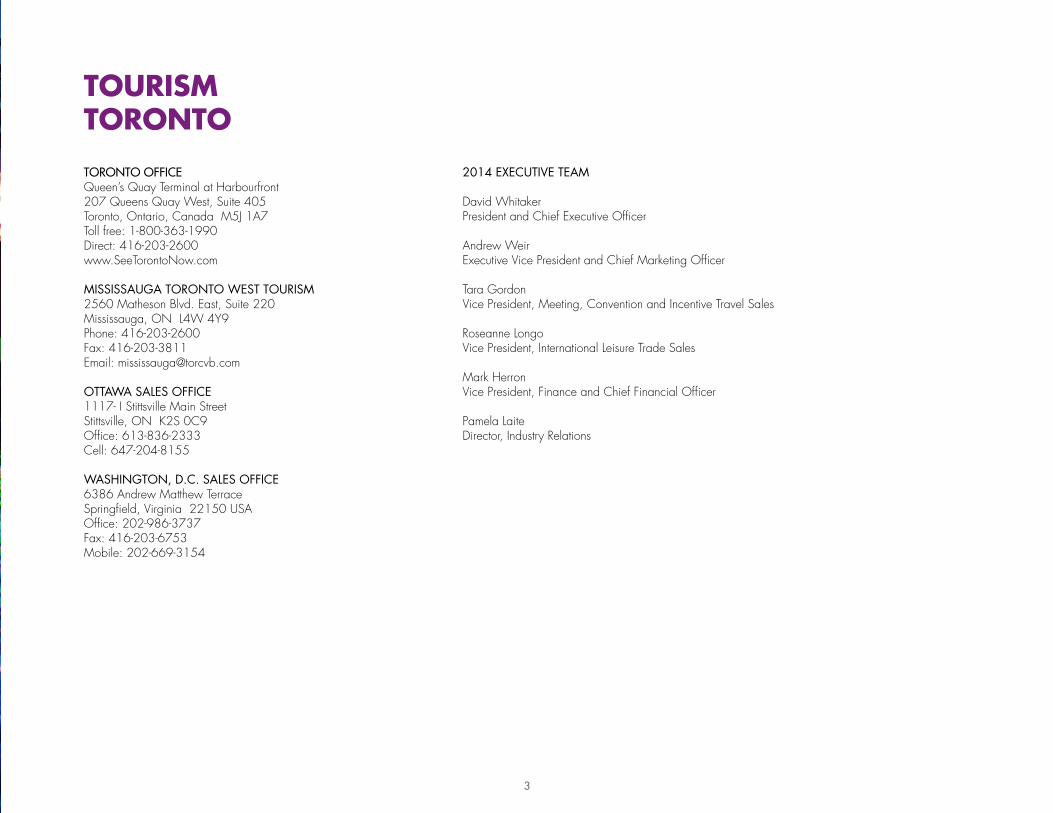
TORONTO OFFICEQueen’s Quay Terminal at Harbourfront207 Queens Quay West, Suite 405Toronto, Ontario, Canada M5J 1A7Toll free: 1-800-363-1990 Direct: 416-203-2600www.SeeTorontoNow.com
MISSISSAUGA TORONTO WEST TOURISM2560 Matheson Blvd. East, Suite 220Mississauga, ON L4W 4Y9Phone: 416-203-2600Fax: 416-203-3811Email: [email protected]
OTTAWA SALES OFFICE1117- I Stittsville Main StreetStittsville, ON K2S 0C9Office: 613-836-2333Cell: 647-204-8155
WASHINGTON, D.C. SALES OFFICE6386 Andrew Matthew TerraceSpringfield, Virginia 22150 USA Office: 202-986-3737Fax: 416-203-6753Mobile: 202-669-3154
2014 EXECUTIVE TEAM
David WhitakerPresident and Chief Executive Officer
Andrew WeirExecutive Vice President and Chief Marketing Officer
Tara GordonVice President, Meeting, Convention and Incentive Travel Sales
Roseanne LongoVice President, International Leisure Trade Sales
Mark HerronVice President, Finance and Chief Financial Officer
Pamela LaiteDirector, Industry Relations
3
4
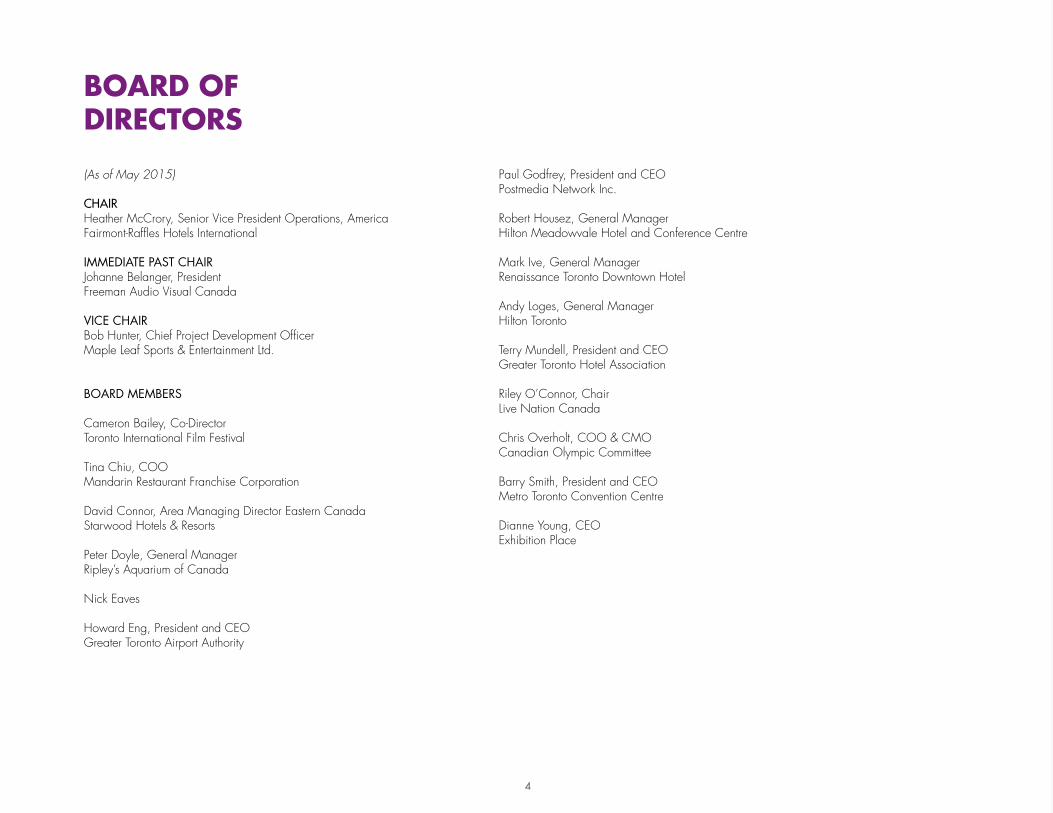
BOARD OFDIRECTORS
(As of May 2015)
CHAIRHeather McCrory, Senior Vice President Operations, AmericaFairmont-Raffles Hotels International
IMMEDIATE PAST CHAIRJohanne Belanger, PresidentFreeman Audio Visual Canada
VICE CHAIRBob Hunter, Chief Project Development OfficerMaple Leaf Sports & Entertainment Ltd.
BOARD MEMBERS
Cameron Bailey, Co-DirectorToronto International Film Festival
Tina Chiu, COOMandarin Restaurant Franchise Corporation
David Connor, Area Managing Director Eastern CanadaStarwood Hotels & Resorts
Peter Doyle, General ManagerRipley’s Aquarium of Canada
Nick Eaves
Howard Eng, President and CEO Greater Toronto Airport Authority
Paul Godfrey, President and CEOPostmedia Network Inc.
Robert Housez, General ManagerHilton Meadowvale Hotel and Conference Centre
Mark Ive, General Manager Renaissance Toronto Downtown Hotel
Andy Loges, General ManagerHilton Toronto
Terry Mundell, President and CEOGreater Toronto Hotel Association
Riley O’Connor, ChairLive Nation Canada
Chris Overholt, COO & CMO Canadian Olympic Committee
Barry Smith, President and CEOMetro Toronto Convention Centre
Dianne Young, CEO Exhibition Place
5
6
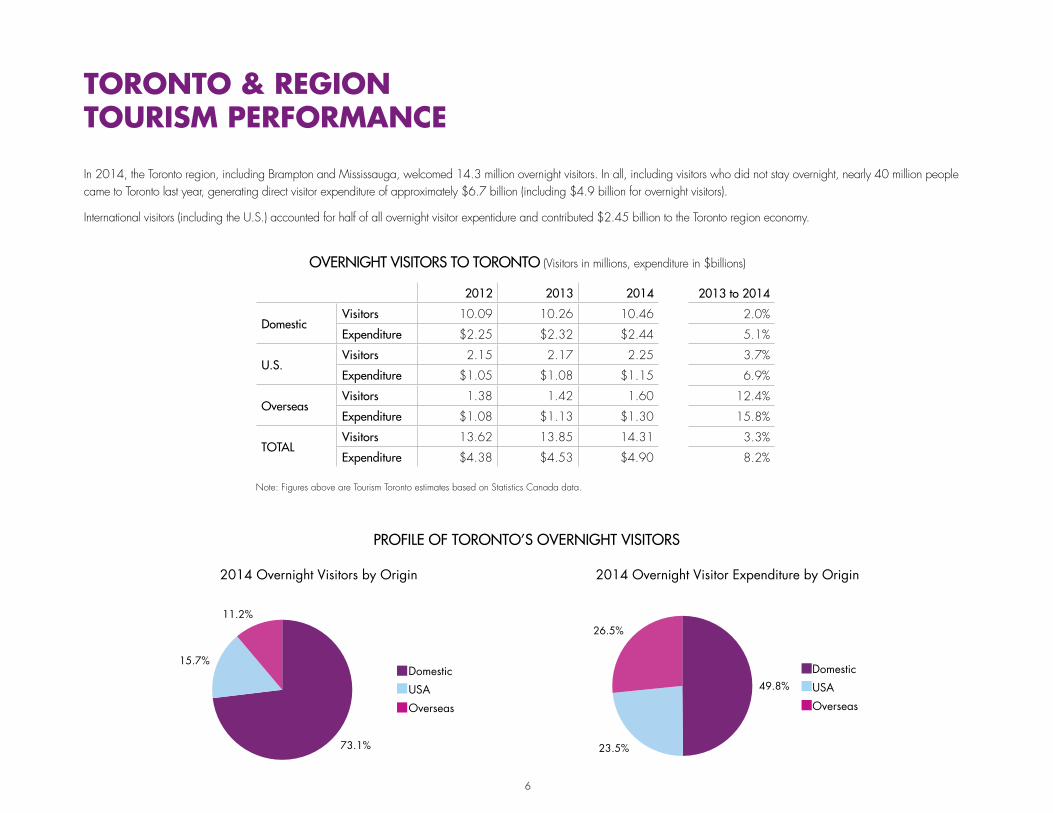
In 2014, the Toronto region, including Brampton and Mississauga, welcomed 14.3 million overnight visitors. In all, including visitors who did not stay overnight, nearly 40 million people came to Toronto last year, generating direct visitor expenditure of approximately $6.7 billion (including $4.9 billion for overnight visitors).
International visitors (including the U.S.) accounted for half of all overnight visitor expentidure and contributed $2.45 billion to the Toronto region economy.
TORONTO & REGIONTOURISM PERFORMANCE
2012 2013 2014
DomesticVisitors 10.09 10.26 10.46
Expenditure $2.25 $2.32 $2.44
U.S.Visitors 2.15 2.17 2.25
Expenditure $1.05 $1.08 $1.15
OverseasVisitors 1.38 1.42 1.60
Expenditure $1.08 $1.13 $1.30
TOTALVisitors 13.62 13.85 14.31
Expenditure $4.38 $4.53 $4.90
2013 to 2014
2.0%
5.1%
3.7%
6.9%
12.4%
15.8%
3.3%
8.2%
PROFILE OF TORONTO’S OVERNIGHT VISITORS!"#$
%&'&()*' +,-.)/0'(&1 #"234!25#$ !233$2$##24"4678 !2!5$2#4" #2#5$2!#92:;$<=0*'0>' #259;233: #2$"$2;$42"""
?@0>'A*0 $24$#2#9;BA'&C0'' !24$52"!#%DE ;2#!425!$ #"2;5;2;!"<(F0* 9!"2$:"
?@0>'A*0GH&C1@IG%DEJ#"2;5;2;!"BA'&C0'' !24$52"!#<(F0* 9!"2$:"
!"## !"#! !"#$ !""% !"#" !"## !"#! !"#$ !"#&6IKI #99I4 #99I: !"#I5 #4:2#:; #9425$4 #992;!: #992;9!GGG !"#25"#GGG !#;2!$!LF&C>G #3!I: #54I9 #:#I# #""29$$ ##3259" #352553 #542:4"GGG #:#2#:5GGG !$"23:5M0*/>CN ;5I: :" ;5 552#"4 44234: ;:2945 :"2"";GGGGGG ;52"3#GGGGGG :52":"OCP&> ;:I: ;:I$ ;;I! 442;53 ;#29;9 ;52:#! ;:2$"9GGGGGG ;;2!:;GGGGGG 932;3!Q>->C 43 4:I# 4: ;42$;9 4!2:$! 45244# 4:2##;GGGGGG 4:2":3GGGGGG :;234:D*>C10 43I9 44 44I4 532955 4!29!; 432""3 442"$9GGGGGG 4424"4GGGGGG ;!25448A'(*>@&> 5!I# 55I# 5:I3 $;2355 342:3" 5"2!39 552#3#GGGGGG 5:23#:GGGGGG 452;#4O(>@N 5"I5 39I9 39I3 !92"43 3"295" 33299# 3929#5GGGGGG 392349GGGGGG ;#2"$9B*>R&@ 35 35I9 35I; $#2!$! $9295" $92!3; 3529!5GGGGGG 352;;"GGGGGG 3;2!#;7IGK)*0> $9I! 3" 39I$ 352$94 !52;5$ !529$; 3"2"!;GGGGGG 392!9!GGGGGG 4!2#4$S0,&1) !5I9 !:I5 !9 42"#5 ;2#9# ;24"" !:2345GGGGGG !92"$:GGGGGG $"23#9
'()*(+),-.)/(0)!"#!)0.1(0+
Note: Numbers are derived from Statistics Canada data. The 2011 numbers are Tourism Toronto estimates based on Statistics Canada data.
73.1%
15.7%
11.2%
Domestic
USA
Overseas
49.8%
23.5%
26.5%
Domestic
USA
Overseas
75.2%
18.4%
6.4%
Pleasure (incl. VFR)
Business
Other
0 10 20 30 40 50 60 70 80 90
100 110 120 130 140 150 160 170 180 190 200 210 220
U.K. China Germany India Japan France Australia Italy Brazil S. Korea Mexico
2011
2012
2013
2014 Overnight Visitors by Origin
!"#$%&'&()*' +,-
.)/0'(&1 #"234!25#$ !233$2$##24"4678 !2!5$2#4" #2#5$2!#92:;$<=0*'0>' #259;233: #2$"$2;$42"""
?@0>'A*0 $24$#2#9;BA'&C0'' !24$52"!#%DE ;2#!425!$ #"2;5;2;!"<(F0* 9!"2$:"
?@0>'A*0GH&C1@IG%DEJ#"2;5;2;!"BA'&C0'' !24$52"!#<(F0* 9!"2$:"
!"## !"#! !"#$ !""% !"#" !"## !"#! !"#$ !"#&6IKI #99I4 #99I: !"#I5 #4:2#:; #9425$4 #992;!: #992;9!GGG !"#25"#GGG !#;2!$!LF&C>G #3!I: #54I9 #:#I# #""29$$ ##3259" #352553 #542:4"GGG #:#2#:5GGG !$"23:5M0*/>CN ;5I: :" ;5 552#"4 44234: ;:2945 :"2"";GGGGGG ;52"3#GGGGGG :52":"OCP&> ;:I: ;:I$ ;;I! 442;53 ;#29;9 ;52:#! ;:2$"9GGGGGG ;;2!:;GGGGGG 932;3!Q>->C 43 4:I# 4: ;42$;9 4!2:$! 45244# 4:2##;GGGGGG 4:2":3GGGGGG :;234:D*>C10 43I9 44 44I4 532955 4!29!; 432""3 442"$9GGGGGG 4424"4GGGGGG ;!25448A'(*>@&> 5!I# 55I# 5:I3 $;2355 342:3" 5"2!39 552#3#GGGGGG 5:23#:GGGGGG 452;#4O(>@N 5"I5 39I9 39I3 !92"43 3"295" 33299# 3929#5GGGGGG 392349GGGGGG ;#2"$9B*>R&@ 35 35I9 35I; $#2!$! $9295" $92!3; 3529!5GGGGGG 352;;"GGGGGG 3;2!#;7IGK)*0> $9I! 3" 39I$ 352$94 !52;5$ !529$; 3"2"!;GGGGGG 392!9!GGGGGG 4!2#4$S0,&1) !5I9 !:I5 !9 42"#5 ;2#9# ;24"" !:2345GGGGGG !92"$:GGGGGG $"23#9
'()*(+),-.)/(0)!"#!)0.1(0+
Note: Numbers are derived from Statistics Canada data. The 2011 numbers are Tourism Toronto estimates based on Statistics Canada data.
73.1%
15.7%
11.2%
Domestic
USA
Overseas
49.8%
23.5%
26.5%
Domestic
USA
Overseas
75.2%
18.4%
6.4%
Pleasure (incl. VFR)
Business
Other
0 10 20 30 40 50 60 70 80 90
100 110 120 130 140 150 160 170 180 190 200 210 220
U.K. China Germany India Japan France Australia Italy Brazil S. Korea Mexico
2011
2012
2013
2014 Overnight Visitor Expenditure by Origin
Note: Figures above are Tourism Toronto estimates based on Statistics Canada data.
OVERNIGHT VISITORS TO TORONTO (Visitors in millions, expenditure in $billions)

Note: Numbers are derived from Statistics Canada data. The 2014 numbers are Tourism Toronto estimates based on Statistics Canada data.
0 10 20 30 40 50 60 70 80 90
100 110 120 130 140 150 160 170 180 190 200 210 220 230 240 250
China U.K. India Japan Germany France Italy Australia S. Korea Brazil Mexico
2012
2013
2014
KEY INTERNATIONAL MARKETS (Overnight Visitors in Thousands)
7
8
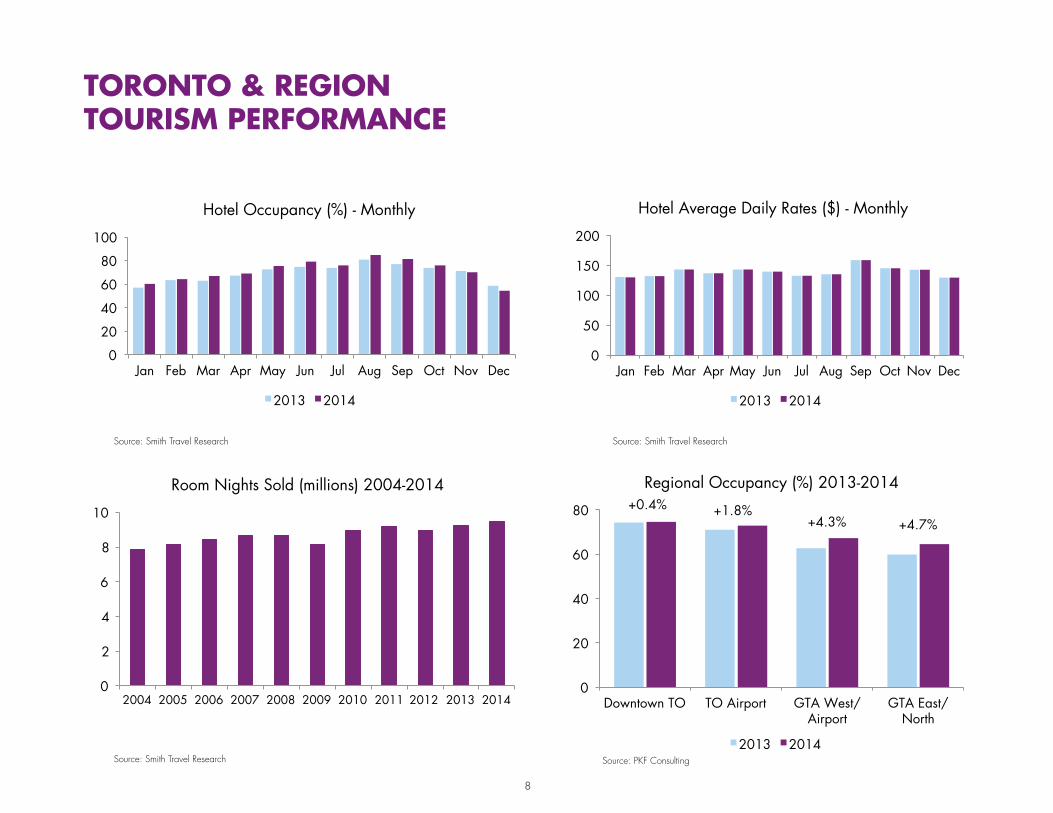
0
20
40
60
80
100
Jan Feb Mar Apr May Jun Jul Aug Sep Oct Nov Dec
Hotel Occupancy (%) - Monthly
2013 2014
0
50
100
150
200
Jan Feb Mar Apr May Jun Jul Aug Sep Oct Nov Dec
Hotel Average Daily Rates ($) - Monthly
2013 2014
0
20
40
60
80
Downtown TO TO Airport GTA West/Airport
GTA East/North
Regional Occupancy (%) 2013-2014
2013 2014
+0.4% +1.8% +4.3% +4.7%
0
2
4
6
8
10
2004 2005 2006 2007 2008 2009 2010 2011 2012 2013 2014
Room Nights Sold (millions) 2004-2014
TORONTO & REGIONTOURISM PERFORMANCE
Source: Smith Travel Research
Source: Smith Travel Research Source: Smith Travel Research
Source: PKF Consulting
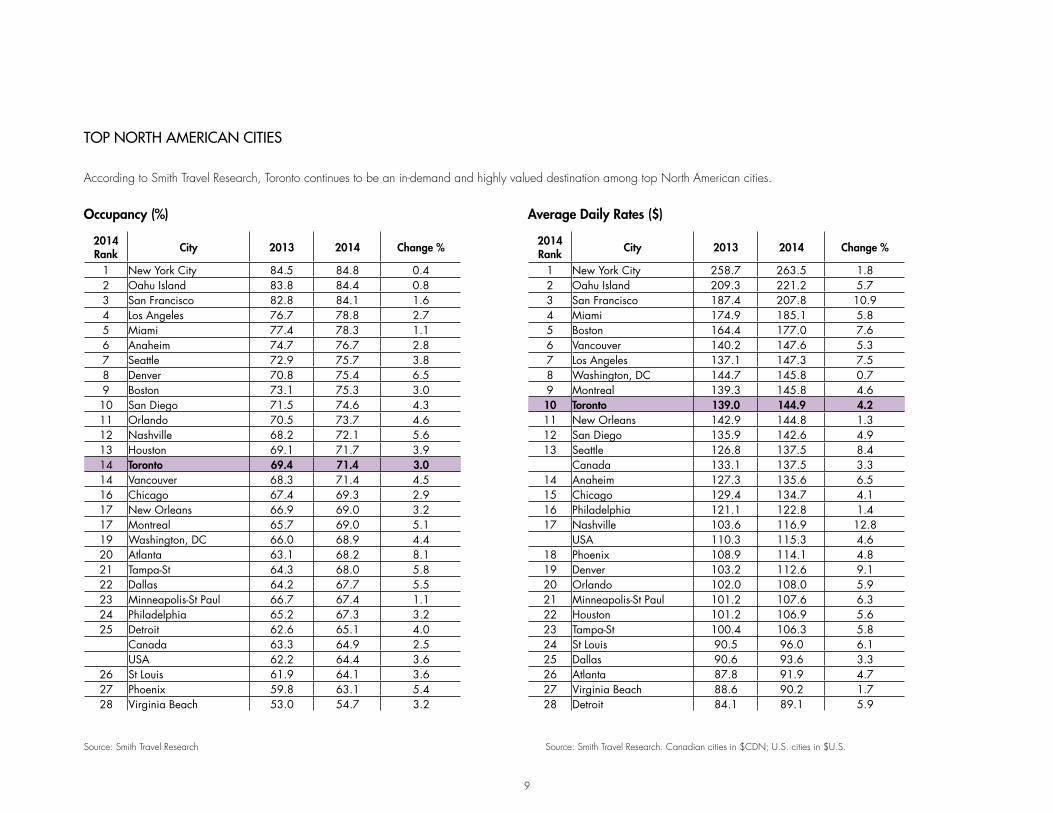
TOP NORTH AMERICAN CITIES
According to Smith Travel Research, Toronto continues to be an in-demand and highly valued destination among top North American cities.
Source: Smith Travel Research Source: Smith Travel Research. Canadian cities in $CDN; U.S. cities in $U.S.
2014 Rank City 2013 2014 Change %
1 New York City 84.5 84.8 0.42 Oahu Island 83.8 84.4 0.83 San Francisco 82.8 84.1 1.64 Los Angeles 76.7 78.8 2.75 Miami 77.4 78.3 1.16 Anaheim 74.7 76.7 2.87 Seattle 72.9 75.7 3.88 Denver 70.8 75.4 6.59 Boston 73.1 75.3 3.010 San Diego 71.5 74.6 4.311 Orlando 70.5 73.7 4.612 Nashville 68.2 72.1 5.613 Houston 69.1 71.7 3.914 Toronto 69.4 71.4 3.014 Vancouver 68.3 71.4 4.516 Chicago 67.4 69.3 2.917 New Orleans 66.9 69.0 3.217 Montreal 65.7 69.0 5.119 Washington, DC 66.0 68.9 4.420 Atlanta 63.1 68.2 8.121 Tampa-St 64.3 68.0 5.822 Dallas 64.2 67.7 5.523 Minneapolis-St Paul 66.7 67.4 1.124 Philadelphia 65.2 67.3 3.225 Detroit 62.6 65.1 4.0
Canada 63.3 64.9 2.5USA 62.2 64.4 3.6
26 St Louis 61.9 64.1 3.627 Phoenix 59.8 63.1 5.428 Virginia Beach 53.0 54.7 3.2
2014 Rank City 2013 2014 Change %
1 New York City 258.7 263.5 1.82 Oahu Island 209.3 221.2 5.73 San Francisco 187.4 207.8 10.94 Miami 174.9 185.1 5.85 Boston 164.4 177.0 7.66 Vancouver 140.2 147.6 5.37 Los Angeles 137.1 147.3 7.58 Washington, DC 144.7 145.8 0.79 Montreal 139.3 145.8 4.610 Toronto 139.0 144.9 4.211 New Orleans 142.9 144.8 1.312 San Diego 135.9 142.6 4.913 Seattle 126.8 137.5 8.4
Canada 133.1 137.5 3.314 Anaheim 127.3 135.6 6.515 Chicago 129.4 134.7 4.116 Philadelphia 121.1 122.8 1.417 Nashville 103.6 116.9 12.8
USA 110.3 115.3 4.618 Phoenix 108.9 114.1 4.819 Denver 103.2 112.6 9.120 Orlando 102.0 108.0 5.921 Minneapolis-St Paul 101.2 107.6 6.322 Houston 101.2 106.9 5.623 Tampa-St 100.4 106.3 5.824 St Louis 90.5 96.0 6.125 Dallas 90.6 93.6 3.326 Atlanta 87.8 91.9 4.727 Virginia Beach 88.6 90.2 1.728 Detroit 84.1 89.1 5.9
Occupancy (%) Average Daily Rates ($)
9

10
Rendering: Union Pearson Express Station in Skywalk (© Metrolinx)
MEETING, CONVENTION & INCENTIVE TRAVEL (MC&IT) SALES
The MC&IT Convention Sales and Client Services Division is responsible for generating room nights from targeted and diverse market segments through the implementation of innovative strategies and solicitation of convention and meetings business that will grow hotel occupancy and revenues for stakeholders across the region. The Client Services team assists event planners with a myriad of promotional and logistical support to bolster the overall client and delegate experience to ensure that Toronto’s best customers attend, extend their stay and return with a future event or for leisure travel.
The team has been driving results to ensure a robust definite pipeline of meetings, conventions and corporate incentive groups coming to the Greater Toronto Region. The MC&IT sales team secured 640,345 total room-nights in future bookings in 2014, with a projected direct visitor spending in Toronto of approximately $523 million, continuing the trend of strong growth over the last six years.
In 2014, MC&IT produced business from within Tourism Toronto’s key city targets and vertical segments and established successful partnerships to create key points of difference to support bid strategies and, along with our stakeholders, 85 future meetings were booked with more than 1,000 total room nights representing 300,087 total definite room nights for future years. As well, a total of 16 Major Conventions of more than 1,100 peak nights each were booked for future years, representing 204,062 total room nights of base business for Tourism Toronto stakeholders.
The corporate segment exceeded its annual goal by 13% having secured 172,477 definite room nights in 2014. It will deploy sales strategies in 2015 in tandem with Invest Toronto, aligned with key business sectors, such as financial services, ICT, green energy, food and beverage, and manufacturing as well as direct selling companies, a market that has picked up momentum over the past few years.
The international congress and corporate segment secured 76,998 total room nights against its 2014 annual goal of 81,400 total room nights, an increase of 24% over 2013 results. The international corporate segment’s key focus in the developing markets of China and India remains directed toward large sized incentive and meeting programs moving anywhere from 250 to10,000 participants in the Direct Selling, Manufacturing, Automotive, ICT, Finance and Insurance industries. Our European approach remains concentrated around the U.K. with development into other important, continental markets such as Germany. Latin America, with an emphasis on Brazil and Mexico, will still be on the agenda through 2015, and will be evaluated for potential expansion of resources in the future. International congress efforts will focus on the Toronto region’s competitive strengths in education, research, entrepreneurship, medical and innovation.
The North American association segment produced 261,000 definite room nights in 2014, posting strong results again from within the national and provincial association business unit. Looking at 2015, in order for Toronto to sustain its strong position as a preferred destination and to grow its fair share of the domestic association market, Toronto must continue to assert itself with innovation and elevate buyer relationships to avoid having Toronto assessed on price alone. Developing multiple-year commitments, as well as focusing prospecting efforts on the union, healthcare and the aboriginal markets will be essential to achieving this segment’s 2015 objectives.
The U.S. association segment has endured some difficult years recently as Toronto competes head-to-head with top-tier destinations and battle the ever present “Buy American” political sentiment, the under blocking of contracted room nights and a steady stream of objections related to crossing the border. In 2014, the U.S. association segment produced 169,307 definite room nights, a remarkable increase of 126% over 2013 results, as a result of a recalibrated sales approach to key segments in geographical areas, coupled with healthy corporate profits, amplified management confidence and increased job development within the membership base of U.S. associations.
2013 2014 Change
Definite Room Nights Booked 593,979 640,345 +7.81%
Major Conventions Room Nights Booked 195,706 294,020 +50%
Tentative Room Nights Developed 1,688,971 1,697,802 +0.52%
11
12
CITYWIDE CONVENTIONS BOOKED IN 2014 WITH 1,100+ PEAK NIGHTS
MEETING, CONVENTION & INCENTIVE TRAVEL (MC&IT) SALES
ACCOUNT TOTAL ATTENDEES YEAR
NormanD Productions LLC 1500 2015
Shoppers Drug Mart 2400 2016
Sport Alliance Ontario 3500 2016
Perfect China Co. Ltd 5000 2016
International Symposium on Viral Hepatitis and Liver Disease (ISVHLD) 3000 2018
Microsoft Corporation 15000 2018
Rendezvous Canada 2000 2019
Society Of Environmental Toxicology and Chemistry (SETAC) 1500 2019
Meeting Professionals International 2500 2019
American Educational Research Association-AERA 14400 2019
Society for Vascular Surgery 3000 2020
Association For Manufacturing Excellence 2500 2020
Society For Worldwide Interbank Financial Telecommunication (SWIFT) 8000 2023
Pediatric Academic Societies (PAS) 7000 2024
American Psychiatric Association 13500 2025
American Bar Association 7000 2026
In 2014, the sport segment achieved a goal of 129,870 definite room nights. Domestically, amateur sport event hosting continues to be a driver for smaller communities across Canada with limited convention space availability and existing sport facilities to drive economic growth through tourism. Post PanAm Games, Toronto can anticipate similar sport event hosting growth opportunities which many domestic destinations already enjoy, but on a larger scale and with higher profile professional and international sporting events. Redirecting resources and focus onto major sporting event rights holders is a logical next step for building future incremental room night business for the destination.
Over the last 12 months, MC&IT has continued our strategy to diversify our business mix to generate broader appeal and stand out from the competition. We now have a well-diversified account base and are no longer over-exposed to any one business sector of the economy or market territory. We remain focused on building shoulder and need periods and continue to evaluate, fine-tune and implement an eight-year pace strategy to ensure a healthy pipeline of definite business across the region. Converting more customers by establishing and measuring conversion goals has yielded strong outcomes with Tourism Toronto stakeholders starting the year off with 16 major conventions on the books, each with 1,000 peak nights and more representing 272,000 total room nights, along with 425 meeting bookings representing 273,000 total room nights.
13
14
CONSUMER MARKETING
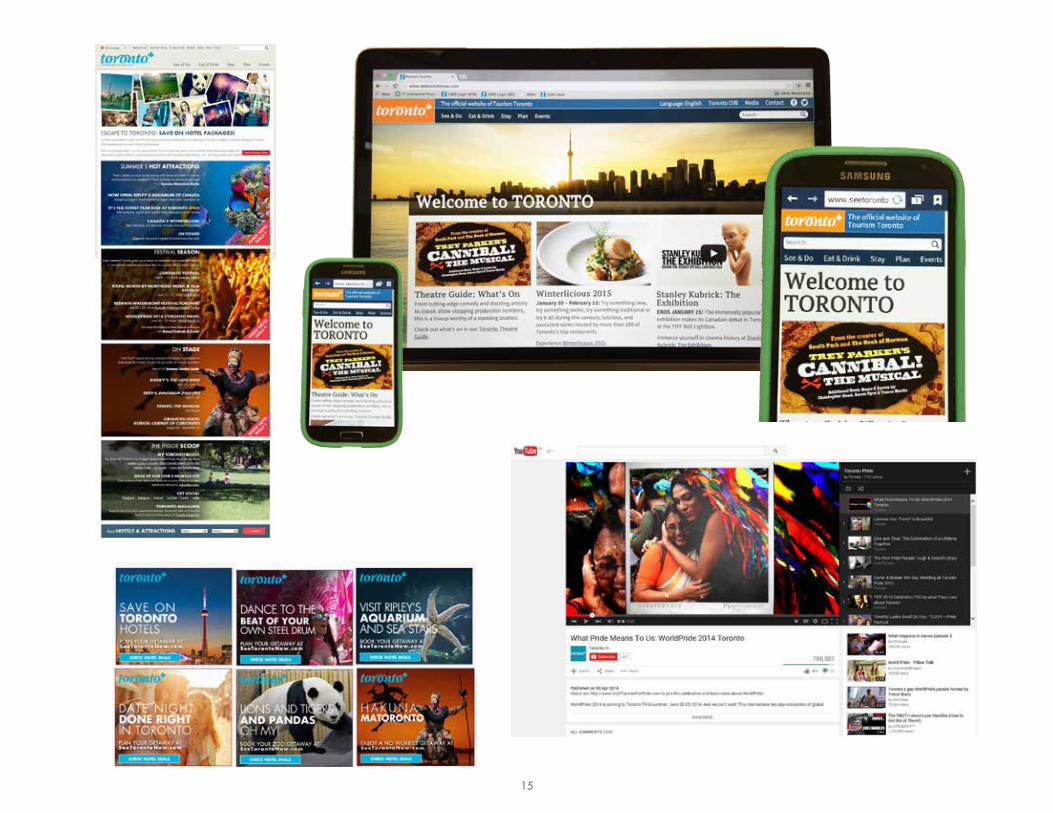
Throughout 2014 Tourism Toronto elevated its ability to compete in a more sophisticated digital marketing environment, by improving its own core digital assets and by using more robust technology and strategies to target consumers. These strategies led to a substantial increase in hotel and attraction searches on the SeeTorontoNow.com website, totaling 383,347 searches, up 47.3% over the prior year.
The first part of this effort was to increase accessibility of Tourism Toronto’s websites in several key ways, with a goal of making the online experience available, easy and convenient to anyone, anywhere, anytime and any way. The nine websites, including the eight foreign-language versions of the site, were relaunched with a fully “responsive” design, meaning the site will load and display for easy reading and navigating on any kind of device from a desktop to a tablet to a phone. Given the growing use of mobile devices for travel searching and purchase, this is a vital step. At the same time accessibility legislation in Ontario called for an improved website infrastructure, requiring that all content be accessible to a full range of abilities (including, but not limited to, assisted devices), which SeeTorontoNow.com was upgraded to meet. Following the implementation of the JackRabbit hotel/attraction referral engine at the end of 2013, the site widgets were extensively tested and modified to maximize the opportunity for referrals to participating hotels and attractions, helping achieve the significant increase in hotel and attraction searches.
Consumer marketing campaigns targeted the summer and fall seasons in regional markets to motivate and convert travel. At the core of each campaign was a sophisticated digital media plan that enabled Tourism Toronto to create dozens of unique display ads and serve them to highly targeted consumer segments on the websites they frequent. Through daily monitoring of results, the team was able to optimize the best-performing ads, thereby maximizing the return on the campaign investment. This careful targeting and high repetition of the most effective messages also helped drive the increase in web activity and hotel/attraction searches.
Further seasonal and themed marketing was delivered through a multi-faceted approach to curating and creating meaningful content on the site and by using web search investments to attract visitors to that content. Existing member content and assets were curated around special occasions and holiday weekends (i.e. Valentine’s Day, March Break, Family Day). Leveraging the paid search program, original content was created in response to consumer demand and search queries. Priority was given to foundational content concentrated in dining, nightlife and shopping categories. Guest bloggers continued to contribute to the “My Toronto” section of the site, providing third-party endorsement and exposure to a broader audience as well as a powerful extension of the site into social channels.
In addition to regional-market campaigns, WorldPride presented a special marketing opportunity. Tourism Toronto created a series of videos serving a dual purpose of driving attendance to the 2014 festival and developing legacy assets that speak to the brand and status of the destination, building on the halo of WorldPride. Similarly, Tourism Toronto leveraged the opportunity presented by TIFF to capture the energy of the festival, along with endorsements by A-list celebrities. Footage was edited into a new video that mixes festival highlights and celebrity comments with the broader story of this cosmopolitan city. These videos were important tools for the ongoing social media strategy and generated more than 2 million views.
The Toronto Escapes partnership program (with OTMPC, Air Canada and the GTAA) continued for its sixth year, with an aggressive digital campaign targeting U.S. travellers. Total air tickets sold through TorontoEscapes.com increased to 25,225 in 2014 from 19,134 in 2013. In addition, the return on investment for the TOGA partnership in 2014 rose to $15.89 per $1 invested.
2013 2014 Change
Hotel / Attraction Searches 260,292 383,347 +47.3%
15
16
COMMUNICATIONS & PUBLIC RELATIONS
Toronto’s profile continued to grow in 2014. Media Relations efforts delivered worldwide media coverage valued at $46.6 million in advertising equivalency, or 103% of the goal of $45.3 million for the year. This coverage came as a direct result of Tourism Toronto and its partners hosting 544 media from over 20 countries throughout the year. The focus for Media Relations remains on the established global Key Cities as well as regional markets in Canada and the U.S.
The commitment in Key Cities starts with active investment in relationships with targeted media. The team conducted in-market media missions in nearly all the priority markets in 2014, typically early in the year in order to generate press tours to the destination in the peak seasons. New in-market representation was established in London, Berlin and Tokyo, along with continuing partnerships in Mexico City, Sao Paulo, Rio de Janeiro and the Chinese markets Beijing, Shanghai and Guangzhou.
In the spring, Tourism Toronto led its first media mission into Tokyo to establish direct relationships with targeted media including broadcasters, major lifestyle magazines and online hubs. Also in the spring, Tourism Toronto supported the OTMPC-led China microfilm project at its high-profile launch in Beijing and subsequently hosted a social media tour in Ontario with the film’s star actor to extend the story and the reach. While in Beijing, the team also held media briefings for key journalists that resulted in substantial coverage later in the year including two major national broadcasters – CCTV6 and Beijing TV – with a combined viewership over 100 million people.
WorldPride in Toronto offered a significant opportunity to showcase Toronto’s true inclusiveness. It was a powerful message not only for the worldwide LGBT community but also for the millions of consumers for whom diversity and inclusiveness are respected attributes in a destination. While some of the media relations initiatives around WorldPride occurred in advance to drive greater visitation for the week of WorldPride itself, the greater value in the media profile is the long-term brand association that was generated through the extensive global coverage. Tourism Toronto, along with OTMPC, hosted a “mega-fam” of more than 30 international
journalists to experience and write about WorldPride and Toronto’s inspiring diversity, resulting in more than 80 published stories in markets from Mexico to Germany to Australia.
As the countdown clock to the 2015 Pan Am and Parapan Am Games ticked down, the team led several major dedicated press tours for key media from the priority PanAm countries (Mexico, Brazil, Argentina and both English- and Spanish-language media from the U.S.). These press tours leveraged the relevance and timeliness of the Games to deliver a broader story about the diversity and vibrancy of the Toronto region. At the same time, advance work with the rights-holding broadcasters has been an important part of the Games preparation to maximize the pre-Games coverage.
Closer to home, relationships that have been established with key reporters and editors in Canada and the U.S. border-state region continue to pay dividends. While some of the media coverage in this region highlights the overall Toronto experience, stories in this region tend to be more focused on specific events or seasons, such as special offerings for March Break, summer or the holiday season. Media Relations efforts in this area are closely aligned with Consumer Marketing and Web Search to drive more active searches and conversion of near-term travel to Toronto.
Even closer, the team continued its efforts working with local Toronto media to highlight the importance of tourism and meetings to the economy, the jobs created by the sector and the success being achieved for our destination. Over the course of the year, stories on tourism growth as well as specific events and issues helped sustain media, stakeholder and public confidence in our industry.
Our dialogue with members continued through our bi-weekly newsletter, Tourism Now. This is an essential membership communications tool that keeps member businesses informed about Tourism Toronto activities and, most importantly, provides a key link through which members can become more actively and directly engaged in sales and marketing programs.
2013 2014 Change
Media Hosted 470 544 +16%
Earned Media Value $43.0 M $46.6 M +8%
ANO 2 - Nº 16 - MARÇO DE 2014
TOPTORONTO
ROTEIROS PARA SEMANA SANTA E CORPUS CHRISTI
OS 10 DESTINOS MAIS FOTOGÊNICOS DO PLANETA
06
Cuando los niños quieren ver a Santa Clos van a Rovaniemi, en Laponia, Finlandia, donde vive el personaje más famoso de estas fechas.
¿DónDe vive
Santa?
Esferas de vidrio, adornos multicolor y sidras elaboradas con fresquísimas manzanas son motivos perfectos para visitar algunos pueblitos de México.
puros pretextos
02
Fashion DistrictFashion District
Financial District
Nathan Phillips Square
TORONTO
CN TowerCN Tower N
Front St
Gardiner Expy
Queen St
Dundas St
University Av York St
texto y fotos:
Juan Carlos GarCía
enVIaDo
TORONTO.- Poco después de las 6 de la mañana, la aplicación del cli-ma en el celular anuncia 5 grados centígrados, todo en orden; dos horas después, ya indica un ate-morizante 10 bajo cero, adornado, al lado, con un copito de nieve: tor-menta a la vista.
En la primera nevada de la temporada anticipamos las imáge-nes que luego veríamos en la calle: niños formando muñecos de nieve en un parque y gente patinando en una de las tantas pistas de Toronto. Era el anuncio oficial de que el in-vierno llegaba y la Navidad estaba a la vuelta de la esquina.
Abrigados como osos, vemos la transformación urbana multicolor en un tapiz blanco interminable: en menos de un día, la ciudad llegó a acumular 14 centímetros de nieve.
Árboles decorados, mercados típicos, vida bajo tierra y costum-bres multiculturales, entre la ofer-ta de temporada. Ya de noche, los torontonianos denotan en su andar su experiencia en este clima.
Caminan con paso seguro, ni muy rápido ni muy lento, para no resbalar entre la grisácea vereda movediza de agua congelada, que, mezclada con el lodo cotidiano, se convierte en una pequeña trampa, en la acera o fuera de ella.
La gente entra al metro, se sube al tranvía, llega a los restau-rantes o se para a comer un hot dog, campante, chabacana, muy acostumbrada a un fenómeno po-co conocido en las grandes urbes de México. El vaho sale con cada palabra.
En la pasarela subterránea, el famoso PATH del Downtown, y en el distrito financiero predominan los transeúntes con abrigos imper-meables de colores neutros con gorro de felpa. Quien osa por una tonalidad brillante, como amarillo o verde, destaca; lo mismo quien usa gabardina gruesa o abrigo de tela. Estos últimos deben ser ofici-nistas, sin duda.
Y hay que mencionar que to-dos y todas andan en botas con suela antiderrapante. En su mochi-la, llevan el calzado presentable.
A unos metros de la CN Tower, iluminada de rojo y verde como dicta la temporada, el Lago Onta-rio se prepara para congelarse. La inmensa mancha acuática pertene-ce a un programa gubernamental que sólo da luz verde para patinar hasta que expertos en hidrografía y topografía hayan verificado el gro-sor de la capa de hielo, por ahí de enero, y clavado las señales que demarcan el límite seguro.
Todavía en el andar nocturno se ven niños, cubiertos hasta los cachetes, jugando con bolas de nieve; los adolescentes se reúnen a chacotear en alguna de las más de 250 pistas de hielo disponibles. Patinar es tan común que quien no lo haga, evidencia su condición de turista o fuereño recién llega-do. Mientras unos afilan navajas y otros beben chocolate caliente ¡aquí no para de nevar!
Navidad bajo cero
ToronTo, canadá
Las primeras nevadas de la temporada suben los grados de diversión: nieve, luces y ¡calorías!
04
z El Toronto Christmas Market, dentro del Distillery District.
z Entre los artículos más buscados están las figuras, rusas y ucrania-nas, de Santa Clos.
z Todos quieren patinar en la pista del Nathan Phillips Square.
z Uno de los principales atractivos del mercado es su árbol gigante.
a Las VegasGracias a nuevas atracciones y a su enriquecida oferta culinaria, más de 40 millones de personas visitaron este destino en 2014. Nuevo récord.
domingo 21 / 12 / 2014
[email protected] / Editora: Laura Pardo
5628 7294
@reformadeviaje
DE baño…a rEstaurantEComo sucede en cualquier gran ciudad, en Londres todo cambia. Por ejemplo, estos sanitarios públicos de la era victoriana, ahora remozados y convertidos en los comedores con más onda de la capital. Todo sobre esta tendencia.
reforma.com/sanitarios
17
18
INTERNATIONALLEISURE TRADE SALES
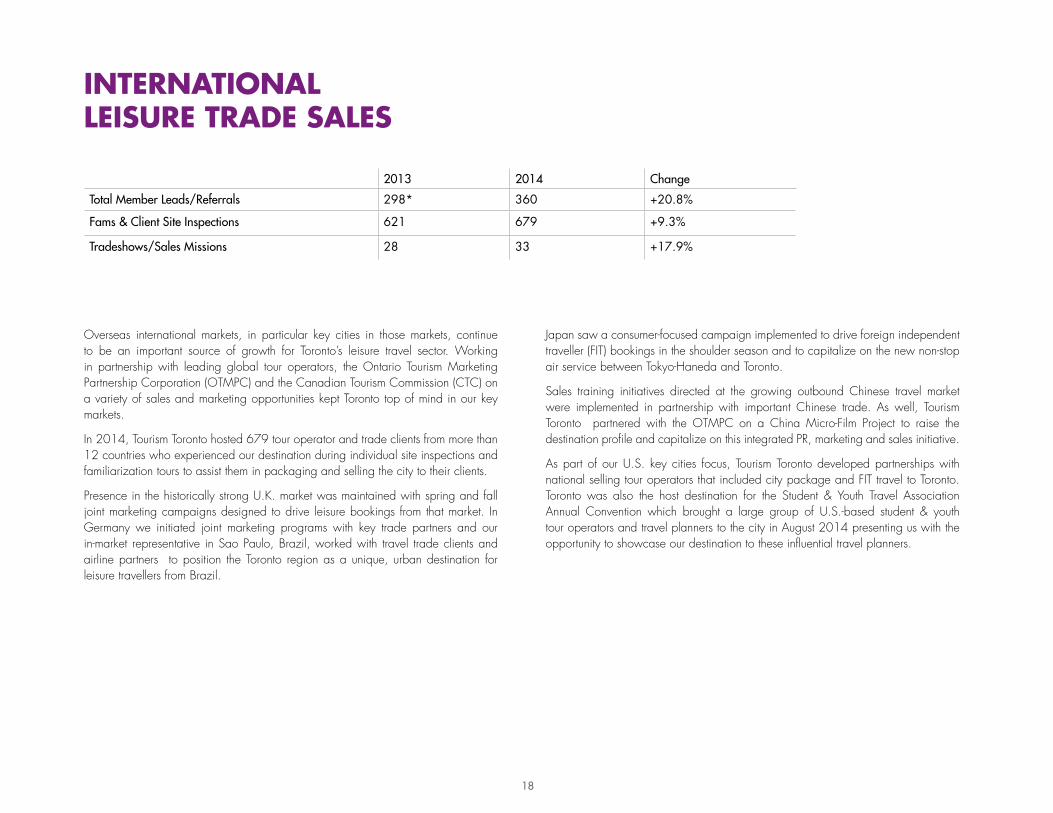
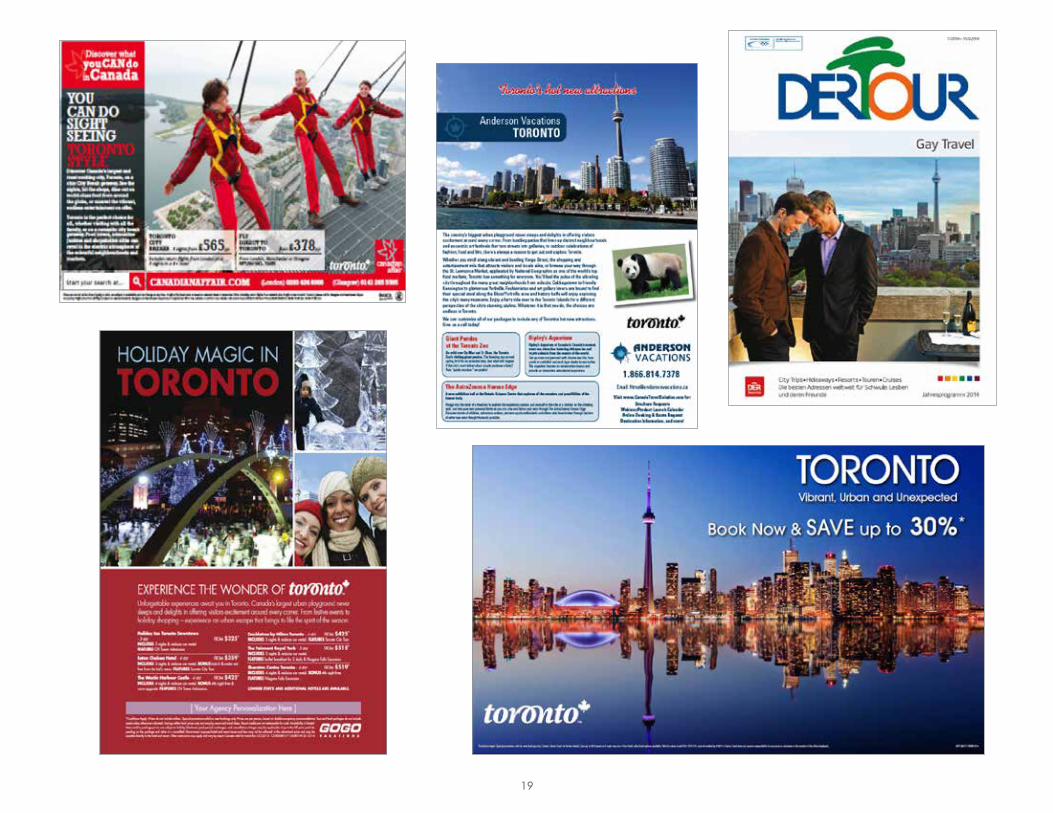
Overseas international markets, in particular key cities in those markets, continue to be an important source of growth for Toronto’s leisure travel sector. Working in partnership with leading global tour operators, the Ontario Tourism Marketing Partnership Corporation (OTMPC) and the Canadian Tourism Commission (CTC) on a variety of sales and marketing opportunities kept Toronto top of mind in our key markets.
In 2014, Tourism Toronto hosted 679 tour operator and trade clients from more than 12 countries who experienced our destination during individual site inspections and familiarization tours to assist them in packaging and selling the city to their clients.
Presence in the historically strong U.K. market was maintained with spring and fall joint marketing campaigns designed to drive leisure bookings from that market. In Germany we initiated joint marketing programs with key trade partners and our in-market representative in Sao Paulo, Brazil, worked with travel trade clients and airline partners to position the Toronto region as a unique, urban destination for leisure travellers from Brazil.
Japan saw a consumer-focused campaign implemented to drive foreign independent traveller (FIT) bookings in the shoulder season and to capitalize on the new non-stop air service between Tokyo-Haneda and Toronto.
Sales training initiatives directed at the growing outbound Chinese travel market were implemented in partnership with important Chinese trade. As well, Tourism Toronto partnered with the OTMPC on a China Micro-Film Project to raise the destination profile and capitalize on this integrated PR, marketing and sales initiative.
As part of our U.S. key cities focus, Tourism Toronto developed partnerships with national selling tour operators that included city package and FIT travel to Toronto. Toronto was also the host destination for the Student & Youth Travel Association Annual Convention which brought a large group of U.S.-based student & youth tour operators and travel planners to the city in August 2014 presenting us with the opportunity to showcase our destination to these influential travel planners.
2013 2014 Change
Total Member Leads/Referrals 298* 360 +20.8%
Fams & Client Site Inspections 621 679 +9.3%
Tradeshows/Sales Missions 28 33 +17.9%
Estávamos esperando por você
19
20
DESTINATION DEVELOPMENT& MEMBER CARE
DESTINATION DEVELOPMENT
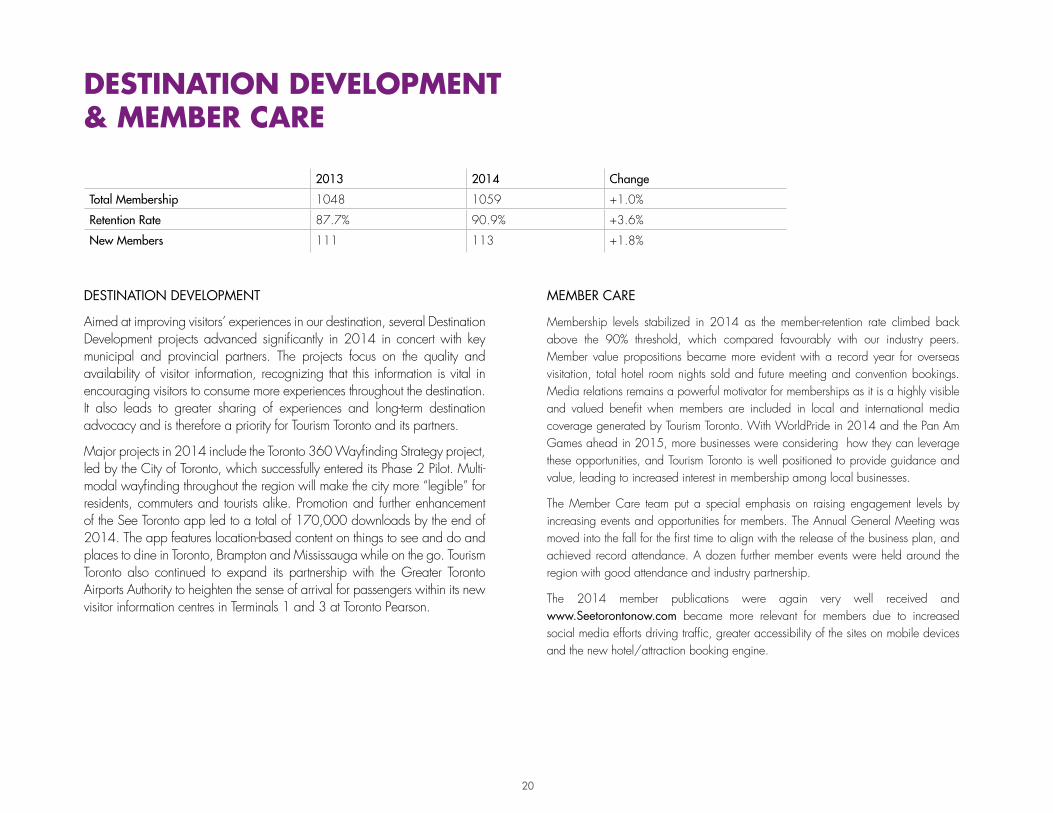
Aimed at improving visitors’ experiences in our destination, several Destination Development projects advanced significantly in 2014 in concert with key municipal and provincial partners. The projects focus on the quality and availability of visitor information, recognizing that this information is vital in encouraging visitors to consume more experiences throughout the destination. It also leads to greater sharing of experiences and long-term destination advocacy and is therefore a priority for Tourism Toronto and its partners.
Major projects in 2014 include the Toronto 360 Wayfinding Strategy project, led by the City of Toronto, which successfully entered its Phase 2 Pilot. Multi-modal wayfinding throughout the region will make the city more “legible” for residents, commuters and tourists alike. Promotion and further enhancement of the See Toronto app led to a total of 170,000 downloads by the end of 2014. The app features location-based content on things to see and do and places to dine in Toronto, Brampton and Mississauga while on the go. Tourism Toronto also continued to expand its partnership with the Greater Toronto Airports Authority to heighten the sense of arrival for passengers within its new visitor information centres in Terminals 1 and 3 at Toronto Pearson.
2013 2014 Change
Total Membership 1048 1059 +1.0%
Retention Rate 87.7% 90.9% +3.6%
New Members 111 113 +1.8%
MEMBER CARE
Membership levels stabilized in 2014 as the member-retention rate climbed back above the 90% threshold, which compared favourably with our industry peers. Member value propositions became more evident with a record year for overseas visitation, total hotel room nights sold and future meeting and convention bookings. Media relations remains a powerful motivator for memberships as it is a highly visible and valued benefit when members are included in local and international media coverage generated by Tourism Toronto. With WorldPride in 2014 and the Pan Am Games ahead in 2015, more businesses were considering how they can leverage these opportunities, and Tourism Toronto is well positioned to provide guidance and value, leading to increased interest in membership among local businesses.
The Member Care team put a special emphasis on raising engagement levels by increasing events and opportunities for members. The Annual General Meeting was moved into the fall for the first time to align with the release of the business plan, and achieved record attendance. A dozen further member events were held around the region with good attendance and industry partnership.
The 2014 member publications were again very well received and www.Seetorontonow.com became more relevant for members due to increased social media efforts driving traffic, greater accessibility of the sites on mobile devices and the new hotel/attraction booking engine.
21
22
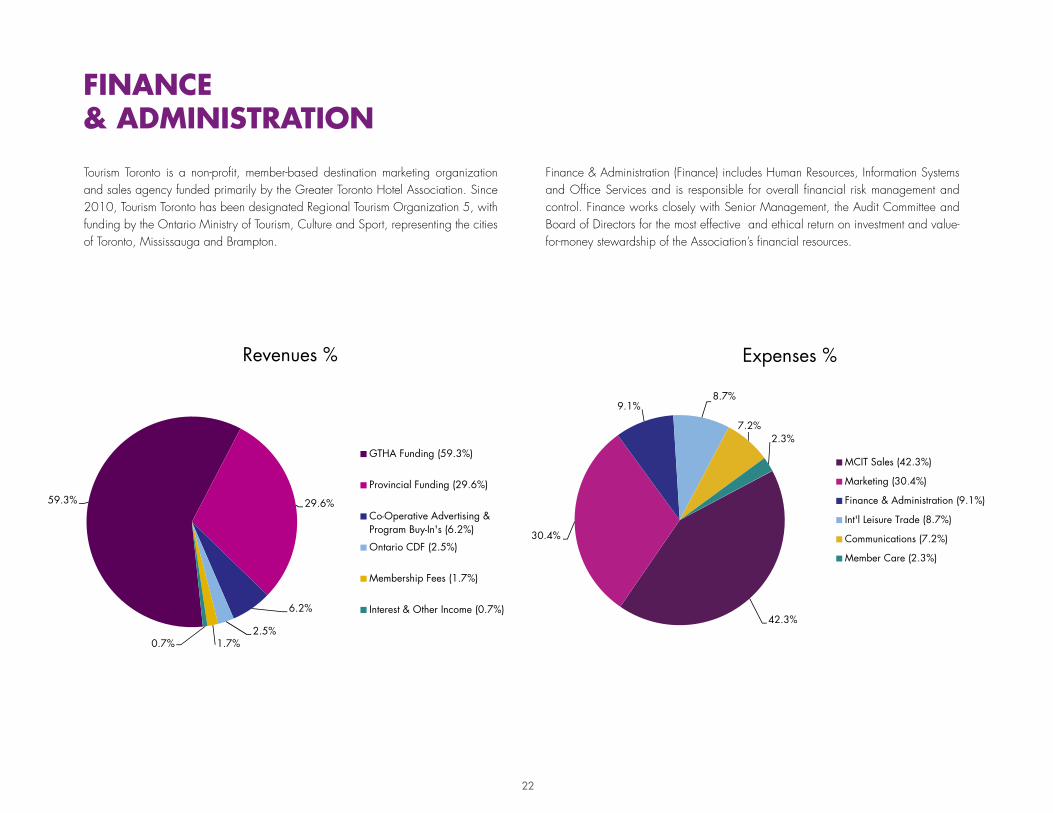
FINANCE & ADMINISTRATION
Tourism Toronto is a non-profit, member-based destination marketing organization and sales agency funded primarily by the Greater Toronto Hotel Association. Since 2010, Tourism Toronto has been designated Regional Tourism Organization 5, with funding by the Ontario Ministry of Tourism, Culture and Sport, representing the cities of Toronto, Mississauga and Brampton.
Finance & Administration (Finance) includes Human Resources, Information Systems and Office Services and is responsible for overall financial risk management and control. Finance works closely with Senior Management, the Audit Committee and Board of Directors for the most effective and ethical return on investment and value-for-money stewardship of the Association’s financial resources.
Revenues % Expenses %
59.3% 29.6%
6.2%
2.5%1.7%0.7%
GTHA Funding (59.3%)
Provincial Funding (29.6%)
Co-Operative Advertising &Program Buy-In's (6.2%)
Ontario CDF (2.5%)
Membership Fees (1.7%)
Interest & Other Income (0.7%)
REVENUE
42.3%
30.4%
9.1%8.7%
7.2%2.3%
MCIT Sales (42.3%)
Marketing (30.4%)
Finance & Administration (9.1%)
Int'l Leisure Trade (8.7%)
Communications (7.2%)
Member Care (2.3%)
Expenses %
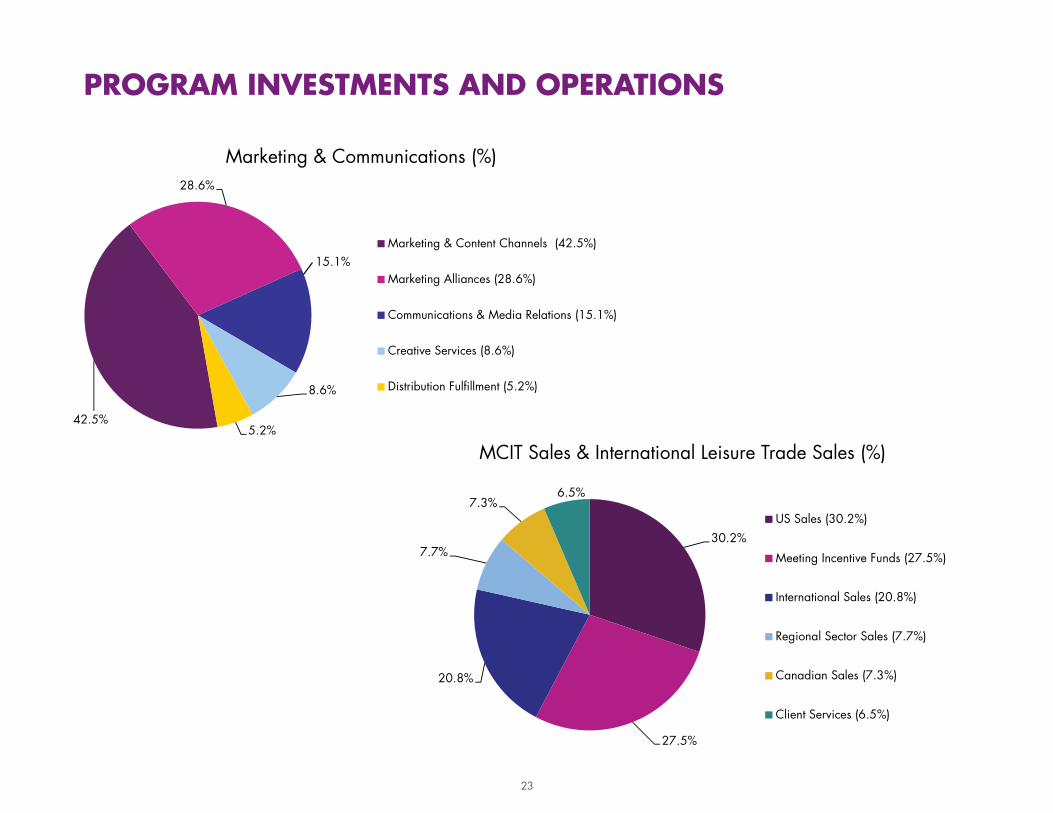
PROGRAM INVESTMENTS AND OPERATIONS
Marketing & Communications (%)
MCIT Sales & International Leisure Trade Sales (%)
42.5%
28.6%
15.1%
8.6%
5.2%
Marketing & Content Channels (42.5%)
Marketing Alliances (28.6%)
Communications & Media Relations (15.1%)
Creative Services (8.6%)
Distribution Fulfillment (5.2%)
Marketing & Communications (%)
30.2%
27.5%
20.8%
7.7%
7.3%6.5%
US Sales (30.2%)
Meeting Incentive Funds (27.5%)
International Sales (20.8%)
Regional Sector Sales (7.7%)
Canadian Sales (7.3%)
Client Services (6.5%)
�����������������
23
24
The tourism and hospitality industry plays an important role in the community and every day our members make meaningful contributions to the social, environmental and business welfare of our region. Tourism Toronto aims to elevate that crucial role through a variety of programs in the Toronto region and in other communities in which we work.
FAMILIES IN NEED
Our signature Relax, Recharge, Renew program has become a mainstay in the Toronto, Mississauga and Brampton area by every week providing parents of special needs children a weekend break. Since launching in 2008, the program has served approximately 400 families.
Due to the generosity of our members in the hospitality industry, every week throughout the year parents are treated to a weekend in Toronto that includes a limousine pickup at home, two nights in one of our excellent hotels, passes to interesting attractions and meals at exceptional restaurants.
The initiative has consistently received awards since its inception including:
• IMEX 2010 “Commitment to the Community” award, which is a globally-recognized honour given out every year in Frankfurt, Germany;
• The Power of A Silver Award 2011 from the American Society of Association Executives;
• the VIA Rail Canada Community Service Award from the Travel Industry Association of Canada in 2012;
• won in the Community Affairs category in PR News’ annual CSR Awards, presented at the National Press Club in Washington, D.C.;
• “Tourism Innovator of the Year Award” by the Tourism Industry Association of Ontario;
• named “Destination Champion” by Destination Marketing Association International.
Tourism Toronto’s initiatives by staff include work and donations in the GTA as well as community in areas in which we work and visit. Examples are:
• At the PCMA Annual Meeting in Boston, TT and members helped assemble bags of groceries, stocked shelves and distributed food supplies to 250 families as part of the Red Cross’s Food Pantry program. The team also invited clients to paint soup bowls and for every 10 soup bowls painted, donated a stock pot to the community outreach program. Altogether, we donated over 100 stock pots and ladles. In addition, Tourism Toronto and the Metro Toronto Convention Centre donated $5,000.00.
• To benefit the Canadian Cancer Society, for the IncentiveWorks Show and CSTA Conference, TT created a unique yellow version of the Toronto ‘T’ pin which were sold at our booth. Over $1,500.00 was raised.
• During 2014 PCMA Education Conference Stop Market carts were used as the base for food and beverage carts, resulting in a $1,500.00 donation to the Toronto Stop Market.
• For the holiday season each TT department chose a cause to provide donations to including the Scott Mission; Evergreen; Sleeping Children Around The World (bed kits for children); YWCA’s Adopt-a-Family Program; and Toronto area homeless people who received gloves and hats.
SUSTAINABILITY
Tourism Toronto has long been active on the “green” front both within our offices – reducing waste through recycling, composting and using sustainable products – as well as through external initiatives in the community. Notable in 2014:
• Held member information sessions on how to improve sustainability practices and aim for certification
• For Earth Day 2014, Tourism Toronto staff performed a clean-up on Centre Island and gardening and painting at Artscape
• A new program initiated by TT and adopted by Brookfield Queens Quay for all QQT businesses and residents, sees used writing instruments being recycled and turned into items like park benches, waste bins and more.
CORPORATE SOCIAL RESPONSIBILITY

Rendering: ROM Amphitheatre (© Hariri Pontarini Architects)
26