toward a sustainable transport development in asia and the
TRANSCRIPT
Toward a Sustainable Transport Development in Asia and the Pacific
Biswa Nath Bhattacharyay
CESIFO WORKING PAPER NO. 3539 CATEGORY 9: RESOURCE AND ENVIRONMENT ECONOMICS
JULY 2011
An electronic version of the paper may be downloaded • from the SSRN website: www.SSRN.com • from the RePEc website: www.RePEc.org
• from the CESifo website: Twww.CESifo-group.org/wp T
CESifo Working Paper No. 3539
Toward a Sustainable Transport Development in Asia and the Pacific
Abstract Despite remarkable growth during the last decade, Asia and the Pacific still faces extensive basic infrastructure needs. Furthermore, to cope up with the reduced export demand from advanced economies arising out of the ongoing financial crisis, the region needs to enhance its connectivity through developing transport infrastructure at the national and regional level to rebalance its growth towards regional demand through enhancing intraregional trade. However, building massive transport infrastructure will have profound implications on environment and climate change at the national, regional and global levels as well as on scarce energy resources. This paper presents the needs and benefits of transport connectivity and financing requirement of Asian economies during 2010-2020; and analyzes the major challenges and prospects in developing sustainable transport connectivity. Finally, the paper provides policy recommendations on what the region can do to meet these challenges.
JEL-Code: H230, H500, K320, L620, L910.
Keywords: sustainable transport, infrastructure, connectivity, financing infrastructure, environment and climate change, Asia and the Pacific.
Biswa Nath Bhattacharyay Asian Development Bank
Kasumigaseki Building 8 Floor 3-2-5, Kasumigaseki, Chiyoda-ku
Tokyo 100-6008 / JAPAN [email protected]
Biswa Nath Bhattacharyay is the Lead Professional and Advisor to the Dean of the Asian Development Bank Institute and Lead Professional, Asian Development Bank, Manila. The author thanks Radhakrishnan Dinakar, Mustafa Moinuddin and Jacinta Bernadette Rico for excellent research assistance.

2
1. INTRODUCTION The Asia and the Pacific (henceforth Asia) region account for about 60 percent of the world’s population and 30 percent of the world’s total land area (ADB 2007). The region, home of nearly two-thirds of the world’s poor, has witnessed remarkable economic growth and poverty reduction in recent decades. The countries that comprise Asia are anything but homogeneous: their, physical, economic as well as demographic size and characteristics, levels of economic development, natural resource endowments, and culture vary to a significant extent. Indeed, it is this diversity that helped the Asian economies to flourish by cooperating and integrating with each other as well as with the rest of the world; it is this diversity that provides the Asian economies with immense opportunities for the region’s growth and development through production, trade and investment (ADB/ADBI 2009). However, diversity per se does not guarantee balanced growth as it can also bring about disparity. Despite remarkable growth during the last few decades, the Asian region still faces several major challenges. It still lags far behind developed economies particularly in terms of the quality of life. One specific challenge that implicates almost all aspects of a country or region’s developmental efforts is weak infrastructure connectivity: provision of basic infrastructure services critically affects a country or region’s security, governance, economic development, and social well-being (Mashatt et al. 2008). Increased physical connectivity will considerably enhance the scale and quality of these services. While investments in infrastructure have been increasing through maintenance of existing infrastructure and new construction, it has not been able to keep up with the region’s demographic and economic growth, rapid urbanization and increasing middle class population. The region still faces extensive basic infrastructure needs. For instance, 1.5 billion people in Asia and the Pacific have no access to improved sanitation, 638 million have no access to improved drinking water, and 930 million have no access to electricity services (IMF 2006) and in some parts of Asia travel to the capital is still a multi-day process. Only 3 out of every 10 people have access to telephone services and only 53.4% of the total road network in Asia of 5.66 million km is paved (ADB 2007). Moreover, the cost of maintaining existing infrastructure continues to rise. Fast growing economies like People’s Republic of China (PRC), India, Thailand, Indonesia, the Philippines, and Viet Nam are seeing their countries’ aging infrastructure and limited capacities being increasingly stretched under extreme growth pressure. It is worth noting that in terms of quality of life, inadequate infrastructure affects the poor the most, and thus often undermining the achievements in poverty reduction, growth and development. The importance of infrastructure investment is well recognized among major Asian economies. In view of the ongoing financial and economic crisis originated during 2008-09 and the possibility of a double dip recession in advanced economies, export-dependent economies of Asia and the Pacific need to rebalance its growth toward domestic and regional demand for sustainable growth of Asia and the world. Despite remarkable growth during the last decade, the region still faces extensive basic infrastructure needs such as transport, energy, telecommunications and water. Asia, therefore, needs to enhance its connectivity through developing transport infrastructure at the national and regional level to rebalance its growth through enhancing intraregional trade, to enhance economic integration and to meet basic infrastructure needs. Transport plays a significant role in enhancing connectivity within and across Asian economies. The Asian economies have greatly increased their investments in infrastructure in recent decades. Infrastructure investment composed a major share in fiscal stimulus packages used by Asian economies to mitigate the negative effects of the current global financial and economic crisis which started in 2008. These infrastructure investments have been utilized in key sectors, such as transportation, energy,
3
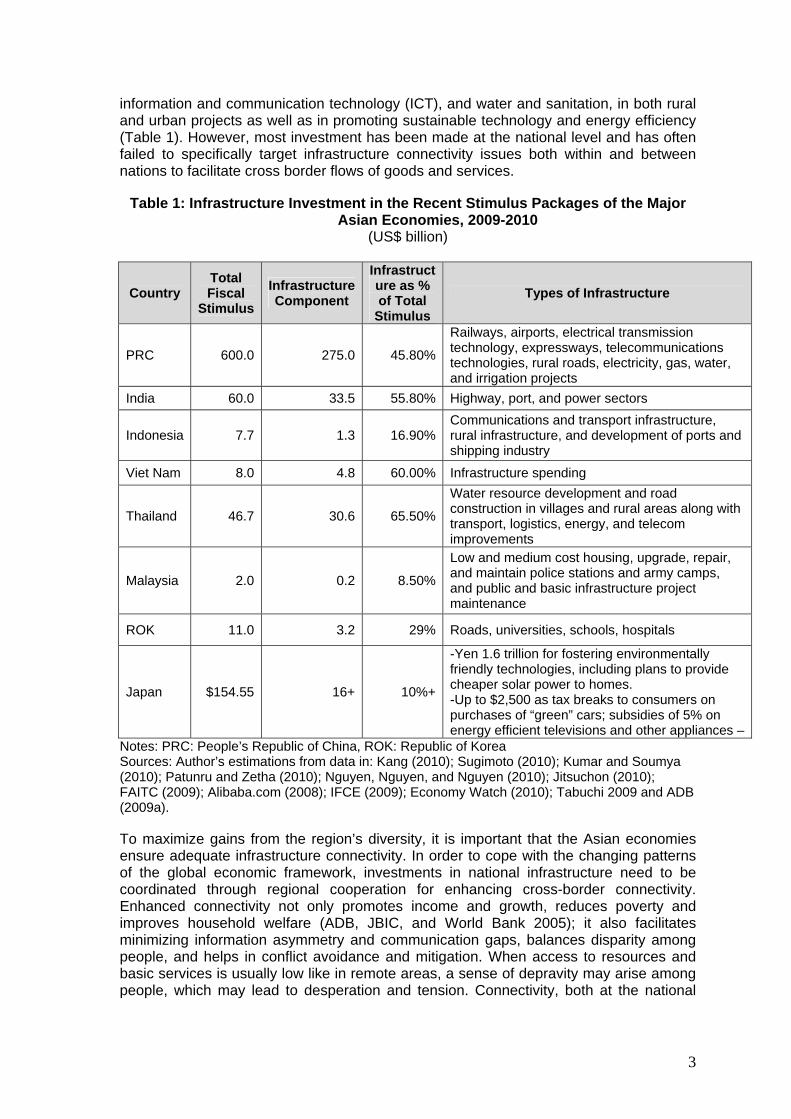
information and communication technology (ICT), and water and sanitation, in both rural and urban projects as well as in promoting sustainable technology and energy efficiency (Table 1). However, most investment has been made at the national level and has often failed to specifically target infrastructure connectivity issues both within and between nations to facilitate cross border flows of goods and services.
Table 1: Infrastructure Investment in the Recent Stimulus Packages of the Major Asian Economies, 2009-2010
(US$ billion)
Country Total Fiscal
Stimulus Infrastructure Component
Infrastructure as % of Total
Stimulus Types of Infrastructure
PRC 600.0 275.0 45.80%
Railways, airports, electrical transmission technology, expressways, telecommunications technologies, rural roads, electricity, gas, water, and irrigation projects
India 60.0 33.5 55.80% Highway, port, and power sectors
Indonesia 7.7 1.3 16.90%Communications and transport infrastructure, rural infrastructure, and development of ports and shipping industry
Viet Nam 8.0 4.8 60.00% Infrastructure spending
Thailand 46.7 30.6 65.50%
Water resource development and road construction in villages and rural areas along with transport, logistics, energy, and telecom improvements
Malaysia 2.0 0.2 8.50%
Low and medium cost housing, upgrade, repair, and maintain police stations and army camps, and public and basic infrastructure project maintenance
ROK 11.0 3.2 29% Roads, universities, schools, hospitals
Japan $154.55 16+ 10%+
-Yen 1.6 trillion for fostering environmentally friendly technologies, including plans to provide cheaper solar power to homes. -Up to $2,500 as tax breaks to consumers on purchases of “green” cars; subsidies of 5% on energy efficient televisions and other appliances –
Notes: PRC: People’s Republic of China, ROK: Republic of Korea Sources: Author’s estimations from data in: Kang (2010); Sugimoto (2010); Kumar and Soumya (2010); Patunru and Zetha (2010); Nguyen, Nguyen, and Nguyen (2010); Jitsuchon (2010); FAITC (2009); Alibaba.com (2008); IFCE (2009); Economy Watch (2010); Tabuchi 2009 and ADB (2009a). To maximize gains from the region’s diversity, it is important that the Asian economies ensure adequate infrastructure connectivity. In order to cope with the changing patterns of the global economic framework, investments in national infrastructure need to be coordinated through regional cooperation for enhancing cross-border connectivity. Enhanced connectivity not only promotes income and growth, reduces poverty and improves household welfare (ADB, JBIC, and World Bank 2005); it also facilitates minimizing information asymmetry and communication gaps, balances disparity among people, and helps in conflict avoidance and mitigation. When access to resources and basic services is usually low like in remote areas, a sense of depravity may arise among people, which may lead to desperation and tension. Connectivity, both at the national
4
and cross-border level, can provide improved access to resources and services and thus infrastructure can work as “bridge for peace” (DFID 2005). As such, well-developed transport, telecommunications, water and energy infrastructures may help develop a peaceful, harmonious and prosperous society. This paper observes that Asia needs to increase its focus particularly on transport connectivity at the national and regional levels to meet the infrastructure requirements of the region, to enhance economic integration and to rebalance its growth. However, building massive infrastructure is expensive and will also have profound implications for environment and climate change as well as adverse social impacts at the national, regional and global levels. In this evolving scenario, in order to remain competitive and at the same time ensure sustainable growth, Asia needs to build efficient, safe, affordable, timely, world-class, financially and environmentally sustainable seamless transport connections within the region and with robust linkage to the rest of the world. As explained earlier, increased infrastructure is important for sustainable growth, but it is the connectivity through the development of regional or cross-border infrastructure (see Box 1 for the definition) that needs renewed and focused energy in Asia for abating the effects of the recent economic and financial crisis for the following reasons:
1. Regional infrastructure enhances competitiveness and productivity, which could help in economic recovery and in sustaining growth in the medium to long-term.
2. It helps improve the standard of living and reduce poverty by connecting isolated places and people with major economic centers and markets, thus narrowing the development gap among Asian economies.
3. It promotes environmental sustainability through properly designed transport and energy projects and the trade of environmentally friendly energy resources across borders.
4. It facilitates and accelerates regional trade and economic cooperation and integration by increasing regional demand and intraregional trade necessary to rebalance Asia’s and world’s economic growth.
As the transport is the key infrastructure for enhancing connectivity, this paper focuses on the transport infrastructure. The concept of “seamless and sustainable transport connectivity” (see Box 2 for definition) attempts to address the competing concerns of meeting extensive infrastructure requirements while at the same time remaining sensitive to their impact on the local, national and global environment and climate change. This paper discusses the concept, needs and benefits of seamless, sustainable infrastructure
Box 1. Defining Regional Infrastructure Regional infrastructure projects are defined as:
projects that involve physical construction and/or coordinated policies and procedures spanning two or more countries; and
national infrastructure projects that have a significant cross-border impact: their planning and implementation involve cooperation or coordination with one or
more countries; they aim to stimulate significant amounts of regional trade and income; and they are designed to connect to the network of a neighboring or third country.
Source: Infrastructure for a Seamless Asia, ADB/ADBI (2009)

5
connectivity in the Asia and Pacific and its prospects and challenges as well as policies required to address the challenges and to secure the prospects. The paper is organized as follows. The second section presents the concept, benefits of transport connectivity and an overview of the growing transport infrastructure needs of the Asian region. The third section presents financing needs for developing transport infrastructure over the period 2010-2020. Apart from the financial cost, there is also an environmental cost of building new transport infrastructure which is covered in Section 4. The subsequent section examines the prospects and challenges and the various options that are available for developing sustainable green transport connectivity, while Section 6 examines the role of regional institutions in developing sustainable transportation. Finally, Section 7 concludes with policy recommendations.
2. THE CONCEPT, NEEDS AND BENEFITS OF SEAMLESS SUSTAINABLE TRANSPORT CONNECTIVITY IN ASIA
This section discusses the concept and vision of building a seamless sustainable transport connectivity, including Asian highway and railways. It also examines the needs and benefits of transport connectivity in terms of competitiveness, quality and quantity.
2.1 The Concept of Seamless Sustainable Connectivity Connectivity has several dimensions, such as physical infrastructure (physical connectivity), effective institutions, mechanisms and processes (institutional connectivity) and empowerment (people-to-people connectivity).3The concept of connectivity through the development of regional infrastructure projects (or infrastructure that links one country to another) is not new to Asia. History shows that transport connectivity in Asia started with the Silk Road in the 13th Century. The Silk Road used to be the most important cross-border artery as it was an extensive, interconnected network of pan-Asian trade routes linking East, South, Central, and Western Asia and ultimately Europe, as well to Eastern and Central Asia. The box 2 defines a seamless transport connectivity in Asia and the Pacific.
3 For details about these key elements of connectivity, see the Master Plan on ASEAN Connectivity, available at http://www.aseansec.org/documents/MPAC.pdf, accessed 9 November 2010.
Box 2. Defining a Seamless Sustainable Transport Connectivity in Asia and the Pacific
Seamless Sustainable Transport connectivity refers to — A physically, economically, and financially integrated region connected by state-of-the-art,
efficient, and environment-friendly or sustainable (green) infrastructure networks in transport that promote trade and investments within the region and with global markets, widen access to markets and public services and thereby promote inclusive and sustainable economic growth and reduce poverty;
Expanding, deepening, and increasing the efficiency of regional production networks and supply chains by streamlining policies, systems and procedures such as customs procedure and other bureaucratic impediments;
Developing efficient regional financial markets that channel savings from Asia and the rest of the world into productive investments, notably transportation throughout the region; and
Efficient and seamless connections across Asia and with the rest of the world to create a more competitive, prosperous, and integrated region, and to take advantage of Asia’s enormous untapped economic potential.
Source: Adapted from Bhattacharyay (2010)

6
In 1992, the concept of pan-Asia transport connectivity was revived by the United Nations Economic and Social Commission for Asia and the Pacific (UNESCAP) under its Asian Land Transport Infrastructure Development (ALTID) project. The ALTID initiative is comprised of three components -- the Asian Highway (AH), the Trans-Asian Railway (TAR), and the facilitation of land transport projects through inter-modal transport terminals (UNESCAP 2010a). Figure 1 shows existing and planned transport and economic links through roads across Asia, Europe and the Middle East. It is planned as a network of 141,271 km of standardized highways—including 155 cross-border roads—that crisscross 32 Asian countries.
Figure 1: Asian Highway Network
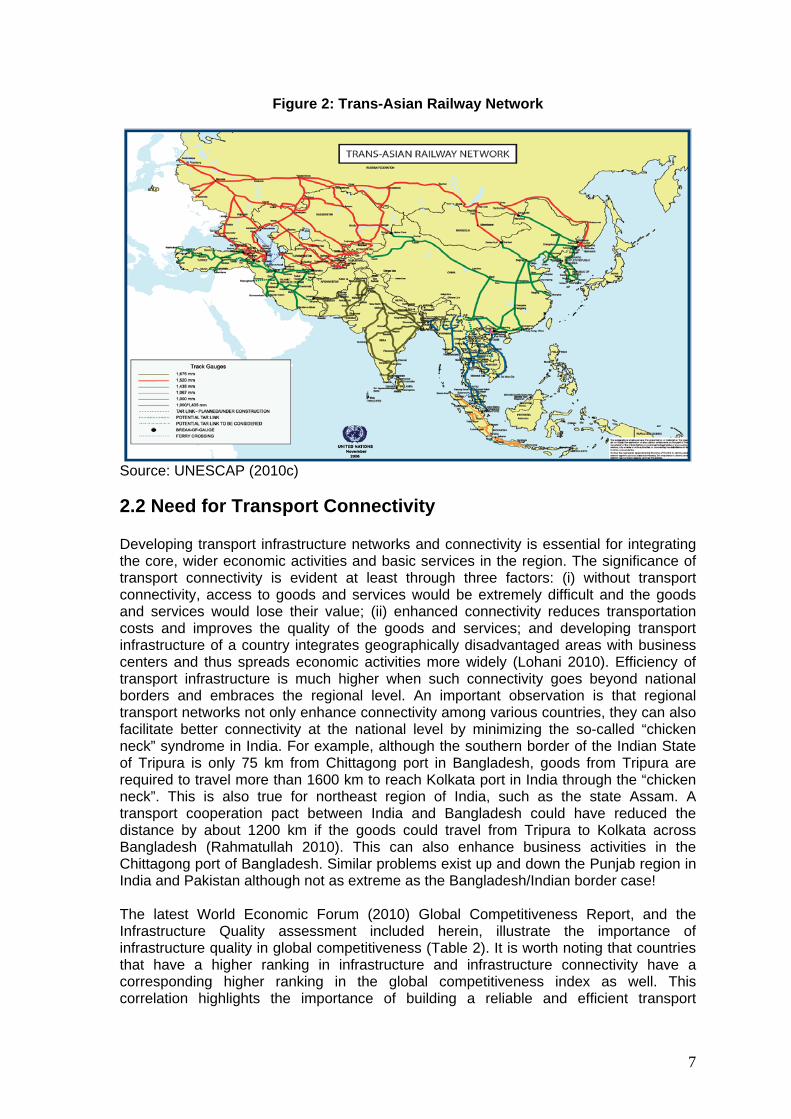
Source: UNESCAP (2010b) The Trans Asian Railway (TAR) existing and planned network (Figure 2), covering a distance of 114,000 km in 28 countries (UNESCAP 2010d), would link pan-Asian and pan-European rail networks at various locations, connecting major ports of Asia and Europe and providing landlocked countries with better access to seaports either directly or in conjunction with highways.
7
Figure 2: Trans-Asian Railway Network
Source: UNESCAP (2010c)
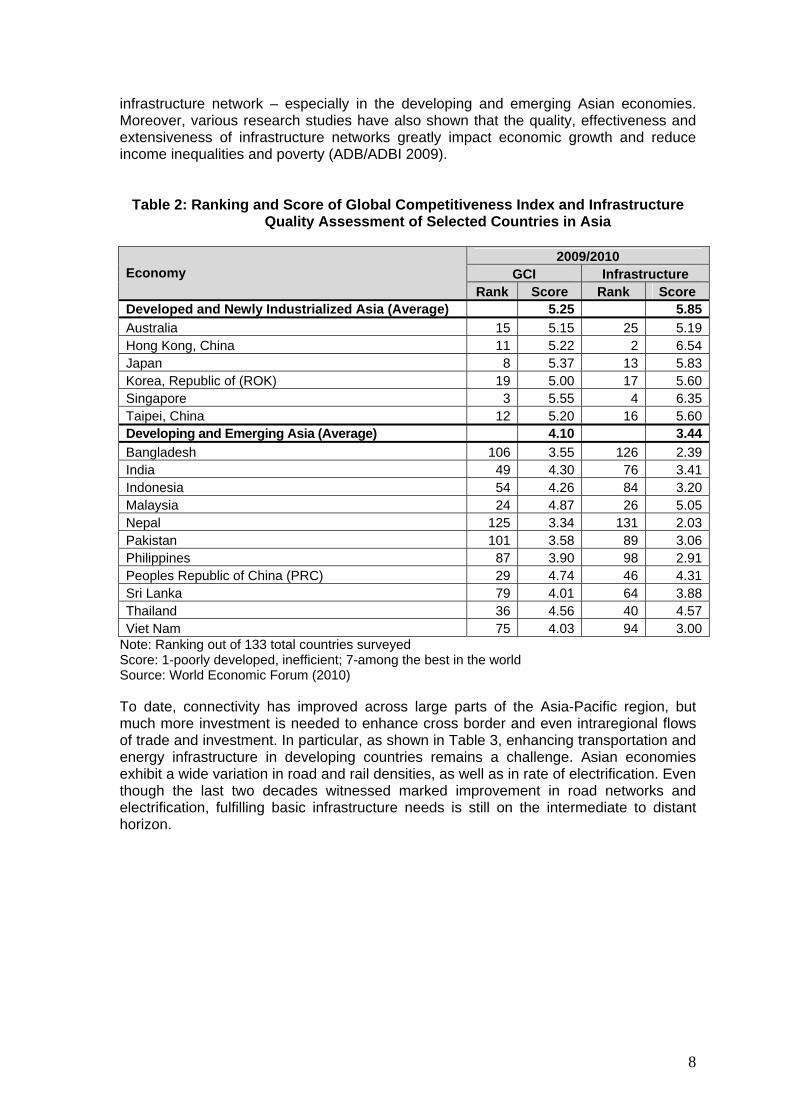
2.2 Need for Transport Connectivity Developing transport infrastructure networks and connectivity is essential for integrating the core, wider economic activities and basic services in the region. The significance of transport connectivity is evident at least through three factors: (i) without transport connectivity, access to goods and services would be extremely difficult and the goods and services would lose their value; (ii) enhanced connectivity reduces transportation costs and improves the quality of the goods and services; and developing transport infrastructure of a country integrates geographically disadvantaged areas with business centers and thus spreads economic activities more widely (Lohani 2010). Efficiency of transport infrastructure is much higher when such connectivity goes beyond national borders and embraces the regional level. An important observation is that regional transport networks not only enhance connectivity among various countries, they can also facilitate better connectivity at the national level by minimizing the so-called “chicken neck” syndrome in India. For example, although the southern border of the Indian State of Tripura is only 75 km from Chittagong port in Bangladesh, goods from Tripura are required to travel more than 1600 km to reach Kolkata port in India through the “chicken neck”. This is also true for northeast region of India, such as the state Assam. A transport cooperation pact between India and Bangladesh could have reduced the distance by about 1200 km if the goods could travel from Tripura to Kolkata across Bangladesh (Rahmatullah 2010). This can also enhance business activities in the Chittagong port of Bangladesh. Similar problems exist up and down the Punjab region in India and Pakistan although not as extreme as the Bangladesh/Indian border case! The latest World Economic Forum (2010) Global Competitiveness Report, and the Infrastructure Quality assessment included herein, illustrate the importance of infrastructure quality in global competitiveness (Table 2). It is worth noting that countries that have a higher ranking in infrastructure and infrastructure connectivity have a corresponding higher ranking in the global competitiveness index as well. This correlation highlights the importance of building a reliable and efficient transport
8
infrastructure network – especially in the developing and emerging Asian economies. Moreover, various research studies have also shown that the quality, effectiveness and extensiveness of infrastructure networks greatly impact economic growth and reduce income inequalities and poverty (ADB/ADBI 2009).
Table 2: Ranking and Score of Global Competitiveness Index and Infrastructure Quality Assessment of Selected Countries in Asia
2009/2010
GCI Infrastructure Economy Rank Score Rank Score
Developed and Newly Industrialized Asia (Average) 5.25 5.85Australia 15 5.15 25 5.19Hong Kong, China 11 5.22 2 6.54Japan 8 5.37 13 5.83Korea, Republic of (ROK) 19 5.00 17 5.60Singapore 3 5.55 4 6.35Taipei, China 12 5.20 16 5.60Developing and Emerging Asia (Average) 4.10 3.44Bangladesh 106 3.55 126 2.39India 49 4.30 76 3.41Indonesia 54 4.26 84 3.20Malaysia 24 4.87 26 5.05Nepal 125 3.34 131 2.03Pakistan 101 3.58 89 3.06Philippines 87 3.90 98 2.91Peoples Republic of China (PRC) 29 4.74 46 4.31Sri Lanka 79 4.01 64 3.88Thailand 36 4.56 40 4.57Viet Nam 75 4.03 94 3.00
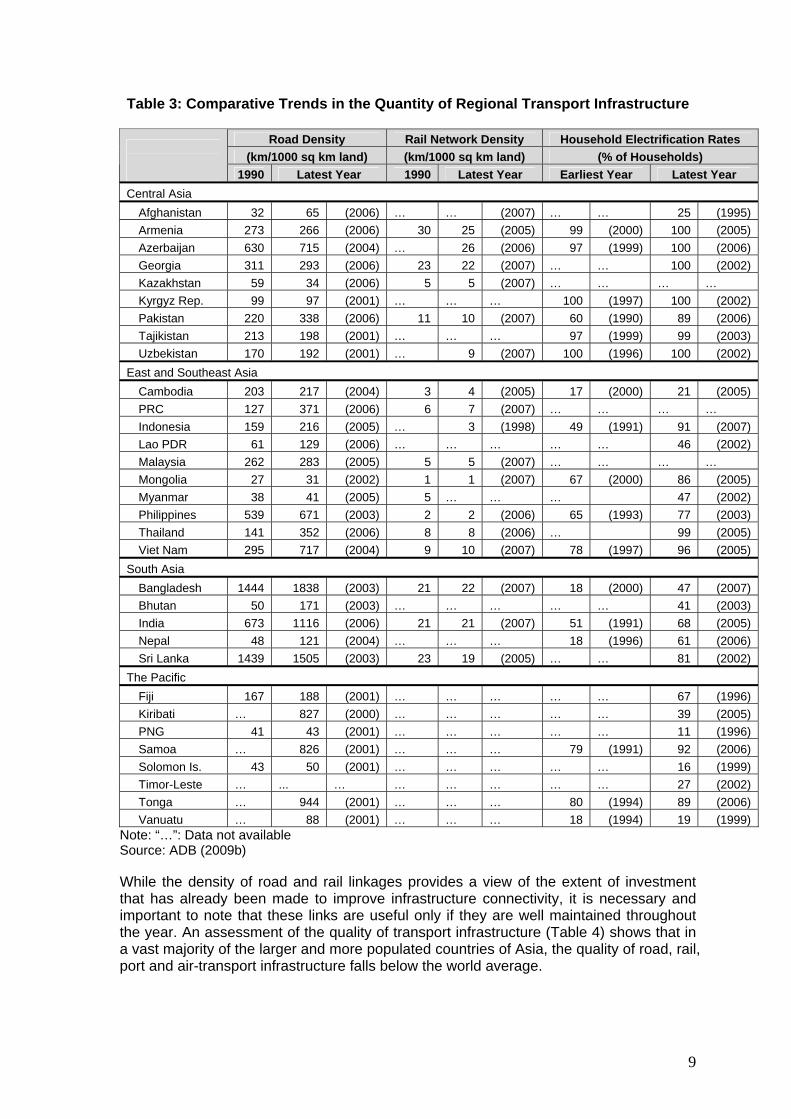
Note: Ranking out of 133 total countries surveyed Score: 1-poorly developed, inefficient; 7-among the best in the world Source: World Economic Forum (2010) To date, connectivity has improved across large parts of the Asia-Pacific region, but much more investment is needed to enhance cross border and even intraregional flows of trade and investment. In particular, as shown in Table 3, enhancing transportation and energy infrastructure in developing countries remains a challenge. Asian economies exhibit a wide variation in road and rail densities, as well as in rate of electrification. Even though the last two decades witnessed marked improvement in road networks and electrification, fulfilling basic infrastructure needs is still on the intermediate to distant horizon.
9
Table 3: Comparative Trends in the Quantity of Regional Transport Infrastructure
Road Density Rail Network Density Household Electrification Rates (km/1000 sq km land) (km/1000 sq km land) (% of Households)
1990 Latest Year 1990 Latest Year Earliest Year Latest Year Central Asia
Afghanistan 32 65 (2006) … … (2007) … … 25 (1995) Armenia 273 266 (2006) 30 25 (2005) 99 (2000) 100 (2005) Azerbaijan 630 715 (2004) … 26 (2006) 97 (1999) 100 (2006) Georgia 311 293 (2006) 23 22 (2007) … … 100 (2002) Kazakhstan 59 34 (2006) 5 5 (2007) … … … … Kyrgyz Rep. 99 97 (2001) … … … 100 (1997) 100 (2002) Pakistan 220 338 (2006) 11 10 (2007) 60 (1990) 89 (2006) Tajikistan 213 198 (2001) … … … 97 (1999) 99 (2003) Uzbekistan 170 192 (2001) … 9 (2007) 100 (1996) 100 (2002)
East and Southeast Asia Cambodia 203 217 (2004) 3 4 (2005) 17 (2000) 21 (2005) PRC 127 371 (2006) 6 7 (2007) … … … … Indonesia 159 216 (2005) … 3 (1998) 49 (1991) 91 (2007) Lao PDR 61 129 (2006) … … … … … 46 (2002) Malaysia 262 283 (2005) 5 5 (2007) … … … … Mongolia 27 31 (2002) 1 1 (2007) 67 (2000) 86 (2005) Myanmar 38 41 (2005) 5 … … … 47 (2002) Philippines 539 671 (2003) 2 2 (2006) 65 (1993) 77 (2003) Thailand 141 352 (2006) 8 8 (2006) … 99 (2005) Viet Nam 295 717 (2004) 9 10 (2007) 78 (1997) 96 (2005)
South Asia Bangladesh 1444 1838 (2003) 21 22 (2007) 18 (2000) 47 (2007) Bhutan 50 171 (2003) … … … … … 41 (2003) India 673 1116 (2006) 21 21 (2007) 51 (1991) 68 (2005) Nepal 48 121 (2004) … … … 18 (1996) 61 (2006) Sri Lanka 1439 1505 (2003) 23 19 (2005) … … 81 (2002)
The Pacific Fiji 167 188 (2001) … … … … … 67 (1996) Kiribati … 827 (2000) … … … … … 39 (2005) PNG 41 43 (2001) … … … … … 11 (1996) Samoa … 826 (2001) … … … 79 (1991) 92 (2006) Solomon Is. 43 50 (2001) … … … … … 16 (1999) Timor-Leste … ... … … … … … … 27 (2002) Tonga … 944 (2001) … … … 80 (1994) 89 (2006) Vanuatu … 88 (2001) … … … 18 (1994) 19 (1999)
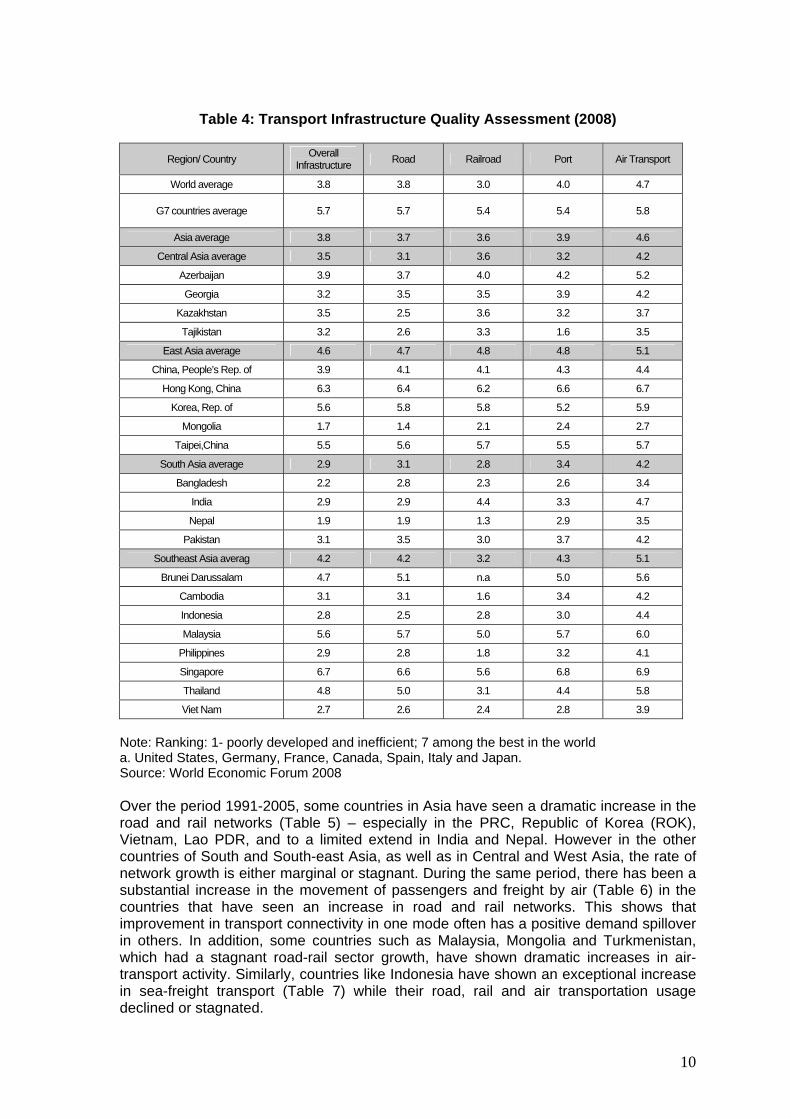
Note: “…”: Data not available Source: ADB (2009b) While the density of road and rail linkages provides a view of the extent of investment that has already been made to improve infrastructure connectivity, it is necessary and important to note that these links are useful only if they are well maintained throughout the year. An assessment of the quality of transport infrastructure (Table 4) shows that in a vast majority of the larger and more populated countries of Asia, the quality of road, rail, port and air-transport infrastructure falls below the world average.
10
Table 4: Transport Infrastructure Quality Assessment (2008)
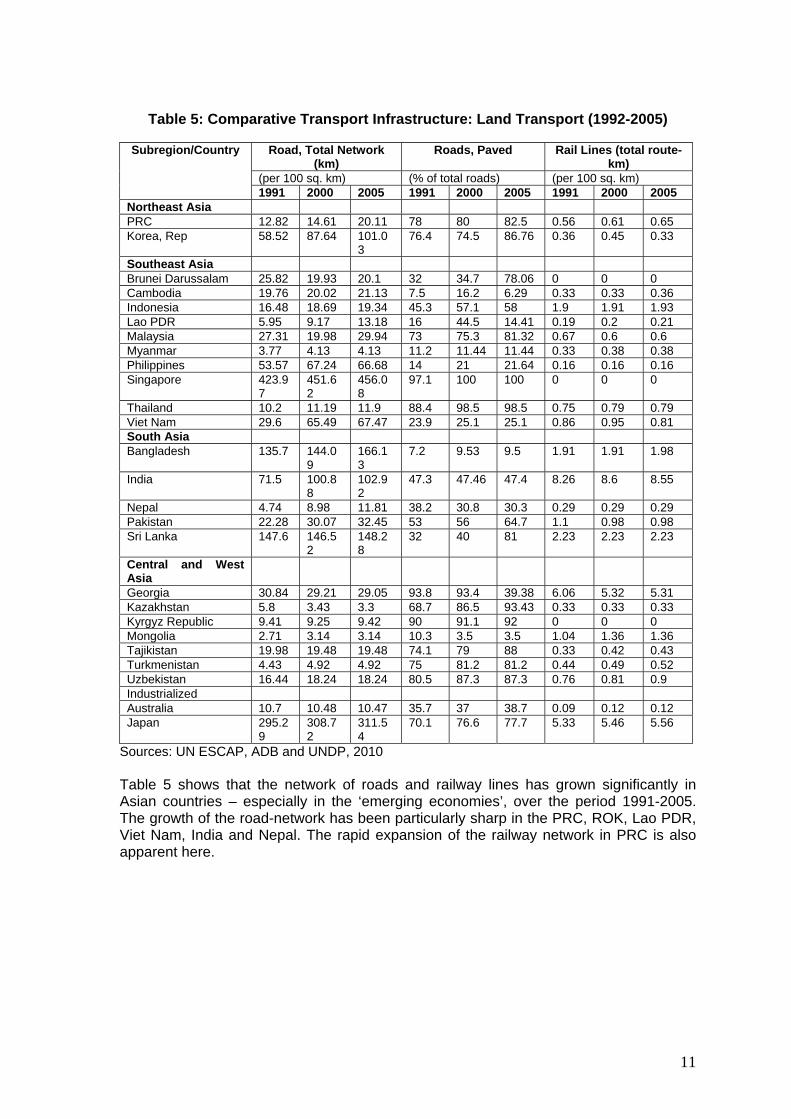
Note: Ranking: 1- poorly developed and inefficient; 7 among the best in the world a. United States, Germany, France, Canada, Spain, Italy and Japan. Source: World Economic Forum 2008 Over the period 1991-2005, some countries in Asia have seen a dramatic increase in the road and rail networks (Table 5) – especially in the PRC, Republic of Korea (ROK), Vietnam, Lao PDR, and to a limited extend in India and Nepal. However in the other countries of South and South-east Asia, as well as in Central and West Asia, the rate of network growth is either marginal or stagnant. During the same period, there has been a substantial increase in the movement of passengers and freight by air (Table 6) in the countries that have seen an increase in road and rail networks. This shows that improvement in transport connectivity in one mode often has a positive demand spillover in others. In addition, some countries such as Malaysia, Mongolia and Turkmenistan, which had a stagnant road-rail sector growth, have shown dramatic increases in air-transport activity. Similarly, countries like Indonesia have shown an exceptional increase in sea-freight transport (Table 7) while their road, rail and air transportation usage declined or stagnated.
Region/ Country Overall Infrastructure Road Railroad Port Air Transport
World average 3.8 3.8 3.0 4.0 4.7
G7 countries average 5.7 5.7 5.4 5.4 5.8
Asia average 3.8 3.7 3.6 3.9 4.6
Central Asia average 3.5 3.1 3.6 3.2 4.2
Azerbaijan 3.9 3.7 4.0 4.2 5.2
Georgia 3.2 3.5 3.5 3.9 4.2
Kazakhstan 3.5 2.5 3.6 3.2 3.7
Tajikistan 3.2 2.6 3.3 1.6 3.5
East Asia average 4.6 4.7 4.8 4.8 5.1
China, People’s Rep. of 3.9 4.1 4.1 4.3 4.4
Hong Kong, China 6.3 6.4 6.2 6.6 6.7
Korea, Rep. of 5.6 5.8 5.8 5.2 5.9
Mongolia 1.7 1.4 2.1 2.4 2.7
Taipei,China 5.5 5.6 5.7 5.5 5.7
South Asia average 2.9 3.1 2.8 3.4 4.2
Bangladesh 2.2 2.8 2.3 2.6 3.4
India 2.9 2.9 4.4 3.3 4.7
Nepal 1.9 1.9 1.3 2.9 3.5
Pakistan 3.1 3.5 3.0 3.7 4.2
Southeast Asia averag 4.2 4.2 3.2 4.3 5.1
Brunei Darussalam 4.7 5.1 n.a 5.0 5.6
Cambodia 3.1 3.1 1.6 3.4 4.2
Indonesia 2.8 2.5 2.8 3.0 4.4
Malaysia 5.6 5.7 5.0 5.7 6.0
Philippines 2.9 2.8 1.8 3.2 4.1
Singapore 6.7 6.6 5.6 6.8 6.9
Thailand 4.8 5.0 3.1 4.4 5.8
Viet Nam 2.7 2.6 2.4 2.8 3.9
11
Table 5: Comparative Transport Infrastructure: Land Transport (1992-2005)
Road, Total Network
(km) Roads, Paved Rail Lines (total route-
km) (per 100 sq. km) (% of total roads) (per 100 sq. km)
Subregion/Country
1991 2000 2005 1991 2000 2005 1991 2000 2005 Northeast Asia PRC 12.82 14.61 20.11 78 80 82.5 0.56 0.61 0.65 Korea, Rep 58.52 87.64 101.0
3 76.4 74.5 86.76 0.36 0.45 0.33
Southeast Asia Brunei Darussalam 25.82 19.93 20.1 32 34.7 78.06 0 0 0 Cambodia 19.76 20.02 21.13 7.5 16.2 6.29 0.33 0.33 0.36 Indonesia 16.48 18.69 19.34 45.3 57.1 58 1.9 1.91 1.93 Lao PDR 5.95 9.17 13.18 16 44.5 14.41 0.19 0.2 0.21 Malaysia 27.31 19.98 29.94 73 75.3 81.32 0.67 0.6 0.6 Myanmar 3.77 4.13 4.13 11.2 11.44 11.44 0.33 0.38 0.38 Philippines 53.57 67.24 66.68 14 21 21.64 0.16 0.16 0.16 Singapore 423.9
7 451.62
456.08
97.1 100 100 0 0 0
Thailand 10.2 11.19 11.9 88.4 98.5 98.5 0.75 0.79 0.79 Viet Nam 29.6 65.49 67.47 23.9 25.1 25.1 0.86 0.95 0.81 South Asia Bangladesh 135.7 144.0
9 166.13
7.2 9.53 9.5 1.91 1.91 1.98
India 71.5 100.88
102.92
47.3 47.46 47.4 8.26 8.6 8.55
Nepal 4.74 8.98 11.81 38.2 30.8 30.3 0.29 0.29 0.29 Pakistan 22.28 30.07 32.45 53 56 64.7 1.1 0.98 0.98 Sri Lanka 147.6 146.5
2 148.28
32 40 81 2.23 2.23 2.23
Central and West Asia
Georgia 30.84 29.21 29.05 93.8 93.4 39.38 6.06 5.32 5.31 Kazakhstan 5.8 3.43 3.3 68.7 86.5 93.43 0.33 0.33 0.33 Kyrgyz Republic 9.41 9.25 9.42 90 91.1 92 0 0 0 Mongolia 2.71 3.14 3.14 10.3 3.5 3.5 1.04 1.36 1.36 Tajikistan 19.98 19.48 19.48 74.1 79 88 0.33 0.42 0.43 Turkmenistan 4.43 4.92 4.92 75 81.2 81.2 0.44 0.49 0.52 Uzbekistan 16.44 18.24 18.24 80.5 87.3 87.3 0.76 0.81 0.9 Industrialized Australia 10.7 10.48 10.47 35.7 37 38.7 0.09 0.12 0.12 Japan 295.2
9 308.72
311.54
70.1 76.6 77.7 5.33 5.46 5.56
Sources: UN ESCAP, ADB and UNDP, 2010 Table 5 shows that the network of roads and railway lines has grown significantly in Asian countries – especially in the ‘emerging economies’, over the period 1991-2005. The growth of the road-network has been particularly sharp in the PRC, ROK, Lao PDR, Viet Nam, India and Nepal. The rapid expansion of the railway network in PRC is also apparent here.

12
Table 6: Comparative Transport Infrastructure: Air Transport Indicator (1991-2006)
Air Transport, Freight Air Transport, Passengers Carried Subregion/Country (million tons per km) (per 1000 population)
1991 2000 2005 2006 1991 2000 2005 2006 Northeast Asia PRC 1,009.
50 3,900.10
7,579.40
7,692.20
17 49 104.8 120.5
Korea, Rep 2,597.00
7,651.30
7,432.60
7,751.50
390.8 730.3 701.7 719.6
Southeast Asia Brunei Darussalam 22 140.2 134.1 130.2 1,161.
30 2,589.60
2,614.90
2,726.80
Cambodia 0 4.1 1.2 1.1 0.5 6.2 12 18 Indonesia 475.5 408.5 439.8 469.2 57.4 48.1 121.7 133.9 Lao PDR 0.8 1.7 2.5 2.5 27.2 39.9 49.5 56.7 Malaysia 713.6 1,863.8
0 2,577.60
2,597.40
646 720.1 803.6 682.9
Myanmar 1.1 0.8 2.7 2.8 7.7 9.2 29.8 33.5 Philippines 307.6 290 322.7 318.9 87 76 97 96.3 Singapore 1,740.
80 6,004.90
7,571.30
7,981.30
2,469.90
4157.70
4,086.80
4,363.60
Thailand 866.2 1,712.90
2,002.40
2,106.90
139.1 283.1 294.3 316.9
Viet Nam 82.9 117.3 230.2 216 2.9 36.7 65.6 62.8 South Asia Bangladesh 99.4 193.9 183.5 190.8 9.6 10.3 11.5 11.1 India 493.1 547.7 773.2 842.6 12.4 17 25.2 36.3 Nepal 23.9 17 6.9 7.2 32.4 26.3 17.7 18.4 Pakistan 373.3 340.3 407.9 427 46.9 38.3 34.4 35.9 Sri Lanka 100.7 255.7 310.4 325.4 51.7 90.7 143.6 155.9 Central and West Asia
Georgia 1.8 2 2.8 2.9 12.2 24.9 55.7 61.3 Kazakhstan 32.2 11.8 15.8 16.4 320.8 31 76.6 83.8 Kyrgyz Republic 0.7 3.7 2 1.2 102.1 49 43.9 42.3 Mongolia 1.2 8.4 6.1 6.3 287.5 105.9 115.6 134.6 Tajikistan 2.5 2.7 6.1 12.8 139.6 27.3 73.6 59.4 Turkmenistan 2.3 11.9 10.1 10.5 187.1 285.2 342.1 376.2 Uzbekistan 36.7 79.6 71.6 67.6 188 70.8 62.7 62.7 Industrialized Australia 1,222.
60 1,730.70
2,444.60
2,569.50
1,264.80
1,700.90
2196.70 2,268.10
Japan 5,225.30
8,672.10
8,549.20
8,480.00
635.2 860.1 800.5 805
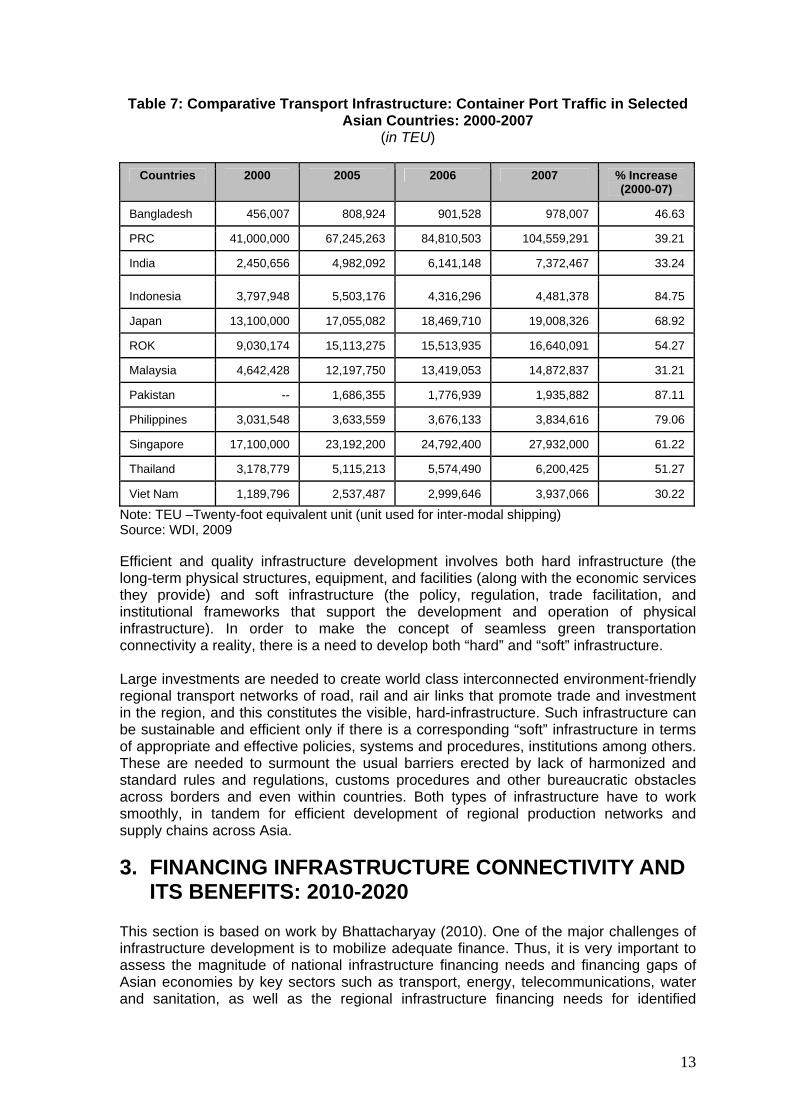
Source: WDI, 2009 In terms of air transportation (Table 6), Asia witnessed again a sharp increase of both passenger and freight transportation in PRC. Other countries which have also expanded air-transport operations include Singapore, Viet Nam, Thailand, India and Uzbekistan. In the Central Asian region there is a marked decrease in passenger transportation on the one hand and a sharp increase in air-freight transport on the other. Table 7 shows the trends on container port traffic in selected countries during 2000-2007. Increase in traffic in this period varies across countries ranging from 87% in Pakistan to 30% in Viet Nam.
13
Table 7: Comparative Transport Infrastructure: Container Port Traffic in Selected Asian Countries: 2000-2007
(in TEU)
Countries 2000 2005 2006 2007 % Increase (2000-07)
Bangladesh 456,007 808,924 901,528 978,007 46.63
PRC 41,000,000 67,245,263 84,810,503 104,559,291 39.21
India 2,450,656 4,982,092 6,141,148 7,372,467 33.24
Indonesia 3,797,948 5,503,176 4,316,296 4,481,378 84.75
Japan 13,100,000 17,055,082 18,469,710 19,008,326 68.92
ROK 9,030,174 15,113,275 15,513,935 16,640,091 54.27
Malaysia 4,642,428 12,197,750 13,419,053 14,872,837 31.21
Pakistan -- 1,686,355 1,776,939 1,935,882 87.11
Philippines 3,031,548 3,633,559 3,676,133 3,834,616 79.06
Singapore 17,100,000 23,192,200 24,792,400 27,932,000 61.22
Thailand 3,178,779 5,115,213 5,574,490 6,200,425 51.27
Viet Nam 1,189,796 2,537,487 2,999,646 3,937,066 30.22
Note: TEU –Twenty-foot equivalent unit (unit used for inter-modal shipping) Source: WDI, 2009 Efficient and quality infrastructure development involves both hard infrastructure (the long-term physical structures, equipment, and facilities (along with the economic services they provide) and soft infrastructure (the policy, regulation, trade facilitation, and institutional frameworks that support the development and operation of physical infrastructure). In order to make the concept of seamless green transportation connectivity a reality, there is a need to develop both “hard” and “soft” infrastructure. Large investments are needed to create world class interconnected environment-friendly regional transport networks of road, rail and air links that promote trade and investment in the region, and this constitutes the visible, hard-infrastructure. Such infrastructure can be sustainable and efficient only if there is a corresponding “soft” infrastructure in terms of appropriate and effective policies, systems and procedures, institutions among others. These are needed to surmount the usual barriers erected by lack of harmonized and standard rules and regulations, customs procedures and other bureaucratic obstacles across borders and even within countries. Both types of infrastructure have to work smoothly, in tandem for efficient development of regional production networks and supply chains across Asia.
3. FINANCING INFRASTRUCTURE CONNECTIVITY AND ITS BENEFITS: 2010-2020
This section is based on work by Bhattacharyay (2010). One of the major challenges of infrastructure development is to mobilize adequate finance. Thus, it is very important to assess the magnitude of national infrastructure financing needs and financing gaps of Asian economies by key sectors such as transport, energy, telecommunications, water and sanitation, as well as the regional infrastructure financing needs for identified
14
regional projects. Regional infrastructure projects are usually more complicated and expensive than typical national infrastructure projects. The estimates of the needed national and regional infrastructure financing can facilitate the planning and the development of solutions for identifying appropriate investment strategies and financial resources, as well developing prioritizing “bankable” projects for utilization of limited resources. This section presents the estimation of national transport infrastructure financing needs for 32 Asian developing economies during 2010-2020 using a “top down” econometric approach based on the projected growth of key economic parameters such as GDP and population as well as regional transport infrastructure financing needs using a “bottom-up approach”. For national transport infrastructure, the selected 32 countries include - Azerbaijan, Bangladesh, Bhutan, Cambodia, Fiji, Indonesia, India, Kazakhstan, Kiribati, Kyrgyzstan, Lao PDR, Papua New Guinea, Philippines, PRC, Malaysia, Marshall Islands, Maldives, Mongolia, Nepal, Pakistan, Samoa, Sri Lanka, Solomon Islands, Tajikistan, Thailand, Tonga, Turkmenistan, Uzbekistan, Vanuatu and Viet Nam. The projections cover transport (airports, ports, railways, and roads (for details, see Bhattacharyay 2010). This estimation uses both top-down and bottom-up approaches for estimating national and regional infrastructure investment needs respectively for the Asia-Pacific region. While the top-down approach utilizes econometric analysis techniques to quantitatively estimate national infrastructure needs and, by extension, the regional needs, the bottom-up approach reviews infrastructure investment demand at the project level specifically for regional or cross-border projects. The investment estimations for regional infrastructure account for regional differences as well as priority investments in planned infrastructure projects, and breaks down demand into the following groups and programs: (i) Pan-Asian, such as the Asian Land Transport Infrastructure Development
(ALTID) project; (ii) Sub-regional, including the Greater Mekong Sub-region Program (GMS4), the
Central Asia Regional Economic Council (CAREC5), the South Asia Sub-regional Economic Council (SASEC), Brunei Darussalam-Indonesia-Malaysia-Philippines East ASEAN Growth Area (BIMP-EAGA6) and the Pacific Countries; and
(iii) Cross-sub regional programs, such as within and between South Asia, Central Asia, Central-South Asia, East Asia-Southeast Asia, and the Association for Southeast Asian Nations (ASEAN).
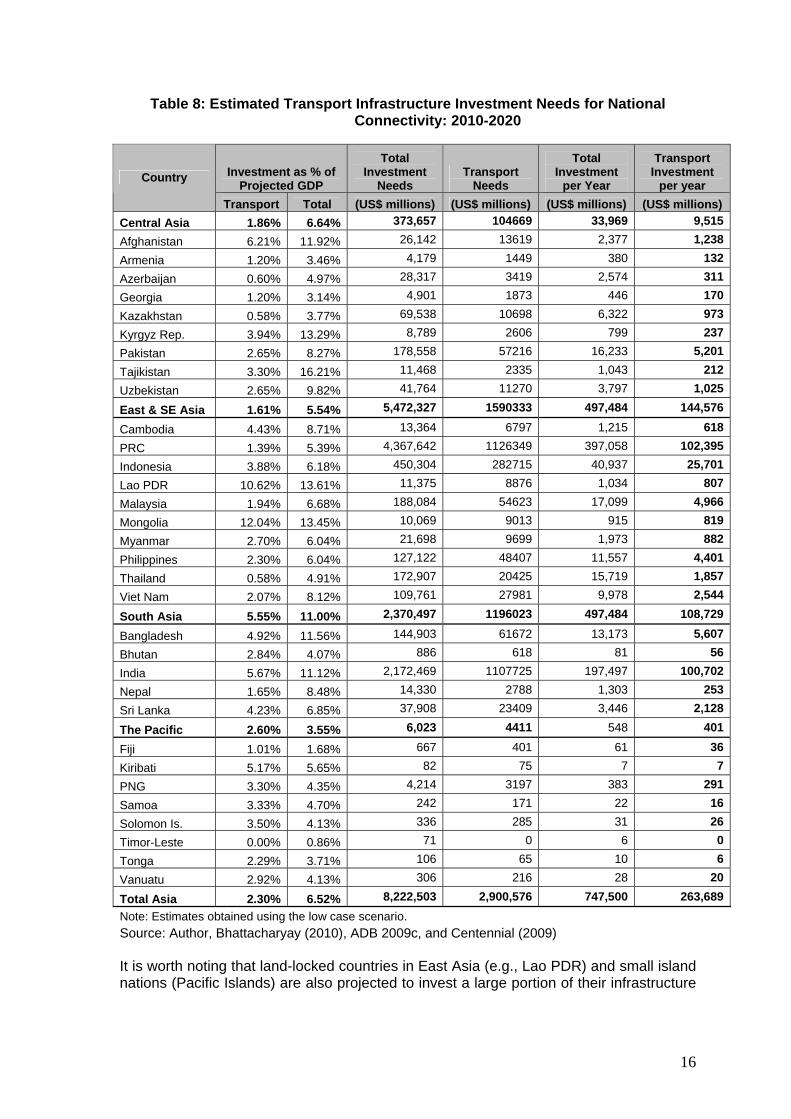
3.1 Financing National Connectivity: 2010-2020 During the ten-year period of 2010-2020, 32 ADB developing member countries are expected to require almost US$ 8.22 trillion (2008 US dollars) for its overall infrastructure investment needs for electricity, transportation, telecommunications and water and sanitation (Table 8). Of this amount, it is estimated that the transportation sector alone – constituting airports, ports, rails and roads – would require $2.9 trillion or 35% of the total
4 GMS, established in 1992, consists of six members – Cambodia, Lao PDR, Myanmar, Thailand, Vietnam and PRC. Website - http://www.gms-eoc.org/ 5 CAREC was established in 1997 and consists of eight member-states: Afghanistan, Azerbaijan, Kazakhstan, Kyrgyz Republic, Mongolia, Tajikistan, Uzbekistan, and PRC. Website: http://www.carecnet.org/en/about 6 BIMP-EAGA was formally launched in 1994 in Davao City in Mindanao, Philippines. Website: http://www.bimp-eaga.org/about.php

15
infrastructure investment need. This translates to an annual investment of US$ 508 billion over 2010-2020 for new capacity investments in infrastructure. Table 8 also provides a detailed breakdown of transport estimates by country per year and as a percentage of GDP. South Asian countries are expected to see half of their total infrastructure investment needs being diverted to the transportation sector, amounting to about $1.1 trillion. In absolute terms, the top five countries with the largest transport needs are – the PRC, India, Indonesia, Bangladesh and Pakistan.
16
Table 8: Estimated Transport Infrastructure Investment Needs for National Connectivity: 2010-2020
Investment as % of Projected GDP
Total Investment
Needs Transport
Needs
Total Investment
per Year
Transport Investment
per year Country
Transport Total (US$ millions) (US$ millions) (US$ millions) (US$ millions) Central Asia 1.86% 6.64% 373,657 104669 33,969 9,515
Afghanistan 6.21% 11.92% 26,142 13619 2,377 1,238
Armenia 1.20% 3.46% 4,179 1449 380 132
Azerbaijan 0.60% 4.97% 28,317 3419 2,574 311
Georgia 1.20% 3.14% 4,901 1873 446 170
Kazakhstan 0.58% 3.77% 69,538 10698 6,322 973
Kyrgyz Rep. 3.94% 13.29% 8,789 2606 799 237
Pakistan 2.65% 8.27% 178,558 57216 16,233 5,201
Tajikistan 3.30% 16.21% 11,468 2335 1,043 212
Uzbekistan 2.65% 9.82% 41,764 11270 3,797 1,025
East & SE Asia 1.61% 5.54% 5,472,327 1590333 497,484 144,576
Cambodia 4.43% 8.71% 13,364 6797 1,215 618
PRC 1.39% 5.39% 4,367,642 1126349 397,058 102,395
Indonesia 3.88% 6.18% 450,304 282715 40,937 25,701
Lao PDR 10.62% 13.61% 11,375 8876 1,034 807
Malaysia 1.94% 6.68% 188,084 54623 17,099 4,966
Mongolia 12.04% 13.45% 10,069 9013 915 819
Myanmar 2.70% 6.04% 21,698 9699 1,973 882
Philippines 2.30% 6.04% 127,122 48407 11,557 4,401
Thailand 0.58% 4.91% 172,907 20425 15,719 1,857
Viet Nam 2.07% 8.12% 109,761 27981 9,978 2,544
South Asia 5.55% 11.00% 2,370,497 1196023 497,484 108,729
Bangladesh 4.92% 11.56% 144,903 61672 13,173 5,607
Bhutan 2.84% 4.07% 886 618 81 56
India 5.67% 11.12% 2,172,469 1107725 197,497 100,702
Nepal 1.65% 8.48% 14,330 2788 1,303 253
Sri Lanka 4.23% 6.85% 37,908 23409 3,446 2,128
The Pacific 2.60% 3.55% 6,023 4411 548 401
Fiji 1.01% 1.68% 667 401 61 36
Kiribati 5.17% 5.65% 82 75 7 7
PNG 3.30% 4.35% 4,214 3197 383 291
Samoa 3.33% 4.70% 242 171 22 16
Solomon Is. 3.50% 4.13% 336 285 31 26
Timor-Leste 0.00% 0.86% 71 0 6 0
Tonga 2.29% 3.71% 106 65 10 6
Vanuatu 2.92% 4.13% 306 216 28 20
Total Asia 2.30% 6.52% 8,222,503 2,900,576 747,500 263,689Note: Estimates obtained using the low case scenario. Source: Author, Bhattacharyay (2010), ADB 2009c, and Centennial (2009) It is worth noting that land-locked countries in East Asia (e.g., Lao PDR) and small island nations (Pacific Islands) are also projected to invest a large portion of their infrastructure

17
investments to improve their transport connectivity, compared to countries in the Central Asian region. Table 9 shows the breakdown of investment needs by sector among the four sub-regional groupings. Generally, energy and transportation make up the largest components of total Asia infrastructure investment needs. By sub-region, the biggest investment needs are in East and Southeast Asia at US$5.47 trillion, or 67% of the total, and South Asia at US$2.37 trillion, or 29% of the total. Not surprisingly, the biggest economies in Asia—PRC and India—are located in these sub-regions.
Table 9: National Transport Infrastructure Investment Needs in Asia, 2010-2020: Per Sub-region and Per Sector
(2008 US$ billions)
Sector / Sub-sector East and Southeast Asia South Asia Central Asia
The Pacific Total
Airports 58 5 1 0 64
Ports 215 36 5 - 257
Rails 16 13 7 0 36
Roads 1305 1142 92 4 2543
Transportation 1594 1196 104 4 2900 Source: Author, Bhattacharyay (2010), and Centennial (2009)
3.2. Financing Needs for Regional Transport Connectivity Projects in Asia: 2010-2020
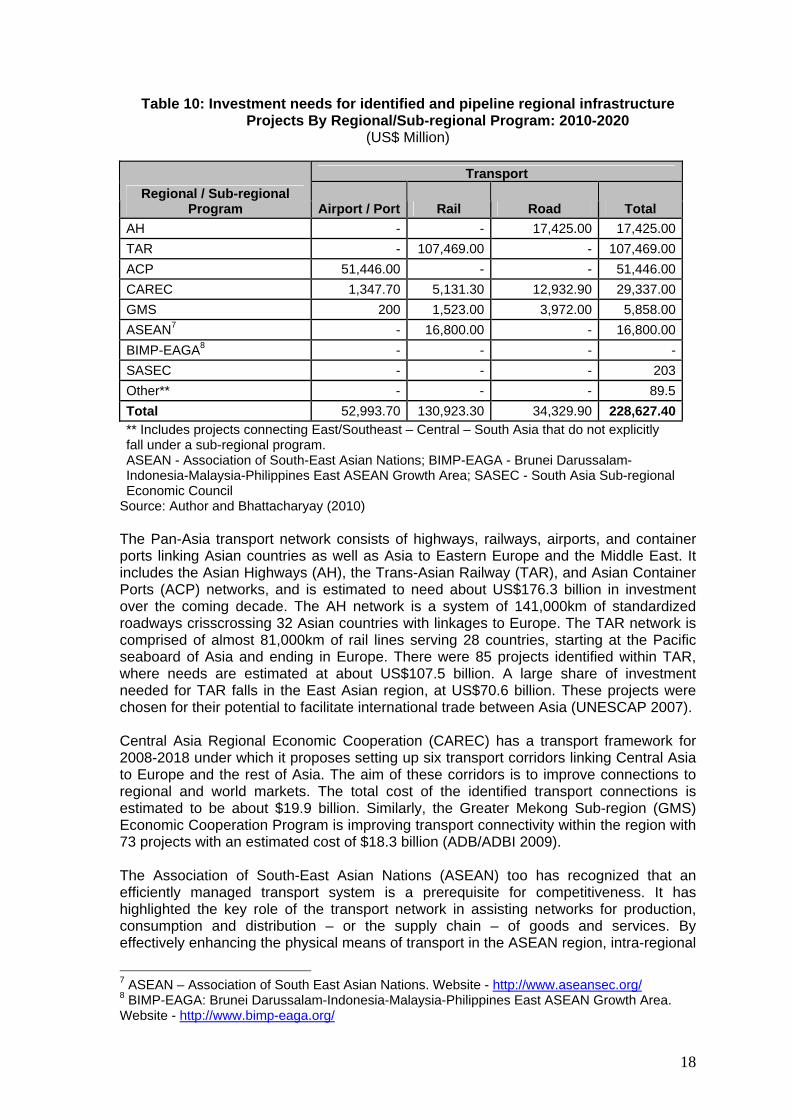
It has been estimated that the total investments required to meet demand for the identified 1202 regional projects is valued at approximately US$320 billion, with an average infrastructure investment need of about US$29 billion per year for the period 2010-2020 (for details see Bhattacharyay 2010). Of this total, needed investment in transport projects accounts for about 70% (Table 10).
18
Table 10: Investment needs for identified and pipeline regional infrastructure Projects By Regional/Sub-regional Program: 2010-2020
(US$ Million)
Transport Regional / Sub-regional
Program Airport / Port Rail Road Total AH - - 17,425.00 17,425.00TAR - 107,469.00 - 107,469.00ACP 51,446.00 - - 51,446.00CAREC 1,347.70 5,131.30 12,932.90 29,337.00GMS 200 1,523.00 3,972.00 5,858.00ASEAN7 - 16,800.00 - 16,800.00BIMP-EAGA8 - - - - SASEC - - - 203Other** - - - 89.5Total 52,993.70 130,923.30 34,329.90 228,627.40** Includes projects connecting East/Southeast – Central – South Asia that do not explicitly fall under a sub-regional program. ASEAN - Association of South-East Asian Nations; BIMP-EAGA - Brunei Darussalam-Indonesia-Malaysia-Philippines East ASEAN Growth Area; SASEC - South Asia Sub-regional Economic Council
Source: Author and Bhattacharyay (2010) The Pan-Asia transport network consists of highways, railways, airports, and container ports linking Asian countries as well as Asia to Eastern Europe and the Middle East. It includes the Asian Highways (AH), the Trans-Asian Railway (TAR), and Asian Container Ports (ACP) networks, and is estimated to need about US$176.3 billion in investment over the coming decade. The AH network is a system of 141,000km of standardized roadways crisscrossing 32 Asian countries with linkages to Europe. The TAR network is comprised of almost 81,000km of rail lines serving 28 countries, starting at the Pacific seaboard of Asia and ending in Europe. There were 85 projects identified within TAR, where needs are estimated at about US$107.5 billion. A large share of investment needed for TAR falls in the East Asian region, at US$70.6 billion. These projects were chosen for their potential to facilitate international trade between Asia (UNESCAP 2007). Central Asia Regional Economic Cooperation (CAREC) has a transport framework for 2008-2018 under which it proposes setting up six transport corridors linking Central Asia to Europe and the rest of Asia. The aim of these corridors is to improve connections to regional and world markets. The total cost of the identified transport connections is estimated to be about $19.9 billion. Similarly, the Greater Mekong Sub-region (GMS) Economic Cooperation Program is improving transport connectivity within the region with 73 projects with an estimated cost of $18.3 billion (ADB/ADBI 2009). The Association of South-East Asian Nations (ASEAN) too has recognized that an efficiently managed transport system is a prerequisite for competitiveness. It has highlighted the key role of the transport network in assisting networks for production, consumption and distribution – or the supply chain – of goods and services. By effectively enhancing the physical means of transport in the ASEAN region, intra-regional
7 ASEAN – Association of South East Asian Nations. Website - http://www.aseansec.org/ 8 BIMP-EAGA: Brunei Darussalam-Indonesia-Malaysia-Philippines East ASEAN Growth Area. Website - http://www.bimp-eaga.org/
19
trade and investment is like to be facilitated greatly. In its Transportation Sector Action Plan (2005-2010) it is dealing with the issues of entry barriers and high operating costs that discourage logistics companies and perpetuates fragmented transport systems (ASEAN 2010).
3.3 Harnessing the Benefits of Regional Infrastructure: Empirical Evidence
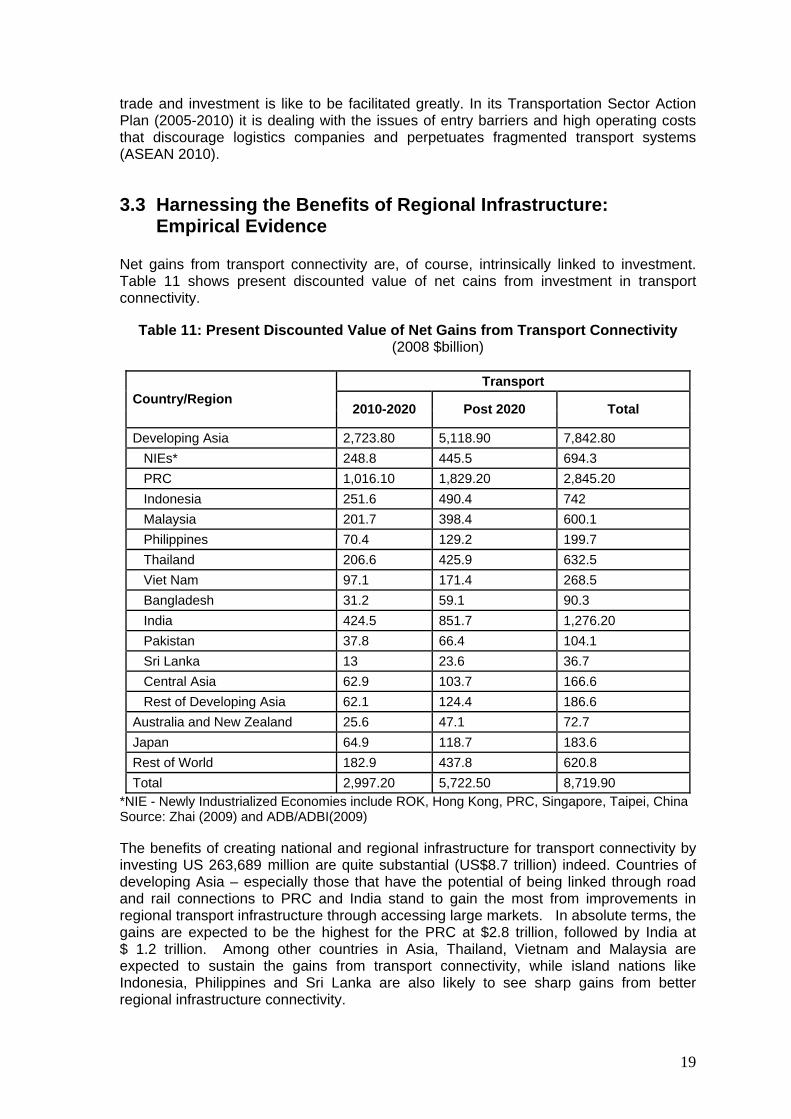
Net gains from transport connectivity are, of course, intrinsically linked to investment. Table 11 shows present discounted value of net cains from investment in transport connectivity.
Table 11: Present Discounted Value of Net Gains from Transport Connectivity (2008 $billion)
Transport
Country/Region 2010-2020 Post 2020 Total
Developing Asia 2,723.80 5,118.90 7,842.80 NIEs* 248.8 445.5 694.3 PRC 1,016.10 1,829.20 2,845.20 Indonesia 251.6 490.4 742 Malaysia 201.7 398.4 600.1 Philippines 70.4 129.2 199.7 Thailand 206.6 425.9 632.5 Viet Nam 97.1 171.4 268.5 Bangladesh 31.2 59.1 90.3 India 424.5 851.7 1,276.20 Pakistan 37.8 66.4 104.1 Sri Lanka 13 23.6 36.7 Central Asia 62.9 103.7 166.6 Rest of Developing Asia 62.1 124.4 186.6 Australia and New Zealand 25.6 47.1 72.7 Japan 64.9 118.7 183.6 Rest of World 182.9 437.8 620.8 Total 2,997.20 5,722.50 8,719.90
*NIE - Newly Industrialized Economies include ROK, Hong Kong, PRC, Singapore, Taipei, China Source: Zhai (2009) and ADB/ADBI(2009) The benefits of creating national and regional infrastructure for transport connectivity by investing US 263,689 million are quite substantial (US$8.7 trillion) indeed. Countries of developing Asia – especially those that have the potential of being linked through road and rail connections to PRC and India stand to gain the most from improvements in regional transport infrastructure through accessing large markets. In absolute terms, the gains are expected to be the highest for the PRC at $2.8 trillion, followed by India at $ 1.2 trillion. Among other countries in Asia, Thailand, Vietnam and Malaysia are expected to sustain the gains from transport connectivity, while island nations like Indonesia, Philippines and Sri Lanka are also likely to see sharp gains from better regional infrastructure connectivity.

20
4. IMPACT OF ASIAN INFRASTRUCTURE DEVELOPMENT ON THE ENVIRONMENT
As explained in the last section, the need for transport connectivity in Asia is huge in the next 10 years as the population and economy expand in a rapid pace together with increased economic integration. On one hand, meeting these robust requirements in the transport sector is essential for economic growth, connectivity and integration as well as for supporting basic needs. On the other hand, if the business as usual is followed, this may cause a very large adverse impact on the environment and related climate change impacts as more people, goods and services are transported within and across Asian countries. Rapid urbanization within the Asian economies further aggravates the demand. In fact, large cities, which account for only one percent of the earth’s surface, consume about 75 percent of the world’s energy and contribute about 80 percent of global emission of greenhouse gases (GHG) (Wuppertal Institute for Climate, Environment and Energy GmbH 2009). According to the UN Intergovernmental Panel on Climate Change (IPCC) in its Fourth Assessment Report, “[m]ost of the observed increase in global average temperatures since the mid-20th century is very likely due to the observed increase in anthropogenic GHG concentrations” (UN-IPCC 2007). The report goes on to state that if global emissions of GHG’s continue to grow at their historic pace - between 2 and 6 degrees Celsius by 2100, humanity is likely to face large-scale adverse environmental, humanitarian, and economic consequences. Emissions fall into four broad groups of sectors that each contribute approximately one-quarter of total emissions in 2005: power; industry (with Petroleum and Gas, Iron and Steel, and Chemicals as large contributors); consumer-related sectors (i.e., Transport, Buildings, Waste), and land-use related sectors (i.e., Forestry and Agriculture). If the historical rates of emissions continue, the relative share of emissions from the first three groups - which includes transportation - will increase by a projected 2 to 3 percentage points by 2030 (McKinsey 2009). Energy consumption is the leading source of greenhouse-gas emissions. According to the International Energy Agency (IEA), in its World Energy Outlook (WEO) for 2009, fossil fuels remain the dominant sources of primary energy worldwide, accounting for more than three-quarters of the overall increase in energy use between 2007 and 2030. Oil demand (excluding bio-fuels) is projected to grow by 1% per year on average over the projection period, from 85 million barrels per day(mb/d) in 2008 to 105 mb/d in 2030. In this scenario, the transportation sector accounts for 97% of the increase in oil use (IEA-WEO 2009). Transportation is thus becoming the fastest growing contributor to global climate change, accounting for 23% of energy-related CO2 emissions. If there are no changes to investment strategies and policies, experts foresee a three- to five-fold increase in CO2 emissions from transportation in Asian countries by 2030, compared with emissions in 2000 (ADB 2010a). Even if electric rail transport is increasingly being used, the type of energy used for electricity production determines the contribution of railway transport on emissions. Within the transportation sector it has been estimated that air-transport contributed only about 2 to 3 percent of the global total emissions. However, according to most recent studies, aviations’ share of GHG gases could increase dramatically to about three times current levels by mid-century, with technical improvements being offset by the expected increase in traffic in and among developing countries. Apart from carbon emissions,
21
aviation also has an adverse environmental impact in terms of noise pollution and high-altitude nitrogen-dioxide emissions (Dicky and McNicoll 2010). Emerging economies of Asia like the PRC and India are becoming, in absolute terms, not only the largest consumers of energy, but also the largest sources of GHG emissions. In the PRC, for instance, sulfur-dioxide (SO2) emissions - mostly originating from the transport sector - rose from 20 million tons in 2000, to 25.5 million tons by 2006; the SO2 emissions had risen 92% from 1978 to 2008 (Global Asia 2010). It has become the largest source of CO2 emissions, having surpassed the US in 2007 (Harris 2008). It was estimated in 2003 that the total cost of air and water pollution, was 2.7% as a percentage of Chinese GDP (Global Asia 2010). The recent global economic downturn has had an unanticipated positive impact on the environment. It is estimated that globally, energy related carbon-dioxide emissions in 2009 will be well below what they would have been if the recession had not occurred (IEA-WEO 2009). This only highlights the need to have a more robust, recession-proof mechanism in place to deal with the long-term environmental impact of economic growth and associated investment in transport infrastructure.
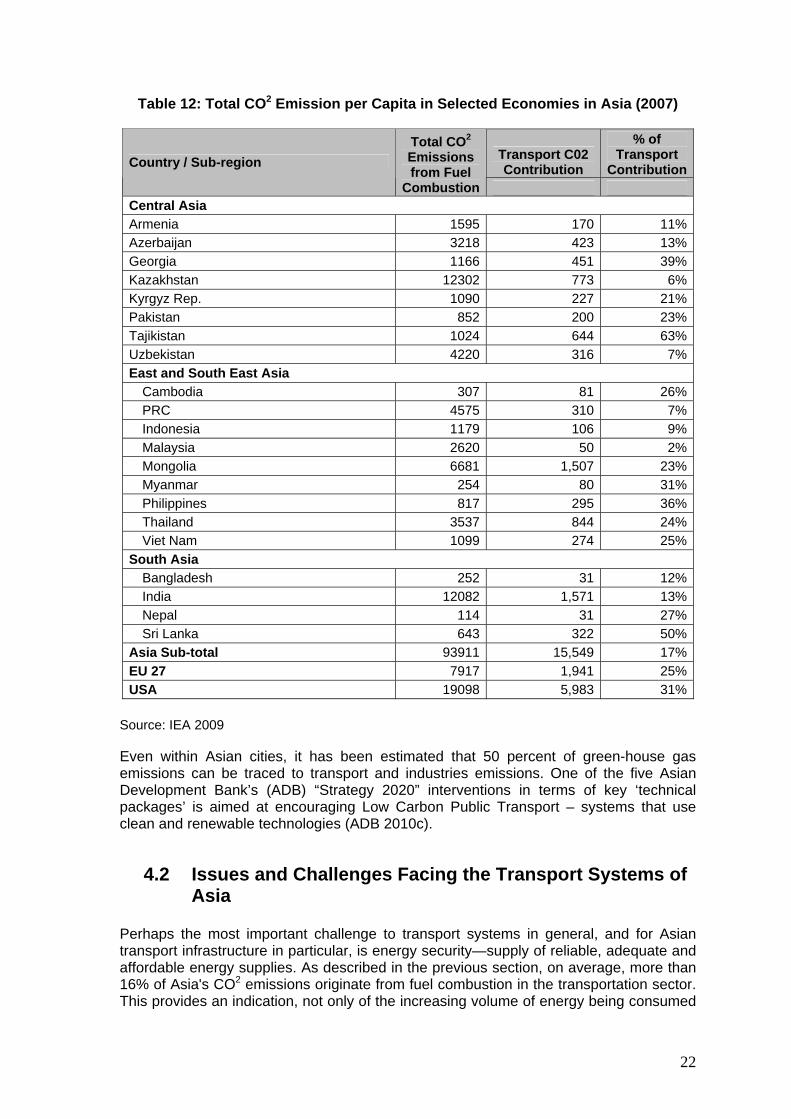
4.1 Transport, Environment and Climate Change The present pattern of development in transport infrastructure is expected to have a strong impact on emissions. Transportation activities account for 52% of total oil consumption; motorization is one of the major driving forces behind petroleum consumption (Rodrigue 2004).The resulting increase in GHG emissions from the transportation sector in Asia, is thus raising environmental concerns. Energy efficiency offers the biggest scope for cutting emissions. Energy-efficiency investments in buildings, industry and transport usually have a short payback period and negative net abatement costs, as fuel-cost savings over the lifetime of the capital stock often outweigh the additional cost of the efficiency measure, even when the future savings are discounted. Measures in the transport sector to improve fuel economy, expand bio-fuels and promote the uptake of new vehicle technologies - notably hybrid and electric vehicles – result in a large reduction in oil demand (IEA-WEO 2009). Table 12 shows that the contribution of the transportation sector to CO2 per-capita emissions is significant in Asian countries. Moreover, transportation consumes a large chunk of fuel consumption, particularly in Central Asia (e.g. Georgia, Tajikistan), South East Asia and some South Asian Economies (e.g. Sri Lanka)
22
Table 12: Total CO2 Emission per Capita in Selected Economies in Asia (2007)
Transport C02 Contribution
% of Transport
ContributionCountry / Sub-region Total CO2 Emissions from Fuel
Combustion Central Asia Armenia 1595 170 11%Azerbaijan 3218 423 13%Georgia 1166 451 39%Kazakhstan 12302 773 6%Kyrgyz Rep. 1090 227 21%Pakistan 852 200 23%Tajikistan 1024 644 63%Uzbekistan 4220 316 7%East and South East Asia
Cambodia 307 81 26%PRC 4575 310 7%Indonesia 1179 106 9%Malaysia 2620 50 2%Mongolia 6681 1,507 23%Myanmar 254 80 31%Philippines 817 295 36%Thailand 3537 844 24%Viet Nam 1099 274 25%
South Asia Bangladesh 252 31 12%India 12082 1,571 13%Nepal 114 31 27%Sri Lanka 643 322 50%
Asia Sub-total 93911 15,549 17%EU 27 7917 1,941 25%USA 19098 5,983 31%
Source: IEA 2009 Even within Asian cities, it has been estimated that 50 percent of green-house gas emissions can be traced to transport and industries emissions. One of the five Asian Development Bank’s (ADB) “Strategy 2020” interventions in terms of key ‘technical packages’ is aimed at encouraging Low Carbon Public Transport – systems that use clean and renewable technologies (ADB 2010c).
4.2 Issues and Challenges Facing the Transport Systems of Asia
Perhaps the most important challenge to transport systems in general, and for Asian transport infrastructure in particular, is energy security—supply of reliable, adequate and affordable energy supplies. As described in the previous section, on average, more than 16% of Asia's CO2 emissions originate from fuel combustion in the transportation sector. This provides an indication, not only of the increasing volume of energy being consumed
23
for road, rail and air transportation, but also points to the broader issues of energy security, particularly environment-friendly or green energy supply and managing energy demand through energy efficiency.
4.2.1 Energy Security Attaining energy security encompasses a broad range of socio-economic and geopolitical factors that include: (i) Reducing reliance on foreign sources of energy with the geopolitical risk of
stability of oil supplying nationas; (ii) Addressing the impact of depletion of petroleum other fossil fuel deposits; (iii) Facilitating effective cross-border trade of energy from energy surplus countries
to energy deficit countries; (iv) Meeting energy needs of poorer countries, and demands from fast emerging
developing countries such as large economies of the PRC India and Indonesia; (v) Enhancing economic efficiency versus population growth debate; (vi) Addressing environmental impact of energy production, in particular climate
change; and, (vii) Developing cost-effective renewable and other alternative green energy
sources.9 In the 1970s, North America consumed twice as much oil as Asia. Since 2005, Asia's oil consumption exceeded North America's. World demand for oil has grown by 7 million barrels per day since 2000; of this growth, 2 million barrels each day have gone to the PRC. As late as 1993, PRC was self-sufficient in oil. Since then its GDP has almost tripled and its demand for oil has more than doubled. This is equivalent to 7.8 million barrels of imported oil per day (Yergin 2006). One of the solutions to the energy security conundrum– still being discussed by Asian countries – is the creation of a sustainable and flexible energy system (SAFE) for the region. The second round table conference (December 2005, New Delhi) brought together oil-producing countries including Russia, Turkey, Uzbekistan, Kazakhstan and Azerbaijan in dialogue with the principal Asian consumer nations - PRC, Japan, ROK and India. An Inter-Asia Oil and Gas Transportation System, was proposed since two thirds of oil supplies in West Asia and Southeast Asia are bound for the markets of Turkey, India, PRC, ROK, Japan and other consumption centers in Asia (Srivastava 2005). The energy efficiency in transport sector such as efficient vehicles through increased investment in research and development for appropriate technology should be the top priority for the Asian economies for achieving energy security and sustainable transport development. Innovative technology for increasing efficiency of car engines, cost effective electric and hybrid vehicles; and hydrogen fuel cells can play an important role in this regard.
4.3 Transport Policies in Selected Asian Countries Many countries in Asia have already started taking proactive measures to minimize the impact of their rapid economic growth and infrastructure development, on the
9 Based on Shah (2010)
24
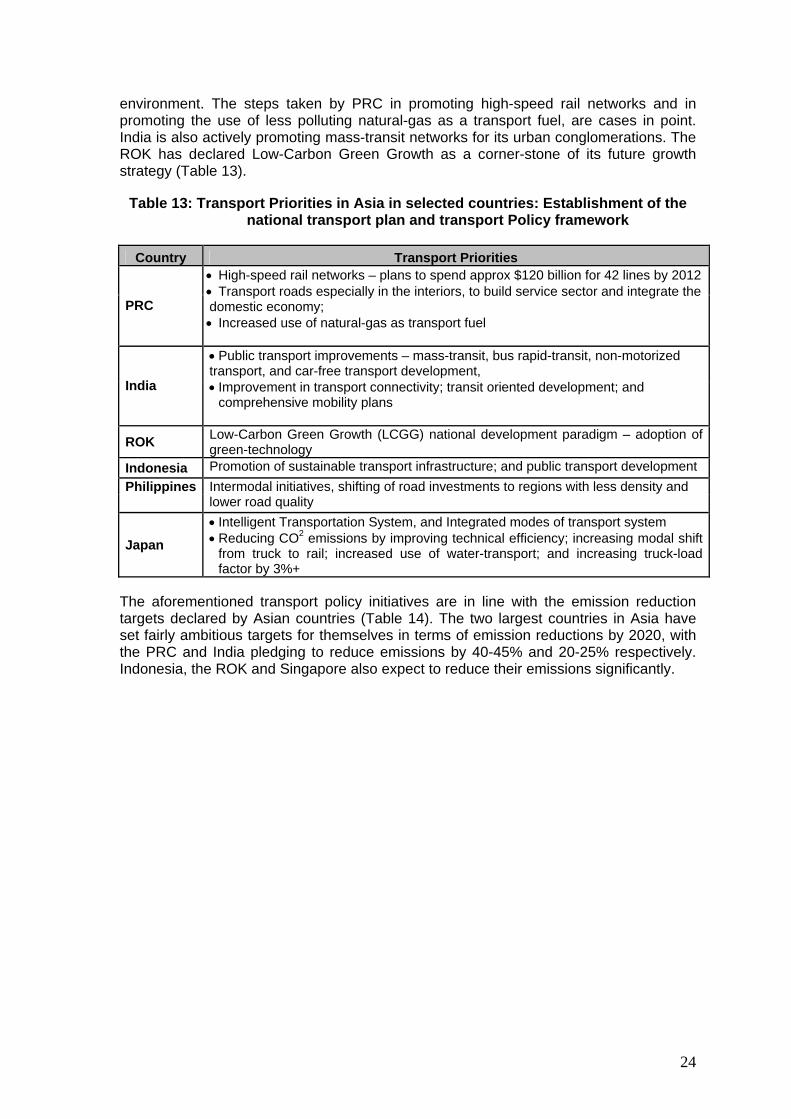
environment. The steps taken by PRC in promoting high-speed rail networks and in promoting the use of less polluting natural-gas as a transport fuel, are cases in point. India is also actively promoting mass-transit networks for its urban conglomerations. The ROK has declared Low-Carbon Green Growth as a corner-stone of its future growth strategy (Table 13).
Table 13: Transport Priorities in Asia in selected countries: Establishment of the national transport plan and transport Policy framework
Country Transport Priorities
PRC
• High-speed rail networks – plans to spend approx $120 billion for 42 lines by 2012 • Transport roads especially in the interiors, to build service sector and integrate the domestic economy; • Increased use of natural-gas as transport fuel
India
• Public transport improvements – mass-transit, bus rapid-transit, non-motorized transport, and car-free transport development, • Improvement in transport connectivity; transit oriented development; and
comprehensive mobility plans
ROK Low-Carbon Green Growth (LCGG) national development paradigm – adoption of green-technology
Indonesia Promotion of sustainable transport infrastructure; and public transport development Philippines Intermodal initiatives, shifting of road investments to regions with less density and
lower road quality
Japan • Intelligent Transportation System, and Integrated modes of transport system • Reducing CO2 emissions by improving technical efficiency; increasing modal shift
from truck to rail; increased use of water-transport; and increasing truck-load factor by 3%+
The aforementioned transport policy initiatives are in line with the emission reduction targets declared by Asian countries (Table 14). The two largest countries in Asia have set fairly ambitious targets for themselves in terms of emission reductions by 2020, with the PRC and India pledging to reduce emissions by 40-45% and 20-25% respectively. Indonesia, the ROK and Singapore also expect to reduce their emissions significantly.

25
Table-14: Voluntary Pledges made in Copenhagen as nationally Appropriate Mitigation Actions
Country Emission reduction target by 2020, and mitigation actions Base Year
PRC
-Endeavor to lower CO2 emissions per unit of GDP by 40-45% by 2020 through - Increase the share of non fossil fuels in primary energy consumption to 15% - Increase forest coverage by 40 million hectares - Forest stock volume by 1.3 billion m3, etc
2005
India Endeavor to reduce the emission intensity of its GDP by 20-25% 2005
Indonesia 26% through 1) Sustainable peat land management, 2) Reduction in rate of deforestation and land degradation, 3) Development of carbon sequestration projects in Forestry and Agriculture, and 4) Promotion of energy efficiency etc
n/a, BAU
ROK 30% reduction n/a, BAU Singapore 16% reduction n/a, BAU
Note: BAU – Business As Usual and n/a not available Source: UNFCCC http://unfccc.int/): Republic of Korea: Korea Energy Management Corporation
2010; Singapore: Ministry of Environment and Water Resources, Singapore 2007, http://app.mewr.gov.sg/web/Common/homepage.aspx.
5 DEVELOPING SUSTAINABLE TRANSPORT CONNECTIVITY: PROSPECTS AND CHALLENGES
Appropriate innovative and cost effective technology will play a crucial role in developing sustainable, environment-friendly transport by effective management of demand and supply through electric and other green vehicles and producing green energy as well achieving higher energy efficiency. Advanced economies with appropriate technology can assist developing emerging economies with a prospect of large transport demand through technology and knowledge transfer and investment. Bilateral, regional and global cooperation in green energy and green transport is fundamental for minimizing the adverse impact of transport on environment and climate change.
5.1 Comparison of Different Energy Sources – Coal, Nuclear, and Renewable Sources
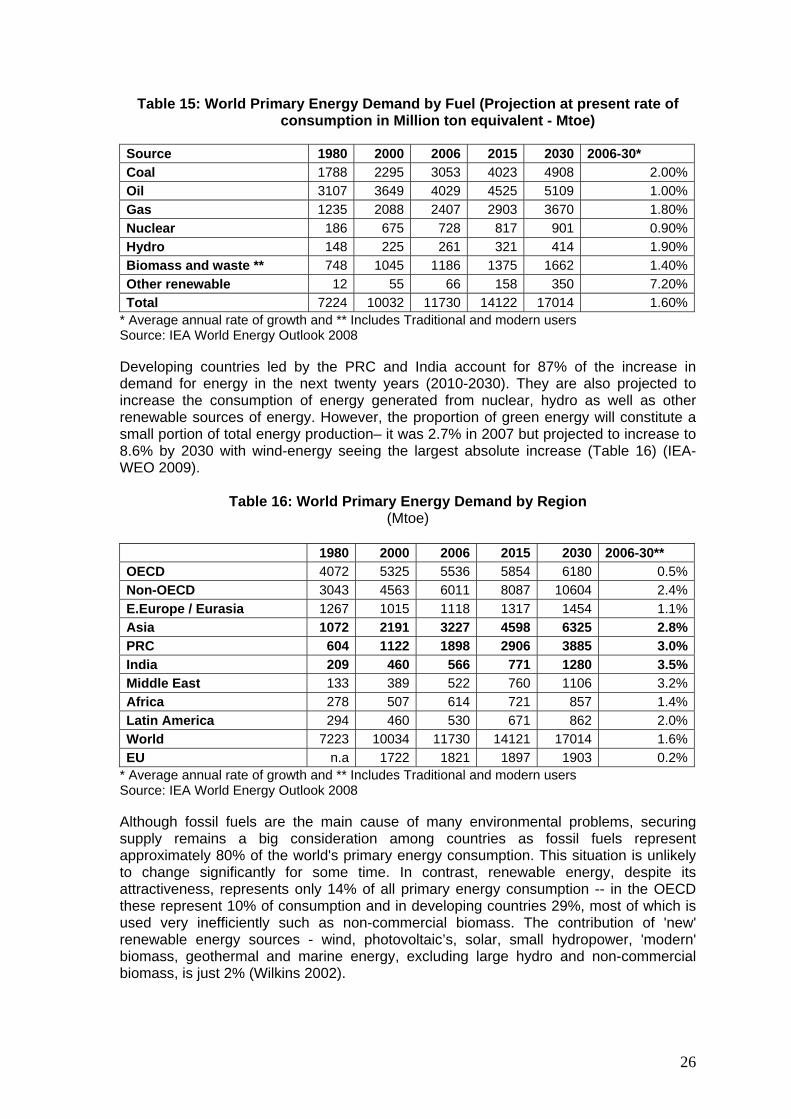
According to IEA's World Energy Outlook for 2008, world primary energy demand was expected to increase by 45% between 2006 and 2030 at an annual growth rate of 1.6% (Table 15). Even though most of the increase in demand comes from the power-generation sector through the rising demand for coal, the dominant fuel in the primary energy mix remains oil. Similarly, the demand for natural gas was expected to increase at 1.8% per annum. The Middle East, developing Asian countries and the OECD will see the biggest increases in natural gas demand. (IEA-WEO 2008).
26
Table 15: World Primary Energy Demand by Fuel (Projection at present rate of consumption in Million ton equivalent - Mtoe)
Source 1980 2000 2006 2015 2030 2006-30* Coal 1788 2295 3053 4023 4908 2.00%Oil 3107 3649 4029 4525 5109 1.00%Gas 1235 2088 2407 2903 3670 1.80%Nuclear 186 675 728 817 901 0.90%Hydro 148 225 261 321 414 1.90%Biomass and waste ** 748 1045 1186 1375 1662 1.40%Other renewable 12 55 66 158 350 7.20%Total 7224 10032 11730 14122 17014 1.60%
* Average annual rate of growth and ** Includes Traditional and modern users Source: IEA World Energy Outlook 2008 Developing countries led by the PRC and India account for 87% of the increase in demand for energy in the next twenty years (2010-2030). They are also projected to increase the consumption of energy generated from nuclear, hydro as well as other renewable sources of energy. However, the proportion of green energy will constitute a small portion of total energy production– it was 2.7% in 2007 but projected to increase to 8.6% by 2030 with wind-energy seeing the largest absolute increase (Table 16) (IEA-WEO 2009).
Table 16: World Primary Energy Demand by Region (Mtoe)
1980 2000 2006 2015 2030 2006-30** OECD 4072 5325 5536 5854 6180 0.5%Non-OECD 3043 4563 6011 8087 10604 2.4%E.Europe / Eurasia 1267 1015 1118 1317 1454 1.1%Asia 1072 2191 3227 4598 6325 2.8%PRC 604 1122 1898 2906 3885 3.0%India 209 460 566 771 1280 3.5%Middle East 133 389 522 760 1106 3.2%Africa 278 507 614 721 857 1.4%Latin America 294 460 530 671 862 2.0%World 7223 10034 11730 14121 17014 1.6%EU n.a 1722 1821 1897 1903 0.2%
* Average annual rate of growth and ** Includes Traditional and modern users Source: IEA World Energy Outlook 2008 Although fossil fuels are the main cause of many environmental problems, securing supply remains a big consideration among countries as fossil fuels represent approximately 80% of the world's primary energy consumption. This situation is unlikely to change significantly for some time. In contrast, renewable energy, despite its attractiveness, represents only 14% of all primary energy consumption -- in the OECD these represent 10% of consumption and in developing countries 29%, most of which is used very inefficiently such as non-commercial biomass. The contribution of 'new' renewable energy sources - wind, photovoltaic’s, solar, small hydropower, 'modern' biomass, geothermal and marine energy, excluding large hydro and non-commercial biomass, is just 2% (Wilkins 2002).

27
In the IEA projection there is, however, one positive aspect with regard to transportation as a final-use sector. Compared to the earlier years (1980-2006) when the fuel demand rose by 2.3% annually, fuel demand In the projected period of 2006-2030 is expected to decline to 1.5% annually on account of improved fuel efficiency of vehicle fleets (IEA-WEO 2010).
5.2 Role of Resource Efficiency in Achieving Sustainable Infrastructure
The concept of sustainable/ green infrastructure is closely linked to increasing awareness of the vulnerability of our natural environment to the pulls created by development pressure. This awareness of vulnerability comes from a growing realization that a more efficient utilization of available resources not only reduces environmental pollution but can also lead to improved performance and reduced costs. Efficiency – doing more with less for longer – has one of the best rates of return of any sustainability investment. This is because it is less expensive not to use as much energy, water and materials, all of which add to the costs of a business or any organization (TNEP 2010). Kuhndt et al. (2007) observes that policy-makers around the world have initiated activities to reduce resource use, while at the same time, increasing economic and social well-being, a vision that is related to the notion of ‘Resource Efficiency (RE)’ or ‘Sustainable Consumption and Production (SCP). The commitment of governments under the Marrakech Process 10 for the development of a “10-year framework of programs in support of regional and national initiatives to accelerate the shift towards sustainable consumption and production, in line with the Johannesburg Plan of Implementation”, presents a global effort to reorient global development on a sustainable path. Resource efficiency starts from the broad material flows that are the basis of our society, instead of focusing on the various specific environmental impacts like air and water pollutants (Weizsacker, Lovins and Lovins 1995). It can also be used a tool for greening businesses and promoting “Green Growth”, a concept pioneered by UN ESCAP and embraced by a broad range of policy-makers in the Asia-Pacific region (Kuhndt 2007). Green Growth is also the main theme of the Seoul Initiative Network on Green Growth (SINGG), proposed by the Ministry of Environment of the ROK at the fifth Ministerial Conference on Environment and Development in Asia and the Pacific 2005 (MECD 2005) and endorsed by the 61st Commission Session of UNESCAP, held in May 2005. The aim of SINGG is to address major policy issues for Green Growth highlighted by the Ministerial Declaration of MCED 2005 and the Regional Implementation Plan for Sustainable Development in Asia and the Pacific, 2006-2010. Guided by a vision to achieve environmentally sustainable economic growth in the Asia and Pacific region by promoting effective environmental policies, it targets – (i) Improving eco-efficiency for environmental sustainability,(ii) Enhancing environmental performance, and (iii) Promoting the environment as an opportunity for economic growth and development(MECD 2005).. The aforementioned Marrakech Process has drawn strong interest from governments for the development of SCP programs. In response to this, the United Nations Environment
10 The Marrakech Process is a global process to support the elaboration of a 10-Year Framework of Programs (10YFP) on sustainable consumption and production, as called for by the WSSD Johannesburg Plan of Action. Details at UN-DESA website - http://esa.un.org/marrakechprocess/
28
Program (UNEP) has not only published a set of SCP guidelines (Planning for Change, 2008) but also an online clearing house that gathers the experiences of more than 30 countries that have developed or are developing national programs on SCP and RE (UNEP 2009). In order to illustrate ways to integrate SCP approaches and tools into wider policies, strategies and initiatives—a process known as mainstreaming - UNEP also illustrates how it is being used for infrastructure connectivity programs in the transportation sector:
(i) The cities of Curitiba in Brazil and Bogota in Colombia, as well as many Chinese
cities, have or are planning integrated rapid transport systems. Such systems aim to provide better transport service than regular bus systems through such mechanisms as dedicated lanes on roads, prepayment of fares to reduce driver time in fare collection, and more frequent and express services.
(ii) Various countries have public transport systems that run partially or entirely on fuels other than petrol and diesel. Many of the buses in Brazil operate on a blend of bio-diesel, alcohol and diesel fuels; many of the public buses in Johannesburg, South Africa, operate on natural gas (UNEP, 2009).
Compressed Natural Gas (CNG) is also gaining popularity in Asia, not only as a cheaper fuel compared to diesel or petrol, but also for being relatively environment friendly in terms of GHG emissions. In India’s capital city New Delhi, sustained pressure from the judiciary since 1990 resulted in the conversion of the entire fleet of public transport buses to CNG. By August 2001, Delhi had the largest fleet of CNG buses in the world. There were 2,394 buses, over 27,000 autos and 14,000 other vehicles running on CNG. This transformation has led to a sharp reduction in carbon-monoxide, sulfur-dioxide and lead-oxide levels and a consequent improvement in air quality in the capital city (UNEP 2006)
5.3 Policies for Demand and Supply Management Demand Side Management (DSM) has emerged as a potent tool in environmental policy since the 1990s. Utility-sponsored DSM measures now include financial incentives such as low-interest loans, rebates, subsidies to adopt energy efficient technologies. Recent studies show that the transport sector in developing countries exhibit the greatest potentials to make substantial energy savings – especially in countries that use two-and three-wheelers, such as India, Indonesia, Philippines, Thailand and Viet Nam. In large economies like the PRC and India, energy-saving potential for the transportation sector alone is 5-15% and 5-25% respectively (Gunatilake and Padmakanthi 2008) Rail and boat shipment of goods is substantially less energy intensive than shipment via trucking. In terms of energy use per ton-kilometer, freight movement by rail is at least two times as energy efficient as by truck in virtually all International Energy Agency (IEA) member countries11, and many times greater in some cases – especially in US, Denmark and Japan (IEA 1991). It has also been demonstrated more recently that rail transportation releases less than a fifth of the emissions per passenger-mile of those of automobiles and less than a fourth of those of airplanes. Air travel emissions are particularly damaging to the environment because the nitrogen oxides and water vapor they release magnify the global warming effect (Glaeser 2009). 11 IEA –has 28 member countries, mostly from Western Europe and North America. The only two Asian members are Japan and South Korea. Website - http://iea.org/about/membercountries.asp

29
“Intermodalism” or switching of some freight from trucks to more efficient modes of transport has been declining in a number of countries, despite its obvious benefits. There are a number of reasons: (i) Infrastructural: low accessibility of railway network, lack of depots and sidings,
and capacity restrictions on some routes in certain timings; (ii) Financial: high level of fixed costs, and low level of investment in infrastructure
and organization; (iii) Pattern of traffic flow: short average length of freight hauls in many countries, e.g.,
small average consignment size; (iv) Changing commodity mix: decline in sectors generating bulk, primary products
that have traditionally been moved by rail and boat; (v) Regulatory framework for intermodal competition - tougher regulations for rail
freight in taxation policy, excessive regulatory controls, among others; and, (vi) Industrial experience - negative view of rail freight, rooted in poor historical
service (IEA 1991). Policies aimed at demand and supply management in transport and energy for selected Asian countries are presented below.
5.3.1 People’s Republic of China The PRC is home to one-fifth of the world's population. In 2007, the country consumed about 2.7 billion tons of standard coal equivalents and emitted about 7.5 Giga-tons of GHG (Joerss 2010). It endorsed the Kyoto Protocol in 1997 after it exempted developing countries from adopting obligatory pollution-reduction commitments. Since then, it has become the largest beneficiary of the protocol's Clean Development Mechanism (CDM12), which, in 2006 alone, brought investment valued at nearly $3.0 billion into the PRC (Harris 2008). Being the biggest host country for CDM accounts for 53.8 percent of CDMs certified emissions reductions (CERs) - a form of emissions rights - and 36.8 percent of CDM projects (Sun-Jin 2010). The PRC's central government has for some time pushed industry to become more energy efficient. New legislation has been passed which encourages the adoption of more energy efficient technology for burning coal and for using petroleum-derived fuels for transport. It also enacted new taxes on transport fuels, and its 11th five-year plan, set forth in 2006, defined new limits on energy use. Its automobile fuel-efficiency standards, at least as stipulated in government regulations, are now ahead of those in most countries, most notably the US. (Harris 2008). In 2009, in the context of international talks to combat climate change, the PRC announced its target to reduce GHG emissions 40-45 percent per unit of GDP by 2020 from 2005 levels - a very ambitious target given the need for continued economic growth and increased living standards (Zhang 2010). The PRC's moderate levels of transport-related emissions reflects the current low penetration of motor vehicles - about 4 vehicles per 1000 people in 2008, compared to almost 60 vehicles in Japan and 80 in the United States. As economies and cities grow, so will household incomes and carbon emissions resulting from higher consumption, including additional cars. By 2030, two-thirds of the PRC's roughly 1.5 billion people will live in urban areas. To cope with that increase, PRC plans to build 50,000 new high-rise 12 Clean Development Mechanism (CDM) is one of the "flexibility" mechanisms defined in the Kyoto Protocol (IPCC, 2007).It is intended to achieve sustainable development by assisting parties in achieving compliance with their quantified emission limitation and reduction commitments in GHG emission caps. Website - http://cdm.unfccc.int/index.html
30
residential buildings and 170 new mass-transit rail and subway systems (Joerss 2010). The Chinese government has set a goal of reducing the country's energy intensity by 20% during the current five-year plan. The measures now envisioned include adopting stricter, high-efficiency building codes and higher fuel efficiency standards for vehicles, shuttering subscale capacity in energy-intensive sectors, and stepping up investments in renewable energy. Current efforts and recently enacted policies is estimated to reduce the country's energy intensity by 17% during every five-year interval from 2005 to 2030 (Joerss 2010). The PRC plans to spend about 120 billion dollars to nearly double the country's high-speed rail network to 42 lines by 2012, as part of an ambitious program to expand the national train system. On these lines, passenger trains would be able to travel at a maximum speed of 346 km/hour while fast freight trains would be able to move at 185 km/hour (Bradsher 2010). It currently has 6,920 km of high-speed lines in operation, (AFP 2010) but the governments envision expanding the network to cover 16000 km by 2020 and provide access to more than 90 percent of population (Financial Times 2010). Recently PRC has successfully launched the high-speed train between Beijing and Shanghai with a speed over 300 km per hour. The private sector too is playing a key role in the rapid growth of the clean-fuel sector in PRC. For example, the WNN Group, better known in for its subsidiary, XinAo Gas, is one of the country's first natural-gas distributors which have expanded operations to over 40 million people in 70 cities in PRC, which includes the supply of liquefied natural gas to filling stations in more than 20 Chinese Cities (Wang and Xu, 2008).
5.3.2 India India’s transport sector is large and diverse; it caters to the needs of 1.1 billion people. In 2007, the sector contributed about 5.5 percent to the nation’s GDP, with road transportation contributing the lion’s share. In 2007, Indian Railways carried about 17 million passengers and 2 million tones of freight a day while the country's roads carried almost 90 percent of the country’s passenger traffic and 65 percent of its freight (WB 2010). McKinsey Global Institute (MGI) (2010) estimates that, as Indian cities expand, urban areas will generate nearly 70 percent of the country’s GDP. Yet, it also points out that if current trends continue, the gap between supply and demand for private transportation will double to 440,000 lane kilometers, and for rail-based mass-transit, the gap will triple to 6,400 route kilometers, by 2030 (MGI 2010). The environmental impact of this sector is also quite substantial. Successive governments have been aware of the need to create more economical and energy efficient modes of transportation to cater to the needs of a growing population. During the Copenhagen Summit in December 2009, India declared its intention to reduce the country’s emission intensity of GDP by 20 – 25% from 2005 level. In July 2010, India's Ministry of Urban Development launched a novel Rupees. 1400 Crore (approximately US $300 million) green urban transport project called Sustainable Urban Transport Project (SUTP), with the support from the Global Environment Facility (GEF), the World Bank and UNDP. In general, the project deals with Sustainable Urban Transport (also called sustainable mobility). It mainly structures its work in terms of the following six key areas:
31
i) Institutional and policy orientation (such as, urban transport and urban policy, and
economic instruments); ii) Land use planning and transport demand management; iii) Transit, walking and cycling (e.g.,public transport improvements, mass transit, bus
rapid transit, non motorized transport, and car free development); iv) Vehicles and fuels (such as, CNG and roadworthiness) ; v) Environmental and health impacts; and vi) Social issues of urban transport and resources (SUTP 2010). Most of above key areas centre around or involve promoting ‘modal shifts’; that is, promoting alternatives to the use of private motor vehicles. The project aims to promote environmentally ‘sustainable’ and economically efficient modes of transport, such as public transport, walking and non-motorized transport, as alternatives to cars and motorcycles. Further, it promotes the integration of public transport with other modes in the overall urban fabric. Good integration in this context not only means well aligned timetables, convenience in transfer from one mode to another and one-stop-shop information systems but also integrated fares (without need to validate a new ticket when changing modes) and integration with land-use concepts. The issue of fuel and vehicle technologies is also crucial to any sustainable urban transport policy framework, but this issue already receives a high profile in existing initiatives involving information dissemination such as the Clean Air Initiative (see www.cleanairnet.org). The issue of modal shifts is also closely related to issues of equity (the lower income majority rely more on public and non-motorized transport), traffic congestion, efficiency of short trips, and general urban livability (SUTP 2010).
5.3.3 Republic of Korea In August 2008, ROK President Lee Myung-bak announced low-carbon green-growth (LCGG) as a national development paradigm, which is being promoted as a growth strategy combined with a job-creation policy. The LCGG strategy involves three strategic factors for sustainable growth. The first is sound economic growth with minimal use of energy and resources. The second is reduced CO2 emissions and environmental pollution with the same energy and resource use. The third is the creation of new growth through research and development in green technologies, with an aim of achieving early dominance in international markets (Sun-Jin 2010).
5.3.4 Japan Japan belongs to the so-called Annex I parties to the Kyoto Protocol, and therefore has an emission reduction target of 6 percent compared to 1990 emission levels. Currently, there are increased efforts to create a Northeast Asian carbon market among the PRC, Japan and the ROK. The PRC has the highest emission reduction potential, Japan has the greatest demand to purchase emission rights and ROK has a dual position as a source of both demand and supply of carbon emission rights (Sun-Jin 2010) Japan’s plan for reducing CO2 emissions includes a package of measures for freight shipping sector, e.g.: (i) Increasing modal shift from trucks to rail for shipments longer than 500 km from 40% to 50% through better facilities, and new terminals; (ii) Improving technical efficiency of each mode; (iii) Reducing inland transport distances through construction of eight new regional gateway ports for containers;

32
(iv) Improving truck load factors by at least 3%; and (v) Increased use of trailers and larger trucks, involving deregulation of gross vehicle-weight from 20 tons to a maximum of 25 tons for heavy duty trucks and 20 tons to 28 tons for semi-trailers (IEA 1991).
5.4 Role of Intelligent Transport System in Developing Efficient Transport Network
Application of advanced technologies to assist in the management of large public transport networks, and for dissemination of information of train and bus arrival, is collectively known as Intelligent Transport Systems (ITS). When applied carefully, ITS can make the transport system not only safer and more secure, but also more efficient and reduce environmental impacts (GTZ 2005). ITS has the potential to reduce the negative impact of regional transport infrastructure. With the expansion of road and rail networks in Asia, there is also an increasing incidence of traffic deaths per capita. For instance, the annual economic loss in the Greater Mekong Sub-region is estimated at nearly $5 billion per year, which is about 2% of the GDP of this region (ADB-JBIC-WB 2005). Therefore, apart from the environmental concerns from increased pollution and GHG emissions, there is also a substantial economic cost associated with traffic accidents in terms of lost time, damaged cargo and vehicles, injuries and death of human beings and livestock (Table 17). Time delays due to congestion in highways, sea ports, terminals, and custom clearance contributed to much higher cross-border trade costs in Asia. One solution to these problems is to increase the traffic capacity of existing road and rail networks, and the other is to simultaneously adopt ITS technologies that help in more efficient monitoring and management of traffic flows, and safety both within cities and countries, and across borders.
Table 17: Contribution of priority ITS user service bundles to desired outcomes
Priority user service bundle
Equitable access and improved mobility including demand management
Improved transport efficiency and productivity
Improved safety and security
Reduced environmental impact
Traffic (and transport) management to reduce the demand for motorized travel, and give priority to buses, NMV*s and pedestrians
Yes Yes Yes Yes
Traveler information Yes Yes Yes Some
Commercial vehicle fleet management Yes Yes Yes Yes
Public transport Yes Yes Yes Yes Electronic payment Yes Yes No Some
Safety and security including emergency management - Yes Yes -
*Non-Motorized Vehicle Source: GTZ 2005
33
ITS technologies can assist in implementing traffic restraint schemes such as application of road use charges levied in London and Singapore, and vehicle access management schemes used in several European cities such as Rome, Milan and Durham. Singapore’s road pricing scheme (ERP) has been operating since 1998. It is a part of the larger Integrated Transport Management System (ITMS, now renamed i-Transport) project which aims to integrate all it’s ITS, including obtaining real time travel information on the surface street system, the interface with car parks, mass transit, bus transport and the associated interchanges (GTZ 2005). As a tool for seamless sustainable infrastructure connectivity, ITS automated systems for fleet management to ensure that vehicles take the most efficient route thus saving fuel and green house emissions. Improved fuel economy, also reduces emissions such as particulates, carbon monoxide and hydrocarbons that affect human health, cause smog and damage the environment. ITS technologies may assist in moderating transport demands by encouraging increased public transport usage and higher vehicle occupancy (GTZ 2005). The use of ITS technologies, along with the harmonization and standardization of cross-border procedures (e.g., automatic vehicle registration) would help in improving the logistics systems in Asia’s sub-regions. Institutional barriers (soft infrastructure) rather more so than technical ones are major factors in the adoption of ITS technologies. Such things as intergovernmental relations, variable standards, a large number of suppliers (industry roll up has been slow to develop) and coordination between the public and private sectors impede the rate of adoption and thus the rate at which its benefits can be achieved. Thus the concepts of resource efficiency and green growth through the acquisitions, adaptation and development of appropriate and cost-effective ITS technology have a direct and growing relevance to seamless sustainable infrastructure connectivity in Asia and Pacific regions.
5.5 Role of Innovation in Sustainable Technology Technology is expected to have a very important role to play in developing sustainable transport connectivity. There are, of course, ongoing efforts to make available technology much more productive – solar cells that are more robust, versatile and efficient; wind-mills with better design and higher capacity, hybrid-vehicles, as well as electric batteries with better weight-to-output ratios and of course ITS. Taking into account the lower income levels in developing countries as well as emerging economies, the concept of “frugal innovation” involves the creation of new products and services without the heavy R&D investment seen in developed economies. This approach is led to the creation of the cheapest passenger car by the Tata Group in India – the “Nano” for just $2,200. Even multi-national companies like General Electric (GE) are utilizing the manpower and talent available in emerging economies to improve their range of products. General Electric, which is also a leading manufacturer of aircraft engines, is using advanced computer simulation facilities in India to develop more fuel efficient engines at a fraction of the original cost. These latest engines which will power the Boeing Dreamliner (GEnx-1B) and Boeing 747 (GEnx-2B) (Bhandari 2009) Increasing demand for environment-friendly sustainable transportation is also leading to radical new approaches to make transportation of passengers and freight much more efficient. Some of these new developments are:

34
(i) Guideways: A system of electrified guideways would allow dramatic increases in capacity and efficiency while freeing up valuable arable land. This system, using vehicle-to-vehicle and vehicle-to-guideway sensors, would enable freight and passenger vehicles to travel in tightly packed groups at high speeds. With a foot or so between vehicles, speeds could range from 60 miles per hour on urban routes to 200 miles per hour in rural areas. These speeds and density improvements allow for huge increases in efficiency (Saltz 2005).
(ii) Elevated Buses: the PRC's latest solution to its notorious traffic and road congestion combines the best features of subways and buses into a single mass-transportation vehicle that rides above traffic rather than in it. This eliminates the need to tunnel underground or build expensive bridges since these elevated buses straddle the road on rails and provide enough clearance for other vehicles on the road (except in some cases for large delivery trucks) to drive under. This strategy will allow the buses to travel faster than the speed of traffic without the need for dedicated lanes or structures. Construction of 115 miles of track will begin in Beijing's Mentougou district. (CNET 2010).
6. TOWARDS SUSTAINABLE TRANSPORTATION - ROLE OF REGIONAL INSTITUTIONS
Asia witnessed a few initiatives by regional institutions towards sustainable transportation. Some examples are highlighted below.
6.1 Environmentally Sustainable Transport (EST) The Asian EST Initiative is a joint initiative of UNCRD 13 and the Ministry of the Environment, Government of Japan. This Regional EST Forum provides a strategic and knowledge platform for sharing experiences and disseminating among Asian countries best practices, policy instruments, tools, and technologies. It comprises of - (i) High-level government representatives (from the Ministry of Environment, the
Ministry of Transport, and the Ministry of Health); (ii) A subsidiary group of experts in various thematic areas related to EST.
Participating countries include members of the Association of South-East Asian Nations (ASEAN), South Asian countries, Mongolia, the PRC, the ROK, and Japan, altogether twenty-two Asian countries.
So far, four Regional EST Forums have been organized in Japan (2005), Indonesia (2006), Singapore (2008) and ROK (2009). These meetings attempted to establish a common understanding across Asia on key elements needed for integrated strategies at the local and national levels to pursue a complementary package of public transport, quality footpaths and cycle ways, vehicle restriction measures, roadmap for emission standards and cleaner fuel, road safety, and gender considerations. At the most recent forum held in the ROK (Seoul, 24 to 26 February 2009) the recommendations called for the promotion of environmentally sustainable transport in Asia, in recognition of the fact that transport services affect all aspects of sustainability - social, economic, and environmental - and that there is a need for safe, clean, and energy-efficient transport in order to achieve green growth through low-carbon transport in Asia, the participants are thus called upon to: 13 United Nations Centre for Regional Development. Website - http://www.uncrd.or.jp/

35
(i) Address transport issues with the broader environmental aims of green growth to encompass the transport-energy-carbon emission nexus, from energy consumption to the emissions and climate change perspectives;
(ii) Develop strategies for low-carbon transport including the increasing shift to energy-efficient and low carbon modes to mitigate the effects of transport on climate, and the effects of climate change on transport services and other socioeconomic sectors;
(iii) Focus on sustainable mobility and transport demand management (TDM) tools and measures [such as – parking controls (including parking charges and pricing), road pricing and congestion charging, fuel and vehicle taxation, low and zero emission zones, car-free day, city centre pedestrianization, public transport priority and improvement measures, transit oriented development, appropriate road-space allocation to high-occupancy vehicles, efficient and affordable mass transit systems, and measures to help and develop non-motorized transport (walking and cycling). with stakeholder consultation and participation rather than relying only on end-of-pipe solutions, so that local air pollutants and GHG emissions from transport sector can be addressed concurrently and effectively, thereby contributing to materializing a Low Carbon Asian Society;
(iv) As much as possible, exploit benefits of adopting intelligent transport system (ITS), and of utilizing market mechanisms such as tax credits for environmentally friendly technologies, to make the transport services environment and people-friendly, cost effective as well as energy efficient;
(v) Develop city partnerships and collaboration across national boundaries within Asia and between Asian cities and cities from other regions for mutual technical assistance and cooperation on implementing environmentally sound practices in transport sector, including recognition of the special needs of the post conflict countries;
(vi) Strengthen regional cooperation, in particular among the international organizations and donors active in the region and member countries, to further improve and deepen the transport agenda at energy efficiency and climate change-related fora, including the Conference of Parties (COP), for achieving low-carbon society and green growth bearing in mind the ultimate objective of reducing global emissions under the UN Framework Convention on Climate Change (UNFCCC); and
(vii) Request international organizations and donor communities to mobilize necessary capacity building services and financial support to the developing member countries to enable them to overcome the complex technical barriers involved in developing transport projects for taking full benefit of the GHG market under the Clean Development Mechanism (CDM) stipulated by Kyoto Protocol14.
These recommendations reflect a sentiment that was expressed earlier by the Director of UNCRD, Mr. K. Onogawa – “While the developing nations in Asia are fast moving towards catching up with the motorization level of developed countries, only a small number of countries and cities have practically demonstrated innovative ways or introduced effective policies in addressing sustainability issues in the transport sector, which is recognized as the fastest-growing source of greenhouse emissions; however, the leaders of developing countries in Asia now have the great opportunity in their hands to leap-frog from a ‘business-as-usual transport’ to an ‘environmentally and people friendly transport’ without going through the traditional path of – grow now, clean up later – previously 14 For further details of the 4th Asian EST Summit, please refer to - http://www.uncrd.or.jp/env/4th-regional-est-forum/index_seoul_statement.htm
36
followed by many of the industrialized nations.” (UNCRD 2009)
6.2 Role of Multilateral Development Banks (MDBs) Asian Development Bank (ADB) Multilateral Development Banks (MDBs) like ADB have already taken steps to encourage sustainable transport projects through its Sustainable Transport Initiative (STI) with its own long-term strategic framework called ‘Strategy 2020’. ADB is currently investing $2.8 million to help develop Sustainable Urban Transport programs and projects in selected Asian cities. The objective is to develop energy-efficient, clean, and inclusive urban transport systems that ensure accessibility for all. It also plans to establish a Sustainable Transport Partnership Facility (STPF) to provide a mechanism for partners to provide financing and expertise to support innovative, environment-friendly approaches for meeting transport connectivity needs (ADB 2010a). ADB is encouraging governments to shift their strategy to address challenges of urban transportation. It is advocating an "avoid-shift-improve" approach to deal with urban gridlock. This involves developing an efficient land-use and transport system to help city dwellers avoid motor transport; a shift towards energy-efficient modes of travel, particularly public transport; and measures to improve vehicle and fuel technologies. The development of the "avoid-shift-improve" model was based on an analysis of four decades of empirical research on sustainable urban development and best practices from major cities around the world including Barcelona; Bogota; Hong Kong, China; London; Seoul; and Singapore (ADB 2009d) The Asian Development Bank plans to finance clean energy projects across the region by selling a bond denominated in three currencies to Japanese retail investors. The uridashi bond, as foreign-currency bonds sold to Japanese individuals are known, will be denominated in four tranches, one each in Australian dollars and Turkish Lira and two in Brazilian Real. This reflects a growing trend in ADB’s total investments related to clean energy - between 2005 and 2009 - its investment in this sector alone was over $5bn. ADB is now targeting $2bn a year in clean energy investments by 2013 focusing on renewable energy projects such as biomass, wind, solar, hydro and geothermal as well as on energy efficiency projects in industrial, commercial and residential sectors. ADB also plans to issue its inaugural Clean Energy Bonds to support its clean energy projects in Asia and the Pacific. It will carry tenors of between 4 and 7 years and will be issued in September 2010. ADB will provide assistance to clean energy projects in an amount at least equal to the amount raised by the Clean Energy Bond (ADB 2010d, Cookson 2010). Earlier, in May 2010, ADB had also announced its Asia Solar Energy Initiative (ASEI) to catalyze generation of about 3,000 megawatts of solar power over the next three years. ADB plans to provide $2.25 billion in finance to the initiative, which is expected to leverage an additional $6.75 billion in investments from others over the same period (ADB 2010d). ADB has also initiated a study this year to prioritize and conduct pre-feasibility studies for selected projects under Asian highway and railway projects to strengthen Pan-Asian connectivity as explained in Section 2.1. World Bank Another MDB, i.e. the World Bank (WB), considers transport as an access agenda with an aim to unlock growth and development potential. WB’s Transport Business Strategy for 2008-2012 underscores the need for ensuring safe (for health and for safety), clean (for air quality and for climate) and affordable (for businesses and for individuals)
37
transport. The Strategy has four main focuses: development impact, policies, modes and regions. The WB also takes into account the regional priorities. Key elements of these priorities for East Asia and the Pacific thrive for improving the capacity and quality of transport infrastructure, while for South Asia the priorities are directed towards enhancing regional connectivity for promoting regional and international trade as well as for developing micro-level transport infrastructure in both rural and urban South Asia (World Bank 2008). The Strategy provides a set of Strategic Directions: - Create the conditions for increased support for transport investment and governance; - Deepen engagement in the roads and highways subsector; - Increase engagement in the urban transport subsector; - Diversify engagement in transport for trade; and - Transport and climate change: control emissions and mitigate impact. In order to implement these strategic directions, the WB outlines four process adjustments: - Increase the proportion of Bank Group’s transport lending made through program approaches; - Enhance the quality of policy dialogue and sharing of transport knowledge; - Improve monitoring and evaluation; and - Capture synergies across sectors and Bank Group instruments (World Bank 2008).
7. CONCLUDING REMARKS Asia is expansive and its economies are characterized by their diversity. Asia needs to develop seamless transport connectivity for rebalancing its growth, for meeting huge basic infrastructure needs and for enhancing trade and economic integration to promote competitiveness and productivity by reducing trade and logistics costs, forming specialized industrials clusters, and enlarging and deepening production networks. Adequate transport connectivity will also help the Asian economies to balance existing disparities by spreading economic opportunities more widely and bring prosperity and harmony across communities, regions and classes of people both within a country and beyond borders. However, building this massive infrastructure needs to be environment-friendly, otherwise, it will have a possible overwhelming adverse impact on environment and climate change. Using the most conservative estimates, the investment requirement for new transport infrastructure at the national level is US$ 2.9 trillion over the next decade. One of the biggest challenges facing many developing countries in Asia is centered on the need to meet the huge financing needs of about US$263 billion per year for transport infrastructure development, during the period 2010-2020. The financing needs for sustainable transport connectivity will be much higher as the present cost of producing green energy and developing more green vehicles like railways is significantly higher than traditional energy production and road transport, respectively. At the same time, impact of the extensive transport infrastructure and resulting increase in the demand of movement of passenger and goods on environment and climate change will be huge unless, green and energy efficient vehicles and green sources of energy can be developed. Developing cost-effective innovative sustainable technology can play a significant role in this regard.
38
In view of rapid urbanization and increased purchasing power of the rising middle class of Asia, mass rail transit system in cities and high speed inter-city railway connections are crucial to reduce the demand on passenger cars, buses and air transport and resulting impact on climate change. Ideally, cities within a distance less than 500 kilometers should be connected by high speed railways to minimize pollution and GHG emissions generated by road- and air-travel. High-speed rail connections (Shinkansen) between Japanese cities have significantly reduced air-travel, in some cases discontinuation of flights. However, although such mass transit systems are desirable, their efficiency will be significantly reduced if other transport services, such as roads and highways, subways, airports and train stations are not properly integrated across the country. Asian economies need to take into consideration this aspect of transport services integration. There is an urgent need to develop a long-term comprehensive, consistent, multimodal and sustainable transport connectivity plans at the national, sub-regional and regional levels. These plans should identify and plan the development of appropriate transport corridors and converting them to economic corridors across major cities and business centers as well as neighboring towns and villages for Asian connectivity and economic growth. These can assist in narrowing the development gap among and within countries by further integrating East Asia’s production network and supply chain and forming new industrial clusters and agglomerations. Transport connectivity is a basic necessity for developing economies for sustaining growth and development. However, there are several socio-economic problems associated with connectivity in terms of affordability and access to the poorest section of the society and poor countries. Even though the present scenario is skewed towards transportation modes that are polluting, rail is a better option to road, sea or air travel if the production of electricity is primarily green. Green connectivity has higher adoption costs; however it is vital to adopt it – not only for the benefit of developing countries but also for a cleaner regional and global environment. The major challenge for Asia is to mobilize various available resources to finance “bankable” infrastructure projects and ensuring strong coordination and cooperation among various stakeholders at the national, sub-regional and regional level. This calls for an appropriate comprehensive strategy and mechanism to infrastructure development to facilitate regional infrastructure connectivity. This approach should address the need for the identification and preparation of priority bankable projects pipeline through a project development mechanism or framework under a Pan-Asia Infrastructure Forum (see ADB/ADBI, 2009 and Bhattacharyay, 2010 for more details). It also requires development of innovative financing mechanism and modalities, as well as policy, regulation and capacity development (through human capital and institutional development) for participating countries. The capacity development for less developed countries is very important as the regional infrastructure performance is only as strong as its weakest link or weakest participating country. In order to attract finance, particularly from the private sector, there is a need to translate this huge transport demand into bankable, commercially viable and profitable projects. Individual countries need to mobilize domestic resources for infrastructure development. However, low-income countries may be more dependent on regional and international capital markets and donors (including bilateral and multilateral development banks) for additional financing, particularly concessional financing. In order to make the transport connectivity sustainable, Asia needs to enhance its production of green energy, particularly renewable energy. Asian economic diversity in
39
energy sources creates large potential for regional energy production and trade between energy resource surplus and deficient countries. Energy surplus countries, such as Nepal, Bhutan, Myanmar, and Lao PDR; and Central Asian countries can supply clean hydropower or natural gas to energy deficient countries in the region, such as PRC, Bangladesh, India, Pakistan, Thailand, and Viet Nam. There is an urgent need for regional cooperation in planning and implementing environment-friendly regional transport projects as envisaged under AH, TAR, GMS and CAREC. In the face of the global financial crisis and resulting economic downturn, it is imperative to have greater coordination of stimulus packages’ in infrastructure investment in transport, to ensure cross-border projects are efficiently developed for enhancing regional connectivity. It is to be noted that “business as usual” in developing essential transport connectivity could be highly expensive in the long run due to the inevitable increase in transport infrastructure demand leading increased adverse impact on environment. This calls for the development, dissemination or transfer and adoption of innovative cost-effective green technology. Advanced economies such as Japan, ROK and Singapore have already developed several green technologies but these are quite expensive for developing countries. PRC and India are developing cost-effective green technologies. Appropriate regional cooperation for green technology and knowledge transfer and investment among Asian economies is crucial for developing sustainable connectivity. Effective transport demand and supply management is necessary for the development of sustainable transport connectivity. Asian economies should share their experience and best practices in areas such as role of ITS, affordable and energy efficient electric and CNG-based vehicles; green electricity production, managing peak transport demand and demand of passenger vehicles, pricing policy, mass city-transport management among others (GTZ 2005, ADB 2005, CNET 2010). Creating a pan-Asia fund for developing sustainable regional transport infrastructure and a pan-Asian sustainable transport development cooperation framework are essential. To achieve a sustainable and seamless transport network, Asia needs to formulate and implement a comprehensive and consistent transport strategy at the national, sub-region and regional levels linked to a comprehensive energy strategy. In order to encourage the rising trends in innovations emerging from Asia, it might be worthwhile to consider setting up an Asia Infrastructure Green Fund (AIGF) in the line of Asia Infrastructure Fund15 to mobilize international funds (public and private) and help prioritize, prepare and finance “bankable” regional transport projects using appropriate environmentally-friendly green technology. The fund could also assist developing Asian countries in acquisition, development, adoption and commercialization of appropriate technology for developing energy efficient and green vehicles and for reducing the impact of transport on carbon emission. Multilateral Development Banks (MDBs) and Bilateral Development Banks (BDBs) like Japan International Cooperation Agency (JICA) play an important role in reducing gaps in funding when private sector funds do not meet financing needs. ADB has been a reliable source of funds for a large and broad variety of development projects in Asia, including cross-border infrastructure. MDBs can both create “green” and resource-efficient bankable projects and mobilize long-term funding through capital markets, explicit guarantees, and special co-financing arrangements. In this context, ADB’s Sustainable Transport Partnership Facility (STPF) would be able to provide a mechanism for partners to provide financing and expertise to support innovative, 15 Adapted from Bhattacharyay (2010) where an Asian Infrastructure Fund (AIF) had been recommended.
40
environment-friendly solutions to overcome constraints in developing seamless sustainable transport connectivity in the Asia and the Pacific region.
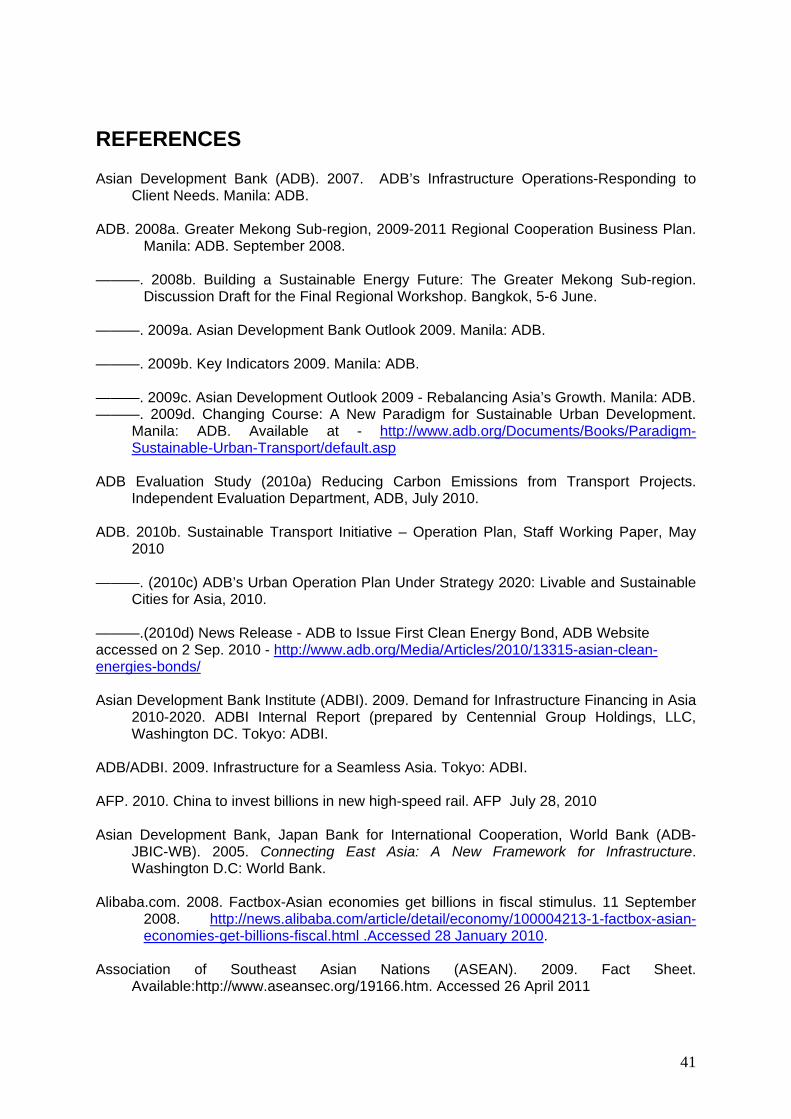
41
REFERENCES Asian Development Bank (ADB). 2007. ADB’s Infrastructure Operations-Responding to
Client Needs. Manila: ADB. ADB. 2008a. Greater Mekong Sub-region, 2009-2011 Regional Cooperation Business Plan.
Manila: ADB. September 2008. ———. 2008b. Building a Sustainable Energy Future: The Greater Mekong Sub-region.
Discussion Draft for the Final Regional Workshop. Bangkok, 5-6 June. ———. 2009a. Asian Development Bank Outlook 2009. Manila: ADB. ———. 2009b. Key Indicators 2009. Manila: ADB. ———. 2009c. Asian Development Outlook 2009 - Rebalancing Asia’s Growth. Manila: ADB. ———. 2009d. Changing Course: A New Paradigm for Sustainable Urban Development.
Manila: ADB. Available at - http://www.adb.org/Documents/Books/Paradigm-Sustainable-Urban-Transport/default.asp
ADB Evaluation Study (2010a) Reducing Carbon Emissions from Transport Projects.
Independent Evaluation Department, ADB, July 2010. ADB. 2010b. Sustainable Transport Initiative – Operation Plan, Staff Working Paper, May
2010 ———. (2010c) ADB’s Urban Operation Plan Under Strategy 2020: Livable and Sustainable
Cities for Asia, 2010. ———.(2010d) News Release - ADB to Issue First Clean Energy Bond, ADB Website accessed on 2 Sep. 2010 - http://www.adb.org/Media/Articles/2010/13315-asian-clean-energies-bonds/ Asian Development Bank Institute (ADBI). 2009. Demand for Infrastructure Financing in Asia
2010-2020. ADBI Internal Report (prepared by Centennial Group Holdings, LLC, Washington DC. Tokyo: ADBI.
ADB/ADBI. 2009. Infrastructure for a Seamless Asia. Tokyo: ADBI. AFP. 2010. China to invest billions in new high-speed rail. AFP July 28, 2010 Asian Development Bank, Japan Bank for International Cooperation, World Bank (ADB-
JBIC-WB). 2005. Connecting East Asia: A New Framework for Infrastructure. Washington D.C: World Bank.
Alibaba.com. 2008. Factbox-Asian economies get billions in fiscal stimulus. 11 September
2008. http://news.alibaba.com/article/detail/economy/100004213-1-factbox-asian-economies-get-billions-fiscal.html .Accessed 28 January 2010.
Association of Southeast Asian Nations (ASEAN). 2009. Fact Sheet.
Available:http://www.aseansec.org/19166.htm. Accessed 26 April 2011

42
———. (2010) ASEAN Transport Action Plan 2005-2010. http://www.aseansec.org/16596.htm. Accessed 20 October 2010
ASEAN Center for Energy. 2005. ASEAN Plan of Action for Energy Cooperation (APAEC)
2004-2009. Available: http://www.aseanenergy.org/ace/work_programme.htm. Accessed 20 October 2010
Bhandari, B. 2009. Frugal Innovation, Business Standard, 13 June 2009. Available :
http://www.business-standard.com/india/news/frugal-innovation/360886/. Accessed 2 September 2010
Bhattacharyay, B. N. 2008. Demand for Regional Infrastructure in Asia and the Pacific:
2010–2020. Background paper prepared for ADB/ADBI Flagship Study, “Infrastructure for a Seamless Asia”. Tokyo: ADBI.
Bhattacharyay, B. N. 2010. Institutions for Asian Connectivity, No. 220, ADBI Working Paper, June, Tokyo
Bradsher, K. 2010. China Sees Growth Engine in a Web of Fast Trains. New York Times, 12
February 2010. - http://www.nytimes.com/2010/02/13/business/global/13rail.html?_r=1&pagewanted=all. Accessed 18 August 2010
Centennial Group Holdings. 2009. Estimating Infrastructure Demand for Asia and the Pacific
2010-2020. ADBI commissioned report. Tokyo: ADBI. Cookson, R. 2010. ADB Plans Triple Currency Bond, Financial Times, London,
http://www.ft.com/cms/s/0/6305cc6c-b5ea-11df-a048-00144feabdc0.html. Accessed 2 September 2010
Commission on Growth and Development. 2008. The Growth Report: Strategies for
Sustained and Inclusive Growth. Washington D.C.: World Bank. CNET. 2010. China’s Elevated Bus Drives Above Cars. CNET Technology Reviews, 4
August 2010. http://reviews.cnet.com/8301-13746_7-20012633-48.html. Accessed 30 August 2010
Department for International Development (DFID). 2005. Provision of Infrastructure in Post
Conflict Situations http://www.ti-up.org/uploads/public/documents/Key%20Documents/Infrastructure%20in%20Post%20Conflict.pdf. Accessed 4 November 2010
Dicky, C.; McNicoll, T. 2010. Environment & Aviation: The Flying Prius. Newsweek 26 July
2010 Economy Watch. 2010. South Korea Economic Stimulus.
http://www.economywatch.com/economic-stimulus/world-economic-stimulus/south-korea.html. Accessed 23 August 2010
Financial Times. 2010. Beijing reviews high-speed rail plans. 7 November 2010. Foreign Affairs and International Trade Canada (FAITC). 2009. Worldwide inventory of
infrastructure spending plans. 21 January 2009. http://www.international.gc.ca/canadexport/articles/90121h.aspx. Accessed 28 January 2010
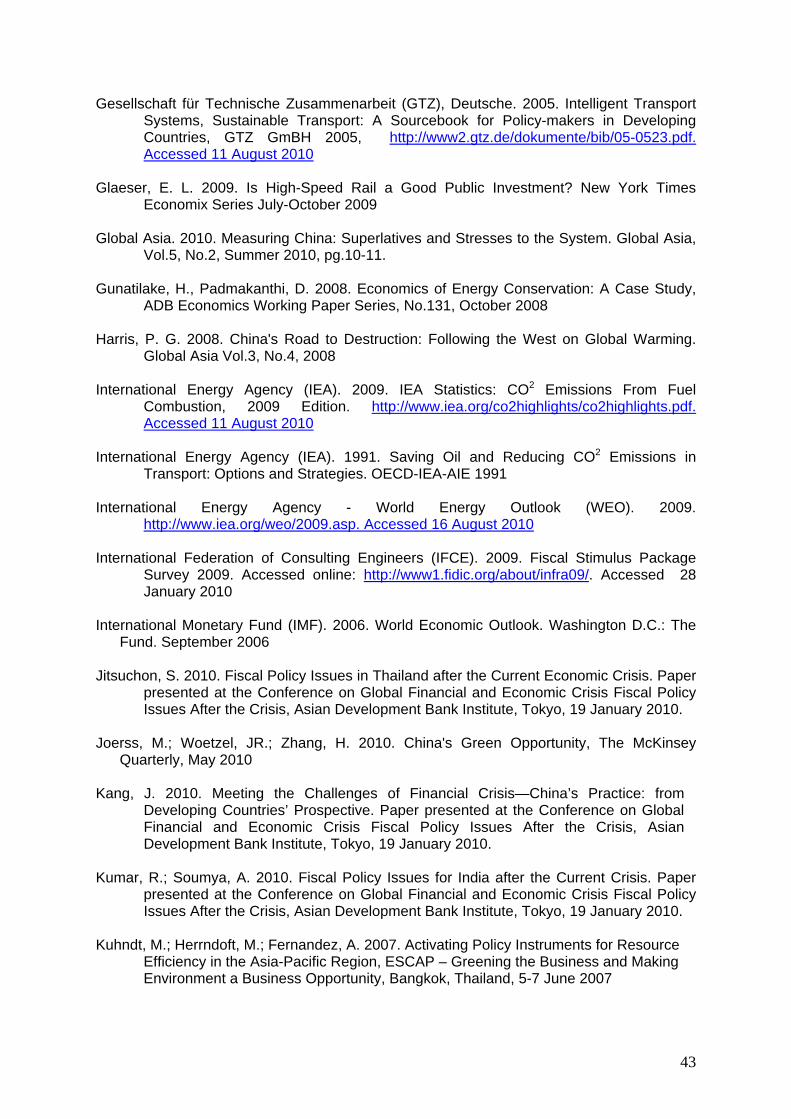
43
Gesellschaft für Technische Zusammenarbeit (GTZ), Deutsche. 2005. Intelligent Transport Systems, Sustainable Transport: A Sourcebook for Policy-makers in Developing Countries, GTZ GmBH 2005, http://www2.gtz.de/dokumente/bib/05-0523.pdf. Accessed 11 August 2010
Glaeser, E. L. 2009. Is High-Speed Rail a Good Public Investment? New York Times
Economix Series July-October 2009 Global Asia. 2010. Measuring China: Superlatives and Stresses to the System. Global Asia,
Vol.5, No.2, Summer 2010, pg.10-11. Gunatilake, H., Padmakanthi, D. 2008. Economics of Energy Conservation: A Case Study,
ADB Economics Working Paper Series, No.131, October 2008 Harris, P. G. 2008. China's Road to Destruction: Following the West on Global Warming.
Global Asia Vol.3, No.4, 2008 International Energy Agency (IEA). 2009. IEA Statistics: CO2 Emissions From Fuel
Combustion, 2009 Edition. http://www.iea.org/co2highlights/co2highlights.pdf. Accessed 11 August 2010
International Energy Agency (IEA). 1991. Saving Oil and Reducing CO2 Emissions in
Transport: Options and Strategies. OECD-IEA-AIE 1991 International Energy Agency - World Energy Outlook (WEO). 2009.
http://www.iea.org/weo/2009.asp. Accessed 16 August 2010 International Federation of Consulting Engineers (IFCE). 2009. Fiscal Stimulus Package
Survey 2009. Accessed online: http://www1.fidic.org/about/infra09/. Accessed 28 January 2010
International Monetary Fund (IMF). 2006. World Economic Outlook. Washington D.C.: The
Fund. September 2006 Jitsuchon, S. 2010. Fiscal Policy Issues in Thailand after the Current Economic Crisis. Paper
presented at the Conference on Global Financial and Economic Crisis Fiscal Policy Issues After the Crisis, Asian Development Bank Institute, Tokyo, 19 January 2010.
Joerss, M.; Woetzel, JR.; Zhang, H. 2010. China's Green Opportunity, The McKinsey
Quarterly, May 2010 Kang, J. 2010. Meeting the Challenges of Financial Crisis—China’s Practice: from
Developing Countries’ Prospective. Paper presented at the Conference on Global Financial and Economic Crisis Fiscal Policy Issues After the Crisis, Asian Development Bank Institute, Tokyo, 19 January 2010.
Kumar, R.; Soumya, A. 2010. Fiscal Policy Issues for India after the Current Crisis. Paper
presented at the Conference on Global Financial and Economic Crisis Fiscal Policy Issues After the Crisis, Asian Development Bank Institute, Tokyo, 19 January 2010.
Kuhndt, M.; Herrndoft, M.; Fernandez, A. 2007. Activating Policy Instruments for Resource
Efficiency in the Asia-Pacific Region, ESCAP – Greening the Business and Making Environment a Business Opportunity, Bangkok, Thailand, 5-7 June 2007

44
Lohani, B. N. 2010. An Instrument for Economic and Social Development (Opening remarks at the Second High Level Regional Workshop of the PRC-ADB Knowledge Sharing Platform Transport Infrastructure, 8 November 2010). http://www.adb.org/Documents/Speeches/2010/ms2010105.asp accessed 9 November 2010. Accessed 9 November 2010
Mashatt, M. et al. 2008. Conflict Sensitive Approach to Infrastructure Development. USIP
Special Report. Accessed 4 November 2010 - http://www.usip.org/files/resources/sr197.pdf. Accessed 4 November 2010
McKinsey & Co. 2009. Pathways to a Low-carbon Economy: Version 2 of the Global
Greenhouse Gas Abatement Cost Curve, 2009. http://www.worldwildlife.org/climate/WWFBinaryitem11334.pdf. Accessed 16 August 2010
McKinsey Global Institute. 2010. India’s Urban Awakening: building Inclusive Cities,
Sustaining Economic Growth, MGI Report, April 2010. Ministry of Environment and Water Resources, Singapore 2007,
http://app.mewr.gov.sg/web/Common/homepage.aspx. Accessed 4 November 2010 Nguyen, N.A.; Nguyen, D.N.; Nguyen, T. 2010. Current Global Crisis, Fiscal Stimulus
Package and Implication for Viet Nam. Paper presented at the Conference on Global Financial and Economic Crisis Fiscal Policy Issues After the Crisis, Asian Development Bank Institute, Tokyo, 19 January 2010.
Patunru, A. A.; Zetha, E. 2010. Indonesia’s Savior: Fiscal, Monetary, Trade, or Luck? Paper
presented at the Conference on Global Financial and Economic Crisis Fiscal Policy Issues After the Crisis, Asian Development Bank Institute, Tokyo, 19 January 2010.
Rahmatullah, M. 2010. “Transport Issues and Integration in South Asia” in Ahmed, Sadiq;
Kelegama, Saman and Ghani, Ejaz (eds.), Promoting Economic Cooperation in South Asia – Beyond SAFTA. New Delhi: Sage Publications Ltd.
Rodrigue, J.P. 2004. Straits, Passages and Chokepoints: A Maritime Geo-strategy of
Petroleum Distribution. Hofstra University, Hempstead, New York 2004. http://www.erudit.org/revue/cgq/2004/v48/n135/011797ar.pdf. Accessed 13 August 2010.
Saltz, M. 2005. Electrical Guideways: A Transportation Solution?. World Energy Monthly
Review Vol.1 No.3, June 2005. Shah, A. 2010. Energy Security, Global Issues Website, http://www.globalissues.org/article/595/energy-security, 15 May 2011, Accessed 24 July 2011. Srivastava, S. 2005. The Foundations of an Asian Oil & Gas Grid. Asia Times Online, 1 Dec.,
2005. http://www.atimes.com/atimes/South_Asia/GL01Df02.html. Accessed 13 August 2010.
Sugimoto, K. 2010. A Study on Fiscal Policy Challenges in Japan. Paper presented at the
Conference on Global Financial and Economic Crisis Fiscal Policy Issues After the Crisis, Asian Development Bank Institute, Tokyo, 19 January 2010.
45
Sustainable Urban Transportation Project (2010) SUTP http://www.sutp.org/. Accessed 18 August 2010
Sun-Jin, Y. 2010. Not So Green: South Korea's Growth Strategy. Global Asia Vol.5. No.2,
Summer 2010 pg. 86-89. Tabuchi, H.2009. Japan Drafts $154.4 billion Stimulus, New York Times, April 9, 2009
http://www.nytimes.com/2009/04/09/business/global/09yen.html. Accessed 23 August 2010
Times of India. 2010. India seeks fresh talks with Iran over gas pipeline. 19 April.
http://timesofindia.indiatimes.com/india/India-seeks-fresh-talks-with-Iran-over-gas-pipeline/articleshow/5829884.cms. Accessed 19 April 2010
TNEP. 2010. The Natural Edge Project – Principles and Practices in Sustainable
Development for the Engineering and Built Environment Professionals http://www.naturaledgeproject.net/ESSPCLP-Principles_and_Practices_in_SD-Lecture5.aspx. Accessed 27 July 2010
UNCRD Asia Environmentally Sustainable Transport Summit 2009. Press Release available
at - http://www.uncrd.or.jp/env/4th-regional-est-forum/doc/Press-release-4th-Regional-EST-Forum-final.pdf. Accessed 23 August 2010
United Nations Economic and Social Commission for Asia and the Pacific (UNESCAP). 2006.
Priority Investment Needs for the Development of the Asian Highway Network. New York: UN
———. 2007. Review of Developments in Transport in Asia and the Pacific. New York: UN. ———. 2010a. UNESCAP Transport Division Website. http://www.unescap.org/ttdw/common/TIS/ALTID/Altid.asp. Accessed 23 August 2010 ———. 2010b. Asian Highways Map. UNESCAP Transport Division Website. Available:
http://www.unescap.org/ttdw/common/TIS/AH/maps/ah_map_latest.jpg ———. 2010c. Trans-Asian Railway Map. UNESCAP Transport Division Website. Available
http://www.unescap.org/ttdw/common/TIS/TAR/images/tarmap_latest.jpg ———. 2010d. UNESCAP Trans-Asian Railway
http://www.unescap.org/ttdw/common/TIS/TAR/faq.asp. Accessed 27 September 2010
UNEP. 2006. CNG Conversion – Learning from New Delhi. 23 January 2006.
http://ekh.unep.org/?q=node/1737. Accessed 31 August 2010 ———. 2009. Mainstreaming Sustainable Consumption and Production and Resource
Efficiency into Development Planning, 2009. http://www.unep.fr/shared/publications/pdf/DTIx1235xPA-MainstreamingSCPintoDevPlanning.pdf. Accessed 28 July 2010
United Nations Framework Convention on Climate Change (UNFCCC). http://unfccc.int/.
Accessed 23 August 2010 UN IPCC. 2007. Synthesis Report of the IPCC 4th Assessment (AR4),
http://www.ipcc.ch/pdf/assessment-report/ar4/syr/ar4_syr.pdf. Accessed 12 July 2011

46
Wang, M.; David, X. 2008. Cleaner Energy for China: An Interview with the Chairman of ENN Group. The McKinsey Quarterly, July 2008
Weizsacker, E.U.; Lovins, A.B.; Lovins, L.H. 1995. Resource Efficiency. In Kuhndt, Michael;
Herrndoft, Martin; Fernandez, Alicia(2007): Activating Policy Instruments for Resource Efficiency in the Asia-Pacific Region, ESCAP – Greening the Business and Making Environment a Business Opportunity, Bangkok, Thailand, 5-7 June 2007
Wilkins, G. 2002. Technology Transfer for Renewable Energy: Overcoming Barriers in
Developing Countries, Royal Institute of International Affairs, 2002 World Bank. 2008. Safe, Clean, and Affordable…Transport for Development. The World
Bank Group’s Transport Business Strategy for 2008-2012. World Development Indicators (2009) Washington D.C.: World Bank 2009 World Bank. 2010. India's Transport Sector. http://go.worldbank.org/FUE8JM6E40.
Accessed 18 August 2010 World Economic Forum. 2008. The Global Competitiveness Report 2008-2009. Geneva:
WEF. Available: http://www.weforum.org/pdf/GCR08/GCR08.pdf. Accessed 13 August 2010
--------- . 2010. The Global Competitiveness Report 2009–2010. Geneva: WEF. Wuppertal Institute for Climate, Environment and Energy GmbH. 2009. Sustainable Urban
Infrastructure. Munich Edition – paths toward a carbon-free future. Yepes, T. 2004. Expenditure on Infrastructure in East Asia Region, 2006-2010. Background
Document for EAP’s Flagship 2005. Washington D.C.: World Bank. Yergin, D. 2006. Ensuring Energy Security, Foreign Affairs, New York: Mar/Apr 2006. Col.85,
iss.2; pg.69 Zhai, F. 2009. Gauging the Economy - Wide Gains of Regional Infrastructure. ADBI Working
Paper No. 223, 30 June 2010 Zhang, S. 2010. Seeking Balance: Reconciling Nature and Development. Global Asia cover
feature - Inside China: How a World Power is Facing Up to Its Many Domestic Challenges, Vol.5. No.2, Summer 2010 pg.41.