towards more effective implementation of rte… report_2013.pdf · towards more effective...
TRANSCRIPT

1
TOWARDS MORE EFFECTIVE IMPLEMENTATION OF RTE: A
BASELINE SURVEY OF ELEMENTARY EDUCATION IN BIHAR AND
UP, 2011-12
Collaborative Research and Dissemination, New Delhi, www.cordindia.com
April 2013

2
Contents
Acknowledgements 6
List of Tables and Figures for Bihar 7
List of Tables and Figures for UP 8
Executive summary 12
Introduction to the report 24
Part A. BIHAR 32
Section 1 Introduction 32
1.1 Background
1.2 Notifications by Government of Bihar related to RTE
1.3 Sample villages
1.4 Number of government and private schools
1.5 Size of government schools
1.6 Enrolment in government schools of children from disadvantaged communities
1.7 Gender wise enrolment in government schools
1.8 Characteristics of private schools
1.9 Madarsas
1.10 Anganwadis
Section 2 Infrastructure and Facilities 44
2.1 Teacher provision
2.2 All weather building
2.3 At least one classroom for every teacher and an office-cum-store-cum-Head
teacher’s room
2.4 Separate toilets for boys and girls
2.5 Safe and adequate drinking water facility for all children
2.6 Availability of a kitchen where the midday meal is cooked in the school
2.7 Playground
2.8 Boundary walls and fencing
2.9 Teaching learning equipment
2.10 Library
2.11 Play material, games and sports equipment
Section 3. Facilitating admission and retention of all children, particularly those
on the margin 57
3.1 Awareness and training on the RTE Act among teachers

3
3.2 Admission policies
Admission not to be denied for lack of age proof
Admission for extended period as prescribed
Admission in age appropriate class
Run Special Classes to mainstream children who have never attended school /
dropped out of school
3.3 Ensure participation of children from weaker sections and disadvantaged social
groups
3.4 Participation of persons with disabilities (equal participation, protection and full
participation)
3.5 Participation of children of migrant families
3.6 Provision of “free” education
3.7 Children not to be kept back in any class or expelled from school till elementary
education is completed
3.8 Languages used to teach/explain
Section 4 Teachers and school functioning 66
4.1 Working days for schools and working hours for teachers
4.2 Teachers’ attendance in school
4.3 Students’ attendance
4.4 Profile of teachers appointed
4.5 Salary scales of teachers
4.6 Completion of curriculum
4.7 Non teaching duties
Section 5. Guidelines for teachers for transacting the curriculum 77
5.1 How teachers understand RTE guidelines for transacting the curriculum
5.2 Teaching activities reported by teachers
5.3 Teaching activities observed
5.4 Methods of controlling/disciplining children reported by teachers
5.5 Assessment: Comprehensive and Continuous Evaluation
5.6 Some problems expressed by teachers about implementing RTE guidelines
Section 6. Accountability in the school system 86
6.1 Role of head teachers
6.2 Role of Education Committee (Tadarth Shiksha Samiti)
6.3 Maintenance of records
Section 7. Concluding remarks 93
7.1 Only limited progress on the road towards RTE
7.2 Suggestions to strengthen the school system

4
Part B. UTTAR PRADESH 98
Section 1 Introduction 98
1.1 Background
1.2 Notifications by Government of UP related to RTE
1.3 Sample villages and its educational facilities till Class 8
1.4 Number of government and private schools
1.5 Size of government schools
1.6 Enrolment in government schools of children from disadvantaged communities
1.7 Gender wise enrolment in government schools
1.8 Anganwadis
Section 2 Infrastructure and Facilities 107
2.1 Teacher provision
2.2 At least one classroom for every teacher and an office-cum-store-cum-Head
teacher’s room
2.3 Separate toilets for boys and girls
2.4 Safe and adequate drinking water facility to all children
2.5 Availability of a kitchen where the midday meal is cooked in the school
2.6 Playground
2.7 Boundary walls and fencing
2.8 Teaching learning equipment
2.9 Availability of library facilities
2.10 Play material, games and sports equipment
Section 3. Facilitating admission and retention of all children, particularly those
on the margin 118
3.1 Awareness and training on RTE in a sample of schools
3.2 Admission policies
No child shall be denied admission in a school for lack of age proof
Admission for extended period as prescribed
Age appropriate enrolment and Special Classes to mainstream children
3.3 Ensure participation of children from weaker sections and disadvantaged social
groups
3.4 Participation of persons with disabilities
3.5 Ensure admission of children of migrant families
3.6 Provision of “free” education
3.7 Children not to be kept back in any class / expelled from school till elementary
education is completed
3.8 Languages used to teach/explain
Section 4 Teachers and school functioning 127

5
4.1 Working days for schools / working hours for teachers
4.2 Teachers’ attendance in schools
4.3 Student attendance
4.4 Profile of teachers appointed
4.5 Salary scales of teachers in UP
4.6 Completion of the curriculum
4.7 Meetings with guardians
4.8 Non teaching duties
Section 5. Guidelines for teachers for transacting the curriculum 138
5.1 How teachers interpret RTE guidelines for transacting the curriculum
5.2 Teaching practices reported and observed
5.3 Methods of controlling / disciplining children reported by teachers
5.4 Assessment: Use of Comprehensive and Continuous Evaluation
5.5 Teachers’ feedback on the RTE guidelines
Section 6. Accountability in the school system 145
6.1 Role of head teachers
6.2 Role of School Management Committees
6.3 Maintenance of records
Section 7. Private schools in UP 153
7.1 Importance of private schooling in UP
7.2 Regulation of private schools in UP
7.3 Private schools in the sample villages
Section 8. Conclusion 163
8.1 Some progress on the road towards RTE
8.2 Too little accountability in the government system
8.3 Suggestions to strengthen the school system
References 168
Appendices 170

6
Acknowledgements
The CORD team would like to thank the Chairperson of NCPCR, Dr Shantha Sinha for giving us
the opportunity to do this study on an extremely topical issue – progress towards the
implementation of the Right to Education Act. The purpose was to study the situation at a point
in time 18 months after the Act was notified, and to develop tools which could be re-used to
study the situation in the same states some years down the line or in other states in the
country. It has been an experience to dissect the Act and to think how best we could measure
progress on the range of aspects covered in it.
We would like to thank the research committee at NCPCR which included the Member
Secretary, Mr Luv Verma, Members Ms Dipa Dixit and Ms Kiran Bhatty, and Ms Karuna Bishnoi
of UNICEF. The committee had several meetings with us and gave us useful inputs before the
study, several times during the course of the study, and at the end of the study. These included
useful comments on the sampling, the tools and the Draft Report. NCPCR, through the kind
offices of the Member Secretary, made it possible for us to do the school survey. Detailed
comments on the draft report were received from Dr Nalini Joneja of NUEPA, and NCPCR
Members Mr Dhir Jhingran and Dr Vandana Prasad. We wish to thank them and other members
of NCPCR for their useful critiques. We would also like to thank Mr Anjani Kumar Singh,
Education Secretary, Directorate of Education, Government of Bihar and Mr Parthasarthy Sen
Sharma, State Project Director (SSA), Government of UP, members of the RTE Forum in Bihar
and UP, and consultants from TSG, EdCIL for meeting with us. It was vitally important for the
team to get their perspective of the situation in their states.
The CORD team gratefully acknowledges the vital contribution of its fellow researchers: Aruna
Popuri, Rajeev Kumar, Sunil Saroj, and Kanika Goel at earlier stages of the study and Chander
Shekhar, Tania Kahlon, and Aurora Bardoneschi at later stages of the study. Other members of
CORD, including our Trustee, Ms Claire Noronha, and staff members, Ashti Salman and Sanjeev
Kumar, also gave crucial inputs. The team is also indebted to their field staff from Bihar,
Rajasthan, Orissa, and UP. Finally, they wish to thank the respondents in the schools they
surveyed as well as other key informants in the sample villages for giving them their time and
sharing with them their valuable perceptions.
Meera Samson Anuradha De Neha Gupta
April 2013

7
List of Tables and Figures for Bihar
Table 1.1 Profile of Schools in Bihar’s Sample Villages
Table 1.2 Distribution of Government Primary Schools by Enrolment in Bihar
Table 1.3 Distribution of Government Upper Primary Schools by Enrolment in Bihar
Figure 1.4 Average Enrolment in Government Schools in Bihar
Table 1.5 Enrolment of Children from Disadvantaged Groups in Government Schools in Bihar
Table 1.6 Gender-wise Enrolment in Government Schools in Bihar
Table 1.7 Distribution of Villages by Number of Anganwadis
Table 1.8 Distribution of Anganwadi Centres by Observed Attendance
Table 2.1 Pupil Teacher Ratios in Government Schools in Bihar
Table 2.2 Primary Schools which meet RTE norms for PTRs in Bihar
Table 2.3 Government Schools which meet RTE norms for Head Teacher in Bihar
Table 2.4 Teacher Classroom Ratio in Government Schools in Bihar
Table 2.5 Student Classroom Ratio in Government Schools in Bihar
Table 2.6 Availability of Room for use as Office cum Store cum Head Teacher’s Room in
Government schools in Bihar
Table 2.7 Availability of Toilet Facilities in Government Schools in Bihar
Table 2.8 Availability of Safe and Adequate Drinking Water Facilities in Government Schools in
Bihar
Figure 2.9 Availability of Kitchen in Government Schools in Bihar
Figure 2.10 Availability of Playgrounds in Government Schools in Bihar
Figure 2.11 Presence of Boundary Wall or Fencing in Government Schools in Bihar
Table 2.12 Availability of Teaching Learning Materials in Government Schools in Bihar
Table 2.13 Availability of Library Facilities in Government Schools in Bihar
Figure 2.14 Availability of Games and Sports Equipment in Government Schools in Bihar
Figure 2.15a Government Schools in Bihar with Specified Infrastructure and Facilities Available
and Usable
Table 2.15b Availability of Specified Facilities in Government Schools in Bihar
Table 3.1 Awareness of the RTE Act among Teachers and Head Teachers in Government Schools
in Bihar
Table 3.2 Documents Required for Admission in Government Schools in Bihar
Table 3.3 Government Schools in Bihar that Grant Admission for Extended Periods as Prescribed
Table 3.4 Criteria for Selecting Grade when Admitting a 9 year old Never Enrolled child in
Government Schools in Bihar
Table 3.5 Children with Disability (CWD) Reported to be Enrolled in Government Schools in
Bihar
Figure 3.6 Availability of Ramps in Selected Government Schools in Bihar
Table 3.7 Training in Special Education among Teachers in Government Schools in Bihar
Table 3.8 Incidence of Disability and Availability of Teachers with Special Training in
Government Schools in Bihar
Table 3.9 Schooling of Migrant Children in Government Schools in Bihar

8
Table 3.10 Schemes to Reduce Costs of Schooling for Children in Bihar
Table 3.11 Retention of Students in Government Schools in Bihar
Table 3.12 Striking Off Names of Students for Prolonged Absence in Government Schools in
Bihar
Table 3.13 Languages Used to Teach/Explain in Government Schools in Bihar
Table 4.1 Working Days for Classes 1-5 in Government Schools in Bihar
Table 4.2 Working Days for Classes 6-8 in Government Schools in Bihar
Table 4.3 Distribution of Government schools in Bihar by the number of days closed for
different reasons
Table 4.4 Teacher Absenteeism in Government Schools in Bihar
Table 4.5 Reasons for Teachers’ Absence on Day of Survey in Government Schools in Bihar
Table 4.6 Student Attendance on Day of Survey in Government Schools in Bihar
Figure 4.7 Student Attendance Before and After Mid-day Meal in Government Schools in Bihar
Table 4.8 Attendance Rates in Selected Classes in Government Schools in Bihar
Table 4.9a Profile of Teachers in Government Schools in Bihar: Type of Service and Gender
Figure 4.9b Profile of Teachers in Government Schools in Bihar: Type of Service
Figure 4.9c Profile of Teachers in Primary and Upper Primary Schools in Bihar
Figure 4.10 Educational Qualifications of Teachers in Government Schools in Bihar
Figure 4.11 Teachers with Professional Teacher Education in Government Schools in Bihar
Table 4.12 Differences between Regular Teacher and Locally Appointed Teachers in Education
Levels and Training
Table 4.13 Salary Scales of Teachers for Selected Classes in Government Schools in Bihar
Table 4.14 Teachers’ Satisfaction with Level and Regularity of Pay in Bihar Schools
Table 4.15 Accessibility of Schools a Problem for Some Teachers in Government Schools in Bihar
Table 4.16 Problems faced by School Teachers in Completing Curriculum on Time in
Government Schools in Bihar
Table 4.17 Non-Teaching Duties of Teachers in Government Schools in Bihar
Table 5.1 Training of Teachers to Incorporate a Different Perspective of the Child and of
Education
Table 5.2 Methods Used to Discipline Students as Reported by Teachers in Government Schools
in Bihar
Table 5.3 Methods Used to Discipline Students by Teachers as Observed in Government Schools
in Bihar
Table 5.4 Organized Activities in Government Schools in Bihar
Table 5.5 Assessment of Children’s Progress by Teachers in Government Schools in Bihar
Table 5.6 Maintenance of Pupil Files in Government Schools in Bihar
Table 6.1 Disciplinary action taken by Head Teachers against Teachers in Government Schools in
Bihar
Table 6.2 Appointment of Head Teachers in Government Schools in Bihar
Table 6.3 Setting up of Education Committees in Government Schools in Bihar
Table 6.4 Functioning of Education Committees in Government Schools in Bihar

9
Table 6.5 Support received from Education Committees as reported by Head Teachers in
Government Schools in Bihar
Table 6.6 Monitoring by SMC/TSS as Reported by Head Teachers in Government Schools in
Bihar
Table 6.7 Registers Maintained in Government Schools in Bihar
List of Tables and Figures for UP
Table 1.1 Profile of Schools in UP’s Sample Villages
Figure 1.2 Average Enrolment in Government Schools in UP
Figure 1.3 Distribution of Government Schools by the year of establishment in UP
Figure 1.4 Enrolment of Children from Disadvantaged Groups in Government Schools in UP
Figure 1.5 Gender-wise Enrolment in Government Schools in UP
Table 1.6 Distribution of Villages by Number of Anganwadis
Table 1.7 Distribution of Anganwadi Centres by Observed Attendance
Table 2.1 Schools which meet RTE norms for PTRs in UP
Table 2.2 Government Schools which meet RTE norms for Head Teacher in UP
Table 2.3 Pupil Teacher Ratios in Government Schools in UP
Table 2.4 Teacher Classroom Ratio in Government Schools in UP
Table 2.5 Student Classroom Ratio in Government Schools in UP
Table 2.6 Availability of Room for Use as Office cum Store cum Head Teacher’s Room in
Government Schools in UP
Table 2.7 Availability of Toilet Facilities in Government Schools in UP
Table 2.8 Availability of Safe and Adequate Drinking Water Facilities in Government Schools in
UP
Figure 2.9 Availability of Kitchen in Government Schools in UP
Figure 2.10 Availability of Playgrounds in Government Schools in UP
Figure 2.11 Presence of Boundary Wall or Fencing in Government Schools in UP
Table 2.12 Availability of Teaching Learning Materials in Government Schools in UP
Table 2.13 Availability of Library Facilities in Government Schools in UP
Figure 2.14 Availability of Games and Sports Equipment in Government Schools in UP
Figure 2.15a Government Schools in UP with Specified Infrastructure and Facilities Available
and Usable
Table 2.15b Availability of Facilities in Government Schools in UP
Table 3.1 Awareness of RTE Act among Teachers and Head Teachers in Government Schools in
UP
Table 3.2 Documents Required for Admission in Government Schools in UP
Table 3.3 Government Schools in UP that Grant Admission for Extended Period as Prescribed
Table 3.4 Criteria for Selecting Grade when Admitting a 9 year old Never Enrolled child in
Government Schools in UP
Table 3.5 Children with Disability (CWD) Reported to be Enrolled in Government Schools in UP

10
Table 3.6 Training in Special Education among Teachers in Government Schools in UP
Table 3.7 Incidence of Disability and Availability of Teachers with Special Training in
Government Schools in UP
Figure 3.8 Availability of Ramps in Government Schools in UP
Table 3.9 Schooling of Migrant Children in Government Schools in UP
Table 3.10 Schemes to Reduce Costs of Schooling for Children in UP
Table 3.11 Retention of Students in Government Schools in UP
Table 3.12 Striking Off Names of Students for Prolonged Absence in Government Schools in UP
Table 3.13 Languages Used to Teach/Explain in Government Schools in UP
Table 4.1 Working Days for Primary and Upper Primary Government Schools in UP
Table 4.2 Distribution of Government Schools in UP by the number of days closed for different
reasons
Table 4.3 Teacher Absenteeism in Government Schools in UP
Table 4.4 Reasons for Teachers’ Absence on Day of Survey in Government Schools in UP
Table 4.5 Student Attendance on Day of Survey in Government Schools in UP
Figure 4.6 Student Attendance Before and After Mid-day Meal in Government Schools in UP
Table 4.7 Attendance Rates in Selected Classes in Government Primary Schools in UP
Table 4.8 Attendance Rates in Selected Classes in Government Upper Primary Schools in UP
Figure 4.9a Profile of Teachers in Government Schools in UP: Type of Service
Figure 4.9b Teacher Profile in Primary and Upper Primary Schools in UP
Table 4.9c Teacher Profile in Government Schools in UP: Type of Service and Gender
Figure 4.10a Educational Qualifications of Teachers in Government Schools in UP
Table 4.10b Educational Qualifications of Male and Female Teachers in Government Schools in
UP
Figure 4.11a Teachers with Professional Teacher Education in Government Schools in UP
Table 4.11b Professional Teacher Education among Male and Female Teachers in Government
Schools in UP
Table 4.12 Salary Scales of Teachers for Selected Classes in Government Schools in UP
Table 4.13 Teachers’ Satisfaction with Level and Regularity of Pay in UP Schools
Table 4.14 Accessibility of Schools a Problem for Some Teachers in Government Schools in UP
Table 4.15 Problems faced by School Teachers in Completing Curriculum on Time in
Government Schools in UP
Table 4.16 Parent-Teacher Meetings for Monitoring Child’s Progress in UP Schools
Table 4.17 Non-Teaching Duties of Teachers in Government Schools in UP
Table 5.1 Training of Teachers to Incorporate a Different Perspective of the Child and of
Education
Table 5.2 Methods Used by Teachers for Explaining Lessons in Government Schools in UP
Table 5.3 Use of Teaching Aids Observed in Government Schools in UP
Table 5.4 Methods Used to Discipline Students as Reported by Teachers in Government Schools
in UP
Table 5.5 Methods Used to Discipline Students by Teachers as Observed in Government Schools
in UP

11
Table 5.6 Assessment of Children’s Progress by Teachers in Government Schools in UP
Table 5.7 Maintenance of Pupil Files in Government Schools in Bihar
Table 6.1 Disciplinary Action taken by Head Teachers against Teachers in Government Schools
in UP
Table 6.2 Appointment of Head Teachers in Government Schools in UP
Table 6.3 Setting Up of Education Committees in Government Schools in UP
Table 6.4 Composition of Education Committees in Government Schools in UP
Table 6.5 Regularity of Meetings of Education Committees in Government Schools in UP
Table 6.6 Functioning of Education Committees in Government Schools in UP
Table 6.7 Support received from Education Committees as reported by Head Teachers in
Government Schools in UP
Table 6.8 Monitoring by SMC as Reported by Head Teachers in Government Schools in UP
Table 6.9 Registers Maintained in Government Schools in UP
Table 7.1 Enrolment in Classes 1 to 8 in Rural Areas in Uttar Pradesh
Table 7.2 Distribution of Sample Villages by Availability of Private Schools
Table 7.3 Distribution of Private Schools by Classes Taught
Table 7.4 Distribution of Private Schools by School Type, Recognition Status and Year of
Establishment
Table 7.5 Annual Fees in Private Schools in UP
Table 7.6 Average Enrolment in Elementary Classes in Private Schools in UP
Figure 7.7 Enrolment by Gender in Private Schools in UP
Figure 7.8 Proportion of Children from Disadvantaged Groups Enrolled in Private Schools in UP
Table 7.9 Availability of Teachers and Classrooms in Private Schools in UP
Table 7.10 Private Schools in UP with Specified Infrastructure and Facilities Available and Usable
Table 7.11 Availability of Trained Teachers in Private Schools in UP

12
Executive Summary
The objective of the study is to provide a baseline for the extent of compliance with the RTE Act
in schools in rural areas of Bihar and Uttar Pradesh in 2011-12, eighteen months after the Act
has been passed. A sample of 89 villages in Bihar and 102 villages in UP was selected and
surveyed between November 2011 and February 2012. Villages were selected through
multistage stratified random sampling.
RTE implementation is expected to impact the number and quality of different types of schools
in a village. In this context, data was collected from all education institutions in the village on
some parameters which included infrastructure and facilities, and number of teachers
appointed and students enrolled. This was supplemented by a detailed survey of a sample of
government primary and upper primary schools in which there were semi-structured interviews
with the head teacher, and teachers of class 3 and class 7, collection of data from school
registers, and observation of teaching activities in class 3 and class 7 for the duration of one
period during the school day. Members of the Education Committees responsible for RTE
compliance were also interviewed, as also members of the panchayat for any role they may be
playing in this area.
The report looks at the provision of infrastructure and teachers because the RTE Act sets
certain standards and norms with regard to these parameters. The focus is equally on the
implementation of other aspects of the Act. It looks at what teachers know of the Act, how they
understand it, what they report they are implementing, and what kind of problems they face
with implementation. It looks at how other stakeholders understand their roles and
responsibilities. Finally, it looks to see what systems are in place in terms of records to enable
monitoring of the implementation of the Act. The methodology is based on a single day’s visit
to a village. In this context it is not useful to research issues such as discriminatory behavior in
schools towards weaker sections and socially disadvantaged groups.
An important objective of the study is to provide tools which can be used in other states to
explore the issue of compliance with the RTE Act. This report will be useful for policy direction
as it looks at the achievements and gaps in every area – infrastructure, teacher provisioning,
capacity of stakeholders, and support and monitoring mechanisms.
Bihar
The 89 sample villages in the study in Bihar were selected from 15 districts. NSSO has divided
Bihar into 7 subregions. Two districts have been randomly selected from each of 6 sub-regions
and 3 districts have been randomly selected from the larger sub-region of Purnea. The sample
villages were comparatively large. The villages had a large number of government schools (136)
and very few private schools (7).
Access to primary and upper primary schooling

13
Primary schooling in the sample villages was available mainly through government provision.
Government schools with primary grades included 71 primary schools (with grades 1-5) and 64
upper primary schools (63 schools with grades 1-8, one school with grades 6-8). Forty per cent
of villages had more than one government school with primary grades. The sample villages also
had 7 private schools, 6 of which were primary schools.
Upper primary schooling in the sample villages was available only through government
provision with the exception of 1 private secondary school. The majority of villages (70%) had a
school with upper primary grades.
However, the sample villages in Bihar were large and the high enrolment relative to the
provision of teachers and classrooms indicates that the supply of schooling needs to be urgently
expanded.
Provision of infrastructure and teachers in government primary schools
The study found severe teacher and infrastructural shortages in the primary schools in the
sample villages. Nine were single teacher schools. Only 20% of schools had at least 2 teachers
and met RTE norms to have a PTR within a specified limit. (This varied between 30 and 40
depending on the numbers enrolled in primary grades.)
Schools had a severe shortage of classrooms. The average SCR was extremely high (81). The
maximum SCR was as high as 296.There were schools which were unable to function at
different times in the year because they were flooded or the roof leaked.
Infrastructure was also poor on other counts. Less than 40% of primary schools had a kitchen
shed for preparation of the midday meal. Less than one fourth of primary schools had
playgrounds, boundary walls, and separate toilets in a usable condition for boys and girls.
Games and sports equipment was available, but only in half the primary schools.
Only in a few aspects was the infrastructure good. A high proportion of primary schools had
safe drinking water (78%), though it was difficult to say it was adequate for so many children.
Nearly all schools (91%) had some teaching learning materials, and investigators saw them
being used in classrooms.
Provision of infrastructure and teachers in government upper primary schools
The upper primary schools were mostly composite schools with both primary and upper
primary grades. There was only 1 upper primary school with only grades 6-8. All these upper
primary schools also had severe teacher and infrastructural shortages. There was 1 single
teacher school. Although it is not possible to say if these schools were RTE compliant in terms
of the PTR, since teachers taught both primary and upper primary grades, 87% of these schools
had a PTR greater than 40, which is the maximum permitted under the RTE Act under any

14
circumstances.1 Only 13% of these schools had at least 2 teachers and a PTR less than or equal
to 40. Teacher shortage is more acute than in primary schools.
The upper primary schools had a severe shortage of classrooms. The average Student
Classroom Ratio was also as high as 99. The situation with respect to shortage of classrooms
was worse than in the primary schools because of the very high enrolment in these schools.
There was a shortage of toilet facilities. Even a single common toilet was not accessible in 11%
of schools. RTE Act requires that schools have at least 2 toilets – one for boys and one for girls.
This was available in only 36% of schools. In any case, two toilets are certainly not adequate for
schools with the high numbers enrolled.
On all other aspects, infrastructure and facilities in the upper primary schools were somewhat
better than in the private schools. A high proportion of upper primary schools (78%) had safe
drinking water, though it was difficult to say it was adequate for so many children. A high
proportion of these schools (74%) also had a kitchen shed for preparation of the midday meal.
Playgrounds were also available in 59% of schools. Most (58%) schools had boundary walls (to
ensure that children stay in school). Nearly all schools had some teaching learning materials,
and investigators saw them being used in classrooms. Games and sports equipment were also
available in 83% of schools, though there was evidence of organized sports activity only in a few
schools.
Awareness of the RTE Act and Extent of Implementation of Policies to Draw and Retain All
Children to School
The Draft Rules of the Government of Bihar were formulated in May 2011. There have been
numerous notifications issued about different aspects of RTE.
The study found that there was very limited implementation of the RTE Act on the ground in
most aspects. This was not surprising given that teachers had not received any training on RTE.
Neither did they have any written materials on the Government notifications on RTE for
reference.
There have been sustained efforts to make education “free” in the sense of providing cash
towards purchase of uniforms and stationery, and textbooks for all students enrolled in primary
and upper primary grades. However, efforts to provide “free education” did not go beyond this.
The study found that there was no mention in any school of transport costs being covered for
any child, except for equipment given to some children with disability. Also that there was any
requirement on the school or the SMC or the panchayat to find out which children were
attending irregularly or not at all, and to ensure that if there was some financial barrier to their
coming to school, that it would be noted and action taken.
1 The Act accepts a maximum PTR of 40 for schools where enrolment in primary grades is more than 200.

15
Teachers tended to be uncertain about most of the Act’s specifications. There were a number
of weak links with regard to enrolling children who had never been enrolled or had dropped out
of school. Only two fifths (41%) of schools reported that they were admitting children without
documents of proof of age. A larger proportion (61%) reported that they were admitting
children to school even after 30 September, which had been the cut-off date prior to the RTE
Act. However, the school records indicated that there were admissions past 30 September only
in 33% of schools. It could be that no children (for example, from migrant families) had asked
for admission past 30 September. A small proportion of teachers (21%) expressed that they
were not cutting off children’s names for prolonged absence from school.2 Children were
reported to not being retained in the same class at the end of the year on any count in 43% of
schools. Teachers were aware that corporal punishment was prohibited. The cane was not seen
to be used a lot, but it was visible. Teachers say they teach with love, though according to one
teacher this was the “official version”. Overall, teachers reported that they abide by the new
notifications, but they do not agree with them.
Admitting children to the age-appropriate class and running Special Classes for them so they
can catch up with the rest of the class did not appear to be happening. While a few schools
reported that they were doing this, they were unable to provide any details on where these
classes were held and when. Similarly, changing the system of assessing children also requires a
major investment. Supplementing or replacing the earlier system of tests and annual
examinations by a new system which requires the teacher to maintain records of the child and
to evaluate his/her performance on a regular basis is an enormous change which can happen
only with considerable guidance and monitoring.
Teachers were conscious of the rights of disabled children to be in school. Teachers were
getting some training on how to work with such children. While disabled children were being
enrolled, and schools were being provided with ramps, the numbers of disabled children seen
in school were much less than those enrolled, and the proportion of schools with at least one
teacher with training on disability was low.
Teacher recruitment, qualifications and training
Bihar has chosen to lean heavily on a teacher cadre, who were largely recruited locally, at very
low salaries. Only one fourth of all teachers appointed were permanent or regular teachers
(20% male and 5% female). A very high proportion (75%) were panchayat appointees (40%
male and 35% female). Overall, there were more male teachers (60%) than female teachers.
The majority of female teachers had passed Class 12 at most (74%). This also applied to 50% of
the male teachers. Close to half (46%) of the female teachers had no training, as opposed to
28% of male teachers.
2This was a topical issue at the time of the survey as the government wanted to reduce “double enrolment” of
children. Teachers were instructed to strike off the names of children who were absent for a prolonged period of
time and were reported to be enrolled in other schools.

16
The qualifications of the large cadre of locally appointed teachers were low – 66% have passed
Class 12 at most compared to 41% of regular teachers. Higher proportions also had no teacher
training (43%) compared to 12% of regular teachers.
There was a considerable difference between the teachers teaching in the 1-5 schools and
those teaching in the 1-8 schools. A much higher proportion (26%) of teachers in the 1-5
schools have not passed class 12 compared to 16% teachers in the upper primary schools. The
RTE Act requires that all teachers teaching primary grades should have passed Class 12. This is
an important gap. Approximately half (49%) the teachers in the primary schools had no training
compared to 31% of the teachers in the upper primary schools.
Teachers teaching upper primary grades are required to be graduates. 44% of teachers in the
upper primary schools were graduates. It is possible that some of the other teachers also teach
upper primary grades in these schools.
Findings on salary scales are based on interviews with one class 3 and / or one class 7 teacher in
a government school in the sample villages. According to the Panchayat Teacher rules, no
teacher should be paid less than Rs 6000 per month. There were two teachers who reported
getting paid less than this amount (Rs 2000, and Rs 5000, respectively). The majority of regular
teachers were getting over Rs 20,000 a month, the majority of locally appointed teachers
reported that they were getting upto Rs 8,000 a month.
Guidelines for teachers on transacting the curriculum
The RTE Act requires that teachers teach in a way that looks at children differently, as persons
with a right to be treated respectfully irrespective of their background, as persons whose
potential needs to be fully built up, as persons who need inputs to develop in an all round
manner, to be taught through activities that are relevant and take their needs and interests into
account. Teachers are prohibited from using corporal punishment. All these provisions have
important implications for the kind of input teachers need if they are to use new teaching
learning methods effectively.
The teachers in Bihar had not had any training specific to RTE and its requirements. A small
proportion of teachers (21%) reported that they had had earlier trainings related to similar
concepts. The study found that teachers in general did have some understanding of the way in
which the RTE Act envisioned that the child should be taught. Earlier trainings had exposed
them to the need to be more sensitive to the child and his/her world, and to focus on building
up the child. This is an extremely useful beginning. However, the study did not find evidence of
these understandings being put into practice. Methods of teaching which were being used were
engaging children in writing and rote learning activities primarily. An important part of their
expressed role as teachers was on making children clean / obedient.
Functioning of schools linked with roles and responsibilities of teachers / SMC / local bodies

17
Numerous stakeholders are supposed to be involved in monitoring teacher and student
attendance. In particular, SMCs as envisaged in the RTE Act have this role. Head teachers also
share in this role as part of the SMCs. All teachers are required to be punctual and work as
much as 45 hours a week (at school and in preparation at home).
The SMCs in Bihar at the time of the survey in 2011-12 were ad hoc committees, formed with
very limited scope. They were to function till elections to the SMCs could be held after a year.
These ad hoc committees or Tadarth Shiksha Samitis had primarily to look after school
construction, midday meals, and other schemes such as provision of uniforms, textbooks and
scholarships. Its monitoring role was extremely limited.
The study also indicates that there was no clear line of accountability in Bihar’s schools. In a
sample of 96 schools surveyed in detail, head teachers were not appointed in 41% of schools
and absent in a further 23% of schools. Head teachers also reported that they play a limited
supervisory role in monitoring the attendance of other teachers.
The local bodies were not keeping any records of children in the village whether they were in
school or out of school. They were also not part of the education committees.
The study found that the functioning of schools on certain basic parameters leaves much to be
desired.
• While schools reported that their working days were as required by the Act, they also
mentioned how they had to close suddenly because of extreme weather conditions
(cold / heat) and on account of floods. The team also found closure of schools on
account of festivals extended beyond the day on which the school was officially closed.
• While a relatively small proportion (11%) of teachers was absent on the day of the
survey due to personal reasons, the investigators found that teachers came late and left
early.
• Only 41% of the students were present on the day of the survey, and some of these
students (10%) left after the midday meal was served. The situation was worse in the
larger upper primary schools.
The situation is cloudy because of double enrolment – children are reportedly enrolled in
government schools and private schools, but attend only private schools; children are enrolled
in madarsas and government schools, and may attend both madarsas and government schools
at different times in the day; children are enrolled in government schools which they may or
may not attend; simultaneously go for private tuition in large groups.
The concluding section makes some suggestions for action which we summarise in brief.
There is an urgent need to invest in every aspect of infrastructure and facilities specified under
the norms for a school by the RTE Act. More teachers need to be recruited. Teachers recruited
need to have the qualifications and training specified by the NCTE. This is an enormous

18
challenge for the state. It is extremely difficult for teachers to transact curriculum as required
by RTE in the sense of building the capacity of a child as envisioned by the RTE Act. Teachers
need to learn and experience these concepts in their own training programmes before they can
implement them.
The RTE Act suggests roles for various stakeholders. Fulfilling these roles is beyond the capacity
of most unless there is sustained effort in building that capacity in the persons involved, both
within and outside the education department. All stakeholders need to understand the RTE Act
better and their role in implementing it (head-teacher and teachers, SMC, sarpanch). It is
important that head-teachers, teachers and SMC members learn more about the rationale of
having a rights based approach in dealing with all children.
The SMC and head-teacher and teachers all need to play a role in monitoring teacher
attendance, children’s attendance and school functioning in general. The sarpanch is required
to take note of any child who is out of school. It is important to put in place a system of records
to ensure that RTE will be implemented.
Uttar Pradesh
The study in UP was conducted in 102 sample villages selected from 17 districts, one district
from each of 17 sub-regions that UP has been divided into by NSSO. The sample villages were
comparatively small and accessible. The villages had a large number of government (107) and
private schools (55).
Access to government primary schooling
Government primary schooling could be accessed only through schools with grades 1-5. All
sample villages in UP had a government primary school, but none of these schools had been set
up in the last 10 years. During the same period access to private schooling at the primary stage
increased significantly.
Provision of teachers and infrastructure in government primary schools
The provision of teachers and infrastructure does not indicate that these primary schools had
the minimum norms and standards for a school. There were 2 primary schools which were
single teacher schools; 59% of primary schools did not have an acceptable PTR. Schools had
insufficient classrooms: The student classroom ratio was high at 42. There were playgrounds in
only 47% of schools, although 73% of schools had some games and sports equipment. Separate
toilets for boys and girls were not available and usable in 56% of schools. On the other hand,
the majority of these primary schools did have some important elements required for a school
– they had access to safe drinking water and to a kitchen shed. Only a small proportion of
primary schools (with enrolment more than 150) required Head teachers to be appointed. This
was satisfied by the majority of these schools.

19
Access issues for government upper primary schooling
Government upper primary schooling could be accessed only through schools with grades 6-8.
Access to a government upper primary school within the village was restricted to 57% of the
sample villages. 34% of the villages had an upper primary school within 3 kms (as required by
RTE). 9% of the villages had an upper primary school only beyond 3 kms (unacceptable to RTE).
The class sizes in the 106 primary and 58 upper primary schools in the sample villages were
found to be quite similar indicating that children are dropping out as they transition between
the primary and upper primary stages of schooling.
The study found limited access to upper primary facilities in the sample villages in UP even
though a large proportion of the upper primary schools have been set up in the last 10 years
indicating that there has been an expansion of facilities for this level of schooling.
Provision of infrastructure and facilities in government upper primary schools
Teacher provision was very limited. Over one quarter of these upper primary schools were
single teacher schools (unacceptable under RTE). PTR norms were not satisfied by 39% of the
upper primary schools. However, Head teachers were appointed in 13 out of 14 schools in
which they were to be appointed.
Existing upper primary schools had a shortage of classrooms though less than primary schools.
There were 2 schools with only a single classroom. The overall SCR was 26.
Existing upper primary schools had some access to most other infrastructural requirements.
The proportion of schools without a functioning boundary wall was 58%, without a usable
playground was 56%, and without separate toilets for boys and girls (in a usable condition) was
48%.
Awareness of the RTE Act and Extent of Implementation of Policies to Draw and Retain All
Children in School
It is evident that a majority of teachers and head teachers in U.P. have received some form of
RTE training mostly for a duration of 4 days. Most teachers reported getting the Samvad
module, as RTE training material.
The RTE Act is focused on bringing and retaining all children in school until they complete
elementary education. Some of these policies teachers were able to grasp more easily but they
were not necessarily convinced of the rationale. High proportions of teachers reported that
they were putting these policies into practice.
• Children without documents were reported to be given admission.
• Children were admitted even if they came for admission after 30 September
• Children with disability were enrolled in schools.

20
• Children were not kept in the same grade at the end of a year
• Children’s names were not cut off the register even with prolonged absence.
• Corporal punishment was prohibited.
The study indicated that there could be problems with the way these policies were being
implemented. Registers showed that only a small proportion of schools had given admission to
children after 30th
September. While schools were admitting children with disability only a small
proportion of those enrolled were observed to be in school. In addition, on the basis of the
study, it was particularly difficult to judge to what extent teachers were using corporal
punishment to discipline children when not being observed or how sensitive teachers were to
discriminatory behavior towards children of disadvantaged groups from among teachers or
other children.
There were some policies related to admission and assessment which teachers found more
difficult to implement effectively as they require new systems to be put in place. These include
the policies of age appropriate enrolment for children who have never been enrolled or
dropped out of school, and the running of Special Classes to mainstream these children. This
was also true for using CCE (Continuous and Comprehensive Evaluation) to assess children and
to maintain records for each pupil. Only small proportions of teachers said they were
implementing them, and even they could not provide information on when these Special
Classes were held or show Pupil Files for any children.
Issues related to teachers’ recruitment, qualifications and training
The study found 2 broad categories of teachers: regular teachers who were 72% of all teachers
and locally recruited teachers who were 28% of all teachers. There were a higher proportion of
males among the better-paid regular teachers. and a higher proportion of females among the
poorly-paid contract teachers.
The teacher cadre in the UP schools had a majority of males (54%) but also a substantial
proportion of females (46%). Male and female teachers were both highly qualified – 70% of
males and 79% of females were graduates. Higher proportions of male teachers had
professional teacher training – 72% of men compared to 61% of women.
Primary school teachers were required to have completed class 12: this was not satisfied by
only 4% of teachers. Upper primary school teachers were required to be graduates: this was not
satisfied by 28% of teachers. The picture in terms of teacher training looks quite rosy if one
looks at teachers in all schools – 69% of teachers had training. However, the situation is drastic
for primary schools. Nearly half (46%) of primary school teachers need training. These are
mostly the contract teachers. Nearly all upper primary school teachers were trained. There
were a higher proportion of males among the upper primary school teachers. There were a
higher proportion of females among the primary school teachers.

21
Findings on salary scales are based on interviews with one class 3 and / or one class 7 teacher in
a government school in the sample villages. There was a high proportion of contract teachers
among the Class 3 teachers. They were reported to be paid Rs 3500. Among the Class 7
teachers, there were no contract teachers. Regular teachers reported that they were paid
between Rs 20,000 – Rs 30,000. One fourth of the regular were being paid above 30 thousand
rupees.
Guidelines for teachers on transacting the curriculum
The Act requires a change in the way that knowledge is constructed. Teachers articulated their
understanding of these concepts -- all round development of the child; building up child’s
knowledge, potential and talents; development of physical and mental abilities to the fullest
extent; learning through activities, discovery and exploration in a child friendly and child
centred manner.
Teachers spoke of how children could be drawn into the learning process, primarily through
using TLMs or activities, teaching as per children’s interests or based on their ‘mental level’.
Explaining well was considered important as also removing fear from children. Teachers
suggested the use of activities such as sports and PT, and music, dance, excursions etc. as a
means to ensure all round development. However, the study found that only in 9% schools (14
schools) was any form of sports activity observed. Teachers also felt that all round development
included telling children the importance of cleanliness and teaching them social skills and
values.
There seemed to be relatively little understanding of possible problems of children from
marginalised communities. The difference between children’s levels was acknowledged but as a
consequence of their abilities not their background. There was no mention of the need to
include children from all communities. Inclusion is limited to helping weaker children and in few
cases, encouraging shy children to speak.
Although the teachers reported that they implement these principles in their classes,
observation of teaching for the duration of one period in Class 3 and Class 7 in schools in the
sample villages indicated that teachers generally used more traditional teaching methods:
reading from the textbook, asking questions from students, writing on the board, and
explaining. Future trainings for teachers need to build on their existing knowledge and allow
them to see the principles laid out in the Act put into practice. Implementing these changes will
take training and time, as it is not what has been the teacher’s own experience in school or
during their professional teacher training.
Functioning of schools linked with roles and responsibilities of teachers / SMC / local bodies
Schools reported that they were open for more than the minimum number of days specified by
the RTE Act but this is unlikely to be true. Schools were found to be closed at various times
during the survey.

22
The study found that absenteeism of teachers due to personal reasons was comparatively low –
11% on the day of the survey. It is possible that the picture of teacher regularity and punctuality
is actually worse than it appears, as the team noted that in many cases the regular teachers
depended on the contract teachers to open and close up the school, and came for a shorter
part of the school day themselves. Many of the contract teachers themselves came late and left
early. Fifteen per cent of teachers were reportedly absent due to official duties. This meant that
on the day of the survey more than one fourth of teachers were not in school.
The team found that student attendance even before the midday meal was less than half of the
enrolment, and that it dropped post the midday meal. Observed attendance was also lower
than what was reported in the register.
The study found that SMCs generally included the required number of parents. However, SMCs
had only a limited idea of their roles and responsibilities, which are quite comprehensive,
including making of the School Development Plan and to be the first stop for any grievance
redressal about the working of the school. SMCs were primarily involved in schemes involving
distribution of uniforms and textbooks and the cooked midday meal.
The private sector
Privatisation of schooling in rural UP has been taking place. Access to a private school with
primary grades was available in 46% of the villages. Access to a private school with upper
primary grades was available in 28% of the villages. Secondary schooling was available in 13% of
the villages. Not all private schools had a preprimary section.
The private schools were mostly recognized, although their infrastructure was limited and their
teachers were not trained. There were unrecognized private schools, most of which had been
set up in the last 5 years. Enrolment was higher in the recognized private schools. Fees were
higher too.
Private schools are playing an important role in providing access to schooling. However, there
are issues of gender and social equity. Private schools have a higher share of boys (59%) than
girls. Private schools have a lower share of SCs than government schools. This is even though
the government provides scholarships of Rs 300 and Rs 480 for children from disadvantaged
social groups for all children enrolled in certain grades in government and recognized private
schools.
Madarsas are playing an important role in providing access to primary schooling for Muslim
children.
Contribution of government schools to gender and social equity
There are more girls than boys in government schools, at primary and upper primary levels. To
some extent this reflects the availability of private schools with upper primary grades in the

23
sample villages, since boys are more likely to be sent to private schools. But it also reflects the
availability of government upper primary schools in these villages which makes them highly
accessible for girls.
The proportion of SCs enrolled in government schools is higher than proportion of SCs in the
population as a whole. There are a comparatively lower proportion of Muslims enrolled in
government schools relative to their share in the population as a whole. The proportion drops
considerably between primary and upper primary schools.
The way ahead
Access to schools needs to be improved. More government schools at both primary and upper
primary levels are required.
School based planning is essential – there is considerable variation in quality of infrastructural
and teacher provision among the government schools.
Infrastructural gaps need attention particularly the shortage of classrooms but others too.
Infrastructural gaps are particularly great in the upper primary schools.
The shortage of teachers needs to be unpacked, according to what the RTE requires for the
stage of schooling and the numbers of students enrolled. Basic educational qualifications of
teachers need to be brought in line with RTE norms. In addition, to recruiting more teachers,
they need to be posted where they are required.
The RTE Act requires that the local authorities / sarpanch take action if they know of children
who might drop out of school because they cannot cover transport costs of getting to school or
other costs that they might incur. The sarpanch or other panch members interviewed in the
sample villages did not have records of children who were out of school, so there was no
question of them knowing why children were out of school and if taking action was required.
The Act is premised on the basis that schools will function in a way in which all children are able
to access their right to free and compulsory elementary education. To this end, it outlines the
duties of the teachers, of SMCs, and of local bodies. Teachers are accountable to the education
authorities in the state, local body members are elected which is supposed to bring with it built
in accountability. But SMCs are accountable at most to the parent body, an amorphous group
which include a sizable proportion from disadvantaged groups and weaker sections, and would
need to be empowered to demand accountability on any front. SMC members also need
training in other aspects such as making School Development Plans and in monitoring school
expenditure to fulfil the roles envisaged for them. All stakeholders need ongoing training
programmes with monitoring mechanisms in place to function more effectively.
24
TOWARDS MORE EFFECTIVE IMPLEMENTATION OF RTE: A BASELINE SURVEY OF
ELEMENTARY EDUCATION IN BIHAR AND UP, 2011-12
INTRODUCTION TO THE REPORT
The RTE Act of 2009 can play a vital role in enabling India’s children achieve their fundamental
right to education of quality. The onus is on the state to make schooling of quality available to
all children as a justiciable right. The specifications in the Act are wide and varied. It sets out
minimum norms and standards for every school on infrastructure and facilities, the number of
teachers required based on Pupil Teacher Ratios, and the availability of teaching learning
materials, a library, and games and sports equipment. It specifies the minimum number of days
that schools should be functioning, and requires fundamental changes in the ways in which all
children will be enrolled in school and how they will be retained in school so they can access
their right to elementary education. Mental harassment and corporal punishment are
prohibited. Children will be assessed through an ongoing system of evaluation on a wide range
of parameters, and cannot be retained in the same grade at the end of the year. Teachers need
to be qualified and trained. The Act provides guidelines to teachers on their duties ranging from
their need to complete the curriculum as well as how they are to transact the curriculum in a
way in which children are able to develop to their full potential. It also gives important roles to
local authorities and to school-based education committees to work with the staff in school to
monitor the situation. In addition, the education committees are to engage in planning for the
future. Implementing such a wide-ranging Act is not an easy task, and needs support and
monitoring to ensure that it does work effectively. Social audits conducted by civil society
organisations at the village level provide an important input to understand ground realities at a
micro level. Useful for the macro picture it provides as well as for details for individual schools
is DISE data which provides updated school level data for the entire country. However, DISE
data is primarily on teacher and infrastructure availability, and student enrolment. There are
some questions with regard to its accuracy, as it depends on data provided by teachers within
the government schooling system itself.3 It is useful to supplement these efforts with research
studies such as this one. Its value lies in the fact that it is an independent effort focused on the
progress made towards the implementation of the RTE Act.
Objectives of the study
This study was conceived of as a baseline survey which will help to monitor implementation of
RTE in schools in villages of Bihar and UP. It explores the degree of compliance wrt the
requirements of the RTE Act in these two states in 2011-12, two years after the RTE has been
notified.
3 Teachers may find the task burdensome. They may also have personal compulsions to inflate enrolment and
attendance (linked as it is with the provision of teachers and incentives such as midday meals).

25
With RTE, major changes are expected in access and quality of schooling, in both the
government and the private sector. A well defined monitoring role is also envisaged for village
local bodies and SMCs. The study provides a framework which allows the situation to be
captured on a range of parameters, now and after a period of time when it is expected that the
picture will show enormous changes.
The study focuses on all the educational facilities in a village. In this way, it allows us to capture
changes not just within the individual school but also the schooling system – the comparative
roles of the government and private sector.
The focus of the study was to provide a baseline of the schooling situation in the states of Bihar
and UP. RTE implementation is expected to impact number and type of schools available in a
village. So it was decided to begin by making a random selection of villages. Some basic
information was collected about all educational facilities in these villages, from preprimary
upwards. This enables us to get insights about access and quality of education, both through
government and non-government provision. At least one school with primary grades was
selected in every sample village to survey in detail.
The study highlights priority areas of intervention for effective implementation of the RTE Act in
these states.
This was in the nature of a pilot study to develop easy to use tools to monitor different aspects
of RTE implementation. The value of the research is that the tools and framework of analysis
can be used as resources for other groups interested in conducting such surveys.
Methodology
The survey was designed as a baseline survey which would serve as a tool for monitoring
implementation of RTE. The two states were selected because they have among the highest
proportions of children (6-13 year age group) out of school (7.6% in UP, 7.2% in Bihar, according
to SRRI, 2009).
The study is based on primary data collected from all schools in 89 villages in Bihar and 102
villages in UP. There were also informal interviews with key informants in the two states. In
particular, the research team spoke to officials in the Department of Education in Bihar and UP
including the Education Secretaries, and to those working in this field from non government
organizations4 active in the development sector, to get their perspective on the current
situation.
4 Both states have several groups active in the RTE Forum – a nation-wide network of civil society organizations
working on mobilizing all stakeholders for better implementation of RTE.

26
The primary data is primarily quantitative but with qualitative elements. Data was collected in a
single visit to a selected village by a 4 person team. During the visit data was collected from all
education institutions in the village. In addition school and village functionaries responsible for
RTE compliance were interviewed and, where possible, supplemented by structured
observation by the survey team.
More detailed observation was done in one or two sample schools in the village. All other
educational institutions – anganwadi centres, and all government and private schools were
surveyed using a structured questionnaire. There was a short semi-structured questionnaire for
a panchayat member in the sample villages to record their involvement in RTE implementation
and a longer semi-structured questionnaire for an executive member of the School
Management Committee was used for the same purpose. In both cases, any records kept at
were looked at by researchers. Details about village characteristics and facilities were collected
to set the context of the schooling data.
For the detailed school survey, details of schooling facilities, teachers and administration were
collected through semi-structured interviews with head-teachers. This was supplemented by
structured observations of the school infrastructure and functioning,5 and collection of data
from the attendance registers and other registers. Upto two class teachers6 (Class 3 and Class 7)
were interviewed in each of these schools to record their knowledge and perception of RTE
rules and the extent to which they are implementing them inside the classroom. This was
supplemented by structured observations inside upto 2 classrooms7 (Class 3 and Class 7) for the
duration of one period in the school day.
Sampling design
The main principle behind the sampling strategy was to generate reliable estimates. Villages
were selected through multistage stratified random sampling. While randomness was an
important criterion for selection, attempt was made to keep the survey logistically feasible
within a limited time and budget. A sample of 90 villages in Bihar and 102 villages in UP was to
be selected. The sample size was determined with the help of the sample size calculator
(www.surveysystem.com) to give reliable estimates.8
5 This included aspects such as physical infrastructure, midday meal, whether children are left to wander around
unattended, whether there is any organized activity outside the classroom. 6 The number of class teachers interviewed depended on the grades being taught in the school. Schools with both
primary and upper primary grades had both a class 3 and class 7 teacher interviewed. Schools with only primary
grades had only a class 3 teacher interviewed. Schools with only upper primary grades had only a class 7 teacher
interviewed. 7 A similar rationale applies for the number of classrooms observed. Schools with only grades 1-5 had only class 3
observed. Schools with only grades 6-8 had only class 7 observed. Schools with grades 1-8 had both classes 3 and 7
observed. 8 These estimates have a confidence interval (or margin of error) of 10% and confidence level is 95%. So it is
possible to predict with 95% confidence level that the actual value lies within an interval of 10% (plus or minus) of
the estimate. Probability theory suggests that the sample size for a given confidence level and confidence interval

27
Selection of districts: A two stage stratified random sample design was adopted to select this
sample. For the first stage NSSO’s classification of states into regions and sub-regions was used.
In Bihar there are 7 NSSO sub-regions. 15 districts were chosen in the following way: two
districts were chosen randomly from 6 sub-regions, and 3 districts were chosen randomly from
Purnea sub-region (which was larger than other sub-regions). In Uttar Pradesh there are 17 sub-
regions. 17 districts were chosen randomly – one from each sub-region.
Selection of blocks: The village directory used by RGI for census survey was used as the
sampling frame. The blocks in the villages were stratified into two strata according to the
population size. One block was chosen randomly from each strata, that is one large and one
small block were selected.
Selection of villages: From each selected block, villages with a population less than 300 were
not considered as, according to Government norms, the probability of a school in small villages
is low. Very large villages (population more than 8000) were also not considered as they are
comparatively few in number and have some urban characteristics. The villages with population
between 3000 and 8000 in 2001, were stratified into three sub-stratums according to their
population size. One village was chosen randomly from each strata, giving us 3 sample villages
from each block, and 6 sample villages from each district. As the focus was to survey
government schools, villages which did not have a government school were replaced.
Selection of schools: Some basic information was collected from all educational facilities in the
sample villages – from pre-primary to higher secondary – government and private. In Bihar’s 89
villages, there were 136 government schools, 7 private schools, 7 madarsas, and 163
anganwadis. In UP’s 102 villages, there were164 government schools, 55 private schools, 4
madarsas, and 161 anganwadis. In addition, the team surveyed in detail a sample of schools: 95
schools with primary grades and 62 schools with upper primary grades in Bihar, and 101 schools
with primary grades and 58 schools with upper primary grades in UP.9
In Bihar, the government schools usually had classes 1 to 5 (primary) or classes 1 to 7 or 8
(upper primary). So if a village had both a 1-5 and 1-8 school,10
the team was asked to choose
the 1-8 school as the school to survey in detail as the study was focused on elementary
education rather than only primary education. The 1-5 schools had generally been set up more
recently and had much poorer infrastructure and lower enrolment per grade compared to the
1-8 schools. If the village had more than one primary school, the largest primary school was
selected. In Bihar, the schools surveyed in detail included 34 primary schools (with grades 1-5),
61 upper primary schools with grades 1-8, and 1 school with grade 6-8, which together
does not depend on population (total number of villages in each state), when the population is very large. So even
though the number of villages in Uttar Pradesh is much larger than in Bihar, we took a similar sample size. 9 The proposal had been to select a certain number of government schools to survey in detail – at least 90 schools
with primary grades and 30 schools with upper primary grades in Bihar, and at least 102 schools with primary
grades and 34 schools with upper primary grades in UP. 10
This was true for 36% of the sample villages in Bihar.
28
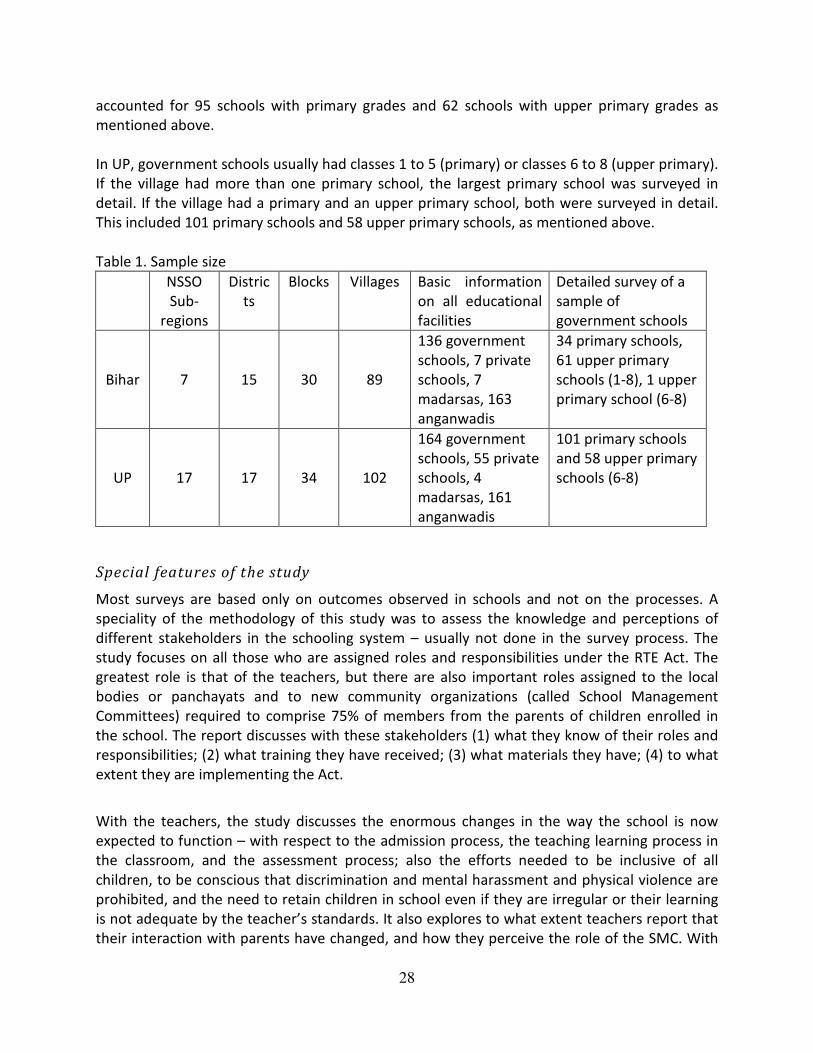
accounted for 95 schools with primary grades and 62 schools with upper primary grades as
mentioned above.
In UP, government schools usually had classes 1 to 5 (primary) or classes 6 to 8 (upper primary).
If the village had more than one primary school, the largest primary school was surveyed in
detail. If the village had a primary and an upper primary school, both were surveyed in detail.
This included 101 primary schools and 58 upper primary schools, as mentioned above.
Table 1. Sample size
NSSO
Sub-
regions
Distric
ts
Blocks Villages Basic information
on all educational
facilities
Detailed survey of a
sample of
government schools
Bihar 7 15 30 89
136 government
schools, 7 private
schools, 7
madarsas, 163
anganwadis
34 primary schools,
61 upper primary
schools (1-8), 1 upper
primary school (6-8)
UP 17 17 34 102
164 government
schools, 55 private
schools, 4
madarsas, 161
anganwadis
101 primary schools
and 58 upper primary
schools (6-8)
Special features of the study
Most surveys are based only on outcomes observed in schools and not on the processes. A
speciality of the methodology of this study was to assess the knowledge and perceptions of
different stakeholders in the schooling system – usually not done in the survey process. The
study focuses on all those who are assigned roles and responsibilities under the RTE Act. The
greatest role is that of the teachers, but there are also important roles assigned to the local
bodies or panchayats and to new community organizations (called School Management
Committees) required to comprise 75% of members from the parents of children enrolled in
the school. The report discusses with these stakeholders (1) what they know of their roles and
responsibilities; (2) what training they have received; (3) what materials they have; (4) to what
extent they are implementing the Act.
With the teachers, the study discusses the enormous changes in the way the school is now
expected to function – with respect to the admission process, the teaching learning process in
the classroom, and the assessment process; also the efforts needed to be inclusive of all
children, to be conscious that discrimination and mental harassment and physical violence are
prohibited, and the need to retain children in school even if they are irregular or their learning
is not adequate by the teacher’s standards. It also explores to what extent teachers report that
their interaction with parents have changed, and how they perceive the role of the SMC. With
29
SMC executive members, the study discusses the composition of their organizations, how often
they meet, and to what extent they fulfil the roles assigned to them. With panchayat members,
the study tries to explore how they see their roles and what their knowledge is of village
children who are out of school / from migrant families. With all stakeholders, the study looked
particularly at evidence to see if any systems had been put in place to ensure that they carried
out their assigned duties. Specifically, the team asked to see any registers in the school which
might keep a record of such activities.
Such a study is useful for policy directions – if RTE norms are not fulfilled did the shortcomings
arise from lack of clarity of concepts among the stakeholders, or stakeholders not fulfilling their
duty even while knowing what is required of them. The survey looks at gaps in every area – lack
of capacity, lack of infrastructure and support, and / or lack of monitoring.
Limitations of the study
Limited data was collected from private schools. The focus was particularly on progress towards
RTE compliance in the government schools in the two states.
The purpose of the study was to get a macro picture of the government schooling system, and
identify systemic issues in implementation of the RTE Act. It was a large cross-sectional survey
of educational facilities and conducted within a short period of time (based on a visit to 6
randomly selected villages in a randomly selected district each week). The intention was to use
an easily replicable model. It was not designed to probe into issues which require complex
methodology and especially trained investigators. Such a study may require repeated visits to
the research site to probe a fewer number of issues in greater depth. To capture issues such as
discriminatory attitudes / mental harassment / physical violence in schools, research which is
particularly focused on this, is more useful than a broad based survey. Such a survey is good to
capture only stray incidents of discrimination which may occur at the time of the research
team’s visit to the school. Nevertheless, efforts were made to raise these issues with teachers
and researchers were asked to note any signs of discrimination, however subtle, as well as
teachers’ engagement around issues of inclusion.
The study was focused on the supply side of schooling – in particular the providers on the
ground. The design and methodology did not include the exploration of perceptions of parents
and children. This could be usefully done in another study to get feedback from parents and
children to see what they understand of the provisions of the RTE Act, and what their
experience is of the way in which it has been implemented.
The survey collected information on the official length of the school day and the official number
of working days to get an idea of the system in each state as it is officially operating on the
ground. It was not to check how long the school actually functioned or how many days the
school was open. Feedback from parents and children were hence not considered a critical part
of the study.

30
Structure of the report
Findings of the study are presented separately for Bihar (see Part A) and UP (see Part B). The
study is focused both on school management and school functioning.
Section 1 provides the context in each state. Section 2 looks at what infrastructure and facilities
were available in all schools in the sample villages, and whether these facilities were usable.
Provision of teachers was also noted for these schools.11
Section 3 looks at school policies
specified under RTE which are aimed to bring all children into school and retain them in school
for at least 8 years, particularly children on the margin (those from socially disadvantaged
groups, children with disability), who are most at risk of dropping out due to problems at home
and/or in school. Findings are based on a sample of government schools surveyed in detail.12
Head teachers were interviewed for their perceptions; data from the registers were noted.
Section 4 looks at the teacher cadre and at the functioning of the school including actual
teacher and student attendance, and the profile of teachers in terms of qualifications, training,
and salary scales. This was based on interviews with the head-teacher, and the class 3 and class
7 teachers in the sample of government schools. Section 5 looks at the Act’s guidelines for
teachers, in terms of how they are to transact the curriculum. This again was based on the
sample of government schools surveyed in detail where these issues were discussed and
activities were observed both inside specified classrooms and outside. Section 6 looks at issues
of accountability in the schooling system – particularly at the role of the head teacher, and of
the School Management Committees. This was based primarily on what is reported by the
head-teachers, and those members interviewed from the panchayat and the SMCs. Written
records were looked at to note the systems in place. For the UP report, Section 7 deals with
private schools, while this has been incorporated into Section 1 in the Bihar report. The final
section is the concluding section which raises a number of key issues based on the study and
makes suggestions for action in each State.
11
This included 136 schools in Bihar and 164 schools in UP. 12
This consisted of 34 primary schools, 61 composite upper primary schools, and 1 upper primary school in Bihar;
and 101 primary schools and 59 upper primary schools in UP.

31
Champaran
(w)
Darbhanga
SitamarhiChamparan
(e)
Lakhisarai
Begusarai
Saran
Bhojpur
NawadaGaya
Ma
dh
ep
ura
Bhagalpur
Purnia
Kishanganj
Kaimur
(Bhabua)
Sample Districts in
Sample Districts in UP

32
PART A. BIHAR
SECTION 1. INTRODUCTION
1.1 Background
Bihar is the third most populous state in India with 103.8 million inhabitants in an area of
94,163 sq kms according to the 2011 census estimates. According to the 2001 Census, Muslims
formed 16.5% and Scheduled Castes 15.7% of the total population in the state. Out of the 38
districts the state is divided into, districts with high Muslim population are Kishanganj (67.6%),
Kathiar (42.5%) and Araria (41.4%) and those with high concentration of SC population are Gaya
(29.64%), Nawada (24%) and Aurangabad (23.49%). The total Scheduled Tribe population in the
state was low (0.9%).
The Bihar plain is divided into two by the river Ganga which flows through the middle from west
to east. Owing to the Ganga and its tributaries Kosi, Gandak and Bhagmati, the state has rich,
fertile plains. Thus agriculture and trading are the main livelihood options in Bihar with 85%
population living in rural areas.
Bihar, however, continues to be one of the most underdeveloped states in the country. Its per
capita state domestic product is the lowest among major states, only one third of the national
level. Bihar suffered a major setback in terms of industrial development with the separation of
the mineral rich districts to Jharkhand in 2000. The state is was virtually devoid of an industrial
sector and was left with the smallest industrial base in the country, contributing only about 12%
towards the state’s gross state domestic product and employing less than 10% of its workforce
(Rorabacher, 2008). Agriculture, the backbone of employment in Bihar, has its own set of
problems. It generates only 40% of the state’s GDP. According to a World Bank Report (2007),
the agricultural output in Bihar has been highly volatile due to shocks from both drought and
periodic flooding during monsoons. Additional factors such as low investment rates, poor water
management and weak transport and marketing infrastructure have all contributed to the
economic backwardness of the state.
The persistent poverty has led to frequent out migration from the state. Manual laborers
migrate to states such as Punjab, Haryana and Maharashtra in search of employment
opportunities. The extreme poverty in the state manifests itself in inadequate nutrition among
children. The NFHS-III report observed that among all Indian states, this problem is most
pronounced in Bihar, along with Madhya Pradesh and Jharkhand. Undernourishment among
women is also a crucial indicator of deprivation and undernourished women are also much
more likely than other women to have children who are undernourished. Bihar has the highest
proportion of women who are undernourished (45%).
However, in recent times this seems to be changing with some of the government initiatives
showing success. Reportedly, MNREGS and development work in the state have led to

33
reduction of out migration by nearly 26%. (The Hindu, March 18, 2012). Another important
initiative in this context has been the Bihar Rural Livelihoods Project that has been initiated by
the Government of Bihar to promote and improve social and economic development of rural
poor and women in the state. It also incorporates the Panchayati Raj Institutions in the
implementation of schemes such as PDS, ICDS and MNREGA. In addition, this project aims at
providing opportunities for primary and secondary education and to improve access to
preventive and reproductive health care.
The literacy rate in Bihar, according to the 2011 census is 63.8%, with 73% literate males and
53% literate females. Purnea is the district with the lowest literacy rate (52.5%). Some other
districts with relatively low literacy are Katihar (53.6%), Araria (55%) and Kishanganj (57%), all
three of which also have a high concentration of minority population.
The 2011 literacy rates for various social groups are not available yet. According to the 2001
census, the literacy rates are very low at 36% for Muslims and around 28% for SCs13
and STs
compared to the state average of 47.5%. However, these rates are likely to have improved now.
Bihar also accounts for a substantial proportion of out of school children – the 2009 out of
school survey conducted by SRI-IMRB found 7.3% of 6 to 13 year old children (1.3 mn children)
in Bihar were out of school – as compared to the national average of 4.3%.
The Bihar Government has made several initiatives to encourage school enrolment and
regularity. The schemes initiated by the Government14
include: Mukhyamantri Akshar Anchal
Yojana, Mukhyamantri Kanya Suraksha Yojana, Mukhyamantri (Balika) Cycle Yojana,15
Shaishnik
Paribraman Yojana16
and Mukhyamantri Balika Poshak Yojana,17
many of which specifically
target girls. In 2011, Bihar won the national award in literacy for making an overall jump in the
literacy rate, especially among women.
1.2 Notifications by Government of Bihar related to RTE
The Government of Bihar formulated the Draft Rules for RTE implementation on 12 May 2011.
Most of the orders included in the Draft Rules were published in the Dainik Jagaran on 29
January 2012.
13
There is considerable variation among the Scheduled Castes. Among the major castes included in the SCs, Dhobi
have the highest proportion of matriculates (19.7%), whereas Musahar and Bhuiya have the lowest proportion of
matriculates (6% each). 14
http://www.biharonline.gov.in 15
Each girl who takes admission in class IX is provided with a sum of Rs 2000/- for purchasing a cycle, in order to
encourage her to continue with further education. 16
This covers educational tours for children. 17
Each girl child who is a student of upper primary section (class VI-VIII) is provided with Rs 700/- for purchasing
two sets of school dresses, one pair of shoes and stationary items.

34
The Draft Rules contain some provisions with regard to which government orders have been
issued earlier. This includes certain provisions to reduce costs of schooling for all children.
Students studying in government-run primary and upper primary schools are to be given funds
to purchase two sets of school uniforms, a pair of shoes, and various items of stationery18
.
Students in Classes I-VIII are also provided with all books, free of cost for each academic
session.
In addition, the setting up of neighborhood schools19
and the school certification of
recognition20
are other examples of orders issued in May 2010, and part of the 2011 Draft
Rules. The Bihar government has also pursued the constitution of SCPCR to monitor the
children’s right to education with a notification issued on 19 August 2010.
In addition to the requirement that private schools with upper primary grades must seek
recognition before they will be allowed to function, the RTE Act requires the reservation of
seats in private schools for children of economically weaker sections. On 20 December 2010 a
first notification was issued, and it was notified again on 28 March 2011. The feature of the
notification includes 25% seats in private schools to be reserved for children from economically
weaker sections (ST/SC/EBC/BC/minority children), and out of this 50% of the seats shall be
reserved for girls.
The March notification followed a notification dated 24 February 2011 on RTE-related issues,
sent from the Bihar HRD Ministry to all the local authorities. Some provisions were notified as
early as 11 May 2010, and then again on 24 February 2011. These include the no denial of
admission due to lack of age proof documents; prohibition of retaining children in the same
class and prohibition of expulsion, though annual examinations can be held in every school; and
the prohibition of physical punishment and mental harassment. Teachers were not to be given
non-teaching activities with some exceptions. Other provisions included in the 24 February
2011 notification for teachers are the need for disciplinary action against teachers who do not
abide by the requirements of the RTE Act including the prohibition of private tuitions. There
were also more regulatory provisions for private schools. No capitation fee or screening test
was to be allowed at the time of admission.
The Bihar government has also issued a notification on 12 March 2012 regarding the
implementation of Comprehensive and Continuous Evaluation and the making of “pupil
cumulative record” for each child.21
Orders were issued on 22 June 2012 about minimum
working days for schools and hours for teachers. “A minimum of 200 working days and 800
instruction hours shall be required for Classes I-V, and 220 days and 1000 hours for Classes VI-
18
The funds, paid out by the Village Education Committee (VEC), amount to Rs. 400/500/700 for students in
Classes III-V. This is part of the Mukhyamantri Poshak Yojana. 19
The definition of a neighborhood school within 1 and 3 kilometers has to be decided by the Head Teacher and
the “District Education Publicity (Prasar) Officer”. See circular 11.05.2010 – 8v3 157/2003. 20
No school with class I-VIII can be established prior to recognition from the State. 21
Section 18(1) of the Bihar Rules states that a “chhatra sanchayee abhilekh” is to be maintained in pursuance of
section 29(2)(h) of the RTE Act.

35
VIII. Teachers should spend 45 hours a week in teaching and preparing materials, and the Head
Teacher should determine the weekly routine for the teaching-learning activities.”
Notifications issued by Government of Bihar
Neighborhood definition Notification issued on 11-05-
2010
Certificate for recognition Notification issued on 11-05-
2010 and 15-02-11
Constitution of SCPCR Notification issued on 19-08-
2010
25% reservation of seats in private schools for children
from EWS
Notification issued on 20-12-
2010 and 28-03-2011
Notification of State Rules Notification issued on 12-05-
2011
No denial of admission Notification issued on 24-02-
2011
Prohibition of holding back and expulsion Notification issued on 24-02-
2011
No corporal punishment Notification issued on 24-02-
2011
No capitation fee Notification issued on 24-02-
2011
Banning private tuition Notification issued on 24-02-
2011
Prohibition of non-academic activities done by teachers Notification issued on 24-02-
2011
Disciplinary actions against teachers who do not abide by
orders
Notification issued on 24-02-
2011
Implementation of CCE Notification issued on 12-03-
2012
Minimum instructional hours Notification issued on 22-06-
2012
The RTE Draft Rules for Bihar also encompass the formation of ad hoc committees for each
primary and middle school as part of the Bihar Elementary School Education Committee Act
(2011). It consists of 6-7 members, including parents, the elected ward member of the Gram
Panchayat/Nagar Nikay, as well as the Head Teacher/Head Master of the school. The functions
of these committees have also been specified. In 2011, the government of Bihar also sent a
notification to all local authorities asking them to implement the RTE rules.
The State Rules also include specific norms for persons with disabilities. Sections 4(7) and 4(8)
and 5(1) state that appropriate and safe transportation shall be arranged for children with
disabilities in order to attend and complete the elementary education cycle. Besides free

36
textbooks and uniforms, disabled children should also be provided with free Special Classes,
support material and equipments. It encompasses residential bridge courses for Children with
Special Needs (CWSN) in order to prepare them for school, and hence improve the quality of
inclusion.
Details on eligibility and working conditions of teachers – qualifications including clearing the
Bihar Teacher Eligibility Test (TET), grade, salaries, retirement and transfer policies -- were also
put out in 2012. A critical requirement for RTE compliance was providing training facilities for
teachers. The government of Bihar had proposed training by SCERT, training through Nalanda
Open University, and training through IGNOU.
Recruitment of teachers is based on the Bihar Panchayat Elementary Teacher Rules, 2012 which
stipulates three teacher grades -- Basic Grade22
for primary and upper primary teachers;
Graduate Grade23
for upper primary teachers, and Head teachers Grade24
. There was also a
provision to recruit Instructors for Rs. 4,000 per month. Regular teachers recruited prior to the
Panchayat Teacher Rules are paid according to the specifications of the Pay Commission.
Regarding teachers’ qualifications, a test (TET) was held in 2012 and in case teachers did not
clear the exam, they could train for two years before re-appearing for the exam. Teachers were
also to be provided with training facilities proposed by the SCERT and approved by the NCTE.
1.3 Sample villages
As mentioned in the introduction to the report, 89 villages were visited in Bihar between
November 2011 and February 2012. The villages varied widely in size. The number of
households per village varied from a minimum of 77 households to a maximum of 1921.
Median number of households was 377.
Nearly all the sample villages in Bihar could be reached by motorable road. The road was
metalled in the case of over two fifths of the villages (42.1%). One third of the villages had
paved roads, in the sense of being paved by stones. One fourth of villages had unpaved roads,
of particular consequence since Bihar has a heavy monsoon and much of it is flood prone. The
type of housing also indicates that families are likely to face problems in the monsoon and the
winters. More than two thirds of the villages (68.2%) had a mix of pakka and kachha housing;
over one fifth (20.5%) of the villages had mostly kaccha houses, and only a little over one tenth
(11.4%) had mostly pakka housing.
The availability of drinking water in the sample villages was particularly important for this study
in the light of the fact that the RTE Act requires schools to provide children with safe and
22
Trained Teacher – Rs. 7,000 per month; Untrained Teachers – Rs. 6,000 per month. 23
Trained Teacher – Rs. 8,000; Untrained Teachers – Rs. 7,500 per month. 24
Head Teacher (trained and for upper primary level) – Rs. 14,000 per month.

37
adequate drinking water. The main source of drinking water in Bihar’s sample villages was
hand-pumps. Only 10.1% of the villages reported getting piped water.
1.4 Number of government and private schools
In terms of government provision, all 89 sample villages had access to primary schooling;25
63
villages had access to upper primary schooling.26
Twenty three villages had a government
upper primary school within a distance of 3 kms, as required by the Bihar Government Rules for
implementation of RTE. There were only 2 villages which had an upper primary school at a
distance of more than 3 kms.
As many as 71 government primary schools (mostly with grades 1-527
), 64 government upper
primary schools (all but one were composite schools), and 1 government secondary school
(with grades 1-10) were surveyed. In addition the there were 7 private schools -- 6 had only
primary grades (with either pre-primary to grade 5 or grade 1 to grade 5) and 1 was a
secondary school (with pre-primary to grade 10). There were 7 madarsas. The private schools
and madarsas will be discussed in greater detail later on in this section.
Table 1.1 Profile of Schools in Bihar’s Sample Villages
Type of Schools Government
Schools
Private Schools
Primary schools 71 6
Upper primary schools with primary grades 63 1
Schools with upper primary grades only 1 0
Schools with primary, upper primary and secondary
grades 1* 0
Total 136 7
*The school has classes 1 to 9.
Source: CORD Survey 2011-12
1.5 Size of government schools
The number of students enrolled is of particular importance when we are looking at the issue of
compliance with RTE. The Pupil Teacher Ratio specified and the need for a head-teacher varies
for schools with enrolment less than 150 and more than 150 in primary grades. The bulk of
primary schools (40 out of 69) in Bihar had less than 200 children enrolled.
25
This included all schools with primary grades i.e. schools with grades 1-3, 1-5, 1-6, 1-7, 1-8 and 1-10 schools 26
This included schools with grades 1-6, 1-7, 1-8, 6-8, and 1-10. 27
Some also had grades 1-2, 1-3, or 1-4.

38
Table 1.2 Distribution of Government Primary Schools by Enrolment in Bihar
Total Enrolment
No. of schools Proportion of schools
(%)
Less than or equal to 100 13 18.9
More than 100 but less than or equal to 200 27 39.1
More than 200 but less than or equal to 300 21 30.4
More than 300 but less than or equal to 400 7 10.1
More than 400 1 1.5
Total 69 100
Note: Enrolment data was not available for 2 primary schools.
Source: CORD Survey 2011-12
Table 1.3 Distribution of Government Upper Primary Schools* by Enrolment in Bihar
Total Enrolment No. of Schools Proportion of schools
More than 100 but less than or equal
to 300 8 13.1
More than 300 but less than or equal
to 400 19 31.1
More than 400 but less than or equal
to 500 14 23.0
More than 500 but less than or equal
to 700 9 14.8
More than 700 but less than or equal
to 900 11 18.0
Total 61 100
*All but one of these schools had primary cum upper-primary grades.
Note Enrolment data was not available for 2 of the schools with grades 1-8.
Source: CORD Survey 2011-12
While most of these schools were up to class 8, a few recently upgraded schools had classes 1
to 6 or 1 to 7. Only one school had classes 6 to 8. They showed considerable variation in size. A
small proportion (13%) had less than 300 enrolled. The majority had between 300 and 500
enrolled (54%). Close to one third of the upper primary schools had more than 500 students
enrolled.
The average enrolment (see Table 1.4) in the government schools in the sample villages was
markedly higher in the upper primary schools. Enrolment in both the primary and upper
primary sections was high in the upper primary schools. Enrolment in the primary schools was
185, enrolment in the primary grades in the upper primary schools was 257.

Based on all government schools in sample villages
Source: CORD Survey 2011-12
1.6 Enrolment in government schools
Table 1.5 gives the proportions of children from disadvantaged groups enrolled in primary and
upper primary schools.
Primary stage: High proportions of SCs and Muslims:
proportion of children from SC communities is
of these children is much higher than their average population in the state as per the 2011
Census (15.7%). The enrolment figure for children
slightly lower than their representation in the average population in the state as per the 2011
Census (0.9%). Finally, there are
population in the state is 16.5%. Taking all disadvantaged groups together, children from these
groups constitute around 37% of the enrolment in the primary
Table 1.5 Enrolment of Children from Disadvantaged Groups in Government Schools in
Proportion enrolled in
Primary stage (class 1 to 5)
Upper primary stage (class 6 to 8)
Both stages (classes 1 to 8)
Primary schools
Upper primary schools
Based on all government schools in sample villages
Source: CORD Survey 2011-12
184.6
0
0
100
200
300
400
500
600
Primary Schools
En
rolm
en
tFigure 1.4: Average Enrolment in Government Schools
39
Based on all government schools in sample villages
in government schools of children from disadvantaged communities
the proportions of children from disadvantaged groups enrolled in primary and
: High proportions of SCs and Muslims: It can be seen from Table 1.5
proportion of children from SC communities is 17.2% in the primary classes. The representation
of these children is much higher than their average population in the state as per the 2011
Census (15.7%). The enrolment figure for children from ST groups is 0.8% in the primary
than their representation in the average population in the state as per the 2011
Census (0.9%). Finally, there are 18.7% Muslim children in primary classes. The average Muslim
state is 16.5%. Taking all disadvantaged groups together, children from these
% of the enrolment in the primary section in the sample villages.
Table 1.5 Enrolment of Children from Disadvantaged Groups in Government Schools in
% SC % ST
17.2 0.8
stage (class 6 to 8) 11.6 0.3
15.9 0.7
20.1 1.4
14.1 0.4
Based on all government schools in sample villages
335.1
163.9
Primary Schools Upper Primary Schools
Figure 1.4: Average Enrolment in Government Schools
in Bihar
Upper
Primary Sections
of children from disadvantaged communities
the proportions of children from disadvantaged groups enrolled in primary and
Table 1.5 that the
. The representation
of these children is much higher than their average population in the state as per the 2011
% in the primary classes,
than their representation in the average population in the state as per the 2011
. The average Muslim
state is 16.5%. Taking all disadvantaged groups together, children from these
in the sample villages.
Table 1.5 Enrolment of Children from Disadvantaged Groups in Government Schools in Bihar
% Muslims
18.7
18.0
18.5
20.4
17.8
Figure 1.4: Average Enrolment in Government Schools
Upper-primary Sections
Primary Sections

Upper primary stage: fewer SCs and STs:
upper primary stage is much lower (1
demographic characteristics of the villages within which the upper primary schools are located
but more likely it reflects that school participation of disadvantaged groups drop
upwards in the school system. The
0.3% in the upper primary classes
enrolment in upper primary classes show
Enrolment of disadvantaged groups is much higher
Table 1.5. These schools have been established in more recent years and probably reflect
government policy of improving access to schools for the disadvantaged sections.
schools had low enrolment on average (particularly compared to the upper primary schools)
indicating that they are not highly in demand
could be catering primarily to disadvantaged groups. The primary schools had
recruited teachers; close to half of the teachers in these schools had had no professional
teacher education. In contrast, the upper primary schools had a higher proportion of regular
teachers (29%), a better qualified and trained teacher cadre.
more poorly resourced. 28
1.7 Gender wise enrolment in government schools
Figure 1.6 shows that proportion of girls enrolled were quite high for both primary and upper
primary stages in the government schools
Source: CORD Survey 2011-12
Based on all government schools in sampl
28
Based on her work in a village in Jharkhand, Nitya Rao (2009) found that new schools set up under SSA to solve
the problem of accessibility to schooling for childr
For example, these schools (known as New Primary Schools) were entitled to recruit only lower
trained local teachers. The recently opened primary schools in Bihar seem to be simil
0
Primary Stage
Upper Primary Stage
Figure 1.6: Enrolment (%) by Gender in Government
40
fewer SCs and STs: The proportion of children from SC communities in the
is much lower (11.6%) than in the earlier stage. This could partly reflect the
demographic characteristics of the villages within which the upper primary schools are located
but more likely it reflects that school participation of disadvantaged groups drop
The enrolment figures for children from ST groups
classes. The situation is more positive for the Muslim children as the
enrolment in upper primary classes shows only a small decline at 18%.
oups is much higher in primary schools as seen in the last row of
Table 1.5. These schools have been established in more recent years and probably reflect
government policy of improving access to schools for the disadvantaged sections.
had low enrolment on average (particularly compared to the upper primary schools)
indicating that they are not highly in demand – they could be in more remote areas, or they
could be catering primarily to disadvantaged groups. The primary schools had
recruited teachers; close to half of the teachers in these schools had had no professional
teacher education. In contrast, the upper primary schools had a higher proportion of regular
, a better qualified and trained teacher cadre. The primary schools appear to be
Gender wise enrolment in government schools
1.6 shows that proportion of girls enrolled were quite high for both primary and upper
primary stages in the government schools – a very slight decline is noted in the
Based on all government schools in sample villages.
Based on her work in a village in Jharkhand, Nitya Rao (2009) found that new schools set up under SSA to solve
the problem of accessibility to schooling for children of marginalized groups were very poorly resourced schools.
For example, these schools (known as New Primary Schools) were entitled to recruit only lower
trained local teachers. The recently opened primary schools in Bihar seem to be similar.
51
52
49
48
Figure 1.6: Enrolment (%) by Gender in Government
Schools in Bihar
% Boys % Girls
The proportion of children from SC communities in the
This could partly reflect the
demographic characteristics of the villages within which the upper primary schools are located
but more likely it reflects that school participation of disadvantaged groups drops as one moves
enrolment figures for children from ST groups also drop to
situation is more positive for the Muslim children as the
as seen in the last row of
Table 1.5. These schools have been established in more recent years and probably reflect
government policy of improving access to schools for the disadvantaged sections. The primary
had low enrolment on average (particularly compared to the upper primary schools)
they could be in more remote areas, or they
could be catering primarily to disadvantaged groups. The primary schools had 86% locally
recruited teachers; close to half of the teachers in these schools had had no professional
teacher education. In contrast, the upper primary schools had a higher proportion of regular
primary schools appear to be
1.6 shows that proportion of girls enrolled were quite high for both primary and upper
the higher classes.
Based on her work in a village in Jharkhand, Nitya Rao (2009) found that new schools set up under SSA to solve
en of marginalized groups were very poorly resourced schools.
For example, these schools (known as New Primary Schools) were entitled to recruit only lower-paid and less-
100
Figure 1.6: Enrolment (%) by Gender in Government

41
1.8 Characteristics of private schools
Private schooling in Bihar is largely an urban phenomenon. In the sample villages, the number
of private schools in the 89 selected villages was reported to be only 7 in number. These
schools are all primary schools with the exception of one secondary school. Only in one case
was the school reported to be recognised and aided by the government, a primary school with
300 Muslim children reportedly set up more than 40 years ago. The land on which this school
was functioning had been provided by the government. No fees were charged. Recognition did
not appear to be based on infrastructural norms as this school did not have a playground.
Enrolment in the private schools varied from 37 students to 300. Schools with enrolment of
more than 200 were the 3 schools which charged no fees (see discussion below).
There was no pattern in terms of fees charged in these few private schools.
• Scholarships given to children: A small NGO-run school for child labourers had been set
up recently and had only 50 children enrolled. The school had 1 classroom and 4
teachers. Children were not only charged no fees but were given Rs 100 by the NGO. It
appears to be part of a scheme to promote education among children who might
otherwise be part of the labour force.
• No fees for all: This was true for the single aided school mentioned above and for two
other schools, all three of which had only Muslim children enrolled.
• No fees for some: In one school, the students included 13 orphans who were not
charged fees as well as being given free textbooks and uniforms. The others were
charged Rs 100-150 per month.
• Monthly fees of Rs 50: This was a new school which was comparatively large with 179
children in the pre-primary section and 38 children enrolled in the primary grades. The
school had 10 classrooms and 9 teachers. It was reported to be in the process of getting
recognition.
• Monthly fees of Rs 100-125: One unrecognized school was being run by a large
organisation, reported to have a district office in Gaya, and the head office in Kolkata. It
had 5 teachers for 150 children from nursery to Class 3. In another, the numbers
enrolled was as low as 37 children.
• Monthly fees of Rs 200: This was the highest fee being charged – Saraswati Shishu Vidya
Mandir had 8 teachers for 131 children. Infrastructure and facilities were comparatively
better. The majority of those enrolled were boys.
The physical infrastructure in these 7 schools was also quite variable -- the number of
classrooms reported to be in use varied from 1 to 10. A hand-pump for drinking water was
generally available. Most schools had a playground, though its smallness was reported to be a
problem in a few cases. The schools generally had some sports equipment, some charts, and
some indoor games such as ludo and carom.

42
Screening at the time of admission was being done through an entrance test in 3 of the 7
private schools. All the schools reported that they have a structured system of assessment, with
regular examinations held half yearly and quarterly.
1.9 Madarsas
There were 7 madarsas in the sample villages in Bihar in 6 of which children are studying only in
primary grades. The madarsa with the largest number of children had 400 children in primary
and 425 children in upper primary grades. In two cases, the schools were residential but only
for girls in one case. Enrolment tended to vary – the lowest was 50, the highest 825. In between
these two extremes, were madarsas which reported between 150-250 children enrolled.
The madarsas generally had poor physical infrastructure. Most did not have a playground.
Charts and other TLM materials were not found.
Most of the madarsas had a tubewell as a source of drinking water. The madarsa which was a
residential school for girls had comparatively good infrastructure. It had a boundary wall which
was plastered, an office room with one table, 2 chairs and a cupboard, 2 handpumps, and a
toilet in good condition. The team also found a globe and a map, as well as clay utensils and a
stove in the kitchen. The 4 madarsas which had been set up before 2000 had better provision of
teachers and classrooms, compared to the 3 which had been set up later.
The system of assessment tended to vary. In one case, classes 1-3 has only oral tests, whereas
students from classes 4-8 had to take written tests; in another case the system consisted of oral
tests for Arbi-Koran and written ones for Urdu, English and Hindi.
1.10 Anganwadis
Bihar’s sample villages revealed a considerable shortage of anganwadis. Of these 89 sample
villages, 9% had no anganwadis at all. These villages without anganwadis were large – they had
330 households on average and should have had at least one anganwadi. While the remaining
had anganwadis, in several cases more than one, the village population was quite high and the
number of anganwadis was often less than what was required. As given in Table 1.7, the
majority (82%) of sample villages had between one and three anganwadis. A small proportion
of villages had between 4-6 anganwadis.
Table 1.7 Distribution of Villages by Number of Anganwadis
No. of anganwadis in a
village
No. of villages with
specified number of
anganwadis
Percentage of villages with specified
number of anganwadis
0 8 9.0
1 36 40.4
2 to 3 37 41.6

43
4 to 6 8 9.0
Total 89 100.0
Source: CORD Survey 2011-12
One Anganwadi Centre (AWC) from each of the sample villages was visited. The following
discussion is based on this. Most centres were reported to be open from 10 am to 2 pm. The
enrolment was quite uniform. More than 80% had an enrolment of 40, and the remaining had
around 80. Girls’ enrolment was quite high and in 60% of cases they constituted more than half
of the children reported to be enrolled.
There were no children present in 3 AWCs. On average, 60% of the AWCs had more than half
the children present. In several cases attendance was seen to be more than enrolment. This
was apparently because the Bihar government specified that an AWC should have a maximum
enrolment of 40 per centre.29
So while the Anganwadi Worker (AWW) kept official enrolment at
40, additional children were allowed to attend the centre and share in the cooked meal. This
was especially when there was only one centre in the village.
Table 1.8 Distribution of Anganwadi Centres by Observed Attendance
Number of children observed Proportion (%) of anganwadis
None 3.8
10 or less 10.3
11 to 20 24.5
More than 20 61.5
Source: CORD Survey 2011-12
In 7 centres (in the 81 villages which had an anganwadi), the AWW was not present – 2 of them
were on leave and the others had gone either for training or to the block office for a meeting.
The team talked to the Anganwadi Helper in those cases. In one case, the AWW has left her job
and shifted from the village, but no new worker had been appointed for the last 4 years.
Infrastructure was a problem for many centres. In some cases there was no building. In one
case, the classes were run at the anganwadi worker’s house, and in another in a panchayat
building. In others the team found that activities were carried out either in a verandah, hut or in
an open space. In one case a new building had been constructed, but the contractor refused to
hand it over as he had not received his dues. Other buildings reportedly had leaking roofs.
Another problem area for anganwadis was also irregularity of funds – several AWCs reported
that the cooked meal could not be distributed for the previous 3 to 4 months.
Observation of teaching activities in anganwadis: While attendance was low in half the AWCs,
most showed evidence of some teaching activities. The most popular activities carried out in
the centres included the teaching of hindi letters, poems, stories, and counting. There was also
29
Government of Bihar’s guidelines for anganwadi centres are available at icdsbih.gov.in

44
the use of charts, pictures, and toys for recognition of alphabets, fruit, flowers, animals, birds.
In some cases, activities also included play-way methods of teaching and other creative
activities such as the bal geet method, games, recognition of birds, fruits, and colours with the
use of TLMs. In few anganwadis, children were being taught how to sit and talk.
SECTION 2. INFRASTRUCTURE AND FACILITIES
The Act sets out certain norms and standards for schools, seven in number. They deal with the
provision of teachers, of physical infrastructure such as classrooms and boundary walls, of
facilities such as drinking water and toilets, and of other provisions to aid learning such as
teaching learning equipment and libraries. In this section, we focus on these requirements to
look at both to what extent they are met by all schools in the 89 sample villages and the size of
the challenges that remain. In some cases, the information from all schools is supplemented by
detailed observations made in a sample of 96 schools.30
2.1 Teacher provision
The RTE Act requires that even the smallest school should have at least 2 teachers. A significant
proportion (13%) of the schools were single teacher schools.
Bihar has had a history of teacher shortage. “No teachers were appointed in Bihar from 1999
onwards. In 2003-04, there was a need to recruit more than 85,000 teachers. However, no new
teachers could be recruited. When the government attempted to recruit teachers in 2003,
based on the Bihar Elementary Teacher Appointment Rules 2003, a case was filed and won in
the Bihar High Court to quash these Rules. The State government was directed to appoint only
trained teachers against vacancies, with untrained teachers to be considered only if there were
no trained teachers. In 2004, when the State government attempted subsequently to recruit
para-teachers, they were unable to because of assembly elections, and the imposition of the
Election Model Code of Conduct. The target for teacher recruitment was over 98,000 by the
end of 2004-05.” 31
It has undertaken massive teacher recruitment. “In 2005, more than 68,000 para-teachers
called Panchayat Shiksha Mitras (PSMs) were appointed. No regular teachers were appointed.
The newly recruited teachers popularly known as Panchayat Teachers are also paid their salary
by the Gram Panchayats.”32
Subsequently 1,50,000 teachers were recruited and then another
36,000 (based on reports from the government).
30
The sample of schools was selected in the following way: if there was more than one government primary school
in a village, the larger one was selected. If there was a government primary and upper primary school with grades
1-8, the upper primary school was selected as it had both the primary and the upper primary stage of schooling. 31
Excerpted from Samson and Gupta (2012). 32
Op. cit.

45
The previous decades have also seen a continuous rise in enrolment in elementary education,
leaving the situation with respect to Pupil Teacher Ratio very grave. In the table, we present
figures for the proportion of schools in the sample villages in Bihar with a specified PTR to give
an idea of the extent of teacher shortage in the state. Ninety per cent of these schools had a
PTR>30. A PTR of 40 is the maximum permitted by the RTE Act whatever the size of school and
whatever the stage of schooling, and a PTR more than 40 was reported by nearly three fourths
of all schools.
Table 2.1 Pupil Teacher Ratios in Government Schools in Bihar
Primary schools Upper primary schools All schools
Average PTR 49.2 70.5 62.4
(per cent)
Proportion of schools
with PTR>30 81.2 100.0 89.9
Proportion of schools
with PTR>35 78.3 95.0 86.0
Proportion of schools
with PTR>40 63.8 86.7 74.4
Based on all government schools in sample villages
Source: CORD Survey 2011-12
The primary schools in the sample were a mix of small schools and large. Number of teachers
required depends on the size of the school – schools with enrolment below 150 required
teachers satisfying the given PTR norms. But more than half (56.5%) the schools had an
enrolment of more than 150 children. These large schools are required to have teachers
satisfying the given PTR norms in addition to a head-teacher. Only two thirds of these larger
schools had a head-teacher (see Table 2.3 below)33
. The study found that when large and small
schools are considered together only 14 of the 69 primary schools (20.3%) in the sample
villages had a PTR which satisfied RTE requirements (Table 2.2).
Table 2.2 Primary Schools which meet RTE norms for PTRs34
in Bihar
Enrolment in primary
schools
Number of schools Number of schools
which meet RTE requirements for PTR
Upto 150 30 7
151-200 10 3
More than 200 29 4
All schools 69 14
33
For schools without a head-teacher, it was presumed that one of the teachers would be an acting head-teacher.
All schools with enrolment of more than 150 were thus presumed to require at least 6 teachers (including a head
teacher, if appointed). 34
RTE specification for teachers: (i) At least 2 teachers; PTR to be less than 30 for schools with less than 150
enrolled. (ii) Five teachers plus head teacher for all schools with more than 150 enrolled; PTR (excluding the head
teacher) to be less than 40 for schools with more than 200 enrolled.

46
Note: Enrolment data is not available for 2 primary schools.
Based on all government primary schools in sample villages
Source: CORD Survey 2011-12
PTRs in the upper primary schools with primary grades (i.e. schools with grades 1-8, 1-7, 1-6)
cannot be compared against RTE norms as the norms are specified for primary and upper
primary grades separately, while three-fourths of teachers (210 out of 280) in these schools
reported teaching children across both the stages. When both the stages are considered, The
RTE Act requires that the PTR be less than 40 whatever the number of children enrolled. The
average PTR across the upper primary schools was as high as 70.5. All the upper primary
schools had a PTR greater than 30. Eighty seven per cent of them had a PTR greater than 40!
Clearly the teacher shortage is even more acute in the upper primary schools.
The situation is more positive in terms of head-teacher appointments, as two thirds of schools
which required head teachers had head-teachers appointed, and this was true for both primary
and upper primary schools.
Table 2.3 Government Schools which meet RTE norms for Head Teacher in Bihar.
Type of schools: Number of schools
where Head-teacher
should be appointed
No. of schools
which meet RTE
requirements for Head-
teacher
Primary schools with more than
150 enrolled 39 26 (66.7%)
Upper primary schools with more
than 150 enrolled in primary
section and/or more than 100
enrolled in upper primary section
60 40 (66.7%)
All schools 99 66 (66.7%)
Based on all government schools in sample villages
Source: CORD Survey 2011-12
Subject teachers in upper primary schools: Details about subjects being taught by the teachers
in upper primary schools were obtained from the sample government schools. These included
58 upper primary schools (57 with primary sections and one which was a standalone upper
primary school). Twenty schools had an enrolment in grades 6-8 less than or equal to 100, and
38 had an enrolment of more than 100. The RTE requirements for these schools were different.
• Fourteen of the 20 schools with less than 100 enrolled met the RTE requirements of at
least 3 subject teachers.
• Of the 38 schools with more than 100 enrolled in grades 6-8, only 10 met the RTE
requirements of a head teacher, at least 3 subject teachers, and part time teachers for
art, PE and work education.

47
Unfortunately, 95% of these upper primary schools had a PTR greater than 35 which is the
maximum permitted by the RTE Act. The shortage of teachers at primary level is further
aggravated at upper primary level by the shortage of subject teachers and teachers for art,
music and physical education. Knowing the full extent of teacher shortage at upper primary
level is limited by the difficulty in separating teachers into those teaching primary and upper
primary grades.
2.2 All weather building35
The Act has set certain norms in place for the infrastructure in a school. Infrastructure was
better in the upper primary schools in comparison to the primary schools. Most of the upper
primary schools had been set up before 198036
as primary schools. Many were upgraded to
upper primary schools between 2000 and 2011. It is possible that as schools are upgraded from
primary to upper primary schools, certain investments are made in improving the
infrastructure. The primary schools in the sample villages were relatively new. It is likely that
these primary schools are in more remote areas and / or in hamlets of historically
disadvantaged groups.
The Act requires that schools run in an all-weather building. There were nine primary schools
with no classrooms. Enrolment varied from 63to 298 in these schools. One of these schools is
run under an asbestos sheet with walls on three sides and water enters it during the monsoon.
Another has no building at all and functions in a villager’s home during the rains. In a third case,
the school runs in a community hall.
2.3 At least one classroom for every teacher and an office-cum-store-cum-Head teacher’s
room37
Schools with less than two classrooms: RTE requires that even the smallest school should have
at least 2 teachers and hence at least 2 classrooms (since it requires one classroom per
teacher). There was a two-room primary school in which all five classes were running in one
room. This room also served as the Head Teacher’s office and the store; the second room
housed the anganwadis. There were 6 other schools which were functioning only with one
classroom.
Shortage of classrooms as reflected in the Teacher Classroom Ratio more acute in the primary
schools: In both the primary and upper primary schools of Bihar, the average teacher classroom
ratio is significantly greater than 1, which indicates that there is a shortage of classrooms by
RTE specifications. The proportion of schools which did not have at least one classroom for
each teacher was as high as 66%.
35
Norms and standards 2. 36
Investigations into the year of establishment of the 96 sample schools found that 60 per cent of them have been
established between 1941 and 1980, 17 percent even before that and only 10.5 per cent in the year 2000 or later. 37
Norms and standards 2 (i).

48
Table 2.4 Teacher Classroom Ratio in Government Schools in Bihar
Indicators Primary schools Upper primary
schools*
All
Average no. of teachers^ 3.8 7.0 5.3
Average no. of classrooms** 2.3 5.0 3.6
Average Teacher Classroom Ratio 1.7 1.4 1.5
Percentage of schools* with at
least one classroom for each
teacher (TCR<=1)
35.0 32.8 33.9
*It excludes the single upper primary school with only grades 6-8 which had 3 teachers. **Includes 4
primary schools which have no classrooms. ^Includes head-teachers where appointed.
Based on all government schools in sample villages
Source: CORD Survey 2011-12
The requirement of classrooms based on the Teacher Classroom Ratio is focused on the ratio of
the number of teachers to classrooms rather than the absolute number of teachers and
classrooms. The acute shortage of teachers can be seen from the high PTRs in both primary and
upper primary schools i.e. 49.2 and 70.5, respectively (Table 2.1). This indicates that the
shortage of classrooms is much more acute than the Teacher Classroom ratio indicates.
This shortage of classrooms is also indicated by other indicators. The average number of
classrooms in primary schools is 2.3 (for 5 grades), and the average number of classrooms in
the 1-8 upper primary schools is 5.0, which indicates that the availability of separate classrooms
for individual grades is more acute in the primary schools. The average student classroom ratio
(SCR) is 93 in the case of all schools indicating a high degree of overcrowding in the classrooms.
The overcrowding is worse in the upper primary schools – the SCR is 99 compared to 81 in the
primary schools.
Table 2.5 Student Classroom Ratio in Government Schools in Bihar
Primary
schools
Upper primary
schools
All
Average Student Classroom Ratio 81.2* 99.1 93.1
*In Average SCR, we have not considered 9 schools at primary level which have no classrooms.
Based on all government schools in sample villages
Source: CORD Survey 2011-12
Availability of room for use as office cum store cum Head teacher’s room: RTE requires that
schools have a room which could be used as office cum store cum HT room. 57% of schools
surveyed had a separate office cum head teacher room. A higher proportion (75%) of the upper
primary schools had a separate office cum head teacher room compared to the primary schools
for whom the figure was less than half (40%) (Table 2.6). These rooms could be used as
storerooms if required, and some were being used for this purpose. There were 15 schools

49
which had a store room38
but no office or HT room. We have included these schools among
those which do not meet RTE norms for a non teaching room which could be used as an office
cum store cum Head Teacher’s room. Putting together the requirement for classrooms and a
non teaching room, we find that this was available for only a small proportion of the schools in
the Bihar sample (21.2%). The 1-8 schools were slightly better off – 26.2% met the RTE
requirement; in the case of the 1-5 schools it was only 16.4%.
Table 2.6 Availability of Room for use as Office cum Store cum Head Teacher’s Room in
Government schools in Bihar (per cent)
Proportion of schools with
Primary
schools
Upper primary
schools
All
with office cum store cum HT room 40.0 75.4 57.0
with at least one classroom for each teacher
and an office cum store cum Head Teacher’s
room
16.4 26.2 21.2
Based on all government schools in sample villages
Source: CORD Survey 2011-12
Schools with unused rooms and rooms used for other purposes: Detailed observations were
made in a sample of 96 schools. In 10 schools there were 1-5 unused rooms. At times rooms
were underused due to low attendance, too few teachers appointed or present in the school or
ongoing construction. At other times no reason was given.
In 15 schools it was observed that rooms were being used for a wide range of other purposes
including as a staffroom for teachers, a room for Special Classes for children to be enrolled in
age appropriate classes, for anganwadis, for administrative purposes (CRCC room). But rooms
were also being used as meeting rooms for the villagers (mahila kutir meetings, village level
meetings); to provide accommodation for the teacher and accommodation for labourers doing
construction work in the school.
In 23% of the sample schools between one and four rooms were under repair or in need of
repair and hence unusable (a total of 46 rooms).
Provision of more rooms and facilities on the way: In 15% of the 96 sample schools, 2 to 9
rooms were found to be under construction when the team arrived. At times these were a
whole set of rooms in a separate one or two storey building with a Head Teacher room, kitchen
and toilet being constructed. At other times rooms were being added. For instance in one
school two rooms were being made. The old building was leaking and the roof was dilapidated.
In another school 9 rooms were being made over two floors.
38
In one school, a room was being used for storing filtered water; in another, for construction material.

50
2.4 Separate toilets for boys and girls39
The RTE under its norms and standards for a school specifies that all schools should have
‘separate toilets for both boys and girls’. The study found that a small proportion (29.6%) of
schools had separate toilets for boys and girls which were in a usable condition. Another 21% of
schools had separate toilets but these were not in a usable condition. The researchers observed
that many of the toilets were very dirty, some were full of garbage, and others had their doors
broken, which made them unavailable for use. In a few schools, toilets were available but found
locked.
Table 2.7 Availability of Toilet Facilities in Government Schools in Bihar
(per cent)
Proportion of schools with: Primary
schools
Upper
Primary
schools
All schools
Separate toilets for boys and girls available
and usable 23.9 35.9 29.6
Separate toilets for boys and girls available
but not usable 18.3 23.4 20.7
Only common toilet available 9.8 29.7 19.2
No toilet available 47.9 10.9 30.4
Total 100 100 100
Based on all government schools in sample villages
Source: CORD Survey 2011-12
Primary schools were worse off than upper primary schools -- nearly half (47.9%) had no toilets
at all. The corresponding proportion was low (10.9%) for upper primary schools.
2.5 Safe and adequate drinking water facility for all children40
Under the norms and standards that a school has to maintain, the RTE act specifies that safe
and adequate drinking water facilities for children should be made available. In accordance with
that, the research team looked at the availability of water in all schools. Head-teachers were
asked if it was safe.
Table 2.8 Availability of Safe and Adequate Drinking Water Facilities in Government Schools in
Bihar
(per cent)
Proportion of schools with
Primary
schools
Upper primary
schools
All
safe and adequate drinking water facility 77.8 78.1 78.0
39
Norms and standards 2 (iii). 40
Norms and standards 2 (iv).

51
Based on all government schools in sample villages
Source: CORD Survey 2011-12
Safe drinking water: Details about the safety of drinking water were discussed with the head-
teachers in the sample schools. In an overwhelming majority of the cases it was reported that
the hand pump is the source of water. In 4 primary schools there was a hand pump in the
school which they had to share with the villagers. In one case a hand pump was under
construction.
The study found that 78% reported availability of safe drinking water facilities. In 5 schools, the
head teachers reported that they have put a filter in the drinking water in order to ensure that
it can be fit for drinking. Out of these 5 head teachers, one of them reported that the drinking
water earlier had arsenic in it.
The issue of why drinking water was considered safe or unsafe was explored with the head-
teachers in the sample schools. Fifteen out of the 96 head teachers said that they felt water
was safe because it was checked by a person from the Physical Health Department, block level
team, or during a swachchta abhiyaan. Most heads (46%) said that they can tell that the water
is potable because it look clean or tastes good, or simply justified their claim by saying that the
teachers or even the villagers drink the same water. A few other respondents (6%) said that
water is drawn from the hand pump and hence is safe since the source of the water is deep
(180 to 200 feet).
Drinking water not safe in all schools - in 9 schools, head teachers reported that iron is found in
the drinking water in the schools. In 2 schools, arsenic and fluoride had been found in the water
but nothing had been done about it.
Drinking water not adequate: Insufficiency of drinking water, when reported, was primarily due
to the inadequacy of water in the summer months, and because of scarcity of drinking water
sources in relation to the number of students. Most schools had only one hand pump, even
when enrolment was high. Based on a single visit to the school, it was difficult for researchers
to get a reliable picture of adequacy of drinking water.
2.6 Availability of a Kitchen where the Midday Meal is Cooked in the School41
Midday meals are required to be cooked in the school and hence the RTE Act mentions that the
all weather building in all schools should have a kitchen where the meal can be made. Fifty six
per cent of the schools had kitchens that were available and usable. A small proportion (7.5%)
of schools had kitchens available which were not usable. More than one third (36.5%) of
schools did not have a kitchen at all. There was a substantial difference between the primary
and upper primary schools in this case – while 57% of primary schools did not have a kitchen,
this was true for only 15% of the upper primary schools in the sample. This is in keeping with
the fact that the upper primary schools are the schools which had been established earlier.
41
Norms and standards 2 (v).

Based on all government schools in sample villages
Source: CORD Survey 2011-12
2.7 Playground42
Based on all government schools in sample villages
Source: CORD Survey 2011-12
42
Norms and standards 2 (vi).
20
1
0
25
50
75
100
Primary Schools
pe
rce
nt
Figure 2.10: Availability of Playgrounds in
Government Schools in Bihar
Available and usable
39
4
0
25
50
75
100
Primary Schools
pe
rce
nt
Figure 2.9: Availability of Kitchen in Government
Available and usable
52
Based on all government schools in sample villages
Based on all government schools in sample villages.
59
39
5
3
Upper-Primary Schools All Schools
Figure 2.10: Availability of Playgrounds in
Government Schools in Bihar
Available and usable Available but not usable
74
56
11
7
Upper-Primary Schools All Schools
Figure 2.9: Availability of Kitchen in Government
Schools in Bihar
Available and usable Available but not usable

The RTE Act mentions that all schools should have a playground. The 1
more poorly equipped than the 1
reported that they had no playground. This was true for 36.5% of the upper
primarily 1-8 schools.
2.8 Boundary walls and fencing43
The RTE Act mentions that all schools should have arrangements for securing the school
building by a boundary wall or fencing. Only
fewer among the primary (22.5%) and more among the upper primary (57.8%). Seven per cent
of all schools had boundary walls/fencing which
all schools had no boundary wall or fencing available.
Based on all government schools in sample villages
Source: CORD Survey 2011-12
2.9 Teaching learning equipment
There were only a few primary schools which had no teaching learning material whatsoever.
The most commonly found teaching and learning aids in both the
primary schools were charts and pictures (in 92% of schools), and maps and globes (in 94% of
schools). Other teaching aids such as hand
puzzle games, microscopes, clay, geometry inst
being used.
43
Norms and standards 2 (vii). 44
Norms and standards 5.
23
6
0
25
50
75
100
Primary Schools
pe
rce
nt
Figure 2.11: Presence of Boundary Wall or
Fencing in Government Schools in Bihar
Present and functional
53
The RTE Act mentions that all schools should have a playground. The 1-5 schools were much
more poorly equipped than the 1-8 schools. Close to four fifths of the 1-5 schools (78.3%)
reported that they had no playground. This was true for 36.5% of the upper
43
The RTE Act mentions that all schools should have arrangements for securing the school
building by a boundary wall or fencing. Only 40% of all schools had such a functional provisio
fewer among the primary (22.5%) and more among the upper primary (57.8%). Seven per cent
of all schools had boundary walls/fencing which was not functional. More than half (53.3%) of
all schools had no boundary wall or fencing available.
l government schools in sample villages
Teaching learning equipment44
a few primary schools which had no teaching learning material whatsoever.
The most commonly found teaching and learning aids in both the primary and the upper
primary schools were charts and pictures (in 92% of schools), and maps and globes (in 94% of
ther teaching aids such as handmade models, wall paintings, maths and science kits,
puzzle games, microscopes, clay, geometry instruments, and the atlas were also reported as
58
39
9
7
Upper-Primary Schools All Schools
Figure 2.11: Presence of Boundary Wall or
Fencing in Government Schools in Bihar
Present and functional Present but not functional
5 schools were much
5 schools (78.3%)
reported that they had no playground. This was true for 36.5% of the upper primary schools,
The RTE Act mentions that all schools should have arrangements for securing the school
of all schools had such a functional provision –
fewer among the primary (22.5%) and more among the upper primary (57.8%). Seven per cent
not functional. More than half (53.3%) of
a few primary schools which had no teaching learning material whatsoever.
primary and the upper
primary schools were charts and pictures (in 92% of schools), and maps and globes (in 94% of
made models, wall paintings, maths and science kits,
ruments, and the atlas were also reported as

54
Table 2.12 Availability of Teaching Learning Materials in Government Schools in Bihar
(per cent)
Proportion of schools with: Primary schools Upper primary schools All
Charts / Pictures 91.2 91.9 91.7
Maps / Globe 88.2 96.8 93.8
Flash Cards 73.5 85.5 81.3
Other 35.3 64.5 54.2
None of the above 8.8 0.0 3.1
Based on all government schools in sample villages
Source: CORD Survey 2011-12
A large number of head teachers reported availability of a wide variety of teaching aids for
students. Specifically for Class 1, it was reported that charts and pictures depicting alphabets
and numbers were used as teaching aids. In 69.2 percent of schools, TLMs were observed in
class 1. In one school, a teacher was observed using half moon shapes to teach geometrical
shapes in class five, but none of the other classes seemed to be using these aids. In one case,
the teaching aid has actually been made by the children and the head teacher reported that
these methods positively influenced learning outcomes. Charts, pictures and flash cards were
seen to be particularly useful aids in teaching.
2.10 Library45
Only half the primary schools reported that they had libraries, while this was true for three
fourths of the upper primary schools. Most of the books in these libraries were story books.
Table 2.13 Availability of Library Facilities in Government Schools in Bihar
(per cent)
Proportion of Schools with Primary schools Upper primary schools All
Library available 50.0 75.4 65.6
Based on all government schools in sample villages
Source: CORD Survey 2011-12
2.11 Play material, games and sports equipment46
The RTE Act says that each class will be provided with play material, sports equipment and
games, as per their requirements. Close to 60% of the schools had some equipment available
and usable, the most common being the carrom board and other indoor games like Ludo and
Chess. Many schools also had cricket equipment and a football/volleyball. Less common but
also found were badminton racquets, skipping ropes, rings and occasionally swings or slides. A
couple of schools had dholki, jhankar or harmoniums. A small proportion of the schools had
45
Norms and standards 6. 46
Norms and standards 7.

games and sports equipment but in such a state that it was not usable (6%). Over one third of
the schools did not have any provision of games, play material and sports equipment. This
included more than half of the prima
primary schools (17.2%).
Based on all government schools in sample villages
Source: CORD Survey 2011-12
A summary figure below shows Bihar’s lack of readiness w
buildings (see Figure 2.15a). It can be seen that the
primary schools in Bihar is much better than in the primary schools, whether it is kitchens (in
74% of upper primary schools compar
upper primary schools compared to 20% of primary schools) or boundary wall (in 58% of upper
primary schools compared to 23% of primary schools). The infrastructure in the primary schools
on the whole is shockingly poor.
figures for infrastructural availability in the primary schools are below 40%.
Worst off is the availability of classrooms in both primary and upper primary schools.
Grievances against infrastructure and facilities were commonly mentioned by teachers
building in poor state, shortage of classrooms, non functional toilet etc. In a sc
district, a teacher stated that students of classes 1, 2 and 3 had been sitting together for the
past 5 years in a cowshed and this greatly hindered teaching. RTE specifically mentions the
setting up of adequate classrooms and proper infr
42
6
0
25
50
75
100
Primary Schools
pe
rce
nt
Figure 2.14: Availability of Games and Sports
Equipment in Government Schools in Bihar
Available and usable
55
games and sports equipment but in such a state that it was not usable (6%). Over one third of
the schools did not have any provision of games, play material and sports equipment. This
primary schools (51.5%), and a smaller proportion of
Based on all government schools in sample villages
below shows Bihar’s lack of readiness with requirements of RTE for school
. It can be seen that the infrastructural provision
primary schools in Bihar is much better than in the primary schools, whether it is kitchens (in
74% of upper primary schools compared to 39% of primary schools), or playgrounds (in 59% of
upper primary schools compared to 20% of primary schools) or boundary wall (in 58% of upper
primary schools compared to 23% of primary schools). The infrastructure in the primary schools
is shockingly poor. With the exception of availability of safe drinking water, all
figures for infrastructural availability in the primary schools are below 40%.
Worst off is the availability of classrooms in both primary and upper primary schools.
Grievances against infrastructure and facilities were commonly mentioned by teachers
building in poor state, shortage of classrooms, non functional toilet etc. In a school in Bhagalpur
district, a teacher stated that students of classes 1, 2 and 3 had been sitting together for the
past 5 years in a cowshed and this greatly hindered teaching. RTE specifically mentions the
setting up of adequate classrooms and proper infrastructure for all schools.
77
59
6
6
Upper-Primary Schools All Schools
Figure 2.14: Availability of Games and Sports
Equipment in Government Schools in Bihar
Available and usable Available but not usable
games and sports equipment but in such a state that it was not usable (6%). Over one third of
the schools did not have any provision of games, play material and sports equipment. This
ry schools (51.5%), and a smaller proportion of the upper
requirements of RTE for school
infrastructural provision in the upper
primary schools in Bihar is much better than in the primary schools, whether it is kitchens (in
ed to 39% of primary schools), or playgrounds (in 59% of
upper primary schools compared to 20% of primary schools) or boundary wall (in 58% of upper
primary schools compared to 23% of primary schools). The infrastructure in the primary schools
With the exception of availability of safe drinking water, all
Worst off is the availability of classrooms in both primary and upper primary schools.
Grievances against infrastructure and facilities were commonly mentioned by teachers –
hool in Bhagalpur
district, a teacher stated that students of classes 1, 2 and 3 had been sitting together for the
past 5 years in a cowshed and this greatly hindered teaching. RTE specifically mentions the
All Schools

Based on all government schools in sample villages
Source: CORD Survey 2011-12
Apart from drinking water, the other positive for primary schools was availability of TLMs.
TLMs, library and games and sports equipment were
primary schools (see Table 2.15b)
Table 2.15b Availability of Specified
*Includes one school with only upper primary grades.
Based on all government schools in sample villages
Source: CORD Survey 2011-12
Proportion of schools with the following
available:
Teaching learning equipment
Library
Games and sports equipment
16.423.926.2
0
25
50
75
100
At least 1
classroom per
teacher & an
office/store/HT
room
Separate toilets
for boys and
girls
Pe
rce
nt
Figure 2.15a: Government Schools (%) in Bihar which
had Specified Infrastructure and Facilities Available
Primary Schools
56
Based on all government schools in sample villages
he other positive for primary schools was availability of TLMs.
TLMs, library and games and sports equipment were also available in a majority of upper
(see Table 2.15b).
Specified Facilities in Government Schools in Bihar
*Includes one school with only upper primary grades.
Based on all government schools in sample villages
Proportion of schools with the following Primary
Schools
(1-5)
Upper Primary
Schools
(1-8)*
91.2 100
50.0 75.4
48.5 82.9
23.9
77.8
39.1
20.3
35.9
78.1 73.8
58.7
Separate toilets
for boys and
girls
Safe drinking
water facility
Kitchen Playground
Figure 2.15a: Government Schools (%) in Bihar which
had Specified Infrastructure and Facilities Available
and Usable
Primary Schools Upper Primary Schools
he other positive for primary schools was availability of TLMs.
also available in a majority of upper
(per cent)
Upper Primary All
96.9
65.6
65.4
22.5
57.8
Boundary wall
Figure 2.15a: Government Schools (%) in Bihar which
had Specified Infrastructure and Facilities Available

57
SECTION 3. FACILITATING ADMISSION AND RETENTION OF ALL CHILDREN, PARTICULARLY THOSE
ON THE MARGIN47
The RTE Act puts a compulsion on the state “to provide free and compulsory elementary
education to every child in the age group 6-14 years” (Chapter III, Section 8a) requiring that the
state ensure compulsory admission, attendance and completion of elementary education for
each of these children. In this section, we will discuss the extent of compliance with school
policies related to admission, assessment, retention and so on, that the Act sets out to ensure
that the goal of providing elementary education for every child in the age group of 6-14 years is
met. We begin by placing the findings in the context of what awareness and training on the RTE
Act existed among the teachers.
3.1 Awareness and training on RTE among teachers
The study found (in January 2012) little awareness of the RTE Act among teachers in the sample
villages. Only a few head-teachers and teachers said they had received RTE related training. The
head-teachers reported that there had been some discussion of the provisions of the RTE Act at
the Cluster Resource Centres. Those who hadn’t received training said that this would most
definitely be useful and would enable them to teach better and also implement the Act more
efficiently. They stated that they would like to receive RTE training as it would make them
aware of their rights as well as the students’ rights.
Table 3.1 RTE Awareness among Teachers and Head teachers in Government Schools in Bihar
Number of teachers who received Teachers Head Teachers
RTE related training 6 7
Reading material on RTE Act 3 6
Based on interviews with Class 3 and Class 7 teachers and the head teachers in sample schools.
Source: CORD Survey 2011-12
Many teachers reported that they had been trained in a range of aspects related to “quality
education”. This included training in child-friendly teaching, using activities, focusing on all
round development of the child and so on, all specified under RTE. Some of these trainings on
“quality education” were reported to be for 21 days, some for 51 days. Some teachers had
received 30 days training on how to use Teaching Learning Material. Lastly, a few teachers
mentioned Ujala 1 training for 15 days, as the source where they were trained on the concepts
of “ensuring all round development of the child” and “making children learn through activities,
discovery and exploration in a child friendly and child centred way”. A few teachers reported
getting the Samjho-Seekho note from the education department. In fact this was seen put up in
several schools during the interview.
47
The findings in this section are based on a comprehensive survey of a sample of schools in the selected villages.
The methodology included interviews with the head teacher on school policy and practice, and the collection of
data from registers in the school.

58
3.2 Admission policies
Admission policy has been revised in the RTE Act to ensure enrolment of all children in the 6 to
14 age group, in age appropriate grades. The compliance with regard to different provisions are
discussed here.
Admission not to be denied for lack of age proof: The RTE Act, Section 14 (1) mandates that for
the purposes of admission to elementary education, the age of a child shall be determined on
the basis of the birth certificate issued in accordance with the provisions of the Births, Deaths,
and Marriages Registration Act, 1886 or on the basis of such other document, as may be
prescribed. Section 14 (2) states that no child shall be denied admission in a school for lack of
age proof. A notification for the same was passed by Bihar government as early as 11.5.2010.
Another reminder was sent to all District Level officers on 24.2.2011.
A majority of primary schools (61.8%) reported that they ask for no documents when enrolling
a child, while in the upper primary schools, this was true for a minority of schools (29.5%).
Several schools reported that while they do not ask for birth certificates, they accept
declarations from parents about the age of the child. A few schools admit children after taking
permission to do so from the BEO. The situation sometimes varied by grade. A few schools
reported that they do not take documents for admission to class 1; in some cases, to classes 1
and 2,.
A few schools (about 13 cases) take documents only for class 6-8. A substantial proportion
(48%) of upper primary schools reported that they ask for Transfer Certificates, as opposed to
only 9% of primary schools. Teachers report that TCs are useful to help them to decide which
class the child should be enrolled in, as are report cards. The Act is concerned that the lack of a
Transfer Certificate not be cause to deny admission.
Table 3.2 Documents Required for Admission in Government Schools in Bihar
Proportion of schools which Primary schools Upper primary schools All schools
Do not refuse admission even if
there are no documents 61.8 29.5 41.1
Ask for the following
documents at time of
admission:
Age proof (Birth Certificate) 8.8 18.0 14.7
Any other (including affidavit /
declaration from parents) 20.6 24.6 23.2
Transfer Certificate 8.8 47.5 33.7
Documents for selected classes 5.9 23.0 16.8
Options were not mutually exclusive.

59
Based on survey of sample schools.
Source: CORD Survey 2011-12
Admission Granted for Extended Period as Prescribed: The RTE Act requires that children be
admitted for an extended period as prescribed by the state (Chapter IV, Section 15). The study
found that 61% of schools reported that they give admission even after 30th
September.
Enrolment records showed that this was actually implemented in only 33% of schools.
Table 3.3 Government Schools in Bihar that Grant Admission for Extended Periods as Prescribed
Proportion of schools which took new admissions after 30th
September Per cent
As reported by HT 61.1
As found from enrolment records 33.3
Based on survey of sample schools.
Source: CORD Survey 2011-12
Admit in age appropriate class: Age appropriate enrolment is not a policy which can be
implemented easily since it requires that the schools would need to run Special Classes to
mainstream these children. Only a small proportion (18.3%) of schools reported that they
would admit a 9 year old child who has never been enrolled to the class which is associated
with his/her age.
Table 3.4 Criteria for Selecting Grade when Admitting 9 year old Never Enrolled Child in
Government schools in Bihar
(per cent)
Proportion of respondents who said, when a never
enrolled 9 year old child comes for admission, that
they
Primary
Schools
Upper
Primary
Schools
All
Schools
Admit the child to age appropriate class 12.1 21.7 18.3
Admit the child to class 1 15.2 8.3 10.8
Give a written test before deciding 72.7 73.3 73.1
Any other (includes oral tests, combination of
options) 0.0 1.7 1.1
Options are not mutually exclusive.
Based on survey of sample schools.
Source: CORD Survey 2011-12
A few schools (10.8%) reported that they would put all never enrolled children into Class 1.
Most schools (73.1%) reported that they would conduct a written test for such a never enrolled
child, to decide which grade the child should be admitted in. This may be the regular procedure
for any older child seeking admission.
Run Special Classes to mainstream children who have never attended school / dropped out of
school: According to the RTE, special classes have to be held for new admissions who have
never attended school / for children who have dropped out of school. Eleven schools reported

60
receiving orders about running special classes to facilitate age appropriate enrolment.
However, only 3 schools reported conducting special classes for age appropriate admissions.
However, none of the three schools could answer the frequency with which such classes were
held in a week, which may be indicative of the fact that the classes were not being held. Some
schools in Bihar received the orders from the BRC in meetings held in 2010 and 2011.
The problem of running Special Classes to mainstream children who have been out of school is
particularly difficult in the context that Bihar is reported to have lakhs of children who are out
of school.
3.3 Ensure participation of children from weaker sections and disadvantaged social groups
The Act specifies that children from weaker sections and disadvantaged groups should not be
discriminated against and prevented from pursuing and completing elementary education on
any grounds – Section 8c.
Such an issue is difficult to observe or capture during a single visit to a school. Only 3 teachers
reported any form of discrimination within the school. A teacher in Begusarai district said that
there is discrimination among children of different castes in sitting next to each other: Rajput ke
bacche chhoti jaati (Chamar, Dom, Mali) ke bacchon ke baste uthakar phek dete hain, unhe
paas nahin baithne dete"(children of Rajput families do not let children of lower castes like
Chamar, Dom and Mali sit near them and they throw their school bags ). A teacher in Bhojpur
also spoke of some discrimination at the time of drinking water and eating together between
Rajputs and Chamars. A teacher in Nawada spoke of discrimination between children from
Muslim and SC families.
3.4 Participation of persons with disabilities
The RTE Act, in chapter II, part Section 3 (2) mentions that the right to free and compulsory
education shall be extended to children suffering from disability. Bihar State rules sections 4(7)
and 4(8) and 5(1) further state that appropriate and safe transportation arrangements shall be
made for them [children with disability] to attend school and complete elementary education.
It further adds that children with disability shall be provided with free special learning, support
material and equipments apart from free textbooks and uniforms.
The study found that children with different forms of disability are given admission, as reported
by the head teachers and as observed by the investigators. As noted earlier, the majority of
these children had physical disabilities.

61
Table 3.5 Children with Disability (CWD) Reported to be Enrolled in Government Schools in
Bihar
Type of Disability Number of CWD in primary schools Number of CWD in upper
primary schools
Physical / Locomotor 20 83
Mental / learning disability 11 45
Visual 7 37
Speech 13 15
Hearing 5 18
Multiple 4 18
All types 60 216
Based on survey of sample schools.
Source: CORD Survey 2011-12
A sizeable proportion of the CWD are those with speech impairment and with ‘mental
disability’. The latter remains a problematic term. The line dividing ‘weak’ students (students
who are not quick to understand) and those with mental disabilities is not clear to many
teachers. The word mandbuddhi used for such students is indicative of this. Overall, the
number of CWD observed was much lower than the number of CWD reported, which suggests
that these children are irregular or even nominally enrolled. The majority of CWD that were in
school were observed to be sitting together with the class and interacting with other children in
the school.
Completion of Class 5 was rare among children with disabilities: Head Teachers were also asked
about the number of CWD who had completed the 5th
grade in 2010-2011. In most cases it was
not more than 1 child per school who had cleared class 5. This figure gives some idea of the
negligible school completion rates among these children.

Based on survey of sample schools.
Source: CORD Survey 2011-12
Barrier-free access:48
Ramps become extremely important to ensure that students with
physical/locomotor disability are able to move about in school. It was found that 58.3% of these
schools had been provided with ramps, but only 47.9% had r
of schools it was observed that the ramps had been damaged or there were ramps which had
no railings at the side. Again provision was better in upper primary schools.
Provision of equipment for the physically disabled
HTs, 3 schools in Bihar reported using special equipment for CWSN, which
aids. As to transport facilities for disabled children, 9 schools reported giving tricycle
wheelchairs to children with a p
were given these cycles. The researchers observed that 2 CW
using teaching aids.
Table 3.7 Training in Special Education among
Teachers with following types of training
on teaching CWDs
Diploma / degree in special education
Short duration course (2 to 30 days)
Based on survey of sample schools.
Source: CORD Survey 2011-12
48
Norms and standards 2 (ii)
38
3
0
25
50
75
100
Primary Schools
pe
rce
nt
Figure 3.6: Availability of Ramps in Selected
Government Schools in Bihar
Available and usable
62
schools.
Ramps become extremely important to ensure that students with
physical/locomotor disability are able to move about in school. It was found that 58.3% of these
schools had been provided with ramps, but only 47.9% had ramps which were usable
of schools it was observed that the ramps had been damaged or there were ramps which had
. Again provision was better in upper primary schools.
Provision of equipment for the physically disabled: From the information gathered
HTs, 3 schools in Bihar reported using special equipment for CWSN, which consist
aids. As to transport facilities for disabled children, 9 schools reported giving tricycle
wheelchairs to children with a physical handicap. Only 1 or 2 students in each of these schools
were given these cycles. The researchers observed that 2 CWD in the schools in Bihar were
ducation among Teachers in Government Schools in
types of training Number of teachers
Diploma / degree in special education 22 ( in 9 schools)
Short duration course (2 to 30 days) 62 ( in 29 schools)
sample schools.
53
15
Primary Schools Upper-Primary Schools All Schools
Figure 3.6: Availability of Ramps in Selected
Government Schools in Bihar
Available and usable Available but not usable
Ramps become extremely important to ensure that students with
physical/locomotor disability are able to move about in school. It was found that 58.3% of these
amps which were usable -- in 10%
of schools it was observed that the ramps had been damaged or there were ramps which had
From the information gathered from the
consisted of hearing
aids. As to transport facilities for disabled children, 9 schools reported giving tricycle
hysical handicap. Only 1 or 2 students in each of these schools
in the schools in Bihar were
Government Schools in Bihar
Number of teachers
62 ( in 29 schools)
48
10
All Schools

63
Training among teachers: There were 9 schools in Bihar, who have teachers with a
diploma/degree in special education to teach disabled children. Twenty nine schools had
teachers with short duration training, ranging from duration of 2 days to 30 days, as reported
by the Head Teachers. A couple of schools reported that a special teacher comes from the BRC
once a week. It appears that the availability of teachers with training to handle CWD is quite
inadequate. Only 36% of schools had even 1 teacher with some training in special education.
Table 3.8 Incidence of Disability and Availability of Teachers with Special Training in
Government Schools in Bihar
Proportion of schools with Per cent
Any children with disability 77.9
At least one teacher with some training on teaching CWD 35.5
Based on survey of sample schools.
Source: CORD Survey 2011-12
3.5 Participation of children of migrant families
Children of migrant families are susceptible to dropping out because they are not stationed in
their native village. The RTE Act is concerned that such children are able to access schooling
wherever they may be based. Not many schools in Bihar reported that they had any children
who were in-migrants to the village. The large upper primary schools were more likely to have
such children than the primary schools. However, a very high proportion of schools (94%) did
report that children who went away to other places returned to the village and to the school
after a gap. Most respondents had no idea if children attend school at the site to which they
migrate.
Table 3.9 Schooling of Migrant Children in Government Schools in Bihar
Proportion of Head teachers who report that: per cent
their school has enrolled children from families who
have lived there only for a few months in the year (in-
migrants)
13.9
their school has children who had migrated to other
places and then returned to the school 94.1
Based on survey of sample schools.
Source: CORD Survey 2011-12
3.6 Provision of “free” education
The Act specifies that no fees should be charged -- Chapter II, Part Section 3 (2). All schools
reported that no fees are charged on any count.
Textbooks were being given to all children in 88% of all schools; Uniforms were given to all
children in 15% and to some children in 70% of schools and transport facilities were being given
to any child in 10% of schools.

64
Table 3.10 Schemes to Reduce Costs of Schooling for Children in Bihar
Proportion of schools which reported: per cent
Textbooks given to all students 88.4
Uniforms given to all children 14.7
Uniforms given to some children 70
Transport facility to any student 9.6
Based on survey of sample schools.
Source: CORD Survey 2011-12
A complaint on the part of teachers was that parents were uncooperative, especially at the
time of distribution of uniforms and books.
3.7 Children not to be kept back in any class or expelled from school till elementary education is
completed
The Act states that no child admitted in a school shall be held back in any class or expelled from
school till the completion of elementary education. A notification for the same was passed by
Bihar government as early as 11.5.2010. Another reminder was sent to all District Level officers
on 24.2.2011.
Despite this order, the no retention policy was being applied in only 43% of the schools in our
sample. Children were still being kept back because they were irregular / had not learnt enough
/ had not sat for the final examinations. These reasons for children being retained in school
were not mutually exclusive. Children were kept back mainly because they had not cleared the
annual examinations.
Table 3.11 Retention of Students in Government Schools in Bihar
Proportion of head-teachers who said they per cent
do not retain any child in the same class 43.2
retain a child is retained in the same class when
the child has not learnt enough / academically weak 22.1
the child is very irregular 5.3
other reasons (includes does not clear the annual
examinations) 46.3
Options are not mutually exclusive.
Based on survey of sample schools.
Source: CORD Survey 2011-12
Irregular attendance in the past was considered an important reason why children’s names
should be cut off the register. This was meant to act as a deterrent for parents and children,
since regular attendance is critical for learning to take place. The majority of head teachers
reported that they do cut off children’s names when they are absent for a prolonged period of

65
time though the cutoff varied -- 33% of head teachers reported that they cut off names of
students who have not attended classes for two months or more; there were also a substantial
proportion (25.5% of head teachers who stated that they cut off students’ names if they were
absent continuously for a much shorter period of time (a month or less). The issue of striking
off names was reported to be a topical one in Bihar at the time of the survey, as the
government was making efforts to reduce double enrolment.
Table 3.12 Striking Off Names of Students for Prolonged Absence in Government Schools in
Bihar
Proportion of head-teachers who report that a child’s name is struck off if absent
continuously for Per cent
More than 2 months 33.0
More than 1 month 20.2
A month or less 25.5
Proportion of head-teachers who report that a child’s name is not struck off even
for a prolonged absence 21.3
Based on survey of sample schools.
Source: CORD Survey 2011-12
3.8 Languages used by teachers to teach / explain
The RTE Act specifies that instruction should be in the child’s mother tongue as far as possible.
The study found that teaching was primarily in Hindi, rather than the child’s mother tongue.
However, there were a proportion of schools (43.2%) where local languages were used to
explain to children, and a few reported teaching in Urdu (16.8%). The proportion of schools
where local languages are used to explain to children is likely to have increased with the
increased recruitment of local teachers.
Of those schools who reported the use of local languages, half the schools (21 out of 41)
reported use of Bhojpuri, the rest a number of local dialects including Maithili, Bajjika, Angika,
Brajkathi, Surjapuri, Khota, Kulhaiya and Magahi. Children in these schools are likely to be
benefiting from explanation in their mother tongue. However, for some children these local
dialects may not be their mother-tongue: if, for example, they are from tribal communities, or
from social groups which speak dialects different from those used to teach in school. Children
from ST communities were reported to be enrolled in 9 of the sample schools. These were
mostly Santhals. These 9 schools have not reported any tribal language used by teachers in
school. Similarly, there are no reports of the use of Bengali in teaching, versions49
of which
were reported to be used by Muslim groups in Purnea and Kishanganj in eastern Bihar.
49
These are known in some places as Kishanganji or Rajbanshi (see Nashya Sheikh’s on Wikipedia; Ethnologue; see
http://currentnews.in/?p=13033 ).

66
Table 3.13 Languages Used to Teach/Explain in Government Schools in Bihar
Proportion of head teachers who reported that the following
languages are used to teach/explain to their students
Per cent
Hindi 100.0
Bhojpuri (and other local dialects) 43.2
Urdu 16.8
Based on survey of sample schools.
Source: CORD Survey 2011-12
Recent appointment of language teachers – Urdu and other languages
In the context of language teaching, we note that Hindi and Urdu are the official languages of
the State of Bihar. Urdu was declared the second official language after the Bihar Official
Language (Amendment) Act 1980 for “specified areas and purposes”. Urdu is recognized as
second official language in 15 districts of Bihar (see http://www.ciil-
ebooks.net/html/langUse/policy.html).
In May 2005, Bihar had 8,059 Urdu teachers in elementary schools and 2,255 in secondary
schools. In early 2010 the Bihar Chief Minister announced the recruitment of 34,540 assistant
teachers for elementary schools, of which 12,862 were to be Urdu teachers. The government
had also proposed that they will appoint an Urdu teacher in each primary and middle school.
In July 2010, the CM declared immediate appointment of an additional 27,000 Urdu teachers
(also 20,000 Sanskrit teachers for 28,000 middle schools, and 250 Bengali teachers). In March
2012, the government was again to appoint 34,000 Urdu teachers.
SECTION 4. TEACHERS AND SCHOOL FUNCTIONING50
4.1 Working days for schools and working hours for teachers
Minimum number of working days in an academic year: The schools reported that their
academic year was from April to March. Most schools with primary grades reported that they
exceed the working day requirements of the RTE Act i.e. 200 working days for Classes 1-5. All
primary schools reported that they work more than 200 days. Nearly all (93%) of upper primary
schools with primary grades also reported the same. Working days for upper primary grades fell
short in 23% of the upper primary schools: these schools reported working for less than 220
days.
50
This section is based on semi-structured interviews with head-teachers in 96 schools, Class 3 teachers in 95
schools with primary grades and Class 7 teachers in 62 schools with upper primary grades.

67
Table 4.1 Working Days for Classes 1-5 in Government Schools in Bihar
Proportion of schools which worked more than 200 days Percent
Primary schools 100
Upper primary schools 93.4
All schools with primary grades 95.7
Note: Based on survey of sample schools
Source: CORD Survey 2011-12
Table 4.2 Working Days for Classes 6-8 in Government Schools in Bihar
Proportion of schools which worked more than 220 days Percent
Upper primary school 100
Upper primary schools 77.0
All schools with upper primary grades 77.4
Note: Based on survey of sample schools
Source: CORD Survey 2011-12
Most schools reported sudden closure due to excessive cold / excessive heat / floods. A very
high proportion of schools (89.6%) reported that the schools had to be closed for different
reasons in the previous year. In Bihar, this is determined at state level and applies to districts all
over the state.
Table 4.3 Distribution of Government schools in Bihar by the number of days schools were closed
unexpectedly*
Number of days closed in school
year 2010-11
Reported by
Number of schools Proportion of schools
Not closed 10 10.4
5 to 9 days 15 15.6
10 to 14 days 43 44.8
15 to 19 days 17 17.7
20 days or more 7 7.3
Total responses 92 100
*Reasons included extreme weather conditions like floods, cold wave, heat wave.
Note: Based on survey of sample schools
Source: CORD Survey 2011-12
Minimum number of working hours per week for the teacher: The RTE Act specifies 45 hours a
week as mandatory time for teachers to prepare and to teach. The average school day was
reported to be five hours in summer and six hours in winter (including the midday meal) on
average. The average duration of the midday meal was reported to be 42 minutes. Saturdays
were a shorter day. Teachers were not keeping any record of time they might spend on work
outside of school hours.
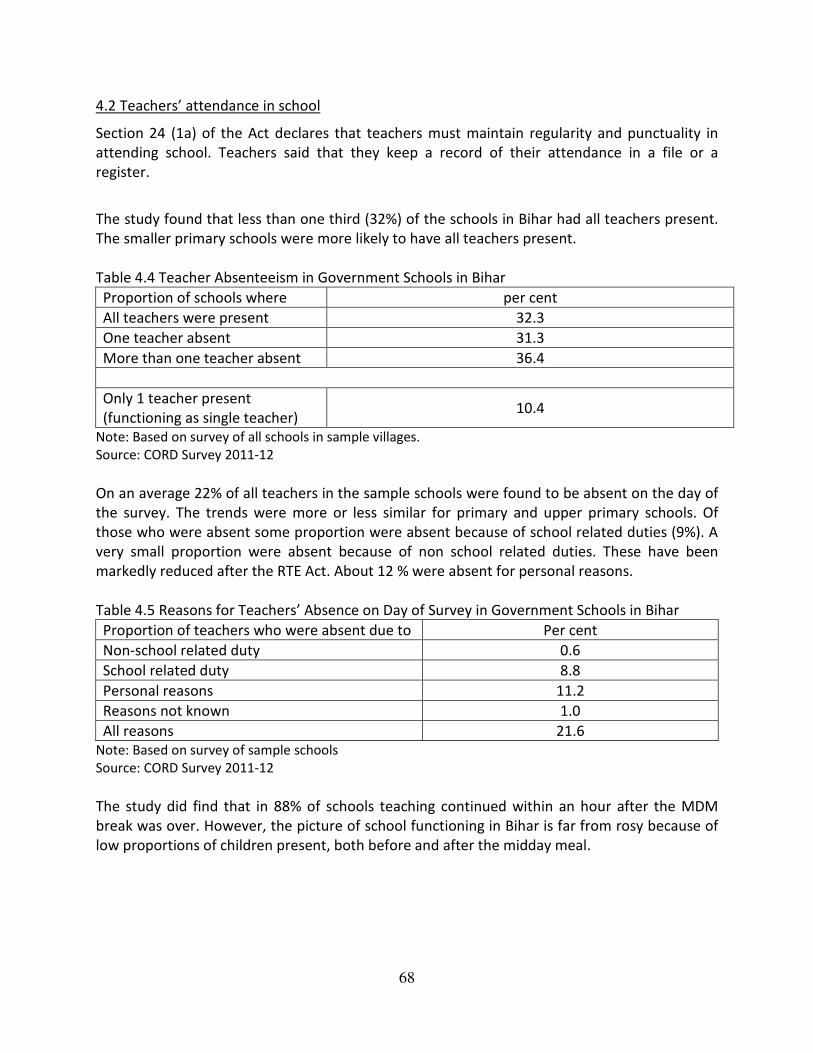
68
4.2 Teachers’ attendance in school
Section 24 (1a) of the Act declares that teachers must maintain regularity and punctuality in
attending school. Teachers said that they keep a record of their attendance in a file or a
register.
The study found that less than one third (32%) of the schools in Bihar had all teachers present.
The smaller primary schools were more likely to have all teachers present.
Table 4.4 Teacher Absenteeism in Government Schools in Bihar
Proportion of schools where per cent
All teachers were present 32.3
One teacher absent 31.3
More than one teacher absent 36.4
Only 1 teacher present
(functioning as single teacher) 10.4
Note: Based on survey of all schools in sample villages.
Source: CORD Survey 2011-12
On an average 22% of all teachers in the sample schools were found to be absent on the day of
the survey. The trends were more or less similar for primary and upper primary schools. Of
those who were absent some proportion were absent because of school related duties (9%). A
very small proportion were absent because of non school related duties. These have been
markedly reduced after the RTE Act. About 12 % were absent for personal reasons.
Table 4.5 Reasons for Teachers’ Absence on Day of Survey in Government Schools in Bihar
Proportion of teachers who were absent due to Per cent
Non-school related duty 0.6
School related duty 8.8
Personal reasons 11.2
Reasons not known 1.0
All reasons 21.6
Note: Based on survey of sample schools
Source: CORD Survey 2011-12
The study did find that in 88% of schools teaching continued within an hour after the MDM
break was over. However, the picture of school functioning in Bihar is far from rosy because of
low proportions of children present, both before and after the midday meal.

4.3 Students’ Attendance
The study found that there appears to be little effort to ensure attendance of all children
enrolled. Attendance rates reported from the attendance register were
Attendance rates among girls were marginal
Table 4.6: Student Attendance on the Day of the Survey in Government Schools in Bihar
Proportion (%) of students attending
on the day of survey
Primary schools
Upper primary schools
All schools
Note: Based on survey of sample schools
Source: CORD Survey 2011-12
The observed attendance rates were
of the investigators on the day of the survey
the midday meal. At its highest point, 40.6% of children were in school,
terms of observed attendance rates as well, girls’ attendance was better than that of the boys.
Attendance rates dropped in the higher grades (see Table
observed among boys in Class 8 where less
It is possible that boys were more likely to be enrolled in private schools or going to private
tuition.
Based on survey of sample schools
Source: CORD Survey 2011-12
46.943.3
0
25
50
75
100
Primary schools
Pe
rce
nt
Figure 4.7: Student Attendance Before and After
Mid-day Meal in Government Schools in Bihar
69
The study found that there appears to be little effort to ensure attendance of all children
enrolled. Attendance rates reported from the attendance register were
Attendance rates among girls were marginally higher than among boys.
ttendance on the Day of the Survey in Government Schools in Bihar
tudents attending According to attendance register Observed by survey
All Boys Girls All
53.4 53.0 53.8 46.9
47.3 46.2 48.3 39.3
47.8 46.2 49.4 40.6
Note: Based on survey of sample schools
The observed attendance rates were even lower. These were calculated from the observations
of the investigators on the day of the survey and were the attendance rates observed before
At its highest point, 40.6% of children were in school, a truly dismal figure.
terms of observed attendance rates as well, girls’ attendance was better than that of the boys.
Attendance rates dropped in the higher grades (see Table 4.8). Lowest attendance levels were
observed among boys in Class 8 where less than 30% of those enrolled were present in school.
It is possible that boys were more likely to be enrolled in private schools or going to private
39.3
31.8
Upper primary schools
Figure 4.7: Student Attendance Before and After
day Meal in Government Schools in Bihar
Pre midday meal
Post midday meal
The study found that there appears to be little effort to ensure attendance of all children
enrolled. Attendance rates reported from the attendance register were as low as …%.
ttendance on the Day of the Survey in Government Schools in Bihar
Observed by survey
team
Boys Girls
46.9 45.9 47.9
39.3 37.0 41.6
40.6 37.6 42.7
calculated from the observations
attendance rates observed before
a truly dismal figure. In
terms of observed attendance rates as well, girls’ attendance was better than that of the boys.
). Lowest attendance levels were
than 30% of those enrolled were present in school.
It is possible that boys were more likely to be enrolled in private schools or going to private
Pre midday meal
Post midday meal

70
To find out whether children were there for the duration of the school day, the number of
children present was also observed after the midday meal. This was found to fall to an even
more dismal figure of 33.5%.
Attendance slightly better in the primary schools: Attendance rates in the primary schools
(46.9%) were slightly better than in the upper primary schools (39.3%). At no point in the school
day, did the attendance figure cross 50% in the case of the primary schools, and 40% in the case
of upper primary schools.
Table 4.8 Attendance Rates in Selected Classes in Government Schools in Bihar
(per cent)
Proportion of
students attending
According to attendance register Observed by survey team
In primary schools
Grade 1 58.7 52.4
Grade 5 50.9 42.9
In upper primary schools
Grade 1 52.4 45.5
Grade 5 48.2 38.9
Grade 8 46.6 35.0
Based on survey of sample schools
Source: CORD Survey 2011-12
Attendance more irregular in higher grades: Grade-wise attendance rates are useful to see how
observed attendance in grade 5 (42.9%) was below observed attendance in grade 1 (52.4%),
indicating a higher degree of irregular attendance among the older children in primary schools.
This trend was also seen in the upper primary schools. Grade 8 had the lowest proportion of
enrolled children observed present (35%), grade 5 had a slightly higher proportion (38.9%)
present, and grade 1 had the highest proportion (45.5%) present.
Clearly the right of every enrolled child in Bihar to complete eight years of elementary
education does not appear to be anywhere within reach.
4.4 Profile of teachers appointed
It must be noted that Bihar, in its state rules (May 2011) has chosen not to stipulate that
teachers of similar qualifications, experience and work will be paid at par. This allows them to
continue recruiting teachers at fixed and low pay. Teachers in Bihar increasingly include
teachers recruited under the Panchayat Teacher Rules 2012 – at specified pay scales which are
much lower than those specified by the Pay Commission. Teachers are reported to be recruited
at Panchayat level for primary schools, and at block level for upper primary schools. When a

school gets upgraded, the teacher moves out of the
comes under the Panchayat Samiti.
Table 4.9a Profile of Teachers in Government Schools in Bihar:
Proportion of teachers
appointed who are:
Distribution by gender
Male
Permanent / regular 20.4
Panchayat appointees 40.2
All 60.6
Based on details of all teachers in sample schools
Source: CORD Survey 2011-12
The study found that only one fourth
teachers (see Table 4.9a). A very high proportion (75%)
there were more male teachers (60.4%) than female teachers.
nearly all local teachers. The upper primary schools had regular teachers but these were a low
proportion (29%) of all teachers in these schools
Panchayat
teachers
75%
Figure 4.9b: Profile of Teachers in Government
Schools in Bihar: Type of Service
71
school gets upgraded, the teacher moves out of the authority of the Gram Panchayat and
comes under the Panchayat Samiti.
Profile of Teachers in Government Schools in Bihar: Type of Service and Gender
Distribution by gender All
Male Female
20.4 5.1 25.5
40.2 34.3 74.5
60.6 39.4 100
Based on details of all teachers in sample schools
The study found that only one fourth of all teachers appointed were permanent or
. A very high proportion (75%) was panchayat appointees.
there were more male teachers (60.4%) than female teachers. The smaller primary schools had
nearly all local teachers. The upper primary schools had regular teachers but these were a low
proportion (29%) of all teachers in these schools (see Figures 4.9b and 4.9c).
Regular
teachers
25%
Figure 4.9b: Profile of Teachers in Government
Schools in Bihar: Type of Service
authority of the Gram Panchayat and
ype of Service and Gender
were permanent or regular
panchayat appointees. Overall,
The smaller primary schools had
nearly all local teachers. The upper primary schools had regular teachers but these were a low
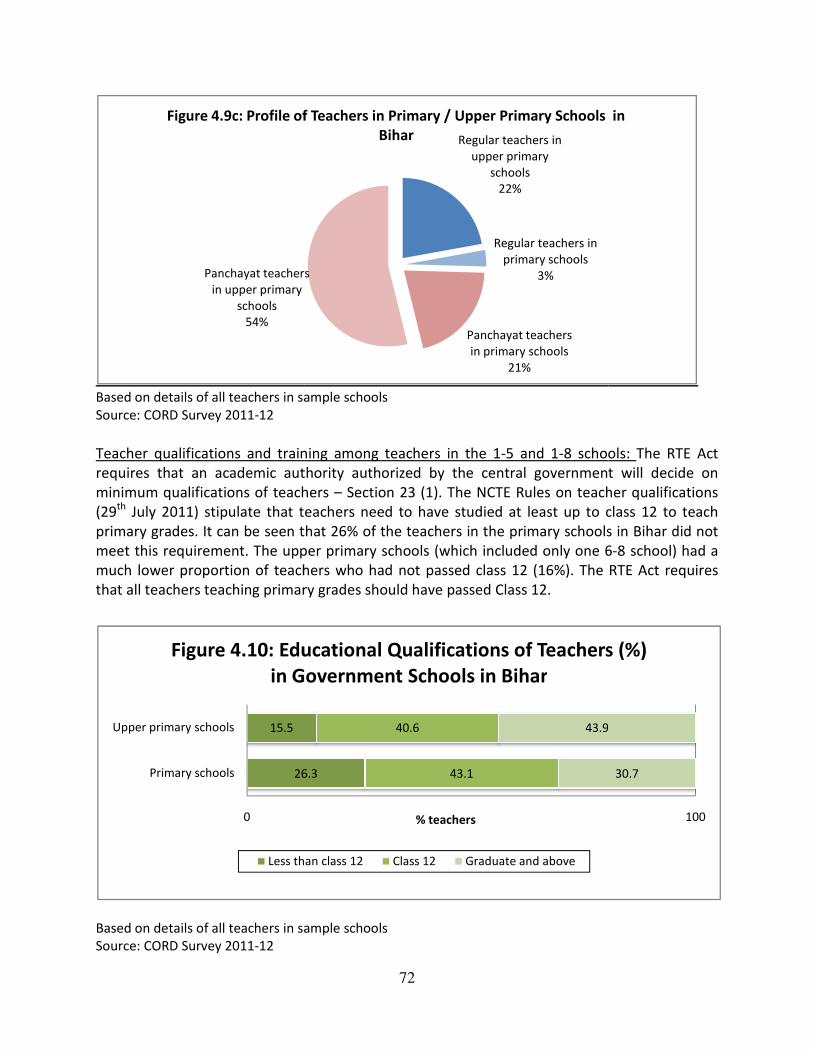
Based on details of all teachers in sampl
Source: CORD Survey 2011-12
Teacher qualifications and training among teachers in the 1
requires that an academic authority authorized by the central government
minimum qualifications of teachers
(29th
July 2011) stipulate that teachers need to have studied at least up to class 12 to teach
primary grades. It can be seen that
meet this requirement. The upper primary schools (which included only one 6
much lower proportion of teachers who had
that all teachers teaching primary
Based on details of all teachers in sample schools
Source: CORD Survey 2011-12
Panchayat teachers
in upper primary
schools
54%
Figure 4.9c: Profile of Teachers in Primary / Upper Primary Schools in
26.3
15.5
0
Primary schools
Upper primary schools
Figure 4.10: Educational Qualifications of Teachers (%)
in Government Schools in Bihar
Less than class 12
72
Based on details of all teachers in sample schools
and training among teachers in the 1-5 and 1-8 schools
cademic authority authorized by the central government
minimum qualifications of teachers – Section 23 (1). The NCTE Rules on teacher qualifications
July 2011) stipulate that teachers need to have studied at least up to class 12 to teach
primary grades. It can be seen that 26% of the teachers in the primary schools in Bihar did not
The upper primary schools (which included only one 6
much lower proportion of teachers who had not passed class 12 (16%). The RTE Act requires
that all teachers teaching primary grades should have passed Class 12.
Based on details of all teachers in sample schools
Regular teachers in
upper primary
schools
22%
Regular teachers in
primary schools
3%
Panchayat teachers
in primary schools
21%
Panchayat teachers
in upper primary
Figure 4.9c: Profile of Teachers in Primary / Upper Primary Schools in
Bihar
26.3 43.1
40.6 43.9
% teachers
Figure 4.10: Educational Qualifications of Teachers (%)
in Government Schools in Bihar
Less than class 12 Class 12 Graduate and above
8 schools: The RTE Act
cademic authority authorized by the central government will decide on
. The NCTE Rules on teacher qualifications
July 2011) stipulate that teachers need to have studied at least up to class 12 to teach
chools in Bihar did not
The upper primary schools (which included only one 6-8 school) had a
The RTE Act requires
Figure 4.9c: Profile of Teachers in Primary / Upper Primary Schools in
30.7
43.9
100
Figure 4.10: Educational Qualifications of Teachers (%)

NCTE rules also stipulate that teachers who teach upper primary grades must be graduates
(except those who have done a 4 year B.El.Ed.).
Bihar reported teaching both primary and upper primary classes, no comment can be made on
the qualifications of teachers teaching upper primary grades.
them as teachers of a specific subject as many were teaching multiple subjects.
cent of teachers in upper primary schools were graduates
since schools had very high PTRs it is unlikely that there were sufficient teachers for t
primary grades who were qualified.
Based on details of all teachers in sample schools
Source: CORD Survey 2011-12
Looking at professional teacher
variation between the primary and upper primary schools. A
teachers in the primary schools had no training compared to 31% of the teachers in the upper
primary schools.
Teacher qualifications and training
educational qualifications and training among the regular teachers and locally appointed
teachers, we see that the regular teacher cadre in
were graduates. But it also included 19% who had only passed Class 12 and 21% who had not
passed Class 12. The newly recruited local teachers had
Approximately half (49%) had only completed Class 12, and 17% have not passed Class
very small proportion (12%) of regular teachers had no training. This wa
teachers. Overall, 35% of teachers in Bihar had no training.
0
Primary schools
Upper primary schools
Figure 4.11: Teachers (%) with Professional Teacher
Education in Government Schools in Bihar
Diploma (JBT, CPED, DPE)
73
NCTE rules also stipulate that teachers who teach upper primary grades must be graduates
(except those who have done a 4 year B.El.Ed.). Since most teachers in upper primary schools in
Bihar reported teaching both primary and upper primary classes, no comment can be made on
the qualifications of teachers teaching upper primary grades. It was also difficult to identify
specific subject as many were teaching multiple subjects.
cent of teachers in upper primary schools were graduates, a substantial proportion
since schools had very high PTRs it is unlikely that there were sufficient teachers for t
primary grades who were qualified.
Based on details of all teachers in sample schools
Looking at professional teacher training among teachers in the 96 sample schools, we see a big
variation between the primary and upper primary schools. Approximately half (49%) the
teachers in the primary schools had no training compared to 31% of the teachers in the upper
raining among regular and locally appointed teachers
educational qualifications and training among the regular teachers and locally appointed
teachers, we see that the regular teacher cadre in the sample schools in Bihar had 59% who
es. But it also included 19% who had only passed Class 12 and 21% who had not
wly recruited local teachers had a lower proportion of graduates (34%
only completed Class 12, and 17% have not passed Class
very small proportion (12%) of regular teachers had no training. This was true for 43% of local
Overall, 35% of teachers in Bihar had no training.
46.3
64
4.4
5.3
49.3
% teachers with
Figure 4.11: Teachers (%) with Professional Teacher
Education in Government Schools in Bihar
Diploma (JBT, CPED, DPE) B. Ed. No training
NCTE rules also stipulate that teachers who teach upper primary grades must be graduates
Since most teachers in upper primary schools in
Bihar reported teaching both primary and upper primary classes, no comment can be made on
It was also difficult to identify
specific subject as many were teaching multiple subjects. Forty four per
, a substantial proportion. However,
since schools had very high PTRs it is unlikely that there were sufficient teachers for the upper
sample schools, we see a big
pproximately half (49%) the
teachers in the primary schools had no training compared to 31% of the teachers in the upper
among regular and locally appointed teachers: Comparing
educational qualifications and training among the regular teachers and locally appointed
Bihar had 59% who
es. But it also included 19% who had only passed Class 12 and 21% who had not
a lower proportion of graduates (34%).
only completed Class 12, and 17% have not passed Class 12. A
s true for 43% of local
30.7
100
Figure 4.11: Teachers (%) with Professional Teacher

74
Table 4.12 Education Levels and Training Among Regular Teachers and Locally Appointed
Teachers
(per cent)
Proportion of teachers who are
educated
Regular
teachers
Locally appointed
teachers
All
Teachers
Less than class 12 21.4 17.0 18.1
Class 12 19.3 48.8 41.3
Graduate and above 59.3 34.2 40.6
All 100.0 100.0 100.0
Proportion of teachers who have
received following training
Diploma (JBT, CPED, DPE etc) 79.2 53.1 59.7
B. Ed. 9.0 3.8 5.1
None 11.8 43.1 35.2
All 100.0 100.0 100.0
Based on details of all teachers in sample schools
Source: CORD Survey 2011-12
There was a difference in qualifications of female teachers as opposed to males. The majority of
female teachers were those who had passed Class 12 at most (74.1%) compared to 49.7% of
the male teachers. Close to half (45.5%) of the female teachers had no training, as opposed to
28.4% of male teachers.
4.5 Salary scales of teachers
Teachers’ salaries varied between Rs 6000 and Rs 8000 (for details of salary scales, see Part A,
Section 1.3). According to the Panchayat Teacher Rules, no teacher should be paid less than Rs
6000 per month. From responses taken from class 3 and class 7 teachers in the sample schools,
it appears that there were two teachers who reported getting paid less than this amount (Rs
2000, and Rs 5000, respectively). The majority of regular teachers were getting over Rs 20,000 a
month, the more recent recruits reported that they were getting upto Rs 8,000 a month.
Table 4.13 Salary Scales of Teachers for Selected Classes in Government Schools in Bihar
Number of
teachers who
receive monthly
salary (Rs.)
Class 3 teachers Class 7 teachers Class 3/Class 7 teachers
Regular Locally
appointed
Regular Locally
appointed
Regular Locally
appointed
5,000 - 6,000 0 50 0 16 0 66
6,001 - 8,000 2 31 1 21 3 52
10,000 - 20,000 1 0 1 0.0 2 0
20,000+ 6 0 15 0.0 21 0
All Teachers 9 81 17 37 26 118
Based on interviews with class 3 and class 7 teachers in sample schools
Source: CORD Survey 2011-12

75
Table 4.14 Teachers’ Satisfaction with Level and Regularity of Pay in Government Schools in
Bihar
(per cent)
Proportion of teachers who
said
Regular
Teachers
Locally appointed
teachers
All teachers
their salary is low / irregular 10.7 75.6 63.5
Based on interviews with Class 3 and Class 7 teachers in sample schools
Source: CORD Survey 2011-12
From the data gathered, it is evident that low / irregular salary was a common concern amongst
most locally recruited teachers. Some respondents said that salary was given once in 3-4
months and this caused a great deal of trouble. One respondent hadn’t received his pay in the
last seven months.
Only a small proportion of teachers had problems with being posted to rural / difficult to access
areas and issues of safety. The majority of teachers interviewed did not have these concerns
reflecting the high proportion of local teachers appointed under the Panchayat rules.
Table 4.15 Accessibility of Schools a Problem for Some Teachers in Government Schools in Bihar
(per cent)
Proportion of teachers who reported
problems with being posted:
Class 3 Class 7 Class 3/Class 7
teachers
in difficult-to-access rural areas 18.5 8.9 14.9
in areas where there are issues of safety 12.0 5.4 9.5
Based on interviews with class 3 and class 7 teachers in sample schools
Source: CORD Survey 2011-12
4.6 Completion of curriculum
Teachers complained of shortage of time to complete the syllabus, particularly with regard to
covering tough topics. Using activities to teach ate up time. They also complained of a lack of
facilities – no blackboard or proper classrooms, and of the difficulty in explaining to some
children – “it is tough to explain to ('kambuddi') weaker children”.
As is evident from Table 4.16 teachers face several hurdles in completing their course on time.
64 percent of the class 3 teachers and 62 percent of the class 7 teachers interviewed said they
faced some kind of trouble finishing curriculum. Teachers state that student irregularity and
difficulty in understanding course content is one of the main reasons for non completion of
curriculum. 30% of class 3 and 27% of class 7 teachers reported that they faced such difficulties.
In addition to this, the teachers also said that being occupied with election, census and BLO
duties was also time consuming and took away teaching hours. Another difficulty that teachers

76
Table 4.16 Problems faced by School Teachers in Completing Curriculum on Time in
Government Schools in Bihar
Proportion of teachers: Class 3 Class 7 Class 3/Class 7
teachers
who reported they face problems in
completing the curriculum on time
64.0
61.8
61.9
Who cited the following difficulties in completing the curriculum on time:*
Student irregularity / students do not
understand 30.4 26.8 29.3
Late arrival of textbooks 27.2 21.4 25.2
Poor infrastructure, insufficient teaching
staff, non teaching duties 27.2 41.1 32.7
School closed due to extreme weather
conditions/natural calamities 19.6 16.1 18.4
*Options not mutually exclusive
Based on interviews with class 3 and class 7 teachers in sample schools
Source: CORD Survey 2011-12
faced was lack of proper infrastructure in schools. One teacher in Gaya stated that all classes in
the school sit together, thereby making teaching very difficult. Teachers also said that
insufficient teaching staff was a problem in the timely completion of the curriculum. Schools
being closed because of extreme weather conditions was reported as a problem by 18% of
teachers interviewed.
4.7 Non teaching duties
Regarding teachers’ involvement in activities like Census, election etc., Section 27 of the Act
states that no teacher shall be deployed for any non educational purposes other than the
decennial population census, disaster relief duties or duties relating to elections to the local
authority or the State Legislatures or Parliament. A notification regarding the same was also
passed by the Bihar Government on January 4, 2011.
Table 4.17 Non-Teaching Duties of Teachers in Government Schools in Bihar
Proportion of teachers who were involved in
following activities during the previous academic
year 2010-11
Class 3 Class 7 Class 3/Class 7
teachers
Election 30.4 69.6 45.3
Census 38.0 66.1 48.7
Polio 2.2 1.8 2.0
Others (Board examination duty, TET evaluations,
Sakshar Bharat scheme)
6.5 12.5 8.8
Based on interviews with class 3 and class 7 teachers in sample schools
Source: CORD Survey 2011-12

77
As mentioned, on the day of the survey very few teachers were found absent for non-school
related duties (less than 1%) However teachers reported that during the previous academic
year, most (38%) of class 3 teachers were deployed for census duties while close to 70% of class
7 teachers were deployed for election duties. Election duty was reported during September-
October and May-June. Census duty was reported in June. Apart from election, census, disaster
relief and polio duties, some teachers said they have BLO51
duty “round the year”. A couple of
teachers had also been sent for board examination duty, TET evaluations and participation in
the 'sakshar bharat’ scheme.
SECTION 5. GUIDELINES FOR TEACHERS FOR TRANSACTING THE CURRICULUM
5.1 How teachers understand the RTE guidelines for transacting the curriculum
The provisions specified in the RTE Act are quite complex and the study sought to understand
how teachers understood these provisions. Teachers are to transact the curriculum in
conformity with Constitutional values; all round development of the child; building up child’s
knowledge, potential and talents; development of physical and mental abilities to the fullest
extent; learning through activities, discovery and exploration in a child friendly and child
centred manner; making the child free of fear, trauma and anxiety and helping the child to
express their views freely. We discuss the findings of the study in the context of each of these
provisions.
(a) Conformity with Constitutional values: A teacher acting in conformity with Constitutional
values would act in a way to ensure that all children are able to access their right to
education. The study found that no teacher talks of the rights of children. When they talk
about being friendly or supportive, it is more as an initiative of the teacher rather than
something the child is entitled to. It is notable that two teachers mentioned the ‘removal of
untouchability’ and ‘keeping children away from discrimination’ as part of all round
development. However, apart from this no teacher talks about active inclusion, except for
‘weaker children’. No one raises the issue that children of certain communities, Special
Needs, or gender may need particular support in the school.
(b) All round development of the child: The most common responses for ensuring all round
development was using physical activities such as sports / PT / parade, and other activities
like singing, dancing, and acting. Sports is not specified as a formal period or activity by
most teachers. Many say that they have play time as a last period of the day or on
Saturdays. This is sometimes along with other cultural activities or bal sabha pointing to
limited formal sports periods. Also, it is not clear whether everyone is encouraged to
participate in art, dance or singing. For instance a teacher said that they encourage children
51
Booth Level Officer.

78
according to what they are good at. Another said that they “encourage children who are
good at studies to also try and be good in sport”. One teacher from Kishanganj however
gave a somewhat questionable response that “children who are weak in either studies or
sport, we make them study or play together so that their confidence increases”.
Teachers also felt that they contributed to a child’s all round development by telling them
about cleanliness and hygiene, encouraging them to conduct themselves well, and teaching
them about things around them, their heritage, telling them stories about renowned people
and exposing them through excursions. Their responses appear to be related also to the
next two requirements – see (c) and (d) below.
(c) Building up child’s knowledge, potential and talents: Teachers’ statements that they tell
children stories of great people, educate them about cleanliness or hygiene or even take
the help of ‘brighter children’ or of TLM to help explain to ‘weaker children’ need to be
noted. This may be useful to build up the child’s knowledge and so on but it does little to
ensure that the child’s physical and mental abilities are being built up to the fullest extent
(see d below) of that the child learns through activities, discovery and exploration (see e
below). It corroborates what is observed by the NCF 2005 that “frequently the notions of
‘good student’ that are promoted emphasise obedience to the teacher, moral character and
acceptance of the teacher’s words as ‘authoritative’ knowledge”.
What is also a matter of concern is that some teachers say that they involve children in the
cleanliness of the school to sensitize them to the issue. Field studies suggest that such work
tends to be given to girls from lower caste groups, indicating a negative fallout on gender
and social equity in the school rather than a positive learning.
(d) Development of physical and mental abilities to the fullest extent: The study did find that
there were efforts to make children learn through activities, through stories, and through
explanations keeping the child’s learning levels in mind (see e below). All these were
sensitive to the learning needs of children. Overall, though, teaching in general was not
geared to the realisation of the child’s full potential.
The concept of ‘weaker’ and ‘brighter’ children remains prevalent. It may be a genuine
problem for teachers to teach children of widely varying capacities but the fact that there is
little mention of different learning styles and abilities shows that many teachers continue to
see their students on a vertical, progressive line of ‘levels’ of ability rather than horizontal
line of ‘differences’ in abilities.
(e) Learning through activities, discovery and exploration in a child friendly and child centred
manner: The most common responses for teaching “through activities, discovery and
exploration” included teaching through objects from the environment or by going out into
the ‘environment’; teaching through TLMs (objects, pictures, shapes); and by teaching
through craft, playway methods, and activities such as standing in a line and learning
counting. Such responses are a very positive trend particularly in the light of the RTE Act. It

79
is also positive to find some mention of the use of question-answers and group discussions
as a means of teaching, activities that encourage critical thinking and higher order cognitive
skills. Some teachers have also said that they make children frame questions and find
answers to them. More of this is needed.
However, teachers often talk of activities such as a song or poem to get the attention of
children, after which they can then get down to the business of teaching reflecting how
some teachers don’t consider activities as teaching methods in themselves. A teacher from
Gaya reported, “First I try and attract children through stories and poems and then begin to
teach through textbooks.”
Teaching “in a child-friendly and child-centred manner” included the stress on TLMs and
playway methods, and, in addition, explaining through examples and stories; explaining
repeatedly to those who do not understand / explaining in a way in which the child
understands / explaining according to the mental level of a child. It appears that teachers
would explain in a style suitable to the child’s needs. Sometimes it appeared that TLMs are
seen as a means of explaining to ‘weaker’ children, as a secondary step in explanation. For
instance, “for children who don’t understand, we use TLM or explain with examples’.
“Child friendly” teaching methods also meant being friendly / removing fear / not scolding /
teaching with love / mingling with the children / encouraging them. It overlapped with the
concerns expressed in (g), see below. “Child centred teaching” also included teaching
according to children’s interests. This could be interpreted as teaching according to what
attracts the class or excites them on that day.
Although most answers to what constitutes child-centered teaching are sensitive to the
child, they continue to display a teacher-centric, adult-helping-child approach, indicating
that there is still room to recognize the child’s agency. One teacher seemed to be
interpreting child-centered teaching with making the child ‘focus’ on studying or associate it
with a spatial concept of a circle with a center. She said that she sits in the center of the
circle with children around her.
Discussion with teachers reflects some exposure to these concepts: Bihar teachers’ reported
understanding of the various ways they are to transact the child friendly and child centered
teaching curriculum shows that despite no large scale RTE specific trainings like ‘Samvad’ in
Uttar Pradesh, teachers do have some degree of understanding.
A small proportion of teachers reported that they had had trainings to enable them to
incorporate a different perspective of the child and of education into their teaching, although
they were not necessarily related to the provisions of the RTE Act itself. Just one fifth of class 3
and class 7 teachers reported that they had received such training. This could reflect earlier
initiatives of the government.52
52
“In-service training programmes are managed by BEP (Bihar Education Project). By 2010, BEP had developed a
new module (“Bodhi Samvad”) in collaboration with SCERT, Bihar and Vidya Bhavan Education Resource Centre
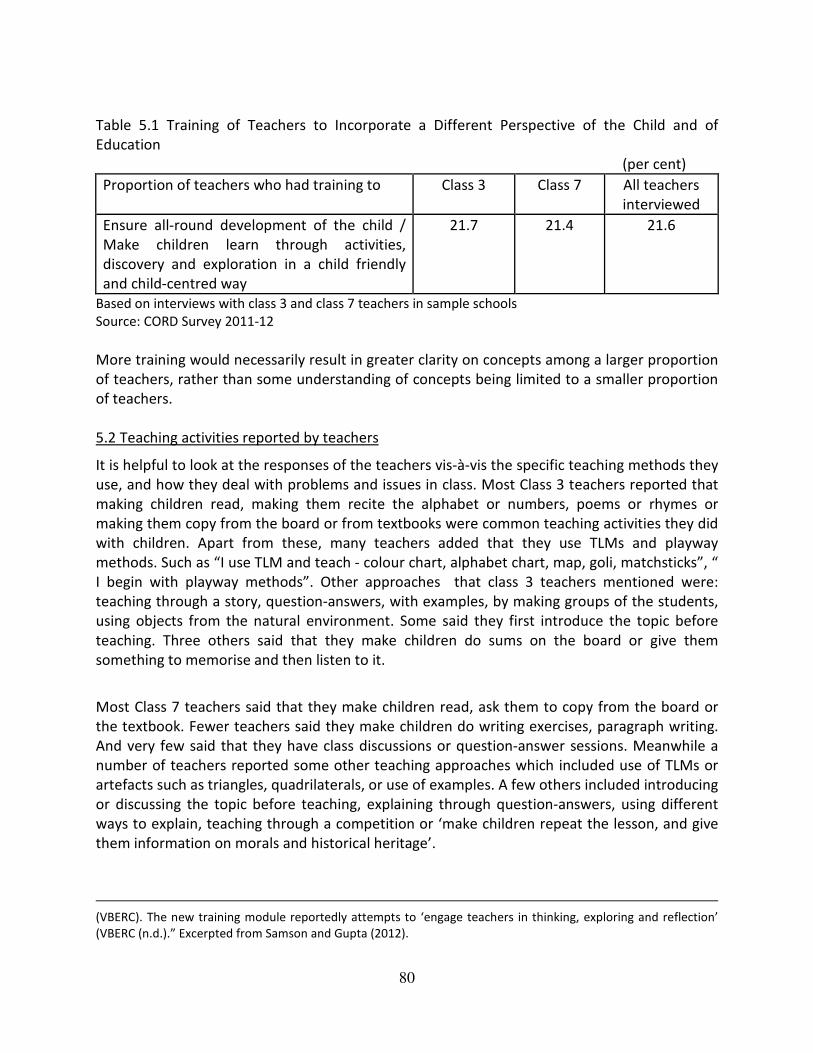
80
Table 5.1 Training of Teachers to Incorporate a Different Perspective of the Child and of
Education
(per cent)
Proportion of teachers who had training to Class 3 Class 7 All teachers
interviewed
Ensure all-round development of the child /
Make children learn through activities,
discovery and exploration in a child friendly
and child-centred way
21.7 21.4 21.6
Based on interviews with class 3 and class 7 teachers in sample schools
Source: CORD Survey 2011-12
More training would necessarily result in greater clarity on concepts among a larger proportion
of teachers, rather than some understanding of concepts being limited to a smaller proportion
of teachers.
5.2 Teaching activities reported by teachers
It is helpful to look at the responses of the teachers vis-à-vis the specific teaching methods they
use, and how they deal with problems and issues in class. Most Class 3 teachers reported that
making children read, making them recite the alphabet or numbers, poems or rhymes or
making them copy from the board or from textbooks were common teaching activities they did
with children. Apart from these, many teachers added that they use TLMs and playway
methods. Such as “I use TLM and teach - colour chart, alphabet chart, map, goli, matchsticks”, “
I begin with playway methods”. Other approaches that class 3 teachers mentioned were:
teaching through a story, question-answers, with examples, by making groups of the students,
using objects from the natural environment. Some said they first introduce the topic before
teaching. Three others said that they make children do sums on the board or give them
something to memorise and then listen to it.
Most Class 7 teachers said that they make children read, ask them to copy from the board or
the textbook. Fewer teachers said they make children do writing exercises, paragraph writing.
And very few said that they have class discussions or question-answer sessions. Meanwhile a
number of teachers reported some other teaching approaches which included use of TLMs or
artefacts such as triangles, quadrilaterals, or use of examples. A few others included introducing
or discussing the topic before teaching, explaining through question-answers, using different
ways to explain, teaching through a competition or ‘make children repeat the lesson, and give
them information on morals and historical heritage’.
(VBERC). The new training module reportedly attempts to ‘engage teachers in thinking, exploring and reflection’
(VBERC (n.d.).” Excerpted from Samson and Gupta (2012).

81
This mostly tallies with the kind and variety of responses given by teachers in Class 3, indicating
that even upper primary students are taught with methods which are used among primary class
students, rather than something that may be more suitable for their age. The common terms
teachers use everywhere also indicate the possibility that these are terms and methods they
have learnt in training sessions. It remains to be seen how much is actually implemented in
school.
When children do not understand: Apart from their teaching methods teachers were also asked
how they deal with a range of situations. If a child does not understand something the teacher
has taught what does he or she do? Of the options given most teachers (92-93 percent) said
that they explain to the child again, with examples or simply repeatedly or sometimes
individually/later. “Explain through science/math kits, break the sentence into small parts and
explain, teach the same lesson for 4-5 days, explain till they do understand, try and find out the
weak point/the root where the child has not understood and explain that, teach once again on
the blackboard, call the child near the teacher and explain,” are some examples.
Two other common responses were: telling the child to read from the textbook or ask the child
to take the help of another child. In these approaches class 3 and class 7 teachers were mostly
in agreement, though a few more Class 7 teachers chose these approaches. Teachers also said
they use the more child centered method of ‘asking related questions from the same child’ to
help them to understand. This was much more preferred by upper primary teachers (51.8%
against 36% for primary). This seems logical as class 7 children would respond to this approach
better.
While the use of TLMs, playway methods, songs, stories were common, a significant number
gave other answers as well: give the children homework, make them write in their notebooks
or solve questions on the board and try and see where the problem is, or simply make them say
the answer repeatedly. Very few teachers reported scolding the child in such a circumstance.
These too were mostly qualified as “mild scolding”.
5.3 Teaching activities observed
An attempt was made to validate responses of teachers by a one period observation of the
groups where class 3 and class 7 were studying. Few other aspects of the functioning of the
school were also noted. The observations do not give a very positive picture of teaching
practices, though there were some encouraging examples.
Teaching in all schools with class 3 could not be observed as in 17% of cases there were no
teaching activities for Class 3 students the entire day because too few students or too few
teachers were present – this was seen on the days after Saraswati Puja, around 26 January, and
in isolated cases where scholarships were being distributed and the single teacher could not
cope. In a few schools the teachers made the children recite alphabet or numbers (13%), or
recite rhymes (22%), or tables (8%). The more common practices observed (in 80% of cases)
included teachers reading from the textbook for language teaching, writing on the blackboard

82
and then explaining for Maths class. A substantial proportion of teachers asked questions orally
(58%). In a couple of cases the students were asked to solve problems on the blackboard, or
copy problems from the blackboard to solve, and only in one class did a teacher use a teaching
aid. In one school, the teacher was working with a few students on preparing for a debate (to
be held on 26 January), There were several instances where, during observation, teachers did
no active teaching – but had given written or oral work to the students, while they corrected
copies or did other work.
Class 7 teachers were observed mainly to read from the text or write on the blackboard and
explain orally. More than 80% were seen to ask questions. A variety of subjects were being
taught – Science, Geography, Geometry, English, in addition to Hindi and Maths.
Some positives: In 5 of the schools observed, the Class 7 teachers used teaching aids. Several
innovative methods were observed – like setting the maths problems with the use of a cricket
score board, additions through using fruits, or breaking numbers into parts, using charts to
teach science, and in some classes use of role plays and acting to explain concepts.
There was evidence of many teachers being inclusive – in a large number of cases in both class
3 and class 7, all children were actively participating in their class. Teachers in general talked to
all children and not to a selected few, and interacted with them, using their names.
Table 5.2 Organized Activities in Government Schools in Bihar
Proportion of schools Per cent
Where any organized activity, sports, games, music, dance was observed 18.7
Based on survey of sample schools
Source: CORD Survey 2011-12
Observation of sports / games / music / dance: In 18.7% schools some form of sports / games /
music or dance was observed during the day of the survey. Given the kind of responses
teachers gave one would have expected it to be higher. In most cases except three, these
involved sports like kabaddi, kho-kho, cricket. In one case each it was carom, volleyball. For
instance, in one school Class 5-7 students were playing kabaddi and class 3-4 were playing rope
skipping and racing. In another, Class 6-8 children were playing Kabaddi and girls were playing
with ropes, class 4 and 5 children were playing "Patna Chithi" game. In a third school, girls of
class 5-8 were were playing kabbaddi. 20 class two children were playing cricket n another
school.
In one school a rehearsal for the national anthem was going on after the MDM (for Republic
Day). A Dance and cultural (music) programme was held for 30 minutes in which all children
participated, in a school in Champaran West. Class 1-3 students were involved in a story session
in another. In Bhabua, students were asked to perform on the themes of the village
environment and social condition it was conducted by the teacher.

83
5.4 Methods of controlling / disciplining children reported and observed
The Act prohibits corporal punishment / mental harassment. In this context teachers were
asked what methods they used to control children or to discipline them. The overwhelming
majority of teachers reported that they explain to children lovingly or try and get their attention
in some way. Sometimes they prefer to give an activity to the children, some way for them to
vent their energy, like making them stand up and down a few times, telling a story, making
them sing and so on. One teacher said that he sends the children out to play for a while, if they
are too restless. One teacher said he tries ‘not to leave gaps in which disturbance can be
created’! Other teachers said that they explain the ‘value of good behavior’, the ‘benefits of
keeping silent’, ‘the value of learning’, ‘that they must respect their teachers (gurujan)’ and so
on. Others tell them inspiring stories about great people (mahan log), people with great
knowledge, about moral values and encourage them.
Some teachers also said that they somehow pacify and tempt children into paying attention
(“bahala-phusla ke padhate hain”). As can be gleaned from a few other responses, teachers
have stages of dealing with children’s behaviour. For instance, one teacher says, “first I try and
make them understand by saying some good words; if they do not settle down, I give them
some free time to play. After this if they don't behave then I consider beating them”.
Teachers seem to use a scale of discipline – if they can’t get children to cooperate, they
consider shouting at them / scolding them. Many teachers clarified that they scold mildly, only
when the need arises; sometimes they make the child stand in her place. One teacher from
Begusarai said, “I scold them mildly – I tell the class monitor to write down the names of the
undisciplined children. Then give these children some questions to do and scold them if they
are not able to do them”. If scolding does not work, teachers said they may threaten them that
they will cut off their names / will call their parents. If threatening doesn’t work, they consider
beating them.
Table 5.3 Methods Used to Discipline Students as Reported by Teachers in Government Schools
in Bihar
(per cent)
Proportion of teachers who said they use the
following measures to control/ discipline
students
Class 3 Class 7 All
Shout at them 37 30.4 34.5
Threaten them 16.3 10.7 14.2
Beat them/Hit them 5.4 1.8 4.1
Others (Persuade them to be cooperative /
motivate them)
84.8 80.4 83.1
Based on interviews with class 3 and class 7 teachers in sample schools
Source: CORD Survey 2011-12

84
Observed: Only a low proportion of teachers reported that they threaten or beat the children.
This was quite different from what was observed by the team, during their observations over
the course of one period in class 3 and class 7. Despite the team being present, there were
some teachers who were found reprimanding children abusively or even physically
punishing/beating them. It is likely that on a normal day the situation is worse.
Table 5.4 Methods Used to Discipline Students as Observed in Government Schools in Bihar
(per cent)
Proportion of teachers observed to use the
following methods to discipline students:
Class 3 Class 7
Teacher corrects non-abusively 70.0 85.4
Reprimands abusively 11.3 8.3
Physical forms like kneeling / holding ear / murga 0 0
Beating/caning students 6.3 4.2
Options are not mutually exclusive.
Based on survey of sample schools
Source: CORD Survey 2011-12
Notably there is not much difference in the reasons for disciplining children mildly or strongly.
In both cases it is mostly when children either do not understand or are making a noise or
creating trouble in some way or just not paying attention. At most it looks like teachers beat the
child if he/she continues to do something repeatedly even when asked to stop.
Fewer number of class 7 teachers were found resorting to beating or other types of physical
punishment as methods of dealing with indiscipline. Only 4 such cases were observed. 4
teachers were found to be abusing children verbally. This was not only when students were
making a noise but even if the child was unable to answer. A teacher in Nawada for instance,
slapped a student because he could not answer a question in a Sanskrit class. In most other
cases teachers would only reprimand mildly or explain gently if a child was undisciplined or was
not understanding/unable to answer something or was not paying attention.
In general, teachers say they teach with love, though according to one teacher this was the
“official version”. Attempting to change methods of disciplining children to improve learning /
improve attendance requires teachers to be convinced of the rationale and receive training on
how to do it differently.
5.5 Assessment: Comprehensive and Continuous Evaluation
All schools reported that they conduct examinations. These may be quarterly, half yearly or
annual exams. Different teachers gave different time periods. Final exams are held in March but
half yearly tests were reported mostly in September or December and in few other cases in
August, October and November. A good number of teachers also said the schools conduct
quarterly exams. They are held in July or August, then between September-December and then
in March. 68.5% of class 3 teachers and 76.8% of class 7 teachers reported giving unit tests,

85
either written or oral. These vary from written tests once or twice a month to questions given
on the blackboard to oral tests. One teacher said they conduct General Knowledge
competitions every month and give out prizes. Other teachers reported conducting weekly
tests, either oral or written, daily assessments in the last ten minutes of the class or conducting
tests after a particular topic is completed. What must be kept in mind is that orders to
implement CCE and make pupil cumulative records had not been issued to district level officials
yet. Such orders were released on 12th
March 2012(8/V-3-27/2012), when the fieldwork was
over. However as the Act was already applicable it is possible teachers had heard about CCE,
and a small proportion of Class 3 and Class 7 teachers did report that they were doing CCE.
Table 5.6 Assessment of Children’s Progress by Teachers in Government Schools in Bihar
(per cent)
Proportion of teachers who take the following
assessments into account to assess the
children’s overall progress
Class 3 Class 7 All
Examinations (half yearly/final) and quarterly 98.9 98.2 99.3
Unit tests – written or oral – monthly, weekly,
daily 68.5 76.8 72.1
Continuous and Comprehensive Evaluation
CCE – tests and other methods 23.9 30.4 26.5
Based on interviews with class 3 and class 7 teachers in sample schools
Source: Cord Survey 2011-12
However, it can safely be assumed that a large number of teachers aren’t fully informed about
CCE. In addition to this, in many instances, frequent oral or written tests may also be
considered as a part of CCE. Most teachers said that they take monthly or daily tests. However
a few have also given other methods. “I ask questions based on daily teaching. If they don’t
understand then try and explain again”, says one teacher in Sitamarhi, “do everyday while
teaching”, “do it throughout the child’s time in school”, “do CCE after teaching every topic”,
“after teaching 2-3 lessons ask them oral questions about it”, “call children in a group with their
copies”, “teach and evaluate”, “at any point I can teach a topic and ask questions” were some
such answers.
Table 5.7 Maintenance of Pupil Files in Government Schools in Bihar
Number of teachers who Class 3
teachers
Class 7
Teachers
Class 3/Class
7 teachers
Maintain a file to record the performance of each
pupil 2 7 9
Show the pupil file to the parents 2 3 5
Have received any government order about
maintenance of Pupil Files 9 13 22
Based on interviews with class 3 and class 7 teachers in sample schools
Source: Cord Survey 2011-12

86
The State Rules for RTE in Bihar state in section 18(1) that a ‘chhatra sanchayee abhilekh’ is to
be maintained, in pursuance of section 29(2)(h) of the Act that requires ‘continuous and
comprehensive evaluation of child’s understanding of knowledge and his or her ability to apply
the same’. A small minority of class 3 and class 7 teachers reported that they keep Pupil Files.
While some teachers did report that they had received government orders to maintain such a
file, not many adhered to it.
5.6 Some problems expressed by teachers about implementing RTE guidelines
A number of teachers expressed difficultly in teaching through activity, discovery and
exploration. Different types of problems were brought up. One said, “Children in small classes
do not understand all this, so I do not do it”; another said, “Activities waste the time of children
in bigger classes, so I do very few.” Another issue brought out by a teacher in Nawada was that
“too much use of activities bores children and some of them get involved in playing itself”. The
need to expose teachers to activities for all ages and to do so with the sort of time constraints
they have, emerges from these answers. The fact that few activities that encourage higher
order critical thinking were reported shows that teachers may be at a loss on how to teach
upper primary school children through activity, discovery and exploration that is appropriate to
their age and their syllabus.
The few teachers who say they scold or beat the children say they do it very ‘mildly’. Teachers
complained that they have trouble managing naughty children during sports activities. Having
to teach children without beating or scolding them they found tough. These tools were used by
their teachers to instill fear into children and motivate them to behave. Teachers reported that
they abide by the new notifications, but they do not agree with them. The cane was not seen to
be used a lot, but it was visible.
SECTION 6. ACCOUNTABILITY IN THE SCHOOL SYSTEM
The Act envisages a system of decentralized planning, a process in which head teachers and a
parent based education committee will play a major role. The Act also envisages a role for a
member of the local body to play a role in monitoring school attendance of all children (under
the age of 14 years) in the village, to ensure that none are out of school and that those who are
in school attend regularly. In this section, we focus on the role of the head-teachers and the
SMCs. The sarpanch as representatives of the locally elected bodies were reportedly not active
in keeping records of all the children in the village and ensuring that they were in school.
6.1 Role of head teachers
We asked heads what they do in cases where teachers default on any matter. A high proportion
of them reported that they simply speak with the teachers concerned. A small proportion
choose to complain to higher authorities. Hardly any head teachers reported that they take
disciplinary action under service rules. The SMCs also appear to play no role.
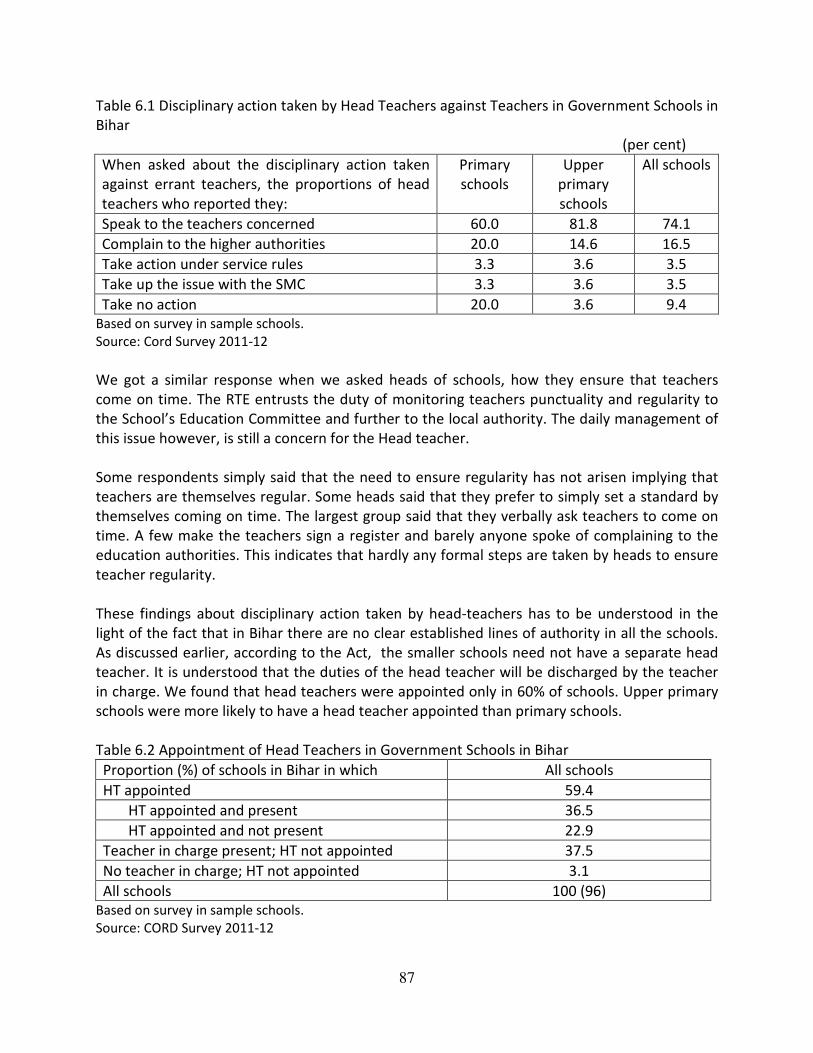
87
Table 6.1 Disciplinary action taken by Head Teachers against Teachers in Government Schools in
Bihar
(per cent)
When asked about the disciplinary action taken
against errant teachers, the proportions of head
teachers who reported they:
Primary
schools
Upper
primary
schools
All schools
Speak to the teachers concerned 60.0 81.8 74.1
Complain to the higher authorities 20.0 14.6 16.5
Take action under service rules 3.3 3.6 3.5
Take up the issue with the SMC 3.3 3.6 3.5
Take no action 20.0 3.6 9.4
Based on survey in sample schools.
Source: Cord Survey 2011-12
We got a similar response when we asked heads of schools, how they ensure that teachers
come on time. The RTE entrusts the duty of monitoring teachers punctuality and regularity to
the School’s Education Committee and further to the local authority. The daily management of
this issue however, is still a concern for the Head teacher.
Some respondents simply said that the need to ensure regularity has not arisen implying that
teachers are themselves regular. Some heads said that they prefer to simply set a standard by
themselves coming on time. The largest group said that they verbally ask teachers to come on
time. A few make the teachers sign a register and barely anyone spoke of complaining to the
education authorities. This indicates that hardly any formal steps are taken by heads to ensure
teacher regularity.
These findings about disciplinary action taken by head-teachers has to be understood in the
light of the fact that in Bihar there are no clear established lines of authority in all the schools.
As discussed earlier, according to the Act, the smaller schools need not have a separate head
teacher. It is understood that the duties of the head teacher will be discharged by the teacher
in charge. We found that head teachers were appointed only in 60% of schools. Upper primary
schools were more likely to have a head teacher appointed than primary schools.
Table 6.2 Appointment of Head Teachers in Government Schools in Bihar
Proportion (%) of schools in Bihar in which All schools
HT appointed 59.4
HT appointed and present 36.5
HT appointed and not present 22.9
Teacher in charge present; HT not appointed 37.5
No teacher in charge; HT not appointed 3.1
All schools 100 (96)
Based on survey in sample schools.
Source: CORD Survey 2011-12

88
In several schools, there was no head-teachers post, and in several it was lying vacant. Even
among the schools where head teachers were appointed, the team was unable to meet the
head teachers in these schools as in 23% of the sample schools, the appointed head teacher
was not present in school. The HT was reported to be absent for various reasons – on leave, on
school related duty and a few other cases. In 2 cases the heads had gone for ‘counsel’ -- their
post/salary was being revised. One head teacher had handed over the work to someone else as
he does not keep well, another had been on medical leave for a year. In yet another, the head
had been suspended. In a few schools there was neither a head teacher nor a teacher in charge.
6.2 Role of Education Committee (Tadarth Shiksha Samiti)
The RTE Act requires the setting up School Management Committees – Chapter IV, Section 21.
The SMC shall perform the following functions: monitor the working of the school; prepare and
recommend school development plan; and monitor the utilization of the grants received from
the appropriate Government or the local authority or any other source.
According to the Bihar Elementary School Education Committee Act, 2011, an ad hoc
committee (Tadarth Shiksha Samiti) for each primary and middle school consisting of 6-7
members shall be constituted. These would include parents, the elected ward member of the
Gram Panchayat/ Nagar Nikay, as well as the Head Teacher/ Head Master of the school. Such a
Committee shall remain in existence till a committee is constituted in keeping with RTE
guidelines and rules.
This TSS is to perform the following functions: it shall ensure the presence of teachers on time;
it shall monitor construction of school building and supply of midday meals and carry out all
necessary activities for implementation of provisions of RTE 2009; it shall ensure compliance of
orders / directions given by the Government from time to time. Being an ad-hoc committee, it
is not vested with many powers and functions. This Committee is to meet every month with at
least 4 members present. It is also a temporary committee till a Vidhyalaya Shiksha Samiti is put
in place. The Bihar Elementary School Education Committee Act, 2011 states that eventually, a
VSS shall be constituted, in keeping with the Bihar State Rules.53
The Bihar Government has issued no notification for the setting up of new Vidhyalaya Shiksha
Samitis which appear to be the Bihar Government’s name for the SMCs required to be set up
under the RTE Act. It has simply passed an Act which requires an ad-hoc committee to perform
a few functions till the time VSS members are elected. These committees were found to be
formed in 2011. When Head teachers in sample schools were asked about the education
53
The VSS shall be constituted of 14 members, out of which 12 shall be elected among parents and 2 shall be ex-
officio. The functions of this Committee are as laid down in the State Rules. They are as follows: to ensure
enrolment of all students between ages 6-14 from the catchment area; to ensure and monitor the regularity of
teachers; supervision of school construction and mid day meals; to bear in mind that teachers are not enrolled in
any non-educational activities; the School Development Plan is to be prepared 2 months before the opening of the
new academic session under the direction of the Block Education Officer; the Committee may be given more duties
from time to time if the need so arises.

89
committees in their school, only in 74% cases was a Tadarth Shiksha Samiti found to be formed.
In more than 13% of cases the earlier VSS was found to be continuing, and in the remaining
cases no education committee existed but according to the head teacher in some of these
schools the TSS was in the process of being formed.
Table 6.3 Setting up of Education Committees in Government Schools in Bihar
(per cent)
Proportion of schools where All schools
SMC was formed 0.0
Tadarth committee was formed 74.0
VSS/ VEC was still there 13.5
No committee/no response 12.5
Total 100.0
Based on survey in sample schools.
Source: CORD Survey 2011-12
Members of 71 committees could be interviewed, but not all could respond to the questions.
The following discussions are based on these interviews. As mentioned earlier, the composition
of these committees is very different from what the RTE mandates. The number of members
varied from 3 to 7, and one or two members were non-parents, and the rest were parent
members. Nearly all had at least 50% women.
Though the respondents were largely the President or the Secretary of the committee, they had
very limited information about it. In most cases the committees were formed only on paper.
Several of them did not know the number of members in the committee and asked the head
teacher about it. In 9 to 10 cases the respondent said they did not know about their
responsibilities and merely signed in registers when asked to. In some cases the respondents
were not aware when they had been made a member or even an office bearer of the
committee. A few of them who had also been members of the earlier education committee,
said there were no differences in the meetings and activities of these committees.
One of the functions that the ad-hoc committee is required to do is monitor teacher regularity
and punctuality. Less than a third reported that they do so and largely through informal
methods (Table 6.4). The study was looking to see what formal systems might be put in place to
enable this to happen in an effective manner.
The ad-hoc committee was not functioning as part of a mechanism for redressal of grievances.
Since it doesn’t have many powers or responsibilities, it is not surprising that 81% reported that
they have not received any complaints from parents or children. However, 11% did say that
they have received complaints regarding schools not giving uniforms/ textbooks/ writing
material to the child.

90
An important function is to ensure the enrolment of all children between ages 6-14 from the
catchment area. While in nearly 31% of cases they said the village still has children in the 6 to
14 age group out of school, in only around 18% of the committees did they say that that they
motivate parents of never enrolled children to get them enrolled.
The committees are also to promote the regularity of already enrolled students. However, only
22% said they do so (Table 6.4). The little attention paid to monitoring student attendance is in
keeping with the poor attendance that was observed in the Bihar schools.
In very few schools were the respondents involved in monitoring school expenditure or in
developing School Development Plans – 19%. However most of these committees were not set
up to do this.
Table 6.4 Functioning of Education Committees in Government Schools in Bihar
Proportion of Education Committee members who said that they per cent
have received a government document defining roles and responsibilities 16.2
Have met once a month 39.0
Monitor provision of infrastructure, equipment, MDM and textbooks 50.0
Informally monitor teacher regularity and punctuality 32.4
Informally monitor children’s attendance 22.1
Ensure admission of out of school children and CWSN 17.6
Monitor school expenditure 19.1
Are involved in developing SDPs 19.1
Options are not mutually exclusive.
Based on interviews with members of Education Committees
Source: CORD Survey 2011-12
When head teachers were asked whether SMCs support their work in any way, the responses
were relatively positive – only around one-third said they did not (Table 6.5). The largest
proportion (72%) said that SMCs have supported them by providing infrastructure and
equipment. A significant portion (70%) said that they help in ensuring children’s regularity, and
38% said that the SMC support them when parents do not cooperate. HTs clearly see them as
the group which liases between them and the village community including other parents and
children.

91
Table 6.5 Support received from Education Committees as reported by Head Teachers in
Government Schools in Bihar
When asked of the ways in which the SMCs/TSS support their work,
proportion of head teachers54
who said
per cent
Does not support in any way 32.9
Receive support from SMCs in the following way:
Provision of infrastructure and equipment 71.9
Ensures children’s regularity 70.2
Support in the case of non-cooperation by any parent 38.6
Responses are not mutually exclusive.
Based on survey in sample schools.
Source: CORD Survey 2011-12
When asked about the ways in which the SMCs help monitor the school functioning, 40% of HTs
said that the SMCs do not monitor the school in any way. Among the rest most of them (78%)
said that the SMC members note the regularity and punctuality of teachers. A similar
proportion said that the SMC members help monitor the distribution of entitlements like
textbooks.
Table 6.6 Monitoring by Education Committees as Reported by Head Teachers in Government
Schools in Bihar
When asked of the ways in which the SMC / TSS monitors school
functioning, proportion of head teachers who said
per cent
Does not monitor in any way 40.0
Monitors in the following way
Notes denial of admission 21.6
Ensures that there is no discrimination in the school (against CWD / SC / ST
/ BPL) 17.6
Ensures that no child faces mental harassment or corporal punishment in
the school 15.7
Responses are not mutually exclusive.
Based on survey in sample schools.
Source: CORD Survey 2011-12
Summing up the findings on education committees in Bihar, we note that SMCS were not
formed in any school but most had the Tadarth Shikhsha Samiti. Its composition is largely as
given in the Act passed by the state government. Most TSS members interviewed indicated that
they had not much information about their roles and responsibilities, they signed when they
54
Includes respondents who were not head-teachers, in schools where head-teachers were absent or not
appointed.

92
were asked to do so. The committee was largely run by the HT. According to the interviews
with the head-teacher and the members of the TSS, their role is most important in providing
infrastructure and distribution of entitlements.
More than two thirds of the head teachers said that the education committees support them in
their work and 60% said they do some monitoring. According to them the role of the education
committees was highest in provision of infrastructure and distribution of entitlements.
Monitoring student and teacher attendance is also an important role. Given the high student
and teacher absenteeism, and the comments made by the respondent, it is clear that these
Committees were doing little in this area. SMC involvement was very low in monitoring school
expenditures and in formulation of the School Development Plan (SDP). There was also very
little involvement in identifying out of school children and bringing them back to school.
6.3 Maintenance of records
Registers are required to maintain records of activities which can be used internally and
externally to monitor performance. Schools were asked whether they maintained registers on a
range of activities. Most schools had registers on a range of information. Fewer schools had
information on parent meetings. A complaints register was available in 10% of schools.
Table 6.7 Registers Maintained in Government Schools in Bihar
(per cent)
Proportion of schools which
maintain
Primary schools Upper primary schools All schools
Teacher attendance register 100.0 100.0 100.0
Admission register 100.0 96.7 97.9
Student attendance register 100.0 100.0 100.0
Incentive register 97.0 91.8 93.6
Mid day meal register 97.0 96.7 96.8
Fund register 69.7 68.9 69.1
SMC meeting register 60.6 68.9 66.0
Parent meeting register 24.2 31.1 28.7
Complaint register 9.1 9.8 9.6
Based on survey in sample schools.
Source: CORD Survey 2011-12

93
SECTION 7. CONCLUSION
The context in Bihar within which RTE has to be implemented is very challenging. It is densely
populated and much of it is flood prone, which has implications for the cost of providing
adequate infrastructure and facilities in schools. The state has substantial proportions of
disadvantaged groups with very low literacy levels. According to the 2001 Census,55
Muslims
formed 16.5% and Scheduled Castes 15.7% of the State’s population, and the literacy rates
were as low as 36% and 28.5% for Muslims and SCs, respectively.56
The literacy rate for the
state as a whole in 2001 was 47%. The gaps between the literacy rates among disadvantaged
groups and the average for the State as a whole were enormous: 11% for Muslims and 19% for
SCs. By 2011, the literacy rate for the state as a whole had risen dramatically to 64%, and it is
likely that literacy rates among disadvantaged groups have also risen substantially.
Nevertheless it is clear that ensuring that all children are able to access their right to
elementary education is a formidable task.
7.1 Only limited progress on the road towards RTE
The state has made some progress on the road towards RTE. Draft Rules have been notified and
government orders issued on a number of aspects.
There have been sustained efforts to make education “free” in the sense of providing cash
towards purchase of uniforms and stationery, and textbooks for all students enrolled in primary
and upper primary grades. However, efforts to provide “free education” did not go beyond this.
The study found that there was no mention in any school of transport costs being covered for
any child, except for equipment given to some children with disability. Also that there was no
mention of any requirement on the school or the SMC or the panchayat to find out which
children were attending irregularly or not at all, and to ensure that if there was some financial
barrier to their coming to school, that it would be noted and action taken.
No large scale trainings on RTE have been organized, and no detailed materials have been
prepared for teachers to increase their understanding of the Act. As a result, teachers tended to
be uncertain about most of the Act’s specifications. This was reflected in the fact that only small
proportions of schools reported that they were admitting children without documents of proof
of age / admitting children for an extended period as determined by the state / not retaining
children in the same class at the end of the year on any count, all provisions of the RTE Act.
Admitting children to the age-appropriate class and running Special Classes for them so they
can catch up with the rest of the class did not appear to be happening. While a few schools
reported that they were doing this, they were unable to provide any details on where these
classes were held and when. Enabling the running of Special Classes will require a new system
to be set in place, in which teachers and physical space and an appropriate curriculum will have
55
2011 figures for literacy of specific social groups is not available. 56
The all-India literacy rate among SCs was 55% in 2001.

94
to be assigned just for this task. This is particularly important for Bihar as it is reported to have
lakhs of children out of school who will need to be mainstreamed into their age-appropriate
class.
Similarly, changing the system of assessing children also requires a major investment.
Supplementing or replacing the earlier system of tests and annual examinations by a new
system which requires the teacher to evaluate the child’s performance on a regular basis and
maintain detailed records for each individual child is an enormous change which can happen
only with considerable guidance and monitoring.
Certain provisions appear to be less difficult to put into practice – not using corporal
punishment to control children; not cutting off children’s names if they are irregular or do not
clear the annual examinations. However, they take away tools used by the teacher to make the
system function, tools which were used by their teachers to instill fear into children and
motivate them to behave. Teachers reported that they abide by the new notifications, but they
do not agree with them. The cane was not seen to be used a lot, but it was visible. Teachers say
they teach with love, though according to one teacher this was the “official version”.
Attempting to change methods of disciplining children to improve learning / improve
attendance requires teachers to be convinced of the rationale and receive training on how to
do it differently.
Teachers were conscious of the rights of disabled children to be in school. However, providing
meaningful services to children with disability has been a problem prior to the RTE Act, and
continues to be so now. While disabled children were being enrolled, and schools were being
provided with ramps, the numbers of disabled children seen in school were much less than
those enrolled, and the proportion of schools with at least one teacher with training on
disability was low.
• Access and quality of schools remains an issue
The schooling system in Bihar is more of a common schooling system. The Bihar government
has not encouraged the growth of private schools by easing norms for recognition. The sample
villages had only 11 private schools, all but one of which were reported to be unrecognized.
Instead there are indications that children depend on a system of private tuition in large
groups, somewhat similar to unrecognized private schools.
The government has set up a large number of primary schools in the last decade and upgraded
a large number of primary schools to upper primary schools, apparently without sufficient
investment in infrastructure and facilities. The high enrolment in the upper primary schools
relative to the provision of teachers and classrooms indicates that the supply of schooling
needs to be urgently expanded. Enrolment is extremely high both for primary and upper
primary grades, indicating that expansion is needed for both stages of schooling. The shortfall
of classrooms and other facilities in the primary schools is also acute. The student classroom
ratio was as high as 81 and 99 in the primary and upper primary schools. More classrooms were
seen to be in the process of being constructed in both the primary and upper primary schools.

95
While there has been significant improvement in the availability of drinking water and a kitchen
shed to cook the midday meal, there was variable access to other facilities such as separate
toilets for boys and girls, a functioning boundary wall, a playground, games and sports
equipment, a library, and teaching learning materials.
• Need for more teachers and more trained teachers
The government has been concentrating on reducing the huge gaps in provision of teachers. In
spite of the huge shortage of teachers still apparent, the government was reported to have
recruited a large number of teachers so as to reduce the high PTRs. One of the challenges facing
the Bihar government is the need to appoint teachers who have to clear a teacher eligibility
test. In spite of criticism that the Bihar TET has been set very low, only a small proportion of
applicants were reported to have cleared it.
The study found an enormous shortage of teachers. Four fifths of primary schools and an even
higher proportion of upper primary schools did not have the PTRs required by RTE. The very
high PTRs means both teachers and children have to function in very difficult conditions.
Bihar has chosen to lean heavily on a teacher cadre, who were largely recruited locally, at very
low salaries. A very high proportion (75%) of teachers in the study were panchayat appointees.
The majority of all teachers had passed Class 12 at most. About one third did not have any
professional teacher training. Most locally appointed teachers interviewed in the study
reported that they were getting upto Rs 8,000 a month. Teachers recruited earlier were being
paid more than Rs 20,000 a month. Reducing the salary scales of teachers has implications for
the type of individuals who might be willing to join the teaching profession, lower the incentive
for them to stay in the profession, and perhaps reduce their motivation to perform to their full
potential.
It is important to ensure that teachers have the opportunity to be professionally trained. It is
also important that teachers who teach upper primary grades in the composite upper primary
schools are graduates as required by the NCTE.
• Implications for equity
The government schools that children are able to access at both primary and upper primary
levels have severe teacher and infrastructural shortages as described above. The situation is
also poor with regard to access to pre-school education. The functioning of the schools in terms
of presence of teachers and children, as we discuss below, also leaves much to be desired.
Children on the margin, who may have parents who have never been to school, are most likely
to suffer in such a situation as they will need special attention to feel included in classroom
transactions, and are also most likely to be among those at the back of the class or outside the
class, interacting relatively little with the teacher. Such children are also vulnerable to be
irregular on a day to day basis because schooling is not a norm in their homes, and because of

96
possible work pressures on them in a family struggling to make both ends meet. Government
schools are playing a critical role in drawing all children into school. It must invest in giving
children schools which will actually provide them with an education.
• Too little accountability in the government system
The study found schools closed unexpectedly because of extreme weather conditions. The
study also found that while teachers were largely in school, there were indications that they
came late and left early. The most troubling finding was that large proportions of children were
not in school. Attendance rates even in the register were extremely low (48%). Observed
attendance rates were even lower (41%). Attendance rates observed post the midday meal
were still lower (34%).
Numerous stakeholders are supposed to be involved in monitoring teacher and student
attendance. In particular, SMCs as envisaged in the RTE Act have this role. Head teachers also
share in this role as part of the SMCs. All teachers are required to be punctual and work as
much as 45 hours a week (at school and in preparation at home).
The SMCs in Bihar at the time of the survey in 2011-12 were ad hoc committees, formed with
very limited scope. They were to function till elections to the SMCs could be held after a year.
These ad hoc committees or Tadarth Shiksha Samitis had primarily to look after school
construction, midday meals, and other schemes such as provision of uniforms, textbooks and
scholarships. Its monitoring role was extremely limited.
The study also indicates that there was no clear line of accountability in Bihar’s schools. In a
sample of 96 schools surveyed in detail, head teachers were not appointed in 41% of schools
and absent in a further 23% of schools. Head teachers also reported that they play a limited
supervisory role in monitoring the attendance of other teachers.
The local bodies were not keeping any records of children in the village whether they were in
school or out of school. They were also not part of the education committees.
7.2 Suggestions to strengthen the school system
RTE Act requires schools to change their way of functioning. All children must be enabled to
access their right to education. Village leaders are to be involved in actively identifying out of
school children. Teachers and SMCs are to ensure that all children are enrolled and given the
opportunity to complete 8 years of education.
• Invest in infrastructure and facilities

97
There are a few positives but overall the gaps in infrastructure and facilities are acute. There is
an urgent need to invest in every aspect of infrastructure and facilities specified under the
norms for a school by the RTE Act. This requires a major investment.
• Recruit more teachers and those most suitable for the job
More teachers need to be recruited. Teachers recruited need to have the qualifications and
training specified by the NCTE. This is an enormous challenge for the state.
Raising salary scales of teachers will attract more qualified candidates and retain them.
Recruiting teachers at a very low rate gives them the message that their work is considered
unimportant, and that the system places no value on trying to retain them.
There is a need to increase transparency in system of recruitment of teachers at local level. The
team was told that while a merit list is used to shortlist candidates at district and block level,
the final list of teachers who are appointed is done at village level and depends on the
candidate’s connections with the sarpanch and / or their willingness to pay the selection
committee. Such an arrangement which is not based on choosing the candidate most suitable
for the job of teaching young children and disregards the equal rights of all teachers to be
selected, strikes directly at undermining the accountability of newly recruited teachers to their
work.
• Build capacity of all stakeholders to understand the RTE Act better and their role in
implementing it
The RTE Act suggests roles for various stakeholders. Fulfilling these roles is beyond the capacity
of most unless there is sustained effort in building that capacity in the persons involved, both
within and outside the education department. All stakeholders need to understand the RTE Act
better and their role in implementing it (head-teacher and teachers, SMC, sarpanch).
Children are required to experience non discriminatory behaviour. It is important that head-
teachers, teachers and SMC members learn more about the rationale of having a rights based
approach in dealing with all children. At present, there are negative feelings among the middle
castes against those from lower castes because of reservations for them in government
employment.
It is also extremely difficult for teachers to transact curriculum as required by RTE in the sense
of building the capacity of a child as envisioned by the RTE Act. Teachers need to learn and
experience these concepts before they can implement them.
The SMC and head-teacher and teachers all need to play a role in monitoring teacher
attendance, children’s attendance and school functioning in general. The sarpanch is required
to take note of any child who is out of school. It is important to put in place a system of records
to ensure that RTE will be implemented.
98
PART B. UTTAR PRADESH
SECTION 1. INTRODUCTION
1.1 Background
The state of Uttar Pradesh is a culturally and socially diverse state with many communities.
According to the 2001 Census, 80.6 %of the State population was Hindu. Muslims formed 18.5
% of the population. The remaining 0.9 % of the population consisted of other religious
minorities like Sikhs, Buddhists, Jains and Christians. Scheduled Castes formed 21.2% of the
State’s population. There are 66 Scheduled Castes in the State; the prominent ones being
Chamar, Kori, Dhobi and Balmiki. The proportion of Scheduled Tribes residing in the State is
negligible at 0.01%. There are only five ST groups in the State.
Uttar Pradesh is the most populous State in India (199.9 million, Census 2011). It covers a land
area of 240,928 sq km. Scholars have argued that because of its historical importance and sheer
size, Uttar Pradesh has always been a key state within the Indian union. The languages of state
administration are Hindi, established by the Uttar Pradesh Official Language Act, 1951,
and Urdu,57
established by the Amendment to the same in 1989.
Uttar Pradesh continues to be one of India’s most economically backward states with a high
rate of illiteracy, more so among females especially in the rural areas. In 1981, the literacy rate
in UP was 28% and it increased to 42% in 1991 (male literacy was 56% and female literacy 25%).
By 2001 it had risen to 56.3% after which it rose to 69.7% in 2011. The gap in literacy levels
between urban and rural areas has been declining. It was 17.9% in 2001 and 9.5% in 2011. With
regard to SCs, the 200158
literacy rate in U.P. was 46.3% with 30.5% literacy among women.
Literacy rate among STs in 2001 was 35.1% with 20.7% literacy among ST women. Muslims have
the lowest literacy rate among the religious minorities, that is, 47.79% in 2001. Within the
Muslim community, the female literacy rate (37.4%) is very much lower than the male literacy
rate (57.3%).
Agriculture is the main source of employment in U.P. However, weather restricts year round
cultivation, resulting in fewer days of work, compared to farmers in Punjab and Haryana. The
magnitude of both drought prone and flood prone areas in the state is highest among all major
57
According to Ather Farouqui, “Urdu is taught in some schools as an optional subject either from sixth class
onwards or, in certain schools from first to 10th class. There is a provision for teaching Urdu as an optional subject
from sixth to eighth class at a few places in UP. There are some schools where Urdu, besides being taught as
optional subject from 1st to 10th class, is also the medium of instruction. In some schools, the regional language is
also taught as an optional subject from third or fourth class onwards.”(Farouqui, 1994). He goes on to say that
even in Urdu medium schools, subjects like science and math are generally taught either in English or in the
regional language, sometimes even in Hindi. “The main reason for this is lack of adequate scientific vocabulary in
Urdu. Urdu is the medium of instruction only for social science subjects, like history and geography, etc.”(op. cit.) 58
Caste wise literacy data is not available from the 2011 Census.
99
states. There is mostly outmigration from the state. According to the 2001 Census, total
migrant inflow to U.P. was 1.8% while total outmigration was 6.1%. Nearly 80% of the
population in U.P. continues to live in rural areas. There has been a shift of only 1% in the
population from rural to urban areas in the State over the decade (1990-2000). The pace of
urbanization has been extremely slow.
Strong gender disparities exist in the state. The NFHS III survey finds that in U.P. 53% of the
respondent women between the ages of 20-24 were married by the age of 18. Employment
opportunities seem to be much lower for women in U.P., which restricts their economic
empowerment. As per 2001 Census, work participation rate was very low for females at 16.5 %
as compared to 46.8 % for males. Only 19.0 % of rural women and 6.8 % of urban women in
U.P. were found to be economically active.
With the aim of providing education to all till the age of 14, a World Bank assisted project called
Basic Education Project was undertaken in 1993. The goal was universal enrollment in and
completion of basic education and improvement of its quality. It consisted of three
components: building institutional capacity, improving quality of education and improving
access to basic education. The project covered 17 districts. The project was completed in 2000.
The District Primary Education Programme-II was started in 1997 in 22 districts of the state and
ended in 2003. DPEP-III was started in 32 districts of the state in 2000 and ended on 31 March,
2006.
According to a World Bank report (2002), UP spends as little as 1.8% of its GSDP (Gross State
Domestic Product) on elementary education. Enrolment is lowest among SCs and Muslims
compared to other social groups, while children belonging to high caste groups enjoy nearly
universal access to education. On the other hand, and quite surprisingly, UP is said to have one
of the highest rates of enrolment in private schools - one-fourth of all rural students and 70% of
their urban counterparts. In this way, it is quite different from Bihar.
Teachers enjoy a privileged position in politics, in that they are guaranteed representation in
the Upper House of the state legislatures, granted by the Constitution of India. Furthermore, as
opposed to other professions, teachers are regarded as holding an office of no profit, allowing
them to contest elections for local bodies as well as representation in both Houses of the State.
They “do so on a very large scale and thus politicize the entire educational environment.”
(Kingdon and Muzammil, 2008). Teachers have continually been an integral part of the State
machinery and continue to wield considerable power. Politicians are reluctant to bring reforms
that would enable accountability of teachers for fear of upsetting their support base. “Teacher
and non-teacher politicians use their considerable influence and ministerial connections etc. to
shelter erring teachers or otherwise help teachers, in order to be seen as friends by the
influential teacher voter bloc.” (Kingdon and Muzammil, 2010)

100
1.2 Notifications by Government of UP related to RTE
The Government of UP formulated the State Rules for Implementation of RTE on 27 July 2011.
The Rules clearly mention that they will remain in force on condition of funds being made
available by the central government.
A series of provisions had been issued before the Draft was approved. With reference to
Section 16, Chapter IV of the RTE Act, the Uttar Pradesh government had as early as on 16th
January, 2010 sent a notification for prohibiting the retention and expulsion of students as well
as the no Board level examination up to the elementary level. The no capitation fee or
screening procedure for admission in private schools was notified on 15th
July 2010, and on 19th
August 2010 the prohibition of corporal punishment and mental harassment was notified.
Concerning the infrastructure and facilities in schools, the setting up of libraries was approved
for the academic year 2010-11. Close to fifty thousand additional classrooms were under
construction during the year 2011-12 and boundary walls provided in 19,600 schools, with
remaining requirements for both classroom and boundary walls to be included in the next
Annual Work Plan.
The formation of SMCs was notified on 28th
June 2011, with the first orientation of the
members to be held in November 2011. The U.P. State Rules mandates that the Committee
shall meet once a month and make the records public. It is also stated that SMCs shall be
constituted in all schools, and 11 out of 15 members shall be parents from SC, ST, OBC, and
other weaker sections. The remaining members will be the Head teacher, one Lekhpal
nominated by the District Magistrate, one member from the ANM cadre to be nominated by
the teachers of the school, and one local authority member. The chair person shall be elected
from parent members. Besides the functions mentioned in the RTE Act, the Uttar Pradesh State
Rules provide the SMC with a mandate which includes: ensuring regularity of teachers and
punctuality in attending school, holding regular meetings; ensuring enrolment and continued
attendance of all children from neighborhood area; monitor the identification, enrolment and
facilities for disabled children; prepare and implement a plan for special training for children
not admitted to school for his/her appropriate age learning level.
The government of Uttar Pradesh on 27th
July 2011 banned the giving of private tuition classes
by government school teachers, and specified the minimum number of working days and
instructional hours for a school. In particular, on 26th
April 2012 there was a notification which
specified that for the primary and upper primary levels, the instructional hours in summer shall
be from 7 a.m. till noon, with a break from 9.30 am to10 am; whereas in winter, school shall be
from 10 a.m. till 4 a.m., with a break between 1 pm and 1.30 p.m.
Other notifications include the construction of separate toilets for boys and girls, as notified on
11th
April 2012. The U.P. State Rules for RTE permits the construction of a new school in the
neighborhood at a distance of more than 1 km for classes I-V and with a minimum population
of 300, and a distance of more than 3 km for classes VI – VIII and with a minimum population of
800. In 2011-12 about 10,366 new primary schools have been approved in the eligible unserved
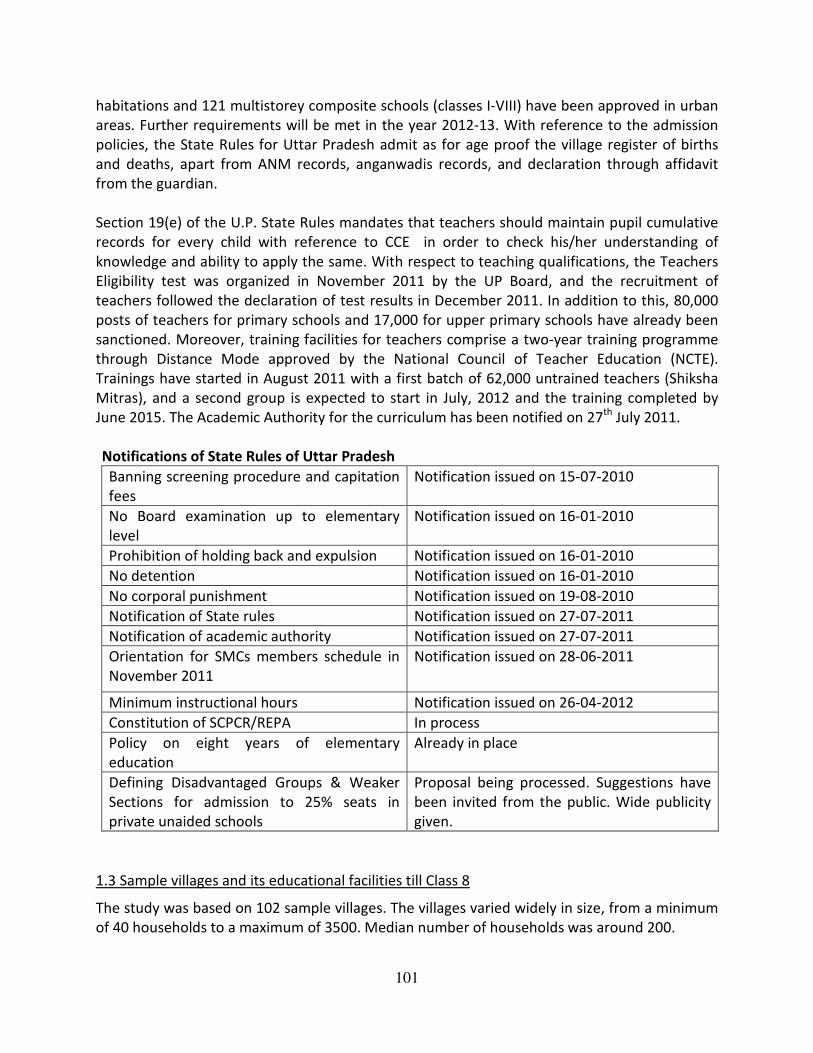
101
habitations and 121 multistorey composite schools (classes I-VIII) have been approved in urban
areas. Further requirements will be met in the year 2012-13. With reference to the admission
policies, the State Rules for Uttar Pradesh admit as for age proof the village register of births
and deaths, apart from ANM records, anganwadis records, and declaration through affidavit
from the guardian.
Section 19(e) of the U.P. State Rules mandates that teachers should maintain pupil cumulative
records for every child with reference to CCE in order to check his/her understanding of
knowledge and ability to apply the same. With respect to teaching qualifications, the Teachers
Eligibility test was organized in November 2011 by the UP Board, and the recruitment of
teachers followed the declaration of test results in December 2011. In addition to this, 80,000
posts of teachers for primary schools and 17,000 for upper primary schools have already been
sanctioned. Moreover, training facilities for teachers comprise a two-year training programme
through Distance Mode approved by the National Council of Teacher Education (NCTE).
Trainings have started in August 2011 with a first batch of 62,000 untrained teachers (Shiksha
Mitras), and a second group is expected to start in July, 2012 and the training completed by
June 2015. The Academic Authority for the curriculum has been notified on 27th
July 2011.
Notifications of State Rules of Uttar Pradesh
Banning screening procedure and capitation
fees
Notification issued on 15-07-2010
No Board examination up to elementary
level
Notification issued on 16-01-2010
Prohibition of holding back and expulsion Notification issued on 16-01-2010
No detention Notification issued on 16-01-2010
No corporal punishment Notification issued on 19-08-2010
Notification of State rules Notification issued on 27-07-2011
Notification of academic authority Notification issued on 27-07-2011
Orientation for SMCs members schedule in
November 2011
Notification issued on 28-06-2011
Minimum instructional hours Notification issued on 26-04-2012
Constitution of SCPCR/REPA In process
Policy on eight years of elementary
education
Already in place
Defining Disadvantaged Groups & Weaker
Sections for admission to 25% seats in
private unaided schools
Proposal being processed. Suggestions have
been invited from the public. Wide publicity
given.
1.3 Sample villages and its educational facilities till Class 8
The study was based on 102 sample villages. The villages varied widely in size, from a minimum
of 40 households to a maximum of 3500. Median number of households was around 200.

102
Nearly all the sample villages in UP could be reached by motorable road. The road was metalled
in the case of over half of the villages (52.9%). Close to one third (31.4%) of the villages had
roads paved with stones. One sixth (15.7%) of villages had unpaved roads. The reasonably good
roads to the sample villages in UP has wider implications including the ability of teachers from
outside the village to reach the school inside the village on a regular basis, and the ability of
children to access an upper primary school in another village if they need to. The type of
housing was mostly a mix of pakka and kachha housing (77.5% of the villages). Small
proportions of the villages had mostly kaccha houses (11.8%) and mostly pakka housing
(10.8%).
The availability of drinking water in the sample villages was particularly important for this study
in the light of the fact that the RTE Act requires schools to provide children with safe and
adequate drinking water. The main source of drinking water in UP’s sample villages was hand-
pumps. Only 7.8% of the villages reported getting piped water. A few villages reported having
wells as their main source of drinking water. Quite a large number of villages (41.2%) reported
that they face problems with being able to access drinking water.
All 102 villages had a government primary school but only 58 villages had a government upper
primary school. Of the remaining, 35 villages had a government upper primary school within a
distance of 3 kms and 9 villages had such a facility at a distance of more than 3 kms. RTE norms
for access to upper primary schooling are not satisfied for 9 out of 102 villages.
1.4 Number of government and private schools
The villages contained as many as 164 government schools -- 106 primary schools, 58 upper
primary schools (one of these was a school with grades 1-8, the rest had only grades 6-8), and 1
secondary school. In addition the sample villages had 55 private schools – 24 primary, 24 upper
primary, and 7 secondary schools.
Table 1.1 Profile of Schools in Sample Villages in UP
Type of Schools
Government
Schools
Private Schools
Primary schools 106 24
Upper primary schools with primary grades 0 24
Schools with upper primary grades only 58 0
Schools with primary, upper primary and secondary
grades 0 7
Total 164 55
Source CORD survey 2011-12

Private schools will be discussed in Section 7. A few observations will also be made on the
madarsas in the sample villages in UP. In the rest of this section, and sections 2
be on government schools.
1.5 Size of government schools
Data is being presented on all the government schools in the sam
106 primary schools with grades 1
The primary and upper primary schools were
the primary schools is 124 and in the upper primary schools is 79. Looking at class size, the
numbers enrolled in upper primary schools appears to be insufficient. The class sizes in both
the primary and upper primary schools are quite similar
schools and they take in students from more than 1 school, a larger class size in upper primary
schools would be expected. But this is not so.
Based on all government schools in sample
Source CORD survey 2011-12
Few of the government primary schools in the sample villages have been established in the past
decade, while this is the time private schools have come up in a big way. However most of the
government upper primary scho
access to upper primary schooling. DISE 2010
of all primary schools and a large proportion (57%) of all upper primary schools in UP have been
set up since 2002.
124.1
0
25
50
75
100
125
Primary schools (1
En
rolm
en
t
Figure 1.2: Average Enrolment in
Government Schools in UP
103
Private schools will be discussed in Section 7. A few observations will also be made on the
madarsas in the sample villages in UP. In the rest of this section, and sections 2
Size of government schools
Data is being presented on all the government schools in the sample villages. These included
ades 1-5 and 58 schools with grades 6-8.
The primary and upper primary schools were comparatively small. The average enrolment in
the primary schools is 124 and in the upper primary schools is 79. Looking at class size, the
numbers enrolled in upper primary schools appears to be insufficient. The class sizes in both
primary schools are quite similar – as there are fewer upper primary
schools and they take in students from more than 1 school, a larger class size in upper primary
schools would be expected. But this is not so.
Based on all government schools in sample villages
Few of the government primary schools in the sample villages have been established in the past
decade, while this is the time private schools have come up in a big way. However most of the
government upper primary schools have been established recently – this means improved
access to upper primary schooling. DISE 2010-11 data also reveals that a small proportion (23%)
of all primary schools and a large proportion (57%) of all upper primary schools in UP have been
79.1
Primary schools (1-5) Upper primary schools (6-8)
Figure 1.2: Average Enrolment in
Government Schools in UP
Private schools will be discussed in Section 7. A few observations will also be made on the
madarsas in the sample villages in UP. In the rest of this section, and sections 2-6, the focus will
ple villages. These included
comparatively small. The average enrolment in
the primary schools is 124 and in the upper primary schools is 79. Looking at class size, the
numbers enrolled in upper primary schools appears to be insufficient. The class sizes in both
as there are fewer upper primary
schools and they take in students from more than 1 school, a larger class size in upper primary
Few of the government primary schools in the sample villages have been established in the past
decade, while this is the time private schools have come up in a big way. However most of the
this means improved
11 data also reveals that a small proportion (23%)
of all primary schools and a large proportion (57%) of all upper primary schools in UP have been

Based on all government schools in sample villages
Source CORD survey 2011-12
1.6 Enrolment in government schools of children from disadvantaged communities
Based on all government schools in sample villages
Source CORD survey 2011-12
Figure 1.4 gives the figures for the proportions of children from disadvantaged groups who are
enrolled in school. Enrolment of SCs in the primary schools is 36.2% and the corresponding
figure for the upper primary schools is 33.3%. These are greater than the average popu
SCs in UP (21.2% in 2001). For the ST populations the figures are 0.5% for the primary schools
9.1
0 10
Primary schools
Upper primary schools
Figure 1.3: Distribution of Government Schools by Year
Before 1990
36
33
0 10
Primary Schools
Upper-Primary Schools
Figure 1.4: Enrolment of Children by Social Group
in Government Schools in UP
104
Based on all government schools in sample villages
Enrolment in government schools of children from disadvantaged communities
Based on all government schools in sample villages
the figures for the proportions of children from disadvantaged groups who are
enrolled in school. Enrolment of SCs in the primary schools is 36.2% and the corresponding
figure for the upper primary schools is 33.3%. These are greater than the average popu
SCs in UP (21.2% in 2001). For the ST populations the figures are 0.5% for the primary schools
49.5 35.6
18.2 72.7
20 30 40 50 60 70 80
% schools set up
Figure 1.3: Distribution of Government Schools by Year
of Establishment in UP
Before 1990 Between 1990 and 1999 2000 and later
36
33
1
0
13
9
50
57
20 30 40 50 60 70 80 90 100
Children
Figure 1.4: Enrolment of Children by Social Group
in Government Schools in UP
Enrolment in government schools of children from disadvantaged communities
the figures for the proportions of children from disadvantaged groups who are
enrolled in school. Enrolment of SCs in the primary schools is 36.2% and the corresponding
figure for the upper primary schools is 33.3%. These are greater than the average population of
SCs in UP (21.2% in 2001). For the ST populations the figures are 0.5% for the primary schools
14.9
80 90 100
Figure 1.3: Distribution of Government Schools by Year
Figure 1.4: Enrolment of Children by Social Group
% SC
% ST
% Muslims
% Other Hindus

and 0.4% in the upper primary schools, which too are higher than the state average population
of STs (0.01%). However for Muslim children, the total en
and only 9% in upper primary schools. Both these figures are lower than the state average of
18.5%. A significant number of Muslim children
at primary level, but some may b
proportion out of school is likely to be quite high.
The dependence of children from SC (and Muslim to some extent) families on government
schools underscores the need to improve access and quality o
applicable to girls – see section 1.7
1.7 Gender wise enrolment in government schools
Looking at gender distribution of enrolment
the primary and upper primary schools.
schools. It also reflects the increased availability of government primary and upper primary
schools in the sample villages since girls from marginalized groups are particularly vulnerable to
being taken out of school if these facilities are not available in the village.
Based on all government schools in sample villages
Source CORD survey 2011-12
1.8 Anganwadis
UP sample villages indicated that most villages had the required number of anganwadis. The
sample villages were comparatively small
102 sample villages, 8% had no anganwadis at all. These villages were smaller
153 households on average.
anganwadis. Villages with one anganwadi had 191 households on average. Villages with two
0 10
Primary schools
Upper primary schools
Figure 1.5: Enrolment by Gender in
Government Schools in UP
105
and 0.4% in the upper primary schools, which too are higher than the state average population
of STs (0.01%). However for Muslim children, the total enrolment in primary schools is 13.2%
and only 9% in upper primary schools. Both these figures are lower than the state average of
of Muslim children are enrolled in madrasas and in private schools
at primary level, but some may be out of school altogether. At upper primary level, the
proportion out of school is likely to be quite high.
The dependence of children from SC (and Muslim to some extent) families on government
schools underscores the need to improve access and quality of these schools. This is also
1.7 below.
Gender wise enrolment in government schools
Looking at gender distribution of enrolment (see Figure 1.5), there were more girls than boys in
the primary and upper primary schools. This reflects greater enrolment of boys in private
schools. It also reflects the increased availability of government primary and upper primary
schools in the sample villages since girls from marginalized groups are particularly vulnerable to
out of school if these facilities are not available in the village.
Based on all government schools in sample villages
UP sample villages indicated that most villages had the required number of anganwadis. The
sample villages were comparatively small – the average (median) was 200 households. Of these
102 sample villages, 8% had no anganwadis at all. These villages were smaller
The majority (78.4%) of sample villages had
anganwadis. Villages with one anganwadi had 191 households on average. Villages with two
48
44
52
56
20 30 40 50 60 70 80 90 100
Figure 1.5: Enrolment by Gender in
Government Schools in UP
% Boys % Girls
and 0.4% in the upper primary schools, which too are higher than the state average population
rolment in primary schools is 13.2%
and only 9% in upper primary schools. Both these figures are lower than the state average of
are enrolled in madrasas and in private schools
e out of school altogether. At upper primary level, the
The dependence of children from SC (and Muslim to some extent) families on government
f these schools. This is also
, there were more girls than boys in
This reflects greater enrolment of boys in private
schools. It also reflects the increased availability of government primary and upper primary
schools in the sample villages since girls from marginalized groups are particularly vulnerable to
UP sample villages indicated that most villages had the required number of anganwadis. The
the average (median) was 200 households. Of these
102 sample villages, 8% had no anganwadis at all. These villages were smaller – they had had
The majority (78.4%) of sample villages had one or two
anganwadis. Villages with one anganwadi had 191 households on average. Villages with two
100

106
anganwadis were much larger with 340 households on average. A small proportion of villages
had 3 anganwadis. These villages had 515 households on average. Villages with more than 3
anganwadis had as many as 943 households on average.
Table 1.6 Distribution of Villages by Number of Anganwadis
No. of anganwadis
in a village
Percentage of villages
with specified number of
anganwadis
Average no. of households in villages
with specified number of anganwadis
0 7.8 153.4
1 49.0 191.0
2 29.4 340.0
3 6.9 515.0
4 to 6 6.9 942.7
Total 100.0 200.0
Source CORD survey 2011-12
Most villages in UP had 1 or more Anganwadi Centres (AWCs) -- but not all AWCs were set up to
hold preprimary classes – there are mini AWCs which run only the supplementary nutrition
programme. In 4 of the sample villages, the AWCs were reported to not provide preschool
education. Thus, 12 villages in the sample did not have preschool facilities available through
anganwadis.
One Anganwadi Centre from each of the sample villages was visited. The following discussion is
based on this. There appears to be no fixed rule about the time the Centre was kept open. The
respondents reported variations where the centre opened at some time between 8 am to 10
am, and closed any time between 12 pm and 3 pm. The centres usually had their own building
or were in a community building. In many villages the AWCs were located within the school
campus – sometimes there was more than 1 AWC in the same school. In some cases, the
children were found to be sitting with class 1, and sharing in the school’s midday meal. There
are cases of double enrolment as well, with the names of the same children figured in the
registers of the AWC and the school. The enrolment varied widely from 37 to 160, with an
average of 76. There does not appear to be any norm of enrolment per Anganwadi Worker
(AWW) or AWC. In 80% of the centres, girls made up less than half the enrolment.
More important, the attendance was very very low. While several centres had no child present,
the maximum number present was 48, and on an average 12 or 13 were present. The following
table shows that while in 13% of schools, no child was present, in nearly 40% of schools, there
were 10 or less children. In 5 schools, the children could not be counted because either the
children were sitting with class 1, or were roaming around while the AWW was busy helping the
ANM while she was vaccinating children.

107
Table 1.7 Distribution of Anganwadi Centres by Observed Attendance
Number of children observed Proportion (%) of anganwadis
None 12.8
10 or less 38.5
11 to 20 30.8
More than 20 17.9
Source CORD survey 2011-12
In 20 centres (in the 94 villages which had an anganwadi), the Anganwadi Worker was not
present – several had gone to the block for meetings or other official work. Between the limited
attendance of the AWW and the low attendance of children, few educational activities could be
observed. While the commonest situation was alphabets or numbers being recited, there were
cases in which the AWW was telling stories or teaching using teaching aids.
In the following sections (Sections 2-5), we will be unpacking the provisions of the Act (how the
state is to provide free and compulsory elementary education to every child) and the extent to
which these requirements have been met.
SECTION 2. INFRASTRUCTURE AND FACILITIES
There is a compulsion on the state to provide access to schooling of grades 1-8. Certain norms
and standards have been set up for schools.
2.1 Teacher provision
RTE requires that even the smallest school should have at least 2 teachers. While only 2 primary
schools were single teacher schools, this applied to one fourth (24.6%) of the upper primary
schools. Of these 14 upper primary single-teacher schools, 12 had less than 100 children
enrolled, 2 had more than 100 children enrolled.
Table 2.1 Schools which meet RTE norms for PTRs in UP
Enrolment Number of
schools
No. of schools which RTE requirements
for PTR
All primary schools 106 44 (41.5%)
Up to 150 76 42
151-200 17 2
>200 13 0
All upper primary schools 56 34 (60.7%)
Up to 100 42 31
More than 100 14 3
All schools 162 78 (48.1%)
Note: Enrolment data is not available for 2 upper primary schools.
Based on all government schools in sample villages
Source CORD survey 2011-12

108
RTE specification in primary schools is for PTR to be less than 30 for schools with less than 150
enrolled.The primary schools in the sample villages were small. Most of them (71.2%) had
enrolment of less than 150 children.59
Only 30 schools had more than 150 children. The latter
are required to have at least 5 teachers and a head-teacher. The study found that 41.5% of the
primary schools had a PTR which satisfied RTE requirements. The shortage is most acute in
primary schools with more than 150 children enrolled.60
The upper primary schools were much
better off. Sixty one per cent had a PTR which was less than 35 (the maximum specified by the
RTE Act). It is seen that among both primary and upper primary schools, RTE compliance is
greater among the schools with lower enrolment.
Table 2.2 Government Schools which meet RTE Norms for Head Teacher Appointments in UP
Type of schools: No. of schools where
Head-teachers
should be appointed
No. of schools which meet
RTE requirements for Head-
teachers
Primary schools with more than 150
enrolled 30 24
Upper primary schools with more
than 100 enrolled 14 13
All schools 44 37
Based on all government schools in sample villages
Source CORD survey 2011-12
The schools did much better in terms of head-teacher appointments. Twenty four of the 30
primary schools which required head teachers (schools with enrolment more than 150) had
head-teachers. Thirteen of the 14 upper primary schools which required head-teachers satisfied
RTE requirements for head teachers.
Table 2.3 Pupil Teacher Ratios in Government Schools in UP
Primary schools Upper primary
schools
All schools
Average Pupil Teacher Ratio 36.1 30.8 34.6
Per cent
Proportion of schools with PTR>30 59.4 55.4 58.0
Proportion of schools with PTR>35 48.1 37.5 44.4
Proportion of schools with PTR>40 41.5 28.6 37.0
Based on all government schools in sample villages
Source CORD survey 2011-12
59
According to RTE, the pupil teacher ratio should be less than 30 for primary grades for schools with
enrolment<150 in Classes 1-5. 60
Schools with enrolment greater than 200 are required to have a PTR less than 40 (the Act specifies that the
head-teacher is to be excluded from this computation).

109
We present figures for the proportion of schools in UP with a specified PTR to give an idea of
the extent of teacher shortage in UP. Close to three fifths of all schools (58%) had a PTR greater
than 30. Thirty seven per cent had a PTR greater than 40. There was also a small proportion
(13%) of the schools which had a PTR greater than 60. Overall the deficiencies were greater in
the case of the primary schools.
Meeting requirements for teachers including subject teachers in upper primary schools: Details
about subjects being taught by the teachers in upper primary schools were asked in a sample of
government schools. In these 56 schools, 42 had an enrolment in grades 6-8 less than or equal
to 100, while 14 had an enrolment of more than 100. The RTE requirements for these schools
were different.
• Eighteen of the 42 schools with less than 100 enrolled met the RTE requirements of at
least 3 subject teachers. The majority of these schools (28 out of 42) also had a PTR less
than or equal to 35, and were not single teacher schools. The combination of having a
PTR below 35 and at least 3 subject teachers means that these 18 schools satisfied the
conditions related to provision of teachers under the RTE Act.
• Of the 14 schools with more than 100 enrolled in grades 6-8, 13 schools had a head
teacher appointed, 9 schools had at least 3 subject teachers, and 7 schools even had
part time teachers for art, PE and work education. However, only 3 schools had a PTR
less than 35. None of these schools met the RTE requirements for provision of teachers
on all criteria.
• Together only 18 out of 56 schools i.e. 32% met all the criteria.
The shortage of teachers needs to be unpacked, according to what the RTE requires for the
stage of schooling and the numbers of students enrolled. In single teacher schools the needs
are the most glaring (see below), but there are acute shortages of teachers in large proportions
of all schools.
• Single teacher schools at primary level need to get another teacher at least, apart from
attention being paid to bringing the PTR to an acceptable level. One has an enrolment of
77. It requires 3 teachers. The second has an enrolment of 108. It requires 4 teachers.
• There were 12 single teacher schools at upper primary level with enrolment of less than
100. They need to get another 2 teachers at least, apart from paying attention to the
overall PTR. There were 2 single teacher schools at upper primary level with enrolment
of more than 100. They need a head teacher, 3 subject teachers, part time teachers as
specified, and ensuring that they have a PTR less than or equal to 35.
2.2 Infrastructure requirements: At least one classroom for every teacher and an office-cum-
store-cum-Head teacher’s room:
Shortage of classrooms in primary schools as reflected in the Teacher Classroom Ratio: In the
primary schools of UP, the average teacher classroom ratio is greater than 1, which indicates
that there is a shortage of classrooms available in the light of RTE. Not so for the upper primary

110
schools, which have a TCR less than 1. The proportion of schools which did not have at least one
classroom for each teacher was 48.5% in the case of the primary schools, but only 14% in the
case of upper primary schools. The TCR indicator is not meaningful when there is a shortage of
teachers. The Student Classroom Ratio is better though it provides only a single statistic.
Table 2.4 Teacher Classroom Ratio in Government Schools in UP
Indicators
Primary
schools
Upper primary
schools
All
Average no. of teachers 3.4 2.6 3.1
Average no. of classrooms 3.0 3.0 3.0
Average Teacher Classroom Ratio 1.2 0.8 1.1
% of schools with at least one classroom
for each teacher (TCR<=1) 55.3 87.5 66.7
Note: Includes head-teachers where appointed.
Based on all government schools in sample villages
Source CORD survey 2011-12
The average student classroom ratio (SCR) is 38. The primary schools are much more crowded
than the upper primary schools, with an SCR of 45 in the case of the former and 26 in the case
of the latter. This is surprising as there are fewer upper primary schools than primary schools.
The reduced enrolment at upper primary level indicates that children are dropping out as they
transition between primary and upper primary school.
Table 2.5 Student Classroom Ratio in Government Schools in UP
Primary
schools
Upper primary
schools
All
Average Student Classroom Ratio 41.7 26.4 36.3
Based on all government schools in sample villages
Source CORD survey 2011-12
Availability of room for use as office cum store cum Head teacher’s room: RTE requires that
schools have a room which could be used as office cum store cum HT room. Over 90% of
schools surveyed had a separate office cum head teacher room. A higher proportion (97%) of
the upper primary schools had a separate office cum head teacher room compared to the
primary schools for whom the figure was 88%. These rooms could be used as storerooms if
required, and some were being used for this purpose.
Table 2.6 Availability of Room for use as Office cum Store cum Head Teacher’s Room in
Government Schools in UP
Proportion (%) of schools with Primary Upper primary All
office cum store cum HT room 88.1 96.6 91.2
at least one classroom for each teacher* and an
office cum store cum Head Teacher’s room 46.2 81.0 58.5

111
*Includes head-teachers where appointed.
Based on all government schools in sample villages
Source CORD survey 2011-12
RTE requires schools to have at least one classroom per teacher and a room for non teaching
purposes (office cum store cum Head Teacher’s room). It is not clear whether the specification
of one classroom per teacher includes the head teacher in schools where head teachers are
mandatory.
2.3 Separate toilets for boys and girls
The RTE under its norms and standards for a school specifies that all schools should have
‘separate toilets for both boys’ and girls’. In the sample schools, just over half (54%) of schools,
had separate toilets for boys and girls which were in a usable condition.
This shortfall in separate toilets for boys and girls exists at a number of levels. There were 12%
of schools which had separate toilets for boys and girls but not in a usable condition. Only
common toilets were available in 28% of schools. In a small minority of schools (6%), there
were no toilets available.
Primary schools were slightly better off than upper primary schools in terms of provision of
toilets. 55% had available and usable toilets for boys and girls compared to 52% of upper
primary schools. A smaller proportion (5%) had no toilets at all while the corresponding
proportion was 9% for upper primary schools.
Table 2.7 Availability of Toilet Facilities in Government Schools in UP
(per cent)
Proportion of schools with: Primary
schools
Upper
Primary
schools
All schools
Separate toilets for boys and girls available
and usable 55.2 51.7 54.0
Separate toilets for boys and girls available
but not usable 10.5 15.5 12.3
Only common toilet available 29.5 24.1 27.6
No toilet available 4.8 8.6 6.1
Total 100 100 100
Based on all government schools in sample villages
Source CORD survey 2011-12
The team found that that the unusable toilets were damaged, had no doors, or that there was
garbage in some of them. In a few cases the toilets were simply locked and hence could not be
used. Researchers reported that the children were seen going outside the school premises
when they wanted to use the toilet.

112
2.4 Safe and adequate drinking water facility to all children
Under the norms and standards that a school has to maintain, the RTE Act specifies that safe
and adequate drinking water facilities for children should be made available. In accordance with
that, the research team enquired about the availability, potability and sufficiency of water.
Table 2.8 Availability of Safe and Adequate Drinking Water Facilities in Government Schools in
UP
(per cent)
Schools (%) with Drinking Water
Primary
schools
Upper primary
schools
All schools
Available 93 83.9 89.7
Potable 89.3 87.2 88.6
Sufficient 90.3 78.7 86.4
Safe and adequate 84.7 78.7 82.8
Based on all government schools in sample villages
Source CORD survey 2011-12
Safe drinking water: The study found that 90% of the sample schools reported availability of
drinking water facilities, and this was observed by the researchers. Most schools have reported
the use of hand pumps. A high proportion (88.6%) of all schools (i.e. 89% and 87% of the
primary and upper primary schools, respectively) reported that the drinking water provided in
their school is safe.
Criteria to judge whether drinking water could be considered safe: When asked why they
considered the water potable, most of the head teachers (HTs) reported that they find the
water is clean and sweet or that they and the villagers also drink this water so they know it is
good. A smaller number (about 20%) of the head teachers reported that the water had been
checked and hence is fit for drinking.
Drinking water not safe/not adequate in some cases: Eleven per cent of the HTs said that the
water is not fit for drinking because of iron particles, chemicals, and other impurities found in
the water. Some also reported that the water smells bad and looks dirty, whereas one HT said
that the water gets polluted during the monsoons and the children face a lot of trouble during
that time.
There were some HTs who complained about the source of water, such as hand pumps and
tube wells not being in working condition or not being enough for the number of children in the
school. Out of these HTs there was one HT who said that the hand pump runs dry during
summer and the students have to walk 200 meters to get to a tube well to collect water.

2.5 Availability of a Kitchen where the Midday Meal is Cooked in the School
Based on all government schools in sample villages
Source CORD survey 2011-12
Midday meals are required to be cooked in the school and hence the RTE Act mentions that the
all weather building in all schools should have a kitchen where the meal can be made. Eighty
five per cent of the schools had kitchens that were available and usab
had kitchens available but which were not usable. Just over one
have a kitchen at all. There was a substantial difference between the primary and upper
primary schools in this case – while close to
available and usable, this was true for only 64% of the upper primary schools in the sample.
2.6 Playground
The RTE Act specifies that all schools should have a playground. The primary schools were
slightly better equipped than the upper primary schools. Just over half (53%) reported that they
had a usable playground compared to 44% of the upper primary schools. A substantial
proportion of the 1-5 schools (39%) and the 6
playground. Some upper primary schools reported they had a playground which was not
usable. This included cases where the playground was dug up and used for storing sticks and
bricks, and where buffaloes were tied in the playground.
96
2
0
25
50
75
100
Primary Schools
pe
rce
nt
Figure 2.9: Availability of Kitchen in
Government Schools in UP
Available and usable
113
Availability of a Kitchen where the Midday Meal is Cooked in the School
Based on all government schools in sample villages
Midday meals are required to be cooked in the school and hence the RTE Act mentions that the
all weather building in all schools should have a kitchen where the meal can be made. Eighty
five per cent of the schools had kitchens that were available and usable. Very few schools (4%)
had kitchens available but which were not usable. Just over one-tenth (12%) of schools did not
have a kitchen at all. There was a substantial difference between the primary and upper
while close to all primary schools (96%) had a kitchen that was
available and usable, this was true for only 64% of the upper primary schools in the sample.
The RTE Act specifies that all schools should have a playground. The primary schools were
y better equipped than the upper primary schools. Just over half (53%) reported that they
had a usable playground compared to 44% of the upper primary schools. A substantial
5 schools (39%) and the 6-8 schools (37%) reported that they h
playground. Some upper primary schools reported they had a playground which was not
usable. This included cases where the playground was dug up and used for storing sticks and
bricks, and where buffaloes were tied in the playground.
64
85
7
4
Upper-Primary Schools All Schools
Figure 2.9: Availability of Kitchen in
Government Schools in UP
Available and usable Available but not usable
Midday meals are required to be cooked in the school and hence the RTE Act mentions that the
all weather building in all schools should have a kitchen where the meal can be made. Eighty
le. Very few schools (4%)
tenth (12%) of schools did not
have a kitchen at all. There was a substantial difference between the primary and upper
all primary schools (96%) had a kitchen that was
available and usable, this was true for only 64% of the upper primary schools in the sample.
The RTE Act specifies that all schools should have a playground. The primary schools were
y better equipped than the upper primary schools. Just over half (53%) reported that they
had a usable playground compared to 44% of the upper primary schools. A substantial
8 schools (37%) reported that they had no
playground. Some upper primary schools reported they had a playground which was not
usable. This included cases where the playground was dug up and used for storing sticks and

Based on all government schools in sample villages
Source CORD survey 2011-12
2.7 Boundary Walls and Fencing
The RTE Act specifies that all schools should have arrangements for securing the school building
by a boundary wall or fencing. Only half of all schools (54%)
more among the primary (61%) and less among the upper primary schools (42%). Eight per cent
of all schools had boundary walls/fencing which were not functional. Around two fifths of all
schools (38%) had no boundary wall o
boundary walls by the researchers were that they were either broken, or not built on all sides
of the school.
Based on all government schools in sample villages
Source CORD survey 2011-12
53
8
0
25
50
75
100
Primary Schools
pe
rce
nt
Figure 2.10 Availability of Playgrounds in
Government Schools in UP
Available and usable
61
8
0
25
50
75
100
Primary Schools
pe
rce
nt
Figure 2.11: Presence of Boundary Wall or Fencing
in Government Schools in UP
Available and functional
114
overnment schools in sample villages
Boundary Walls and Fencing
The RTE Act specifies that all schools should have arrangements for securing the school building
by a boundary wall or fencing. Only half of all schools (54%) had such a functional provision
more among the primary (61%) and less among the upper primary schools (42%). Eight per cent
of all schools had boundary walls/fencing which were not functional. Around two fifths of all
schools (38%) had no boundary wall or fencing available. Common observations on the
boundary walls by the researchers were that they were either broken, or not built on all sides
Based on all government schools in sample villages
44 50
19 12
Upper-Primary Schools All Schools
Figure 2.10 Availability of Playgrounds in
Government Schools in UP
Available and usable Available but not usable
4254
98
Upper-Primary Schools All Schools
Figure 2.11: Presence of Boundary Wall or Fencing
in Government Schools in UP
Available and functional Available but not functional
The RTE Act specifies that all schools should have arrangements for securing the school building
had such a functional provision –
more among the primary (61%) and less among the upper primary schools (42%). Eight per cent
of all schools had boundary walls/fencing which were not functional. Around two fifths of all
r fencing available. Common observations on the
boundary walls by the researchers were that they were either broken, or not built on all sides

115
2.8 Teaching learning equipment
The teachers in Uttar Pradesh reported availability of a wide variety of teaching and learning
aids in their classes. Specifically, charts, pictures, maps and globes seem to be very popular,
with 93.7% of all schools surveyed reportedly using charts and 89.9% of the schools surveyed
reportedly using maps and globes. Other teaching and learning materials used as reported by
the teachers are science and maths kits, wall paintings, handmade models made by the children
and plastic alphabet cards.
Table 2.12 Availability of Teaching Learning Materials in Government Schools in UP
(per cent)
Proportion of schools with: Primary Upper primary All
Charts / Pictures 97.0 87.9 93.7
Maps / Globe 90.1 89.7 89.9
Flash Cards 89.1 50.0 74.8
Other 33.7 50.0 39.6
None of the above 1.0 3.4 1.9
Based on all government schools in sample villages
Source CORD survey 2011-12
TLMs were observed to be available in a majority of primary schools. In a large number of cases
these were a variety of wall paintings with pictures of numbers, alphabets, tables, animals,
birds, fruits and vegetables, days of the week, month names, maps, stories expressed in
pictures, human body parts, national symbols like the Indian flag or Ashok Chakra, inspirational
statements drawn on them. Many also had flash cards, plastic letters or numbers, abacus,
charts, a globe, marbles, match sticks, plastic pipes to count 1-100 or clay. However in only 11.6
percent of schools visited were TLMs seen in use in any of the classes. In the various classrooms
teachers were seen – ‘explaining additions and subtractions with matchsticks’, ‘teaching by
showing the counting chart’, ‘by showing globe and charts’, by using paper letters and using
Hindi flash cards for class 1.
2.9 Availability of Library Facilities
Table 2.13 Availability of Library Facilities in Government Schools in UP
(per cent)
Proportion of schools with: Primary schools
Upper primary
schools All
Library available 84.0 65.5 77.2
A high proportion (84%) of the primary schools had libraries, while this was true for a smaller
proportion (66%) of the upper primary schools.

2.10 Play material, Games and Sports equipment
Based on all government schools in sample villages
Source Cord Survey 2011-12
The RTE Act says that each class must be provided with play material, sports equipment and
games, as per their requirements. Just over one third (3
which was usable, whereas over half (54%) of the schools did not have any games and sports
equipment. One tenth (11%) of all schools had equipment available but this was not in usable
condition. The primary schools wer
them reported no equipment in contrast to 39% of the upper primary schools. Common sports
equipment included cricket paraphernalia, footballs, skipping rope. Some schools had
equipment for volleyball and badminton, apart from ludo and carrom boards for indoor
activities.
Summing up, in terms of teacher provision, the situation is quite varied. There are still 2
primary schools and 14 upper primary schools which are single teacher schools. The PTRs ar
somewhat better in the smaller primary schools (enrolment less than 150) and the smaller
upper primary schools (enrolment less than 100). The provision of head teachers in the larger
schools is comparatively high. Upper primary schools also require at le
and, in the larger schools, part time teachers. Looking at the picture as a whole, it was found
that 18 of the 42 upper primary schools (with enrolment less than 100) met all these
requirements, but this applied to none of the larger
more than 100).
29
9
0
25
50
75
100
Primary Schools
pe
rce
nt
Figure 2.14: Availability of Games and Sports
Equipment in Government Schools in UP
Available and usable
116
ames and Sports equipment
Based on all government schools in sample villages
The RTE Act says that each class must be provided with play material, sports equipment and
games, as per their requirements. Just over one third (35%) of all schools had some equipment
which was usable, whereas over half (54%) of the schools did not have any games and sports
equipment. One tenth (11%) of all schools had equipment available but this was not in usable
condition. The primary schools were much worse off than the upper primary schools
them reported no equipment in contrast to 39% of the upper primary schools. Common sports
equipment included cricket paraphernalia, footballs, skipping rope. Some schools had
and badminton, apart from ludo and carrom boards for indoor
Summing up, in terms of teacher provision, the situation is quite varied. There are still 2
primary schools and 14 upper primary schools which are single teacher schools. The PTRs ar
somewhat better in the smaller primary schools (enrolment less than 150) and the smaller
upper primary schools (enrolment less than 100). The provision of head teachers in the larger
schools is comparatively high. Upper primary schools also require at least 3 subject teachers
and, in the larger schools, part time teachers. Looking at the picture as a whole, it was found
that 18 of the 42 upper primary schools (with enrolment less than 100) met all these
requirements, but this applied to none of the larger upper primary schools (with enrolment
4535
16
11
Upper-Primary Schools All Schools
Figure 2.14: Availability of Games and Sports
Equipment in Government Schools in UP
Available and usable Available but not usable
The RTE Act says that each class must be provided with play material, sports equipment and
5%) of all schools had some equipment
which was usable, whereas over half (54%) of the schools did not have any games and sports
equipment. One tenth (11%) of all schools had equipment available but this was not in usable
e much worse off than the upper primary schools – 62% of
them reported no equipment in contrast to 39% of the upper primary schools. Common sports
equipment included cricket paraphernalia, footballs, skipping rope. Some schools had
and badminton, apart from ludo and carrom boards for indoor
Summing up, in terms of teacher provision, the situation is quite varied. There are still 2
primary schools and 14 upper primary schools which are single teacher schools. The PTRs are
somewhat better in the smaller primary schools (enrolment less than 150) and the smaller
upper primary schools (enrolment less than 100). The provision of head teachers in the larger
ast 3 subject teachers
and, in the larger schools, part time teachers. Looking at the picture as a whole, it was found
that 18 of the 42 upper primary schools (with enrolment less than 100) met all these
upper primary schools (with enrolment

A summary figure below shows UP’s lack of readiness wrt requirements of RTE for
infrastructure and facilities (see Figure 2.15a)
classrooms and a non teaching room is particularly poor. Drinking water facilities and kitchens
are the only facilities available in a high proportion of these schools. Many other facilities
(playgrounds, separate toilets for boys and girls, boundary walls) are available
of the primary schools. Infrastructural provision
are slightly worse than in the primary schools, with the exception of classrooms.
Based on all government schools in sample villages
Source CORD Survey 2011-12
The situation with regard to some TLMs available in both primary and upper primary schools is
excellent. Library facilities have also been made available in 77% of all schools. Games and
sports equipment were available in less t
schools.
46.2
55.2
81
0
25
50
75
100
At least 1
classroom per
teacher & an
office/store/HT
room
Separate toilets
for boys and
girls
Pe
rce
nt
Figure 2.15a: Government Schools (%) in UP which had
Specified Infrastructure and Facilities Available and
Primary Schools
117
below shows UP’s lack of readiness wrt requirements of RTE for
(see Figure 2.15a). In the primary schools, the availability of usable
non teaching room is particularly poor. Drinking water facilities and kitchens
are the only facilities available in a high proportion of these schools. Many other facilities
(playgrounds, separate toilets for boys and girls, boundary walls) are available
nfrastructural provision and facilities in the upper primary schools in UP
are slightly worse than in the primary schools, with the exception of classrooms.
Based on all government schools in sample villages
The situation with regard to some TLMs available in both primary and upper primary schools is
excellent. Library facilities have also been made available in 77% of all schools. Games and
sports equipment were available in less than half of all schools, and particularly poor in primary
55.2
84.7
96.2
53.451.7
78.7
63.8
43.9
Separate toilets
for boys and
girls
Safe drinking
water facility
Kitchen Playground
Figure 2.15a: Government Schools (%) in UP which had
Specified Infrastructure and Facilities Available and
Usable
Primary Schools Upper Primary Schools
below shows UP’s lack of readiness wrt requirements of RTE for
. In the primary schools, the availability of usable
non teaching room is particularly poor. Drinking water facilities and kitchens
are the only facilities available in a high proportion of these schools. Many other facilities
in less than 60%
and facilities in the upper primary schools in UP
are slightly worse than in the primary schools, with the exception of classrooms.
The situation with regard to some TLMs available in both primary and upper primary schools is
excellent. Library facilities have also been made available in 77% of all schools. Games and
han half of all schools, and particularly poor in primary
60.6
42.1
Boundary wall
Figure 2.15a: Government Schools (%) in UP which had
Specified Infrastructure and Facilities Available and

118
Table 2.15b Availability of Facilities in Government Schools in UP
(per cent)
Based on all government schools in sample villages
Source CORD Survey 2011-12
SECTION 3. FACILITATING ADMISSION AND RETENTION OF ALL CHILDREN, PARTICULARLY THOSE ON THE MARGIN
The RTE Act puts a compulsion on the state “to provide free and compulsory elementary
education to every child in the age group 6-14 years” (Chapter III, Section 8a) requiring that the
state ensure compulsory admission, attendance and completion of elementary education for
each of these children. In this section, we will look at school policies specified under RTE which
are aimed to bring all children into school and retain them in school for at least 8 years,
particularly children on the margin (those from socially disadvantaged groups, children with
disability), who are most at risk of dropping out due to problems at home and/or in school.
Findings are based on the schools surveyed in detail. Head teachers were interviewed; activities
observed; and registers examined to see what was recorded.
We begin by noting whether teachers had any information about the Act, in terms of training
and materials.
3.1 Awareness and training on RTE Act
Table 3.1 Awareness of RTE Act among Teachers and Head Teachers in Government Schools in
UP
(per cent)
Proportion of teachers and head-
teachers who reported that they had
received
Teachers Head Teachers
RTE related training 83.7 86.5
Reading material on RYE Act 96.9 13.5
Based on interviews with class 3 and class 7 teachers and the head teachers in sample schools
Source: CORD survey 2011-12
The study found that over four-fifths of teachers and head teachers in U.P. had received RTE
training for a duration of 4 days. The purpose of the training was reported to be essentially to
spread awareness about RTE rules and regulations including specifications of teachers’ duties.
Percentage of schools with the following
available:
Primary Schools Upper Primary
Schools
All
Teaching learning equipment 99.0 96.6 98.1
Library 84.0 65.5 77.2
Games and sports equipment 37.1 60.7 45.8

119
Training also emphasized child development, how to teach children with special
needs/disability, the need for special attention for weaker students, and the importance of
teaching in a friendly and fear free environment, without punishing or scolding the children.
Specifically four fifths of Class 3 and Class 7 teachers reported that they had had training on
how to teach in a child friendly way, in a child centred way, how to make children learn through
activities, discover and exploration, and to teach so as to ensure the all round development of
the child. Most teachers and head teachers felt however that they needed more training on
RTE.
Most teachers reported getting the Samvad module,61
as RTE training material. A majority of
them remembered the name, and others simply said they got a booklet/book. A few teachers
said they did not get it because of a shortage of copies.
3.2 Admission policies
No child shall be denied admission in a school for lack of age proof: The RTE Act, Section 14 (1)
mandates that for the purposes of admission to elementary education, the age of a child shall
be determined on the basis of the birth certificate issued in accordance with the provisions of
the Births, Deaths, and Marriages Registration Act, 1886 or on the basis of such other
document, as may be prescribed. Section 14 (2) states that no child shall be denied admission in
a school for lack of age proof. The UP state rules (Section 9) stipulate that the age proof could
be provided from ANM records, anganwadis records, village register of births and deaths, or a
declaration through affidavit from the guardian.
We see that 63% of head teachers stated that they do not refuse admission if children have no
documents (for age proof or transfer certificates). Teachers reported getting these orders
(verbally) between July and December 2011 (barring 4 cases). A few teachers admit children
after taking permission to do so from the BEO. Some schools (10.4 percent) reported that they
require documents only for admission to certain classes. Class 1 is always exempt from this
requirement. In some cases documents were needed only for classes 2-5, 3-4 or 4-5 or class 6
onwards.
A small proportion (12%) of schools reported that they require Birth Certificates as age proof.
Another 7% said they take affidavits from parents. A substantial proportion (44%) of upper
primary schools reported that they ask for transfer certificates, compared to 22.7% of primary
schools. Teachers reported that Transfer Certificates are important for them to decide which
class to admit children in. The RTE Act is only concerned that the lack of a TC should not be
grounds for denying admission. 62
61
The Samvad module is reported to cost between 70 and 80 rupees. This appears to be highly subsidized as the
module is a thick volume. 62
The RTE Act requires that children who wish should be issued Transfer Certificates to facilitate their admission
into other schools, and that lack of a Transfer Certificate is not to be a ground to delay or deny admission (Chapter
II, Section 5 (3)).

120
Table 3.2 Documents Required for Admission in Government Schools in UP
(per cent)
Proportion of schools which Primary schools Upper primary
schools
All schools
Do not refuse admission even if
there are no documents 71.6 46.0 62.3
ask for the following documents at
time of admission:
Age proof (Birth Certificate) 11.4 12.0 11.6
Any other (including affidavit /
declaration from parents) 3.4 12.0 6.5
Transfer Certificate 22.7 44.0 30.4
Options are not mutually exclusive.
Based on survey in sample schools
Source Cord Survey 2011-12
Admission for extended period as prescribed: The RTE Act requires that children be admitted
for an extended period as prescribed (Chapter IV, Section 15). A high proportion (84%) of
schools reported that they do admit children even after the earlier cut-off date for admission
(i.e. after 30 September). Enrolment records showed that only 15% of schools had done so. This
is more in keeping with the fact that 49% of head teachers reported that they have so far not
received any government order of admitting children beyond the extended period.
Table 3.3 Schools that Grant Admission for Extended Period as Prescribed
(per cent)
Proportion of schools which took new
admissions after 30th
September
Primary Upper Primary Total
As reported by HT 80.8 90.9 84.4
As found from enrolment records 13.9 17.2 15.1
Based on survey in sample schools
Source Cord Survey 2011-12
Age appropriate enrolment and Special Classes to mainstream children: What was the criteria
for choosing the grade in the case of the admission of a 9 year old who has never been enrolled
before. From the table, it can be seen that 61% of the schools reported that they admit a child
to the age appropriate class. Admission into age-appropriate classes would need to go hand in
hand with Special Classes for such new admissions. The awareness and implementation of
having such classes is discussed below.

121
Table 3.4 Criteria for Selecting Grade when Admitting 9 year old Never Enrolled child in
Government Schools in UP
(per cent)
Proportion of respondents who said, when a never enrolled 9 year old child
comes for admission, that they:
Percent
Admit the child to age appropriate class 61
Admit child to class 1 8
Give a written test before deciding 48
Any other (includes oral tests) 3
Note: This is not applicable to schools with only upper primary grades because age of entry for these
schools is 11 years.
Based on survey in sample schools
Source Cord Survey 2011-12
A majority of schools (57%) were not doing age appropriate enrolment -- 48% reported that
they would conduct a written test for a 9 year old, who had never been enrolled, to decide
which grade the child should be admitted in. This may be the standard procedure the teachers
have always followed for new admissions. A few schools (8%) reported that they would put all
never enrolled children into Class 1. There were also a few schools who said they would decide
on the basis of oral tests or a combination of factors.
According to the RTE Act, Special Classes have to be held for new admissions who have never
attended school to enable them to catch up with other children of their age. However, only two
schools actually reported conducting such special classes for age appropriate new admissions,
despite 34 schools claiming to have received orders from the Government to conduct such
classes. Some schools reported being briefed about this rule during RTE training programmes, a
few reported receiving orders from the BRC.
3.3 Ensure participation of children from weaker sections and disadvantaged social groups
Related to ensuring school participation of children from weaker sections and disadvantaged
groups is the specification in the Act that these children are not discriminated against and
prevented from pursuing and completing elementary education on any grounds – Section 8c.
Overt discrimination against children from “weaker sections and disadvantaged groups” was
neither reported nor observed. In a few schools, discrimination against disadvantaged groups
was mentioned in the context of the midday meal. As mentioned earlier, the methodology and
tools used in this study are not suited to exploring issues of discrimination. Issues of inclusion
are discussed in section 5 which looks at how teachers are to transact the curriculum. The study
did not find much awareness of these issues among teachers (see section 5.1 which discusses
teachers’ understanding of the various ways that the RTE Act requires them to relook at the
goals of schooling and how they are to achieve them).

122
3.4 Participation of persons with disabilities
RTE requires for children with disabilities to have full participation in school, ensuring that they
are protected, and that they are on equal footing with other children. While heads of schools
did report that many children with disabilities (149) were enrolled in school, numbers observed
by researchers (with the help of the teachers) were about half of this (75).
Table 3.5 Children with Disability (CWD) Reported to be Enrolled in Government Schools in UP
Type of Disability
No. of CWD in primary schools No. of CWD in upper primary
schools
Physical / locomotor 30 17
Mental / learning disability 30 9
Visual 16 1
Speech 10 5
Hearing 5 0
Multiple 20 6
Total 111 38
Based on survey in sample schools
Source: CORD Survey 2011-12
Table 3.6 Training in Special Education among Teachers in Government Schools in UP
Teacher with following types of training on
teaching CEDs
Number of teachers
Diploma / degree in special education 7 (in 5 schools)
Short duration course (2 to 30 days) 62 (in 28 schools)
Based on survey in sample schools
Source: CORD Survey 2011-12
Coming to the teachers, there were 5 schools in UP, which had 7 teachers with a
diploma/degree in special education to teach disabled children, and 28 schools with 62
teachers having short duration training, which ranged between 1-4 days. Six schools also
reported to having teachers coming from outside the school (from NGOs, IET and Shiksha
Mitra) to teach the children with disability. Surprisingly only 47% of the schools reported that
they had children with disability enrolled, and the proportion of schools which had at least one
teacher with even short-duration special training was much lower (25%), clearly indicating how
unprepared the system is.

Table 3.7 Incidence of Disability and Availability of Teachers with Special Training in
Government Schools in UP
Proportion of schools with:
Any children with disability
At least one teacher with some
on teaching CWD
Based on interviews with the Head Teachers in the sample schools
Source: CORD Survey 2011-12
Barrier-free access: Ramps are important to ensure that students with physical/locomotor
disability are able to move about in school. It can be seen from the table that 54.4% of all
schools had ramps that were us
Ramps had not been made in 36
indicates that just over half the schools had usable ramps to provide barrier free access for
children with disability. Further, 5.1%
usable.
Based on survey in sample schools
Source: CORD Survey 2011-12
62
2
0
25
50
75
100
Primary Schools
pe
rce
nt
Figure 3.8: Availability of Ramps in
Selected Government Schools in UP
Available and usable
123
Table 3.7 Incidence of Disability and Availability of Teachers with Special Training in
Primary
schools
Upper primary
schools
47 45.5
some training 22 29.1
Based on interviews with the Head Teachers in the sample schools
Ramps are important to ensure that students with physical/locomotor
disability are able to move about in school. It can be seen from the table that 54.4% of all
schools had ramps that were usable (62% in primary and 41.4% in upper primary schools).
Ramps had not been made in 36% of primary schools and 48.3% of upper primar
indicates that just over half the schools had usable ramps to provide barrier free access for
with disability. Further, 5.1% of all the schools had ramps that were available but not
4154
10
5
Upper-Primary Schools All Schools
Figure 3.8: Availability of Ramps in
Selected Government Schools in UP
Available and usable Available but not usable
Table 3.7 Incidence of Disability and Availability of Teachers with Special Training in
(per cent)
All schools
46.5
24.5
Ramps are important to ensure that students with physical/locomotor
disability are able to move about in school. It can be seen from the table that 54.4% of all
in upper primary schools).
of upper primary schools. This
indicates that just over half the schools had usable ramps to provide barrier free access for
of all the schools had ramps that were available but not

124
3.5 Ensure admission of children of migrant families
Children of migrant families are susceptible to dropping out because they are not stationed in
their native village. The RTE Act is concerned that such children are able to access schooling
wherever they may be based. A small proportion (17%) of schools in UP reported that they had
any children who were in-migrants to the village. This is in keeping with the limited in-migration
that is reported in UP. These were more likely to be the primary schools. Only a small
proportion of schools (18%) reported that they had children who had been enrolled, then
migrated to other places, and then returned.
Table 3.9 Schooling of Migrant Children in Government Schools in UP
(per cent)
Proportion of Head Teachers who report that:
Primary
schools
Upper
primary
schools
All
schools
their school has enrolled children from families who
have lived there only for a few months in the year (in-
migrants)
19.0 14.6 17.4
their school has children who had migrated to other
places and then returned to the school 20.0 14.5 18.1
Based on survey in sample schools
Source: CORD Survey 2011-12
3.6 Provision of “free” education
RTE requires not just that children not pay fees, but also that the state will cover any costs
which may serve as a barrier to the child’s participation in school. The schools in the sample
reported that they do not charge fees. However, additional coverage of costs of education was
limited to the established schemes of providing textbooks to all children and uniforms to some
children. In a very few cases, there was coverage of the costs of some transport facilities.
Table 3.10 Schemes to Reduce Costs of Schooling for Children in UP
(per cent)
Proportion of schools which reported: Primary schools Upper primary schools All
Textbooks given to all students 97.0 93.1 95.6
Uniforms given to all children 12.9 15.5 13.8
Uniforms given to some children 17.8 18.9 18.2
Transport facility to any student 1.0 5.2 2.5
Based on survey in sample schools
Source: CORD Survey 2011-12
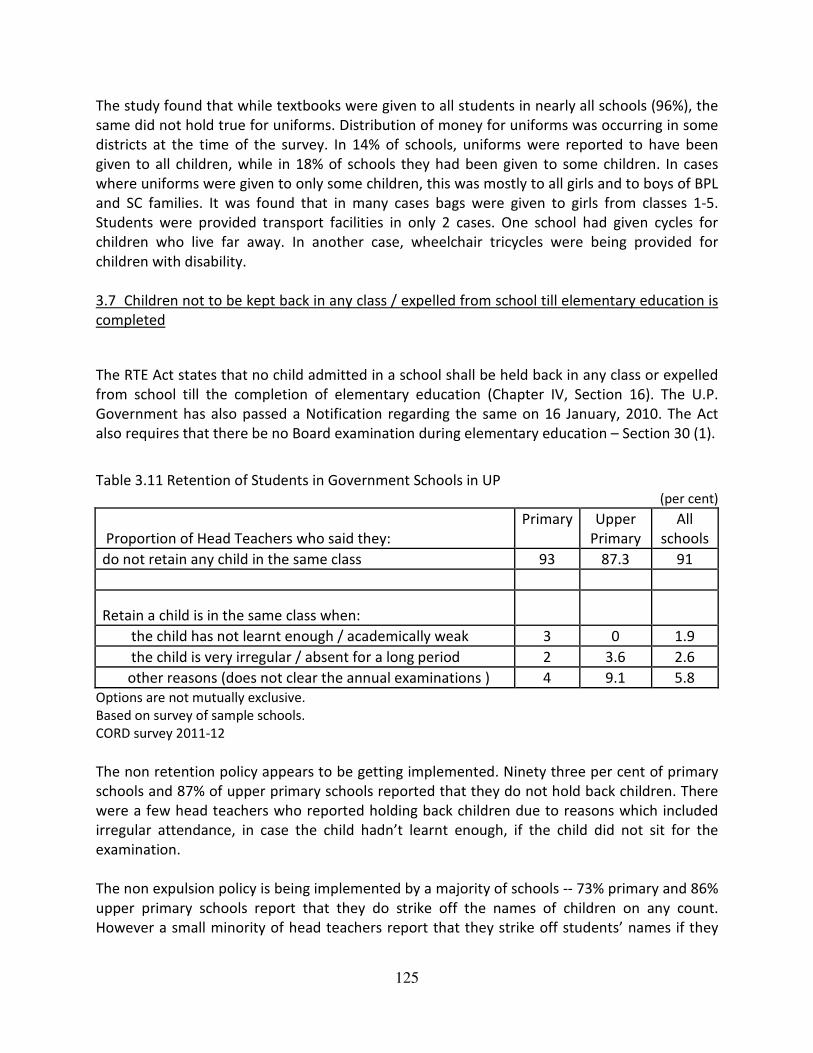
125
The study found that while textbooks were given to all students in nearly all schools (96%), the
same did not hold true for uniforms. Distribution of money for uniforms was occurring in some
districts at the time of the survey. In 14% of schools, uniforms were reported to have been
given to all children, while in 18% of schools they had been given to some children. In cases
where uniforms were given to only some children, this was mostly to all girls and to boys of BPL
and SC families. It was found that in many cases bags were given to girls from classes 1-5.
Students were provided transport facilities in only 2 cases. One school had given cycles for
children who live far away. In another case, wheelchair tricycles were being provided for
children with disability.
3.7 Children not to be kept back in any class / expelled from school till elementary education is
completed
The RTE Act states that no child admitted in a school shall be held back in any class or expelled
from school till the completion of elementary education (Chapter IV, Section 16). The U.P.
Government has also passed a Notification regarding the same on 16 January, 2010. The Act
also requires that there be no Board examination during elementary education – Section 30 (1).
Table 3.11 Retention of Students in Government Schools in UP
(per cent)
Proportion of Head Teachers who said they:
Primary Upper
Primary
All
schools
do not retain any child in the same class 93 87.3 91
Retain a child is in the same class when:
the child has not learnt enough / academically weak 3 0 1.9
the child is very irregular / absent for a long period 2 3.6 2.6
other reasons (does not clear the annual examinations ) 4 9.1 5.8
Options are not mutually exclusive.
Based on survey of sample schools.
CORD survey 2011-12
The non retention policy appears to be getting implemented. Ninety three per cent of primary
schools and 87% of upper primary schools reported that they do not hold back children. There
were a few head teachers who reported holding back children due to reasons which included
irregular attendance, in case the child hadn’t learnt enough, if the child did not sit for the
examination.
The non expulsion policy is being implemented by a majority of schools -- 73% primary and 86%
upper primary schools report that they do strike off the names of children on any count.
However a small minority of head teachers report that they strike off students’ names if they

126
are absent for two months or more (8%), some who do so if they are absent for a month or
more (8%), and some who do so even if they are absent for less than a month (6%).
Table 3.12 Striking Off Names of Students for Prolonged Absence in Government Schools in UP
(per cent)
Primary
schools
Upper primary
schools
All
schools
Proportion of head-teachers who report that a
child’s name is struck off if absent continuously for
More than 2 months 8 9.1 8.4
More than 1 month 12 1.8 8.4
A month or less 7 3.6 5.8
Proportion of head-teachers who report that a
child’s name is not struck off even for a prolonged
absence
73 85.5 77.4
Based on survey of sample schools
Source: CORD Survey 2011-12
3.8 Languages used to teach/explain
Table 3.13 Languages used in Government Schools in UP
(per cent)
Proportion of head teachers who reported that the
following languages are used to teach/explain to
their students
Primary
schools
Upper
primary
schools
All
schools
Hindi 99.0 98.2 98.7
Other local dialects 35.0 18.2 29.0
Urdu 1.0 0.0 0.7
Options are not mutually exclusive.
Based on survey of sample schools
Source: CORD Survey 2011-12
In the 17 districts covered in this survey, teachers reported that Hindi or khadi boli were the
most common languages spoken by children. Nearly all schools reported using Hindi to teach
and explain in class. However, there were a proportion of head-teachers (29%) who reported
that local languages were also being used (a higher proportion of primary schools). In a small
proportion of schools (16%), teachers said that children face some trouble in understanding
Hindi. In most cases, teachers said this was a problem because they speak Bhojpuri, Awadhi or
theth bhasha at home. This was more a problem for children of class 1. “Children don’t
understand ‘pure Hindi’”, said one teacher. No one reported Urdu as a language spoken in the

127
region. No teacher reported using Urdu to explain in the class. Only one primary school
reported that it had teaching in Urdu.63
SECTION 4 TEACHERS AND SCHOOL FUNCTIONING
4.1 Working days for schools / working hours for teachers
The academic year in the UP schools was reported to run from July to May. All primary schools
and a high proportion (85%) of upper primary schools reported that they work more than the
minimum number of days specified by RTE (i.e. 200 working days for Classes 1-5 and 220
working days for Classes 6-8).
Table 4.1 Working Days for Primary and Upper Primary Government Schools in UP
Proportion of: Percent
Primary schools (1-5) which worked at least 200 days 100
Upper primary schools (6-8) which worked at least 220
days
84.6
Based on survey of sample schools
Source: CORD Survey 2011-12
However, the actual picture is very different. Schools are often closed at short notice because
of extreme weather conditions. Only 6% of schools that they had not been closed for such
reasons the previous year. Fifty per cent of schools said they had been closed for 10-14 days the
previous year for such reasons. The study found that extreme cold in UP in December 2011
meant that schools were closed suddenly while the survey was going on, and well before the
official closing date for the winter break. The scheduled date for schools reopening was also
uncertain. Attendance of children just before the schools closed and just after they opened was
also very thin, partly because of the cold but also because of the uncertainty about whether the
schools were functioning. Similarly, uncertainty about the functioning of schools was also a part
of the days immediately before festivals such as Saraswati Puja.
Table 4.2 Distribution of Government schools in UP by the number of days closed unexpectedly*
(per cent)
Number of days closed in
school year 2010-11
Reported by proportion of schools
Not closed 7.1
Closed but days not specified 2.6
5 to 9 days 16.8
10 to 14 days 54.8
15 to 19 days 11.6
20 days or more 7.1
100
63
See Appendix: Status of Urdu in Uttar Pradesh.

128
*Reasons include extreme weather conditions like floods, cold wave, heat wave.
Based on survey of sample schools
Source: CORD survey 2011-12
RTE also specifies a minimum number of 45 working hours per week for the teacher for
teaching and preparation work. Self reporting by the teacher would make it difficult to get an
accurate picture of this. The average school day for the primary and upper primary schools in
UP were reported to be 6.7 and 6.1 hours (including the MDM), respectively. The average
duration of the MDM was 36 minutes in primary schools and 30 minutes in upper primary
schools. Teachers were not required to keep a record of time they spent on preparation outside
of school hours.
4.2 Teachers’ attendance in schools
Teachers are required to maintain regularity and punctuality in attending school, as specified in
Section 24 (1a) of the Act, and teachers’ presence in school on the day of the survey was noted
to get some idea of their regularity in school.
The study found that 48% of the schools in UP had all teachers present. The upper primary
schools were more likely to have all teachers present. Thirty per cent of schools had only one
teacher absent, both primary and upper primary. More than one fifth of schools had only one
teacher present. These were more likely to be upper primary schools – 46% of them were in
this situation. The mean PTR on the day of the survey was 31.
Table 4.3 Teacher Absenteeism in Government Schools in UP
(per cent)
Proportion of schools where: Primary schools Upper primary
schools
All schools
All teachers were present 43.6 55.2 48.1
One teacher absent 29.7 29.8 29.7
More than one teacher
absent
26.7 15.0 22.2
Only 1 teacher present 10.9 45.6 23.4
Note: Two upper primary schools had no teachers present.
Based on survey of all schools in sample villages
Source: CORD Survey 2011-12
While 26% of teachers were absent in school due to different reasons, 15% of teachers were
reportedly absent because of school related duties and non school related government duties.
Unlike Bihar, absence due to non school related government duties was comparatively high – it
applied to 13% of teachers. Eleven per cent of teachers were reported to be absent for personal
or unknown reasons.

129
Table 4.4 Reasons for Teachers’ Absence on Day of Survey in Government Schools in UP
(per cent)
Type of schools
Proportion of teachers absent due to
non school-
related duty
school-
related duty
personal
reasons
reason not
known
All reasons
Primary schools 12.2 2 11.3 0.6 26.3
Upper primary
schools 15.9 1.4 8.3 1.4 26.7
All schools 13.1 1.8 10.3 0.8 26.4
Based on survey of sample schools
Source: CORD Survey 2011-12
Even among schools where teachers were present, teaching did not necessarily continue after
the midday meal. The school day came to an end with the midday meal in 14% of the schools
even though it was served in the middle of the official school day.
4.3 Student attendance in schools
The study found that there appears to be little effort to ensure attendance of all children
enrolled. Attendance rates reported from the attendance register were as low as 55.3%.
Attendance rates among girls were higher than among boys.
Table 4.5 Student attendance on Day of Survey in Government Schools in UP
(per cent)
Proportion of
students attending on
the day of survey
According to attendance register Observed by survey team
All Boys Girls All Boys Girls
Primary schools 54.9 53.7 56.1 48.9 46.6 50.9
Upper primary schools 57.2 54.2 59.6 52.8 48.3 56.3
All schools 55.3 53.5 57 49.9 47 52.4
Based on survey of sample schools
Source: CORD Survey 2011-12
The observed attendance rates were much lower than the reported attendance rates. These
were calculated from the observations of the investigators on the day of the survey and were
the attendance rates observed before the midday meal. At its highest point, 49.9% of children
were in school, a truly dismal figure. In terms of observed attendance rates as well, girls’
attendance was better than that of the boys. It is possible that boys were simultaneously
enrolled in private schools or going to private tuition or even out of school altogether.
To find out whether children were there for the duration of the school day, the number of
children present was also observed after the midday meal. This was found to fall to 46%.

Based on survey of sample schools
Source: CORD Survey 2011-12
Attendance rates were low in both primary and upper primary schools. Attendance rates in the
upper primary schools were 52.8%, slightly better than in the primary schools (48.9%). (This
applied both when one looked at attendance from the register and at observed attendance.)
However, within the upper primary schools itself, it was seen that there was a sharp decline in
attendance rates between classes 6 and 8. There was not much difference noticed in
attendance rates between classes 1 and 5 in the primary schools. Improving student at
rates in primary and upper primary schools is essential if other inputs are going to make a
difference.
Table 4.7 Attendance Rates in Selected Classes in Government Primary Schools in UP
Proportion of students attending
Grade 1
Grade 5
Based on survey of sample schools
Source: CORD Survey 2011-12
Table 4.8 Attendance Rates in Selected Classes in Government Upper Primary Schools in UP
Proportion of students attending
Grade 6
Grade 8
Based on survey of sample schools
Source: CORD Survey 2011-12
48.9
0
25
50
75
100
Primary schools
Pe
rce
nt
Figure 4.6: Student Attendance Observed Before
and After Mid-day Meal in Government Schools
Pre midday meal
130
both primary and upper primary schools. Attendance rates in the
upper primary schools were 52.8%, slightly better than in the primary schools (48.9%). (This
applied both when one looked at attendance from the register and at observed attendance.)
within the upper primary schools itself, it was seen that there was a sharp decline in
attendance rates between classes 6 and 8. There was not much difference noticed in
attendance rates between classes 1 and 5 in the primary schools. Improving student at
rates in primary and upper primary schools is essential if other inputs are going to make a
Table 4.7 Attendance Rates in Selected Classes in Government Primary Schools in UP
Proportion of students attending Reported attendance rates
Observed attendance
rates
55.0
56.3
Table 4.8 Attendance Rates in Selected Classes in Government Upper Primary Schools in UP
students attending Reported attendance rates Observed attendance rates
61.6
50.0
52.845.1 49.7
Primary schools Upper primary schools
Figure 4.6: Student Attendance Observed Before
day Meal in Government Schools
in UP
Pre midday meal Post midday meal
both primary and upper primary schools. Attendance rates in the
upper primary schools were 52.8%, slightly better than in the primary schools (48.9%). (This
applied both when one looked at attendance from the register and at observed attendance.)
within the upper primary schools itself, it was seen that there was a sharp decline in
attendance rates between classes 6 and 8. There was not much difference noticed in
attendance rates between classes 1 and 5 in the primary schools. Improving student attendance
rates in primary and upper primary schools is essential if other inputs are going to make a
Table 4.7 Attendance Rates in Selected Classes in Government Primary Schools in UP
(per cent)
Observed attendance
rates
50.6
49.2
Table 4.8 Attendance Rates in Selected Classes in Government Upper Primary Schools in UP
(per cent)
Observed attendance rates
55.9
47.0
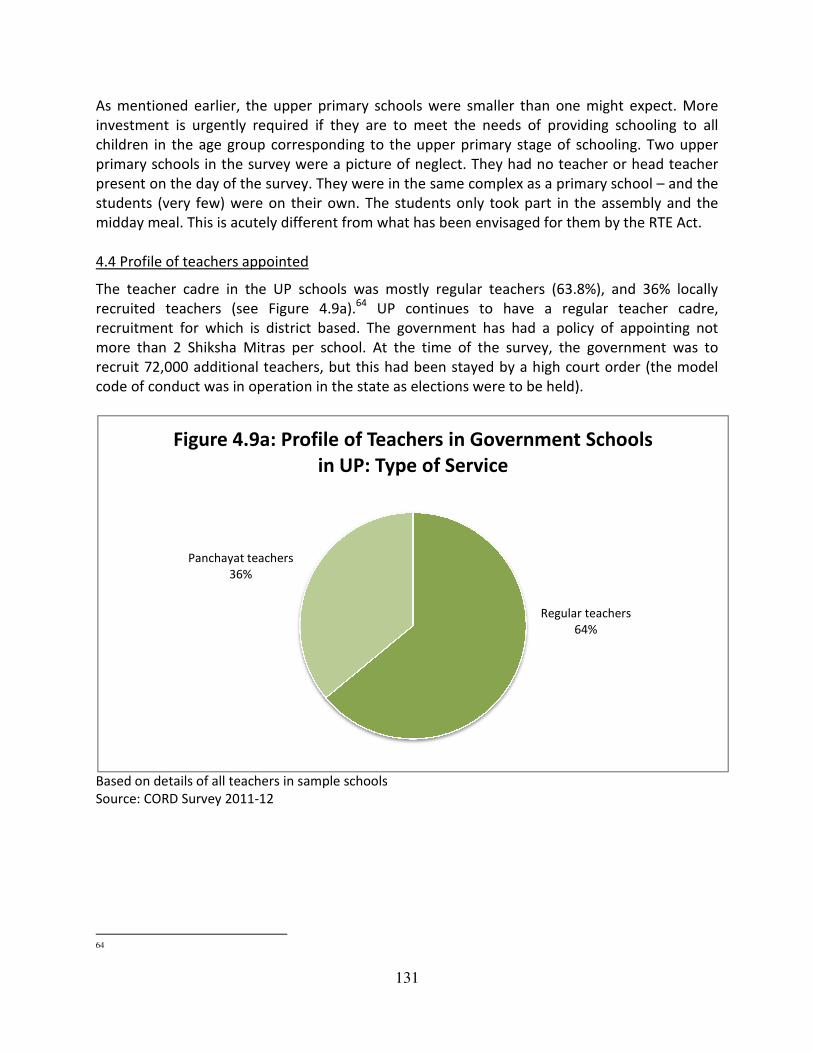
As mentioned earlier, the upper primary schools were smaller than one might expect.
investment is urgently required if they are to meet the needs of providing schooling to all
children in the age group corresponding to the upper primary stage of schooling. Two upper
primary schools in the survey were a picture of neglect. They had n
present on the day of the survey. They were in the same complex as a primary school
students (very few) were on their own. The students only took part in the assembly and the
midday meal. This is acutely different from w
4.4 Profile of teachers appointed
The teacher cadre in the UP schools
recruited teachers (see Figure 4.9a)
recruitment for which is district based. The government has had a policy of appointing not
more than 2 Shiksha Mitras per school. At the time of the survey, the government
recruit 72,000 additional teachers, but thi
code of conduct was in operation in
Based on details of all teachers in sample schools
Source: CORD Survey 2011-12
64
Panchayat teachers
36%
Figure 4.9a: Profile of Teachers in Government Schools
131
As mentioned earlier, the upper primary schools were smaller than one might expect.
investment is urgently required if they are to meet the needs of providing schooling to all
children in the age group corresponding to the upper primary stage of schooling. Two upper
primary schools in the survey were a picture of neglect. They had no teacher or head teacher
present on the day of the survey. They were in the same complex as a primary school
students (very few) were on their own. The students only took part in the assembly and the
midday meal. This is acutely different from what has been envisaged for them by the RTE Act.
4.4 Profile of teachers appointed
teacher cadre in the UP schools was mostly regular teachers (63.8%), and 36% locally
(see Figure 4.9a).64
UP continues to have a regular teacher cadre,
recruitment for which is district based. The government has had a policy of appointing not
more than 2 Shiksha Mitras per school. At the time of the survey, the government
teachers, but this had been stayed by a high court order (the model
code of conduct was in operation in the state as elections were to be held).
Based on details of all teachers in sample schools
Regular teachers
64%
Figure 4.9a: Profile of Teachers in Government Schools
in UP: Type of Service
As mentioned earlier, the upper primary schools were smaller than one might expect. More
investment is urgently required if they are to meet the needs of providing schooling to all
children in the age group corresponding to the upper primary stage of schooling. Two upper
o teacher or head teacher
present on the day of the survey. They were in the same complex as a primary school – and the
students (very few) were on their own. The students only took part in the assembly and the
hat has been envisaged for them by the RTE Act.
mostly regular teachers (63.8%), and 36% locally
to have a regular teacher cadre,
recruitment for which is district based. The government has had a policy of appointing not
more than 2 Shiksha Mitras per school. At the time of the survey, the government was to
s had been stayed by a high court order (the model
Regular teachers
Figure 4.9a: Profile of Teachers in Government Schools

Based on details of all teachers in sample schools
Source: CORD Survey 2011-12
A majority of teachers were males (53.6%) but
(46.4%). Regular teachers were more likely to be male. Locally recruited teachers were more
likely to be female (see Table 4.9c)
panchayat teachers, upper primary schools had only regular teachers (see Figure 4.9b).
Table 4.9c Teacher Profile in Government Schools in UP: Type of Service and Gender
Proportion of teachers appointed who are:
Permanent / regular
Panchayat appointees
All
Based on details of all teachers in sample schools
Source: CORD Survey 2011-12
Teacher qualifications: Section 23 of the RTE Act deals with the issue of qualifications required
for a teacher. Section 23(1) specifies that an academic authority authorized by the central
government will decide on the minimum qualifications of teachers, in this case the National
Council of Teacher Education (NCTE).
65
The norms for minimum qualifications for teachers can be relaxed for 5 years (Section 23 (2)) but teachers are
required to acquire minimum qualifications within 5 years (Section 23 (3)).
Panchayat teachers
in primary schools
36%
Figure 4.9b: Teacher Profile
in Primary and Upper Primary Schools in UP
132
sample schools
males (53.6%) but the proportion of females was also substantial
(46.4%). Regular teachers were more likely to be male. Locally recruited teachers were more
ble 4.9c). Primary schools had high proportions of regular and
panchayat teachers, upper primary schools had only regular teachers (see Figure 4.9b).
Table 4.9c Teacher Profile in Government Schools in UP: Type of Service and Gender
s appointed who are: Male Female
37.7 26.3
15.8 20.2
53.5 46.5
Based on details of all teachers in sample schools
23 of the RTE Act deals with the issue of qualifications required
for a teacher. Section 23(1) specifies that an academic authority authorized by the central
government will decide on the minimum qualifications of teachers, in this case the National
l of Teacher Education (NCTE).65
The norms for minimum qualifications for teachers can be relaxed for 5 years (Section 23 (2)) but teachers are
um qualifications within 5 years (Section 23 (3)).
Regular teachers in
primary schools
35%
Regular teachers
in upper-primary
schools
29%
Panchayat teachers
in primary schools
Figure 4.9b: Teacher Profile
in Primary and Upper Primary Schools in UP
was also substantial
(46.4%). Regular teachers were more likely to be male. Locally recruited teachers were more
Primary schools had high proportions of regular and
panchayat teachers, upper primary schools had only regular teachers (see Figure 4.9b).
Table 4.9c Teacher Profile in Government Schools in UP: Type of Service and Gender
Female
26.3
20.2
46.5
23 of the RTE Act deals with the issue of qualifications required
for a teacher. Section 23(1) specifies that an academic authority authorized by the central
government will decide on the minimum qualifications of teachers, in this case the National
The norms for minimum qualifications for teachers can be relaxed for 5 years (Section 23 (2)) but teachers are

Table 4.10b Educational Qualifications of
UP
Proportion of teachers
who are educated:
Less than class 12
Class 12
Graduate and above
All
Based on details of all teachers in sample schools
Source: CORD Survey 2011-12
The NCTE Rules on teacher qualifications (29
studied at least up to class 12 to teach primary grades. It can be seen that nearly all the
teachers (96%) in the primary schools in UP met this requirement. The teachers recruited were
primarily graduates (see Figure 4.10a)
also stipulate that teachers who teach upper primary grades must be graduates (except those
who have done a 4 year B.El.Ed.). This stipulation was met by 72% of the teachers in the uppe
primary schools. Those who did not meet these norms included a small proportion (6%) who
had not passed Class 12, and 22% of teachers who had not studied beyond Class 12.
Looking at educational qualifications of male and female teachers, we see that a
proportion of both were graduates (see Table 4.1
had studied up to Class 12 but not beyond. This was one fourth of the male teachers but 16% of
the female teachers.
Teacher training: In terms of teacher tra
had a Diploma in primary education, but more women (39%) than men (28%) had no training
(see Table 4.11b). The teachers with no training were nearly all in the primary schools (46%)
4.1
6.3
20.3
0
Primary schools
Upper primary schools
Figure 4.10a: Educational Qualifications of Teachers (%)
in Primary and Upper Primary Schools in UP
Less than class 12
133
Educational Qualifications of Male and Female Teachers in Government Schools in
(per cent)
Male Female
4.5 4.9
25.3 16.4
70.2 78.8
100.0 (265) 100.0 (226)
Based on details of all teachers in sample schools
The NCTE Rules on teacher qualifications (29th
July 2011) stipulate that teachers need to have
studied at least up to class 12 to teach primary grades. It can be seen that nearly all the
teachers (96%) in the primary schools in UP met this requirement. The teachers recruited were
see Figure 4.10a). Less than 5% had not completed class 12. NCTE rules
also stipulate that teachers who teach upper primary grades must be graduates (except those
who have done a 4 year B.El.Ed.). This stipulation was met by 72% of the teachers in the uppe
primary schools. Those who did not meet these norms included a small proportion (6%) who
had not passed Class 12, and 22% of teachers who had not studied beyond Class 12.
Looking at educational qualifications of male and female teachers, we see that a
proportion of both were graduates (see Table 4.10b). The difference was the proportions who
to Class 12 but not beyond. This was one fourth of the male teachers but 16% of
In terms of teacher training, a similar proportion of male and female teachers
had a Diploma in primary education, but more women (39%) than men (28%) had no training
. The teachers with no training were nearly all in the primary schools (46%)
20.3
21.8
75.7
71.8
% teachers with training
Figure 4.10a: Educational Qualifications of Teachers (%)
in Primary and Upper Primary Schools in UP
Less than class 12 Class 12 Graduate and above
Teachers in Government Schools in
July 2011) stipulate that teachers need to have
studied at least up to class 12 to teach primary grades. It can be seen that nearly all the
teachers (96%) in the primary schools in UP met this requirement. The teachers recruited were
. Less than 5% had not completed class 12. NCTE rules
also stipulate that teachers who teach upper primary grades must be graduates (except those
who have done a 4 year B.El.Ed.). This stipulation was met by 72% of the teachers in the upper
primary schools. Those who did not meet these norms included a small proportion (6%) who
had not passed Class 12, and 22% of teachers who had not studied beyond Class 12.
Looking at educational qualifications of male and female teachers, we see that a high
). The difference was the proportions who
to Class 12 but not beyond. This was one fourth of the male teachers but 16% of
ining, a similar proportion of male and female teachers
had a Diploma in primary education, but more women (39%) than men (28%) had no training
. The teachers with no training were nearly all in the primary schools (46%)
100
Figure 4.10a: Educational Qualifications of Teachers (%)

(see Figure 4.11a). This is an important area where action is required
taken.
Provisions have been made for a two year training programme through Distance Mode
(approved by the NCTE). A notification was issued regarding this 2 year NCTE approved
course on 11th
July 2011. Under this provision, Shiksha Mitras who are graduates shall be
trained through distance mode with material prepared by the SCERT. Contact programmes at
the block level will be combined with the distance mode. The notification
1.25 lakh graduate Shiksha Mitras are to be trained the last batch of which shall be trained in
2013’. Interestingly, teachers are to be trained under a CCE system culminating in a final exam.
Table 4.11b Professional Teacher Edu
Government Schools in UP
Proportion of teachers who have received the
following training
Diploma (JBT, CPED, DPE etc)
B. Ed.
None
All
Based on details of all teachers in sample schools
Source: CORD Survey 2011-12
There is an urgent need to bring basic educational qualifications of teachers in line with RTE
norms. There were still 4% of teachers in upper primary schools who had not passe
and 28% of teachers in upper primary schools who were not graduates, including 6% of
teachers who had not passed Class 12. The teachers with no training were nearly all in the
primary schools. They were 46% of the teachers in the primary school
26.8
0
Primary schools
Upper primary schools
Figure 4.11a: Teachers (%) with Professional Teacher
Education in Primary and Upper Primary Schools in UP
% with Diploma (JBT, CPED, DPE etc)
134
. This is an important area where action is required and was reported to being
Provisions have been made for a two year training programme through Distance Mode
(approved by the NCTE). A notification was issued regarding this 2 year NCTE approved
July 2011. Under this provision, Shiksha Mitras who are graduates shall be
trained through distance mode with material prepared by the SCERT. Contact programmes at
the block level will be combined with the distance mode. The notification states that ‘about
1.25 lakh graduate Shiksha Mitras are to be trained the last batch of which shall be trained in
2013’. Interestingly, teachers are to be trained under a CCE system culminating in a final exam.
Professional Teacher Education among Male and Female Teachers (%)
Proportion of teachers who have received the Male
36.6
35.1
28.3
100.0
Based on details of all teachers in sample schools
There is an urgent need to bring basic educational qualifications of teachers in line with RTE
norms. There were still 4% of teachers in upper primary schools who had not passe
and 28% of teachers in upper primary schools who were not graduates, including 6% of
teachers who had not passed Class 12. The teachers with no training were nearly all in the
primary schools. They were 46% of the teachers in the primary schools surveyed in detail in UP.
26.8
58.7
27.1
38.5
46.2
% teachers with training
Figure 4.11a: Teachers (%) with Professional Teacher
Education in Primary and Upper Primary Schools in UP
% with Diploma (JBT, CPED, DPE etc) % with B. Ed. % having no training
and was reported to being
Provisions have been made for a two year training programme through Distance Mode
(approved by the NCTE). A notification was issued regarding this 2 year NCTE approved BTC
July 2011. Under this provision, Shiksha Mitras who are graduates shall be
trained through distance mode with material prepared by the SCERT. Contact programmes at
states that ‘about
1.25 lakh graduate Shiksha Mitras are to be trained the last batch of which shall be trained in
2013’. Interestingly, teachers are to be trained under a CCE system culminating in a final exam.
among Male and Female Teachers (%) in
(per cent)
Female
35.1
25.5
39.4
100.0
There is an urgent need to bring basic educational qualifications of teachers in line with RTE
norms. There were still 4% of teachers in upper primary schools who had not passed Class 12,
and 28% of teachers in upper primary schools who were not graduates, including 6% of
teachers who had not passed Class 12. The teachers with no training were nearly all in the
s surveyed in detail in UP.
2.8
100
Figure 4.11a: Teachers (%) with Professional Teacher
Education in Primary and Upper Primary Schools in UP
% having no training

135
4.5 Salary scales of teachers in UP
The regular teachers in the UP teacher cadre were more likely to be male. Local teachers were
more likely to be female (see section 4.4). This is of particular interest as we look at the huge
differences in the salary scales of the regular and local teachers. We explored the issue in semi-
structured interviews with a sample of Class 3 and Class 7 teachers – one Class 3 teacher from
the 101 government primary schools, and one Class 7 teacher from the 59 government upper
primary schools.
Table 4.12 Salary Scales of Teachers for Selected Classes in Government Schools in UP
Number of teachers
who receive as
monthly salary (Rs.)
Class 3 teachers Class 7 teachers Class 3/Class 7 teachers
Regular Local Regular Local Regular Local
3500 0 67 0 0 0 67
10,000 - 20,000 9 0 3 0 12 0
20,000 - 30,000 23 0 38 0 61 0
30,000+ 0 0 10 0 10 0
32 67 51 0 83 67
Based on interviews with Class 3 and Class 7 teachers in sample schools
Source: CORD Survey 2011-12
Class 3 and class 7 teachers were asked what salaries they are paid. While all contract teachers
in class 3 reported being paid a salary of Rs. 3500, the largest proportion (72%) of regular
teachers reported being paid between Rs 20,000 and Rs 30,000. Among class 7 teachers, there
were no contract teachers found; here too the majority (75%) of regular teachers was being
paid a salary between Rs. 20,000 – Rs 30,000. One fifth (20%) of regular Class 7 teachers were
being paid above Rs. 30,000.
Complaints from teachers: Not surprisingly, 65% of contract teachers complained regarding
about low and irregular salaries as opposed to a small proportion (13%) of regular teachers.
Table 4.13 Teachers’ Satisfaction with Level and Regularity of Pay in UP Schools
(per cent)
Proportion of teachers who
said
Permanent Contract All teachers
that their salary is low /
irregular
12.9 64.7 35.9
Based on interviews with Class 3 and Class 7 teachers in sample schools
Source: CORD Survey 2011-12
One of the negatives pointed out by the teachers was posting to rural / difficult to access areas
or issues of safety. This was expressed more by Class 7 teachers, perhaps reflecting that all the
Class 7 teachers interviewed were regular teachers rather than local teachers. A lower

136
proportion of Class 3 teachers interviewed had these concerns reflecting the higher proportion
of local teachers among the Class 3 teachers. A complaint on the part of teachers was lack of
cooperation from panch members / parents in the village. Teachers said that parents were
uncooperative, especially at the time of uniform and books distribution. A higher proportion of
Class 7 teachers complained about such a lack of cooperation.
Table 4.14 Accessibility of Schools a Problem for Some Teachers in Government Schools in UP
Proportion (%) of teachers who reported
problems with being posted:
Class 3 Class 7 Class 3/Class
7 teachers
in difficult-to-access rural areas 11 18.5 13.6
in areas where there are issues of safety 5.0 11.1 7.1
In villages where they had little
cooperation from panch members /
parents
13.0 25.9 17.5
Based on interviews with Class 3 and Class 7 teachers in sample schools
Source: CORD Survey 2011-12
4.6 Completion of curriculum
Teachers are responsible for completing the curriculum on time.66
However they face several
hurdles in this. The reasons, as we can see, include student irregularity and that students find it
difficult to understand the coursework (reported by 43% of primary schools and 32% of upper
primary schools). This goes with the poor student attendance noted in section 4.3. In addition
to this, important reasons for non completion of curriculum were the lack of adequate teachers
and deployment of teachers for election and census duties (reported by 25% of primary schools
and 50% of upper primary schools). These activities aggravate the situation of teacher shortage.
Late arrival of textbooks was cited by one third of the teachers. Schools being closed due to
extreme weather conditions was also cited by a number of teachers.
Table 4.15 Problems faced by School Teachers in Completing Curriculum on Time in
Government Schools in UP
Proportion (%) of teachers: Class 3 Class 7 Classes 3 and 7
who reported that they face problems in
completing the curriculum on time
64.0
70.4
66.2
Who cited the following reasons for this:
Students irregular/students do not understand 43.0 31.5 39.0
Late arrival of textbooks 33.0 29.6 31.8
Poor infrastructure, insufficient teaching staff,
non teaching duties
25.0
50.0 33.8
School closed due to extreme weather
conditions/natural calamities 19.0 24.1 20.8
66
The RTE, Section 9 (i) makes the local authorities responsible for ensuring timely prescribing of curriculum and
courses of study for elementary education.

137
Based on interviews with Class 3 and Class 7 teachers in sample schools
Source: CORD Survey 2011-12
4.7 Meetings with guardians
Section 24 (I) (e) of the Act states that teachers must regularly hold meetings with parents and
guardians and appraise them about the regularity in attendance, ability to learn, progress made
in learning and any other relevant information about the child.
Table 4.16 Parent-Teacher Meetings for Monitoring Child’s Progress in UP Schools
Proportion (%) of teachers who said
they have
Class 3 Class 7 All teachers
interviewed
Regular meetings with parents to
inform them about their child’s
progress
76.0 75.9 76
They keep records of such meetings 71.1 75.6 72.6
They have received government
order with regard to such meetings 55.0 56.6 55.6
Based on interviews with Class 3 and Class 7 teachers in sample schools
Source: CORD Survey 2011-12
76% of both class 3 and 7 teachers stated that they regularly met parents to update them on
their child’s progress. 71% of class 3 and 75.6% of class 7 teachers kept records of these
meetings and around 55% of both teachers had received government orders regarding the
same. However, parent meetings are not a new phenomenon and many of them said they had
got orders for this much before 2011. Some (about 40 teachers) did mention that they were
told in late 2011 through oral orders from the BRC or had been informed of this during their
RTE training.
4.8 Non teaching duties
Table 4.17 Non-Teaching Duties of Teachers in Government Schools in UP
Proportion (%) of teachers who were
involved in following activities during
the previous academic year 2010-11
Class 3 Class 7 All interviewed
teachers
Election 48 56.6 51
Census 58 73.6 63.4
Polio 40 35.9 38.6
Disaster relief 0 0 0
Others (Board examination duty, TET
evaluations, Sakshar Bharat scheme) 14 15.1 14.4
Based on interviews with Class 3 and Class 7 teachers in sample schools
Source: CORD Survey 2011-12

138
Teachers were asked what non teaching activities they were involved in during the last
academic year. Section 27 of the Act states that no teacher shall be deployed for any non
educational purposes other than the decennial population census, disaster relief duties or
duties relating to elections to the local authority or the State Legislatures or Parliament.
Most of them reported to be involved in the ‘legitimate’ functions of election and census
duties. However the survey did not find out whether this was done during school hours or on
weekends/holidays. Out of the class 3 teachers, 58% were sent for census duties, while 74% of
class 7 teachers were sent for the same. Some of the teachers said that they were also sent on
BLO duty. Only a handful said that they did other duties such as examination invigilation,
literacy surveys and so on.
SECTION 5. GUIDELINES FOR TEACHERS FOR TRANSACTING THE CURRICULUM
5.1 How teachers interpret RTE guidelines for transacting the curriculum
The provisions specified in the RTE Act include all round development of the child; building up
child’s knowledge, potential and talents; development of physical and mental abilities to the
fullest extent; learning through activities, discovery and exploration in a child friendly and child
centred manner; making the child free of fear, trauma and anxiety and helping the child to
express their views freely.
Table 5.1 Training of Teachers to Incorporate a Different Perspective of the Child and of
Education
(per cent)
Proportion of teachers who had training Class 3
teachers
Class 7
teachers
Class 3 / Class 7
teachers
in conducting curriculum according to
provisions which included ensuring all round
development of the child.
78.0 81.5 79.2
Based on interviews with Class 3 and Class 7 teachers in sample schools
Source: CORD Survey 2011-12
About four fifths (80%) of class 3 and class 7 teachers stated that they had received training in
teaching keeping these parameters in mind i.e. ensuring a child’s all round development and
making them children learn through activities, discovery and exploration in a child friendly and
child centered way.
Using TLMs, stories and play-way methods, and being friendly and encouraging to children are
the most common methods that UP teachers interpret as teaching in a child-centred and child
friendly manner. For instance, some teachers say that “Some children understand and some
don't - we explain with pictures when they don't”, “Along with book knowledge, I teach with

139
natural objects around them”. Another said they use sports, stories, music, poems etc. “First I
teach them and make them understand. If they don’t understand, then I take different
examples related to that subject and use charts also”, elaborated another teacher. Teachers
said they try and encourage children and be friendly in various ways. “I use playway methods;
encourage the children to come daily and understand what is being taught”, says one. “Make
students understand, never beating them if they don’t have the right answer”, is the meaning
of being child friendly for another. “First I try to understand their level and then teach with
affection and compassion”, says another. ‘Remove their fear or attract children towards
studying’ was also a common response for child-friendly teaching.
Teaching according to children’s interest or mood; and explaining repeatedly and simply are
also two approaches which teachers say they use often. “I teach as per children's interests so
that they pay full attention to studies”, “I teach only if the children want to study. I try to create
the right ambience first. I adopt a friendly attitude”, says another. The last example is actually
illustrative of many similar answers given to other methods as well. Many teachers say that
they teach when children are in the mood, or tell them stories or poems if they are not in the
mood to study. For instance, teachers gave answers such as “When children are shouting or
disrupting the class, I ask them what they want to learn and teach them on that”, “I write
something on the blackboard and say to the children that I am not going to ask questions,
rather the children have to ask what they haven't understood”, “When I find that students have
no interest in studying, I focus on TLMs like charts, pictures, GK related to the subject
concerned”. One teacher mentioned, “I make them do various activities - I take them for picnics
in the forest where it is very peaceful. I teach them there”.
Teachers suggested the use of activities such as sports and PT, and music, dance, excursions
etc. as a means to ensure all round development. Some reported organizing bal sabhas and
competitions. Teachers also felt that all round development included telling children the
importance of cleanliness and teaching them social skills and values.
Overall, teaching through TLMs or activities, teaching as per children’s interests or based on
their ‘mental level’, explaining well, removing fear from children are common methods
teachers report across the board. A few teachers do suggest teaching methods that engage
with the children’s environment, that encourage question answers sessions and discussions, or
teach through practical applications. These are also methods that engage higher order thinking
skills of students. They are a positive sign but more of such responses will be welcome.
It should be noted that there is no mention of the rights of children or the attempt to focus on
children from backward communities or on girls. The difference between children’s levels is
acknowledged but as a consequence of their abilities not their background. There are no
proactive responses from teachers that they try and include children from all communities.
Inclusion is limited to helping weaker children and in few cases, encouraging shy children to
speak. This is of particular consequence in that the RTE Act requires that teachers transact the
curriculum in line with upholding the values of the Constitution.

140
5.2 Teaching practices reported and observed
Apart from these open ended questions on how they implement various approaches specified
by RTE, teachers were also asked which of the teaching activities below they did in class. Most
Class 3 teachers (more than 70%) reported that making children read, making them recite the
alphabet or numbers, poems or rhymes or making them copy from the board or from textbooks
were common teaching activities they did with children. Only a few (less than 30%) reported
using more creative ways of teaching. Class 7 teachers also reported ‘making children read’ and
‘asking them to copy from the board / textbook’ as common methods of teaching (in more than
85% of cases). But Class 7 teachers also had ‘class discussions or question-answer sessions’.
Based on the class observations, this usually means that teachers simply ask questions from
children one by one or do a round of few questions based on earlier topics taught.
Apart from their teaching methods teachers were also asked how they deal with situations in
which a child does not understand something the teacher has taught. Of the options given (see
Table) most teachers (93-94 percent) said that they explain to the child again, in some cases
with examples, or sometimes individually. Two other common responses were: telling the child
to read from the textbook or ask the child to take the help of another child. Teachers also said
they use the method of ‘asking related questions from the same child’ so as to explain. This was
preferred much more by Class 7 teachers (56% against 45% for Class 3 teachers). As can be seen
from the table, very few teachers reported scolding the child in such a circumstance. These too
were mostly qualified as “mild scolding”.
Table 5.2 Methods Used by Teachers for Explaining Lessons in Government Schools in UP
(per cent)
Proportion of teachers who said they use
the following methods to explain to
students who have not understood what
has been taught
Class 3 Class 7 All teachers
interviewed
Explain again with examples/Explain
individually 93.0 94.4 93.5
Tell the child to read from the textbook 44.0 57.4 48.7
Ask the child to take the help of another
child 42.0 37.0 40.3
Ask other related questions from the same
child 45.0 55.6 48.7
Scold the child 5.0 3.7 4.6
Based on interviews with Class 3 and Class 7 teachers in sample schools
Source: CORD Survey 2011-12
The common activities that teachers were observed to be doing in class were reading from the
textbook, asking questions from students, writing on the board, and explaining. Often these
were done together and a majority of teachers reported were seen explaining. Of course, in

141
quite a few cases this involved explanation at individual level, as part of checking notebooks or
solving a ‘weaker’ child’s confusion.
Teaching aids were observed to be used in any class in a minority of schools, although as we
note when discussing infrastructure and facilities in the schools, nearly all schools had teaching
aids.
Table 5.3 Use of teaching aids observed in Government schools in UP
(per cent)
Proportion of schools where:
Primary schools Upper primary
schools
All
schools
teaching aids observed to be in use in
any class during the time of the visit
12.0
10.9 11.6
Based on survey of sample schools
Source: CORD Survey 2011-12
The study found that only in 9% schools (14 schools) was any form of sports activity observed.
Kho-kho and cricket were the common games, apart from badminton, pithu, skipping rope,
racing. Counting games were seen in two schools and bal sabha was held for 2 hours in another.
Children from classes 1,2 and 3 in one school were playing antakshari and singing songs, while
Class 4 and 5 students played kho. Examples of organized sports activities include Class 6, 7 and
8 boys playing cricket while girls were played badminton for 45 minutes; classes 4 and 5 playing
cricket while classes 1, 2 and 3 spent time skipping; classes 4 and 5 students playing kho while
classes 1, 2 and 3 raced between themselves for 30 minutes; classes 6,7 , 8 girls playing pithu
and skipping for 20 minutes; Classes 4 and 5 playing kho and kabbadi and class 1-3 students
playing the ‘Bol Bhai’ game.
5.3 Methods of controlling / disciplining children
The Act requires that children do not experience mental harassment or corporal violence in
school. In this context, teachers were asked about how they controlled / disciplined children.
Only a minority of teachers in UP said that they shout at children to control them (19%). The
proportion was comparatively higher with older children – 26% of Class 7 teachers in contrast
to 15% of Class 3 teachers. Few teachers said they threaten the children (3%). Only one Class 7
teacher actually admitted beating the children.
Table 5.4 Methods Used to Discipline Students as Reported by Teachers in Government Schools
in UP
Proportion (%) of teachers who said they use the
following measures to control/ discipline students
Class 3 Class 7 All
Shout at them 15.0 25.9 18.8
Threaten them 3.0 3.7 3.2
Beat them/Hit them 0.0 1.9 0.6
Others (Motivate them to be cooperative) 85.0 77.8 82.5

142
Based on interviews with Class 3 and Class 7 teachers in sample schools
Source: CORD Survey 2011-12
A majority of teachers from both classes 3 and 7 said that they use various kinds of gentler
means to control or discipline students. Most of them said that they explain to children gently
and motivate them to behave well. Some said they try to communicate the value of discipline;
some give examples of great people. Teachers also said that they try and keep children busy by
giving them some work or reading a poem or something of their interest. One option was to
give children prizes to motivate them. One teacher said that if he is not able to control the
child, he contacts the parents. A few teachers ask the rest of the children to suggest a
punishment for the child who is being naughty.
Table 5.5 Methods Used to Discipline Students by Teachers as Observed in Government Schools
in UP
(per cent)
Proportion of teachers who used the following
methods to discipline students (as observed by the
survey team)
Class 3 Class 7
Teacher corrects non-abusively 92.2 93.0
Reprimands abusively 5.6 2.3
Physical forms like kneeling / holding ear / murga /
putting hands up 1.1 4.6
Beating/caning students 3.3 0.0
Options not mutually exclusive
Based on survey of sample schools
Source: CORD survey, 2011-12
During observation for one period in the school day, in agreement with what they claimed,
most class 3 teachers were found to be correcting undisciplined children gently. Ten percent of
teachers were using some form of abusive reprimanding or actual physical punishment.
Interestingly the reasons were similar to those where the teachers had chosen to not be
abusive -- children making a noise, looking here and there, not reading the book or not sitting
properly. Even fewer Class 7 teachers were found being abusive or punishing children for being
undisciplined. In one classroom, children were being naughty so the teacher punished them by
making them put their hands up. In another case the teacher scolded them strongly when they
did not become quiet after 2-3 warnings.
It appears that teachers have internalized the requirement of RTE that there should not be
corporal punishment. Both in their words and in their behavior while the team was in the
school, only a minority of teachers were harsh with the children when they needed to discipline
them.

143
5.4 Assessment: Use of Comprehensive and Continuous Evaluation
The Act requires that there should be comprehensive and continuous evaluation of a child’s
learning, and his / her ability to apply the same. Only a small proportion of Class 3 and Class 7
teachers (22% and 31.5%, respectively) said that they were using CCE. The state government
was reportedly piloting CCE in some schools. It could be that these schools were part of that
scheme. Most Class 3 and Class 7 teachers (85% and 93%, respectively) responded that they
conduct exams as a means of assessing a student’s progress. These varied from annual to half
yearly to quarterly examinations. In addition to this, 82% of Class 3 and 70% of Class 7 teachers
said that they conduct either written or oral unit tests for assessment. Seen together the tests
and CCE included either monthly or weekly tests. Often tests or exams were held on a particular
day of the week, such as Monday or Saturday. Oral assessment was also conducted by quite a
few teachers regularly in the form of questioning students on the previous day’s lesson. There
was generally a lack of clarity on the meaning and components of CCE which makes it difficult
to determine how many teachers and schools are carrying out this method of evaluation.
Table 5.6 Assessment of Children’s Progress by Teachers in Government Schools in UP
(per cent)
Proportion of teachers who take the following
assessments into account to assess the children’s
overall progress
Class 3 Class 7
Examinations (half yearly/final) and quarterly 85.0 92.6
Unit tests – written or oral – monthly, weekly, daily 82.0 70.4
Continuous and Comprehensive Evaluation CCE –
tests and other methods
22.0 31.5
Based on interviews with Class 3 and Class 7 teachers in sample schools
Source: CORD Survey 2011-12
The UP State Rules [19(e)] stipulate that teachers ‘shall maintain a file containing the pupil
cumulative record for every child to check child’s understanding of knowledge and his or her
ability to apply the same and for continuous evaluation, and on the basis of which shall award
the completion certificate’.
As a part of CCE, teachers are expected to maintain pupil files to keep a record of the
performance of students. A small proportion of teachers (30 Class 3 and 17 Class 7 teachers)
reported that they had received government orders to maintain pupil files. It was found that
most of the teachers had either received oral orders regarding the maintenance of pupil files or
had been informed about it during their RTE training. Very few had received written orders. A
majority of the teachers said they received orders in 2010 or earlier or that they are simply
continuing an older system. This indicates that teachers may be referring to the regular student
record file that exists from before. Only few teachers specifically referred to being told during
their RTE training session or during BRC meetings in late 2011 about maintaining pupil files. In
some instances the orders were received fairly recently so the files hadn’t been made yet.
Teachers said they were yet to make them or were awaiting further orders. Only 23 Class 3 and

144
15 Class 7 teachers actually reported maintaining pupil files. Additionally, only 16 Class 3 and 13
Class 7 teachers reported showing them to parents. The team did not see any pupil files.
Table 5.7 Methods Used by Teachers for conducting CCE in Government Schools in UP
Number of teachers who Class 3 Class 7
Maintain a file to record the performance of
each pupil 23 15
Show the pupil file to the parents 16 13
Have received any government order about
maintenance of Pupil Files 30 17
Based on interviews with Class 3 and Class 7 teachers in sample schools
Source: CORD Survey 2011-12
The Government of UP was reported to be piloting CCE on a small scale. It was being
undertaken in 5 schools in each of 5 districts. Special Classes were being run in which 50,000
children were reported to be admitted.
5.5 Teachers’ feedback on RTE guidelines
Several teachers shared a range of problems that they face in teaching in general and in
implementing the above approaches. Many of the problems they shared were quite real and
reflect the situations teachers face in rural schools particularly with teaching first generation
learners. It is extremely important to discuss these concerns during future training
programmes.
Teachers said that it is tough to explain to some children who are slow to understand and need
separate attention; children also often forget what is taught. “The children forget after some
time and we have to repeat several times”, “Children’s home and school environments are very
different. They do learn when we teach but they forget at home and the family is not able to
help”. “Even after trying to include all children while teaching, some don’t understand. If we
insist too much, they stop coming to school; it is not possible to include fully each and every
child”, were some of the problems teachers brought up when discussing the inclusive and more
interactive teaching methodologies required by RTE.
Teaching children at different levels of learning was a considerable challenge. One teacher
spoke of the problems of multi-grade teaching which “required special attention to be paid
separately to each grade”. Within a class, teachers faced problems handling children at
different levels of learning.
Problems with using activities, discovery and exploration to teach: The most common response
teachers gave was that it is difficult to explain to children. “When we use flash cards, children
recognise pictures but not the alphabet”, shared one teacher. I have problems making the
children understand because with some objects, they just keep looking at them and forget the
lesson.”

145
Activities take time and due to them the syllabus does not get completed, said some teachers.
A few teachers also said that they face problems because children are irregular or come late
and lament the lack of support from parents in sending children to school regularly. Teaching
through discovery and exploration does not work with children who are irregular. Another
teacher stressed that learning through discovery is only possible for a few topics.
Some teachers struggle with the need to use activities and to teach in an anxiety free
environment. They feel that students get distracted by activities and want to play or that it is
tough to discipline children and sometimes they need to be scolded. “When children don't
listen, we have to scold them,” they said. “Some children cannot learn unless they are
threatened. With different activities, children do learn faster but the whole class becomes a
mess and it is very time consuming.” “When I am teaching, I keep a cane to scare the children.
If I use child-centric methods, I will not be able to finish the curriculum. I have to leave the weak
students behind and move ahead.” One teacher said that with the new approaches that RTE
suggests, “children become more and more curious and it becomes difficult to answer their
questions”!
Expressing distress with the RTE, a teacher said “I was told during the training that we cannot
take any tests. Without tests, we cannot know what progress the child is making, and the child's
interest in studies becomes less.” “Children are now aware that teachers cannot beat them so
some children don't listen”, said another teacher.
These views indicate that these teachers are going beyond lip service and actually trying to
understand the concepts of all round development and teaching through activity, discovery and
exploration in a child friendly and child centered way. But they need to be convinced of the
rationale behind these changes of they will implement them poorly at most. The teachers also
need more clarity in how best they can put these concepts into practice. There is a lot of
natural resistance to new methods, and a feeling that the old ways are the best, particularly
with regard to policies such as prohibiting corporal punishment.
SECTION 6. ACCOUNTABILITY IN THE SCHOOL SYSTEM
The Act envisages a system of decentralized planning. To this end, it outlines the duties of the
teachers in the school with regard to being regular and punctual themselves, completing the
curriculum, and ensuring that children attend school regularly, and in schools above a certain
size, it provides for a head-teacher to play a supervisory role. The teachers and head-teacher
are to be monitored and supported in these duties by a School Management Committee, with
the head-teacher being a member of the Committee. SMCs were required to have several other
important duties which included supervising special classes for children who have never been
enrolled / dropped out, monitoring school expenditure, making of the annual School
Development Plan and to be the first stop if anyone had any complaints about the working of
the school. The Act also envisages a role for a member of the local body to play a role in
monitoring school attendance of all children (under the age of 14 years) in the village, to ensure
that none are out of school and that those who are in school attend regularly. In this section,

146
we focus on the role of the head-teachers and the SMCs. The sarpanch as representatives of
the locally elected bodies were reportedly not active in keeping records of all the children in the
village and ensuring that they were in school. The team was informed that in many cases the
head teacher and the sarpanch were working together to manage the funds coming into the
school.
6.1 Role of head teachers
We asked heads what they do in cases where teachers default on any matter. A high proportion
of them (73%) reported that they simply speak with the teachers concerned. A small proportion
(27%) chooses to complain to higher authorities. Hardly any head teachers (5%) reported that
they take disciplinary action under service rules. The SMCs are asked to intervene only in a
negligible 7% of cases. In 15% of schools, the respondents report that they take no action.
Table 6.1 Disciplinary action taken by Head Teachers against Teachers in Government Schools in
UP
(per cent)
When asked about the disciplinary
action taken against errant teachers,
the proportion of Head Teachers who
reported that they:
Primary Upper primary All schools
Speaking to the teachers concerned 76 64.1 72.6
Complaining to the higher authorities 27.1 25.6 26.7
Taking action under service rules 4.2 7.7 5.2
Taking up the issue with the SMC 6.3 7.7 6.7
Others 2.1 0 1.5
Taking no action 13.5 18 14.8
Options not mutually exclusive
Based on survey of sample schools
Source: CORD Survey.
We got a similar response when we asked heads of schools, how they ensure that teachers
come on time. The RTE entrusts the duty of monitoring teachers punctuality and regularity to
the school’s Education Committee and further to the local authority. The daily management of
this issue however, is still a concern for the Head teacher.
A substantial proportion (24%) of respondents simply said that the need to ensure regularity
has not arisen implying that teachers are themselves regular. Some (21%) said that they prefer
to simply set a standard by themselves coming on time. The largest group (36%) said that they
verbally ask teachers to come on time. A few make the teachers sign a register. Barely anyone
spoke of complaining to the education authorities. This indicates that hardly any formal steps
are taken by heads to ensure teacher regularity.

147
Table 6.2 Appointment of Head Teachers in Government Schools in UP
(per cent)
Proportion of schools in UP in which Primary schools Upper primary
schools
All schools
HT appointed 83.2 81.0 82.4
HT appointed and present 61.4 63.8 62.3
HT appointed and not present 21.8 17.2 20.1
Teacher in charge present; HT not
appointed 14.8 17.3 15.7
No teacher in charge; HT not
appointed 2.0 1.7 1.9
100 100 100
Based on survey of sample schools
Source CORD survey 2011-12
Head teachers in the UP schools were appointed in a high proportion of the sample schools
(82%). In 62% of the schools the head teachers were appointed and present so there was a
clear established line of authority in these schools.
6.2 Role of the School Management Committee
The RTE Act requires the setting up School Management Committees – Chapter IV, Section 21.
Information was collected on the working of SMCs through interviews with the head teacher
and interviews with a key functionary of the SMC. Some information was also collected from a
panch member.
Formation and composition of SMCs: A notification issued on June 2011 mandates the setting
up of SMCs in UP. It lays down the composition of the SMC as well. The HTs reported that SMCs
required under RTE were formed in over 90% of the schools in UP, and that in 10 schools, the
earlier VECs were still continuing. It appears that the SMC members had been nominated rather
than elected.
Table 6.3 Setting up of Education Committees in Government Schools in UP
(per cent)
Proportion of schools where
Primary schools Upper primary
schools
All schools
SMC was formed 93.0 94.5 93.5
SMC was not formed 7.0 5.5 6.5
Based on survey of sample schools
CORD survey 2011-12
More than half the SMCs appeared to satisfy some of the membership norms. 94% of the SMCs
had 15 members – out of which most had 11 parent members and 6 to 7 female members.

148
Most (87.2%) SMCs had around 75% parent members. However a much lower proportion of
SMCs had at least half female members – 57%. Proportionate representation of disadvantaged
groups and weaker sections is also required, but the study was not able to ascertain this in a
short interview with a single member.
Table 6.4 Composition of Education Committees in Government Schools in UP
Proportion of SMCs with Percent
75% parent members 87.2
at least 50% women members 56.7
Based on interviews with members of education committees
CORD survey 2011-12
The State Rules for UP mandate that the members of the SMC must meet at least once a month
and make their records public. However, we find that these meetings are quite irregular. Only
54% of the SMCs reported that they had been meeting once a month. In the case of most SMCs
(81%) though, more than half the members were reportedly present at the last meeting.
Table 6.5 Regularity of Meetings of Education Committees in Government Schools in UP
Proportion of SMCs which report that Per cent
They meet once a month 53.5
More than half the members attended the last meeting 80.6
Based on interviews with members of education committees
CORD survey 2011-12
The newly formed SMCs reported that they had had an SMC meeting in the previous two
months. However, it was found that many of them were not informed about their roles and
responsibilities. Only in a few cases (8%) did they report having received a government
document detailing this – see Box on “SMC Training Module” prepared by the UP Government.
School Management Committee Training Module: Uttar Pradesh
The Education Department of UP completed the SMC module in early 2012. The UP SMC
Training Module is divided into several sections: rights of children, duties of teachers, duties
of the school and SMC’s composition and functions. It begins with an introduction about RTE,
stating the norms laid down in the Act. It then goes on to state basic guidelines for the
schools such as teaching science, social science and languages to students, if the strength of a
school exceeds 200 students, then there must be a head teacher and one teacher per forty
students, etc. It also mentions the various schemes initiated by the government in the
promotion of education, such as the free textbooks scheme.
The Module reiterates most of the norms laid down in the Act, such as provisions for clean
drinking water, a proper boundary wall, separate toilets for boys and girls, etc. which the
SMC is also expected to ensure.

149
According to the Training Module, an SMC must be formed every two years. Some of the
functions of the SMC mentioned in the Training Module are laid out as follows:
i) the SMC must make an effort to enroll out of school children from the
neighbourhood
ii) the SMC must maintain records of all students between 6-14 years
iii) ensure no discrimination of students
iv) must inform people about the RTE and its provisions
v) ensure that teachers do not engage in any non-educational work, apart from
work related to the population census, election and disaster relief.
vi) The SMC must come up with a School Development Plan for a period of three
years.
The Training Module lays down a list of observations to be made by SMC members when they
visit the schools. This includes checking the attendance records, progress of the students and
curriculum, etc. The Module consists of guidelines on how to prepare for and organize
meetings through cooperation and coordination between various departments. There is also
a brief on how to formulate the School Development Plan.
It has an interesting section on how the SMC members can evaluate the progress of
children’s education. There are certain points listed as the basic minimum knowledge that
students from each class must possess.
A larger module and a small booklet have been designed. While their content is in line with
the RTE, it is not too interactive.
Functioning of SMCs: A large proportion of SMCs (40%) said that they tried to ensure teacher
regularity and punctuality. Details about the methods used show that 29% reported that they
check the number of teachers present and a few reported that they check the register or
recorded time of arrival or departure. The majority used informal methods. Several
respondents said they live near the school and drop in to check and enquire on the attendance
of teachers. The head-teachers also confirmed this role of the SMCs (see Table 6.8).
Table 6.6 Functioning of Education Committees in Government Schools in UP
Proportion of Education Committee members who said that they per cent
have received a government document defining roles and responsibilities 8.0
monitor provision of infrastructure, equipment, MDM and textbooks 50.6
monitor teacher regularity and punctuality 40.3
monitor children’s attendance 34.5
ensure admission of out of school children and CWSN 31.0
monitor school expenditure 20.7
are involved in developing School Development Plans 25.3
Note. Options not mutually exclusive.
Based on interviews with members of education committees
CORD survey 2011-12

150
Only one third of the SMCs (35%) said that they monitor children’s attendance. While a few said
they did it by counting the children or looking at the register, here too informal methods
through school visits were reported to be used. The head-teachers saw this as one of the most
important areas in which the SMCs play a role (see Table 6.7).
While SMCs have been mandated to ensure the enrolment and continued attendance of all
children from the neighbourhood, very few respondents said that their village had out of school
children. Only 31% reported that they actually motivate parents to enrol children who have
never enrolled and to send them regularly. More respondents talked about identifying CWDs
and motivating them to go to school. Here too they talked about incentives and sometimes
special schools. None of the SMC members spoke about Special Training for older children who
needed to be mainstreamed into age-appropriate grades. This is also an area they are supposed
to take a keen interest in. SMCs will have to develop the skills of educationists if they are
supposed to guide and monitor such a difficult area of implementation.
Very few of these respondents said that they monitored school expenditure (20%) – primarily
through checking accounts and being involved decisions on items of expenditure. Involvement
in making of School Development Plans was also quite low – and it largely involved identifying
additional infrastructure and equipment required. Both these roles would require some
financial and management skills, in addition to having the confidence to work with the head-
teacher on these issues.
However when head teachers were asked whether SMCs supported their work in any way,
around one-fourth said they did not. Of those who did, the largest proportion (71.8%) said they
helped in ensuring children’s regularity. This is interesting in the light of the relatively low
student attendance at the time of the survey. A significant proportion (39%) said the SMCs
supported the school through facilitating the provision of infrastructure and equipment; and
32% of the heads also said the SMC supported them when parents did not cooperate with
them.
Table 6.7 Support received from Education Committees as reported by Head Teachers in
Government Schools in UP
When asked of the ways in which the SMCs support their work, proportion (%)
of Head Teachers who said
Per cent
They have received support in the following way*
Ensures children’s regularity 71.8
Facilitates provision of infrastructure and equipment 39.1
Supports in case of non-cooperation by any parent 31.8
Ensures that teachers are not given non-academic duties 6.4
They are not supported in any way 28.3
*Options are not mutually exclusive.
Based on survey of sample schools
CORD survey 2011-12

151
When asked about the ways in which the SMCs help monitor school functioning, around one
third said they do not play a monitoring role. Among the rest, most of them (81%) said that the
SMC members note regularity and punctuality of teachers. Nearly 60% said that SMC helped
monitor distribution of entitlements like textbooks.
Table 6.8 Monitoring by SMC as Reported by Head Teachers in Government Schools in UP
When asked of the ways in which the SMC monitors school functioning,
proportion of Head Teachers who said Percent
Does not monitor in any way 33.5
Monitors in the following way
Notes regularity / punctuality of teachers 81.0
Facilitates provision of free textbooks to all children 59.0
Ensures that there is no discrimination in the school (against CWSN / SC / ST
/ BPL) 21.0
Notes denial of admission 16.2
Ensures that no child faces mental harassment or corporal punishment in
the school 10.5
Responses not mutually exclusive
Based on survey of sample schools
CORD survey 2011-12
Grievance redressal: As the State Rules have mandated, SMC should ensure that teachers of the
school must hold regular meetings with parents and guardians and appraise them about the
progress made in learning and any other relevant information about the child. The UP State
Rules also specify that the first grievance redressal of teachers shall be at the SMC level.
However, only 11 out 102 SMCs reported to have received any complaints or grievances from
teachers. 93% of SMCs reported that they hadn’t received any complaints from parents
indicating that the SMCs don’t yet function in a way that anybody seeks redressal through
them.
The Act states that while SMCs are the first redressal mechanism, they can further take forward
complaints to local authorities if the need arises. While very few complaints were forwarded to
higher authorities, the lack of timely provisions of entitlements was one issue that was.
Summing up, the study found that SMCS were formed in most schools. The composition is as
required in terms of parents but not in terms of women. To what extent the SMCs include the
specified proportion of disadvantaged groups could not be ascertained. The SMC members
interviewed are not very well informed about their roles and their activities. According to these
interviews their role is most important in providing infrastructure and distribution of
entitlements. Some said they do monitor teacher regularity and student attendance – but

152
usually through informal methods. There is no system in place to ensure that they are able to
improve attendance levels.
More than two thirds of the head teachers said that the SMC monitors school functioning and
supports them in their work. According to them the SMCs play an important role in monitoring
student and teacher attendance – suggesting that informal methods have some impact
according to them. Provision of infrastructure and monitoring distribution of entitlements was
reported to come next in terms of the importance of the role the SMCs play.
SMC involvement was reported to be very low in monitoring school expenditures, making the
School Development Plan,67
and in facilitating Special Training for out of school children who
have been enrolled in age appropriate grades. The first two would require some financial and
management skills, and some level of empowerment of members of the SMC to allow them to
be a part of the decision making around the finances. The latter would require some
understanding of curriculum and how learning takes place. The RTE Act seems to give SMC
members some responsibilities they are not prepared for.
The specific tasks they reported dealing with were mostly related to improvement of
infrastructure and provision of incentives, both tasks which the education committees have
been handling under SSA. The largest number of respondents said they were involved in
monitoring provision of infrastructure, midday meals and distribution of textbooks and
uniforms. The midday meal was reportedly monitored through tasting the meal or enquiring
about its quality. Many of them said they ensure that textbooks and uniforms are distributed
properly. The role of the SMC in this area was also confirmed by the head-teacher when he was
asked how the SMC supports him in the school and how the SMC monitors the functioning of
the school.
A system for training was in place. Master trainers had trained Block Resource Persons, but the
training at SMC level had not begun. The state was awaiting additional funds from the centre.
6.3 Maintenance of records
Registers are required to maintain records of activities which can be used internally and
externally to monitor performance. Schools were asked whether they maintained registers on a
range of activities. Most schools had registers for information such as attendance and even
SMC meetings. Few had registers on parent teacher meetings or a complaints register.
67
The School Development Plan had to have the following details: estimates of classwise enrolment for each year,
and additional financial requirements including additional requirement of free textbooks for children and providing
special training facility to children.

153
Table 6.10 Registers Maintained in Government Schools in UP
(per cent)
Proportion of schools which maintain Primary school Upper primary
school
All school
Teacher attendance register 99.0 100.0 99.4
Admission register 96.0 98.2 96.8
Student attendance register 100.0 100.0 100.0
Incentive register 98.0 96.4 97.5
Mid day meal register 99.0 98.2 98.7
Fund register 65.3 57.1 62.4
SMC meeting register 91.1 85.7 89.2
Parent meeting register 38.6 39.3 38.9
Complaint register 19.8 19.6 19.7
Based on survey of sample schools
CORD survey 2011-12
SECTION 7 PRIVATE SCHOOLS IN UP
In this section, we look at non-government provision of schooling in UP. The issue of
compliance with RTE in UP cannot be completed without looking more closely at the
functioning of the private schools. Secondary data indicates that private schools play an
important role even in rural UP. We begin by looking at these trends, following which we look
at some features of government regulations for private schools in UP, before we discuss
features of the private schools we found in the sample villages.
7.1 Importance of private schooling in UP
Private schools play a very important role in the context of RTE as they account for a high
proportion of enrolment in elementary stages even in rural areas.
The table below presents the proportion of private school enrolment in rural areas according to
DISE 2010-11, DISE 2011-12 (provisional) and the CORD survey. The table indicates that private
school enrolment consisted of 33.5% of total enrolment at elementary stage in 2010 according
to DISE, and it shows a sharp increase to 38.2 %. The CORD survey shows a higher proportion of
enrolment in private sector – nearly 40%.
The table needs to be interpreted with caution. DISE data attempts to collect data from all
schools with elementary classes, but its coverage of private schools is not complete. Overtime
its coverage of recognized private schools has improved but not of unrecognized schools. So the

154
increase in enrolment in private schools between 2010-11 and 2011-12 may partly reflect a
better coverage of private schools. CORD survey, 2011-12 covers all schools in 102 villages –
and the proportion of private enrolment is larger at 40% -- very possibly because unrecognized
schools are covered.
Table 7.1 Enrolment in classes 1 to 8 in rural areas in Uttar Pradesh
Source Enrolment in classes 1 to 8 in Proportion enrolled
in private schools Government schools Private schools
DISE 2010-11 18785091 9477632 33.5
DISE 2011-12 (P) 18637264 11510883 38.2
CORD survey, 2011-
12
17587 11592 39.7
7.2 Regulation of private schools in UP
Partial recognition / temporary recognition / permanent recognition: Private schools in UP may
be granted recognition for a certain stage of schooling or for a certain subject.
After 1986, secondary and higher secondary schools with recognition in one subject were
allowed recognition in other subjects too, if unaided. However that process was stopped as it
gave rise to many irregularities. There was also an intervening period when upper primary
sections were recognized, and the schools were not allowed to run primary sections. This could
be the reason that DISE data indicates many private schools with only grades 6-8.
Recognition of schools can be temporary or permanent. Srivastava writes that “to obtain
recognition, schools had to comply with a number of state-set norms such as: minimum
enrolment; fee amounts; minimum number of teachers; teachers’ qualifications; and
infrastructure. Recognition for basic schools could be granted on a temporary basis in the first
instance if they did not fulfill all the conditions but complied with a minimum set standard.
Schools with temporary recognition were given a certain grace period during which they were
expected to fulfill all conditions and reapply for permanent recognition.” 68
Flourishing of unrecognized private schools reported: Many unrecognised private schools are
functioning in UP. Their students may do their Board exams through recognized private schools,
for an additional fee. Often one recognized school has many unrecognized branches. Some
unrecognised schools are reported to be popular because they promise good marks in the
Board examinations, by allowing copying. These schools are largely from grades 1 to 12, and
may or may not have good infrastructure.
68
Excerpted from Srivastava (2008).
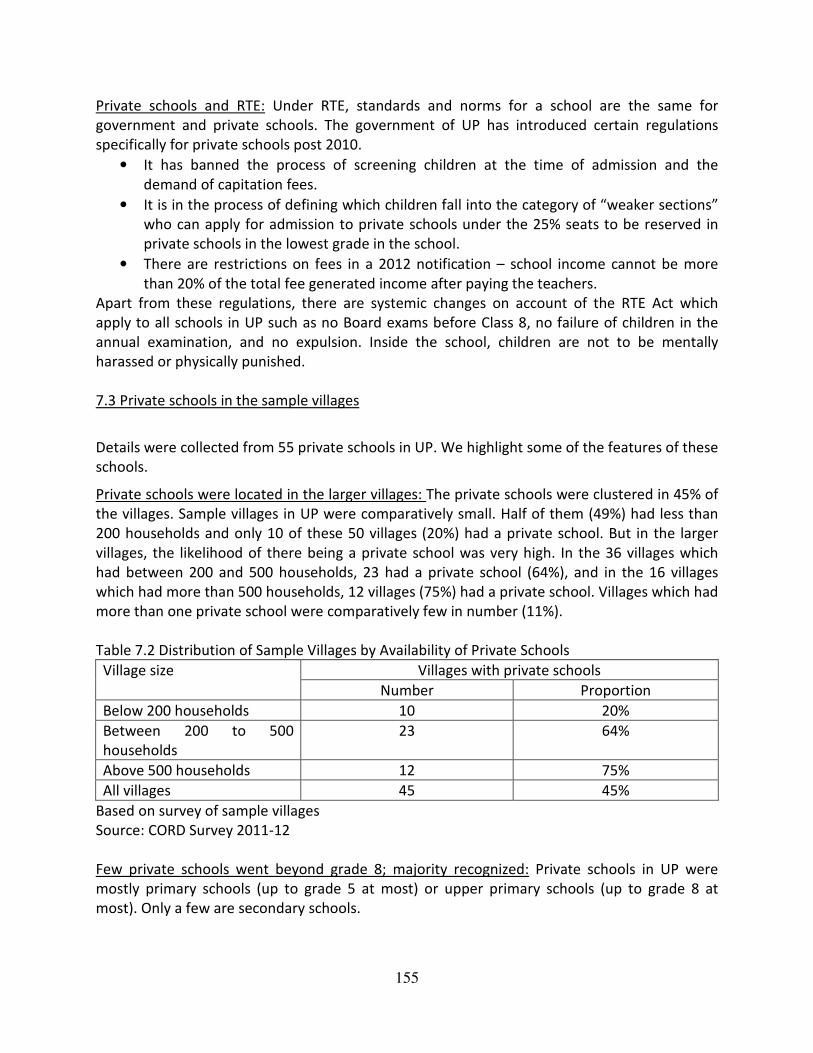
155
Private schools and RTE: Under RTE, standards and norms for a school are the same for
government and private schools. The government of UP has introduced certain regulations
specifically for private schools post 2010.
• It has banned the process of screening children at the time of admission and the
demand of capitation fees.
• It is in the process of defining which children fall into the category of “weaker sections”
who can apply for admission to private schools under the 25% seats to be reserved in
private schools in the lowest grade in the school.
• There are restrictions on fees in a 2012 notification – school income cannot be more
than 20% of the total fee generated income after paying the teachers.
Apart from these regulations, there are systemic changes on account of the RTE Act which
apply to all schools in UP such as no Board exams before Class 8, no failure of children in the
annual examination, and no expulsion. Inside the school, children are not to be mentally
harassed or physically punished.
7.3 Private schools in the sample villages
Details were collected from 55 private schools in UP. We highlight some of the features of these
schools.
Private schools were located in the larger villages: The private schools were clustered in 45% of
the villages. Sample villages in UP were comparatively small. Half of them (49%) had less than
200 households and only 10 of these 50 villages (20%) had a private school. But in the larger
villages, the likelihood of there being a private school was very high. In the 36 villages which
had between 200 and 500 households, 23 had a private school (64%), and in the 16 villages
which had more than 500 households, 12 villages (75%) had a private school. Villages which had
more than one private school were comparatively few in number (11%).
Table 7.2 Distribution of Sample Villages by Availability of Private Schools
Village size Villages with private schools
Number Proportion
Below 200 households 10 20%
Between 200 to 500
households
23 64%
Above 500 households 12 75%
All villages 45 45%
Based on survey of sample villages
Source: CORD Survey 2011-12
Few private schools went beyond grade 8; majority recognized: Private schools in UP were
mostly primary schools (up to grade 5 at most) or upper primary schools (up to grade 8 at
most). Only a few are secondary schools.

156
Table 7.3 Distribution of Private Schools by Classes Taught
Primary schools Upper primary schools Secondary/higher secondary
schools
Classes Number Classes Number Classes Number
0-2 1 0-8 16 0-9 1
0-4 1 1-8 8 0-10 1
0-5 11 6-10 1
1-5 11 1-10 1
1-12 3
All primary
Schools 24
All upper
primary
schools
24
All
secondary
schools
7
No.
recognized* 14
No.
recognized* 19
No.
recognized* 6
*Includes schools with partial recognition.
Grade 0 refers to children enrolled in the preprimary section.
Based on survey of private schools in sample villages
Source: CORD Survey 2011-12
As Table 7.3 shows, 31 schools (56%) had pre primary classes. It is commonly expected that
private schools have pre-primary grades and that it is an important factor which attracts
parents to enrolling their children in private school.
There were 39 schools (70.9%) which were recognized. Of these schools, 3 had partial
recognition. All but one of the secondary schools were recognized. Most of the upper primary
schools were recognized (19 out of 24), and a significant number of primary schools were also
recognized (14 out of 24). Sixteen schools were unrecognized. These were mostly primary
schools (10 out of 16).
There were 2 all girls’ schools. The rest were coeducational. All were day schools with the
exception of one which had hostel facilities. The duration of the school day was reported to be
5.5 hours in primary and upper primary schools and 6 hours in the secondary schools.
Procedure for selecting students did not appear to be affected by government regulations. A
large number of schools have an entrance test. In some schools, a test is carried out for all
grades, whereas in other cases, it varies with the grade. For example, in one school an oral test
for recognition of alphabets was done for entry at class 1, but written tests were done for
classes 2-5.
Majority of these private schools set up after 2000: Majority (72%) of these private schools
were established after 2000. Of these schools, a significant proportion (38%) came up in the last
5 years. The older schools were largely recognized -- only 1 school was not recognised. Most
schools set up between 2000 and 2006 were recognized too – though there are 3 unrecognised

157
schools in this group as well. Of the more recent schools, only 7 out of 21 were recognized. Of
the remaining, 2 claimed partial recognition, and as many as 12 were unrecognized.
Table 7.4 Distribution of Private Schools by School Type, Recognition Status and Year of
Establishment
Year established Primary
Schools
Upper
primary
schools
Secondary/H
secondary
schools
All
schools
Before 2000 Recognised 9 3 2 14
Part recognized 0 0 0 0
Unrecognized 0 0 1 1
All 9 3 3 15 (27.3%)
Between 2000
and 2006
Recognised 4 8 3 15
Part recognized 0 1 0 1
Unrecognized 3 0 0 3
All 7 9 3 19 (34.5%)
2007 to 2011 Recognised 1 6 0 7
Part recognized 0 1 1 2
Unrecognized 7 5 0 12
All 8 12 1 21 (38.2%)
All schools 24 24 7 55
Based on survey of private schools in sample villages
Source: CORD Survey 2011-12
Costs of private schooling: Table 7.5 gives the total amount charged annually to private school
students. For the same grade, Grade 5 for example, fees were much lower in recognized
primary schools (Rs 579) compared to recognized upper primary schools (Rs 991).
In addition to tuition fees, in some schools an admission fee was charged as well as exam fee.
Interestingly, in two schools if three children from the same family were enrolled, one of them
would not be charged fees. One school provided free transport for those coming from outside
the village.
Table 7.5 Annual Fees in Private Schools in UP
Recognized (39) Unrecognized (16) All Private Schools
Primary Schools
Class 1 472 558 495
Class 5 579 457 546
Upper-Primary Schools
Class 1 915 966 926
Class 5 991 1018 997
Class 8 1149 1168 1153
Secondary schools
Class 8 1292 NA 1292

158
Based on survey of private schools in sample villages
Source: CORD Survey 2011-12
Reduction of costs of schooling for children from disadvantaged groups / EWS: As part of a
government scheme to reduce the costs of education for disadvantaged groups, in a few
schools it was reported that some children receive an annual government scholarship69
of Rs.
300. Some schools reported that they charged no fees in the case of children whose families
had a BPL card / belonged to economically weaker families. They received no reimbursement
from the government for this.
High enrolment in primary and upper primary grades in recognized private schools: Private
schools have quite high enrolment, particularly the recognized schools. The partially recognized
schools have significantly lower enrolment than the recognized schools and the unrecognized
schools have significantly lower enrolment than the partially recognized schools.
Table 7.6 Average Enrolment in Elementary Classes in Private Schools in UP
Average
enrolment in
Recognized (36) Partially
recognized (3)
Unrecognized (16) All Private
Schools (55)
Primary schools 229.8 Missing 80.9 167.8
Upper primary
and secondary
schools
283.2 154.0 151.2 247.1
All 261.9 154.0 104.3 211.2
Based on survey of private schools in sample villages
Source: CORD Survey 2011-12
Enrolment in all types of private schools had a disproportionately high share of boys: The high
proportions of boys in private schools reflects the higher motivation that parents have for their
sons’ education relative to that of their daughters, as well as their inability to cover the costs of
sending all their children to private schools. The study found that government schools had a
slightly higher proportion of girls, reflecting the fact that more boys were being sent to private
schools.
69
SC, minority and OBC students in recognized private schools receive annual scholarships of Rs 300 and Rs 480 in
primary and upper primary stages of schooling, respectively. There is no income limit. Children from BPL families in
general castes are also entitled to this scholarship. These are given by the Social Welfare Department, Minority
Welfare and Department of Backward Classes. Local bodies have the responsibility of supervising distribution of
scholarships, and since 2007 the lists are available publicly on the UP Government website.

Based on survey of private schools in sample villages
Source: CORD Survey 2011-12
Comparatively lower proportions of children from SC and
One fourth of students enrolled at primary and upper primary levels were children from SC
families. The proportion of SCs enrolled in private schools is less than their proportions in the
population as a whole, whereas t
role of private schools in furthering social stratification should not be ignored. Childhood is a
time when strong bonds can be forged between children of widely differing social groups.
Based on survey of private schools in sample villages
Source: CORD Survey 2011-12
Less than one tenth enrolled were Muslims.
than the proportions in society as a whole. This is similar to the enrolment pattern in th
Girls
41%
Figure 7.7: Enrolment by Gender in Private
Schools in UP
25 0.6 8.7
0% 10% 20% 30%
Figure 7.8: Distribution of Children (%) by Social Group
Enrolled in Private Schools in UP
% SC
159
Based on survey of private schools in sample villages
Comparatively lower proportions of children from SC and Muslim families in private schools
One fourth of students enrolled at primary and upper primary levels were children from SC
families. The proportion of SCs enrolled in private schools is less than their proportions in the
population as a whole, whereas they were more highly represented in government schools. The
role of private schools in furthering social stratification should not be ignored. Childhood is a
time when strong bonds can be forged between children of widely differing social groups.
on survey of private schools in sample villages
were Muslims. The proportions of Muslims enrolled are lower
than the proportions in society as a whole. This is similar to the enrolment pattern in th
Boys
59%
Figure 7.7: Enrolment by Gender in Private
Schools in UP
65.7
40% 50% 60% 70% 80%
Figure 7.8: Distribution of Children (%) by Social Group
Enrolled in Private Schools in UP
% SC % ST % Muslims % Other Hindus
Muslim families in private schools:
One fourth of students enrolled at primary and upper primary levels were children from SC
families. The proportion of SCs enrolled in private schools is less than their proportions in the
hey were more highly represented in government schools. The
role of private schools in furthering social stratification should not be ignored. Childhood is a
time when strong bonds can be forged between children of widely differing social groups.
proportions of Muslims enrolled are lower
than the proportions in society as a whole. This is similar to the enrolment pattern in the
90% 100%
Figure 7.8: Distribution of Children (%) by Social Group

160
government schools. Large proportions of Muslim children are enrolled in madarsas at primary
level. By upper primary they may well be out of school.
Teacher and classroom provision better in the upper primary schools: Private schools, like
government schools, are required to have a minimum PTR and a minimum level of
infrastructure. The average PTR and the average SCR was lower in the upper primary schools
compared to the primary schools, indicating that there is less pressure on the resources they
have. The average enrolment per grade is comparatively higher in the primary schools.
Twelve out of 15 primary schools with enrolment less than 150 had a PTR less than 30 as
required by RTE. There was only 1 primary school with enrolment between 150 and 200. It did
not have at least 5 teachers (excluding head-teachers). Only 2 out of 8 primary schools with
enrolment more than 200 had a PTR less than 40 (excluding head-teachers). So 15 out of 24
private primary schools satisfied RTE norms for PTR. A similar analysis could not be done for the
upper primary schools as teachers taught both primary and upper primary grades. The average
PTR in the upper primary schools was 27.
The Act requires that all schools should have at least 2 teachers and that the Teacher Classroom
Ratio should be greater than or equal to 1. The study found that 1 private school had less than 2
teachers, and 46.3% of private schools had a Teacher Classroom Ratio of less than one.
The RTE Act requires only schools with a specific enrolment to have a head-teacher. Head-
teachers are part of the set-up of all private schools. Close to four fifths (78%) of the private
schools had a separate head teacher’s room.
Table 7.9 Availability of Teachers and Classrooms in Private Schools in UP
School Type Average
number of
students
Pupil Teacher
Ratio
Average
number of
teachers
Average
number of
classrooms
Student
Classroom
Ratio
Primary Schools 167.8 31.5 5.3 4.4 39.5
Upper-Primary
Schools 208.8
26.8 8.2 7.3
30.6
Secondary Schools 394.0 34.8 11.6 10.7 36.7
Total 211.2 29.8 7.4 6.5 34.7
Based on survey of private schools in sample villages
Source: CORD Survey 2011-12
In general, schools had a head-teacher’s room, some use of all weather classrooms and access
to drinking water (through a handpump). The SCRs were highest in the primary schools
indicating possible overcrowding. The availability of a proper boundary wall to keep children
safe and secure inside the school was restricted to about half the private schools. The
secondary schools were more likely to have a boundary wall. These schools were also most

likely to have a playground. Separate toilets for boys and girl
schools.
In a few cases, the infrastructure was very poor. In one school, for example, water was kept in a
small tank outside for children to drink water. In a few other schools, the boundary wall was
partially constructed, or broken. In one school, there were no p
During the rainy season the school faced additional problems as the school did not have a roof.
Based on survey of private schools in sample villages
Source: CORD Survey 2011-12
Teaching learning materials such as charts on vegetables, animals, alphabets, and numbers
were found in 73% of the private schools. Some sports equipment (e.g. for badminton,
volleyball and cricket) was found in 62% of the private schools. A very low propo
had an available and usable library (only 13%). The number of books in the library was generally
limited.
Low proportions of teachers were trained
cadre in sufficient number. This is
The proportion of trained teachers in private schools was as low as 30%. The figure was
particularly low in both the primary and upper primary schools (27% and 25%, respectively)
which form the bulk of the private schools in UP.
46.3
77.8
0
25
50
75
100
At least one
classroom for
each teacher
Head teacher's
room
Pe
rce
nta
ge
of
sch
oo
ls
Figure 7.10: Private Schools (%) in UP with Specified
Infrastructure and Facilities Available and Usable
161
likely to have a playground. Separate toilets for boys and girls were also available only in 43% of
In a few cases, the infrastructure was very poor. In one school, for example, water was kept in a
small tank outside for children to drink water. In a few other schools, the boundary wall was
partially constructed, or broken. In one school, there were no proper sitting arrangements.
During the rainy season the school faced additional problems as the school did not have a roof.
Based on survey of private schools in sample villages
Teaching learning materials such as charts on vegetables, animals, alphabets, and numbers
were found in 73% of the private schools. Some sports equipment (e.g. for badminton,
volleyball and cricket) was found in 62% of the private schools. A very low propo
had an available and usable library (only 13%). The number of books in the library was generally
Low proportions of teachers were trained: The RTE Act requires a qualified and trained teacher
cadre in sufficient number. This is likely to raise their costs and make some of them unviable.
The proportion of trained teachers in private schools was as low as 30%. The figure was
particularly low in both the primary and upper primary schools (27% and 25%, respectively)
bulk of the private schools in UP.
77.8
43.4
92.3
63
Head teacher's
room
Separate toilets
for boys and
girls
Drinking water
facility for all
children
Playground
Figure 7.10: Private Schools (%) in UP with Specified
Infrastructure and Facilities Available and Usable
s were also available only in 43% of
In a few cases, the infrastructure was very poor. In one school, for example, water was kept in a
small tank outside for children to drink water. In a few other schools, the boundary wall was
roper sitting arrangements.
During the rainy season the school faced additional problems as the school did not have a roof.
Teaching learning materials such as charts on vegetables, animals, alphabets, and numbers
were found in 73% of the private schools. Some sports equipment (e.g. for badminton,
volleyball and cricket) was found in 62% of the private schools. A very low proportion of schools
had an available and usable library (only 13%). The number of books in the library was generally
The RTE Act requires a qualified and trained teacher
likely to raise their costs and make some of them unviable.
The proportion of trained teachers in private schools was as low as 30%. The figure was
particularly low in both the primary and upper primary schools (27% and 25%, respectively)
49.1
Boundary wall
Figure 7.10: Private Schools (%) in UP with Specified
Infrastructure and Facilities Available and Usable

Based on survey of private schools in sample villages
Source: CORD Survey 2011-12
Summing up, we find a large number of private sc
villages. These were clustered in 45% o
to have a private school. Ten villages had more than one private school. The private schools
appear to be well established. Some proportion were established before 2000, some between
2000 and 2006, and some in the last five years. The majority (70%) of private schools have been
recognized. A few of these have partial recognition
one does not. The unrecognized schools were mostly among those who had been set
last five years. The private schools included an equal number of primary and upper primary
schools, and a few secondary schools. A large proportion of the schools (56%) had lowest grade
nursery while the rest had Class 1 as the lowest grade. Som
met in a high proportion of schools such as sufficient classrooms and access to drinking water.
However, this does not tell us anything about the size of the classrooms or the adequacy of
drinking water. The proportion o
7.4 Madarsas
The madarsas offering primary schooling in the sample villages generally had poor physical
infrastructure. Most did not have a playground or sports equipment. Charts and other TLM
materials were not found. There was only 1 madarsa which had comparatively good
infrastructure. It had 5 classrooms and teaching learning equipment such as charts on numbers
and alphabets. It had an office room, a kitchen, and a storeroom. It had taps and
for drinking water, and clean toilets. It had a big playground and sports equipment such as a
football.
27.3
0
25
50
75
100
Primary schools
Pe
rce
nt
Figure 7.11: Availability of Trained Teachers (%) in
162
Based on survey of private schools in sample villages
Summing up, we find a large number of private schools in our sample villages, 55
villages. These were clustered in 45% of the sample villages; the larger villages were more likely
to have a private school. Ten villages had more than one private school. The private schools
appear to be well established. Some proportion were established before 2000, some between
, and some in the last five years. The majority (70%) of private schools have been
recognized. A few of these have partial recognition – one stage of schooling has recognition,
one does not. The unrecognized schools were mostly among those who had been set
last five years. The private schools included an equal number of primary and upper primary
schools, and a few secondary schools. A large proportion of the schools (56%) had lowest grade
nursery while the rest had Class 1 as the lowest grade. Some infrastructural requirements were
met in a high proportion of schools such as sufficient classrooms and access to drinking water.
However, this does not tell us anything about the size of the classrooms or the adequacy of
drinking water. The proportion of trained teachers in private schools was as low as 30%.
The madarsas offering primary schooling in the sample villages generally had poor physical
infrastructure. Most did not have a playground or sports equipment. Charts and other TLM
materials were not found. There was only 1 madarsa which had comparatively good
infrastructure. It had 5 classrooms and teaching learning equipment such as charts on numbers
and alphabets. It had an office room, a kitchen, and a storeroom. It had taps and
for drinking water, and clean toilets. It had a big playground and sports equipment such as a
24.9
44.4
Primary schools Upper primary schools Secondary and higher secondary
schools
Figure 7.11: Availability of Trained Teachers (%) in
Private Schools in UP
hools in our sample villages, 55 in 102 sample
f the sample villages; the larger villages were more likely
to have a private school. Ten villages had more than one private school. The private schools
appear to be well established. Some proportion were established before 2000, some between
, and some in the last five years. The majority (70%) of private schools have been
one stage of schooling has recognition,
one does not. The unrecognized schools were mostly among those who had been set up in the
last five years. The private schools included an equal number of primary and upper primary
schools, and a few secondary schools. A large proportion of the schools (56%) had lowest grade
e infrastructural requirements were
met in a high proportion of schools such as sufficient classrooms and access to drinking water.
However, this does not tell us anything about the size of the classrooms or the adequacy of
f trained teachers in private schools was as low as 30%.
The madarsas offering primary schooling in the sample villages generally had poor physical
infrastructure. Most did not have a playground or sports equipment. Charts and other TLM
materials were not found. There was only 1 madarsa which had comparatively good
infrastructure. It had 5 classrooms and teaching learning equipment such as charts on numbers
and alphabets. It had an office room, a kitchen, and a storeroom. It had taps and handpumps
for drinking water, and clean toilets. It had a big playground and sports equipment such as a
44.4
Secondary and higher secondary
schools
Figure 7.11: Availability of Trained Teachers (%) in

163
SECTION 8. CONCLUSION
UP is the most populous state in India. It has substantial proportions of disadvantaged groups.
According to the 2001 Census,70
Muslims formed 19 % and Scheduled Castes 21% of the State’s
population. Literacy rates in 2001 were 48% for Muslims and 46% for SCs, respectively while the
average literacy rate for the state as a whole was 56%. The gaps between the literacy rates
among disadvantaged groups and the population as a whole were between 8% and 10%. By
2011, the literacy rate for the state as a whole had risen to 70%. It would be interesting to see if
the gaps between the disadvantaged groups and the state as a whole have narrowed with the
continued focus on Education For All in the decade between the two Censuses.
8.1 Some progress on the road towards RTE
• Module on RTE has been prepared and teachers have received training
More than 80% of teachers and head teachers in U.P. reported that they have received training
on RTE for a duration of 4 days. Most teachers reported getting the Samvad module which has
information on RTE. However, while the module is comprehensive, it is very dense. It would be
even more useful if it was made more reader-friendly.
The duties of the teachers outlined in the Act include them being regular and punctual
themselves, completing the curriculum, and ensuring that children attend school regularly.
Later trainings will need to motivate and inform them on all aspects of the Act, including these.
• High proportions of teachers reported implementing policies specified in the RTE Act
High proportions of teachers reported that they were putting policies specified under RTE into
practice such as children not being refused admission to school even if they do not have
documents or come for admission after 30th
September (the cut-off date in the past); children’s
names not being cut off the register even with prolonged absence; corporal punishment being
prohibited.
However, it is important that teachers understand the rationale behind the provisions of the
Act to get them to implement it more effectively. They also need support in deciding how to
carry out these provisions in their own context. Feedback from the teachers on problems they
face in teaching in general and in implementing the approaches outlined in the Act is critical
and needs to be used in future training programmes on RTE.
• The Government of UP has taken the initiative of piloting CCE in 5 schools in each of 5
districts. Special Classes are being run in which 50,000 children were reported to be
admitted.
70
2011 figures for literacy of specific social groups is not available.

164
The Act can only be implemented effectively if it is done in a thoughtful manner. It requires
careful planning and implementation on a small scale to work out how best to take it forward
on a wider canvas. The piloting of CCE should provide insights on how it should be done, and
what pitfalls can be avoided.
• The Government of UP continues to recruit regular teachers and restricts the
deployment of contract teachers.
The Act demands that teachers work competently and conscientiously. In this context,
recruitment of appropriate candidates as teachers is critical. The Government of UP has so far
restricted the deployment of contract teachers to not more than two per school, and continues
to recruit regular teachers. This will ensure that they have some level of competence to handle
the new demands made on them by the RTE Act to teach in a way which builds up the child.
However, even teachers who have received professional teacher training are likely to require
support to carry out their duties under the Act, as their own experience in school and during
training is most likely to have consisted mainly of rote learning.
• SMCs set up in most villages with adequate proportion of parents
The Act requires that teachers be monitored and supported in their duties by a School
Management Committee. The study found that School Management Committees had been set
up in UP with the required representation of parent members, although smaller proportions
had adequate representation of women and the representation of disadvantaged groups is not
clear.
• Module for training of SMCs called “Jan Pahal” has been prepared
A system for training was in place. Master trainers had trained Block Resource Persons, but the
training at SMC level had not begun. The state was awaiting additional funds from the centre.
The SMC members’ lack of knowledge of their roles and responsibilities will be discussed in the
next section.
• Schooling system in UP has expanded in terms of more government schools being
opened at upper primary level. More private schools have also come up. Access to
primary and upper primary schooling remains an issue.
More upper primary schools in UP have been set up in the last decade. They were found to
have low enrolment indicating that there is dropping out as children transition between
primary and upper primary schools. Many more upper primary schools are needed if all
children enrolled in primary are to continue into upper primary and beyond. The issue of access
at this stage is particularly important for girls (for whom safety issues are important and the
opportunity cost of schooling is important), and for all children from disadvantaged groups who

165
are likely to be needed for directly or indirectly contributing to the family economy, and are
vulnerable to being taken out of school if they need to travel outside the village to get there.
Few, if any, government primary schools have been opened in the last 10 years. The
importance of providing sufficient access to government primary schooling should not be
underestimated, as it is the primary provider of schooling to children from disadvantaged social
groups, including the minorities.
Private schools have been opened but they are quite heterogeneous in quality. Recognition by
the government does not appear to be tied to any norms for infrastructure or teacher
provision. There are also problems with equity, as they cater to higher proportion of boys and
to proportions of Scheduled Castes lower than their representation in the population.
• Infrastructure and teachers in primary and upper primary schools have been improved
but gaps remain
More teachers have been appointed. In the primary schools, nearly all the teachers (96%) had
passed Class 12 (a requirement of RTE). However 46% of them were not professionally trained
to be teachers, also a requirement under the Act. In the upper primary schools, 72% were
graduates (a requirement of RTE), and nearly all were trained. So while there were positives,
gaps in qualifications and training of teachers remain.
The provision of teachers was inadequate in both the primary and upper primary schools, but
worse in the primary schools. Only 41% of the primary schools had at least 2 teachers and a PTR
below the maximum specified by the RTE Act, while this applied to 60% of the upper primary
schools. The positive for both primary and upper primary schools was that the majority of
schools which required a Head teacher had one appointed.
In spite of the expansion of infrastructure in the last decade, there was still a shortage of
classrooms. The Student Classroom Ratio was much higher in primary schools than in upper
primary schools. The situation appears to be better at upper primary levels because of the
lower numbers of children enrolled at this level.
Both the primary and upper primary schools had a shortage of most other infrastructural
requirements including a boundary wall, a playground, and separate toilets for boys and girls.
On the other hand, the majority of these schools had access to safe drinking water and to a
kitchen shed.
• Schools were functioning but only to a limited extent
Schools reported that they were open the minimum number of days specified by the RTE Act
but this is unlikely to be true. Schools were found to be closed at various times during the
survey because the day before had been a holiday on account of a festival or even the day

166
before that. Extremely cold weather conditions prevailing at the time of the survey also meant
that schools were all but closed on many days.
The study found that teachers were generally in school – 11% were absent due to personal
reasons on the day of the survey. However, an additional 15% were absent due to other duties,
mostly related to the forthcoming elections in the State. It is possible that the picture of
teacher regularity and punctuality is actually worse than it appears, as the team noted that in
many cases the regular teachers depended on the contract teachers to open and close up the
school, and came for a shorter part of the school day themselves. They also found that while
the contract teachers were there for a longer period than the regular teachers, they themselves
also came late and left early. Teachers reported that they keep no record of how much time
they spend on their work. The Act requires them to spend a minimum of 45 hours a week in
teaching and preparation.
The team found that student attendance even before the midday meal was less than half of the
enrolment, and that it dropped post the midday meal. Observed attendance was also lower
than what was reported in the register. Clearly neither the teachers nor the SMCs nor the
sarpanch were playing an adequate role in this area. This is the critical area which needs to be
plugged and we discuss it in the next section.
8.2 Too little accountability in the government system
• Head teachers and teachers not playing a strong role in carrying out their various duties
The head teacher and teachers are accountable to the education authorities at block level,
district level, and finally, state level. It did not appear that the head teachers were playing a
strong leadership role or that teachers were functioning in a way in which they were envisaged
in the RTE Act – to be punctual and regular, monitor student attendance, complete the
curriculum, and transact the curriculum in keeping with certain principles designed to
fulfil the child’s potential to the maximum possible. The lines of accountability do not appear to
be drawn sufficiently strongly. This may have something to do with the reportedly strong and
powerful teacher lobby in the state of UP.
• SMCs not playing the multi pronged role envisaged for them
The SMCs are newly mandated bodies. In UP, they appear to have been nominated rather than
elected. They are accountable at most to the parent body, an amorphous group which include a
sizable proportion from disadvantaged groups and weaker sections, and would need to be
empowered to demand accountability on any front. The SMCs had only a limited idea of their
roles and responsibilities particularly in their need to monitor student attendance. Observing
teacher attendance seems to be a duty they have internalized. In any case, it was reported by
members of SMCs who were interviewed that they used only informal methods to monitor
teacher and student attendance. SMCs were primarily involved in schemes involving
distribution of uniforms and textbooks and the cooked midday meal.

167
SMCs were required to have several other important duties which included supervising special
classes for children who have never been enrolled / dropped out, monitoring school
expenditure, making of the annual School Development Plan and to be the first stop if anyone
had any complaints about the working of the school. These provisions were not in place.
• Sarpanch not playing a role in monitoring school attendance of all children in the village
The sarpanch is to be involved in keeping a record of all children in the village to ensure that
none are out of school and that those who are in school attend regularly. Paying careful
attention to records of all the children in the village did not appear to be happening on
anyone’s watch. The team was informed that in many cases the head teacher and the sarpanch
were working together to manage the funds coming into the school.
8.3 Suggestions to strengthen the school system
Implementing the RTE Act by the various stakeholders will require
• Awareness of their roles and responsibilities
• Understanding the rationale behind the provisions of the Act to get a buy-in from the
stakeholders
• Follow-up with regard to whether the roles and responsibilities are carried out, and
putting in place a system of grievance redressal
Provision of schools and their infrastructure, facilities and availability of teachers needs utmost
priority. School based planning is essential – there is considerable variation in quality among
the government schools.
• Access to schools needs to be improved. More government schools at both primary
and upper primary levels are required.
• Infrastructural gaps need attention particularly the shortage of classrooms.
Infrastructural gaps are particularly great in the primary schools.
Requirements related to teachers need to be dealt with on several levels. To begin with, the
shortage of teachers needs to be unpacked, according to what the RTE requires for the stage of
schooling and the numbers of students enrolled. In addition, to recruiting more teachers, they
need to be posted where they are required. There is also a need to bring basic educational
qualifications of teachers in line with RTE norms.
The Government of UP has begun the process of implementing the RTE Act in a determined and
meaningful way. It needs to take it much much further for the provisions to reach all children as
envisioned in the Act.

168
References
Dainik Jagran (2012). Bihar Government Orders, 29 January.
DISE (2012). Elementary education in India. Progress towards UEE. Flash Statistics. NUEPA and
MHRD, New Delhi.
Farouqui, A. (1994). Urdu education in India: four representative states, Economic and Political
Weekly, Vol. 29, N. 14, pp. 782-785.
Government of Bihar (2011a). Bihar elementary school education committee act 2011, 12 May.
Department of Education, Patna.
— (2011b). Bihar elementary school education committee rules (Prarambhik Vidyalay Shiksha
Samiti) 2011, 6 June. Department of Education, Patna.
http://www.educationbihar.gov.in/Documents/ActionRule/4Bihar_Gazette_BESECA_2011.
— (2012). Bihar panchayat elementary teacher (recruitment and services) rules 2012.
Department of Education, Patna.
Government of India (2001). Census 2001, http://censusindia.gov.in/.
— (2009). The right of children to free and compulsory education act, 2009. 26th August 2009.
Ministry of Law and Justice, New Delhi.
— (2011). Census of India, http://censusindia.gov.in/.
Government of Uttar Pradesh (2011). The Uttar Pradesh right of children to free and
compulsory education rules, 27 July. U.P. Education For All Project Board, Lucknow.
http://www.upefa.com/upefa/RTE-11E.pdf
Kingdon, Geeta Gandhi and Mohd. Muzammil (2008). Political economy of education in India:
the case of Uttar Pradesh. Oxford Policy Institute.
http://r4d.dfid.gov.uk/PDF/Outputs/ImpOutcomes_RPC/OPI_KingdonMuzammil20081%5B1%5
D.pdf
— (2010). The School Governance Environment in Uttar Pradesh, India: Implications for Teacher
Accountability and effort. RECOUP Working Paper No. 31, Centre for Education and
International Development, University of Cambridge, UK.
http://recoup.educ.cam.ac.uk/publications/WP31-GK_MM_final.pdf
Kumar, S., M. Sanjeer Alam, and Dhananjai Joshi (2008). Caste Dynamics and Political Process in
Bihar. Journal of Indian School of Political Economy, Vol. 20, Issue 1&2, pp. 1-32.

169
NFHS-III (2007). National Family Health Survey (NFHS-3), 2005–06: India. International Institute
for Population Sciences (IIPS) and Macro International. IIPS, Mumbai.
Raina, V. and K. Hulsof (2010). Frequently asked questions on right to free and compulsory
education act (2009), Bharat Gyan Vigyan Samiti and UNICEF, New Delhi.
Rao, Nitya (2009), “Structural Constraints in Sarva Shiksha Abhiyan Schools”, Economic and
Political Weekly, April.
Rorabacher, J Albert (2008) Gerrymandering, Poverty and Flooding: A Perennial Story of Bihar,
Economic & Political Weekly, February 16, 2008.
Samson, Meera and Neha Gupta (2011), “Marginalisation and Education: Schooling for Children
on the Bihar Jharkhand Border Between Katihar and Sahibganj Districts”, Report submitted to
NEG FIRE, www.cordindia.com
SSA (2012). Samvad. National curriculum framework 2005 and free and compulsory child right
to education act 2009. Teachers’ handbook. Sarva Shiksha Abhiyan. Lucknow.
SRRI (2009). All India survey of out-of-school children in the 6-13 years age group. Social and
Rural Research Institute (SRRI). Ministry of Human Resource Development, New Delhi.
Srivastava, Prachi (2008). “The shadow institutional framework: towards a new institutional
understanding”. Centre for International Education, Sussex Institute, University of Sussex,
Brighton, UK.
UNICEF Child Rights Framework,
http://www.unicef.org/lifeskills/index_7260.html#A%20Framework%20for%20Rights-
Based,%20Child-Friendly
World Bank (2002). Poverty in India: The Challenge in Uttar Pradesh, Poverty Reduction and
Economic Management Sector Unit, South Asia Region, World Bank Report, N. 22323-IN,
http://www.wds.worldbank.org/servlet/WDSContentServer/WDSP/IB/2002/07/02/00009
4946_0206190400469/Rendered/PDF/multi0page.pdf
--- (2007). Bihar: towards a development strategy. A World Bank Report.
http://siteresources.worldbank.org/INTINDIA/Resources/Bihar_report_final_June2005.pdf

170
APPENDIX 1 – The Samvad Module
The Samvad Module has been introduced by the U.P. Government as a tool to assist in training
teachers about RTE. The Module is divided into chapters pertaining to different aspects of the
RTE.
• The first describes what the attitude of teachers should be towards students, the
qualifications of the teachers and the subjects that must be taught, including math,
science, art, etc.
• The second chapter lays down a framework for schools. It specifies the approaches to be
adopted to facilitate teaching and learning, emphasizes the need for child centered
education and a safe and fear free atmosphere for children.
• This chapter is followed by a chapter on guidelines for teachers. It states that students
must be taught about different religions, cultures and traditions, so as to sensitize them
and reduce discrimination in the classrooms. It also gives examples for methods of
teaching various subjects such as math and science.
• The next chapter discusses CCE and the approaches that should be adopted for effective
CCE. It begins with the importance of CCE and why it is needed. The formative and
summative techniques are also explained in some detail and emphasis is laid on
evaluations through regular assignments and project work. How exactly it is to be
operationalised within the classroom is however not very clear.
• Lastly, the duties of teachers are listed, which include putting in 45 hours a week,
maintaining student profiles (for which a format is given), and using TLM in classrooms
to facilitate student learning.
The second half of the module contains the Act in Hindi as well as a reproduction of several
state government orders relevant to its implementation. It is a thick module, 240 pages long
and a fairly exhaustive reference document.

171
APPENDIX 2 -- Status of Urdu in Uttar Pradesh
Urdu speakers in India number almost 44 million (Census of India, 1991) with the largest
numbers in the state of Uttar Pradesh (followed by Bihar, Andhra Pradesh, Maharashtra and
Karnataka, which together account for 85% of the national Urdu-speaking population). Syed
Shahbuddin writes that “on partition, Urdu was declared as the national language of Pakistan.
On the Indian side, the Hindu community, including Urdu and Punjabi speaking refugees
steadily dissociated themselves from Urdu. The result is that Urdu has become synonymous
with Muslims though it is not the mother tongue of all Muslims but almost all Indians who
declare it as mother tongue are Muslims. Among the major states AP and Karnataka top in the
list with 94.3 and 84.6 percent of Muslim as Urdu speaking. In UP only 43.3 percent Muslims
have so declared, even lower than Jharkhand (http://www.arabnews.com/status-urdu-land-its-
birth)”.
This makes the status of Urdu complicated. While there are several speakers in Uttar Pradesh, it
is also not recognized as a ‘regional language’ and instead is associated with a minority
community. This community moreover consists of both those who speak Urdu traditionally and
those who speak local dialects.
Hindi was the only official Language until 1989, when the Uttar Pradesh Official Language
(Amendment) Act, 1989 was passed and Urdu language was declared to be the second official
language. A notification issued by the State Government declared the purpose for which the
Urdu was to be used as second official language.
- Entertaining petitions and applications in Urdu presented by members of public.
- Receiving documents in Urdu presented for registration with a Hindi copy thereof.
- Publication of important Government rules, regulations and notifications.
- Publication of important Government advertisements, etc.
- Issuing Government Orders and circulars of public importance in Urdu also;
- Translation of Gazette in Urdu.
- Exhibition of important sign posts in Urdu.
(see http://www.ciil-ebooks.net/html/langUse/policy.html).
This status is given to Urdu in the 21 minority concentration districts, all of which are
concentrated in the northern belt of the state (see below). Among the districts covered in the
survey these were Barabanki, Bijnor, Pilibhit and Baharaich.
The “Scheme of Financial Assistance for Appointment of Language Teachers” of the MHRD
states that it shall provide for Urdu Teachers in the schools of those districts that have a
significant minority population. The State/UT Governments is provided 100% financial
assistance for salaries of Urdu teachers and Honorarium to the existing Urdu teachers for
teaching Urdu in Schools. The scheme has been revised during 2008-09 such that assistance is
provided for appointment of Urdu Teachers to any locality where more than 25% of the
population is from the Urdu speaking community in pursuance to the Prime Minister’s new 15
Point Programme for the Welfare of the Minorities.

172
APPENDIX 3 – UNICEF Framework for Rights based Child friendly Educational Systems and
Schools
A useful ‘framework for rights-based, child-friendly educational systems and schools’ has been
developed by UNICEF. As per this framework – a rights based child friendly school meets a wide
set of requirements
• Is a child-seeking school
– actively identifying excluded children to get them enrolled in school and included in
learning
– treating children as subjects with rights and States as duty-bearers with obligations to
fulfil these rights
– demonstrating, promoting, and helping to monitor the rights and well-being of ALL
children in the community
• Is a child-centred school
– acting in the best interests of the child
– leading to the realisation of the child’s full potential
– concerned about the “whole” child: her health, nutritional status, and well-being
– concerned about what happens to children before they enter school and after they
leave school
• Above all -- has an environment of good quality
– Inclusive of children
– Effective with children: Promotes good quality teaching and learning processes,
instruction appropriate to each child’s learning needs, abilities, and learning styles
active, co-operative, democratic, gender-sensitive learning, Provides structured
content and good quality materials and resources
– Healthy and protective for children, Physically safe, emotionally secure and
psychologically enabling
– Gender-sensitive
– Involved with children, families, and communities