towards strategy formulation in a complex environment · towards strategy formulation in a complex...
TRANSCRIPT
African Journal of Hospitality, Tourism and Leisure Vol. 3 (1) – (2014) ISSN: 2223-814X Copyright: © 2014 AJHTL – Open Access- Online @ http//:www.ajhtl.com
Towards strategy formulation in a
complex environment
Prof René. Pellissier Professor of Research and Innovation
Graduate School of Business Leadership, UNISA Box 392, Pretoria, 0003. South Africa
Abstract The management sciences offer mainly linear solutions to an environment that is becoming increasingly complex. This is aggravated by the need for innovation outcomes. Formulating and implementing strategy is therefore far more complicated. Since developing economies face far less stable environments, businesses operating in these domains are more accustomed (even adept) to deal with complexity. This article compares the deployment of complexity in strategy to achieve innovation in either a developing or a developed economy setting. From interviews conducted with selected CEOs from both economies, it was found that the businesses in the developing economies include complexity factors in their strategies whereas those in developed economies focus on operational excellence and not on complexity. Therefore, at this point, businesses in developed economies may want to explore the strategies adopted by those in developing economies to accommodate diversity and the dynamic environment that require innovations.
Key phrases: ambidexterity, complexity, developed economies, developing, economies, exploitation, exploration innovation, strategy adoption, strategy formulation
INTRODUCTION The management sciences give us differing theories and strategies to compete in the international arena. These theories are based upon specific, yet differing assumptions leading to differing outcomes. Emergent theories are confusing and aggravate the complexity of the business environment internally and externally. This leads us to the following questions: Should we follow scientific management? Should we adopt a systems approach? Should we throw caution to the wind and adopt new technologies and focus on innovation? How does the rapidly changing environment impact on strategy? The reality is that we can no longer ignore complexity as a science applicable to the business problems we face, and, particularly the complexities in the environment and the subsequent effect these may have on our business strategies.
Allowing complexity principles into management requires an acknowledgement that we cannot control organisations to the degree that a mechanistic perspective will. Moreover, as the system’s environment changes, so does the behaviour of its agents. Thus, the behaviour of the system as a whole can change. Linear strategies and technologies become irrelevant with a shift to patterns and relationships between entities. This changes the formulation and adoption of the organisation’s strategies. The financial crisis worldwide highlighted the links and differences between developed and developing economies in terms of business and strategies. Developing economies, especially, are more prone to the adoption of non-linear solutions because of the nature of the relevant variables, the changes and interplays between the variables, labour and human resource problems, lack of training and

African Journal of Hospitality, Tourism and Leisure Vol. 3 (1) - (2014) ISSN: 2223-814X Copyright: © 2014 AJHTL - Open Access- Online @ http//: www.ajhtl.com
education; and the consequent organic nature of competitiveness. These variables introduce an unavoidable element of unpredictability and randomness into any business environment making companies operating in developing economies more susceptible, indeed adaptable, to change. This research compared the strategies in organisations from different environments as explained by the respective CEOs. CEOs were selected from middle-sized organisations in the US where the environment is more structured and orderly; and from SA where the environment is less structured and less orderly. In both cases, the focus was the strategies given the extent of complexity experienced in the internal and external environment. There were two research objectives: (1) To determine the extent of use of principles of complexity in an orderly and structured environment against an environment that is more open to change; and (2) To determine whether businesses in less orderly and structured environments were more able to deal with complexity when formulating and implementing organisational strategies than businesses in structured environments. The research data was obtained from face-to-face interviews with selected CEOs in middle-sized organisations from each domain. US companies were chosen due to the strong evidence of innovation and business acumen from the Global Competitiveness Index (GCI) undertaken by the World Economic Forum and SA companies because of SA’s efficiency-driven status allowing for a good comparison of management-related issues in a structured and a less structured environment. Therefore, a total of 14 CEOs from middle-sized organisations were interviewed. Middle-sized companies were targeted because their size makes them more flexible and sensitive to the environment and the strategies less complicated to
discuss and interpret. No differentiation was made about the industry the company is based in. For this research, an interview approach was adopted to solicit information from the CEOs in the selected middle-sized organisations from each domain. The questionnaires were sent to the respondents ahead of the interview in order for them to familiarize themselves with the research setting and the questions to be addressed. This research focused on the following research questions based on the formulation and adoption of strategy in selected middle-sized organisations: Is there a difference in terms of leadership’s perception of issues relating to the complex environment in formulating the strategy, between organisations in a developing and in a developed environment given the discussion above? Secondly, if so, which factors are relevant in building strategy in each? The intention of the study is not to provide a generalisation of these issues, but to explore the extent to which these are relevant at least to the selection of cases interviewed. The research outcomes are valuable from two perspectives. Firstly, it highlights possible differences between the two countries with regards to strategy, and, secondly, it identifies the most important factors for strategy formulation and adoption in complex domains. DIFFERENT ENVIRONMENTS Many classifications exist with regards to the economies of countries (Sullivan & Steven 2003). The World Bank’s main criterion for classifying economies is gross national income (GNI) per capita (World Bank 2013: Internet). Based on its GNI per capita, every economy is classified as low income, middle income (subdivided into lower middle and upper middle), or high income. Another classification is in terms of

African Journal of Hospitality, Tourism and Leisure Vol. 3 (1) - (2014) ISSN: 2223-814X Copyright: © 2014 AJHTL - Open Access- Online @ http//: www.ajhtl.com
economic development where countries are classified as developed, developing, high income or newly industrialised countries. Other non-economic classifications include human development (focusing on indices including human development, human poverty or population living in poverty), digital divide (focusing on a digital opportunity index, listing by number of internet or broadband internet users). Quality of life rankings differentiate based on satisfaction with life, human development, ecological footprint, environmental performance¸ sustainability, vulnerability and even use of beverages or motor vehicles. Classifications can also be in terms of language, politics or trade partners and trade agreements. However, according to some economists (Mankiw 2007; Mauro 2003), the terms imply a sense of homogeneity amongst countries which is not generally the case. Developing countries, also known as less-developed countries, have lower living standards, undeveloped industrial bases, and low human development indices relative to other countries. Overall, developing economies seem to be suffering from a greater lack of stability with regards to politics, economics, financial security, education and training or skills and infrastructure, to name a few (Sullivan & Steven 2003). The instability in terms of political, economic, social and other factors in developing countries is well described in
literature (Gabriele, Baratav & Parikh 2000; Glick & Hutchison 2005). The United States. Developed economies have a modern infrastructure and continuous, self-sustaining economic growth. According to the GCI (2012) companies in the United States are generally highly sophisticated and innovative, supported by an excellent university system that collaborates admirably with the business sector in research and development. The labour market is flexible. However, the management of the banking system partly led to the financial crisis of 2007 indicating that there was a lack of understanding of managing for volatility. South Africa. Because of its market positioning, SA is referred to as an advanced emerging market and as newly industrialised. Its economy is more advanced and developed than others in the developing world, but not yet with the full signs of a developed country. According to the same GCI (2012), South Africa does reasonably well in complex areas such as business sophistication and innovation, benefitting from good scientific research institutions and strong collaboration between universities and the business sector in innovation. However, it does badly in labour market efficiency and significant tensions in labour-employer relations. Table 1 draws comparisons between SA and US in terms of the business environment.

African Journal of Hospitality, Tourism and Leisure Vol. 3 (1) - (2014) ISSN: 2223-814X Copyright: © 2014 AJHTL - Open Access- Online @ http//: www.ajhtl.com
TABLE 1: Comparison between the US and SA in relation to the business environment
GCI scoring out of 7 US
(Developed economy)
SA1
(Developing economy)
Market size 6.9 4.8
Institutions 5.1 4.4
Business sophistication 5.3 4.3
Infrastructure 5.8 4.1
Technological readiness 5.8 4
Labor market efficiency 5.4 3.9
Innovation 5.5 3.5
Overall economic profile Innovation-driven Efficiency-driven
Source: World Economic Forum 2012: 16-22 Where applicable, data in tables were ordered on SA
Table 2: Organisational and process maturity levels
Levels Focus Descriptions
1 Incomplete Entrepreneurial activities
There is a general failure to attain the purpose. There are no easily identifiable work products or outputs.
2 Performed Basic management The purpose is generally achieved. The achievement may not be rigorously planned and tracked. Individuals within the organisation recognize that an action should be performed, and there is general agreement that this action is performed as and when required. There are identifiable work products, and these testify to the achievement of the purpose.
3 Managed Standardisation Work products of acceptable quality are developed within defined time scales. Performance according to specified procedures is planned and tracked. Work products conform to specified standards and requirements.
4 Established Quantitative management
The process is performed and managed using a defined process based upon good principles. Individual adoptions of the process use approved, tailored versions of standard and documented processes. The resources necessary to establish the process definition are also in place.
5 Predictable Continuous improvement
The defined process is performed consistently in practice, within defined control limits, to achieve its goals. Detailed measures of performance are collected and analyzed. This practice leads to a quantitative understanding of process capability and an improved ability to predict performance. The quality of work products is quantitatively known.
6 Optimizing Organisational learning and innovation
Performance of the process is optimized to meet current and future business needs, and the process achieves repeatability in meeting its defined business goals. Quantitative process effectiveness and efficiency goals (targets) for performance are established, based on the business goals of the organisation. Obtaining quantitative feedback enables continuous process monitoring against these goals, and improvement is achieved by analysis of the results. Optimizing a process involves piloting innovative ideas and technologies and changing non-effective processes to meet defined goals and objectives.
Source: El Emam and Madhavji 1995:104
.

African Journal of Hospitality, Tourism and Leisure Vol. 3 (1) – (2014) ISSN: 2223-814X Copyright: © 2014 AJHTL – Open Access- Online @ http//:www.ajhtl.com
Based on the Global Competitiveness Index (GCI) in table 1, the US (as an innovation-driven economy), scores much higher than SA (as an efficiency-driven economy) on every factor presented in the above table, although both economies score highest on market size (the latter being the highest scoring in the table for SA). The US’s market size is an outstanding 6.9. SA’s overall business sophistication and innovation score is 3.9 compared to a 5.4 (out of 7) for the USA with the innovation score in the USA particularly high (5.5) against the SA score of 3.5. This research is based on a comparative study of organization strategies in a selection of middle-sized companies, and the extent of the complexities that they deal with. STRATEGY IN A COMPLEX ENVIRONMENT In a complex environment, management principles are different. The inherent self-organisation and unpredictability mean that there is less control. Leadership is therefore required to take unique actions as there is less control and more focus on small actions to influence patterns of interaction. Smaller organisations are of course more flexible and thus more able to be innovative (Axelrod & Cohen 2000). Thus, the size of the organisation counts because it is easier to develop relationships and creativity in a smaller group and there may be a greater willingness to release control. Larger organisations seem to become inflexible and more rule-bound. Their flexibility is normally embedded in specific units, but overall, there is a notion that adaptive and resilient systems are characterized by the order and/or disorder or stability and/or flexibility. In a complex environment, there is no either/or in terms of decision-making (Perow 1967). Dutta (2012) writes that successful organisations juggle between periods of incremental and transformational change with discontinuities driven by technology, competitors, regulations or
economic or political events. He warns that success normally leads to increase in age and size, which leads to increased internal and external complexity. El Emam and Madhavji (1995) write that mature organisations can be moved to growth businesses by following a specific path over time. Zimmerman, Lindberg and Plsek (2012) suggest the following in order to deal with complexity in the environment: (1) Provide opportunities for a diverse group of people to interact creatively; (2) formulate processes to develop creativity, e.g. appreciative enquiry, open space, conversation cafes: (3) do not develop a grand plan or long-term blue print and instead adopt a shorter-term perspective stimulating experimentation and sense-making of the ideas; (4) management should be centralised (to develop an innovation culture organisation-wide) and decentralized (encouraging experimentation at the local level); and (5) leadership should have the ability to listen to promising developments. Create network opportunities and communications across the organisation and allow for pattern recognition and new innovations to unfold. This is corroborated by the research of Gottfredson and Aspinall (2005) who postulated that the application of complexity principles requires a change in leadership. Firstly it requires the creation of a culture of innovation. Leadership cannot make innovation happen, but it should foster innovation by providing the time and space for creativity, communication and interaction. Secondly, leadership is about listening and learning to determine what is emerging, and, lastly, leadership should learn by taking risks and allowing experimentation. Ambidexterity in strategy O’Reilly and Tushman (2010) maintain that leadership should be constantly looking backwards and attend to products and

African Journal of Hospitality, Tourism and Leisure Vol. 3 (1) - (2014) ISSN: 2223-814X Copyright: © 2014 AJHTL - Open Access- Online @ http//: www.ajhtl.com
processes of the past, whilst looking ahead and preparing for innovations that will shape the future. O’Reilly and Tushman (2004) caution that, as environmental dynamics increase, organisations need to change and innovate to adapt to the environment. Raisch and Tushman (2011) suggest that organisations renew themselves by exploring new business models even as they exploit existing ones. They continue by suggesting that, in exploring and exploiting, organisations have to balance internal and external demands and resultant complexities. Whereas exploration is related to flexibility, decentralization and loose structures, exploitation is associated with efficiency, centralisation and tight cultures. Therefore ambidexterity is the ability to simultaneously exploit and explore with equal dexterity (Lubatkin, Simsek & Veiga 2006). Moon and Huh (2010) state that any organisation that is able to both explore and exploit (i.e. be ambidextrous) clearly has a competitive advantage. These authors define organisational ambidexterity as an organisation’s ability to be aligned and efficient in its management of immediate business demands, while simultaneously being adaptive to changes in the environment. Dutta (2012), in looking at the dynamic capabilities required to foster ambidexterity, found that management should build a culture to promote business consolidation by building and sustaining competencies, promote risk taking by leveraging core competencies and undertake advanced risk taking by building and adapting core competencies that address the rapidly changing environment. Ahuja and Lampert (2001) warn that a one-sided focus on exploitation may enhance short-term performance, but results in an inability to deal with change and, conversely, too much exploration enhances the knowledge base but traps the organisation into a continuous search for change for change’s sake. The authors believe that few companies undertake this balancing act of exploiting the present while
exploring the future, well. This is so because established companies lack the flexibility to explore anything new. The innovations they need to address include Smith’s (2010) radical, architectural, modular and incremental innovations. These innovations require different targets, for example, existing customers or markets, or new customers or markets. O’Reilly and Tushman (2004) found that ambidextrous organisations require a clear and compelling vision relentlessly communicated by senior management and used structures which make provision for separate units working on existing business and others working on emerging business. In fact, the units dealing with exploration may be smaller, more decentralised and more flexible than the exploitation ones. Organisational and process maturity Organisational maturity encompasses the techniques and methods to evaluate the current state of organisational processes, and identify opportunities for continuous improvements to business outcomes (Rosemann & de Bruin, 2005). The original Capability Maturity Model (CMM) model embodies a simple principle: if organisations wish to develop predictability and repeatability in their processes, they need to be standardised. El Emam and Madhavji (1995) posit that processes need to develop through maturity stages from informal (the lower end of the scale) to highly repeatable and optimized processes with continuous improvement embedded (higher end). As each process develops in this way, the organisational capability will improve. Process maturity is based on five levels of maturity with level one being immature and level five being very mature. The levels are often characterized as follows: an absence of a formal or recognized process (things are done in a non-standard way); a recognized process is used but it is inconsistently applied and is not documented; a standard

African Journal of Hospitality, Tourism and Leisure Vol. 3 (1) - (2014) ISSN: 2223-814X Copyright: © 2014 AJHTL - Open Access- Online @ http//: www.ajhtl.com
and documented process is applied and flexed as needed; a documented process that includes metrics about the outputs of the process and also the process itself. These metrics are the key to identifying process improvement initiatives; and a documented process that embeds
continuous improvement driven from the process and the output metrics that optimize the process. The assumption of this research is that standardized processes are less flexible and will likely not lean towards innovation.
See table 2
According to Duta (2012), mature organisations can revitalize themselves by shifting between incremental and breakthrough products or processes using ambidexterity. Thus, leadership should be able to combine organisational separation at the business level and integrate at the corporate level. METHODOLOGY Although we acknowledge the role of technology and innovation in modern management, we seem to revert to established rules and processes when executing strategy. In fact, as Berger and Luckmann (1966) posit so succinctly, we like stability, structure and order because it makes us feel safe. However, the environment refuses to accept linearity and our world is cluttered with so much non-
linearity and complexity that we need to look for alternatives in how our management practices should be established, let alone taught. It is possible that companies operating in unstable environments are more set to embrace non-linearity than their developed counterparts. China is but one example. So, is there a difference, from the perspective of the organisational strategic plan based on the impact of the environment (internal or external) to the organisation? Using the conceptual framework in figure 1, this research is based on interviews with selected industry leaders in an orderly and well-structured environment (US) and an environment that is organic and changing (SA) to determine their views on what aspects impact on strategy and how their environment plays a role in the strategy formulation.

African Journal of Hospitality, Tourism and Leisure Vol. 3 (1) – (2014) ISSN: 2223-814X Copyright: © 2014 AJHTL – Open Access- Online @ http//:www.ajhtl.com
FIGURE 1: Proposed research framework to determine the factors impacting on strategy in structured or complex
environments
For this research, an interview approach was adopted to solicit information appropriate for analyses although the questionnaires were sent to the respondents before the time of the interview. The latter allowed the participants to reflect upon their strategy adoptions in terms of the scenarios described in the questionnaire. Qualitative research aims to answer the ‘why’, and the ‘how’. It is usually through the analysis of the unstructured information. This involves things like interview transcripts, open survey responses, mails, notes and feedback forms. It does not just rely on the numbers, which are the domain of quantitative researchers. It is mostly used to have great insight into people's attitudes, behaviour and values (McMillan & Schumacher 2006:394).The qualitative research method used allowed the study to be carried out in its natural setting by attempting to make sense of and interpret the phenomena in terms of meanings the CEOs bring to them. This is in line with Cresswell (2009:4) who maintains that qualitative research is an inquiry process of understanding a social or
human problem based on a complex, holistic picture formed with words in natural settings. The study was explorative in keeping with Bless and Higson-Smith (1995:42) that the purpose of exploratory research is to gain insight into a situation, phenomenon, community or person. The authors maintain that exploratory research refers to initial research conducted to clarify and define the nature of the research problem or opportunity by giving ideas or insights as to how the research problem can be addressed. The information required is only loosely defined at this stage. Exploratory research collects information in an semi-structured, informal manner. The purpose of this type of research is to narrow the scope of the research topic and, consequently, define the problem or opportunity clearly. Exploratory research can be conducted by investigating previous studies on the subject and informally investigating the problem through secondary data (Gerber-Nel, Kotze, and Nel, 2005: 30).

African Journal of Hospitality, Tourism and Leisure Vol. 3 (1) - (2014) ISSN: 2223-814X Copyright: © 2014 AJHTL - Open Access- Online @ http//: www.ajhtl.com
The CEOs were selected based on their suitability and availability as opposed to necessarily representing high or low levels of complexity in the environment using a convenience sampling design. Twenty CEOs from mid-sized businesses in SA and 50 from the US were invited by email to participate in the project. The number of years in this position was used as selection criterion to ensure that respondents had knowledge of strategy deployment and the possibilities of complexity in the internal and external environment. Of the 20 CEOs approached in South Africa, 40% did not respond despite follow up and a further 25% indicated their unwillingness due to the nature of the research or because of time constraints to participate. Similarly, 68% of the US CEOs did not respond, whilst a further 38% indicated their unwillingness citing the same reasons, this lead to a small sample of seven CEOs in each category for the interviews. Based on not in list (2009:112) description of interpretative research, it was decided that this method will uncover, describe and interpret actual meanings in order to develop a deeper understanding of the phenomenon with the aim of using the knowledge to inform and foster development in other settings. The researcher first established a working relationship with the participants in order to explore their experiences which add to the information-richness of the observations and the responses to the structured questions. To strengthen the validity of the results, the same interviewer conducted the interviews. This also allowed the participants to reflect upon their strategy adoptions in terms of the scenarios described in the questionnaire. Unstructured and structured questions were posed to the CEOs and the interviews were recorded and notes taken. This article elaborates on the structured questions using a Likert scale data. One of the difficulties in developing the questionnaire was to define the appropriate questions and items to best describe the different variables
in the research framework developed. In an effort to increase user acceptability, the questionnaire was developed to enable completion by separate people for each factor or by one individual for the entire questionnaire. All CEOs elected to respond to the questions themselves. The CEOs were asked to describe their understanding of the environment and its complexities and the deployment of their strategy. In the structured part of the questionnaire (of which the results are discussed in this article), the CEOs were presented with a set of complexity and strategy formulation issues and asked to comment about the extent to which their companies were exposed to these and how these impacted on strategy formulation and adoption based on a five point Likert scale (1=no agreement to 5= absolute agreement). The interviews focused on the elements used to formulate and implement strategy, and, specifically, on their understanding and adoption of a list of issues relating to strategy in a complex environment (see figure 1). These issues related to purpose, ambidexterity (for innovation), problems normally relating to instructed environments, the maturity of the organisation and issues relating to operational excellence. The ambidexterity relates to the extent to which the organisation becomes internally complex given the different structures required in order to remain competitive.
RESEARCH FINDINGS AND DISCUSSIONS Organisation design and structure The CEOs in the sample were requested to comment on the extent to which they believed their organisations were linear or complex, firstly, by nature and, secondly, by formulation. The US companies described themselves as far more linear by nature (3.76) and by formulation (2.92) than the SA companies (the respective scoring was 6.6
African Journal of Hospitality, Tourism and Leisure Vol. 3 (1) - (2014) ISSN: 2223-814X Copyright: © 2014 AJHTL - Open Access- Online @ http//: www.ajhtl.com
and 6.4) indicating strong complexity by nature and by design. For instance, as one CEO for an US-based research organisation put it their strategy is certainly linear, aimed at ‘putting the firm on a straight path and staying on that path’. He maintained that ‘a linear strategy was required because of the competitive nature and scale of the environment and a required change in one direction. We are not in a tumultuous environment and had to adapt to the new path and merely be able to stay on that path.’ Factors relevant in strategy formulation and adoption
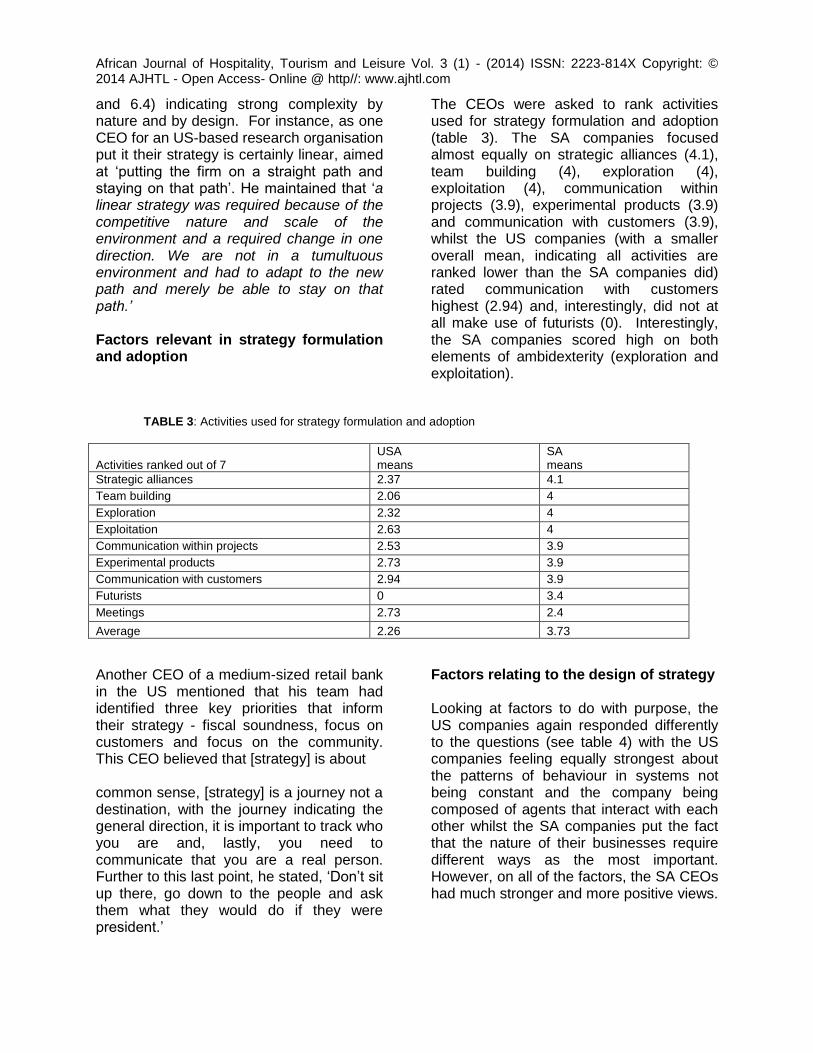
The CEOs were asked to rank activities used for strategy formulation and adoption (table 3). The SA companies focused almost equally on strategic alliances (4.1), team building (4), exploration (4), exploitation (4), communication within projects (3.9), experimental products (3.9) and communication with customers (3.9), whilst the US companies (with a smaller overall mean, indicating all activities are ranked lower than the SA companies did) rated communication with customers highest (2.94) and, interestingly, did not at all make use of futurists (0). Interestingly, the SA companies scored high on both elements of ambidexterity (exploration and exploitation).
TABLE 3: Activities used for strategy formulation and adoption
Activities ranked out of 7 USA means
SA means
Strategic alliances 2.37 4.1
Team building 2.06 4
Exploration 2.32 4
Exploitation 2.63 4
Communication within projects 2.53 3.9
Experimental products 2.73 3.9
Communication with customers 2.94 3.9
Futurists 0 3.4
Meetings 2.73 2.4
Average 2.26 3.73
Another CEO of a medium-sized retail bank in the US mentioned that his team had identified three key priorities that inform their strategy - fiscal soundness, focus on customers and focus on the community. This CEO believed that [strategy] is about common sense, [strategy] is a journey not a destination, with the journey indicating the general direction, it is important to track who you are and, lastly, you need to communicate that you are a real person. Further to this last point, he stated, ‘Don’t sit up there, go down to the people and ask them what they would do if they were president.’
Factors relating to the design of strategy Looking at factors to do with purpose, the US companies again responded differently to the questions (see table 4) with the US companies feeling equally strongest about the patterns of behaviour in systems not being constant and the company being composed of agents that interact with each other whilst the SA companies put the fact that the nature of their businesses require different ways as the most important. However, on all of the factors, the SA CEOs had much stronger and more positive views.

African Journal of Hospitality, Tourism and Leisure Vol. 3 (1) – (2014) ISSN: 2223-814X Copyright: © 2014 AJHTL – Open Access- Online @ http//:www.ajhtl.com
TABLE 4: Issues relating to the design of strategy
Issues ranked out of 4
USA
means
SA
means
The nature of our business requires that we find distinctly different ways of interacting with systems. 1.19 3.9
The patterns of behaviour in these systems are not constant since, as the system’s environment changes, so does the behaviour of its agents and, as a result, so does the behaviour of the system as a whole. 2.73 3.7
The company is composed of agents that interact with each other and, in doing so, generate new behaviors for the systems as a whole. 2.73 3.6
We acknowledge that we cannot control organisations to the degree that a mechanistic perspective will imply but only that we can influence where the organisation is going and how it will evolve. 2.44 3.6
The models we build should be based on systems that describe each distinct aspect but are not derived from each other. 2.12 1.3
Average 2.242 3.22
Factors pertaining to internal complexity Two issues pertinent to non-linearity in strategy were discussed although the respondents were not told that these were issues of non-linearity (table 5). The South African companies rated both of these higher than the US companies, but scored
them almost identical. This suggests that the SA companies allowed values to be created depending on the problem and furthermore allowed emergence of new products or services even at inception rather than a more formalized approach as the US companies seem to prefer.
TABLE 5: Factors pertaining to internal complexity
Factors ranked out of 4 USA
means SA
means
Values are created and attached as the system interacts with itself and the environment until the optimal solution is found. 1.85 4
Emergence of new products or services following on multiple solutions all of which are equally valuable at the initial stages (as opposed to rules imposed from the outside). 2.32 3.9
Average 2.085 3.95
The CEOs of a SA risk management enterprise described his role as ‘never lonely, participative and directive, experiential and experienced participative’. The strategy consisted of the following elements: strategic management is flexible, (2) strategy is monitored as a journey as often as twice a week, there are no
‘analogue activities’, only ‘acting and thinking digitally’, engaging in strategic planning is a continuous process using the concept of a sense-making loop from uncertainty to a shared understanding, their intent is to manage future risks before they take place, the execution of their strategy employs action learning, experiential learning and serious play are the

African Journal of Hospitality, Tourism and Leisure Vol. 3 (1) - (2014) ISSN: 2223-814X Copyright: © 2014 AJHTL - Open Access- Online @ http//: www.ajhtl.com
methodology framework for the planning sessions and a talent analysis, learning and communication styles linking assignments to a group of various competencies. Teams change depending on the task. Factors pertaining to complexity in the external environment The respondents were asked to rank the given issues with regards to a complex environment (table 6). Interestingly this is the only category where the mean responses for US and SA companies were almost the same, meaning that, the factors with regards to complexity, are perceived in much the same way by both economies.
However, the SA companies rated activities mostly the same, i.e. increasing the gap between enterprise models and software systems (4), the global financial crisis (4), increasing intertwinement such as strategic alliances (4), development of knowledge and technology and the incurred uncertainties and risk (3.9), technology and technology change (3.9) and horizontal relations (3.9). Not unexpectedly, the US companies identified technology and technology change as the most pressing factor and turbulent environments (1.75) and valuing pluralism (1.67) as the lowest complexity issues.
TABLE 6: Factors indicating a possible complex environment
Factors ranked out of 4
USA
means
SA
means
Increasing gap between enterprise models and software systems. 2.06 4
The global financial crisis 2.44 4
Increasing intertwinement such as strategic alliances 2.63 4
Development of knowledge and technology and the incurred uncertainties and risk 2.09 3.9
Technology and technology change 3.19 3.9
Horisontal relations 1.26 3.7
Value pluralism 1.67 3.7
Regulatory, macroeconomic, political, and societal 2.06 3.7
The emergence of new business models to improve market share or link adjacent businesses 2.92 3.6
The lack of focus in the knowledge economy on land, labor or capital 2.92 3.6
Turbulent environments 1.75 1.3
Industry dynamics 2.3 1.3
The waste created by the industrial revolution as opposed to a service economy 2.37 1.3
Natural disasters 2.61 1.3
Deterritorialisation 2.61 1.3
Off shoring and outsourcing 2.86 1.3
Growing lack of natural resources 1.85 1.1
Average 2.33 2.76
Problems pertinent to an unstable and unstructured environment The following factors were identified as developing economy indicators and would seem to be more attributable to the SA
companies than the US companies (table 7). As expected, SA scored on average higher on all the indicators and different in terms of the highest scoring items. The SA companies ranked highly problems relating to clashing cultures (4), training and

African Journal of Hospitality, Tourism and Leisure Vol. 3 (1) - (2014) ISSN: 2223-814X Copyright: © 2014 AJHTL - Open Access- Online @ http//: www.ajhtl.com
development (4), education (4) and understanding, implementing new technologies (4) and communication (3.9). Although these factors are primarily pertinent to a developing economy setting, it is interesting to note that the US companies identified problems in understanding and
implementing new technologies (2.26) as the most prevalent issue. This is in contrast to the GCI (2012) rating the US a 5.8 (out of 7) in terms of technological readiness. According to the GCI (2012) this issue is not an innovation and sophistication factor but slots under efficiency enhancers.
TABLE 7: Problems to be considered in a developing economy setting
Problems ranked out of 4 USA means SA means
Problems relating to clashing cultures 1.42 4
Problems relating to training and development 1.67 4
Problems relating to education 1.67 4
Problems understanding and implementing new technologies 2.26 4
Problems relating to communication 1.42 3.9
Problems relating to quality 2.02 3.7
Problems relating to productivity 1.67 1.1
Problems relating to geographical dispersion 1.67 1.1
Problems relating to labor 2.26 1.1
Average 1.78 2.99
Factors pertaining to maturity The only filter used in the study was the size of the organisation. CEOs in both countries averaged 5.7 years in their current position which is a reasonable time to understand
The strategy formulation and adoption. However, what is important is the process maturity of the organisation, i.e. the level of readiness and experience in relation to people, processes, technologies and consistent measurement practices, these being the basic elements of an organisation.
TABLE 9: Maturity levels
Levels ranked out of 5 USA mean
Process maturity in sample
SA mean
Process maturity in sample
People 4.7 Predictable 3.24 Established
Technology 4.9 Predictable 3.11 Established
Process 4.3 Predictable 2.19 Managed
Measurement 4.86 Predictable 2.03 Managed
Average 4.69
2.64
The US companies rated higher on all four aspects of organisational maturity with the highest rankings for technology (4.9), then for process (4.86), then measurement and, lastly people. In contract, the SA companies rated people highest (3.24); followed by technology (3.11), process (2.03) and measurement (2.03). According to this view,
US companies are mostly predictable whereas the SA companies are between managed and established. Based on the maturity model, the US companies’ ‘predictability’ indicates that, with regards to people, technology, process and measurement, the defined process is

African Journal of Hospitality, Tourism and Leisure Vol. 3 (1) - (2014) ISSN: 2223-814X Copyright: © 2014 AJHTL - Open Access- Online @ http//: www.ajhtl.com
performed consistently in practice, within defined control limits, to achieve its goals. Detailed measures of performance are collected and analysed. This practice leads to a quantitative understanding of process capability and an improved ability to predict performance. The quality of work products is quantitatively known. It was expected that the US companies will score at least some ‘optimizing’ scores indicating that the performance of the process is optimized to meet current and future business needs, and the process achieves repeatability in meeting its defined business goals. Quantitative process effectiveness and efficiency goals (targets) for performance are established, based on the business goals of the organisation. Obtaining quantitative feedback enables continuous process monitoring against these goals, and improvement is achieved by analysing the results and design of action plans. Optimizing a process involves piloting innovative ideas and technologies and changing non-effective processes to meet defined goals and objectives. On the other hand, in ‘established’ organisations (for the SA companies with regards to people and technology), the process is performed and managed using a defined process based
upon good principles. Individual adoptions of the process use approved, tailored versions of standard and documented processes. The resources necessary to establish the process definition are also in place. And the process delivers work products of acceptable quality within defined time scales. Performance according to specified procedures is planned and tracked. Work products conform to specified standards and requirements. The SA companies scored a ‘managed’ for process and measurement, indicating that these processes deliver work products of acceptable quality within defined time scales. Performance according to specified procedures is planned and tracked. Work products conform to specified standards and requirements. This is in line with the GCI (2012) indicating SA as an efficiency economy. Factors pertaining to operational excellence On this variable, the two samples seemed to be similar with the US companies on average slightly higher than the SA ones. This makes sense given South Africa’s status as an efficiency-driven economy, according to the GCI (2012).
TABLE 8: Operational excellence indicators
Indicators sorted on SA USA mean SA mean
Non-discrete business units 3.4 3.43
No gap between strategic intent and operations
3.34 3.41
Link between people and process 3.6 3.32
Scorecards introduced/ working 2.4 3.22
Adequate performance measurement 3.24 3.1
New innovations 3.9 3
New technology fundamental 2.87 2.96
Business units have well-articulated connections to overall institutional mission
2.6 2.93
Excellent BI 2.91 2.54
KPI’s, KPA’s formalized 2.92 2.3
Excellent KM 3.11 2.14
Value/supply chain streamlined 3.8 2.11
High capacity utilization 3.2 2.11
Average 3.18 2.81

African Journal of Hospitality, Tourism and Leisure Vol. 3 (1) - (2014) ISSN: 2223-814X Copyright: © 2014 AJHTL - Open Access- Online @ http//: www.ajhtl.com
One US-based CEO reflected that, at times he is the classic ‘lonely’ CEO, off by himself thinking and dreaming of what could/should be within the organisation. Yet, he feels that ‘Creative inspiration or concrete decision may come at any time including during the wee hours, driving my daughters to school or while having lunch. I am participative during many ‘blue sky’ meetings, where my role is decisive in theory but I am just another voice for the most part.’
Modelling strategy formulation and adoption The input variables above (purpose (X1), internal complexity (X2), external complexity (X3), developing economy problems (X4), organisational and process maturity levels (X5) and operational excellence indicators (X6)), were used as independent variables to determine a model for strategy Formulation and adoption in a developed or developing economy setting. With X5 dropped because of collinearity, and with a pseudo R2 of .82, table 10 shows the median regression for the US companies.
TABLE 10: Median regressions for US companies
Y Coef. Std. Err. t P>t [95% Conf Interval] x1 3.018808 7.242454 0.42 0.749 -89.0053, 95.04291 x2 -1.133711 3.708022 -0.31 0.811 -48.2486, 45.98118 x3 2.73826 7.026294 0.39 0.763 -86.53927, 92.01579 x4 -1.058823 4.395176 -0.24 0.850 -56.90483, 54.78718 x6 1.588235 .1997807 7.95 0.080 -.9502199, 4.12669 _cons -10.31352 1.851299 -5.57 0.113 -33.83651, 13.20947
Dropping X1 because of collinearity, and with an R
2 of .9997, table 11 summarises the median
regressions for the SA companies.
TABLE 11: Median regression for SA companies
y Coef. Std. Err. t P>t [95% Conf.Interval]
x2 .7337324 .0013433 546.21 0.001* .7166641, .7508007
x3 -.960006 .0004439 -2162.84 0.000* -.9656459, -.9543662
x4 -.004623 .0000984 -46.98 0.014* -.0058733, -.0033726
x5 .000721 .0009782 0.74 0.596 -.0117087, .0131507
x6 -.0031858 .0006571 -4.85 0.129 -.0115356, .0051639
cons 3.044701 .0091912 331.26 0.002* 2.927916, 3.161486
*Denotes significance at the 5% level. For the regression, the variables were entered in the following order (table 12).
TABLE 12: Order of variables enteringa
the equation
Country Model Variables Entered Variables
Removed Method
USA 1 x6, x3, x5, x4, x1b . Enter
SA 1 x6, x1, x4, x2, x5b . Enter
a. Dependent Variable: y b. Tolerance = .000 limits reached.

African Journal of Hospitality, Tourism and Leisure Vol. 3 (1) - (2014) ISSN: 2223-814X Copyright: © 2014 AJHTL - Open Access- Online @ http//: www.ajhtl.com
Turning now to regression and the prediction of variables that will explain strategy in a developing or a developed setting, quantile regression was used since
quantile regression estimates are more robust against outliers in the response measurements (table 13).
TABLE 13: Comparative quantile regression results for the SA and US companies
SA USA
Y Coef. P>t
│t│
Coef. P>t
│t│
x2 .73 .001*
3.02 .75
x3 -.96 0*
-1.13 .811
x4 -.04 .014*
2.74 .763
x5 .00 .596 -1.06 .85
x6 .003 .129 1.59 .08*
Cons 3.05 .002*
-10.32 .113
*Denotes significance at the 5% level
It follows from table 13 that the variables used in the formulation and deployment of strategy in the two datasets are different with X6 (issues relating to operational excellence) being the significant predictor in the US companies, and X2 (internal complexity), X3 (external complexity), and X4 (developing economy issues) being significant in the SA case. Therefore, in an innovation-driven economy like the USA, the middle-sized organisations may focus their strategy largely on operational excellence. The situation is much different with regards to the SA companies surveyed. Their strategies largely depend on internal and external complexity and, as expected, on issues relating to developed economies. The US companies show a simpler overall model for the Formulation and adoption of strategy than the SA companies. The latter are faced with complexity issues internal and external to the organisation as well as a dearth of instability issues (table 6 and table 7) emanating from a developing economy.
CONCLUSION AND RECOMMENDATIONS Interestingly, the SA companies focused more on the proposed activities to be used in strategy formulation and adoption. This was also true insofar as the purpose of the strategy and the internal complexity factors were concerned. Although on average, the US and SA companies dealt with the external environment similarly, the SA companies were more inclined to deal with the range of external complexities, except of course, for natural disasters and issues beyond their control. Naturally, the SA companies dealt with the developing factors more than the US companies did. Whereas the US companies showed as ‘predictable’ with regards to all the factors of maturity, the SA companies tested as ‘established’ and managed’ (El Emam and Madhaji, 1995). The US companies should a stronger use of business intelligence and knowledge management applications. The study is by no means perfect. Convenience sampling was used and the samples were too small. Based on the Likert scale responses a non-parametric

African Journal of Hospitality, Tourism and Leisure Vol. 3 (1) - (2014) ISSN: 2223-814X Copyright: © 2014 AJHTL - Open Access- Online @ http//: www.ajhtl.com
test had to be adopted. However, the use of middle-sized organisations is a good choice though as these organisations are more able to deal with change and reflect on the factors in strategy than large organisations consisting of many units can. Since the study confirms the efficiency focus established by the GCI (2012) the study can likely also inform about the impact of complexity on strategy. The study did not look at factors relevant to international trade and globalisation and assumed that operations took place in the country of origin. With regards to the US companies, process maturity was not included in the model because of its co-linearity with the other variables. The strategy was shown to be a function of operational excellence, and internal and external complexity was not included in the strategy formulation and adoption. On the other hand, in the SA sample, purpose was not included in the model because of its co-linearity with the other variables. The strategy was shown to be a function of internal and external complexity and of developing economy factors as was expected. The study shows that there are more variables at play in strategy formulation and adoption in the SA sample than in the US sample and the two are certainly not the same. With the introduction of complexity into the business domain, the US companies, and, possibly any company within a developed economy environment, will have to, take cognizance of the way South African, and other companies in developing economies, acknowledge and deploy complexity in their strategy formulation and adoption. Maybe one reason why this is not so at the moment, is that developed economies are currently seen to be innovation-driven which satisfies the order of the day. However, as the environment continues to change discontinuously, the need to acknowledge and allow for complexity will outgrow the
current focus on innovation and operational excellence. It is acknowledged that the sample sizes are too small for conclusivity. Furthermore, the terms developed and developing economies by no means indicate any sense of homogeneity between similar classified countries, so that the country selection can change the outcomes of this research. Furthermore, in order to conduct a qualitative study, the sample sizes are necessarily small which may lead to a-similar results. However, the findings here are interesting and seem indicative of an intuitive difference between the two domains with regards to internal and external complexities and their influence on the strategy. The obvious limitation of the study is the non-generalisability of the findings due to the small sample size and the convenience sampling scheme employed. Given the nature of the study, this was unavoidable. Moreover, the breaking down of the issues into measurable parts in a study about complexity uses a form of reductionism that goes against the nature of complexity principles. Lastly, the study, being small, did not stratify according to industry although such a sampling scheme will certainly elevate the differences in industry with some more volatile than others. Undertaking a similar study on a bigger scale and using stratification according to industry, can greatly improve the quality of the findings of this study.
References
AHUJA G & LAMPERT CM. 2001. Entrepreneurship in the large corporation: a longitudinal study of how established firms create breakthrough Inventions. Strategic Management Journal, 22(6-7): 521–543, June-July.

African Journal of Hospitality, Tourism and Leisure Vol. 3 (1) - (2014) ISSN: 2223-814X Copyright: © 2014 AJHTL - Open Access- Online @ http//: www.ajhtl.com
ANDERSON P. 1999. Complexity theory and organization science. Organization Science, 10(3): 216–232, May-June. AXELROD R & COHEN MD. 2000. Harnessing complexity: Organizational implications of a scientific frontier. Basic Books: New York.
BERGER PL & LUCKMANN T. 1966. The social construct of reality. New York: Anchor Books. BLESS C & HIGSON-SMITH C. 1995. Fundamentals of social research methods: an African Perspective. Kenwyn: Juta. COOKE P, HEIDENREICH M & BRACZYK HJ. 2004. Regional innovation systems. Routledge: London. CRESSWELL JW. 2009. Research designs: qualitative, quantitative and mixed methods approaches. 3rd edition. Thousand Oaks: Sage publication. DUTTA SK. 2012. Dynamic capabilities: fostering ambidexterity. SCMS Journal of Indian Management, 9(2): 81-91, April. EL EMAM K & MADHAVJI NH.1995. The reliability of measuring organizational maturity. [Internet: http://citeseerx.ist.psu.edu/viewdoc/download?doi=10.1.1.55.8733&rep=rep1&type=pdf; downloaded on 2012-09-18.] GABRIELE A, BARATAV K & PARIKH A. 2000. Instability and volatility of capital flows to developing countries. The World Economy, 23(8): 1031-1056, August. GERBER-NEL C, KOTZE T & NEL D. 2005. Marketing research. Claremont: New Africa Books. GLICK R & HUTCHISON MM. 2005. Capital controls and exchange rate
instability in developing economies. Journal of International Money and Finance, 24(3): 387-412, April.
GOTTFREDSON M & ASPINALL K. 2005. Innovation versus complexity: What is too much of a good thing? Harvard Business Review, 83(11): 62-71, November. LEWIN R & REGINE B. 1999. The soul at work: unleashing the power of complexity science for business. London: Orion Business Books. LUBATKIN MH, SIMSEK Z & VEIGA JF. 2006. Ambidexterity and performance in small-to medium-sized firms: The pivotal role of top management team behavioral integration. Journal of Management, 32 (5): 646-672.
MANKIW NG.2007. Principles of Economics. 4th edition. Boston: Cengage Learning. MAURO FG. 2003. Multinationals, ideology, and organized labor - the limits of convergence. Princeton: Princeton University Press.
MCMILLAN H & SCHUMACHER S. 2006. Research in education: evidence-based inquiry. 6th edition. Boston: Pearson Education Inc. MOON S & HUH M. 2010. Building organizational ambidexterity. [Internet: http://dl4.globalstf.org/?wpsc-product=building-organizational-ambidexterity; downloaded 2012-09-14.]
OLIVER MS. 2009. Information Technology Research: A Practical guide for computer Science and Informatics. 3rd edition. Pretoria: Van Schaik.
African Journal of Hospitality, Tourism and Leisure Vol. 3 (1) - (2014) ISSN: 2223-814X Copyright: © 2014 AJHTL - Open Access- Online @ http//: www.ajhtl.com
O’REILLY CA & TUSHMAN ML.2004. The ambidextrous organization. Harvard Business Review, 82(4):74-81, April. PERROW C. 1967. A framework for the comparative analysis of organizations. American Sociological Review, 32(2):194-208, April. RAISCH S & TUSHMAN ML. 2011. A dynamic perspective on ambidexterity: structural differentiation and boundary activities. HBS Working Paper Number: 11-111. Boston: Harvard Business School. ROSEMANN M & DE BRUIN T. 2005. Towards a business process management maturity model. [Internet: http://sdaw.info/asp/aspecis/20050045.pdf; downloaded on 2013-06-04.] SMITH D. 2010. Exploring Innovation. 2nd edition. Berkshire: McGraw-Hill Education. SULLIVAN A & STEVEN MS. 2003. Economics: principles in action. Upper Saddle River, New Jersey: Pearson Prentice Hall
TAYLOR JS, DE LOURDES MACHADO M & PETERSON MW. 2008. Leadership and strategic management: keys to institutional priorities and planning, European Journal of Education, 43(3):369–386, September.
THOMPSON JD & MACMILLAN IC. 2010. Business models: creating new markets and societal wealth, Long Range Planning, 43(2–3):291–307, April-June. ZIMMERMAN B, LINDBERG C & PLESK P. 2012. Edgeware: Lessons from complexity science for health care leaders. Irving, TX: VHA Incorporated. WORLD BANK. 2013. Classifications of countries according to their economies. [Internet: http://data.worldbank.org/country; downloaded on 2013-05-27.] World Economic Forum. 2011. Global Competitiveness Report 2011-2012. [http://www3.weforum.org/docs/WEF_GCR Report_2011-12.pdf; downloaded on 2012-10-23.]