towards true underground infrastructure surface documentation · condition monitoring device...
TRANSCRIPT
reviewed paper
REAL CORP 2010 Proceedings/Tagungsband Vienna, 18-20 May 2010 – http://www.corp.at
Editors: Manfred SCHRENK, Vasily V. POPOVICH, Dirk ENGELKE, Pietro ELISEI
1
Towards True Underground Infrastructure Surface Documentation
Thomas Ortner, Gerhard Paar, Gerd Hesina, Robert F. Tobler. Bernhard Nauschnegg
(Thomas Ortner MMSc, VRVis, Donau-City-Straße 1,Vienna A-1220, [email protected]) (DI. Gerhard Paar, Joanneum Research, Graz A-8010, [email protected]) (Dr. Gerd Hesina, VRVis, Donau-City-Straße 1,Vienna A-1220, [email protected]) (Dr. Robert F. Tobler, VRVis, Donau-City-Straße 1,Vienna A-1220, [email protected])
(DI (FH) Bernhard Nauschnegg, Joanneum Research, Graz A-8010, [email protected])
1 ABSTRACT
Underground infrastructure becomes more and more important in urban development. Building and maintaining tunnels typically involves three phases: construction, monitoring and repair. Throughout all three phases engineers increasingly demand a visually and geometrically exact digital representation of a tunnel surface involving both high resolution imagery and laser scan data. These requirements pose a challenge to all phases of the visualization pipeline. After retrieving geo-referenced geometric and image data with a surface resolution in the range of 1mm and better, novel processing and mapping techniques are applied to enable a fast and efficient rendering while preserving high sensor data quality. Visualization of such data requires the handling of huge amounts of 3D Points, high-resolution textures and additional graphical elements that explain the context of the displayed data. Without additional processing the sum of this data exceeds the capacities of both the graphics card and the main memory. The paper describes how a tunnel of several kilometers length is digitalized by range laser scanners and cameras, processed into an efficient data structure and finally integrated into a fully interactive 3D visualization combining multiple data sources for real-time display and interpretation.
2 INTRODUCTION
The quality assessment and - control of roads, tunnels, railroad tracks, water channels, airport runways and other linear structures has been an issue ever since such structures were in use. The documentation of surface defects in terms of location, physical and geometrical properties, amount of damage, and visual appearance is not only important for safety reasons. Frequent maintenance relies on the detection of potentially hazardous defects to initiate focused correction measures at an early state to save costs due to small interventions, keep the risk level low, and avoid unexpected closures of traffic lines. First means of inspection were based on the human visual system, assisted by mechanical measurement devices, chemical and physical tests on manually selected points of interest, and the installation of simple geodetic monitoring devices. Hand- drawings and notes were used for localization and context description of defects, followed by photographic documentation. The history of changes became important when a unified quality management came into existence.
Nowadays high-resolution vision sensors are available to map the surface of linear structures. Laser scanners, digital cameras, mobile platforms that host sophisticated suites of such devices in combination with navigation abilities, and the relating on-site Hardware and Software data acquisition means collect consistent sets of geo-coded 3D structure and texture information. A solution to the challenge of maintaining the huge amounts of data involved, while providing an ergonomic and user-friendly access to the relevant stages of information is content of this paper.
3 RELEVANT WORK
The measurement and visual surface inspection of linear structures using passive and active vision sensors started to be a well established application area of digital vision metrology about 10 years ago. Several systems for linear structure surveying, in particular tunnels, are on the market with different approaches and sensor configurations, most of them using laser scanners in frame scan (Amberg 2010, Fröhlich 2004), or line scan mode (Spacetec 2010). Road profiling with a resolution of several cm has been covered by mobile mapping approaches using Inertial Measurement Unit (IMU) and Global Positioning System (GPS), for example with the MoSES (Gräfe 2004) system which also applies digital cameras, or the Austrian road condition monitoring device RoadStar (Arsenal 2010). With the Dibit system (Dibit 2010) a first photogrammetry-based solution for tunnel excavation monitoring was presented in 1999. This application

Towards True Underground Infrastructure Surface Documentation
2
REAL CORP 2010: Liveable, prosper, healthy CITIES for everyone
segment is also covered by an Austrian provider using static laser scanning (Geoconsult 2010). For geologic excavation documentation the high spatial and radiometric resolution of digital stereo images has been well established (Gaich 2004). The combination of laser scanning and high-resolution digital images underwent some recent research (Abmayr 2004, Ulrich 2003). A combination between laser scanning and digital camera (Paar 2005) turned out to be robust in the tunnel case. In the first stages of application the measurement of tunnel surfaces during different construction phases (excavation, shotcrete, segments of TBM-Tunnel Boring Machines, final lining) was emphasized. With growing textural surface resolution the technology is also suited for the inspection and the inventing of existing tunnels and it is even able to support the remote mapping of cracks (Paar 2006). Although great strides have been done during the last years in bringing visualization to the attention of the engineering community, it has not yet been universally accepted as a tool for typical engineering tasks. Visualization of linear structures such as tunnels represents a great opportunity to remedy this lack, and apply some of the recent visualization techniques of multi-dimensional data (Aigner 2007) to a technical problem. One of the main features of structure visualization is the time-dependent nature of the data (i.e. there are multiple data sets from the same structure, representing different snapshots of its state). Although some of the work on time dependent data (Kosara 2004, Piringer 2005) can be applied to this task, it has to be adapted, since in previous research time is mostly represented by a continuous dimension, as opposed to the discrete nature of the time-dimension in the problem at hand. Nevertheless some of the techniques for handling large data can be applied and extended in order to deal with the huge amount of data provided by structure scanning. Since it was possible to acquire and export data in an ordered fashion the data at hand can be processed similar to a height map. Since graphics cards of the last two generations offer a high triangle throughput a simple multiresolution level of detail rendering approach was chosen as described in Lübke (2001, p.187). Since laser scan data is point based one could also consider a system similar to QSplat (Rusinkiewicz 2000). QSplat assumes arbitrary points and does not consider the advantage of ordered point sets, it offers however a sophisticated data management approach to deal with large point sets. As it will be discussed in later sections specific data requires to be rendered as polygonal lines in 3d space. Shader based approaches as discussed in Akenine-Möller (2008, p.528) have been considered, but neglected since they might be difficult to integrate and combine with the other rendering. Volumetric lines (Nvidia 2010) did not yield convincing results due to artifacts. In the end a simple and fast polygonal approach was chosen as it is described in more detail in section 5. ,
4 DATA ACQUISITION & PROCESSING
4.1 Data Acquisition
The data acquisition system is based on state-of-art vision sensors (e.g. laser scanners, digital cameras). The whole system is moved through the tunnel by means of a mobile platform (Figure 1). Data acquisition takes place either on certain positions (stop-and-go mode, using spherical laser scans) or continuously moving (dynamic mode, using a stream of laser lines). It typically produces data consisting of rectangular arrays of scan points, and a number of images that overlap this scan area. A number of such – ideally overlapping – 3D and texture data sets represent a tunnel.
Figure 1: Data acquisition platform equipped with laser scanner and camera (left, center), tunnel site(right)
Thomas Ortner, Gerhard Paar, Gerd Hesina, Robert F. Tobler. Bernhard Nauschnegg
REAL CORP 2010 Proceedings/Tagungsband Vienna, 18-20 May 2010 – http://www.corp.at
Editors: Manfred SCHRENK, Vasily V. POPOVICH, Dirk ENGELKE, Pietro ELISEI
3
In order to facilitate merging of several scans the global orientation of the system must be known. It is determined either by exterior measurement using a radio-controlled theodolite, by vision data acquisition of known targets (Kaltenböck, 2004) or by using odometry in combination with an inertial navigation system (INS). The individual sensors are oriented relatively to each other in a pre-calibration step. The orientation between different vision sensors on the same sensor platform is further refined by texture matching on measurement data level (Paar et al., 2005).
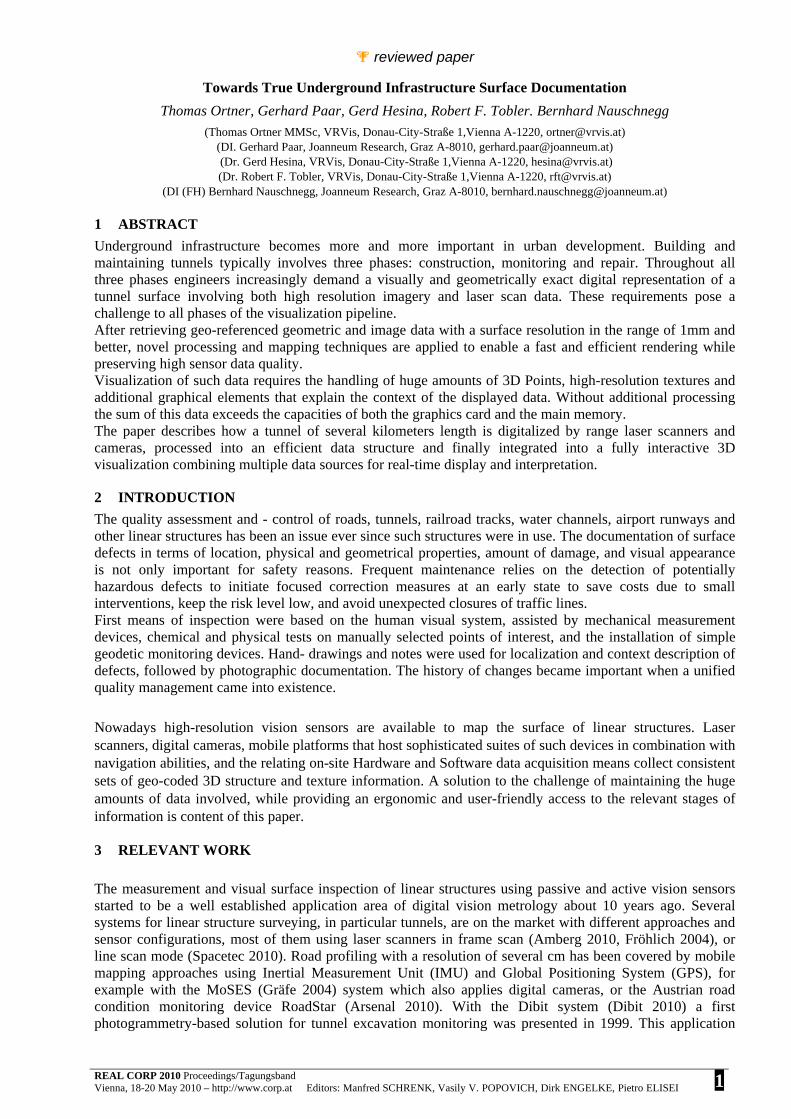
4.2 Processing Workflow Sketch
Passive and active vision sensor data (e.g. Camera images and laser scans) are processed independently from each other as far as possible, since one camera image generally can overlap several laser scans and vice versa. Further, pre-processing of the measurement data is kept to a minimum to avoid artifacts or texture blurring. This leads to a workflow as depicted in Figure 2. The mapping of the laser data on the tunnel surface uses a parameterized tunnel model and a regular grid as a digital surface model on top of it (Bauer & Paar, 1997). Co-registration of adjacent measurements takes place using textured point cloud matching (Pottmann et al, 1995).
Figure 2: Processing workflow, resulting in an Ordered Point Cloud (OPC)
4.3 Visualization Data Preparation
The data acquisition system produces huge amounts of data for a tunnel of several kilometers length. Assuming a texture resolution of about 1 mm and a geometric resolution of about 1 cm, close to 200 GB of raw data for a tunnel of one km length are to be expected. To facilitate fast and efficient rendering of such data amounts with affordable hardware, the measurement data is converted into a data structure which allows the renderer to be dynamically fed with manageable data and supports multiple levels-of-detail (LoD). The so-called Ordered Point Cloud (OPC) consists of a multiresolution structure both for the 3D surface and the texture represented as individual grids. For the following rendering it allows the access to the processed data in various resolution levels, thus ensuring the efficient usability of LoD concepts.
5 VISUALIZATION
The demands to a visualization system grow with increasing resolution. As soon as the data quality at the end of the processing pipeline exceeds the ability of paper plots (as used in standard construction and quality engineering processes), the user needs to get access to the data by a real-time rendering system, providing an “immersive” view on one or more computer screens, compared to the situation of physically moving around in the displayed environment. Arbitrarily changing the distance and viewing position allows a quick orientation and the effective microscopic investigation of artifacts almost at the same time.
After data acquisition and pre-processing several challenges are therefore posed to the visualization stage which can be divided into the following three categories:
Handling and rendering data that exceeds the size of the main memory or the graphics card’s memory, respectively
Simultaneously visualizing data of various forms without creating visual clutter Interacting with data in a manner desired by the future users of the described application
In the following these three challenges are dealt with in detail.
5.1 Rendering Massive Amounts of Data
Considering a tunnel of several kilometers length and the resulting processing resolutions described in 4.3 the exported OPC data may easily exceed the limits of customer end system resources. Further, tunnels often

Towards True Underground Infrastructure Surface Documentation
4
REAL CORP 2010: Liveable, prosper, healthy CITIES for everyone
consist of multiple tubes and the end-user might want to compare multiple phases, so the memory consumption may easily increase. A computer graphics-based solution designed to navigate through large data sets at interactive frame rates typically facilitates two strategies: An out-of-core (OOC) data management and a LoD rendering algorithm, which are responsible for not running out of main memory and efficiently stream and display data. To navigate through the scene, the user moves the so called camera by changing its position and / or viewport.
5.1.1 Out-Of-Core Data Management
The first step of an OOC strategy is to decide which subset of the whole data is crucial to support the current view and therefore is to be streamed from the hard drive to main memory. In our case this is decided for each OPC based on the distance to the camera position and the closest point on an OPC’s bounding box. For instance, being inside the tunnel there is no need to load OPCs outside of a radius of 300 meters. Further OPCs outside the viewing frustum, i.e. behind the viewer or outside of the peripheral sight, are ignored. When constantly streaming more data, while navigating through the tunnel the viewed data still might exceed the system’s main memory at some point. Consequently the OOC algorithm has to remove OPCs which have become irrelevant. Rendered OPCs are constantly enqueued in a least recently used (LRU) manner, which keeps its element ordered by age. In regular intervals all OPCs exceeding a certain age are removed from the system memory. Assuming a constant viewing distance, and that the OPCs in a data set are exported at about the same length the number of OPCs processed at once is constant. At this point the user might adjust the distance constraint to meet the desired balance between performance and sight.
Figure 3: Illustration of capture density – point grid with 0.7 cm average distance between two points

Thomas Ortner, Gerhard Paar, Gerd Hesina, Robert F. Tobler. Bernhard Nauschnegg
REAL CORP 2010 Proceedings/Tagungsband Vienna, 18-20 May 2010 – http://www.corp.at
Editors: Manfred SCHRENK, Vasily V. POPOVICH, Dirk ENGELKE, Pietro ELISEI
5
5.1.2 Level of Detail Rendering
According to Luebke (2001 p.10) LoD rendering dynamically selects the most appropriate level of detail to support the current view. The previously discussed OPC hierarchy consists of multiple resolution levels, where each level spatially encloses its child levels.
Since the hierarchy is created in a bottom up fashion the level 0 at the bottom contains the highest detail (original scan resolution). Considering a 3 level hierarchy level 1 is a simplification of level 0, whereas level 2 is a simplification of level 1 as depicted in Figure 4. Keeping in mind that all levels consist of an ordered sequence of points an OPC can be thought of as a pyramid of multiple grids. Except of residing on the tunnels curved surface the given data itself does not show any significant difference to height maps or terrain data as seen in Luebke (2001, p.186). Applying a straight-forward view-dependent terrain LoD algorithm carefully combines various LoDs according to the camera’s position and viewport, i.e. scan data at a distance of 200m is barely visible so there is no need to render it at full detail whereas data directly in front of the viewer is desired to present itself at full detail. Due to the nature of the data structure all LoDs on the path to the desired level are streamed and rendered subsequently, which results in a gradual refinement of the visible surface data. Although Figure 5a shows a significant simplification at the end of the tunnel this lack of detail is barely perceivable in Figure 5b. The image artefacts might be further reduced by applying anisotropic filtering directly offered by the graphics hardware, but this might impose a considerable performance penalty on lower-end and medium- priced graphics cards.
Figure 5: Different levels of detail shown in point (a) and solid mode (b)
Which LoD is ought to be displayed at which distance depends on the users current aims so their association is chosen semi-automatically. Distances are calculated by a quadratic function taking the real world scan resolution into account. Coefficients can be adjusted through a simple slider to find a good balance between speed and quality.
5.1.3 Rendering and Intersection Optimizations
As depicted in Figure 3 positions are arranged in order as a 2 dimensional grid. This attribute allows creating a triangulated mesh by computing index arrays at runtime. Since the data exporter strives for creating patches of the same size the index arrays are identical for most of the grids and can be cached.
Figure 4: Multiresolution hierarchy
0 0 0 0
1 1
2
Towards True Underground Infrastructure Surface Documentation
6
REAL CORP 2010: Liveable, prosper, healthy CITIES for everyone
To optimize upload times of index arrays to the graphics card triangle strip indices are used as suggested in Akenine-Möller (2008, p.549-552). Their size is reduced to about a third in comparison to triangle list indices. Although the layout of the OPC data structure is identical to the typical structure of terrain data the curvature of the tunnel poses a significant challenge to the distance computation. Where it is sufficient for terrain rendering to compute the distance between the viewer and the bounds of a certain level in the hierarchy this method turned out to be too inaccurate for a curved surface. Therefore a kd-tree data structure is created for the highest level in an OPC hierarchy. The key advantage of a kd-tree is to greatly speed up ray / triangle intersections. By shooting random rays into the viewing direction the viewed surface is intersected with spoken-of rays and yields far more accurate distance to the surface itself.
5.2 System Exploitation Use Cases
So far the described rendering application solely dealt with the presentation of acquired real world data at high visual fidelity while not exceeding the system’s resources and maintaining interactive framerates. At this point data from other sources is introduced to create a mixed reality allowing the user to draw new conclusions by putting them into context. This step marks the transition from a presentation to actual visualization. In the following the different elements and integration will be discussed such as database objects, deviations, axes and marker planes.
5.2.1 Line Based Objects
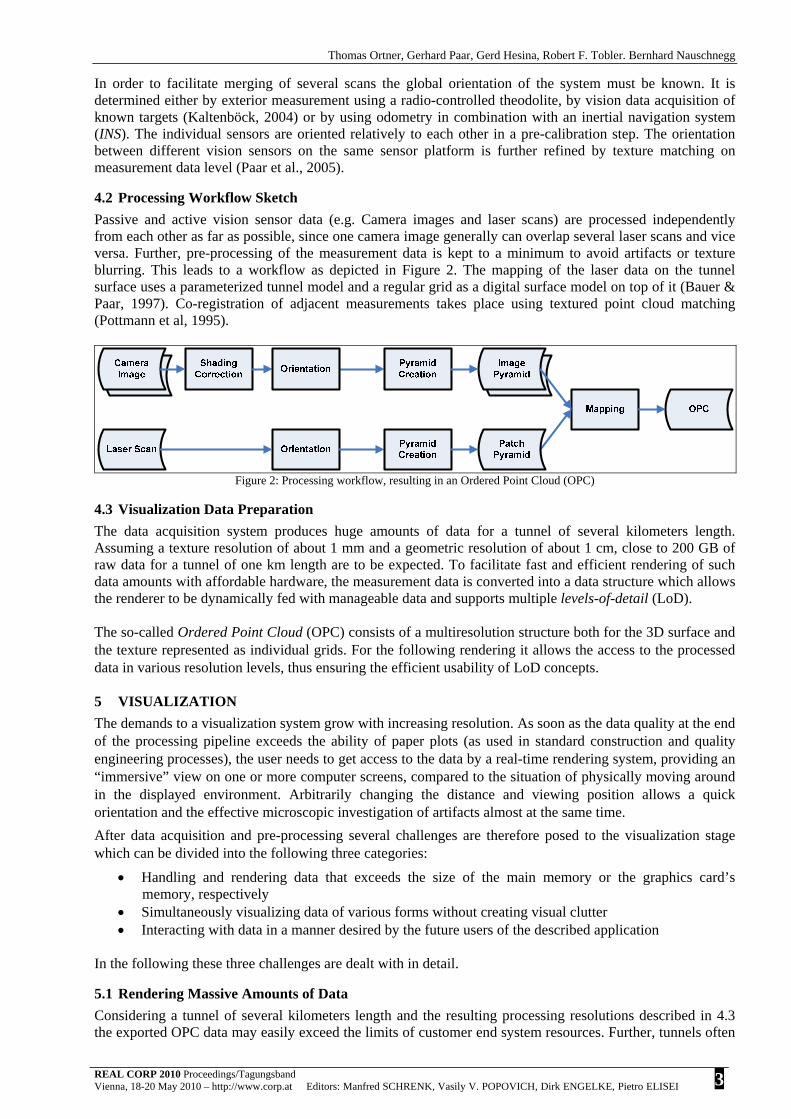
With a certain tunnel a set of polygonal objects is associated. Such a polygon is described by its positions as a list of line segments, its color and a flag defining whether it is closed or not. Since these objects emerge from CAD (Computer Aided Design) programs they are also desired to be represented in the scene as lines. These polygons are typically used to indicate niches, cables, hatches and especially cracks (semi-automatically mapped (Paar et al, 2006)) and damaged spots on the tunnel surface. Although the used graphics API DirectX offers line rendering, lines can only be displayed at a width of one pixel and are not hardware accelerated by customer-end graphics cards. To overcome these limitations each line segment is rendered as a triangulated cylinder with its vertices displaced by the vertex shader. The displacement factor is modulated by distance so the lines always occupy the approximately same width in pixels on screen. By introducing a scale factor the line width may also be adjusted in real-time by the user.
Figure 6: Cracks and surface defects of different classifications / Viewer embedded in Dibit7 framework
with project tree and viewer map to the left
Thomas Ortner, Gerhard Paar, Gerd Hesina, Robert F. Tobler. Bernhard Nauschnegg
REAL CORP 2010 Proceedings/Tagungsband Vienna, 18-20 May 2010 – http://www.corp.at
Editors: Manfred SCHRENK, Vasily V. POPOVICH, Dirk ENGELKE, Pietro ELISEI
7
5.2.2 Dynamic and Static Planes
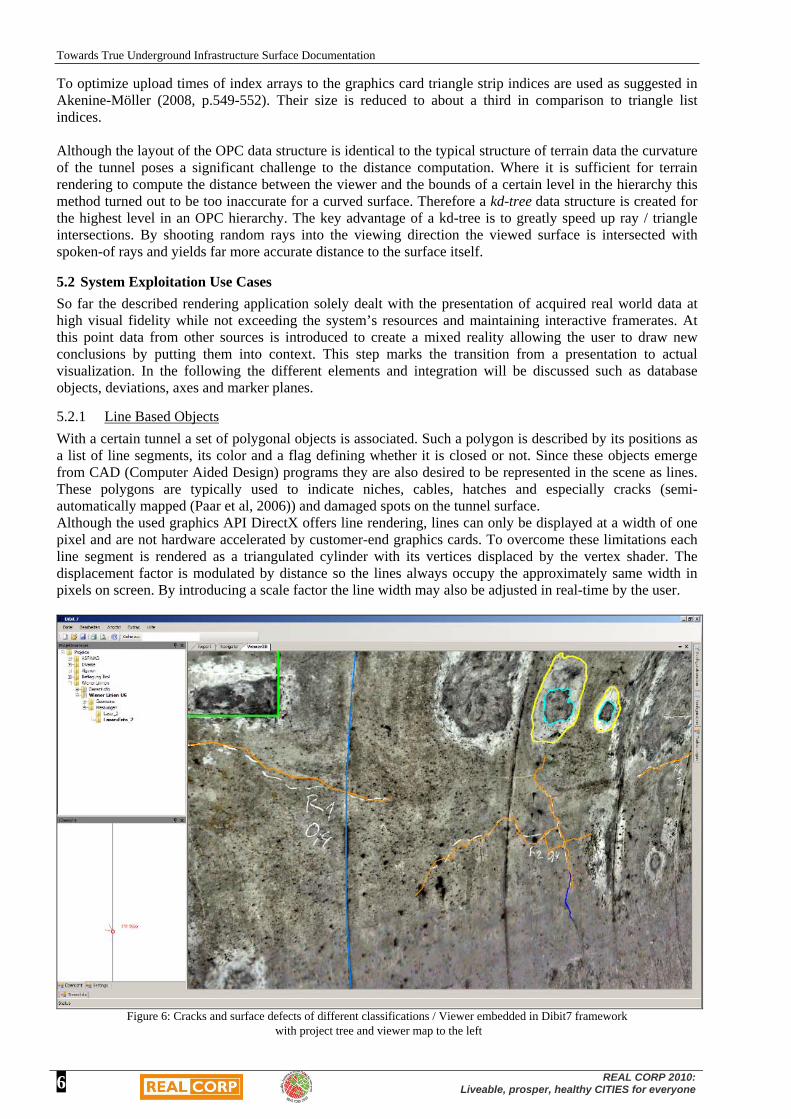
To indicate a tunnel’s profile at a specific station of the tunnel axis a plane orthogonal to the axis is constructed. Planes are represented by a semi - transparent quad (i.e. a small elementary patch, defined by 4 3D points accurately or approximately lying on the same plane) of given size and color. Since the graphics card blends the solid tunnel geometry with the protruding semi - transparent quad the course of the profile can be seen as a change in color tone (see Figure 7).
Figure 7: Static planes and billboards on the left (axis, cracks and cables as poly-lines),
dynamic axis aligned plane on the right
A list of static planes is sent to the renderer defined by a position and a normal vector, whereas the dynamic plane is computed in real-time while navigating along the tunnel axis. To assure correct blending, solid surfaces have to be rendered before transparent ones. Since it is necessary to display more than one plane at once the respective transparent quads have to be rendered in a view-dependent order, otherwise blending artifacts may occur. The user may also specify a maximum number of planes to be rendered, to avoid visual clutter.
5.2.3 Data Maps
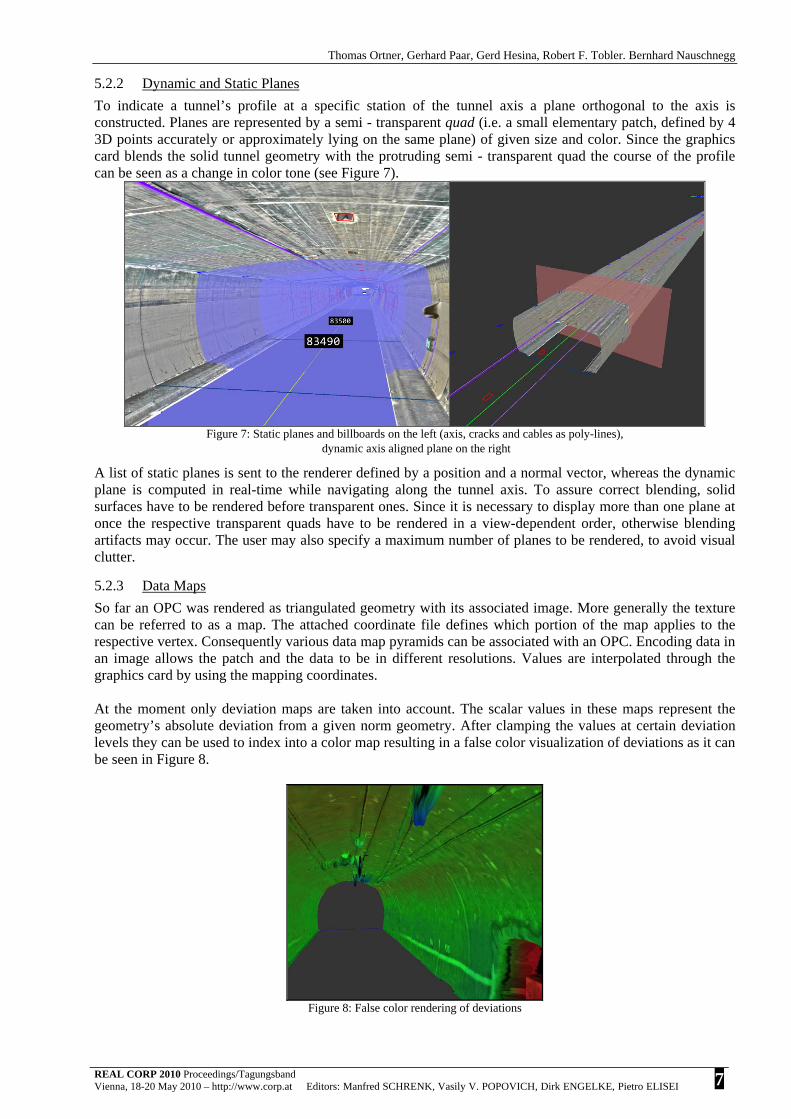
So far an OPC was rendered as triangulated geometry with its associated image. More generally the texture can be referred to as a map. The attached coordinate file defines which portion of the map applies to the respective vertex. Consequently various data map pyramids can be associated with an OPC. Encoding data in an image allows the patch and the data to be in different resolutions. Values are interpolated through the graphics card by using the mapping coordinates. At the moment only deviation maps are taken into account. The scalar values in these maps represent the geometry’s absolute deviation from a given norm geometry. After clamping the values at certain deviation levels they can be used to index into a color map resulting in a false color visualization of deviations as it can be seen in Figure 8.
Figure 8: False color rendering of deviations

Towards True Underground Infrastructure Surface Documentation
8
REAL CORP 2010: Liveable, prosper, healthy CITIES for everyone
5.2.4 Transparent Surfaces
Certain use cases might require the rendering of two phases of a tunnel on top of each other where one of them is rendered transparent. At the current stage of the application this mode is utilized to perform a visual structural clearance intersection. Therefore a triangulated mesh is extrapolated from structural clearance profiles along the axis by the exporter. Rendering the structural clearance mesh transparent over the solid tunnel geometry indicates an intersection between surfaces as a change in color (see Figure 9.).
Figure 9: Transparent surface rendered on top of solid surface
This approach is similar to transparent planes in 5.2.2, however the more complex form of the transparent surface requires a view-dependent sorting of every single triangle. Therefore a binary space partition (BSP) tree is created as a pre processing step, which allows accessing all triangles in the sequence they are seen in.
5.3 Passive Interaction with Data
Beyond rendering data, in the given scenario of quality engineering and inspection a specific interaction with the data is required. At this point of the application only passive interaction with data will be discussed since no manipulation of the data occurs. In the following some typical aspects of interaction are covered.
5.3.1 Axis Navigation
When navigating through a tunnel it is often desired to focus the user’s movement to remain along the tunnel axis instead of free-fly navigation through the scene. The tunnel axis is discretized by a polygon, thus by applying straight forward mathematic concepts any positions and viewing vectors along the axis can be computed. Offsets in x and y dimensions in respect to the course of the axis allow to navigate along paths parallel to it.
5.3.2 Time aware Rendering, Switchable Nodes & Markup Colors
When displaying numerous data sets and different forms of data it is useful to mask objects or highlight them in a certain color. The user may mask certain construction phases or whole building projects to avoid visual clutter or to increase loading and rendering performance. Since OPCs contain a timestamp it is possible to use a time frame as mask criteria. The boundaries of the time frame can be adjusted in real time so it illustrates the growing of the tunnel over time. Including the latest working tunnel face for a given time frame conveys an even more convincing visualization of the tunnel driving during construction.
6 CONCLUSION
Using lasers scanners and other vision sensors is a rather young approach to conduct surface documentation of urban infrastructure installations. The acceptance of 3D visualization systems is still limited among potential users but steadily growing. The presented visualization is part of the newest version of a commercial software lineage. Since previous versions only offered limited 3D rendering capabilities the visualization of and interaction with the acquired data were brought a considerable step forward. At this point the discussed features represent a basic subset

Thomas Ortner, Gerhard Paar, Gerd Hesina, Robert F. Tobler. Bernhard Nauschnegg
REAL CORP 2010 Proceedings/Tagungsband Vienna, 18-20 May 2010 – http://www.corp.at
Editors: Manfred SCHRENK, Vasily V. POPOVICH, Dirk ENGELKE, Pietro ELISEI
9
by providing efficient rendering of large data sets, concise visualization of additional information and intuitive interaction, including movement. Although the presented results look promising the application lacks two features, which may be considered as crucial for the acceptance among the tunnel construction community: Measurement and manipulation or creation of new data. Improved measurement may include the computation of the volume between virtually designed tunnel geometry and a real-world scanned rough excavation. Consequently it is possible to calculate the amount of concrete needed to pave the tunnel surface. Further simple measurements such as direct and on the surface distances have to be included. Integration of previous modules would offer great improvements in usability, such as performing the semi-automatic crack detection while navigating through the scene. In this way the ability of a real-time graphical representation of as-built underground scenes and attached visualization of relevant additional information has reached the maturity to sustainably replace paper print-outs and the necessity to ensure on-site expert presence. This represents a considerable step forward in Urban planning, safety management and the objective and repeatable monitoring & maintenance of public transport installations.
7 ACKNOWLEDGEMENTS
This work is part of the “FIT-IT” (www.fit-it.at) Project VILMA (contract number 815991/14444 GLE/ROD), funded by the Austrian Federal Ministry for Transport, Innovation and Technology and FFG (www.ffg.at)
8 REFERENCES Abmayr T., Härtl F., Mettenleiter M., Heinz I., Hildebrand A., Neumann B., Fröhlich C. “Realistic 3d Reconstruction – Combining
Laserscan Data With Rgb Color Information”. Proc. XXth ISPRS Congress, 12-23 July 2004 Istanbul, Turkey. Aigner, Miksch, Müller, Schumann, Tominski: "Visualizing Time-Oriented Data: A Systematic View" in Computers&Graphics,
2007. Akenine-Möller, T., Haines, E., Real-Time Rendering. 3rd Ed. Natick: A. K. Peters. 2008. Amberg, http://www.amberg.ch/at/uploads/media/Brochure_TMSTunnelscan_en.pdf, 2009 Dibtit, http://www.dibit.at, 2010 Fröhlich, C., Mettenleiter, M. Terrestrial Laser Scanning – New Perspectives in 3D Surveying. In: International Archives of
Photogrammetry, Remote Sensing and Spatial Information Sciences, Vol XXXVI – 8/W2, Freiburg, Germany, 2004, pp. 7-13
Gaich, A., Schubert, W., Pötsch, M. “Reproducible rock mass description in 3D using JointMetriX3D system”, Eurock 2004, Proc.
of the ISRM Regional Symposium Eurock 2004 & 53rd Geomechanics Colloquy, Salzburg, Austria, pp. 61-64, 2004. Geoconsult, http://www.geoconsult.at, 2010 Gräfe, G., Caspary, W., Heister, H., Klemm, J., Lang, M. Erfahrungen bei der kinematischen Erfassung von Verkehrswegen mit
MoSES. 14th International Conference on Engineering Surveying Zürich, March 15. – 19. 2004 Helmut Doleisch, Martin Gasser, Helwig Hauser: "Interactive feature specification for focus+ context visualization of complex
simulation data", Proceedings of the symposium on Data visualisation 2003 Kosara, Bendix, Hauser: "Timehistograms for large, time-dependent data", Joint Eurographics – IEEE Symposium on
Visualization, 2004. Luebke, D., Reddy, M., Cohen, J., Varschney, A., Watson, B., Huebner, R., Level of Detail for 3D Graphics. Morgan Kaufmann,
2002 Nvidia, Volumetric Lines http://http.download.nvidia.com/developer/SDK/Individual_Samples/screenshots/samples/
VolumeLine.html, 2010.

Towards True Underground Infrastructure Surface Documentation
10
REAL CORP 2010: Liveable, prosper, healthy CITIES for everyone
Paar G., Kontrus H., Bauer A.: Texture Based Fusion Between Laser Scanner and Camera for Tunnel Surface Documentation. In: 7th ISPRS Conference on Optical 3-D Measurement Techniques. Vienna, 2005.
Paar, G., Caballo-Perucha, M., Kontrus, H., Sidla, O., Optical Crack Following on Tunnel Surfaces; Proc. SPIE OpticsEast,
Photonics for Applications in Industry, Life Sciences, and Communications, Boston, USA; October 1-4, 2006 Piringer H., Design guidelines and concepts of the infovis library. Technical report, VRVis, 2005, TR-VRVis-2005-034. Rusinkiewicz, S., Levoy, M., QSplat: A Multiresolution Point Rendering System for Large Meshes. Proceedings of ACM SIG-
GRAPH 2000, Computer Graphics Proceedings, 2000. Spacetec, http://www.spacetec.de, 2009