town of elkton - maryland water assessment plan for town of elkton water treatment plant prepared by...
TRANSCRIPT

SOURCE WATER ASSESSMENT PLAN for
Town of Elkton Water Treatment Plant
Prepared By
Water Management Administration Water Supply Program
June 2005
Robert L. Ehrlich, Jr. Kendl P. Philbrick Governor Secretary Michael S. Steele Jonas A. Jacobson Lt. Governor Deputy Secretary

TABLE OF CONTENTS EXECUTIVE SUMMARY ........................................................................................ iii 1.0 BACKGROUND ...............................................................................................1 2.0 INTRODUCTION.............................................................................................1 A. Description of Surface Water Source .......................................................2 B. Water Supply Development......................................................................2 3.0 RESULTS OF SITE VISIT(S) .........................................................................2 Site Observations and Concerns .........................................................................3 4.0 WATERSHED CHARACTERIZATION ......................................................3 Source Water Assessment Area Delineation Method (Surface Water) ..............3 General Characteristics .......................................................................................3 Land Use Characteristics ....................................................................................4 Table 4.1. Land Use Distribution in Big Elk Creek Watershed.................4 Localized Characteristics ....................................................................................4 Figure 4.1. 1997 MRLC Land Use for the Elkton Watershed ...........................5 5.0 POTENTIAL SOURCES OF CONTMINATION.........................................6 5.1 Non Point Sources.....................................................................................6 5.2 Point Sources ............................................................................................6 Table 5.1. Pennsylvania Pollution Control Facilities in the Elkton Watershed......................................................................................6 5.3 Transportation Related Concerns..............................................................7 Figure 5.1. Potential Sources of Contamination for the Elkton Watershed.......8 6.0 REVIEW OF WATER QUALITY DATA .....................................................9 Inorganic Compounds (IOCs).............................................................................9 Table 6.1. Elkton IOCs. ...........................................................................9 Synthetic Organic Compounds (SOCs) ............................................................10 Table 6.2. Elkton SOCs .........................................................................11 Volatile Organic Compounds (VOCs)..............................................................11 Table 6.3. Elkton DBP...........................................................................12 Microbiological Contaminants..........................................................................12 Figure 6.1. Elkton Raw Water Fecal Coliform......................................14 Figure 6.2. May Showing Sampling Locations for Big Elk Creek Fecal Coliform Study..........................................................15 Table 6.4. E. coli bacteria counts for the 5 Big Elk Creek Stations.......16 Table 6.5. Fecal bacteria counts for the 5 Big Elk Creek Stations ........16 Table 6.6. pH values for the 5 Big Elk Creek Stations ..........................16
i

Table 6.7. Temperature values for the 5 Big Elk Creek Stations ..........16 Table 6.8. Dissolved Oxygen values for the 5 Big Elk Creek Stations .17 Table 6.9. Conductivity values for the 5 Big Elk Creek Stations .......................................................................17 Turbidity ...........................................................................................................17 Table 6.10. Summary of Monthly Turbidity Results for 2002 and 2003 ...............................................................18 7.0 SUSCEPTIBILITY ANALYSIS....................................................................18 Inorganic Compounds.......................................................................................18 Synthetic Organic Compounds (SOCs) ............................................................18 Volatile Organic Compounds (VOCs)..............................................................19 Disinfection Byproducts and Disinfection Byproduct Precursors ....................19 Microbiological Contaminants..........................................................................19 Turbidity and Sediment.....................................................................................20 8.0 RECOMMENDATIONS FOR SOURCE WATER PROTECTION PLAN....................................................................................20 REFERENCES............................................................................................................22 Other Sources of Information and Data ............................................................22
ii

iii
EXECUTIVE SUMMARY The 1996 Safe Drinking Water Act Amendments require states to develop and implement source water assessment programs to evaluate the safety of all public drinking water systems. A Source Water Assessment (SWA) is a process of evaluation the vulnerability of a source of public drinking water supply to contaminants. This SWA was completed for the Town of Elkton’s water treatment plant water supply source (Big Elk Creek). The Big Elk Creek, in combination with Holly Hall ground water sources, serves 13,000 people in the Town of Elkton and its surrounding area in Cecil County. Big Elk Creek originates in Chester County, Pennsylvania and flows south-southeast towards Elkton, Maryland. A short distance south of Elkton, the Big Elk Creek becomes the Elk River and discharges to the Chesapeake Bay. The raw water is diverted from the Creek into a raceway between the creek and the plant. Water flows from the raceway into a wetwell and then is pumped to the treatment plant. The source water protection area for the Town of Elkton intake encompasses approximately 60 square miles (38,383 acres) of mixed land use with over 60% of cropland and pasture. Approximately 40% of the watershed is in Cecil County, Maryland and 60% is in Chester County, Pennsylvania. Potential sources of contamination for Big Elk Creek watershed include point and non point sources, including transportation, agriculture, on-site septic systems and runoff from developed areas. There are several minor municipal and industrial dischargers in Pennsylvania and a quarry in Maryland’s portion of the source water assessment area. There is also an inactive landfill located in Fair Hill Natural Resource Area. In 1975, the Maryland Department of Natural Resources (DNR) purchased the property for use as a recreation area. The susceptibility analysis indicates that turbidity, disinfection by product precursors and pathogenic microorganisms are the contaminants of most concern. The results of studies conducted by MDE indicate that both E. coli and fecal bacteria are present consistently in Big Elk Creek. Nutrient enrichment, algal blooms and natural organic matters all contribute to reactive nature of disinfection by product precursors. High turbidity levels are associated with erosion and transport of sediment during storm flows. Section 8.0 of this report lists specific recommendations for consideration in developing a source water protection plan. Providing critical information for implementing a source water protection for Big Elk Creek is the ultimate goal of this assessment.

1.0 BACKGROUND The 1996 Safe Drinking Water Act Amendments require states to develop and implement source water assessment programs to evaluate the potential for contaminants to affect the sources of all public drinking water systems. A Source Water Assessment (SWA) follows a process for evaluating the susceptibility of a public drinking water supply to contamination. The assessment does not address the treatment processes or the storage and distribution of the water system, which are covered under separate provisions of the Safe Drinking Water Act. The Maryland Department of the Environment (MDE) is the lead state agency in this SWA effort. There are three main steps in the assessment process: (1) delineating the watershed drainage area that is likely to contribute to the drinking water supply, (2) identifying potential contaminants within that area and (3) assessing the vulnerability of the system to those contaminants. This document reflects all of the information gathered and analyzed required by those three steps. MDE looked at many factors to determine the susceptibility of this water supply to contamination, including the size and type of water system, available water quality data, the characteristics of the potential contaminants, and the capacity of the natural environment to attenuate any risk. Maryland has more than 3,800 public drinking water systems. Approximately 50 of Maryland’s public drinking water systems obtain their water from surface supplies, either from a reservoir or directly from a river. The remaining systems use ground water sources. Maryland’s Source Water Assessment Plan was submitted to the Environmental Protection Agency (EPA) in February 1999, and received final acceptance by the EPA in November 1999. A copy of the plan can be obtained at MDE’s website, www.mde.state.md.us, or by calling the Water Supply Program at 410 537-3714. 2.0 INTRODUCTION The Town of Elkton and its water system service area is located in east-central Cecil County. It is a growing town within commuting distance to major cities in Maryland, Delaware and Pennsylvania. The Town’s water system serves approximately 13,000 people, the Triumph Industrial Park and certain Route 7 properties. Elkton currently provides water to its customers from two sources – a surface water treatment plant located on the Big Elk Creek and a well system that consists of two wells. The source water assessments for the Town’s Holly Hall groundwater sources were completed under a separate report. The Town of Elkton’s surface water treatment plant is permitted by MDE to withdraw 1.5 million gallons average daily and 2.0 million gallons maximum daily from Big Elk Creek. The Big Elk Watershed above the Town’s intake is located in southeastern Pennsylvania and northeastern Maryland with a small portion extending into Delaware. Population in the Big Elk Creek Basin is projected to increase 20 percent between 1998 and 2020 (Chester County Water Resource Authority, 2001.)
1

A. Description of Surface Water Source Big Elk Creek flows south-southeast towards Elkton, Maryland. It is joined by the Little Elk downstream of the water plant’s intake. A short distance south of Elkton, the Big Elk Creek becomes the Elk River and discharges to the Chesapeake Bay. Big Elk Creek originates in Chester County, Pennsylvania and the drainage area of the basin above Elkton’s intake is approximately 60 square miles. The Big Elk Creek Watershed is located in the Piedmont Phisiographic Province and is underlain by crystalline rocks. The topography is generally rolling uplands, common to the Piedmont. The basin exhibits well developed dendritic drainage patterns and streams are moderately incised. The climate of the Big Elk Creek Watershed is a humid, modified continental climate characterized by warm summers and moderately cold winters. The normal annual (1971-2000) precipitation at the National Oceanic and Atmospheric Administration (NOAA) station at Newark, Delaware, approximately 3 mile east of Big Elk Creek Watershed, is 45.35 inches. Precipitation is distributed fairly evenly throughout the year, although slightly more falls in May through August than in the other months (Geohydrology and Groundwater Quality, Big Elk Creek Basin, Ronald A. Sloto, 2002). B. Water Supply Development The first water appropriation and use permit was granted in March, 1966 to withdraw a daily average of 1.5 million gallons on a yearly basis and a maximum daily of 2.0 million gallons from Elk Creek for the Town of Elkton’s water treatment plant. The design capacity of the surface water treatment is 2.0 million gallons per day. Treatment processes include coagulation, static mixer, flocculation, sedimentation, filtration and disinfection. The Town contracts with Severn Trent Environmental Services (STES) to perform daily operations of the plant. Raw water is diverted from the creek into a raceway between the creek and the plant. The raceway holds about two million gallons and is up to 12 feet deep. It is cleaned out once each year. During high turbidity events, water to the raceway can be shut off by closing two 36” gates. Water flows from the raceway into the plant where it is screened before entering a 31,300 gallon wet well. The bar screens are cleaned once a week or more often, as needed. From the wet well, water is pumped through the treatment plant (Comprehensive Performance Evaluation of the Town of Elkton, MDE, June 2000). 3.0 RESULTS OF SITE VISIT(S) Water Supply Program personnel conducted a site survey of the Town of Elkton’s water sources and other raw water facilities in order to accomplish the following tasks:
To collect information regarding the locations of raw water sources and intakes by using Global Positioning System (GPS) equipment.
To determine the general condition and structural integrity of intakes and other raw water facilities.
To discuss source water issues and concerns with the County’s water system operators.
2

To conduct a windshield survey of the watershed and to document potential problem areas. Additional tours of the watersheds were taken on follow-up visits.
Site Observations and Concerns
Elkton’s intake is located on the south bank of Big Elk Creek, north of Main (MD Route 281). The intake is located behind a gravity flow dam which was constructed in 1900. The pool behind the dam has a surface area of about one acre and stores about five acre feet (1.63 million gallons). The creek is about five feet deep at the intake.
A new concrete head wall, bar screens and concrete vault for control valves were constructed in 1999.
The operator was concerned about the possible hazardous spills from I-95 and railway crossings over the Big Elk Creek and discharges from a quarry upstream of the intake.
The operator was also concerned about the impact from geese proliferation along the raceway and in DNR fish hatchery ponds.
Past manure spills from farms in Pennsylvania. Large residential developments and an 18-hole golf coarse is under construction
in the watershed at the forested area near the intake. Existing houses along the southside of the raceway are located on a hill near the
raceway. 4.0 WATERSHED CHARACTERIZATION Source Water Assessment Area Delineation Method (Surface Water) An important aspect of the source water assessment process is to delineate the watershed area that contributes to the source of drinking water. A source water protection area is defined as the whole watershed area upstream from a water plant’s intake (MDE, 1999). Delineation of the source water area was performed by using ESRI’s Arc View Geographic Information Software (GIS), utilizing existing GIS data, and by collecting location data using a Global Positioning System (GPS). GPS point locations were taken at the water source intake and differentially corrected (for an accuracy of +/-2 meters) at MDE. Once the intake location was established, the contributing area was delineated based on existing Maryland Department of Natural Resources digital watershed data and Maryland State Highway Administration digital stream coverage. Digital USGS 7.5 topographical maps were also used to perform “heads up” digitizing, or editing, or watershed boundaries. General Characteristics The drainage area above the Town of Elkton intake on Big Elk Creek encompasses approximately 60 square miles (38,383 acres) of mixed land use with over 60% of cropland and pasture. About 40% of the watershed is in Cecil County, Maryland and 60% in Chester County Pennsylvania. Figure 4.1 depicts the land use distribution throughout the watershed.
3
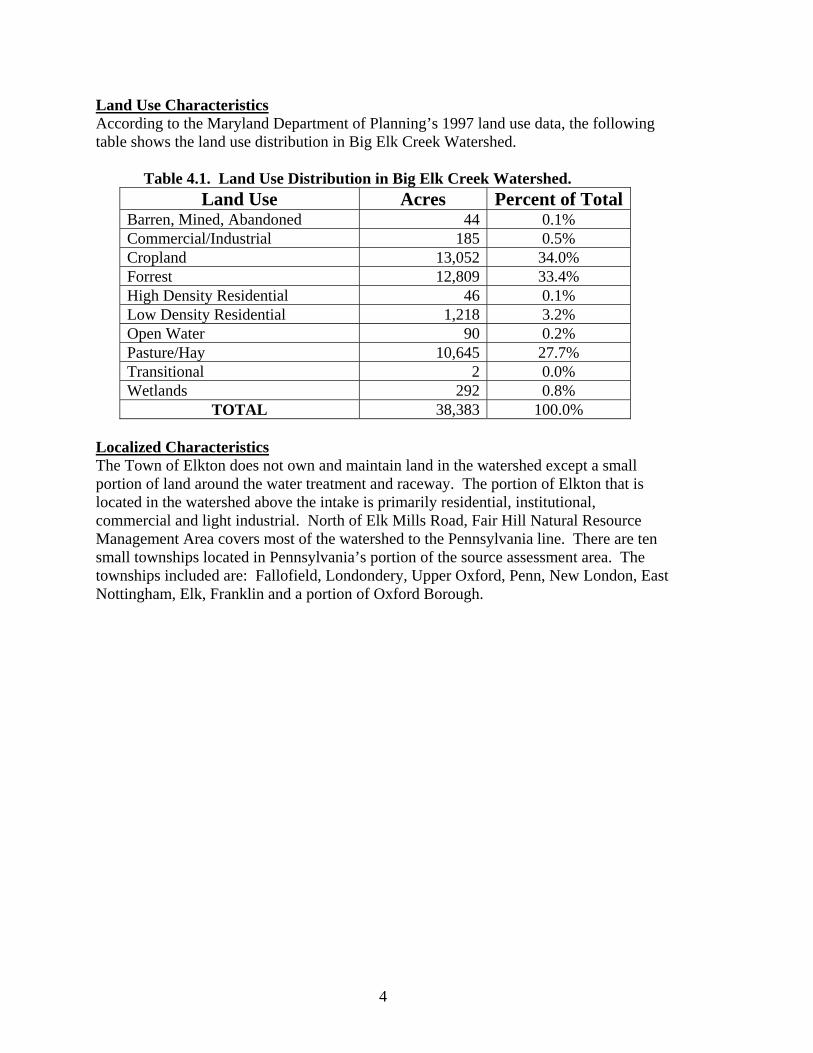
Land Use Characteristics According to the Maryland Department of Planning’s 1997 land use data, the following table shows the land use distribution in Big Elk Creek Watershed.
Table 4.1. Land Use Distribution in Big Elk Creek Watershed. Land Use Acres Percent of Total
Barren, Mined, Abandoned 44 0.1% Commercial/Industrial 185 0.5% Cropland 13,052 34.0% Forrest 12,809 33.4% High Density Residential 46 0.1% Low Density Residential 1,218 3.2% Open Water 90 0.2% Pasture/Hay 10,645 27.7% Transitional 2 0.0% Wetlands 292 0.8%
TOTAL 38,383 100.0% Localized Characteristics The Town of Elkton does not own and maintain land in the watershed except a small portion of land around the water treatment and raceway. The portion of Elkton that is located in the watershed above the intake is primarily residential, institutional, commercial and light industrial. North of Elk Mills Road, Fair Hill Natural Resource Management Area covers most of the watershed to the Pennsylvania line. There are ten small townships located in Pennsylvania’s portion of the source assessment area. The townships included are: Fallofield, Londondery, Upper Oxford, Penn, New London, East Nottingham, Elk, Franklin and a portion of Oxford Borough.
4

5.0 POTENTIAL SOURCES OF CONTAMINATION Watershed sources of contaminants in the Big Elk Creek can be categorized as either point or non point sources and include agricultural activities, residential runoff, wastewater treatment plant discharges, septic system and erosion and disturbance of vegetation along the tributaries of Big Elk Creek. 5.1 Non Point Sources According to Maryland Department of Planning land use data, 23,697 acres are used for agricultural purposes (cropland, pasture). Land to grow crops can be a source of nutrients (from fertilizers), synthetic organic compounds (herbicides) and sediment load. Pastures for grazing livestock and concentrated animal feed lots can be sources of nutrients and pathogenic protozoa, viruses and bacteria from animal waste. Although developed lands account for less than 4.0% (high density, low density and commercial/industrial) in the watershed, much of the development is concentrated around the intake area and the water quality impacts from these developments may be significant. Sediment, nutrients, pathogens (Giardia and Cryptosporidium), total organic carbon (TOC), road salt and heavy metals are most significant water supply concerns from runoff in developed areas. Lawn and pavement in the residential area results in increased storm water velocities. In turn, the higher velocities cause streambed and stream bank erosion, resulting in the transport of sediment and high turbidity onto the raceway entering to the water treatment plant. 5.2 Point Sources Point sources are regulated to minimize water quality impacts through the National Pollutant Discharge Elimination System (NPDES). NPDES permits have been issued for several minor surface water discharges within the Pennsylvania portion of watershed. Point source locations are depicted on Figure 5.1. The following table lists Pennsylvania’s minor private and public facilities in Big Elk Creek Watershed.
Table 5.1. Pennsylvania Pollution Control Facilities in the Elkton Watershed Organization Type of Factility NPDES
Consolidated Container Co LLC Stormwater-Industrial PAR230078Penn Twp Chester Cnty Sewage Publicly Owned (Muni) PA0058572Lincoln Univ Sewage Non-Publicly Owned (Non-Muni) PA0050733Agway Inc Industrial Waste 1591204 Pa Univ Sewage Non-Publicly Owned (Non-Muni) 1595411 Jackson Immunoresearch Labs Industrial Waste PA0057444Brookhaven Boro Delaware Cnty Sewage Publicly Owned (Muni) PA0023949Old Ft Ind Inc Sewage Non-Publicly Owned (Non-Muni) 1572422 United Mobile Homes Inc Sewage Non-Publicly Owned (Non-Muni) PA0050750West Grove Hosp Corp Sewage Non-Publicly Owned (Non-Muni) 1596406
According to the Pennsylvania’s Department of Environmental Protection, Bureau of Watershed Management, the above facilities are currently in compliance with the NPDES Permits water quality limits. In Maryland, there are two facilities located in the
6

watershed above the town’s intake. The first facility is a general permit No. 95-MM-0865 issued for Elk Mills Quarry, located on the southwest quadrant of junction of MD Route 277 and MD Route 316, one mile east of Elk Mills on Elk Mills Road. Elk Mills Quarry has been in operation since 1959. The quarry is owned and operated by D. M. Stoltzfus and Son, Inc. The existing quarry covers an approximately 118 acres. In 2001 the quarry expanded its operation onto an approximately 50 additional acres south of the existing pit. The ground water is collected in a sump and pumped to Big Elk Creek, which flows near and along the western boundary of the quarry permit area. MDE’s Water Appropriation and Use Permit Number CE1977G122(02) granted Elk Mills Quarry to withdraw a daily average of 510,000 gallons on a yearly basis and a daily average of 1,000,000 gallons for the month of maximum use. The water is used for quarry dewatering, dust suppression, and crusher cooling at Elk Mills Quarry. The second facility is an inactive 7-acre Big Elk Chapel Road Landfill in the Fair Hill Natural Resource Area. The landfill is located in a predominantly rural area immediately south of Big Elk Chapel Road. The Cecil County Commissioner opened the Big Elk Chapel Road Landfill site in 1954 as a public landfill for the surrounding communities. In 1975, the Maryland Department of Natural Resources (DNR) purchased the property for use as a recreation area. A citizen complaint alleged that the property owner who leased the property to the county deposited drums of hazardous chemical and tanker trucks of plasticizer from a chemical plant in Delaware. As a result, the MDE completed a Preliminary Assessment of the property in 1991 and a subsequent Focused Site Inspection (FSI) in 1994. While preparing the FSI, surface water, ground water, sediment, soil, and four residential well samples were collected and analyzed for a full scan of all organic and inorganic priority pollutant. On the basis of the information contained in the FSI, the U.S. Environmental Protection Agency (EPA) issued the Big Elk Chapel Road site No Further Remedial Action Planned (NFRAP) status under the Comprehensive Environmental Restoration, Compensation and Liability Act. 5.3 Transportation Related Concerns Another potential source of contamination to the Big Elk Creek is transportation, including highways, railroad and roads. I-95 and U.S. Route 1 are used heavily for commercial traffic and cross portions of the watershed and the main stem of Big Elk Creek. There are also three railroad crossings and numerous secondary roads and residential access roads throughout the watershed. (See Figure 5.1). All these routes especially I-95 pose potential spill danger to the Big Elk Creek Concentration of residential road with heavy traffic within the watershed and lack of proper stormwater management practices in urban areas can cause siltation of the Creek. Colonial Pipeline, an interstate carrier of petroleum products, crosses the entire width of Big Elk Creek watershed above the Pennsylvania state line. Pipeline accidents and leaking of petroleum products can cause contamination of raw water with volatile organic compounds.
7

6.0 REVIEW OF WATER QUALITY DATA Several sources of water quality data were reviewed for the Town of Elkton’s Source Water Assessment. These include MDE Water Supply Program’s database for safe drinking water contaminants and monthly operating reports from the town’s water treatment plant. Data from a special study by MDE’s Water Quality Monitoring Program, the United States Geological Survey, MD Department of Natural Resources and the Town of Elkton’s water quality monitoring program were also reviewed. Water quality data for the Town of Elkton water sources will be compared with Maximum Contaminant Levels (MCLs) set by the U.S. Environmental Protection Agency to ensure safe drinking water. If the monitoring data is greater than 50% of MCL for at least 10% of the time, a detail susceptibility analysis will be performed for that contaminant and its potential sources. Inorganic Compounds (IOCs) The Town of Elkton’s water treatment plant regularly tests for the presence of nitrate and other inorganic compounds. Table 6.1 is a summary of testing results for IOCs detected in finished water from 1993 through 2004. No inorganic compounds exceeded MDE’s criteria for a detailed susceptibility analysis. Table 6.1. Elkton IOCs
CONTAM_NAME
SAMPLE_DATE
RESULT
UNITS MCL
ALUMINUM 01/23/2001 0.1 mg/L BARIUM 12/15/1993 0.031 mg/L 2 BARIUM 12/21/1994 0.023 mg/L 2 BARIUM 12/12/1996 0.028 mg/L 2 BARIUM 03/24/2004 0.028 mg/L 2 CHROMIUM 03/28/2001 0.01 mg/L 0.1 FLUORIDE 03/29/2000 0.1 mg/L 4 MANGANESE 01/23/2001 0.07 mg/L NITRATE 03/11/1993 3.6 mg/L 10 NITRATE 04/28/1993 3.3 mg/L 10 NITRATE 08/11/1993 2.2 mg/L 10 NITRATE 11/03/1993 2.6 mg/L 10 NITRATE 03/16/1994 2.6 mg/L 10 NITRATE 12/21/1994 2.4 mg/L 10 NITRATE 03/15/1995 4.2 mg/L 10 NITRATE 03/06/1996 2.67 mg/L 10 NITRATE 06/27/1996 3.3 mg/L 10 NITRATE 03/26/1997 3.7 mg/L 10 NITRATE 07/01/1997 3.1 mg/L 10 NITRATE 05/20/1998 2.91 mg/L 10 NITRATE 05/28/1998 3.7 mg/L 10 NITRATE 03/26/1999 3.2 mg/L 10
9

Table 6.1. Elkton IOCs continued: NITRATE 04/06/1999 3 mg/L 10 NITRATE 03/29/2000 2.1 mg/L 10 NITRATE 03/07/2001 3.3 mg/L 10 NITRATE 03/28/2001 3.8 mg/L 10 NITRATE 03/28/2001 3.8 mg/L 10 NITRATE 04/03/2001 3.4 mg/L 10 NITRATE 03/27/2002 3.7 mg/L 10 NITRATE 04/01/2002 2.5 mg/L 10 NITRATE 03/26/2003 2.2 mg/L 10 NITRATE 04/01/2003 2.5 mg/L 10 NITRATE 03/24/2004 3.37 mg/L 10 NITRITE 06/27/1996 0.003 mg/L 1 NITRITE 04/01/2002 0.006 mg/L 1 SODIUM 06/27/1996 11 mg/L SODIUM 07/01/1997 9 mg/L SODIUM 05/28/1998 9.1 mg/L SODIUM 04/06/1999 10.71 mg/L SODIUM 03/29/2000 9.7 mg/L SODIUM 01/23/2001 28.3 mg/L SODIUM 04/03/2001 11.1 mg/L SODIUM 04/01/2002 12.4 mg/L SODIUM 04/01/2003 17.6 mg/L SODIUM 03/24/2004 19.1 mg/L SULFATE 12/15/1993 21 mg/L SULFATE 12/21/1994 21 mg/L SULFATE 06/27/1996 21.9 mg/L SULFATE 12/12/1996 23 mg/L SULFATE 07/01/1997 21.6 mg/L SULFATE 05/28/1998 21.7 mg/L SULFATE 04/06/1999 22 mg/L SULFATE 04/03/2001 25 mg/L SULFATE 04/01/2002 26.7 mg/L THALLIUM 12/21/1994 0.002 mg/L 0.002
Synthetic Organic Compounds (SOCs) Table 6.2 is a summary of detections of SOC’s results in treated waterfor the years 1995-2003. Simazine was detected three (3) times, one exceeding 50% of the maximum contaminant level (MCL). Di(2-ethylhexyl) Phthalate was detected eight (8) times, one exceeding 50% of the MCL. The Town of Elkton participated in a nationwide study of acetochlor, alachlor and atrazine occurrence in drinking water intakes during 1996 and 1997. Only atrazine was found in the 23 samples collected during the two-year study. One sample exceeded 50% of the MCL. The detections from that study are included in Table 6.2. A more detailed discussion of these findings will be covered in Section 7.0.
10

Table 6.2. Elkton SOCs Contam_Name SAMPLE_DATE RESULT UNITS MCLAtrazine 05/98/1996 1.01 ug/L 3 Atrazine 05/22/1996 0.06 ug/L 3 Atrazine 06/05/1996 0.10 ug/L 3 Atrazine Atrazine Atrazine Atrazine Atrazine Atrazine Atrazine Atrazine
06/19/199607/02/199607/17/199607/31/199608/14/199605/07/199706/04/199706/19/1997
0.13 0.62 0.20 0.06 0.09 0.06 2.14 0.05
ug/L ug/L ug/L ug/L ug/L ug/L ug/L ug/L
33333333
Dalapon 04/06/1999 1.64 ug/L 200 Dalapon 08/24/1999 0.78 ug/L 200 Dalapon 03/07/2001 0.14 ug/L 200 Di(2-Ethylhexyl) Adipate
07/31/1995 0.98 ug/L 400
Di(2-Ethylhexyl) Adipate
04/10/2000 0.8 ug/L 400
Di(2-Ethylhexyl) Adipate
10/24/2001 0.4 ug/L 400
Simazine 04/06/1999 0.9 ug/L 4 Simazine 04/03/2001 0.8 ug/L 4 Simazine 04/01/2002 3.2 ug/L 4Di(2-Ethylhexyl) Phthalate
07/31/1995 1.52 ug/L 6
Di(2-Ethylhexyl) Phthalate
08/24/1999 0.5 ug/L 6
Di(2-Ethylhexyl) Phthalate
04/10/2000 0.6 ug/L 6
Di(2-Ethylhexyl) Phthalate
04/03/2001 0.6 ug/L 6
Di(2-Ethylhexyl) Phthalate
04/01/2002 3.4 ug/L 6
Di(2-Ethylhexyl) Phthalate
04/03/2002 1.1 ug/L 6
Di(2-Ethylhexyl) Phthalate
07/16/2002 1.1 ug/L 6
Di(2-Ethylhexyl) Phthalate
04/01/2003 0.6 ug/L 6
Volatile Organic Compounds (VOCs) No volatile organic compounds other than disinfection by-products (DBP) were detected in the water leaving the Elkton water treatment plant. Compliance with the disinfection by-products rule is determined by level in the distribution system. Samples for DBP collected in 2002-2004 are shown in Table 6.3. These data indicate that changes will be needed at the Elkton plant for the facility to consistently meet the current standards of 80.0 ug/l for total THM and 60.0 ug/l for total HAA at all locations.
11

Table 6.3. Elkton Disinfection By Product Levels (all results in ug/l)
SAMPLE_DATE SAMPLE_LOCATION HAA THM02/06/2002 Elkton Florist 132 W. Main Street 57.84 23.3704/01/2002 Elkton Florist 132 W. Main Street 9.98 60.4607/01/2002 Elkton Florist 132 W. Main Street 56.02 102.8410/01/2002 Elkton Florist 132 W. Main Street 37.26 93.4801/09/2003 Elkton Florist 132 W. Main Street 36.89 24.6104/01/2003 Elkton Florist 132 W. Main Street 52.58 4707/01/2003 Elkton Florist 132 W. Main Street 54.6 63.9310/07/2003 Elkton Florist 132 W. Main Street 22.1 43.9404/02/2004 Elkton Wastewater Treatment Fa 200 W Pulaski Hwy 22.6 64.304/07/2004 Elkton Wastewater Treatment Fa 200 W Pulaski Hwy 8.7 21.305/05/2004 Elkton Wastewater Treatment Fa 200 W Pulaski Hwy 146.9 94.607/07/2004 Elkton Wastewater Treatment Fa 200 W Pulaski Hwy 38 70.407/07/2004 Elkton Wastewater Treatment Fa 200 W Pulaski Hwy 19.4 42.5
Microbiological Contaminants MDE, with the cooperation of the Town of Elkton water treatment operators, began raw water bactribiological monitoring program in September 2000. The raw water was collected weekly and tested for fecal coliform and E. coli. Figure 6.1 shows the results in Most Probably Number/100 ml from September 2000 through March 2003. In order to better understand the location and sources of the fecal coliform in Big Elk Creek, MDE with the help of Elkton water plant managers (Severn-Trent) conducted a Big Elk Creek bacteria (fecal and E. coli) study in 2003. The objective of the study was to identify sources of fecal contamination in the Big Elk Creek Watershed. Five sampling stations were identified along the Big Elk Creek. They include: 1) Elkton water intake BEL0039, 2) above Route Sever BEL0043, 3) Ricketts Mill Road BEL0059, 4) Route 277 BEL0089, and 5) Covered Bridge at Fair Hill Natural Resource Area BEL0139. The attached map (Figure 6.2) depicts the location of sampling stations. In addition to analyzing the samples for fecal and E. coli bacteria using the methodology established by the Maryland Department of Health and Mental Hygiene, each sampling site was also analyzed for other water quality parameters such as Dissolved Oxygen, Temperature, Conductivity and pH. The results of the study indicated that both E. coli and fecal bacteria counts were high at all stations except BEL0059, the Ricketts Mill Rd. road crossing. This road crossing is located just north of Elkton. High bacteria counts at the two most northerly stations indicate that bacterial contamination is a problem for the entire Maryland extent of Big Elk Creek and not a condition limited to water pollution sources in the Town of Elkton. Reconnoitering surveys along Big Elk Creek in the vicinity of the sampling stations revealed several potential sources for the high bacteria counts. In Elkton, there was a fish hatchery with ten ponds, and several other ponds, which attracted a large flock of Canadian geese. The second major fecal source observed was the large horse boarding
12

13
facilities located at Fair Hill Park, which surrounded the northern section of the creek. Horses were not only boarded here, but also exercised along the trails, some of which ran beside the creek banks. Whether the high bacteria counts at the BEL0089 and BEL0139 were directly due to horse fecal runoff, or whether the creek waters emerging from Pennsylvania already had high counts is unknown. Water quality parameters indicated good water quality. Values of pH were somewhat high, perhaps reflecting the geology of the region. The data, including means, is presented in Tables 6.4 through 6.9.

14
Figure 6.1 - E lkton Raw W ater Fecal Coliform
1
10
100
1000
10000
100000
9/1/2000
10/1/2000
10/31/2000
12/1/2000
12/31/2000
1/31/2001
3/2/2001
4/1/2001
5/2/2001
6/1/2001
7/2/2001
8/1/2001
8/31/2001
10/1/2001
10/31/2001
12/1/2001
12/31/2001
1/30/2002
3/2/2002
4/1/2002
5/2/2002
6/1/2002
7/1/2002
8/1/2002
8/31/2002
10/1/2002
10/31/2002
11/30/2002
12/31/2002
1/30/2003
3/2/2003
4/1/2003O
rgan
ism
s pe
r 100
ml
Fecal Coliform Previous State Water Quality Standard Geom etric Mean of Five Sam ples for Up to 90 days

Table 6.4. E. Coli bacteria counts for the 5 Big Elk Creek Stations E. Coli BEL0039 BEL0043 BEL0059BEL0089BEL013907/16/2003 150 430 43 230 20007/23/2003 460 240 180 240 32007/30/2003 180 140 100 40 14008/06/2003 140 100 180 460 46008/13/2003 240 240 240 240 18008/20/2003 40 20 40 140 140MEAN 202 195 131 225 240MEDIAN 165 190 140 235 190 Table 6.5. Fecal bacteria counts for the 5 Big Elk Creek Stations Fecal BEL0039 BEL0043 BEL0059BEL0089BEL013907/16/2003 150 430 43 230 20007/23/2003 930 930 93 930 43007/30/2003 240 460 40 150 24008/06/2003 460 460 460 2400 110008/13/2003 460 460 240 430 24008/20/2003 460 93 93 150 240MEAN 450 472 162 715 408MEDIAN 460 460 93 330 240 Table 6.6. pH values for the 5 Big Elk Creek Stations PH BEL0039 BEL0043 BEL0059BEL0089BEL013907/16/2003 7.48 7.45 8.06 8.02 7.8807/23/2003 7.49 7.60 7.82 7.70 7.5107/30/2003 7.28 7.35 7.69 7.65 7.4208/06/2003 7.29 7.63 8.24 7.93 7.3408/13/2003 7.20 7.34 7.43 7.43 7.3008/20/2003 7.34 7.55 7.76 7.70 7.30MEAN 7.35 7.49 7.83 7.74 7.46 Table 6.7. Temperature values for the 5 Big Elk Creek Stations TEMP BEL0039 BEL0043 BEL0059BEL0089BEL013907/16/2003 22.43 22.40 23.23 22.66 22.8407/23/2003 23.82 23.69 23.31 22.66 21.8007/30/2003 22.35 22.16 21.46 20.75 20.9008/06/2003 23.60 22.90 23.04 21.88 21.0108/13/2003 23.30 23.21 23.60 22.60 22.7008/20/2003 22.50 22.40 21.90 21.00 20.10MEAN 23.00 22.79 22.76 21.93 21.56
16

Table 6.8. Dissolved Oxygen values for the 5 Big Elk Creek Stations DO BEL0039 BEL0043 BEL0059BEL0089BEL013907/16/2003 8.13 8.30 9.08 8.76 8.4507/23/2003 7.76 7.92 8.42 8.43 7.2107/30/2003 8.48 8.44 9.30 9.33 7.0908/06/2003 8.10 8.35 9.45 9.43 8.208/13/2003 7.69 8.00 7.33 8.32 7.5108/20/2003 8.88 9.11 9.93 9.70 8.70MEAN 8.17 8.35 8.92 9.00 7.86 Table 6.9. Conductivity values for the 5 Big Elk Creek Stations COND BEL0039 BEL0043 BEL0059BEL0089BEL013907/16/2003 178.8 178.0 173.1 166.3 165.007/23/2003 175.5 174.0 170.5 164.8 166.507/30/2003 175.2 174.3 171.5 166.3 166.708/06/2003 162.2 164.6 161.3 160.3 160.808/13/2003 167.2 167.4 163.7 159.9 158.808/20/2003 179.3 178.3 173.7 171.9 168.5MEAN 173.03 172.77 168.97 164.92 164.38 Turbidity Turbidity is described as a measure of cloudiness of water. It is used to indicate water quality and treatment effectiveness. Higher turbidity level are often associated with higher levels of disease causing microorganisms such as viruses, parasites and bacteria. Turbidity is measured in the raw water at the Elkton Water Treatment Plant on a continuous basis. The monthly summary statistics for each month during the period 2002-2003 is presented in Table 6.7. For this period, the average daily measured was 11.8 nephelometric turbidity units (NTU), minimum turbidity measured was 1.3 NTU and the maximum turbidity measured was 245.0 NTU during the month of September. Page text corrected on July 18, 2005.
17

Table 6.10. Summary of Monthly Turbidity Results for 2002 and 2003
Month Average Maximum Minimum January 6.1 37.9 1.4 February 7.0 69.0 1.5 March 13.8 128.8 1.9 April 8.8 34.5 3.7 May 10.6 43.5 3.2 June 21.4 161.0 5.0 July 7.8 14.2 4.9 August 8.8 53.5 3.8 September 19.6 245.0 3.0 October 10.5 86.9 2.0 November 10.2 90.6 1.9 December 17.3 225.0 1.3 Whole Period 11.8 245.0 1.3
7.0 SUSCEPTIBILITY ANALYSIS Each class of contaminants were reviewed based on the potential they have of contaminating Big Elk Creek and the Town of Elkton’s water intake. This analysis identified suspected sources, evaluated the natural conditions that may decrease or increase the likelihood of contaminant reaching the intake, and evaluate the impacts that future changes within the watershed may have on the susceptibility of the water intake. Inorganic Compounds All the inorganic compounds (IOC) that have been detected are below the maximum contaminant level in the finished water from the Town of Elkton’s water treatment plant. Nitrate was the most common IOC detected but no results exceeded 50% of the Maximum Contaminant Level (MCL). Nitrate can enter the water supply via ground water and surface water runoff. Fertilizer losses, leaches from septic tanks and animal waste are considered sources of nitrates. Unless livestock numbers, fertilizer usage and number of homes using on-site disposal drastically increase, it is unlikely that nitrate concentration will increase in the future. Nitrate and other inorganic contaminants are not contaminants of concern at this time. Synthetic Organic Compounds (SOCs) There are several detects at the Elkton water treatment plant, but no SOCs exceed the criteria of exceeding 50% of the MCL in at least 10% of the collected samples, with the exception of two compounds, simazin and di(2-ethylhexyl)phthalate. There was one result of each contaminant that was more than 50% of MCL. Di(2-ethylhexyl)phthalate was reported in corresponding laboratory blanks; therefore, reported quantities are not likely reflective of levels in the environment but rather laboratory artifacts. Simazine has been documented to enter streams and rivers in Maryland following springtime herbicide application. Simazine is an organic white solid, used as a preemergence herbicide used for control of broad-leaved and grassy weeds on a variety of deep-rooted crops such as artichokes, asparagus, berry crops, broad beans, citrus, etc.,
18

19
and on non-crop areas such as farm ponds and fish hatcheries (EPA Fact sheet). Atrazine is also applied as a preemergence herbicide for row crop production. A review of Maryland Pesticide Statistics and other available data indicate that usage of atrazine and simazine and other agricultural herbicides have substantially declined over the past 20 year, and therefore lower concentrations in the water are likely in the future. The Town of Elkton’s intake is not currently susceptible to SOC contamination. It is unlikely that the threat of SOCs entering the water supply will increase in the future, given the continued conversion of agricultural land to residential land. SOCs will continue to be sampled annually by MDE. If detections become more frequent or concentrations increase; further investigation could be undertaken. Volatile Organic Compounds (VOCs) As discussed in Section 6.0 no VOCs other than disinfection by products have been detected in the water leaving the surface water treatment plant. While volatile organic compounds are routinely used, stored and transported within the watershed, they are not likely to be measured in the raw water. Volatile organic compounds readily volatilize from free flowing streams. The most significant threat of VOC contamination in the watershed is the potential of a hazardous spill from the highway, railroad or local contamination due to leaks in the Colonial pipeline/pumping station. Big Elk Creek watershed is not susceptible to regular VOC contamination. Disinfection Byproducts and Disinfection Byproduct Precursors During the water treatment process disinfectants, like chlorine, interact with naturally occurring organic matter (NOM) in the water to produce disinfection byproducts, which are associated with human health. The U.S. Environmental Protection Agency (EPA) requires that surface water systems comply with Disinfectants and Disinfection Byproduct Rule (DBPR). The rule established MCLs for the most common and well-studied halogenated DBPs: total trihalomethane (TTHMs) and five of the nine haloacetic acids (HAAs) as well as bromate and chlorite. TTHM is defined as the sum of chloroform, bromoform, bromodichloromethane, and dibromochloromethane; HAA is defined as the sum of mono-, di-, and trichloroacetic acids and mono- and dibromacetic acids. The maximum contaminant levels (MCLs) set for TTHMs and HAAs are 80 ug/l and 60 ug/l respectively, based on a system-wide running annual average. The Town of Elkton has been monitoring TTHM and HAA in the water treatment plant and distribution system (Table 6.3); some of the reported TTHM and HAAs levels were higher than the MCLs set by EPA. Due to the nature of the Big Elk Creek watershed and occasionally high sample concentrations of HAA and THM, the Town of Elkton’s water system is susceptible to disinfection byproducts. Microbiological Contaminants The land use map (Figure 4.1) shows numerous pasture lands, and the point source map (Figure 5.1) shows seven sewage treatment plants in the watershed are all sources of microbiological

contaminants. In addition, wildlife are also sources of microbiological contamination. The results of studies conducted by MDE indicate that both E. coli and fecal bacteria are present consistently in Big Elk Creek. Most of the counts as shown in Figure 6.1 and Tables 6.4 and 6.5 were higher than the level set by the State Water Quality Standard (fecal count of 200 MPN/100 ml “old standard,” 126 MPN/100 ml for E.coli “new standard”). Like all surface water supplies relying on free flowing streams, the Town’s water intake is susceptible to pathogenic microorganisms. Giardia and Cryptosporidium are protozoans resistant to chlorination that are common in surface water and associated with human and animal wastes. Turbidity and Sediment The average raw water monthly turbidity at the Elkton water treatment plant during 2002 and 2003 was 11.8 NTU; the highest average turbidity of 21.4 NTU was recorded during the month of June. Highly turbid water can cause additional demands on water treatment plants and sediment can carry harmful microorganisms and compounds into drinking water suppliers. Turbidity is used as a surrogate indicator for the presence of Cryptosporidium and Giardia, and increased water turbidity is indicative of elevated bacteria concentrations. Turbidity is caused by erosion of materials from the contributing watershed. Turbidity may be from a wide variety of materials, including soil particles and organic matter created by the decay of vegetation. During storm events and/or snowmelts, surface runoff increases. Runoff during a storm event occurs when the rate of precipitation exceeds the rate of infiltration. As runoff increases during a storm and/or snowmelt, the increased flow of water can cause soil and other material to erode, increasing suspended solids and raising the turbidity. There are several factors in the watershed that can contribute to increased turbidity/sediment. Runoff from paved surfaces (residential and commercial developments) increases the amount of flow in tributaries quickly and leads to bank erosion. Allowing cattle and other livestock unfettered access to streams destroys protective vegetation along riparian areas where soils can runoff directly into a waterway. Also, row cropping on steep slopes and forestry operations throughout the watershed may contribute to increased sediment and turbidity. Future land use changes in the Big Elk Creek watershed could increase the turbidity of raw water at the Town of Elkton’s intake. Most of the watershed is privately owned and alteration of forested land and changes of cropland and pasture to residential development can lead to erosion and higher turbidity. Therefore, turbidity is an important water quality concern for the Elkton water supply. 8.0 RECOMMENDATIONS FOR SOURCE WATER PROTECTION PLAN This report is compiled based on the existing and available data from several sources. It provides general information as a first step towards establishing and implementing source water protection plan for the Town of Elkton’s Big Elk Creek source. Additional data may be needed to further understand the areas of concern or establishing specific source protection goals. The following list of recommendations is offered to begin a focused source water protection effort for the Big Elk Creek Watershed.
20

The Town of Elkton should take a lead role in forming a local watershed planning team to develop and implement strategies to protect Big Elk Creek as a drinking water source.
A formal or informal agreement should be developed to engage officials from jurisdictions in MD and PA on a continuing basis.
Encourage broad stakeholder participation, including soil conservation districts, community association leaders, farmers and existing environmental groups.
Establish clear and achievable goals, objectives and milestones to ensure the highest quality raw water.
Erect road signs in strategic locations to alert the public that they are entering a drinking water watershed.
Continue monitoring for fecal coliform and E. coli in the raw water. To better understand the causes of the repeated high disinfection by product levels algae
monitoring and/or indicators of algae bloom in Big Elk Creek would be helpful The Department of Natural Resources may be of assistance in this effort.
The watershed group should periodically conduct its own detailed field survey of the watershed to ensure there are no new sources of contaminants.
The Cecil County Soil Conservation District and Pennsylvania Districts should continue to develop projects to reduce pathogens and nutrients from animal waste from entering upstream tributaries. Stream fencing projects are particularly helpful.
The soil and erosion control and stormwater management regulations and practices in the Pennsylvania Townships within the watershed should be reviewed and compared with Maryland’s standards.
21

22
REFERENCES Cecil County Water and Sewerage Plan, 2001. Chester County PA Water Resource Authority, 2001. Geohydrology and Groundwater Quality, Big Elk Creek Basin, Ronald A. Sloto, 2002.
Maryland Department of the Environment (MDE), Comprehensive Performance Evaluation
of Town of Elkton Water Treatment Plant, Water Supply Program, June 2000. Maryland Department of the Environment (MDE), Maryland’s Source Water Assessment
Plan, Water Supply Program, February 1999. Maryland Department of the Environment (MDE), Total Maximum Daily Load Program, Big
Elk Creek Bacteria Study, 2003. U.S. Department of Agriculture, Soil Conservation Service, December 1973.
OTHER SOURCES OF INFORMATION AND DATA EPA’s Guidance Manual for Source Water Assessments MDE and Pennsylvania NPDES Permits MDE Waste Management Sites Database MDE Water Appropriation and Use Permits MDE Water Supply Inspection Reports MDE Water Supply Program Oracle Database Town of Elkton Water Treatment Plant Monthly Operating Reports (MORs) and Self
Monitoring Reports