town of markham markham arena opportunity … · the following pages contain material to be...
TRANSCRIPT
Town of Markham – Markham Arena Opportunity Confidential | January 2011
2
Confidential Information Disclaimer
The following pages contain material to be provided to the Town of Markham. (“Markham” or the “Town”) by
Raymond James Ltd. (“Raymond James” or “RJ”). As used herein, the terms “Markham” and the “Town” are used in
this presentation to refer to the Town of Markham and those of its affiliates that the context requires. The
accompanying material was compiled or prepared on a confidential basis solely for the use of Town staff and the
Town Councilors and have not been prepared with a view toward public disclosure under any securities laws or
otherwise. The information concerning the Town or its affiliates contained in this material was obtained from the
Town or its affiliates. Any estimates and projections contained herein involve numerous and significant subjective
determinations, and there is no assurance that such estimates and projections will be realized. Raymond James
does not take responsibility for such estimates and projections, the basis on which they were prepared, or their
reasonableness. No representation or warranty, express or implied, is made as to the accuracy or completeness of
the information included herein and nothing contained herein is, or shall be relied upon as, a representation, whether
as to the past, the present or the future. This material was not prepared for use by readers not as familiar with the
business and affairs of the Town as Town staff and Town Councilors are and, accordingly, neither the Town nor
Raymond James nor their respective legal or financial advisors or accountants takes any responsibility for the
accompanying material if used by persons other than Town staff or the Town Councilors. Raymond James does not
have any obligation to update or otherwise revise the accompanying materials.
3
Section 1 Situation Overview
Section 2 Cost of Completion
Section 3 Pro-Forma Financial Forecast
Section 4 Sources & Uses
Section 5 Financing & Structuring Alternatives
Section 6 Next Steps & Recommendations
Appendix Supplemental Schedules
Table of Contents

Section 1
Situation Overview
5
Background Information
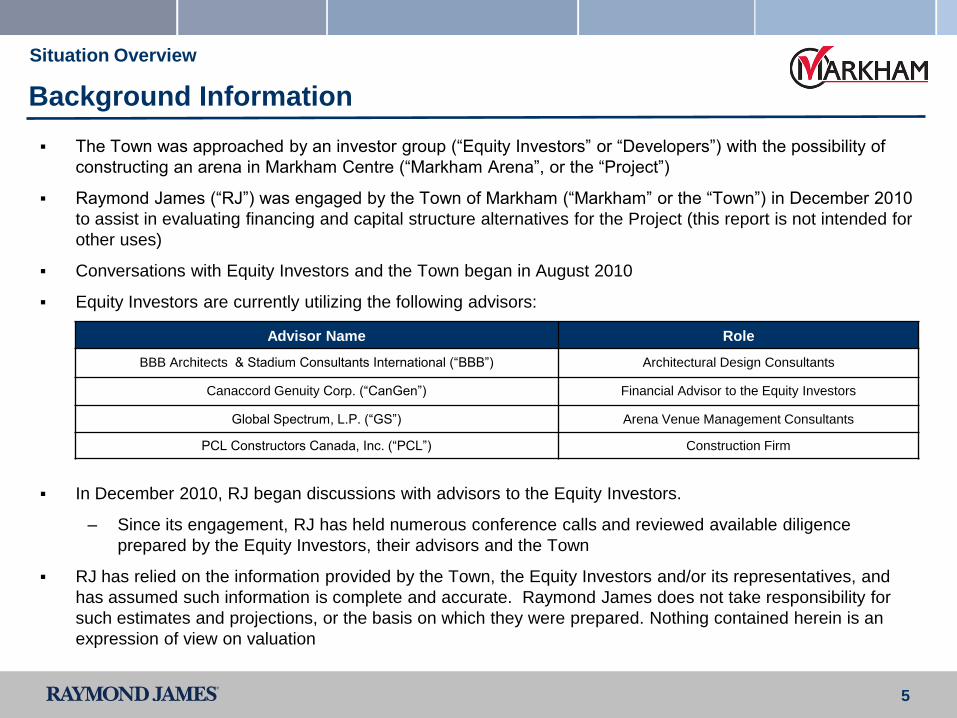
The Town was approached by an investor group (“Equity Investors” or “Developers”) with the possibility of
constructing an arena in Markham Centre (“Markham Arena”, or the “Project”)
Raymond James (“RJ”) was engaged by the Town of Markham (“Markham” or the “Town”) in December 2010
to assist in evaluating financing and capital structure alternatives for the Project (this report is not intended for
other uses)
Conversations with Equity Investors and the Town began in August 2010
Equity Investors are currently utilizing the following advisors:
In December 2010, RJ began discussions with advisors to the Equity Investors.
– Since its engagement, RJ has held numerous conference calls and reviewed available diligence
prepared by the Equity Investors, their advisors and the Town
RJ has relied on the information provided by the Town, the Equity Investors and/or its representatives, and
has assumed such information is complete and accurate. Raymond James does not take responsibility for
such estimates and projections, or the basis on which they were prepared. Nothing contained herein is an
expression of view on valuation
Situation Overview
Advisor Name Role
BBB Architects & Stadium Consultants International (“BBB”) Architectural Design Consultants
Canaccord Genuity Corp. (“CanGen”) Financial Advisor to the Equity Investors
Global Spectrum, L.P. (“GS”) Arena Venue Management Consultants
PCL Constructors Canada, Inc. (“PCL”) Construction Firm
6
RJ Objectives
Markham has been given an opportunity, whereby the Equity Investors would invest $175 million used
towards the development of a marquee destination in the Town
RJ was engaged to assist Markham in evaluating the options for raising the additional capital required to
construct the Markham Arena
The Markham Arena proposal from the Equity Investors assumes a $350 million total development cost,
50% of which the Equity Investors assume is funded by Markham or other sources of capital raised by
Markham
RJ’s objectives in assessing the opportunity include:
– Analyzing the cost of completion estimates for the Project
– Analyzing the pro-forma financials of the Project
– Addressing the potential financing alternatives
– Addressing the potential capital structures
– Evaluating the funding sources and financial qualifications of the Equity Investors
This report assumes there is no Major League tenant residing in the Markham Arena
Situation Overview
7
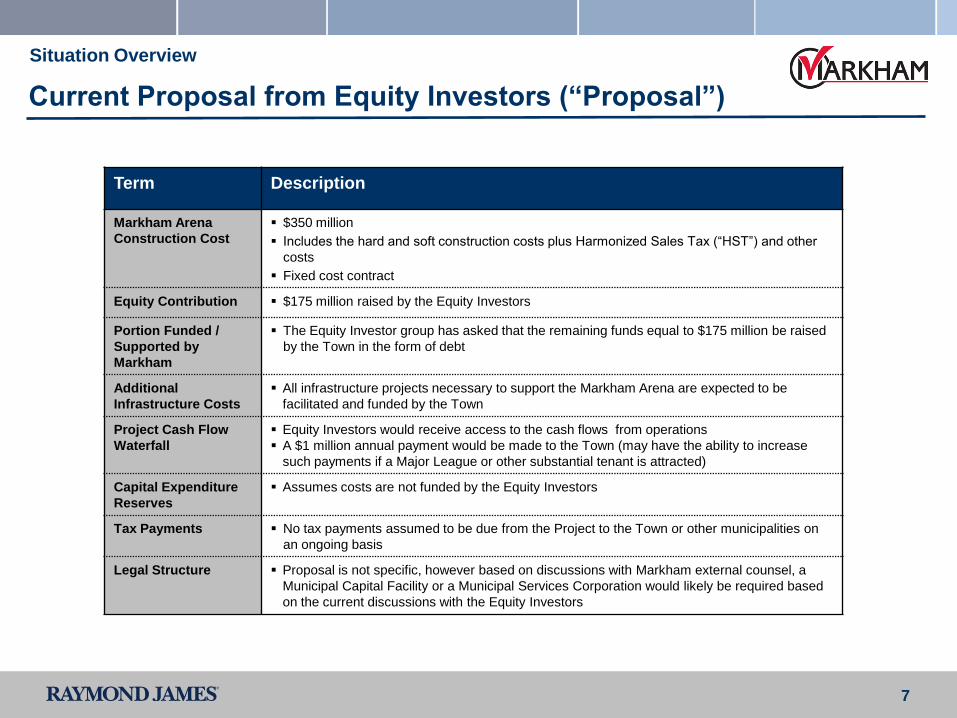
Term Description
Markham Arena
Construction Cost
$350 million
Includes the hard and soft construction costs plus Harmonized Sales Tax (“HST”) and other
costs
Fixed cost contract
Equity Contribution $175 million raised by the Equity Investors
Portion Funded /
Supported by
Markham
The Equity Investor group has asked that the remaining funds equal to $175 million be raised
by the Town in the form of debt
Additional
Infrastructure Costs
All infrastructure projects necessary to support the Markham Arena are expected to be
facilitated and funded by the Town
Project Cash Flow
Waterfall
Equity Investors would receive access to the cash flows from operations
A $1 million annual payment would be made to the Town (may have the ability to increase
such payments if a Major League or other substantial tenant is attracted)
Capital Expenditure
Reserves
Assumes costs are not funded by the Equity Investors
Tax Payments No tax payments assumed to be due from the Project to the Town or other municipalities on
an ongoing basis
Legal Structure Proposal is not specific, however based on discussions with Markham external counsel, a
Municipal Capital Facility or a Municipal Services Corporation would likely be required based
on the current discussions with the Equity Investors
Current Proposal from Equity Investors (“Proposal”)
Situation Overview

Section 2
Cost of Completion

9
Summary Observations
The Equity Investor’s estimated total development costs are $350 million comprised of (i) $208 million hard
construction costs, (ii) $91 million soft construction costs and (iii) $51 million non-construction related costs
PCL’s estimated total construction costs of $299 million for a 19,500 seat arena appears reasonable based
on the company’s experience with building similar arenas
– Firm cost contract provides some cost over-run protection (paid on a monthly basis until completion)
– Construction period would start as soon as practical and run through the last quarter of 2013
Hard construction costs of $208 million are reflective of current market conditions
– Based on certain comparables, PCL’s estimated $297/ft2 of hard costs appears reasonable
– However, certain modifications can be made to slightly reduce these construction costs
Soft construction costs of $91 million are generally in line with the Town’s estimate excluding $14 million of
development charges, bringing the total soft costs to $105 million
The Equity Investors assumed $51 million of non-construction related costs appears understated and may
be approximately $61 million, which includes $39 million of HST and a general contingency of $22 million (1)
Additionally, $42 million of identified infrastructure costs were excluded from PCL’s cost estimates
Cost of Completion
Source: PCL Presentation to the Town, Town Memos and Correspondence with the Town
(1) Includes an estimated $10 million for a one year interest reserve
Total Project Costs
Hard Costs 208$
Soft Costs 105$
Non-Construction Related Costs 61$
Other Infrastructure Costs 42$
Total Project Costs 416$
10
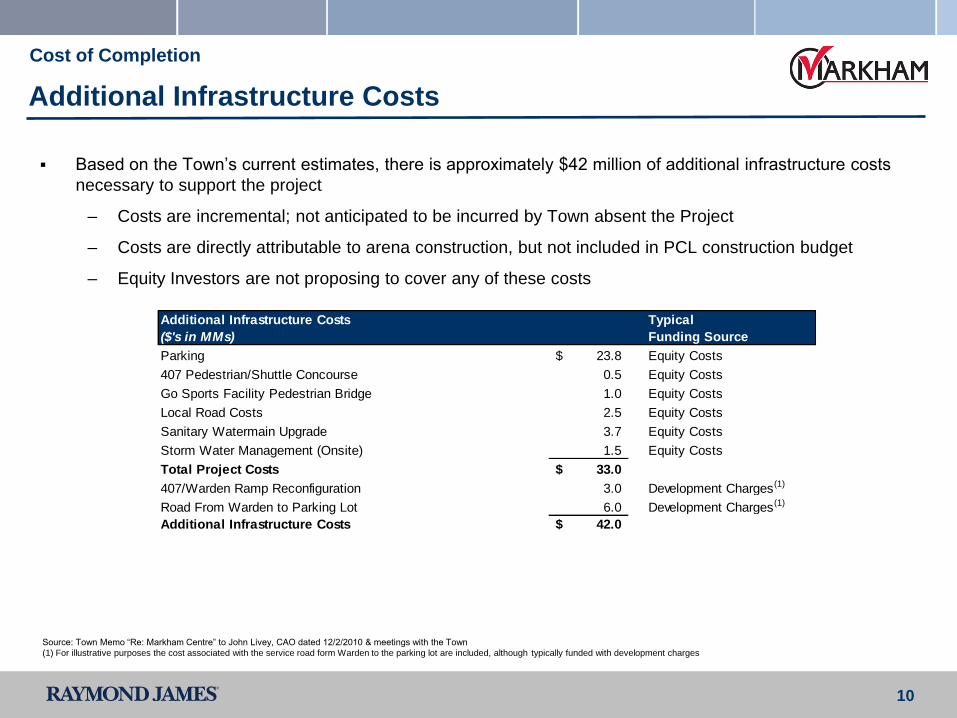
Based on the Town’s current estimates, there is approximately $42 million of additional infrastructure costs
necessary to support the project
– Costs are incremental; not anticipated to be incurred by Town absent the Project
– Costs are directly attributable to arena construction, but not included in PCL construction budget
– Equity Investors are not proposing to cover any of these costs
Additional Infrastructure Costs
Cost of Completion
Source: Town Memo “Re: Markham Centre” to John Livey, CAO dated 12/2/2010 & meetings with the Town
(1) For illustrative purposes the cost associated with the service road form Warden to the parking lot are included, although typically funded with development charges
Additional Infrastructure Costs Typical
($'s in MMs) Funding Source
Parking 23.8$ Equity Costs
407 Pedestrian/Shuttle Concourse 0.5 Equity Costs
Go Sports Facility Pedestrian Bridge 1.0 Equity Costs
Local Road Costs 2.5 Equity Costs
Sanitary Watermain Upgrade 3.7 Equity Costs
Storm Water Management (Onsite) 1.5 Equity Costs
Total Project Costs 33.0$
407/Warden Ramp Reconfiguration 3.0 Development Charges(1)
Road From Warden to Parking Lot 6.0 Development Charges(1)
Additional Infrastructure Costs 42.0$

Section 3
Pro-Forma Financial Forecast
12
Annualized Profit & Loss (“P&L”) from Standalone Arena
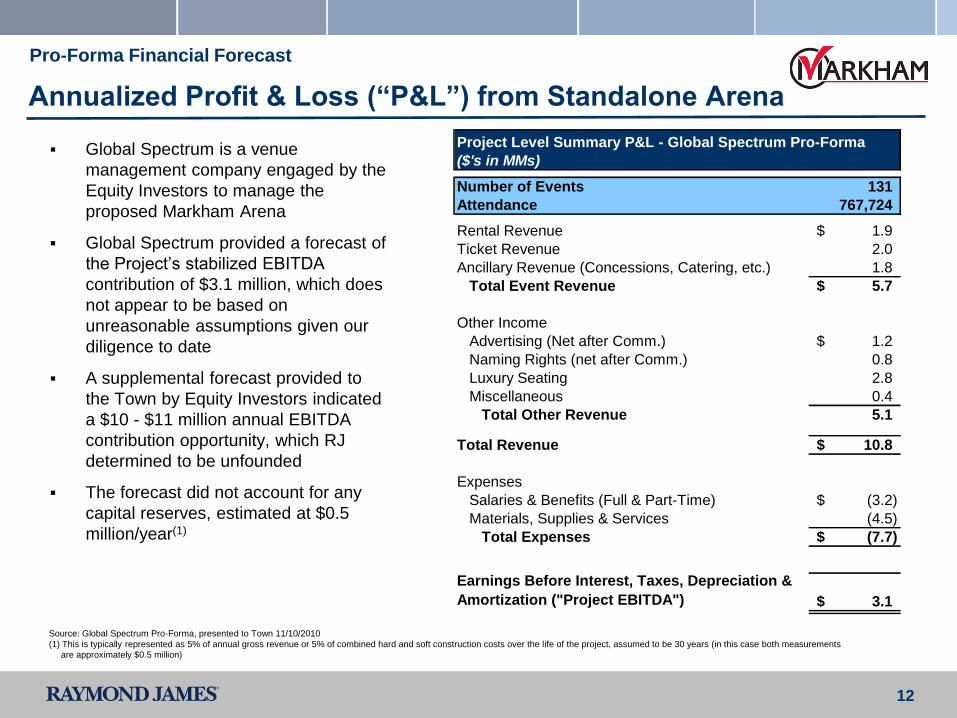
Global Spectrum is a venue
management company engaged by the
Equity Investors to manage the
proposed Markham Arena
Global Spectrum provided a forecast of
the Project’s stabilized EBITDA
contribution of $3.1 million, which does
not appear to be based on
unreasonable assumptions given our
diligence to date
A supplemental forecast provided to
the Town by Equity Investors indicated
a $10 - $11 million annual EBITDA
contribution opportunity, which RJ
determined to be unfounded
The forecast did not account for any
capital reserves, estimated at $0.5
million/year(1)
Pro-Forma Financial Forecast
Source: Global Spectrum Pro-Forma, presented to Town 11/10/2010
(1) This is typically represented as 5% of annual gross revenue or 5% of combined hard and soft construction costs over the life of the project, assumed to be 30 years (in this case both measurements
are approximately $0.5 million)
Project Level Summary P&L - Global Spectrum Pro-Forma
($'s in MMs)
Number of Events 131
Attendance 767,724
Rental Revenue 1.9$
Ticket Revenue 2.0
Ancillary Revenue (Concessions, Catering, etc.) 1.8
Total Event Revenue 5.7$
Other Income
Advertising (Net after Comm.) 1.2$
Naming Rights (net after Comm.) 0.8
Luxury Seating 2.8
Miscellaneous 0.4
Total Other Revenue 5.1
Total Revenue 10.8$
Expenses
Salaries & Benefits (Full & Part-Time) (3.2)$
Materials, Supplies & Services (4.5)
Total Expenses (7.7)$
Earnings Before Interest, Taxes, Depreciation &
Amortization ("Project EBITDA") 3.1$

13
Observations – Comparable Events
Pro-Forma Financial Forecast
Source: Company Websites
RJ Source: Canaccord
(1) BOK Center for 2009
Note: Markham projections provided by Global Spectrum, major tenant is not a Major League team
Global Spectrum’s forecast of 131 events is within the range of comparable arenas provided
14
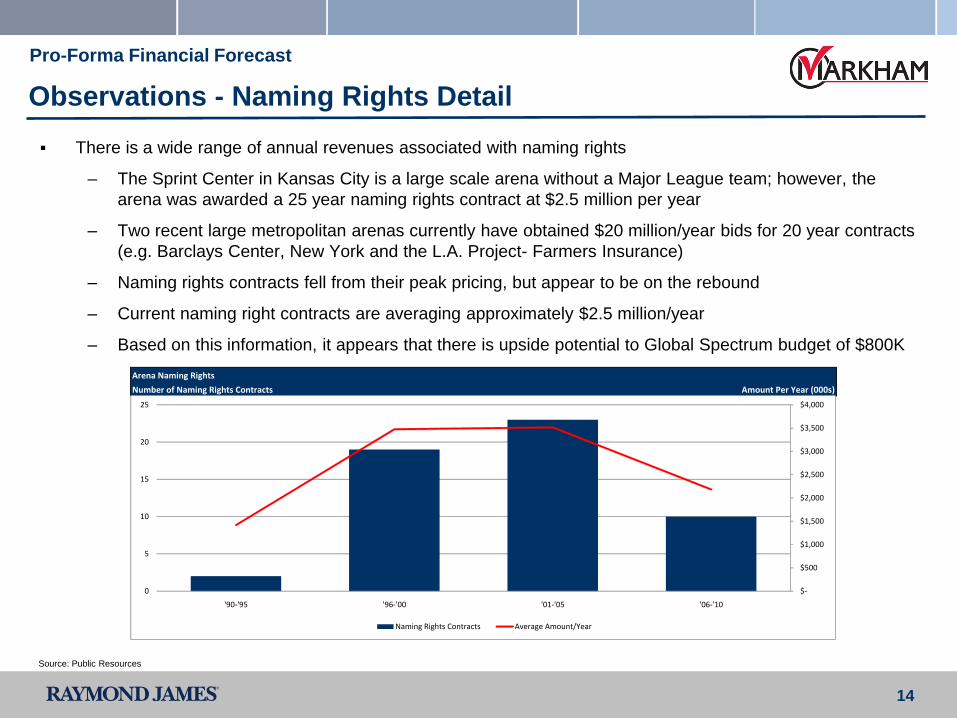
Observations - Naming Rights Detail
There is a wide range of annual revenues associated with naming rights
– The Sprint Center in Kansas City is a large scale arena without a Major League team; however, the
arena was awarded a 25 year naming rights contract at $2.5 million per year
– Two recent large metropolitan arenas currently have obtained $20 million/year bids for 20 year contracts
(e.g. Barclays Center, New York and the L.A. Project- Farmers Insurance)
– Naming rights contracts fell from their peak pricing, but appear to be on the rebound
– Current naming right contracts are averaging approximately $2.5 million/year
– Based on this information, it appears that there is upside potential to Global Spectrum budget of $800K
Pro-Forma Financial Forecast
Source: Public Resources
Arena Naming Rights
Number of Naming Rights Contracts Amount Per Year (000s)
$-
$500
$1,000
$1,500
$2,000
$2,500
$3,000
$3,500
$4,000
0
5
10
15
20
25
'90-'95 '96-'00 '01-'05 '06-'10
Naming Rights Contracts Average Amount/Year
15
Summary Observations
Project EBITDA and key assumptions may be achievable based on the comparable data provided
Solely based on Markham’s population, the Markham Arena falls below its peers in terms of population per
seat, however when considering the larger York Region or other similar Metro areas (a more appropriate
metric), the results are within the range of its peers (see page 37)
131 event assumption is not based on any existing commitment from promoters or contracts. Mix of events
and attendance could change significantly
– Meaningful risk to cash flows and operating profitability
– Potential ramp-up period before 131 event schedule is normalized
– Nearby comparable facilities that can accommodate over 15,000 attendees include the Air Canada
Centre, Copps Coliseum and Rogers Centre
– An arena venue in Markham may be a more accessible alternative to those living in the York Region
than existing venues in the Greater Toronto Area
Potential upside in cash flows
– Improved naming right contracts
– Incremental advertising revenue
– Greater utilization of luxury seating
Opportunity for the Town to negotiate ability to utilize non-event days and evenings to supplement cash flow
Pro-Forma Financial Forecast
Section 4
Sources and Uses
17
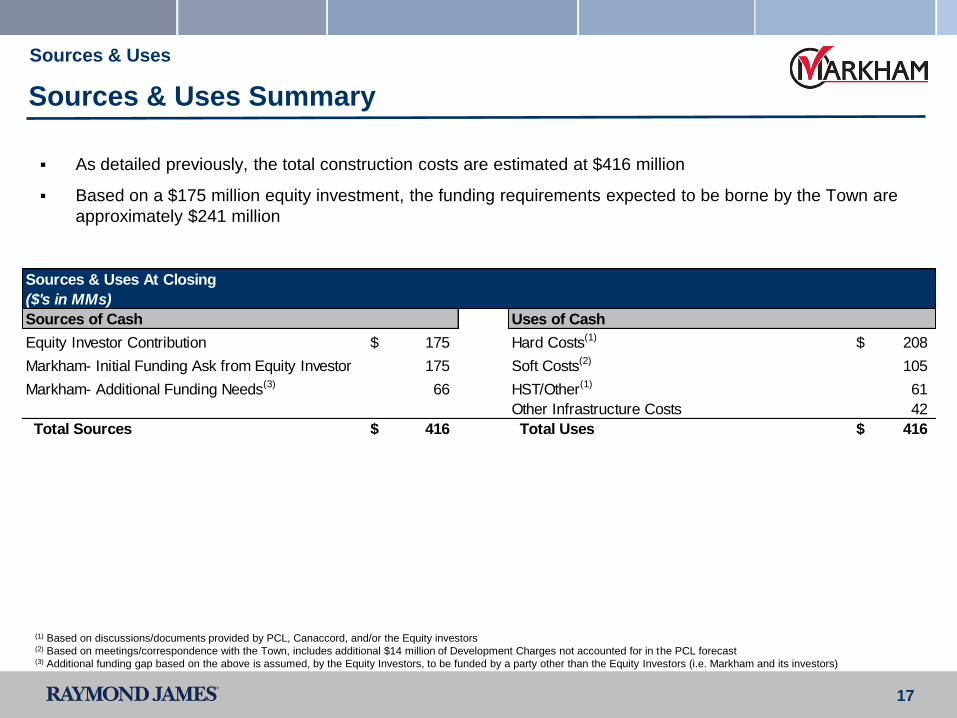
Sources & Uses Summary
As detailed previously, the total construction costs are estimated at $416 million
Based on a $175 million equity investment, the funding requirements expected to be borne by the Town are
approximately $241 million
Sources & Uses
(1) Based on discussions/documents provided by PCL, Canaccord, and/or the Equity investors(2) Based on meetings/correspondence with the Town, includes additional $14 million of Development Charges not accounted for in the PCL forecast(3) Additional funding gap based on the above is assumed, by the Equity Investors, to be funded by a party other than the Equity Investors (i.e. Markham and its investors)
Sources & Uses At Closing
($'s in MMs)
Sources of Cash Uses of Cash
Equity Investor Contribution 175$ Hard Costs(1)
208$
Markham- Initial Funding Ask from Equity Investor 175 Soft Costs(2)
105
Markham- Additional Funding Needs(3)
66 HST/Other(1)
61
Other Infrastructure Costs 42
Total Sources 416$ Total Uses 416$
18
Annual Funding Summary - Based on the Proposal
Based on Proposal, available annual cash flow to support a debt raise includes:
– Proposed $1 million payment from operating cash flow
– Plus: estimated additional parking revenue of $1 million / year
– Less: capital reserves of $0.5 million / annum
Based on the above cash flow, the total annual funding shortfall prior to including amortization is
approximately $10 million(1)
Assuming a 20 year term (with straight line amortization) the annual funding shortfall is approximately $17
million(1)
In summary, the Town’s initial funding cost, not funded by the Equity Investors, is estimated at $241 million
with an annual funding obligation of $10 - $17 million (with and without principal amortization, respectively)
– Lack of amortization would create significant refinancing risk
Opportunities and risks exist that may increase or decrease both the total Project construction costs as well
as the annual cash flows available to service debt, as discussed in following section
Sources & Uses
(1) Assumes 5% interest rate
19
Section 5
Financing & Structuring Alternatives
20
Overview - Financing Alternatives Based on Proposal
Financing & Structuring Alternatives
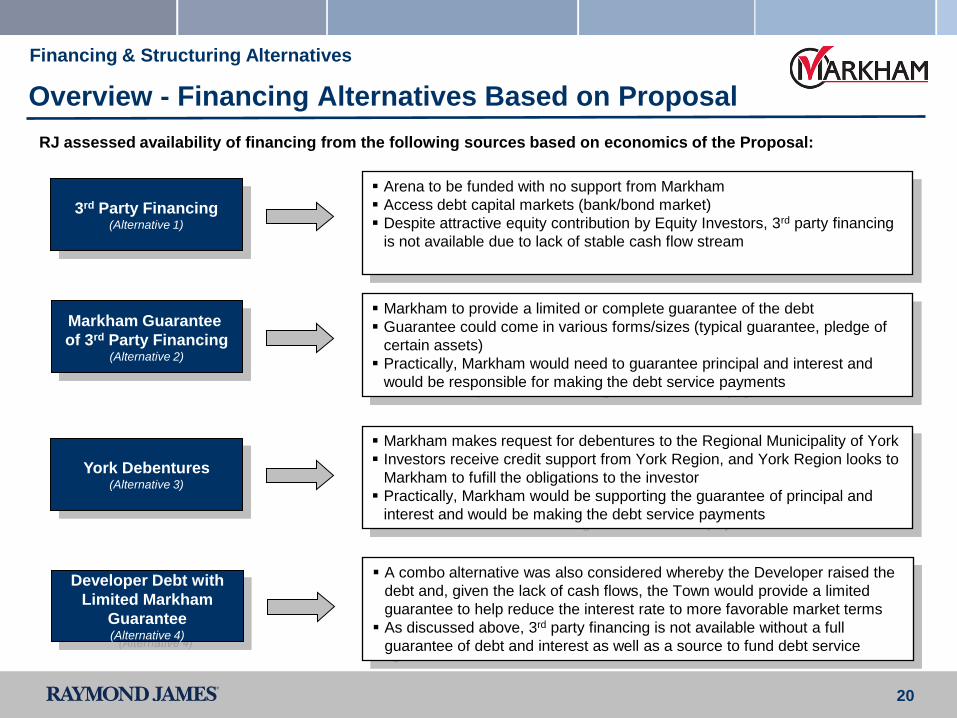
RJ assessed availability of financing from the following sources based on economics of the Proposal:
Markham Guarantee
of 3rd Party Financing(Alternative 2)
Markham makes request for debentures to the Regional Municipality of York
Investors receive credit support from York Region, and York Region looks to
Markham to fufill the obligations to the investor
Practically, Markham would be supporting the guarantee of principal and
interest and would be making the debt service payments
York Debentures(Alternative 3)
3rd Party Financing(Alternative 1)
Markham to provide a limited or complete guarantee of the debt
Guarantee could come in various forms/sizes (typical guarantee, pledge of
certain assets)
Practically, Markham would need to guarantee principal and interest and
would be responsible for making the debt service payments
Arena to be funded with no support from Markham
Access debt capital markets (bank/bond market)
Despite attractive equity contribution by Equity Investors, 3rd party financing
is not available due to lack of stable cash flow stream
A combo alternative was also considered whereby the Developer raised the
debt and, given the lack of cash flows, the Town would provide a limited
guarantee to help reduce the interest rate to more favorable market terms
As discussed above, 3rd party financing is not available without a full
guarantee of debt and interest as well as a source to fund debt service
Developer Debt with
Limited Markham
Guarantee(Alternative 4)
21
Add’l Alternative: Negotiated Transaction and 3rd Party Funding Sources
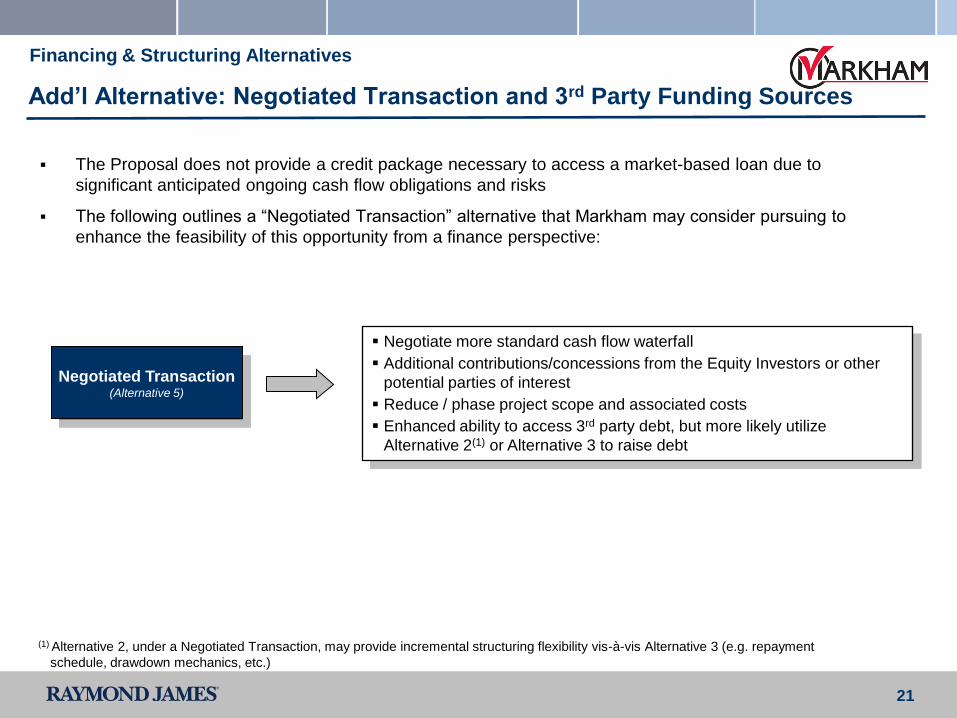
The Proposal does not provide a credit package necessary to access a market-based loan due to
significant anticipated ongoing cash flow obligations and risks
The following outlines a “Negotiated Transaction” alternative that Markham may consider pursuing to
enhance the feasibility of this opportunity from a finance perspective:
Financing & Structuring Alternatives
Negotiated Transaction(Alternative 5)
Negotiate more standard cash flow waterfall
Additional contributions/concessions from the Equity Investors or other
potential parties of interest
Reduce / phase project scope and associated costs
Enhanced ability to access 3rd party debt, but more likely utilize
Alternative 2(1) or Alternative 3 to raise debt
(1) Alternative 2, under a Negotiated Transaction, may provide incremental structuring flexibility vis-à-vis Alternative 3 (e.g. repayment
schedule, drawdown mechanics, etc.)
22
Negotiated Transaction – Overview
Multiple opportunities are available to the Town to reduce the initial Project funding requirements and
consequently the ongoing debt service amounts. Such benefits could come from:
– Credit enhancements provided by Markham
• Contributions to the initial funding (e.g. community use funds, deferral of development charges,
etc.)
• Utilization of initiatives funded from other programs (e.g. parking structures that may be
developed with an award from the Pan Am Games)
• Future revenue streams (e.g. bonusing payments)
– Additional contributions/concessions from Equity Investors
• Less expensive build out of the Markham Arena
• Contractual rights to all of certain cash flow streams (particularly naming rights and advertising
revenue)
• Additional equity contribution
– Contributions from alternative funding sources
• Additional contributions could be made from Provincial, Federal or other sources
Financing & Structuring Alternatives
23
Negotiated Transaction - Potential Contributions and Deferrals
Financing & Structuring Alternatives
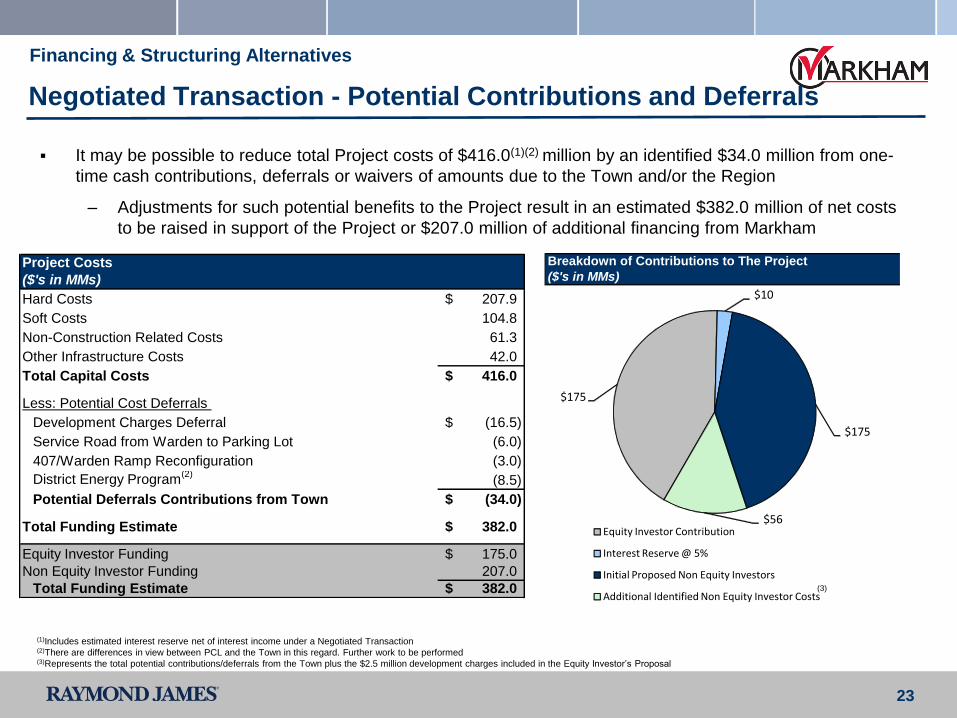
It may be possible to reduce total Project costs of $416.0(1)(2) million by an identified $34.0 million from one-
time cash contributions, deferrals or waivers of amounts due to the Town and/or the Region
– Adjustments for such potential benefits to the Project result in an estimated $382.0 million of net costs
to be raised in support of the Project or $207.0 million of additional financing from Markham
(1)Includes estimated interest reserve net of interest income under a Negotiated Transaction(2)There are differences in view between PCL and the Town in this regard. Further work to be performed(3)Represents the total potential contributions/deferrals from the Town plus the $2.5 million development charges included in the Equity Investor’s Proposal
(3)
Breakdown of Contributions to The Project
($'s in MMs)
$175
$10
$175
$56 Equity Investor Contribution
Interest Reserve @ 5%
Initial Proposed Non Equity Investors
Additional Identified Non Equity Investor Costs
Project Costs
($'s in MMs)
Hard Costs 207.9$
Soft Costs 104.8
Non-Construction Related Costs 61.3
Other Infrastructure Costs 42.0
Total Capital Costs 416.0$
Less: Potential Cost Deferrals
Development Charges Deferral (16.5)$
Service Road from Warden to Parking Lot (6.0)
407/Warden Ramp Reconfiguration (3.0)
District Energy Program(2)
(8.5)
Potential Deferrals Contributions from Town (34.0)$
Total Funding Estimate 382.0$
Equity Investor Funding 175.0$
Non Equity Investor Funding 207.0
Total Funding Estimate 382.0$
24
Negotiated Transaction – Cash Flow, Debt Capacity and Funding Gap
Financing & Structuring Alternatives
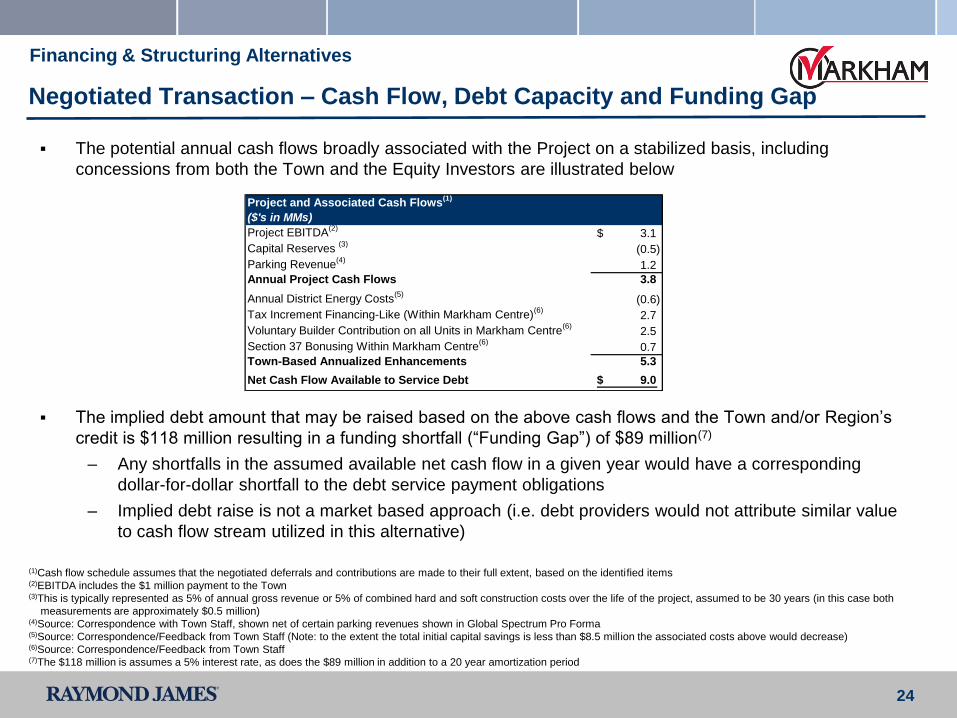
The potential annual cash flows broadly associated with the Project on a stabilized basis, including
concessions from both the Town and the Equity Investors are illustrated below
The implied debt amount that may be raised based on the above cash flows and the Town and/or Region’s
credit is $118 million resulting in a funding shortfall (“Funding Gap”) of $89 million(7)
– Any shortfalls in the assumed available net cash flow in a given year would have a corresponding
dollar-for-dollar shortfall to the debt service payment obligations
– Implied debt raise is not a market based approach (i.e. debt providers would not attribute similar value
to cash flow stream utilized in this alternative)
(1)Cash flow schedule assumes that the negotiated deferrals and contributions are made to their full extent, based on the identified items(2)EBITDA includes the $1 million payment to the Town(3)This is typically represented as 5% of annual gross revenue or 5% of combined hard and soft construction costs over the life of the project, assumed to be 30 years (in this case both
measurements are approximately $0.5 million)(4)Source: Correspondence with Town Staff, shown net of certain parking revenues shown in Global Spectrum Pro Forma(5)Source: Correspondence/Feedback from Town Staff (Note: to the extent the total initial capital savings is less than $8.5 million the associated costs above would decrease)(6)Source: Correspondence/Feedback from Town Staff(7)The $118 million is assumes a 5% interest rate, as does the $89 million in addition to a 20 year amortization period
Project and Associated Cash Flows(1)
($'s in MMs)
Project EBITDA(2)
3.1$
Capital Reserves (3)
(0.5)
Parking Revenue(4)
1.2
Annual Project Cash Flows 3.8
Annual District Energy Costs(5)
(0.6)
Tax Increment Financing-Like (Within Markham Centre)(6)
2.7
Voluntary Builder Contribution on all Units in Markham Centre(6)
2.5
Section 37 Bonusing Within Markham Centre(6)
0.7
Town-Based Annualized Enhancements 5.3
Net Cash Flow Available to Service Debt 9.0$
25
Negotiated Transaction - Summary Observations
As it stands, the Proposal does not provide for market-based debt, however there is potential to negotiate an
improved, more palatable agreement for the Town
– Given the structure of cash flows, 3rd Party debt would not be available absent significant credit support
and payment guarantees from Town
A Negotiated Transaction may provide sufficient cash flows on a stabilized basis to justify a debt raise
Assuming all assumptions in the Negotiated Transaction are achieved, there is an $89 million Funding Gap
Other parties of interest could justify bridging the Funding Gap based on economic benefits(1) and other
benefits not quantifiable at the current time
The Funding Gap could be bridged with additional equity (developers, provincial and federal)
– On an average, annualized basis, funding of the Funding Gap would require $5.2 million / year
Other ideas that may be explored with the existing constituents include:
Financing & Structuring Alternatives
Town
‒ Pursuit of grants and donations
‒ Pursue lease / grant of land acquired for
parking lot
‒ Potential structure which may avoid HST
obligations (approx. $39 million)(3)
Equity Investors
‒ Building an arena with a smaller construction budget
‒ Contributions to future capital expenditure and reserve
requirements
‒ Pre-sale of luxury boxes
‒ Commitments to development surrounding Markham Arena
(1) Please refer to the report being prepared by Director of Economic Development for the Town, Stephen Chait, on the Economic Benefits of the Project (2) Assumes 5% interest rate and a 20 year amortization period(3) Based on PCL’s assumed construction cost estimates

26
Section 6
Next Steps & Recommendations
27
Recommendations
Equity Investor group composition and investment proportions are not yet fully formed. RJ has obtained some verbal
assurances of financial wherewithal from two of the potential investors, and an investment firm on their behalf, but
further financial qualification diligence is needed
– Absent other motivations, the Project does not appear to provide adequate equity like returns to the proposed
Equity Investors, creating additional execution risk
– Require substantial equity investment from lead proponent of Equity Investor group
The Proposal would not permit a debt raise from a 3rd party capital provider on a stand-alone basis
– The debt can be raised by a 3rd party given Markham credit enhancement or via the York Region
Structural protections to the benefit of the Town, such as a first lien / foreclosure right should be negotiated
The debt under the Proposal would place significant annual cash flow burden on Markham and carries significant risk
– At this point, from a pure financial point of view, the Town does not appear to be earning an adequate return for
its involvement in extending or facilitating the debt raise
A $175 million equity investment to help fund a marquee destination in the Town is attractive and may be worth
pursuing alternatives with respect to the project’s feasibility
There are numerous factors that impact a) the Project’s costs and b) the Project’s cash flows, that could be
negotiated and/or revised to mitigate the burden and risk to the Town
– A Negotiated Transaction, as illustrated, will be difficult to achieve given multiple parties and interests
– Might still leave a Funding Gap of $89 million (assuming 20 year amortizing period and 5% rate)
Based on the Town’s draft economic study, there may be justification for provincial support to fund this gap(1)
– On an average, annualized basis, funding of the Funding Gap would require $5.2 million / year(2)
Next Steps & Recommendations
(1)Please refer to the report being prepared by Director of Economic Development for the Town, Stephen Chait, on the Economic Benefits of the Project(2)Assumes 5% interest rate and a 20 year amortization period
28
Next Steps
Obtain Town Council approval to move forward with evaluation of the opportunity
– Do not provide any substantial commitments before significant progress on various improvements to
the Proposal have been negotiated
Engage Raymond James to continue to “quarterback” assessment of Project, assist in negotiations with the
Equity Investors and pursue necessary debt capital to consummate any agreements or transactions
Complete financial qualification review of Equity Investors
Negotiate letter of intent / term sheet with the Equity Investors
– Assess and finalize the legal / funding structures
– Determine actual tangible costs / benefits (i.e. cash in/outflow) of the Project
– Determine the tangible and intangible benefits of the Project
– Document timeline and milestones
– Socialize/obtain approvals from York Region and others that may be required
Next Steps & Recommendations
29
Appendix
Supplemental Schedules
30
PCL Overview
PCL is a construction firm working with the Equity Investors to construct the Arena
– Provided preliminary projection estimates to construct the Arena
– Has been engaged by the Equity Investors to construct the Arena should the Project get approved
PCL has extensive experience in arena building (over $2.7 billion in construction value in North American in
the last 10 years(1)), including the construction of a number of arenas in Canada in the last 10 years
– PCL is currently engaged by the Town for the construction of the East Markham Community Centre
and Library
PCL has estimated the cost of completing a 19,500 seat Arena at $350 million
– Hard Costs- $208 million
– Soft Costs- $91 million
– Non-Construction Related Costs - $51 million
Construction period would start as soon as practical and run through the last quarter of 2013
Cost of Completion
(1)PCL facts from PCL official website <www.pcl.com>
31
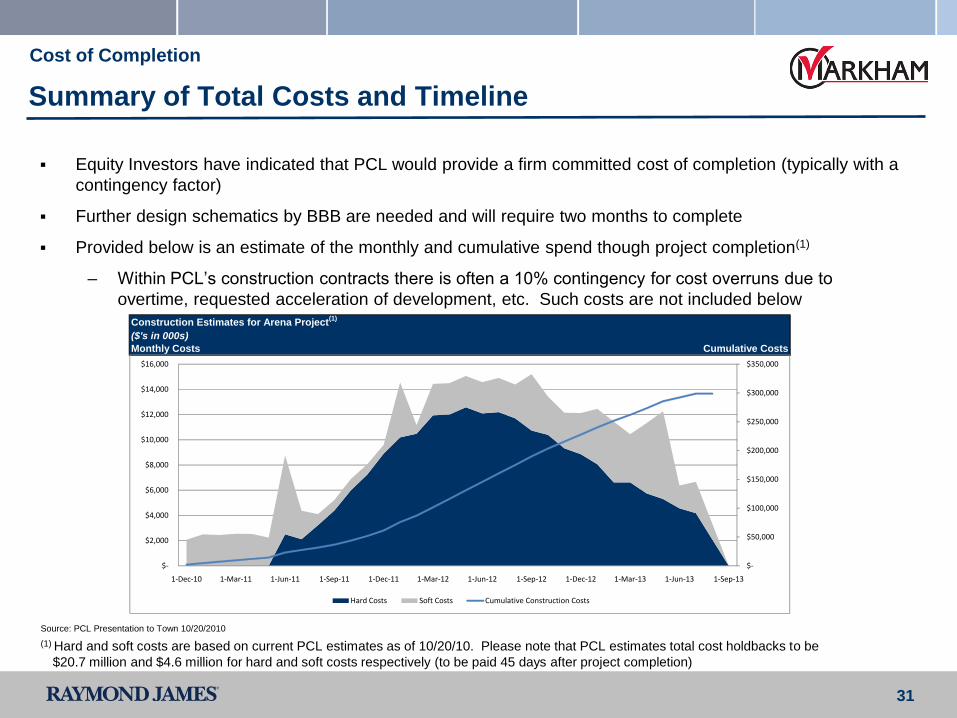
Summary of Total Costs and Timeline
Equity Investors have indicated that PCL would provide a firm committed cost of completion (typically with a
contingency factor)
Further design schematics by BBB are needed and will require two months to complete
Provided below is an estimate of the monthly and cumulative spend though project completion(1)
– Within PCL’s construction contracts there is often a 10% contingency for cost overruns due to
overtime, requested acceleration of development, etc. Such costs are not included below
Cost of Completion
Source: PCL Presentation to Town 10/20/2010
(1) Hard and soft costs are based on current PCL estimates as of 10/20/10. Please note that PCL estimates total cost holdbacks to be
$20.7 million and $4.6 million for hard and soft costs respectively (to be paid 45 days after project completion)
Construction Estimates for Arena Project(1)
($'s in 000s)
Monthly Costs Cumulative Costs
$-
$50,000
$100,000
$150,000
$200,000
$250,000
$300,000
$350,000
$-
$2,000
$4,000
$6,000
$8,000
$10,000
$12,000
$14,000
$16,000
1-Dec-10 1-Mar-11 1-Jun-11 1-Sep-11 1-Dec-11 1-Mar-12 1-Jun-12 1-Sep-12 1-Dec-12 1-Mar-13 1-Jun-13 1-Sep-13
Hard Costs Soft Costs Cumulative Construction Costs
32
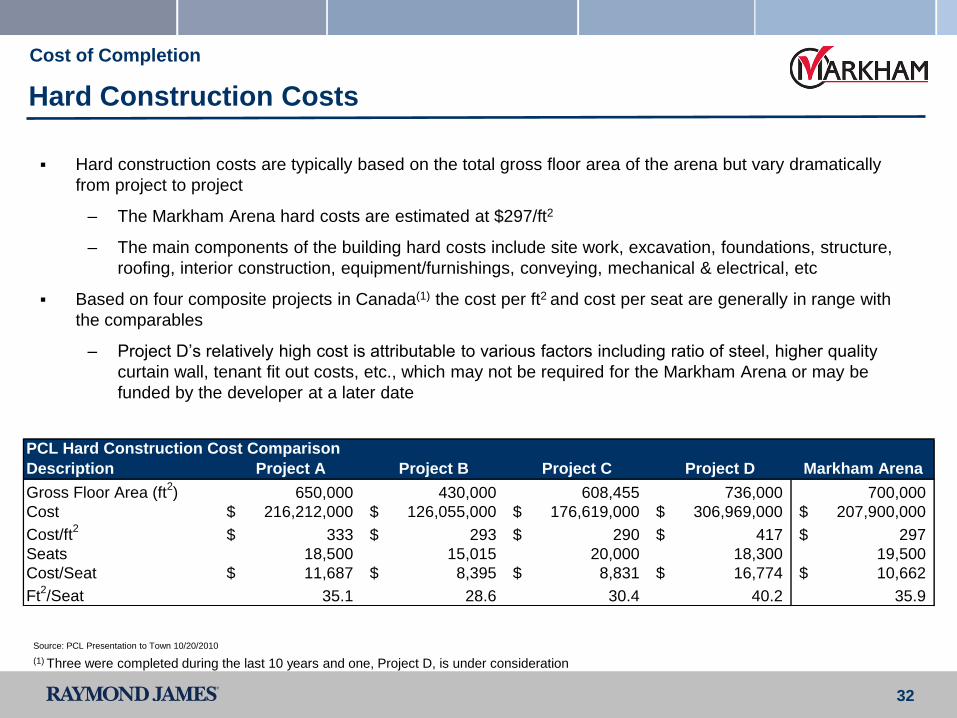
Hard Construction Costs
Hard construction costs are typically based on the total gross floor area of the arena but vary dramatically
from project to project
– The Markham Arena hard costs are estimated at $297/ft2
– The main components of the building hard costs include site work, excavation, foundations, structure,
roofing, interior construction, equipment/furnishings, conveying, mechanical & electrical, etc
Based on four composite projects in Canada(1) the cost per ft2 and cost per seat are generally in range with
the comparables
– Project D’s relatively high cost is attributable to various factors including ratio of steel, higher quality
curtain wall, tenant fit out costs, etc., which may not be required for the Markham Arena or may be
funded by the developer at a later date
Cost of Completion
Source: PCL Presentation to Town 10/20/2010
(1) Three were completed during the last 10 years and one, Project D, is under consideration
PCL Hard Construction Cost Comparison
Description Project A Project B Project C Project D Markham Arena
Gross Floor Area (ft2) 650,000 430,000 608,455 736,000 700,000
Cost 216,212,000$ 126,055,000$ 176,619,000$ 306,969,000$ 207,900,000$
Cost/ft2
333$ 293$ 290$ 417$ 297$
Seats 18,500 15,015 20,000 18,300 19,500
Cost/Seat 11,687$ 8,395$ 8,831$ 16,774$ 10,662$
Ft2/Seat 35.1 28.6 30.4 40.2 35.9
33
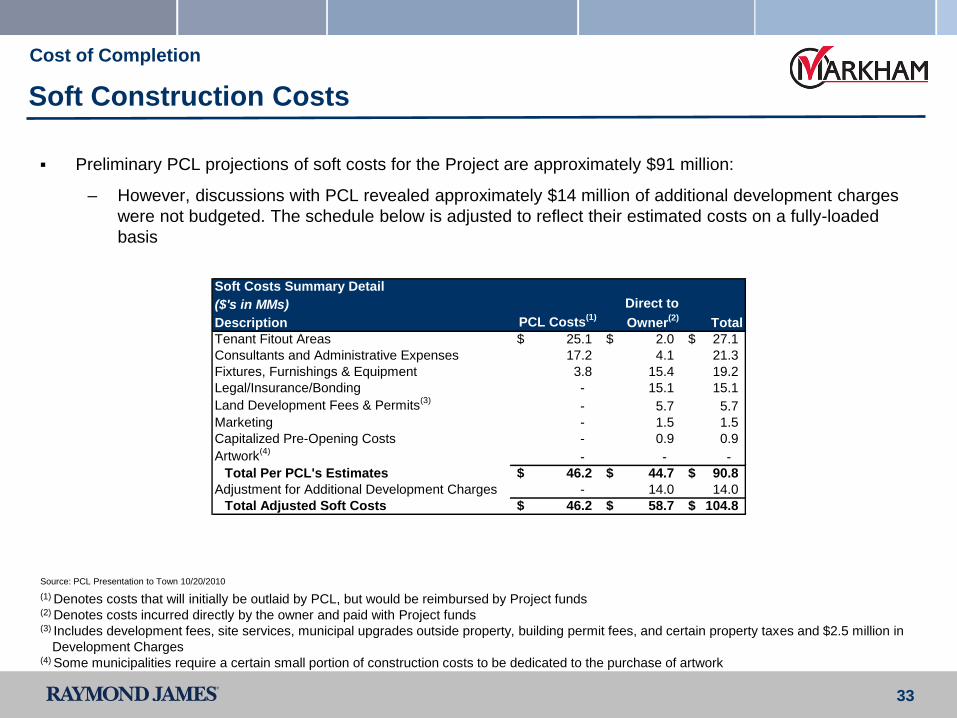
Soft Construction Costs
Preliminary PCL projections of soft costs for the Project are approximately $91 million:
– However, discussions with PCL revealed approximately $14 million of additional development charges
were not budgeted. The schedule below is adjusted to reflect their estimated costs on a fully-loaded
basis
Cost of Completion
Source: PCL Presentation to Town 10/20/2010
(1) Denotes costs that will initially be outlaid by PCL, but would be reimbursed by Project funds(2) Denotes costs incurred directly by the owner and paid with Project funds(3) Includes development fees, site services, municipal upgrades outside property, building permit fees, and certain property taxes and $2.5 million in
Development Charges(4) Some municipalities require a certain small portion of construction costs to be dedicated to the purchase of artwork
Soft Costs Summary Detail
($'s in MMs)
Description PCL Costs(1)
Total
Tenant Fitout Areas 25.1$ 2.0$ 27.1$
Consultants and Administrative Expenses 17.2 4.1 21.3
Fixtures, Furnishings & Equipment 3.8 15.4 19.2
Legal/Insurance/Bonding - 15.1 15.1
Land Development Fees & Permits(3)
- 5.7 5.7
Marketing - 1.5 1.5
Capitalized Pre-Opening Costs - 0.9 0.9
Artwork(4)
- - -
Total Per PCL's Estimates 46.2$ 44.7$ 90.8$
Adjustment for Additional Development Charges - 14.0 14.0
Total Adjusted Soft Costs 46.2$ 58.7$ 104.8$
Direct to
Owner(2)
34
Non-Construction Related Costs
Non-Construction related costs estimated at $61 million (1)
Approximately $39 million of such costs are associated with the Harmonized Sales Tax (HST), which is
assumed to constitute an unrecoverable cash outlay by the Project
The use of the $22 million(1) of remaining funds were not identified. For purposes of analyzing the Proposal,
we consider these funds a contingency and are not assumed available for any future funding of the Project
Cost of Completion
(1) Includes an estimated 10 million for an one year interest reserve
35
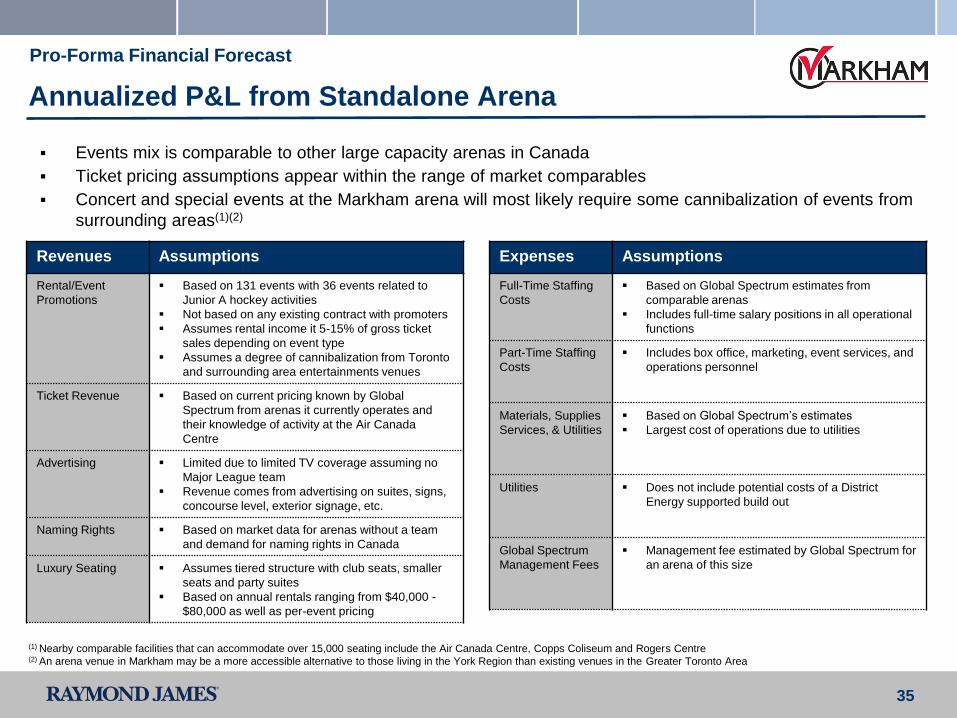
Annualized P&L from Standalone Arena
Revenues Assumptions
Rental/Event
Promotions
Based on 131 events with 36 events related to
Junior A hockey activities
Not based on any existing contract with promoters
Assumes rental income it 5-15% of gross ticket
sales depending on event type
Assumes a degree of cannibalization from Toronto
and surrounding area entertainments venues
Ticket Revenue Based on current pricing known by Global
Spectrum from arenas it currently operates and
their knowledge of activity at the Air Canada
Centre
Advertising Limited due to limited TV coverage assuming no
Major League team
Revenue comes from advertising on suites, signs,
concourse level, exterior signage, etc.
Naming Rights Based on market data for arenas without a team
and demand for naming rights in Canada
Luxury Seating Assumes tiered structure with club seats, smaller
seats and party suites
Based on annual rentals ranging from $40,000 -
$80,000 as well as per-event pricing
Expenses Assumptions
Full-Time Staffing
Costs
Based on Global Spectrum estimates from
comparable arenas
Includes full-time salary positions in all operational
functions
Part-Time Staffing
Costs
Includes box office, marketing, event services, and
operations personnel
Materials, Supplies
Services, & Utilities
Based on Global Spectrum’s estimates
Largest cost of operations due to utilities
Utilities Does not include potential costs of a District
Energy supported build out
Global Spectrum
Management Fees
Management fee estimated by Global Spectrum for
an arena of this size
Events mix is comparable to other large capacity arenas in Canada
Ticket pricing assumptions appear within the range of market comparables
Concert and special events at the Markham arena will most likely require some cannibalization of events from
surrounding areas(1)(2)
(1) Nearby comparable facilities that can accommodate over 15,000 seating include the Air Canada Centre, Copps Coliseum and Rogers Centre(2) An arena venue in Markham may be a more accessible alternative to those living in the York Region than existing venues in the Greater Toronto Area
Pro-Forma Financial Forecast
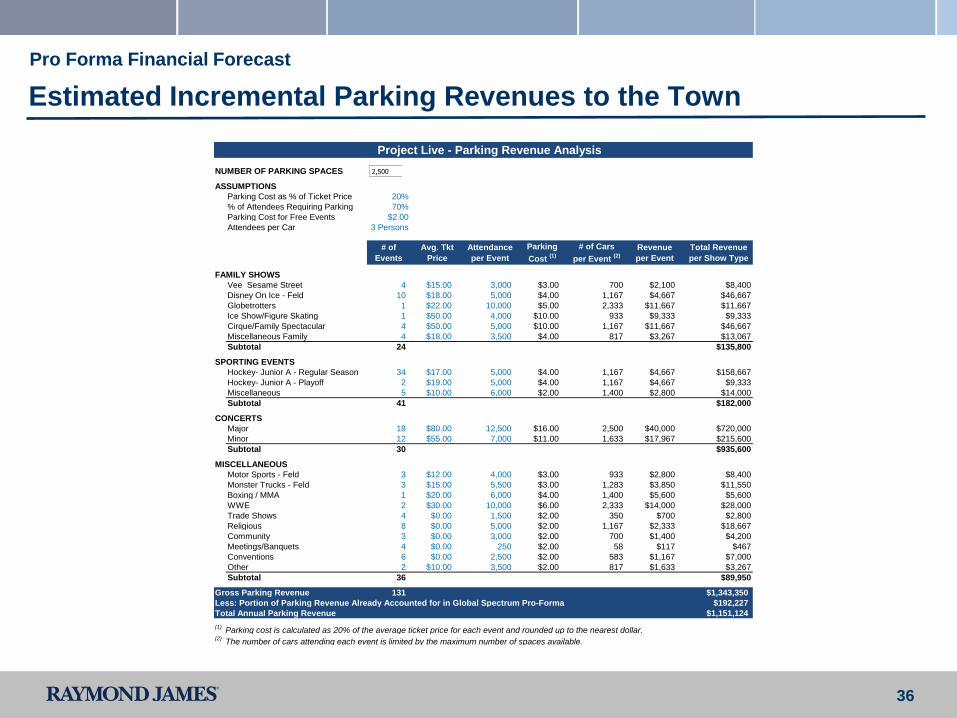
36
Estimated Incremental Parking Revenues to the Town
Project Live - Parking Revenue Analysis
NUMBER OF PARKING SPACES 1 2,500 2,5004,500
ASSUMPTIONS 6,500
Parking Cost as % of Ticket Price 20%
% of Attendees Requiring Parking 70%
Parking Cost for Free Events $2.00
Attendees per Car 3 Persons
# of
Events
Avg. Tkt
Price
Attendance
per Event
Parking
Cost (1)
# of Cars
per Event (2)
Revenue
per Event
Total Revenue
per Show Type
FAMILY SHOWS
Vee Sesame Street 4 $15.00 3,000 $3.00 700 $2,100 $8,400
Disney On Ice - Feld 10 $18.00 5,000 $4.00 1,167 $4,667 $46,667
Globetrotters 1 $22.00 10,000 $5.00 2,333 $11,667 $11,667
Ice Show/Figure Skating 1 $50.00 4,000 $10.00 933 $9,333 $9,333
Cirque/Family Spectacular 4 $50.00 5,000 $10.00 1,167 $11,667 $46,667
Miscellaneous Family 4 $18.00 3,500 $4.00 817 $3,267 $13,067
Subtotal 24 $135,800
SPORTING EVENTS
Hockey- Junior A - Regular Season 34 $17.00 5,000 $4.00 1,167 $4,667 $158,667
Hockey- Junior A - Playoff 2 $19.00 5,000 $4.00 1,167 $4,667 $9,333
Miscellaneous 5 $10.00 6,000 $2.00 1,400 $2,800 $14,000
Subtotal 41 $182,000
CONCERTS
Major 18 $80.00 12,500 $16.00 2,500 $40,000 $720,000
Minor 12 $55.00 7,000 $11.00 1,633 $17,967 $215,600
Subtotal 30 $935,600
MISCELLANEOUS
Motor Sports - Feld 3 $12.00 4,000 $3.00 933 $2,800 $8,400
Monster Trucks - Feld 3 $15.00 5,500 $3.00 1,283 $3,850 $11,550
Boxing / MMA 1 $20.00 6,000 $4.00 1,400 $5,600 $5,600
WWE 2 $30.00 10,000 $6.00 2,333 $14,000 $28,000
Trade Shows 4 $0.00 1,500 $2.00 350 $700 $2,800
Religious 8 $0.00 5,000 $2.00 1,167 $2,333 $18,667
Community 3 $0.00 3,000 $2.00 700 $1,400 $4,200
Meetings/Banquets 4 $0.00 250 $2.00 58 $117 $467
Conventions 6 $0.00 2,500 $2.00 583 $1,167 $7,000
Other 2 $10.00 3,500 $2.00 817 $1,633 $3,267
Subtotal 36 $89,950
Gross Parking Revenue 131 $1,343,350
Less: Portion of Parking Revenue Already Accounted for in Global Spectrum Pro-Forma $192,227
Total Annual Parking Revenue $1,151,124
(1) Parking cost is calculated as 20% of the average ticket price for each event and rounded up to the nearest dollar.
(2) The number of cars attending each event is limited by the maximum number of spaces available.
2,500
Pro Forma Financial Forecast
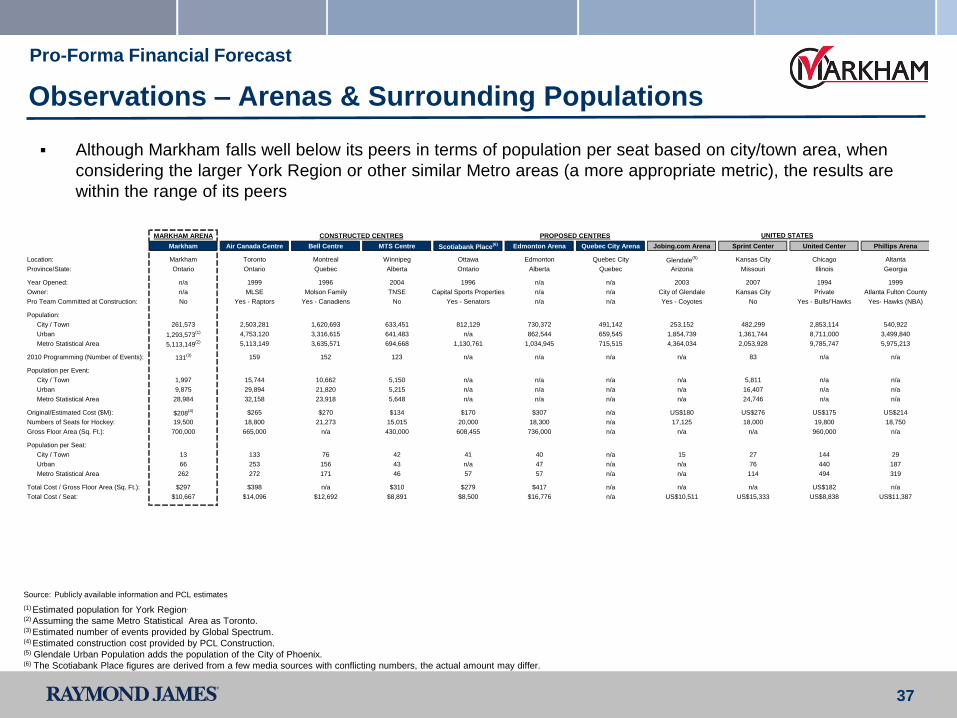
37
Observations – Arenas & Surrounding Populations
Pro-Forma Financial Forecast
Although Markham falls well below its peers in terms of population per seat based on city/town area, when
considering the larger York Region or other similar Metro areas (a more appropriate metric), the results are
within the range of its peers
Source: Publicly available information and PCL estimates
(1) Estimated population for York Region.
(2) Assuming the same Metro Statistical Area as Toronto.(3) Estimated number of events provided by Global Spectrum. (4) Estimated construction cost provided by PCL Construction.(5) Glendale Urban Population adds the population of the City of Phoenix.(6) The Scotiabank Place figures are derived from a few media sources with conflicting numbers, the actual amount may differ.
MARKHAM ARENA CONSTRUCTED CENTRES PROPOSED CENTRES
Markham Air Canada Centre Bell Centre MTS Centre Scotiabank Place(6) Edmonton Arena Quebec City Arena Jobing.com Arena Sprint Center United Center Phillips Arena
Location: Markham Toronto Montreal Winnipeg Ottawa Edmonton Quebec City Glendale(5) Kansas City Chicago Altanta
Province/State: Ontario Ontario Quebec Alberta Ontario Alberta Quebec Arizona Missouri Illinois Georgia
Year Opened: n/a 1999 1996 2004 1996 n/a n/a 2003 2007 1994 1999
Owner: n/a MLSE Molson Family TNSE Capital Sports Properties n/a n/a City of Glendale Kansas City Private Atlanta Fulton County
Pro Team Committed at Construction: No Yes - Raptors Yes - Canadiens No Yes - Senators n/a n/a Yes - Coyotes No Yes - Bulls/'Hawks Yes- Hawks (NBA)
Population:
City / Town 261,573 2,503,281 1,620,693 633,451 812,129 730,372 491,142 253,152 482,299 2,853,114 540,922
Urban 1,293,573(1) 4,753,120 3,316,615 641,483 n/a 862,544 659,545 1,854,739 1,361,744 8,711,000 3,499,840
Metro Statistical Area 5,113,149(2) 5,113,149 3,635,571 694,668 1,130,761 1,034,945 715,515 4,364,034 2,053,928 9,785,747 5,975,213
2010 Programming (Number of Events): 131(3) 159 152 123 n/a n/a n/a n/a 83 n/a n/a
Population per Event:
City / Town 1,997 15,744 10,662 5,150 n/a n/a n/a n/a 5,811 n/a n/a
Urban 9,875 29,894 21,820 5,215 n/a n/a n/a n/a 16,407 n/a n/a
Metro Statistical Area 28,984 32,158 23,918 5,648 n/a n/a n/a n/a 24,746 n/a n/a
Original/Estimated Cost ($M): $208(4) $265 $270 $134 $170 $307 n/a US$180 US$276 US$175 US$214
Numbers of Seats for Hockey: 19,500 18,800 21,273 15,015 20,000 18,300 n/a 17,125 18,000 19,800 18,750
Gross Floor Area (Sq. Ft.): 700,000 665,000 n/a 430,000 608,455 736,000 n/a n/a n/a 960,000 n/a
Population per Seat:
City / Town 13 133 76 42 41 40 n/a 15 27 144 29
Urban 66 253 156 43 n/a 47 n/a n/a 76 440 187
Metro Statistical Area 262 272 171 46 57 57 n/a n/a 114 494 319
Total Cost / Gross Floor Area (Sq. Ft.): $297 $398 n/a $310 $279 $417 n/a n/a n/a US$182 n/a
Total Cost / Seat: $10,667 $14,096 $12,692 $8,891 $8,500 $16,776 n/a US$10,511 US$15,333 US$8,838 US$11,387
UNITED STATES

38
Annual Funding Costs Based on the Proposal
Based on Proposal, available annual cash flow available to support debt raise include:
– Proposed $1 million payment from operating cash flow
– Plus: estimated additional parking revenue of $1 million / year
– Less: capital reserves of $0.5 million / annum
Tables below reflect remaining debt service funding requirement:
In summary, the Town’s initial funding cost, not funded by the Equity Investors, is estimated at $241 million
with an annual funding obligation of $10 - $17 million (with and without principal amortization, respectively)
Sources & Uses
(1) Includes interest expense and capital expenditure (maintenance and reserves), refer to Section 4 for additional detail(2) For illustrative purposes only, assumes a 5% interest rate(3) Utilizing an average annual Principal and Interest payment amount over the length of the term. (Note: Due to declining interest
payments over the life of the amortization, cash flow available for funding earlier on in the term would be less than that available in the
later years of the term.
Annual Funding Requirements(1)
Annual Funding Requirements- Assuming Straightline Amortization(2)(3)
($'s in MMs) ($'s in MMs)
-$ 4.0% 4.5% 5.0% 5.5% 6.0% Int. Only 40 Yrs 30 Yrs 20 Yrs 10 Yrs
221.2$ (7)$ (8)$ (9)$ (11)$ (12)$ 221.2$ (9)$ (10)$ (11)$ (15)$ (27)$
231.2$ (8)$ (9)$ (10)$ (11)$ (12)$ 231.2$ (10)$ (10)$ (12)$ (16)$ (28)$
241.2$ (8)$ (9)$ (10)$ (12)$ (13)$ 241.2$ (10)$ (11)$ (13)$ (17)$ (29)$
251.2$ (8)$ (10)$ (11)$ (12)$ (13)$ 251.2$ (11)$ (11)$ (13)$ (18)$ (30)$
261.2$ (9)$ (10)$ (11)$ (13)$ (14)$ 261.2$ (11)$ (12)$ (14)$ (18)$ (32)$
Interest Rate(2) Term
Non-
Equity
Investor
Funding
Non-
Equity
Investor
Funding
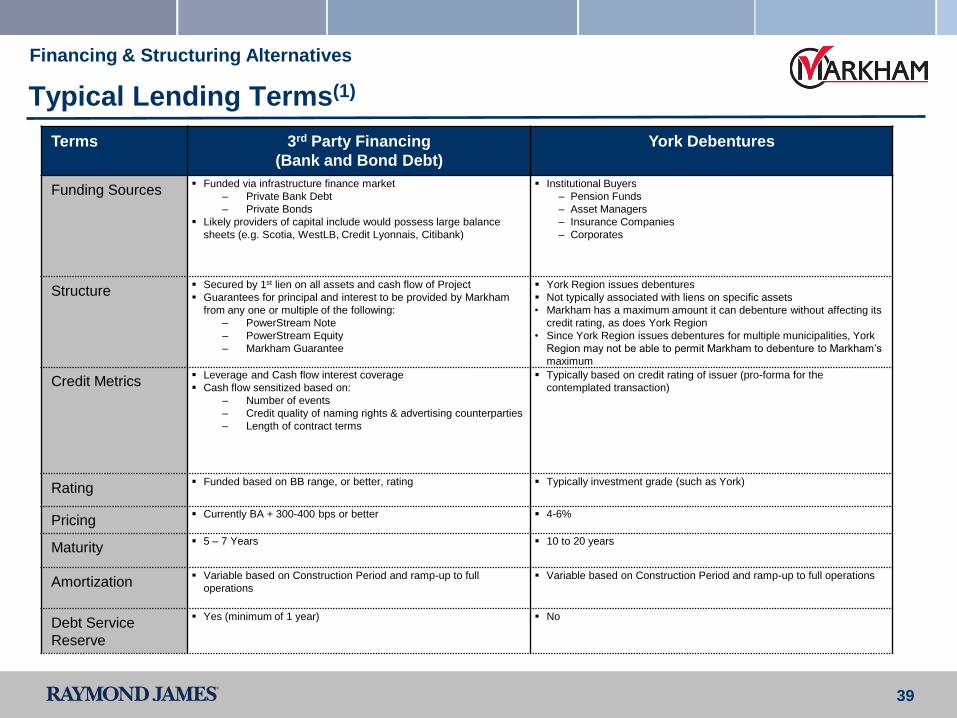
39
Typical Lending Terms(1)
Financing & Structuring Alternatives
Terms 3rd Party Financing
(Bank and Bond Debt)
York Debentures
Funding Sources Funded via infrastructure finance market
– Private Bank Debt
– Private Bonds
Likely providers of capital include would possess large balance
sheets (e.g. Scotia, WestLB, Credit Lyonnais, Citibank)
Institutional Buyers
‒ Pension Funds
‒ Asset Managers
‒ Insurance Companies
‒ Corporates
Structure Secured by 1st lien on all assets and cash flow of Project
Guarantees for principal and interest to be provided by Markham
from any one or multiple of the following:
– PowerStream Note
– PowerStream Equity
– Markham Guarantee
York Region issues debentures
Not typically associated with liens on specific assets
• Markham has a maximum amount it can debenture without affecting its
credit rating, as does York Region
• Since York Region issues debentures for multiple municipalities, York
Region may not be able to permit Markham to debenture to Markham’s
maximum
Credit Metrics Leverage and Cash flow interest coverage
Cash flow sensitized based on:
– Number of events
– Credit quality of naming rights & advertising counterparties
– Length of contract terms
Typically based on credit rating of issuer (pro-forma for the
contemplated transaction)
Rating Funded based on BB range, or better, rating Typically investment grade (such as York)
Pricing Currently BA + 300-400 bps or better 4-6%
Maturity 5 – 7 Years 10 to 20 years
Amortization Variable based on Construction Period and ramp-up to full
operations
Variable based on Construction Period and ramp-up to full operations
Debt Service
Reserve
Yes (minimum of 1 year) No
40
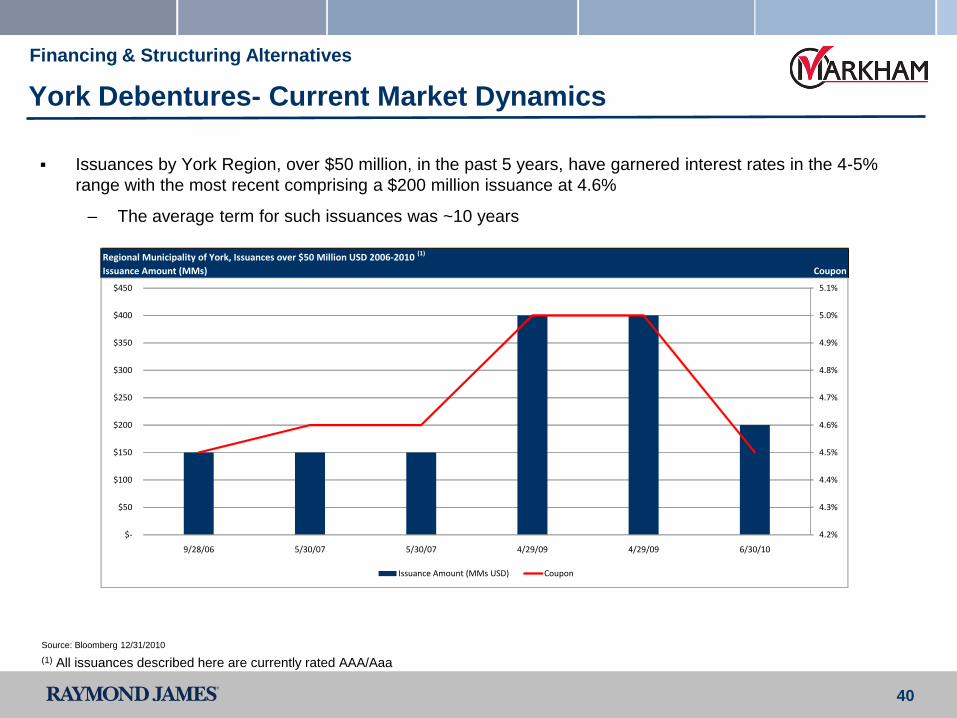
York Debentures- Current Market Dynamics
Issuances by York Region, over $50 million, in the past 5 years, have garnered interest rates in the 4-5%
range with the most recent comprising a $200 million issuance at 4.6%
– The average term for such issuances was ~10 years
Financing & Structuring Alternatives
Source: Bloomberg 12/31/2010
(1) All issuances described here are currently rated AAA/Aaa
Regional Municipality of York, Issuances over $50 Million USD 2006-2010 (1)
Issuance Amount (MMs) Coupon
4.2%
4.3%
4.4%
4.5%
4.6%
4.7%
4.8%
4.9%
5.0%
5.1%
$-
$50
$100
$150
$200
$250
$300
$350
$400
$450
9/28/06 5/30/07 5/30/07 4/29/09 4/29/09 6/30/10
Issuance Amount (MMs USD) Coupon

41
U.S. Municipal Bonds – Other Comparables
The majority of the larger arena financings in Canada over the past 20 years(2) have been privately
financed
– Municipally or provincially funded deals are less commonplace for large arenas, however, there are
recent instances where this is being contemplated (e.g. Quebec)
As a comparison, the U.S. municipal bond market for arena financings is fairly robust, with coupons ranging
in the 5-6% range and typically investment grade rated
Financing & Structuring Alternatives
Source: Bloomberg 1/15/11
(1) Includes outstanding issuances used to fund recreational facilities including stadiums, parks, museums, theatres, YMCAs and additional
recreational projects. Data set includes instances of multiple tranches of a debt issuance related to the same project, is solely based on
data tracked by Bloomberg and not meant to represent a total population of such issuances in the U.S.(2) These include the Air Canada Centre, Bell Centre, MTS Centre and Scotiabank Place
Current Term and Maturity on Municipal Debt Used to Fund Recreational Facilities in the U.S.A.(1)
Number of Issuances Average Term
0.0 years
5.0 years
10.0 years
15.0 years
20.0 years
25.0 years
30.0 years
35.0 years
0
10
20
30
40
50
60
AAA AA A BBB NR
Number of Issuances Average Term

42
Negotiated Transaction – Hypothetical Debt and Funding Sensitivity
Financing & Structuring Alternatives
An implied debt amount that may be raised based on the cash flows, and the Town’s and/or Region’s credit
support is sensitized below:
Based on a revised funding requirement of $207 million the funding gap is illustrated below
Any shortfalls in the assumed available net cash flow in a given year would have a corresponding dollar–for-dollar
shortfall to the debt service payments due
(1)Represents the amount of debt that the sensitized cash flow availability would be able to support assuming a 5% interest rate(2)Represents the additional amount, in excess of the debt supported by the sensitized cash flows, that would need to be funded in order to pay for the project costs
Implied Debt Capacity Based on Available Cash Flow(1)
($'s in MMs) 10 Years 20 Years 30 Years 40 Years Interest Only
7.0$ 55.1$ 92.1$ 118.7$ 138.7$ 140.5$
8.0$ 62.9$ 105.2$ 135.6$ 158.5$ 160.5$
9.0$ 70.7$ 118.3$ 152.5$ 178.2$ 180.5$
10.0$ 78.6$ 131.4$ 169.4$ 198.0$ 200.5$
11.0$ 86.4$ 144.6$ 186.3$ 217.8$ 220.5$
Available
Cash Flow
to Service
Debt
Term- Years
Funding Gap(2)
($'s in MMs) 10 Years 20 Years 30 Years 40 Years Interest Only
7.0$ 151.9$ 114.9$ 88.2$ 68.2$ 66.4$
8.0$ 144.1$ 101.8$ 71.3$ 48.4$ 46.4$
9.0$ 136.3$ 88.6$ 54.4$ 28.7$ 26.4$
10.0$ 128.4$ 75.5$ 37.5$ 8.9$ 6.4$
11.0$ 120.6$ 62.3$ 20.6$ (10.9)$ (13.6)$
Available
Cash Flow
to Service
Debt
Term- Years