toyota tsusho corp_120511chokei.en
TRANSCRIPT
1
Long-Term Business Plan forthe Fiscal Year Ending March 2017
May 11, 2012
Investor Relation GroupE-mail: [email protected]: +81-3-4306-8201 Fax: +81-3-4306-8818
Inquiries to:

2
1. About the Long-Term Business Plan for the Fiscal Year Ending March 2017
1. About the Long-Term Business Plan for the Fiscal Year Ending March 2017
2. About Financial Policy and Risk Management Policy
3. About Dividends

3
● Shift to an aging society with low birthrate (Japan) ● Revolution in technology and materials ● Food shortages, increased demand for resources ● Change in major players driving the economy● Increased awareness of environmental issues and regulation ● Expansion of HV, EV markets● Ongoing yen strength ● Energy issues● Population growth in emerging countries
Orientation of Long-Term Management Policy for the Fiscal Year Ending March 2017
【VISION 2015】 Aim to develop new pillars of profit with a focus on non-automotive areas andto build a balanced profit structure with the automotive business (core business)
Changes in the business environment
“GLOBAL 2020 VISION” was established to accelerate the building of non-automotive businesses and to make progress in strengthening global strategy and creating business
in addition to dealing with diversified and complex customer needs and revolutionary new technologies.
The completion of VISION 2015 in March 2017 is the first step toward the realization of GLOBAL 2020 VISION

4
Numerical Targets of Long-Term Business Planfor the Fiscal Year Ending March 2017
Net incomeMarch 2017 Target
Aim for balanced growth while maintaining a sound financial position
ROE
Net DER
¥120.0 billion
12-15%
1.5 times or less
(excluding goodwill)

5
Net Income Targets for the Fiscal Year Ending March 2017
March 2012results
March 2012actual value
March 2017target
(66.2)82.0
47.5 47.5
34.5
(58.0)74.0
26.5
60.0
60.0
Temporary factors■Main negative adjustments・Gain on sale of assets・Gain on transfer of benefit obligation
relating to employees’ pension fund, etc.■Main positive adjustments・Reversal of deferred tax assets, etc.
120.0
(Billion yen)
Non-automotive areas
Automotive area
Figures in parentheses are actual net income after amortization of goodwill
34.0
52.0
(70.0)86.0
March 2013forecast

6
Important Policies Toward Realizing the Long-Term Business Plan
■ Innovate the business model
Horizontal development of existing business model (new clients, new regions)
Build new business model
■ Accelerate new investment
Business domains important for each of the three areas of focus
Business domains where we leverage our strengths to aim for the No. 1 position
■ Develop new markets
Important countries (India, Brazil, others)
Important regions (Africa, Middle East, Latin America, others)
7
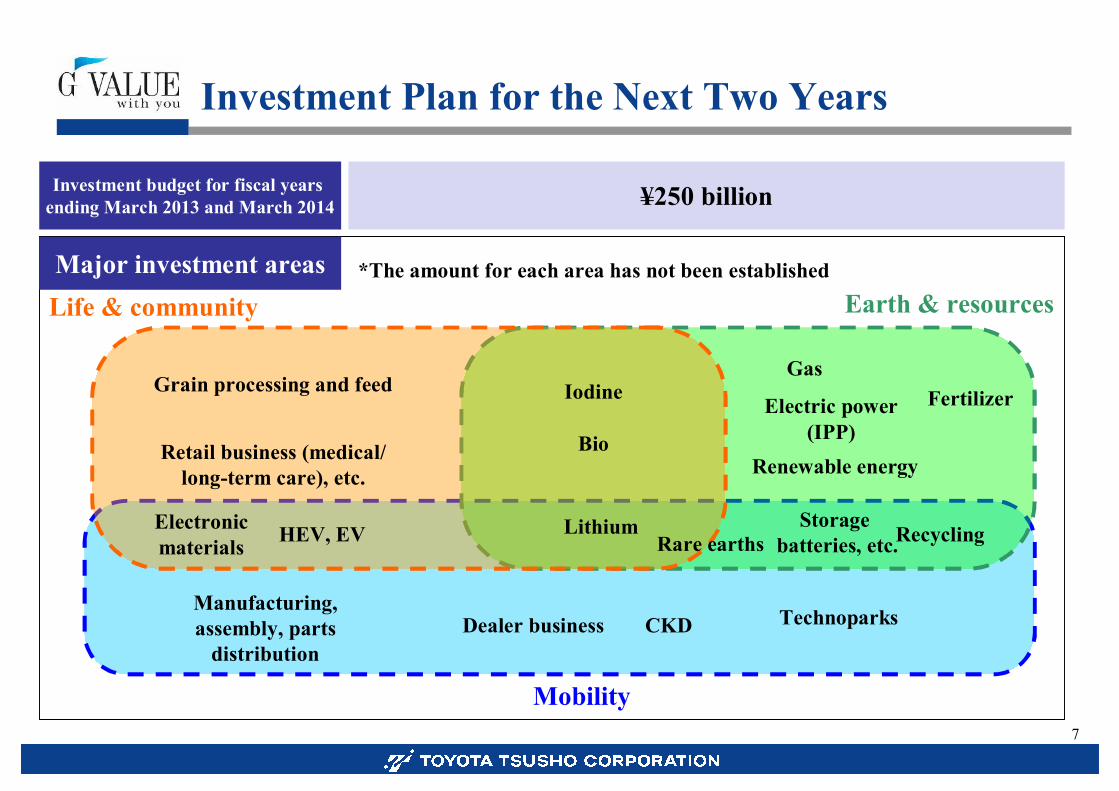
Mobility
Life & community Earth & resources
Investment Plan for the Next Two Years
Retail business (medical/long-term care), etc.
Iodine
Rare earths
Manufacturing, assembly, parts
distributionDealer business
Electric power (IPP)
Gas
Renewable energy
Lithium RecyclingHEV, EV
Bio
Fertilizer
Electronic materials
Grain processing and feed
Storagebatteries, etc.
Investment budget for fiscal years ending March 2013 and March 2014 ¥250 billion
Major investment areas
Technoparks
*The amount for each area has not been established
CKD

8
Policies to Achieve Targets (Automotive Area)
◆ Concern over declining profitability of existing business・Parts exports from Japan decreasing due to local sourcing・Automobile retail profit margins falling due to intense competition・Decreasing volume of materials due to smaller, lighter vehicles
◆ EV/HEV technology innovations and shift to new materials◆ Expanding markets in emerging countries
Changes in environment
March 2012 actual value March 2017 target
60.047.5
8% annual growth
Deepen (explore and strengthen functions), broaden (develop outside the Toyota Group) and horizontally develop (expand along with the Toyota Group) Toyota-related business to build an even more stable foundation for profit.
Results to date and future plansMetals Global logistics Automotive
Major results to date
・Steel centers・Aluminum smelting
business
・Parts logistics・Tire assembly
(Europe, North America, Asia)・Technoparks (India,
Thailand, Indonesia, others)
・Dealer, distributor business・CKD (Egypt, Pakistan)・Handle business transfers to other
countries
Major future plans
・Steel centers (other manufacturers)
・Steel centers(other industries)
・Parts logistics (other companies, other regions)
・Tire assembly (VW, Nissan, others)・Technoparks (other emerging
countries)
・Dealer, distributor business (emerging countries)・CKD (emerging countries)・Increase business transfers to other countries・New business (used cars, etc.)
(Billion yen)

9
Policies to Achieve Targets (Non-Automotive Area)
Changes in environment Company policy・Growth of global population and food shortages Grain, agriculture area・Higher resource prices and increased awareness of
environmental issues and regulation Recycling business・Electric power supply concerns due to nuclear accident Renewable energy, gas・Acceleration of aging society and low birthrate in Japan Medical, long-term care area
Changes in environment
Results to date and future plans
Earth & resources area Life & community area
Major results to date
・Rare earths (India, Vietnam)・Iodine (Chile) ・Lithium (Argentina)・Wind power generation (making Eurus
Energy Holdings Corporation a subsidiary)・Gas (Australia) ・Electric power (U.S., Canada)・Metal recycling (Green metal), etc.
・Electronic materials (acquisition of Elematec Corporation)
・Paprika, tuna farming business・Biopet/ethanol/polyester・Flour milling business, etc.
Major future plans
・Renewable energy (solar, geothermal)・General recycling・Develop upstream and downstream businesses for
iodine and lithium, etc.
・Retail business (medical/long-term care)・Grain/grain processing/feed, etc.
→
→
→→

10
Non-Automotive Area: From Investment to Profit (Post-Tax)
¥57.0 billion ¥5.0 billion(8.7%)
¥6.5 billion(11.4%)
¥76.0 billion - ¥1.5 billion(-1.9%)
Investment amount (*)
Operating investments・Electric power (North America,
Canada)・Fukusuke Corporation・Topics Group, etc.
Investments under development or in preparation
・Elematec Corporation・Australia gas project・Chile/iodine, etc.
* Excluding investments for production capacity increases, etc.,associated with existing businesses
Post-tax profit profitMarch 2012 (result) March 2017 (forecast)
Major funded investments
¥133.0 billion ¥3.5 billion(2.6%)
¥14.0 billion (10.5%)
Total
¥7.5 billion(9.9%)
Investments approved but not yet funded
Future new investments
¥60.0 billion
¥200.0 billion(*)
―
―
¥6.0 billion (10.0%)
¥14.0 billion (7.0%)
Profit from existing investments (last 3 years)
Total ¥260.0 billion ― ¥20.0 billion (7.7%)
Profit from future new investments
Figures in parentheses are return on investment post-tax profit/value of investment
(*) ¥200.0 billion is the total of future new investments that are expected to contribute to profit in the fiscal year ending March 2017
・・>A
・・>B
・・>C
11
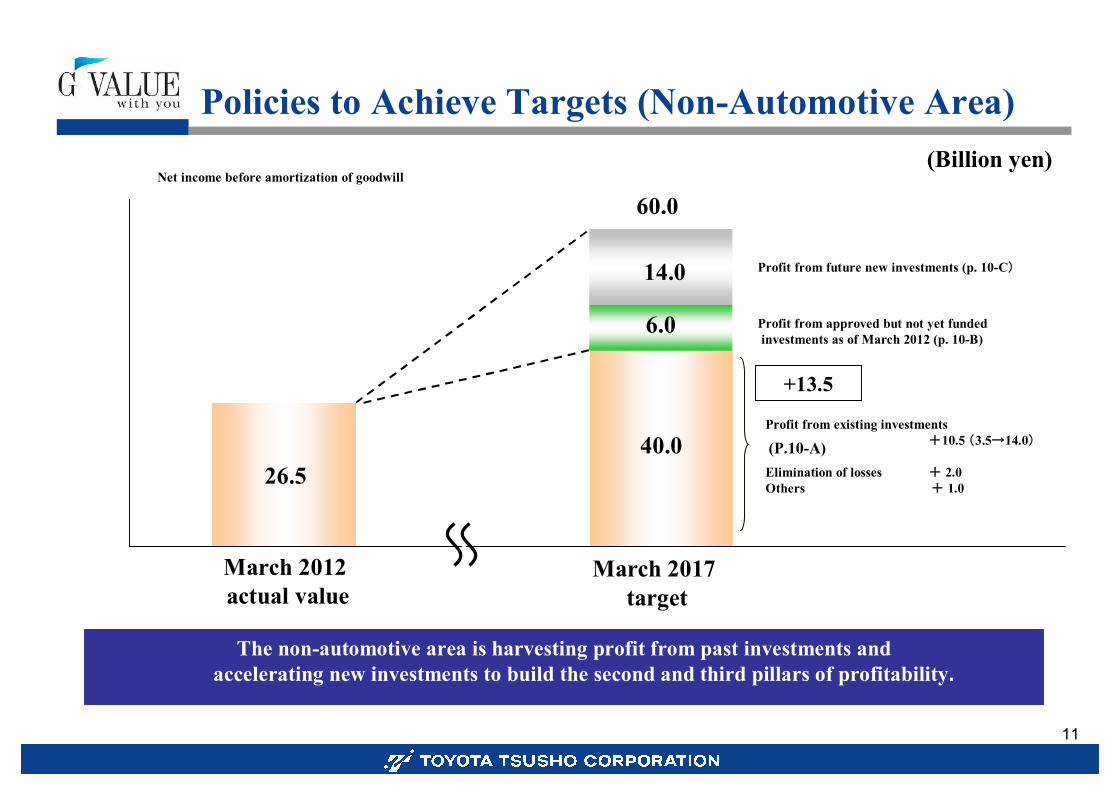
Policies to Achieve Targets (Non-Automotive Area)
March 2012 actual value
26.540.0
March 2017target
60.0
14.0
Profit from existing investments+10.5 (3.5→14.0)
Elimination of losses + 2.0Others + 1.0
Profit from future new investments (p. 10-C)
The non-automotive area is harvesting profit from past investments and accelerating new investments to build the second and third pillars of profitability.
+13.5
6.0 Profit from approved but not yet fundedinvestments as of March 2012 (p. 10-B)
(P.10-A)
Net income before amortization of goodwill(Billion yen)

12
1. About the Long-Term Business Plan for the Fiscal Year Ending March 2017
2. About Financial Policy and Risk Management Policy2. About Financial Policy and Risk Management Policy
3. About Dividends

13
Plan for Next Fiscal Year and Medium-to-Long-Term Quantitative Outlook
PL
BS
Net sales
Operating income
Net income(*)
Total assets
Net assets
ROE
Net DER
March 2011Results
New investments
5,743.6
85.2
62.8
2,436.2
667.3
8.0%
1.0
78.0
6,700.0
115.0
86.0
3,100.0
820.0
11%
1.1
March 2017assumption
9,600.0
200.0
120.0
1.0
4,200.0
1,200.0
13%
March 2012Results
5,916.7
92.4
82.0
2,837.4
751.7
10.7%
1.0
115.0
March 2013Plan
Aim for growth while balancing growth, efficiency and soundness.
Continue at ¥250 billion over two years
(*) Net income before amortization of goodwill
(Billion yen)
Benchm
arks
FinancialO
thers

14
◆ Risk Asset Management PolicyRisk Asset Management Policy
1)Keep total risk within a sustainable range (RA≦RB)2)Secure earnings to justify risk taken (Min.R/R≧Cost of equity)
RA(Risk assets)
about ¥470 billion
RB(Risk buffer;
mainly net worth)about ¥580 billion RA:RB ratio (RA/RB) ⇒ about 0.78
R/R (Risk/Return): After-tax ordinary income/RA⇒about 15%
<as of March 31, 2012>
Risk Asset Management (RAM)
With investments expected to increase in each business area to achieve the goals of the long-term business plan and vision, efficient use of resources will be even more important. Therefore, we will prioritize risk assets allocated to new businesses and review risk assets in existing businesses to speed up execution of strategies.
Evolution of Risk Management・Build a risk management system based on strategic organizational units・Promote the improvement of risk profitability and the strategic allocation
of resources
Risk Management Policy

15
1. About the Long-Term Business Plan for the Fiscal Year Ending March 2017
2. About Financial Policy and Risk Management Policy
3. About Dividends3. About Dividends

16
Dividend Policy
Previous dividend policy
Linked to consolidated business results, consolidated dividend payout ratio 20%
New dividend policy
Linked to consolidated business results, consolidated dividend payout ratio 20%-25%
In response to shareholders’ expectations for dividends, the Company reviewed its dividend policy and will handle dividends flexibly,
keeping in mind the changing economic environment and the progress of its investment plans.

17
44
2616
42
28
23%
21%21%
22%22%
March 2009 March 2010 March 2011 March 2012 March 2013Forecast
Cash dividends per shareConsolidated payout ratio
(Yen / Share)
Dividends and Forecast for the Fiscal Year Ending March 2013
18
Notice on Forward-Looking Statements
◆ The presentation material includes “forward-looking statements” such as those pertaining to the strategy and management plan of Toyota Tsusho Corporation and its group companies, which are not historical facts. The forward-looking statements are based on expectations, estimates, and forecasts available at the current moment, and necessarily include risks and uncertainties.
Accordingly, the information on the business environment, future performances, business results, and financial standings of the Company explicitly or implicitly expressed in the forward-looking statements could differ materially from the actual results.The Company undertakes no obligation to revise or update publicly any forward-looking statement for any reason.
◆ The presentation material is not intended to be the basis for an offer or solicitation to buy or sell any security. In making a decision on investment, etc., prospective investors may not rely on the information in this presentation

19