traction performance of a model 4wd tractor' -...
TRANSCRIPT

Traction performance of a model 4WD tractor'GUANG WANG, R. L. KUSHWAHA, and G. C. ZOERB
Agricultural Engineering Department, University of Saskatchewan, Saskatoon, SK, Canada S7N OWO. Received 12 September1988, accepted 4 April 1989.
Wang, Guang, Kushwaha, R. L. and Zoerb, G. C. 1989. Tractionperformance of a model 4WD tractor. Can. Agric.Eng. 31: 125-129.A model tractor, based upon approximately 1/4 length scale of the JohnDeere 8640 four-wheel drive tractor, was designed and fabricated fortraction studies in a soil bin. The tractor was powered by a 2.25 kWelectric motor and was capable of either two-wheel-drive or four-wheel-drive modes. Various components were instrumented to measureindividual axle torque, axle speed, and drawbar pull. Data were collected with a HP2240A data logger connected to a HP 1000 mainframecomputer. Tests were conducted in front-wheel-drive, rear-wheel-driveand four-wheel-drive modes to investigate the traction characteristicswith different drive modes. Test results showed the four-wheel-drive
mode produced a drawbar pull about three times of that produced bythe rear- or front-wheel-drive mode. The rear-wheel-drive mode was
found more favorable than the front-wheel-drive mode. The motion
resistance of the four-wheel mode was greater than that of the front-or rear-wheel-drive mode. A theoretical analysis and model tractortests were conducted to find the optimum traction ratio. The resultsshowed the optimum traction ratio ranged from 0.3 to 0.4.
INTRODUCTION
Transfer of engine power to drawbar power in the case ofagricultural tractors and off-road wheeled vehicles is dependentupon a number of interrelated parameters. Tire characteristics,soil condition, type of loading, as well as static and dynamicweight distribution are some of the parameters which affecttractor performance. Methods of studying tractive performanceinclude theoretical or mathematical analysis, scale model testingunder controlled conditions and field testing of full-sizedtractors. The mathematical analysis and actual field testingrepresenttwo opposites within the realm of traction mechanics.A scale model, however, fits between these two limits. Traction studies using a model tractor have several advantages —it is easier to instrument a model tractor than a full-sized tractor;tests can be conducted at any time of the year; and it is easierto change loading conditions and soil conditions.
Murillo-Soto and Smith (1977, 1978) reported weight transferand traction efficiency of 4WD tractors using a model tractorbased on a John Deere 7020 tractor. They tested the effect ofdrive axle speed ratio, drawbar hitch height and static weightdistributionon the weight transfer and tractive efficiency. Effectsof tire size, wheel slip and soil conditions on the tractive performance of a single wheel have been investigated (Freitag(1966), Turnage (1972), Wismer and Luth (1973), Dwyer etal. (1975), Gee-Clough et al. (1978), McKyes (1985) and manyothers. Equations have been developed relating the tractive performance ratios (traction ratio and motion resistance ratio),wheel slip, soil cone index, tire size and wheel load. These relationships have been applied for prediction of tractive efficiency.
lThe manuscript includes information from the CSAE Paper No. 88-203,presented at the 1988 CSAE-AIC Conference, Calgary, Alberta.
CANADIAN AGRICULTURAL ENGINEERING
The objective of this study was to investigate the tractioncharacteristics of 4WD tractors under two- and four-wheel drive
modes with a model tractor as well as 4WD mode under
different tractor ballasts. An analysis was conducted to find theoptimum traction ratio, which could be used to assist farmersin the selection of tractor ballasts.
TEST EQUIPMENT AND PROCEDURE
The model tractor was designed and fabricated to 1/4-lengthscale of the John Deere 8640 tractor (Close and Fahlman 1986;Zyla 1987). The wheelbase was 795 mm and tire size was584-216 mm (23-8.5 in.). The tractor was powered by a2.25-kW electric motor and was capable of either two-wheelor four-wheel drive modes with power delivered to the driveaxles by chains. Figure 1 shows the model tractor operatingin the soil bin. The drive axle torque was measured for eachwheel by measuring the tension in the driving chain. The axlespeed was measured with a magnetic pickup sensor. Figure 2illustrates the chain drive train and locations of the torque andspeed transducers. A detailed diagram showing the torque andspeed sensors is given in Fig. 3. As shown, beam A is bondedwith strain gauges, two on each side. The tension in the chainis transferred to beam A, causing a bending moment in the beam.The strain measured by the strain gauges is proportional to thechain tension. The tractor axle speed was sensed from the idlersprocket by a magnetic pickup. The model tractor had a totalweight of 2852 N, with the total front wheel load being 1676N and the total rear wheel load 1176 N. The drawbar hitchheight was 236 mm above the ground.
Tests were conducted with four-wheel-drive (4WD), front-wheel-drive (FWD) and rear-wheel-drive (RWD) modes. Toachieve the two-wheel-drive (2WD) mode, either the front oraxle chains were removed from the drive train. During the tests,the model tractor was connected to the transport carriage(Fig. 1) via a strain gauge load cell for draft measurement.Various slip values were obtained by setting the tractor motorspeed at levels to produce a ground speed greater than the carriage speed. The data were collected by a HP2240A data logger,which was connected to a HP1000 main frame computer.
RESULTS AND DISCUSSION
Comparison of different drive modes
Table I lists the soil conditions including soil cone index andsoil moisture content. Soil cone index, determined from conepenetrometer tests (American Society of Agricultural Engineers1986) was used as the measure of soil strength. This cone indexwas used instead of soil cohesion and friction angle because ofits simplicity of measurement and popularity in traction analysis. The test soil was fine-grained Saskatchewan clay loam. Arotary cultivator was used to till the soil. The tilled soil wascompacted by a heavy roller. Soil compaction levels were
125

Figure 1. Electric-powered model tractor operating in a soil bin.
Figure 2. Picture showing the model tractor drive train.
WHEEL AXLE
Figure 3. Diagram showing the torque measurement mechanism andthe axle speed sensor.
126
Table I Soil conditions for the tests of three drive modes
Drive
mode
4WD
FWD
RWD
Soil cone index (kPa)
Before 1st passf After 1st pass
231
224
217
628
751
736
Soil moisture
content (%db)
14
13
12
fSoil was tilled 100 mm deep.
controlled by the number of passes of the roller on the soil. Testswere carried out to investigate the effect of different drive modeson the tractive performance of the tractor. The tractive performance of a tractor refers to drawbar pull, tractive efficiencyand motion resistance. The calculations were made using thefollowing definitions.
Tractive efficiency:
output drawbar power
input power to driving axle
Motion resistance ratio:
where:
P =
H =
D =
W =
H—D
W
motion resistance ratio,gross traction,horizontal drawbar pull, andtractor weight.
Gross traction:
H =axle torque
rolling radius
(1)
(2)
(3)
The rolling radius equals the advance under no load per wheelrevolution divided by 2ir.
Drawbar pull and tractive efficiency
As shown in Fig. 4, the drawbar pull for the 4WD mode is aboutthree times that for the FWD mode or the RWD mode. This
situation was caused by the extra motion resistance from thetowed wheels, which were drive wheels for 4WD mode. Thedrawbar pull for the FWD mode was nearly equal to that forthe RWD mode, although the dynamic load on the front wheelswas about 1.2 times that on the rear wheels. The reason the
RWD mode produced more pull was that the rear wheel travelledon the soil compacted by the front wheels. The compacted soilincreased the traction ability of the rear wheels.
The tractive efficiency of the three drive modes is plotted inFig. 5. There is no doubt that 4WD is the most efficient mode.Again from the tractive efficiency plot, the RWD mode is morefavorable than the FWD mode at most wheel slip levels.Figure 5 also shows the maximum tractive efficiency of the2WD modes occured at a greater wheel slip as compared withthe 4WD mode. A greater slip was needed to produce a certainamount of traction to overcome the motion resistance on the
towed wheels.
Motion resistance ratio
Motion resistance was obtained by subtracting the horizontaldrawbar pull from the gross traction. The motion resistance ratio
WANG, KUSHWAHA AND ZOERB

MODEL TRACTOR, TIRE SIZE: 23-8.5 IN., SOIL TILLED
10 15 20
WHEEL SLIP (%)30
Figure 4. Drawbar pull vs wheel slip with three different drive modes.O, 4WD mode; x, FWD mode; a , RWD mode. —, first pass;—, second pass.
0.9
0.8
>* 0.7-uzw 0.6-
o
u* 0.5-u*u
w0.4-
>
&0.3-^
<OS 0.2-
H
0.1-
MODEL TRACTOR, TIRE SIZE: 23-8.5 IN., SOIL: TILLED
0-r) 15 20
WHEEL SLIP (%)
—i—
25 30
Figure 5. Tractiveefficiency vs wheelslip with three differentdrivemodes. O, 4WD mode; X , FWD mode; a , RWD mode. —, firstpass; —, second pass.
0.30MODEL TRACTOR, TIRE SIZE: 23-8.5 IN., SOIL: TILLED
0.00-
5 10 15 20
WHEEL SLIP (%)
Figure6. Motion resistance ratio vs wheel slip with three differentdrive modes. O, 4WD mode; X, FWD mode; a , RWD mode. —,first pass; —, second pass.
CANADIAN AGRICULTURAL ENGINEERING
30
is the ratio of motion resistance to the total tractor weight. Thelaboratory test results plotted in Fig. 6 show the motionresistance of the 4WD mode is greater than that of the two-wheel-drive modes. From this test, the RWD mode was foundmost favorable as far as the motion resistance is concerned. It
is not known, however, why the motion resistance ratio washigher for the 4WD mode than for the RWD or the FWD mode.This phenomenon may be due to the difference in motion characteristics of towed wheels and powered wheels. As indicated inFig. 6, the motion resistance increases with slip. Field tests ofa full-sized 4WD tractor (Wang 1988) also revealed thisphenomenon, that is, the motion resistance increases with slip.Thus, high slip operation of 4WD tractors is not recomm-mended. Further tests are necessary in order to find a relationship between motion resistance and wheel slip.
First pass vs. second pass
As can be seen from Fig. 4, the drawbar pull increased by about18% on an average for the second pass as compared with thefirst pass. The motion resistance ratio was about 15% less onan average for the second pass than for the first pass (Fig. 6).This incereased drawbar pull and decreased motion resistancewas due to the increased soil strength. As indicated in Table I,the soil cone index after the first pass is about three times thatbefore the first pass. For the RWD mode, rear wheels travelon the soil compacted by front wheels. This situation increasesthe tractiveabilityof the rear wheels. Therefore, the RWD modehas a certain advantage over the FWD mode.
Optimum traction ratio
A tractor should be ballasted to a weight such that the tractornot only produces sufficient pull but also operatesat the maximum tractive efficiency. For a single drive wheel, the tractiveefficiency can be computed from the following equation(McKyes 1985):
V = -d - S)T + p
(4)
where:
r = traction ratio,p = motion resistance ratio, andS = wheel slip.
The traction ratio is the ratio of the net traction to the dynamicwheel load. The motion resistance ratio is the motion resistancedivided by the dynamic wheel load. From Gee-Clough et al.(1978), the tractionratio can be predictedfrom an exponentialfunction and expressed as:
where:
= r0(l - e-KS
r0 = 0.796-0.92/M
K = (4.838 + 0.06^/70
(5)
(6)
(7)
Also from Gee-Clough et al. (1978) the motion resistance ratiocan be predicted by
0.049 + 0.287/M (8)
127
where M is the mobility number (Turnage 1972), which isexpressed as:
M =
where:
Cbd
W -\h 1 + blld(9)
C = soil cone index,d = unloaded tire diameter,b = unloaded tire section width,
W = dynamic wheel load,d = tire deflection, andh = unloaded tire section height.
For a given traction ratio, the wheel slip can be predicted fromEq. 5 which is rearranged as:
S=-i-m(l_—) (10)K T0
To determine the optimum traction ratio, Eq. 10 is substitutedinto Eq. 4 which becomes:
V = [1 + — ln(lt + p K
1)]
TO(11)
In the aboveequation, p, K and r0 are functions of the mobilitynumber as indicated by Eq. 6, 7, and 8. For a given dynamicwheel load, a given soil strength and a given tire, the mobilitynumber is determined. In this case, the tractive efficiency, rj,is a function of traction ratio only. To obtain the maximum tractive efficiency for a given mobility number, Eq. 11 is differentiated with respect to traction ratio. Letting the resulting equation equal zero, the final equation obtained is given below:
T(T + P) -i +J-Mi-l)pK{ r0 - r) K t0
(12)
For a given mobility number, the optimum traction ratio, corresponding to the maximum tractive efficiency, can be solvedfrom the above equation. A simple computer program waswritten to calculate the optimum traction ratio for a givenmobility number. Table II lists some of the computer results.
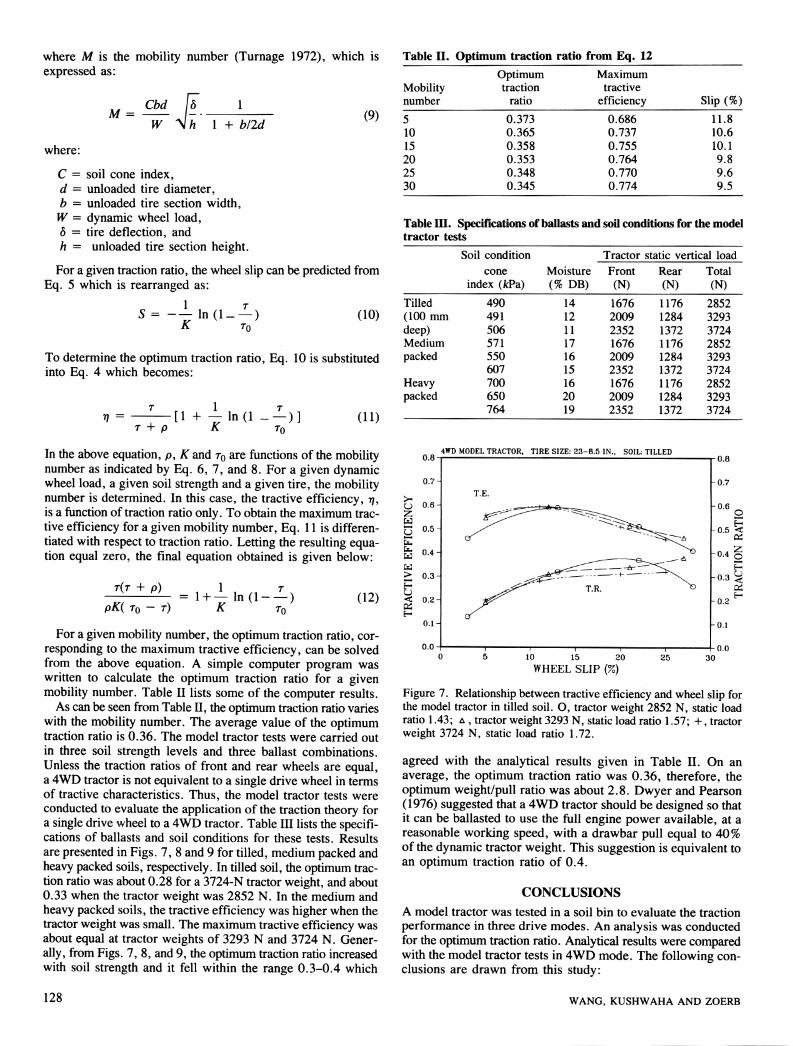
As can be seen from Table II, the optimum traction ratio varieswith the mobility number. The average value of the optimumtraction ratio is 0.36. The model tractor tests were carried outin three soil strength levels and three ballast combinations.Unless the traction ratios of front and rear wheels are equal,a 4WD tractor is not equivalent to a single drive wheel in termsof tractive characteristics. Thus, the model tractor tests wereconducted to evaluate the application of the traction theory fora single drive wheel to a 4WD tractor. Table III lists the specifications of ballasts and soil conditions for these tests. Resultsare presented in Figs. 7, 8 and 9 for tilled, medium packed andheavy packedsoils, respectively. In tilledsoil, the optimum traction ratio was about 0.28 for a 3724-N tractor weight, and about0.33 when the tractor weight was 2852 N. In the medium andheavy packed soils, the tractive efficiency was higher when thetractor weight was small. The maximum tractive efficiency wasabout equal at tractor weights of 3293 N and 3724 N. Generally, from Figs. 7, 8, and 9, the optimum traction ratio increasedwith soil strength and it fell within the range 0.3-0.4 which
128
Table II. Optimum traction ratio from Eq. 12
Optimum Maximum
Mobility traction tractive
number ratio efficiency Slip (%)
5 0.373 0.686 11.8
10 0.365 0.737 10.6
15 0.358 0.755 10.1
20 0.353 0.764 9.8
25 0.348 0.770 9.6
30 0.345 0.774 9.5
Table HI. Specifications ofballasts and soil conditions for the modeltractor tests
Soil condition Tractor static vertical load
cone Moisture Front Rear Total
index (IcPa) (% DB) (N) (N) (N)
Tilled 490 14 1676 1176 2852
(100 mm 491 12 2009 1284 3293
deep) 506 11 2352 1372 3724
Medium 571 17 1676 1176 2852
packed 550 16 2009 1284 3293
607 15 2352 1372 3724
Heavy 700 16 1676 1176 2852
packed 650 20 2009 1284 3293
764 19 2352 1372 3724
4WD MODEL TRACTOR, TIRE SIZE: 23-8.5 IN., SOIL: TILLED
10 15 20
WHEEL SLIP (%)
Figure 7. Relationship betweentractive efficiency and wheel slip forthe model tractor in tilled soil. O, tractor weight 2852 N, static loadratio 1.43; a , tractor weight 3293 N, static load ratio 1.57; +, tractorweight 3724 N, static load ratio 1.72.
agreed with the analytical results given in Table II. On anaverage, the optimum traction ratio was 0.36, therefore, theoptimum weight/pull ratio was about 2.8. Dwyer and Pearson(1976) suggested that a 4WD tractor should be designed so thatit can be ballasted to use the full engine power available, at areasonable working speed, with a drawbar pull equal to 40%of the dynamic tractor weight. This suggestion is equivalent toan optimum traction ratio of 0.4.
CONCLUSIONS
A model tractor was tested in a soil bin to evaluate the tractionperformance in three drive modes. An analysis was conductedfor the optimumtractionratio. Analytical resultswere comparedwith the model tractor tests in 4WD mode. The following conclusions are drawn from this study:
WANG, KUSHWAHA AND ZOERB

4WD MODEL TRACTOR, TIRE SIZE: 23-8.5 IN., SOIL: MEDIUM PACKED-r0.8u.o
0.7-
G 0.6-
2 °-5_
T.E.-^jj
-A-^-
^f—^
~A
W
> 0.3-HU< 0.2-QS
0.1-
0.0 J
^^s^' T.R.
—1
10 15 20
WHEEL SLIP (%)25
0.7
0.6
H0.5 <
h0.4 §
h0.3^
0.2 ^
Figure 8. Relationship between tractive efficiency and wheel slip forthe model tractor in medium-packed soil. O, tractor weight 2852 N,static load ratio 1.43; a , tractor weight 3293 N, static load ratio 1.57;+ , tractor weight 3724 N, static load ratio 1.72.
4WD MODEL TRACTOR, TIRE SIZE: 23-8.5 IN., SOIL: HEAVY PACKED
0 5 10 15 20 25
WHEEL SLIP (%)
Figure 9. Relationship between tractiveefficiency and wheelslip forthemodeltractor in heavy-packedsoil. O, tractor weight 2852 N, staticload ratio 1.43; a , tractor weight 3293 N, static load ratio 1.57; +,tractor weight 3724 N, static load ratio 1.72.
1. The four-wheel-drive mode produced a drawbar pull aboutthree times that produced with the rear-wheel-drive or thefront-wheel-drive mode.
2. The rear-wheel-drive mode was found to be more favorablethan the front-wheel-drive mode as far as the motionresistance and drawbar pull were concerned.
CANADIAN AGRICULTURAL ENGINEERING
3 . The motion resistance ratio of the four-wheel-drive mode
was greater than that of the two-wheel-drive mode fromthese test results. This situation was due to the increas
ing of motion resistance of powered wheels with slip.Further investigation should be conducted to find thedifference in motion resistance of powered wheels and towedwheels.
4. The range of traction ratio for maximum tractive efficiencywas from 0.3 to 0.4. On an average, a tractor should beballasted to a weight of 2.8 times the desired horizontaldrawbar pull.
REFERENCES
AMERICAN SOCIETY OF AGRICULTURAL ENGINEERS. 1986.Soil cone penetrometer. ASAE Standards S313.2. ASAE, St. Joseph,ML
CLOSE, J. D. and J. W. FAHLMAN. 1986. Design of a model tractorfor use in the soil bin. Unpublished B.S. Design Project Report.Agricultural Engineering Department, University of Saskatchewan,Saskatoon, SK.DWYER, M. J., D. R. COMELY, and D. W. EVERNDEN. 1975.Development of the N.I.A.E. handbood of agricultural tire performance. Proc. 5th int. conf., Int. Soc. for Terrain-Vehicle System,Detroit, MLDWYER, M. J. and G. PEARSON. 1976. A field comparison of thetractive performance of two- and four-wheel drive tractors. J. Agric.Eng. Res. 21: 77-85.FREITAG, D. R. 1966. A dimensional analysis of the performanceof pneumatic tires on clay. J. Terramechan. 3: 51-68.GEE-CLOUGH, D., M. McALLISTER, G. PEARSON, and D. W.EVERNDEN. 1978. The empirical prediction of tractor-implementfield performance. J. Terramechan. 15: 81-94.McKYES, E. 1985. Soil cutting and tillage. Elsevier SciencePublishingCo., Inc., New York, NY.MURILLO-SOTO, F. and J. L. SMITH. 1977. Weight transfer in4WD tractors: A model study. Trans. ASAE (Am. Soc. Agric. Engrs.)20: 251-253.MURILLO-SOTO, F. and J. L. SMITH. 1978. Traction efficiencyof 4WD tractors: A model study. Trans. ASAE. (Am. Soc. Agric.Engrs.) 21: 1051-1053.TURNAGE, G. W. 1972. Tire selection and performance predictionfor off-road wheeled-vehicle operations. Proc. 4th Inter. Conf., Inter.Soc. for Terrain-Vehicle System and Swedish Soc. for Collaborationon Terrain-Vehicle Res., Stockholm, Sweden.WANG, G. 1988. A microprocessor based analysis of tractor performance. Unpublished Ph.D. thesis. University of Saskatchewan, Saskatoon, SK.WISMER, R. D. and H. J. LUTH. 1973. Off-road traction prediction for wheeled vehicles. J. Terramechan. 10: 49-61.ZYLA, L. E. 1987. Instrumentation and evaluation of a model tractor.Unpublished B.S. Design Project Report. Agricultural EngineeringDepartment, University of Saskatchewan, Saskatoon, SK.
129