trade and tasks: a preliminary exploration with german...
TRANSCRIPT

Trade and tasks:
a preliminary exploration
with German data
EFIGE working paper 45
May 2012
Sascha O. Becker and
Marc-Andreas Muendler
EFIGE IS A PROJECT DESIGNED TO HELP IDENTIFY THE INTERNAL POLICIES NEEDED TO IMPROVE EUROPE’S EXTERNAL COMPETITIVENESS
Funded under the
Socio-economic
Sciences and
Humanities
Programme of the
Seventh
Framework
Programme of the
European Union.
LEGAL NOTICE: The
research leading to these
results has received
funding from the
European Community's
Seventh Framework
Programme (FP7/2007-
2013) under grant
agreement n° 225551.
The views expressed in
this publication are the
sole responsibility of the
authors and do not
necessarily reflect the
views of the European
Commission.
The EFIGE project is coordinated by Bruegel and involves the following partner organisations: Universidad Carlos III de Madrid, Centre forEconomic Policy Research (CEPR), Institute of Economics Hungarian Academy of Sciences (IEHAS), Institut für Angewandte Wirtschafts-forschung (IAW), Centro Studi Luca D'Agliano (Ld’A), Unitcredit Group, Centre d’Etudes Prospectives et d’Informations Internationales (CEPII).The EFIGE partners also work together with the following associate partners: Banque de France, Banco de España, Banca d’Italia, DeutscheBundesbank, National Bank of Belgium, OECD Economics Department.

Trade and Tasks:A Preliminary Exploration with German Data∗
Sascha O. BeckerU Warwick and CEPR
Marc-Andreas MuendlerUC San Diego and NBER
Abstract
For the first time, this paper combines representative worker-level data that cover time-varyingjob-level task characteristics of an economy over a long time span with sector-level bilateraltrade data. We carefully create longitudinally consistent workplace characteristics from theGerman Qualification and Career Survey 1979-2006 and prepare trade flow statistics fromvarying sources. Four main facts emerge: (i) intermediate inputs constitute a major shareof imports, and their relevance grows especially in the early decade; (ii) the German work-force increasingly specializes in workplace activities and job requirements that are typicallyconsidered non-offshorable, mainly within and not between sectors and occupations; (iii) theimputed activity and job requirement content of German imports grows relatively more inten-sive in work characteristics typically considered offshorable; and (iv) labor-market institutionsat German trade partners are largely unrelated to the changing task content of German importsbut German sector-level unionization rates exhibit some covariation consistent with faster taskoffshoring in more unionized sectors.
Keywords: Trade in tasks; offshoring; demand for labor; labor force survey
JEL Classification: F16, F14, J23, J24
∗We thank Lisandra Flach for outstanding research assistance. We thank Gene Grossman and Esteban Rossi-Hansberg for fruitful discussions. We thank Alexandra Spitz-Oener for sharing her task coding for comparisonswith our measures, and Alfons Geis of GESIS Mannheim for helpful advice on occupational concordances. Weacknowledge with gratitude EFIGE for funding this exploratory data preparation and IMT Lucca for its hospitality inJune 2011. Becker is also affiliated with CAGE, CESifo, Ifo, and IZA; Muendler is also affiliated with CAGE andCESifo.
1

1 IntroductionOffshoring of production stages, and the accompanying global integration of production, are widelythought to affect employment and wages. The direction of effects is theoretically ambiguous andlikely depends on the type of labor. If jobs of the least educated workers are those most fre-quently offshored, one might expect a widening of the wage gap between skilled and unskilledlabor (Feenstra and Hanson 1999). To the extent that offshoring is associated with consumer pricereductions, less skilled workers may still benefit overall from an increase in real wages. Grossmanand Rossi-Hansberg (2008) point to the theoretical possibility that quasi-rents from offshored jobsmight accrue to the apparently most vulnerable workers who command a wage premium in theoffshorable jobs that remain onshore in equilibrium. Jones and Kierzkowski (1990) and Grossmanand Rossi-Hansberg (2008) stress that, if the associated cost reductions are particularly strong inindustries employing low-skilled labor intensively, offshoring might shrink the wage gap betweenskilled and unskilled labor as resources are reallocated towards low-skill intensive industries ingeneral equilibrium.1
The offshorability of jobs need not even be directly related to skills as measured by formaleducation. Blinder (2009) argues that low-skilled and high-skilled jobs are equally likely to beaffected by offshoring. The prominent two examples of janitors and tele-radiologists illustratethat there is no simple one-to-one relationship between skills and offshorability. Janitors are typ-ically low-skilled but the nature of their tasks ties them to their local workplace. In contrast, themedical interpretation of computer-tomography images or X-rays typically requires at least upper-secondary or tertiary education but the images can easily be read remotely. The link between taskcontent and offshorability has been explored by Leamer and Storper (2001); Markusen (2006);Jensen and Kletzer (2006); Blinder (2006), among others. Blinder and Krueger (2009) argue thatmore educated workers appear to hold more offshorable jobs in the United States. Several impor-tant task characterizations have been proposed as relevant for the offshorability of occupations: theprevalence of codifiable rather than tacit information to perform the job (Leamer and Storper 2001);the prevalence of routine tasks, especially if they can be summarized in deductive rules (Levy andMurnane 2004); or the job’s lacking requirement of physical contact and geographic proximity(Blinder 2006). Whereas the nature of tasks could be strongly correlated with the skill-intensity ofthe occupation, there is no a priori reason for this to be the case.
To examine the relationship between offshoring and the composition of skills and tasks in thehome economy, this paper combines representative worker-level data that cover time-varying job-level task characteristics of an economy over a period of decades. Rich micro data from the GermanQualifications and Career Survey (BIBB survey) for the years 1979, 1986, 1992, 1999 and 2006provide various measures of workplace characteristics, typically referred to as tasks.2 We care-fully create mappings across the five survey waves to obtain longitudinally consistent workplacecharacteristics.
There are three sets of workplace characteristics. First, the BIBB survey asks workers to
1See also Baldwin and Robert-Nicoud (2007) and Kohler (2008) for alternative presentations of this argument.2For earlier studies using the BIBB survey in different contexts see, for instance, Acemoglu and Pischke (1998) or
Spitz-Oener (2006).
2

state whether they perform activities from a given list—including activities such as manufac-ture/produce, analyze/research, organize/plan or oversee/control. These reported activities havebeen used in earlier research by Spitz-Oener (2006) and Gathmann and Schonberg (2010), forexample. Our data preparation goes beyond their work both in time span and in coverage of ad-ditional workplace variables. Second, the BIBB survey asks workers whether they use tools froma given list to carry out their work. Reported tool use—such as the usage of computers, pencils,or fork lifts, for instance—has been extracted for research by DiNardo and Pischke (1997) andAcemoglu and Pischke (1998) in different settings before, and by Becker, Ekholm and Muendler(2009) in the context of inhouse offshoring and vertical foreign direct investment. In this paper, weconcentrate on workplace characteristics beyond tool use. Third, the BIBB survey asks the workerhow frequently performance requirements apply to the job—including the frequency of deadlinesto complete tasks, the frequency with which the worker has to improve or adopt new techniques,and the frequency with which work procedures are described in detail. This is a so far largelyunexplored group of BIBB survey questions and arguably closely related to task types that arerelevant for offshorability.
Combined with sector-level trade information, our worker data provide evidence on the re-sponsiveness of onshore tasks to trade flows and thereby indicate the degree of offshorability ortradability of jobs (Jensen and Kletzer 2009; Blinder 2009). Using the import matrix from the Ger-man input-output tables, we can separate imports of intermediate inputs and final goods importsby year. Imports of intermediate inputs are commonly associated with offshoring. The bilateralnature of the trade data allows us to relate trade flows to the composition of labor-market charac-teristics of the foreign countries, where German imports originate. Four main facts emerge. One,intermediate inputs constitute a major share of imports, and their relevance grows especially inthe early decade. Two, the German workforce increasingly specializes in workplace activities andperformance requirements that are typically considered non-offshorable, mainly within and not be-tween sectors and occupations. Three, the imputed activity and job requirement content of Germanimports grows relatively more intensive in work characteristics typically considered offshorable.Four, labor-market institutions at German trade partners are largely unrelated to the changing taskcontent of German imports but German sector-level unionization rates exhibit some covariationconsistent with faster task offshoring in more unionized sectors.
Earlier empirical research typically pre-defines task dichotomies based on survey answers(Spitz-Oener 2006; Gathmann and Schonberg 2010; Becker et al. 2009). Two common such taskdichotomies are routine/non-routine and non-interactive/interactive. In this paper, we take a stepback and let the original data speak. We keep a rich set of individual workplace characteristics anduse regressions of employment frequencies to track how the task content has evolved across sectorsand occupations, and most importantly within sectors and occupations, over the period 1979-2006.In a preliminary imputation exercise, we weight sectoral import flows to Germany with typicalGerman task content seven years prior and use similar regressions to describe the evolution of tasktrade, for the full set of individual workplace characteristics. The stylized facts that emerge fromour data document the importance of time-varying task information within sectoral occupations,where most variation occurs, and draw attention to subtle distinctions between offshorability andworkplace changes. In contrast, much existing research uses time-invariant classifications from the
3

U.S. Dictionary of Occupational Titles Job Description (DOT) or the Occupational InformationNetwork (ONET) descriptions of occupations (Autor, Levy and Murnane 2003; Goos, Manningand Salomons 2009).
Our research relates to the widely documented hollowing-out of intermediate-skill employmentin industrialized countries, and the accompanying polarization of the earnings distribution with rel-ative compensation losses for intermediate-skill groups (Autor, Katz and Kearney 2006; Goos etal. 2009). Beyond offshoring and task trade (Grossman and Rossi-Hansberg 2008), which is thefocus of our paper, those labor-market changes may be related to four additional explanations: (i)immigration (Ottaviano, Peri and Wright 2010); (ii) product demand shifts at high earning house-holds that favor low-skill compensation (Mazzolari and Ragusa 2007); (iii) technical change (e.g.Acemoglu 2002; Autor et al. 2003; Spitz-Oener 2006); and (iv) changing human resource man-agement practices such as training and teamwork (Lazear and Shaw 2007). As to the former twohypotheses, our empirical treatment controls for both labor-supply effects from immigration andlabor-demand effects from product-demand shifts, by conditioning out sector and year effects. Asto the latter two hypotheses, our data include information on the use of technically advanced equip-ment and human-resource management practices such as training and teamwork. In future workwe will include those additional workplace characteristics and implement identification strategiesto empirically discern alternative explanations.
This paper has six more sections. In Section 2, we give an overview of the data. Section 3documents trade patterns in Germany between 1979 and 2006. Section 4 turns to evidence on theGerman workforce and investigates the shifts in workplace activities and tasks over time, withinand between sectors and occupations. Section 5 then combines the data and imputes the likelytask content of Germany import and export trade flows, and documents their changes over time.Section 6 relates the workplace and trade flow changes to select labor-market institutions: thesectoral degree of unionization in Germany and the extent of labor-market rigidity among Germantrade partners. Section 7 concludes.
2 DataThis section describes our novel micro-level data set, covering nearly three decades (1979-2006)of workplace and trade information. We draw on various sources: (i) the German Qualificationsand Career survey, which we use to construct detailed and time consistent task measures at theworker-level; (ii) sector-level bilateral trade data from the World Trade Flows (WTF) database;(iii) sector-level unionization rates from the German Socioeconomic Panel (GSOEP); (iv) inter-nationally comparable measures of labor-market institutions from the World Bank, characterizinglabor market rigidities of Germany and its trading partners. We describe each of these data sourcesin turn.
We take account of German unification in 1990 and of changes in the WTF data constructionby including year dummies in all our regressions. We have confirmed the robustness of our resultsby restricting the analysis to West Germany alone.
4

2.1 German Qualifications and Career surveyOur main data source is the German Qualifications and Career survey (Qualifikation und Berufsver-lauf ), meanwhile renamed to German work survey (Erwerbstatigenbefragung). We refer to thisdata source for short as the BIBB survey because Germany’s Federal Institute for Vocational Edu-cation and Training BIBB (Bundesinstitut fur Berufsbildung) is the lead institution conducting thesurvey. The BIBB survey allows us to infer the time varying activity content and job requirementsof occupations and to obtain detailed worker characteristics. The survey has been conducted in fivewaves—in 1979, 1985-86, 1991-92, 1998-99 and 2005-06. The BIBB data is a random sample ofaround one tenth of a percent of the German labor force in each wave and forms a repeated crosssection of workers with detailed information on workplace characteristics, worker characteristics,the occupation and earnings, as well as the job’s industry. (There is only rudimentary informationon the employer, such as the employer’s region and employer size in some years.)
We have created time consistent information across all five waves (see the Data Appendix formore detail). For the first time, these data enable us to track the changing workplace characteristicsof jobs within sectors and occupations for a country over almost three decades. The BIBB datacharacterize the task profile of German workplaces through the surveyed worker’s response torelatively objective questions (such as the declaration of the main activity on the job and the use ofworkplace tools) as well as somewhat more subjective questions (the worker’s assessment of theskills required to perform a job and the worker’s assessment of the intensity of job requirements toconduct the job such as the degree of repetitiveness, the relevance of deadlines, or the adaptationto new situations).3 In this paper, we restrict our attention to the worker’s declaration of performedactivities and the worker’s assessment of the job’s performance requirements.
Activities. For a longitudinally consistent series of activities on the job, we extract binary indica-tors from the BIBB data. These activity indicators record whether an activity is performed or not ona worker’s job. To our knowledge for the first time, we obtain fifteen longitudinally consistent ac-tivity indicators across all five survey waves. For details on the activity variables see Appendix A.1.Examples of longitudinally consistent BIBB activities are: Manufacture, Produce Goods; GatherInformation, Develop, Research, Construct; Organize, Plan, Prepare (others’ work); or Oversee,Control Machinery and Techn. Processes. We will use manufacturing activities (Manufacture,Produce Goods) as our arguably easily offshorable benchmark in subsequent activity analysis.
The activities are not mutually exclusive. As Table 1 shows, workers report that they performconsiderably more simultaneous activities in later waves than in early waves. While 58.7 percentof workers report no more than one activity in 1979, the fraction of workers who report to performno more than one activity drops to 2.4 percent by 2006. To account for potential differences inreporting conventions over time, we condition on survey-wave fixed effects in all later regressions.
3For earlier work on select workplace characteristics in a labor-market context see DiNardo and Pischke (1997),Acemoglu and Pischke (1998) or Spitz-Oener (2006), for instance, and for tool use and global integration of Germanfirms see Becker et al. (2009).
5

Table 1: SIMULTANEOUS ACTIVITIES BY SURVEY WAVE
1979 1985-86 1991-92 1998-99 2005-06# Activities (1) (2) (3) (4) (5)
0 .184 .071 .109 .033 .0081 .403 .331 .353 .062 .0162 .204 .263 .237 .087 .0293 .096 .156 .136 .113 .0484 .053 .093 .075 .122 .0715 .029 .053 .044 .128 .1026 .015 .023 .024 .121 .1237 .008 .006 .012 .110 .1318 .004 .002 .005 .083 .1279 .002 .001 .003 .060 .116
10 .001 .0006 .001 .039 .09511 .0005 .0001 .0003 .024 .06712 .0002 .0001 .013 .03913 .00003 .003 .02114 .00007 .0006 .00715 .0004
Observations 29,737 26,361 34,277 34,343 20,000
Source: BIBB 1979-2006.Note: Shares of worker observations per wave with given number of reported activities. Missing entries are less thanone-tenth percent of a percent of observations. Activities are: 1. Manufacture, Produce Goods; 2. Repair, Maintain;3. Entertain, Accommodate, Prepare Foods; 4. Transport, Store, Dispatch; 5. Measure, Inspect, Control Quality; 6.Gather Information, Develop, Research, Construct; 7. Purchase, Procure, Sell; 8. Program a Computer; 9. ApplyLegal Knowledge; 10. Consult and Inform; 11. Train, Teach, Instruct, Educate; 12. Nurse, Look After, Cure; 13.Advertise, Promote, Conduct Marketing and PR; 14. Organize, Plan, Prepare (others’ work); 15. Oversee, ControlMachinery and Techn. Processes.
Performance requirements. The BIBB survey reports task requirements to perform a job. Incontrast to the activity indicators, a job requirement is recorded in BIBB by the frequency withwhich a worker executes the tasks on the job. We obtain nine longitudinally consistent job require-ment categories but information for four requirement categories is missing in a single wave each.To our knowledge, the performance requirement variables are so far largely unexplored workplacecharacteristics in research and we construct longitudinally consistent variables for the first time.We describe details of our performance requirements construction in Appendix A.2.
For empirical comparability to the more widely known activities definitions, in this paper wetransform the intensity scale into a set of binary task variables that indicate frequent requirements(intensity of 3 or 4–occasionally, frequently or almost always) or infrequent requirements (intensityof 1 or 2–never or almost never, or seldom). We have conducted robustness checks with alternativecutoffs (such as 1-3 vs. 4, and 1 vs. 2-4, available upon request), and find consistent empiricalfacts. Examples of longitudinally consistent BIBB job requirements are: Deadlines/pressure to
6

Table 2: SIMULTANEOUS PERFORMANCE REQUIREMENTS BY SURVEY WAVE
1979 1985-86 1991-92 1998-99 2005-06# Requirements (1) (2) (3) (4) (5)
0 .056 .022 .077 .004 .0041 .040 .034 .031 .036 .0152 .065 .061 .073 .055 .0353 .103 .099 .160 .102 .0754 .143 .138 .302 .151 .1625 .168 .186 .211 .181 .2356 .156 .196 .146 .181 .2287 .129 .138 .144 .1698 .085 .085 .090 .0779 .055 .041 .057
Observations 29,737 26,361 34,277 34,343 20,000
Source: BIBB 1979-2006.Note: Shares of worker observations per wave with given number of reported performance requirements that are appli-cable occasionally, frequently or almost always. Missing entries occur in survey waves 1991-92 (three missing perfor-mance requirements) and 2005-06 (one missing performance requirement), as documented in Table A.2. Performancerequirements are: 1. Deadlines/pressure to perform; 2. Improve/adopt new techniques; 3. New situations/activities; 4.Repeated work steps; 5. Work procedures prescribed in detail; 6. Financial losses by small mistakes (missing in 1992);7. Minimum performance/time/quantity given to execute activity (missing in 1992); 8. Versatility/multiple activitiesat same time (missing in 1992); 9. Concentration on activity (missing in 2006).
perform; Improve/adopt new techniques; New situations/activities; or Work procedures prescribedin detail. We will use the presence of detailed work routines (Work procedures prescribed in detail)as our arguably easily offshorable benchmark in subsequent analysis of performance requirements.
Just as activities before, performance requirements are not mutually exclusive. In contrast toactivities, however, German workers do not report more simultaneous performance requirementsover time, as Table 2 documents. For the tabulation, we consider a performance requirement aspresent if the worker reports it to apply occasionally, or frequently or almost always. Except forthe survey waves 1991-92 and 2005-06, where three and one requirements are not reported respec-tively, the fractions of workers with a given number of simultaneous high-frequency performancerequirements remain remarkably stable. A plurality of workers faces between four and seven si-multaneous performance requirements with high frequency in all survey waves.
The lacking change in the simultaneity of performance requirements over time is not only in-teresting in its own right. The stability in performance requirement reporting perhaps also suggeststhat the observed change in the simultaneity of activities above is not a statistical artefact of chang-ing reporting conventions over time, but may reflect an actual workplace enrichment over time.
7

2.2 TradeWorld trade flow statistics. We obtain bilateral trade flow data to and from Germany by sectorfor the years 1979, 1986 and 1992 using the World Trade Flows (WTF) database over the period1979-1993 by (Feenstra, Lipsey, Deng, Ma and Mo 2005), and using their recent revision files(2011) for the years 1994 to 2006. We aggregate the individual country information from therecent files (for 1999 and 2006) to the country groups as defined by (Feenstra et al. 2005) in theearly years (1979, 1986 and 1992). We map the SITC Rev. 2 sector information to our commonsector definition with 39 industries across all waves of the BIBB data (see Appendix A.4). Wetransform the US$ data to Euro and deflate them with the German CPI to the end of the year 1998,at the eve of the Euro’s introduction for financial transactions.
Imports of intermediate inputs. We collect the import matrices from input-output tables in1978 (no table for 1979), 1986, 1992, 1999 and 2006 by the German Statistical Office destatis. Wemap the sector classification from the NACE oriented classifications in Germany’s import matricesto our common sector definition with 39 industries. In line with OECD standards, the Germanimport matrix is based on the import proportionality assumption. This technique assumes that anindustry uses an import of a particular input in proportion to its total use of that input. For example,if an industry such as motor vehicles uses steel in its production processes and 10 percent of allsteel is imported, it is assumed that 10 percent of the steel used by the motor vehicle industry isimported. So time variation in imported steel for intermediate use comes from two independentchanges over time: more steel imports and changing shares of steel use by industry, but does notcome from a direct measure of import use shares by input and output. Using the import matrix, wecompute the value of imports of intermediate inputs. We translate the import values in the earlyyears from Deutsche Mark to Euro and deflate all years with the German CPI to our base year1998.
2.3 Labor-market institutionsUnionization rates. We infer sector-level unionization rates from the German SocioeconomicPanel (GSOEP), a longitudinal survey of individuals in private households. We retain only obser-vations of West German households which provide an arguably more precise reflection of unioniza-tion, and map the NACE 1.1 sector information in GSOEP to our common sector definition acrossall waves of the BIBB data (see Section A.4). Then we compute unionization rates by sector asthe average over the years for which they are available (1985, 1989, 1993, 1998, 2001, 2003 and2007).
Labor market rigidity. Following Botero, Djankov, La Porta, Lopez de Silanes and Shleifer(2004), the World Bank computes internationally comparable measures of labor-market institutionssince 2004. These measures summarize employment laws across countries with respect to theimplied rigidity of labor markets, covering hiring costs, restrictions on changing work hours, firingcosts, as well as the World Bank’s overall rigidity index summarizing the aforementioned three
8

1020
4080
160
320
Impo
rts
(bill
ion
EU
R in
199
8)
1979 1986 1992 1999 2006Calendar year
Agriculture, Utilities, Mining Chemicals & mineralsIron, steel & metals Transport equipmentMachinery & equipmt Wood, paper, printingTextiles, apparel, leather Food & beverages
Source: World Trade Flows (WTF) data 1979-1993 and recent revisions 1994-2006 (Feenstra et al. 2005, update2011).Notes: US$ data converted to Euro and deflated with German CPI, end of year 1998 as base year. Log scale on verticalaxis.
Figure 1: German Imports, 1979-2006
indexes. Finally, the World Bank data offer a direct measure of firing costs. Historical data areunavailable so we use the initial World Bank survey from 2004, which is closest to our sampleperiod from 1979-2006.
3 German Trade PatternsWe start out by looking at the pattern of German imports over time. Figure 1 shows that Germanimports grew considerably across all sectors. However, there is some heterogeneity. Imports ofmachinery and equipment as well as of transport equipment have grown considerably faster thanaverage imports, while agricultural imports have declined slightly in real terms.
Classic trade theory used to emphasize trade in final goods. Table 3 shows, in contrast, thatmost imports are for intermediate use and not for final consumption. The dominance of intermedi-ate uses is particularly pronounced for services imports and imports of iron, steel and metals, whereintermediate uses account for more than 80% of uses over three decades. At the other extreme, intextiles and apparel as well as in transport equipment, imports of intermediate input make up lessthan 40% of total imports. The share of intermediates in total imports is relatively stable over timeacross most sectors. In some sectors, such as transport equipment, machinery, wood and food,the fraction of imports for intermediate use increases in the early decade and half (from 1979 to1986 or 1992). In all sectors, however, the share of intermediates imports falls between 1979 and2006. This different shift in trade patterns between the early half and the late half of our sampleperiod leads us to track changes in German workplace characteristics between 1979 and 1986 and
9

Table 3: SHARE OF INTERMEDIATE PRODUCT IMPORTS IN TOTAL IMPORTS
1978 1986 1992 1999 2006(1) (2) (3) (4) (5)
Agriculture & Utilities .844 .838 .771 .718 .790Manf.: Chemicals and mineral products .758 .746 .757 .728 .607Manf.: Iron, steel and metal products .902 .880 .847 .845 .836Manf.: Transport equipment .379 .409 .355 .335 .326Manf.: Machinery, equipment and misc. prod. .428 .441 .371 .378 .376Manf.: Wood, paper and printing .793 .810 .867 .742 .675Manf.: Textiles, apparel and leather .350 .283 .280 .229 .187Manf.: Food and beverages .394 .453 .394 .396 .344Services .938 .815 .832 .846 .909
Source: Destatis import matrices, releases 2009 (1978 and 1986) and 2010 (1992, 1999, 2006).Notes: Deflated with German CPI, end of year 1998 as base year. Shares of total imports for intermediate use in totalimports.
between 1979 and 2006.Table 3 documents that trade in intermediates is not a new phenomenon in Germany. The
increasing trade of intermediate inputs seems to be mostly a consequence of the general increasein imports. As a share of total trade, however, trade in intermediates continues to account for thebulk of imports. To the extent that trade in intermediates is associated with tasks performed abroadthat would otherwise remain onshore, imports of intermediate inputs can be viewed as trade intasks.
4 Activity Content and Job Performance RequirementsThe degree to which jobs can be offshored depends on their activity content and performance re-quirements (see e.g. Leamer and Storper 2001; Markusen 2006; Jensen and Kletzer 2006; Blinder2006). Several such activity types and performance requirements have been proposed as relevantfor the degree of offshorability in the literature: the prevalence of codifiable rather than tacit infor-mation to perform the job (Leamer and Storper 2001); the prevalence of routine tasks, especiallyif they can be summarized in deductive rules (Levy and Murnane 2004); or the job’s lacking re-quirement of personal interaction and physical proximity (Blinder 2006). Beyond previous work,we do not lump the detailed information on workplace tools, activities or job characteristics intosubjectively defined task dichotomies such as codifiable/non-codifiable, routine/non-routine andnon-interactive/interactive. Instead, we let the data speak for themselves.
We investigate two sets of task characteristics that a worker faces in a sectoral occupation:the activity content and the job performance requirements. For each set of tasks, we aggregate theBIBB data to cells by sector, occupation, survey year, gender, age and task (activity or performancerequirement) and count the number of workers performing the task in each cell. Then we regress
10

the log number of workers, lnL, performing the task on a set of indicators in two specifications.First, allowing task employment counts to vary across sectors and occupations, we specify
lnLitsajk = βit + βt + βs + βa + εitsajk (1)
for task i (activity or performance requirement), year t, gender s and age a, as well as sector j andoccupation k, where the β parameters denote regression coefficients on according sets of dummyvariables. Second, restricting coefficient estimates to reflect effects within sectors and occupations,we specify the long regression4
lnLitsajk = βit + βt + βs + βa + βj + βk + εitsajk. (2)
We estimate standard errors under two-way clustering (Cameron, Gelbach and Miller 2011) at thelevel of 2-digit sectors and tasks, which are not nested within sectors.
For activity content, we choose as our omitted reference activity 1 Manufacture, ProduceGoods in each survey year. This activity is expectedly easily offshorable through merchandisetrade. For performance requirements, we choose as our omitted reference performance require-ment E Work procedures prescribed in detail in each survey year. This requirement is consideredeasily offshorable because it involves codifiable, rather than tacit, information to perform the job(Leamer and Storper 2001). Note that our inclusion of a full set of year dummies βt means that wehave to exclude one reference task category per survey year.
To standardize results, we scale the coefficients from the log regressions to report exp{β} (andadjust the standard errors with the Delta method) so that the estimates reflect relative frequen-cies compared to the respective omitted reference categories. Under this convention the referenceperformance requirement E Work procedures prescribed in detail, for example, is implicitly stan-dardized to exp{β·t} = 1 for all survey years and a transformed coefficient estimate exp{βit}for any other performance requirement i then shows whether the respective performance require-ment is a more (exp{βit} > 1) or less frequent (exp{βit} ≤ 1) workplace characteristic than thereference category in a given year. Deviations from the reference category can vary over time.
Activity content. In Tables D.8 and D.9 in the Appendix, we report coefficient estimates for βit
and overall regression statistics. In Figure 2 we present the βit estimates in graphical form. Eachone of the two panels in Figure 2 depicts coefficient estimates from one single regression.
Our hypothesis is that under increasing offshorability of codifiable, routine and non-interactivetasks, we should see a shift in the relative frequency of activities other than 1 Manufacture, ProduceGoods to higher and higher levels over time, that is an upward turn of the activity profile to theright of the left-most reference activity 1 Manufacture, Produce Goods.
Two important patterns can be discerned from Table D.8 and the corresponding left panel ofFigure 2. First, every single activity gains in importance after the base year 1979, relative to thearguably most offshorable reference category 1 Manufacture, Produce Goods. Second, most of theshift away from the reference category has taken place already by 1986. Third, the shift away from
4We can also condition on joint sector year effects βst instead of βt + βs to assess the robustness of our results.
11

Unconditional Within Sectors and Occupations
1979
1986
2006
.67
.82
11.
221.
5R
elat
ive
Fre
quen
cy
1 Produce
2 Repair/M
aintain
3 Enterta
in/Acc
ommodate
4 Transport/S
tore
5 Measu
re/Insp
ect
6 Analyz
e/Rese
arch
7 Purch
ase/S
ell
8 Program C
omputer
9 Practi
ce Law
10 Consu
lt/Inform
11 Train/Educa
te
12 Nurse
/Cure
13 Adve
rtise/P
romote
14 Organize
/Plan
15 Ove
rsee/C
ontrol
Activity
1979 1986 2006
1979
1986
2006
.54
.67
.82
11.
221.
5R
elat
ive
Fre
quen
cy
1 Produce
2 Repair/M
aintain
3 Enterta
in/Acc
ommodate
4 Transport/S
tore
5 Measu
re/Insp
ect
6 Analyz
e/Rese
arch
7 Purch
ase/S
ell
8 Program C
omputer
9 Practi
ce Law
10 Consu
lt/Inform
11 Train/Educa
te
12 Nurse
/Cure
13 Adve
rtise/P
romote
14 Organize
/Plan
15 Ove
rsee/C
ontrol
Activity
1979 1986 2006
Source: BIBB 1979-2006, workers ages 16 through 65.Notes: Measures of relative activity frequencies from log employment OLS regression over 168,466 activity-year-gender-age-sector-occupation cells, as reported in Tables D.8 and D.9. Coefficients β from log employment regres-sions reported as exp{β} to reflect relative frequencies. Omitted baseline activity from regressions: 1 Manufacture,Produce Goods in each survey wave. Log scale on vertical axis.
Figure 2: Activity Content of German Work
1 Manufacture, Produce Goods affects both “high-end activities” such as 14 Organize/Plan and 15Oversee/Control as well as “low-end activities” such as 2 Repair/Maintain.
The regressions underlying Table D.8 only control for gender, 48 age groups, and 5 years(survey waves), but not for occupation and sector. The trend towards certain high-end activitiescould thus just reflect an expansion of sectors and occupations that are intensive in these activities.To probe this further, in Table D.9 and the corresponding right panel of Figure 2, we conditionout occupation and sector means (through according fixed effects). It turns out that the coefficientsbarely change, suggesting that the main driver of the trends in activities is a shift within occupationsand sectors towards less offshorable activities, not between occupations and sectors.
Intensity of performance requirements. Our hypothesis is that under increasing offshorabilityof codifiable, routine and non-interactive tasks, we should see a shift in the relative frequency ofperformance requirements other than E Work procedures prescribed in detail to higher and higherlevels over time. Now using as a reference category the mid bin E of the range from A to I, weshould see a U-shaped upward turn of the performance requirement profile to the left and to theright of the reference requirement E Work procedures prescribed in detail.
In Tables D.10 and D.11 in the Appendix, we report coefficient estimates for βit and overallregression statistics. In Figure 3 we present the βit estimates in graphical form.
Several observations emerge. First, across all five sample waves, we detect the expected U-shape: performance requirements other than the reference category E Work procedures prescribedin detail are more prevalent. Second, this pattern varies little over time. A noticeable exception isthe category B Improve/adopt new techniques, whose importance increases significantly over time.
12

Unconditional Within Sectors and Occupations
1979
1986
2006
.91
1.11
1.23
1.37
Rel
ativ
e F
requ
ency
A Deadlin
es
B Improve
tech
niques
C New si
tuations
D Repeat w
ork
E Presc
ribed w
ork
F Losses i
f mist
ake
G Multi
activit
ies
H Conce
ntratio
n
I Minim
um perform
Performance Requirement
1979 1986 2006
1979
1986
2006
.91
1.11
1.23
1.37
Rel
ativ
e F
requ
ency
A Deadlin
es
B Improve
tech
niques
C New si
tuations
D Repeat w
ork
E Presc
ribed w
ork
F Losses i
f mist
ake
G Multi
activit
ies
H Conce
ntratio
n
I Minim
um perform
Performance Requirement
1979 1986 2006
Source: BIBB 1979-2006, workers ages 16 through 65.Notes: Measures of relative performance requirement frequencies from log employment OLS regression over 180,022requirement-year-gender-age-sector-occupation cells, as reported in Tables D.10 and D.11. Coefficients β from logemployment regressions reported as exp{β} to reflect relative frequencies. Omitted baseline performance requirementfrom regressions: E Work procedures prescribed in detail in each survey wave. Performance requirements F-H missingin 1992, requirement I missing in 2006. Log scale on vertical axis.
Figure 3: Performance Requirements of German Work
Note that the “right arm” of the performance requirement profile is arguably less precisely mea-sured because in 1992 F-H are missing, and in 2006 I is missing. Similar to the lacking differencebetween the short and long regressions for activities above, if anything coefficient estimates be-comes somewhat more pronounced in the long regression that conditions on sector and occupationfixed effects. This evidence suggests that the main source of variation in performance requirementsis within occupations and sectors, not between them.
5 Imputed Activity Content, Job Performance Requirementsand Trade
So far, we separately presented Germany’s import patterns and the evolution of activities and jobperformance requirements in Germany. Now we bring both together and investigate how trade andtasks interact. To obtain first proxies to the likely activity content and the likely job performancerequirements behind German trade flows, we impute implied task trade flows through a weightingprocedure. Consider import flows to Germany first. To obtain weights, we aggregate the BIBBdata to cells by sector, survey year, and task (activity or performance requirement) and count thenumber of workers in each cell. We compute a task’s employment share in the sector and yeartotal,
σijt ≡ Lijt/(∑
j Lijt),
13

for task i, survey year t and sector j. Then we match to these task shares the import flows of finalproducts in a given sector Mjtc from source country c and obtain imputed task shares in importflows σij,t−7Mjtc, where we use the German task share in a sector in the prior survey wave t − 7under the assumption that a typical foreign source country’s task composition resembles that ofGermany seven years earlier. Finally, we impute the volume of final goods imports associated withtask i embedded in total imports from country c with
mitc ≡∑
j σij,t−7Mjtc.
For German exports, we use task weights σijt of the current period to obtain tasks embeddedin total exports
xitc ≡∑
j σijtXjtc,
where Xjt are sectoral export flows of final products to destination country c.5
We regress the log embedded task trade flow on a set of indicators in specifications similar tothe exercises before:
lnmitc = βit + βt + βc + εitc, (3)ln xitc = βit + βt + βc + εitc, (4)
for task i (activity or performance requirement), year t and country c. We control for sourcecountry fixed effects (in regressions of log task imports) and for destination country fixed effects(in regressions of log task exports) but their omission changes βit estimates hardly at all. Weestimate standard errors under two-way clustering at the level of countries and tasks (Cameron etal. 2011).
As before, for activity content we choose as our omitted reference categories 1 Manufacture,Produce Goods in each survey year. For performance requirements, we choose as our omittedreference categories the performance requirement E Work procedures prescribed in detail in eachsurvey year. Note that our inclusion of a full set of year dummies means that we have to excludeone reference task category per survey year. To standardize results, we scale the coefficients fromthe log regressions to report exp{β} (and adjust the standard errors with the Delta method) so thatthe estimates reflect relative trade frequencies (relative trade values) compared to the respectiveomitted reference categories.
German imports. Our hypothesis is that under increasing offshorability of codifiable, routineand non-interactive tasks, we should see a shift in the relative import frequency of activities otherthan 1 Manufacture, Produce Goods to lower and lower levels over time, that is a downward turn ofthe activity profile to the right of the reference activity 1 Manufacture, Produce Goods. Similarly,
5These are crude measures and, similar to much prior work on trade in the literature, based on final goods trade.However, as Table 3 above documented, most German imports are for intermediate use and not for final consumption.In future statistical work, we are planning to use ILO data on foreign occupations and industries to compute theoccupation composition behind country-level import flows and transform the import flows of final products into flowsof intermediate goods imports using the import matrix from German input-output tables.
14

Activities in Imports Performance Requirements in Imports
1986
1999
2006
.3.4
4.6
71
1.5
Rel
ativ
e F
requ
ency
1 Produce
2 Repair/M
aintain .
4 Transport/S
tore
5 Measu
re/Insp
ect
6 Analyz
e/Rese
arch
7 Purch
ase/S
ell
8 Program C
omputer
9 Practi
ce Law
10 Consu
lt/Inform . .
13 Adve
rtise/P
romote
14 Organize
/Plan
15 Ove
rsee/C
ontrol
Activity
1986 1999 2006
1986
1999
2006
.91
1.11
1.23
Rel
ativ
e F
requ
ency
A Deadlin
es
B Improve
tech
niques
C New si
tuations
D Repeat w
ork
E Presc
ribed w
ork
F Losses i
f mist
ake
G Multi
activit
ies
H Conce
ntratio
n
I Minim
um perform
Performance Requirement
1986 1999 2006
Sources: WTF 1979-1993 and recent revisions 1994-2006; BIBB 1979-2006, workers ages 16 through 65.Notes: Measures of relative task (activity or performance requirement) frequencies from log import value OLS regres-sion over task-year-source country cells (12,398 observations for activities and 6,918 observations for performancerequirements), as reported in Tables D.12 and D.13. Import value of embedded tasks imputed using 7-year lags ofGerman task shares by sector. Services activities 3, 11 and 12 not reported in graphs, performance requirement Imissing in 2006, requirement D dropped to avert multi-collinearity. Coefficients β from log import value regressionsreported as exp{β} to reflect relative import frequencies. Omitted baseline activity 1 Manufacture, Produce Goods ineach survey wave, omitted baseline performance requirement E Work procedures prescribed in detail in each surveywave. Log scale on vertical axis.
Figure 4: Activity Content and Performance Requirements Embedded in German Imports
we should see a shift in the relative frequency of performance requirements other than E Workprocedures prescribed in detail to lower and lower levels over time, that is a U-shaped downwardturn of the performance requirement profile to the left and right of the reference requirement EWork procedures prescribed in detail. In the extreme case, we might see an inversion from aninitially U-shaped profile open upwards to an inverted U with the opening downwards.
Table D.12 reports exponentiated coefficient estimates from OLS regressions of activities em-bedded in German imports, relative to the activity manufacture, produce goods. (Note that we use1979 weights also for 1979 because no data is available for t − 7 = 1972.) Similarly, Table D.13presents the estimates for performance requirements embedded in German imports. Graphically,we present estimates for the years 1986, 1999 and 2006 in Figure 4. We exclude 1992 becauseof many missing performance requirements. We exclude 1979 because weights for 1972 are notavailable so that we have to use concurrent weights instead. Given identical task weights for tradeflows in 1979 and 1986, and our conditioning on year fixed effects, it is not surprising that ourestimates for 1979 and 1986 are very similar (compare Table D.12 and in the Appendix).6
The left panel of Figure 4 indicates that most activities embedded in German imports have
6From the activity graphs, we drop the pure services activities 3 Entertain/Accommodate, 11 Train/Educate and 12Nurse/Cure off the shown task trade flow statistics because we do not have services trade data at this stage. However,we include these three services categories in the underlying regression to condition out their relative effects (seeAppendix tables).
15

remained roughly constant over time or lost over in importance over time relative to the referencecategory manufacture, produce goods. Prominent exceptions are activities 8 Program a Computerand 9 Apply Legal Knowledge, which have become more prominent in German imports over time.
The picture is more clear cut for performance requirements embedded in German imports. Theright panel of Figure 4 shows that, except for G Versatility/multi activities, where the 2006 valueis slightly above the 1986 one, the 1986 values exceed the ones from 1999 and 2006. So, we dosee that performance requirements other than the reference category E Work procedures prescribedin detail lose importance over time. To the extent that these performance requirements are more“high-end” than E Work procedures prescribed in detail, they matter relatively less in Germanimports, mirroring their prominence in the job requirements of Germany’s domestic labor force.Overall, the performance requirement profile roughly resembles a U shape in 1986 (and 1979)and the hypothesized inverted U shape in later years. The profile strictly resembles an invertedU shape in 1999 with its peak at the arguably easily offshorable baseline task E Work proceduresprescribed in detail, as expected. In 2006, however, there are two exceptions for the performancefeatures F Financial loss by small mistake and G Versatility/multiple activities, consistent with aconcentration of German imports in sectoral activities that enrich jobs with more responsibilitiesbetween 1999 and 2006.
German exports. We perform the same exercise for German exports. Our hypothesis is thatthe export pattern should reflect the task restructuring of the German economy as observed inSection 4 before. Under increasing offshorability of codifiable, routine and non-interactive tasks,we should see German export specialization with the relative frequency of activities other than1 Manufacture, Produce Goods shifting to higher and higher levels over time, that is an upwardturn of the activity profile to the right of the reference activity 1 Manufacture, Produce Goods.Similarly, we should see a shift in the relative export frequency of performance requirements otherthan E Work procedures prescribed in detail to higher and higher levels over time, that is a U-shaped upward turn of the performance requirement profile to the left and right of the referencerequirement E Work procedures prescribed in detail.
For activities, we do not find a strong temporal pattern similar to the import side, as can besee in Table D.14 and in the left panel of Figure 5.7 The similarity of the activity weighted exportpatterns with the import patterns is consistent with the idea that products from sectors with theseactivity patterns become more tradable overall. For future more detailed analysis of shifts in taskcontent, we will need to account for exports of final products as well as for imports of competinggoods in the product market and imports of intermediate goods in the input markets.
Our hypothesis receives support for performance requirements in German exports, however.Table D.15 and the right panel of Figure 5 show that German exports are increasingly intensivein “high-end” performance requirements. In all performance requirements except for G Versatil-ity/multiple activities the coefficient estimates in 2006 are as high as (statistically not significantlydifferent) or statistically significantly higher than in prior years.
Summarizing our main findings from this and the preceding Section, we find an increasing im-
7Note that, for comparability to imports, we choose the same years 1986, 1999, 2006 for exports in Figure 5.
16

Activities in Exports Performance Requirements in Exports
1986
1999
2006
.3.4
4.6
71
1.5
Rel
ativ
e F
requ
ency
1 Produce
2 Repair/M
aintain .
4 Transport/S
tore
5 Measu
re/Insp
ect
6 Analyz
e/Rese
arch
7 Purch
ase/S
ell
8 Program C
omputer
9 Practi
ce Law
10 Consu
lt/Inform . .
13 Adve
rtise/P
romote
14 Organize
/Plan
15 Ove
rsee/C
ontrol
Activity
1986 1999 2006
1986
1999
2006
.91
1.11
1.23
1.37
Rel
ativ
e F
requ
ency
A Deadlin
es
B Improve
tech
niques
C New si
tuations
D Repeat w
ork
E Presc
ribed w
ork
F Losses i
f mist
ake
G Multi
activit
ies
H Conce
ntratio
n
I Minim
um perform
Performance Requirement
1986 1999 2006
Sources: WTF 1979-1993 and recent revisions 1994-2006; BIBB 1979-2006, workers ages 16 through 65.Notes: Measures of relative task (activity or performance requirement) frequencies from log export value OLS regres-sion over task-year-destination country cells (12,629 observations for activities and 6,882 observations for performancerequirements), as reported in Tables D.14 and D.15. Export value of embedded tasks imputed using current Germantask shares by sector. Services activities 3, 11 and 12 not reported in graphs, performance requirement I missing in2006, requirement D dropped to avert multi-collinearity. Coefficients β from log export value regressions reported asexp{β} to reflect relative export frequencies. Omitted baseline activity 1 Manufacture, Produce Goods in each surveywave, omitted baseline performance requirement E Work procedures prescribed in detail in each survey wave. Logscale on vertical axis.
Figure 5: Activity Content and Performance Requirements Embedded in German Exports
portance of “high end” activities in German workplace characteristics between during the sampleperiod. At the same time, we find a decreasing relevance of “high-end” performance requirementsin German imports and the opposite for performance requirements embedded in German exports.This evidence is supports theories of trade in tasks.
6 Institutional AspectsThis section relates the workplace and trade flow changes to select labor-market institutions: thesectoral degree of unionization in Germany and the extent of labor-market rigidity among Germantrade partners.
6.1 Highly unionized vs. less unionized sectors in GermanyIn our subsequent analysis, we run separate regression for highly unionized (above median) vs.less unionized sectors (at or below median) in Germany. This sample split allows us to comparethe trade-task relationship across degrees of unionization.
To inspect unionization rates across sectors over time, we aggregate sectors to the same eightaggregate sectors that we used to depict trends in German imports over time (Figure 1). Figure 6
17

.1.2
.3.4
.5U
nion
izat
ion
rate
1 Agri/U
til/Mining
2 Chem/M
inerals
3 Iron/S
teel/Metals
4 Transport e
quipmt
5 Mach
in & E
quipmt
6 Wood/P
aper/Prin
t
7 Text/App/Leath
8 Food/Beve
rage
1985 1993 1998 2007
Source: GSOEP, 1985-2007, workers ages 16 through 65; select years with unionization.Note: Unionization rate is share of West German household members who report union membership and employmentin an industry.
Figure 6: Unionization rates by sector over time
shows several interesting features: first, unionization rates vary considerably across (aggregated)sectors. They are highest in 3 Iron/Steel/Manufacturing and 4 Transport equipment ranging frombetween 40 to 50 percent, and lowest in 8 Food/Beverages with 10 to 30 percent unionization.Second, with the exception of textiles and apparel, unionization rates have fallen over time. Thechanges over time are similar across sectors.
In the regression analysis, we exploit variation not only across the eight sectors used in thegraphical presentation, but across all 39 sectors in our data. In order to split sectors into highunionization and low unionization sectors, we compute unionization rates as averages over timeand split the sample at the median sector. We re-run the regressions from Section 4, separately forstrongly unionized sectors and weakly unionized sectors. The regression results are in Tables D.16through D.19 in the Appendix.
For ease of comparison, we graphically depict the results in Figure 7. The upper panel showsthat the change in activity content of German work is more pronounced in weakly unionized sec-tors. Similarly, as can be seen in the lower panel of the figure, performance requirements areoverall more demanding in weakly unionized sectors. Labor market institutions in the form ofdomestic unionization rates thus seem to contribute to explaining the evolution of task intensityover time.
6.2 Labor market rigidity of German trade partnersWe now turn to measures of labor-market institutions and compare the rigidity of German labormarkets to that of its trade partners, using the World Bank’s classification of employment lawsfollowing Botero et al. (2004). We use import flows by year to compute the unweighted meanrigidity index of the source countries of Germany’s imports, and export flows for the weighted
18

Activity Content of German WorkStrongly Unionized Sectors Weakly Unionized Sectors
1979
1986
2006
.44
.54
.67
.82
11.
221.
51.
84R
elat
ive
Fre
quen
cy
1 Produce
2 Repair/M
aintain
3 Enterta
in/Acc
ommodate
4 Transport/S
tore
5 Measu
re/Insp
ect
6 Analyz
e/Rese
arch
7 Purch
ase/S
ell
8 Program C
omputer
9 Practi
ce Law
10 Consu
lt/Inform
11 Train/Educa
te
12 Nurse
/Cure
13 Adve
rtise/P
romote
14 Organize
/Plan
15 Ove
rsee/C
ontrol
Activity
1979 1986 2006
1979
1986
2006
.54
.67
.82
11.
221.
51.
84R
elat
ive
Fre
quen
cy1 P
roduce
2 Repair/M
aintain
3 Enterta
in/Acc
ommodate
4 Transport/S
tore
5 Measu
re/Insp
ect
6 Analyz
e/Rese
arch
7 Purch
ase/S
ell
8 Program C
omputer
9 Practi
ce Law
10 Consu
lt/Inform
11 Train/Educa
te
12 Nurse
/Cure
13 Adve
rtise/P
romote
14 Organize
/Plan
15 Ove
rsee/C
ontrol
Activity
1979 1986 2006
Performance Requirements of German WorkStrongly Unionized Sectors Weakly Unionized Sectors
1979
1986
2006
.91
1.11
1.23
1.37
Rel
ativ
e F
requ
ency
A Deadlin
es
B Improve
tech
niques
C New si
tuations
D Repeat w
ork
E Presc
ribed w
ork
F Losses i
f mist
ake
G Multi
activit
ies
H Conce
ntratio
n
I Minim
um perform
Performance Requirement
1979 1986 2006
1979
1986
2006
.91
1.11
1.23
1.37
Rel
ativ
e F
requ
ency
A Deadlin
es
B Improve
tech
niques
C New si
tuations
D Repeat w
ork
E Presc
ribed w
ork
F Losses i
f mist
ake
G Multi
activit
ies
H Conce
ntratio
n
I Minim
um perform
Performance Requirement
1979 1986 2006
Source: BIBB 1979-2006, workers ages 16 through 65; GSOEP select years with unionization.Notes: Measures of relative activity frequencies from log employment OLS regression over 76,676 activity-year-gender-age-sector-occupation cells with high unionization and 84,480 cells with low unionization, as reported in Ta-bles D.16 and D.17, and 89,092 activity-year-gender-age-sector-occupation cells with high unionization and 83,667cells with low unionization, as reported in Tables D.18 and D.19. Coefficients β from log employment regressionsreported as exp{β} to reflect relative frequencies. Omitted baseline task from regressions: activity 1 Manufacture,Produce Goods and performance requirement E Work procedures prescribed in detail in each survey wave. Perfor-mance requirements F-H missing in 1992, requirement I missing in 2006. Log scale on vertical axis.
Figure 7: Activity Content and Performance Requirements of German Work by Unionization
19

Table 4: LABOR MARKET RIGIDITY AT GERMANY’S IMPORT AND EXPORT PARTNERS
Index of Hiring costs Hours changes Firing costs Overall rigidity Firing costs(1) (2) (3) (4) (5)
Germany 44.0 80.0 40.0 55.0 80.0
Imports 1979 32.7 52.7 28.8 38.0 36.8Imports 1986 33.4 52.8 28.5 38.2 35.9Imports 1992 33.2 53.3 29.3 38.5 37.5Imports 1999 31.2 51.7 29.6 37.5 38.1Imports 2006 28.3 51.2 30.0 36.4 39.0
Exports 1979 31.1 52.8 29.3 37.7 37.1Exports 1986 29.9 50.6 28.5 36.3 36.0Exports 1992 33.7 54.6 31.3 39.8 40.9Exports 1999 32.3 53.2 31.5 38.9 40.0Exports 2006 31.3 53.5 32.1 38.9 41.4
Sources: World Bank Doing Business 2004 (Botero et al. 2004); WTF 1979-1993 and recent revisions 1994-2006.Notes: Labor-market rigidity indexes are coded on a scale from 1 to 100, where a higher level indicates more labor-market rigidity.
rigidity index of Germany’s destination countries.Table 4 lists the rigidity indexes by category for Germany and its trade partners. Three main
insights emerge. First, Germany has considerably more rigid employment laws than its trade part-ners. Second, the rigidity composition of Germany’s trade partners changes little over time. Third,Germany’s main import and export partners have similar labor market rigidities. This is consistentwith the idea that Germany’s trade flows are largely independent of foreign labor-market institu-tions.
In our remaining analysis, we run separate regressions for imports from source countries withmore rigid (overall rigidity index above German level) vs. less rigid labor markets than Ger-many. This sample split allows us to compare the imported trade-task relationship across levelsof source-country rigidity. Figure 8 shows the results (regression Tables D.20 through D.23 in theAppendix).8 Not surprisingly given the evidence from Table 4, there are no marked differences ofembedded task trade between high-rigidity and low-rigidity import source countries.
7 ConclusionNovel data on time-varying German workplace characteristics over three decades show that theactivities of German workers on the job change considerably over time. Workers perform moreactivities simultaneously and different activities over time, with a shift towards activities that are
8Select regressions result in non-negative definite Hessians when accounting for two-way clustering. In those caseswe only cluster by importing destination country.
20

Activity Content Embedded in German Importsfrom More Rigid Countries from Less Rigid Countries
1986
1999
2006
.3.4
4.6
71
1.5
Rel
ativ
e F
requ
ency
1 Produce
2 Repair/M
aintain .
4 Transport/S
tore
5 Measu
re/Insp
ect
6 Analyz
e/Rese
arch
7 Purch
ase/S
ell
8 Program C
omputer
9 Practi
ce Law
10 Consu
lt/Inform . .
13 Adve
rtise/P
romote
14 Organize
/Plan
15 Ove
rsee/C
ontrol
Activity
1986 1999 2006
1986
1999
2006
.3.4
4.6
71
1.5
Rel
ativ
e F
requ
ency
1 Produce
2 Repair/M
aintain .
4 Transport/S
tore
5 Measu
re/Insp
ect
6 Analyz
e/Rese
arch
7 Purch
ase/S
ell
8 Program C
omputer
9 Practi
ce Law
10 Consu
lt/Inform . .
13 Adve
rtise/P
romote
14 Organize
/Plan
15 Ove
rsee/C
ontrol
Activity
1986 1999 2006
Performance Requirements Embedded in German Importsfrom More Rigid Countries from Less Rigid Countries
1986
1999
2006
.91
1.11
1.23
Rel
ativ
e F
requ
ency
A Deadlin
es
B Improve
tech
niques
C New si
tuations
D Repeat w
ork
E Presc
ribed w
ork
F Losses i
f mist
ake
G Multi
activit
ies
H Conce
ntratio
n
I Minim
um perform
Performance Requirement
1986 1999 2006
1986
1999
2006
.91
1.11
1.23
Rel
ativ
e F
requ
ency
A Deadlin
es
B Improve
tech
niques
C New si
tuations
D Repeat w
ork
E Presc
ribed w
ork
F Losses i
f mist
ake
G Multi
activit
ies
H Conce
ntratio
n
I Minim
um perform
Performance Requirement
1986 1999 2006
Source: WTF 1979-1993 and recent revisions 1994-2006; BIBB 1979-2006, workers ages 16 through 65; World BankDoing Business 2004.Notes: Measures of relative task (activity or performance requirement) frequencies from log import value OLS regres-sions over task-year-source country cells (2,653 observations for activities and 1,485 for performance requirementsover more rigid source countries, 6,657 observations for activities and 3,705 for performance requirements over lessrigid source countries than Germany), as reported in Tables D.20 and D.22, D.21 and D.23. 37 source countries withmore, 101 source countries with less rigid labor markets than Germany. Import value of embedded tasks imputedusing 7-year lags of German task shares by sector. Services activities 3, 11 and 12 not reported in graphs, performancerequirement I missing in 2006, requirement D dropped to avert multi-collinearity. Coefficients β from log importvalue regressions reported as exp{β} to reflect relative import frequencies. Omitted baseline activity 1 Manufacture,Produce Goods, omitted baseline performance requirement E Work procedures prescribed in detail in each surveywave. Log scale on vertical axis.
Figure 8: Activity Content and Performance Requirements Embedded in German Importsby Foreign Labor-market Rigidity
21

commonly considered little offshorable. These changes occur mostly within sectors and occupa-tions, emphasizing the importance of time-varying task measures. During this period, the bulk ofGerman imports is destined for intermediate use and German imports expand mostly in sectors thatare intensive in job performance requirements commonly considered highly offshorable. Foreignlabor-market institutions are largely unrelated to the observed changes in German trade patterns,while unionization rates in Germany exhibit some covariation consistent with faster change inactivity content of German work in weakly unionized sectors.
In ongoing research, we infer the activity content and intensity of performance requirementsbehind trade flows using sector and occupation information from ILO data (Appendix C) andaugment our trade data to include services trade flows.
22
Appendix
A BIBB SurveyWe use the German Qualification and Career Survey (Qualifikation und Berufsverlauf ) to inferthe time varying workplace characteristics and to obtain detailed worker characteristics. Since itsinception, the survey was conducted in varying collaborations between federal goverment agenciesand has meanwhile been renamed to German work survey (Erwerbstatigenbefragung). The surveyhas been conducted in five waves—in 1979, 1985-86, 1991-92, 1998-99 and 2005-06—by theGerman Federal Institute for Vocational Education and Training (Bundesinstitut fur BerufsbildungBIBB) and collaborating agencies.9 In each wave, the random worker sample represents aroundone tenth of a percent of the German labor force. We refer to this data source as the BIBB worksurvey, or just BIBB survey for short.
The BIBB survey reports workplace information in multiple ways. First, the BIBB surveyasks workers to state whether or not they perform activities from a given list. These reportedactivities have been used in earlier research by Spitz-Oener (2006), for instance. Second, the BIBBsurvey asks workers whether they use tools from a given list to carry out their work, and about themain tool used. Reported tool use has been extracted for research by, for instance, DiNardo andPischke (1997, pencil and computer use) and Becker et al. (2009, in a globalization context) before.Given varying collaborations between agencies and shifting interests over time, surveyed activities(and tool uses) differ across waves and we carefully create longitudinally consistent time series.Third, the BIBB survey asks about job performance requirements and skill requirements. To ourknowledge, those are largely unexplored workplace characteristics from the BIBB survey and webuild variables based on job performance requirements.
In this paper, we restrict our attention to longitudinally consistent definitions of activity content,which we prepare for all five waves in a time consistent way, and job performance requirements,which we prepare for the first time.
A.1 Longitudinally consistent Activity definitionsBIBB reports a worker’s workplace activity (Tatigkeit) on the job in addition to common occu-pation codes. Table A.1 presents our longitudinally consistent definition of activities. The BIBBsurvey recognizes 51 distinct activities in the 1979 wave, but only 18 in 1985-86 and 1991-92,and 16 in 1998-99 and 2005-06. Not only the number of activities but also the activity definitionschange over time. We define 15 longitudinally consistent activities, as shown in Table A.1. Thecolumns report the variables in the BIBB data that characterize an activity and the values a variableneeds to take so that our longitudinal concordance marks an activity as performed by a worker.
9Collaborating agencies include the Institute for Employment Research (Institut fur Arbeitsmarkt- und Berufsfor-schung) at the Federal Employment Agency (Bundesagentur fur Arbeit) in Nuremberg from 1979 through 1999 andthe Federal Institute for Occupational Safety and Health (Bundesanstalt fur Arbeitsschutz und Arbeitsmedizin BAuA)in Dortmund in 2005-06.
23

Tabl
eA
.1:
LO
NG
ITU
DIN
AL
LYC
ON
SIS
TE
NT
AC
TIV
ITY
DE
FIN
ITIO
NS
Act
ivity
1979
1985
-86
1991
-92
1998
-99
2005
-06
1.M
anuf
actu
re,P
rodu
ceG
oods
2.R
epai
r,M
aint
ain
3.E
nter
tain
,Acc
omm
odat
e,Pr
epar
eFo
ods
4.Tr
ansp
ort,
Stor
e,D
ispa
tch
5.M
easu
re,I
nspe
ct,C
ontr
olQ
ualit
yentries
6.G
athe
rInf
orm
atio
n,D
evel
op,R
esea
rch,
Con
stru
ctavailable
7.Pu
rcha
se,P
rocu
re,S
ell
uponrequest
8.Pr
ogra
ma
Com
pute
r9.
App
lyL
egal
Kno
wle
dge
10.C
onsu
ltan
dIn
form
11.T
rain
,Tea
ch,I
nstr
uct,
Edu
cate
12.N
urse
,Loo
kA
fter
,Cur
e13
.Adv
ertis
e,Pr
omot
e,C
ondu
ctM
arke
ting
and
PR14
.Org
aniz
e,Pl
an,P
repa
re(o
ther
s’w
ork)
15.O
vers
ee,C
ontr
olM
achi
nery
and
Tech
n.Pr
oces
ses
Not
es:V
aria
ble
nam
esas
inB
IBB
surv
eys.
Ent
ries
show
valu
esth
ata
vari
able
need
sto
take
soth
atit
ism
arke
das
bein
gpe
rfor
med
.
24

In some waves (1979, 1991-92), the worker is asked the binary question whether he or sheperforms an activity on the job. In other waves (1985-86, 1998-99 and 2005-06), the workeris asked to classify into three categories whether he or she performs a given activity frequently,infrequently or not at all. For longitudinal consistency, we reduce the three-category classificationin the latter waves into a time-invariant binary classification as to whether an activity is performedat all or not. Our longitudinally consistent activity definitions ensure that there are no missingactivities in any survey wave.
In defining our 15 longitudinally consistent activities, as shown in Table A.1, we made thefollowing adjustments to the mapping for three waves. Without these adjustments, our 15 lon-gitudinally consistent activities would have to be aggregated into 11 categories. To improve onmappings for the three slightly cruder waves of the BIBB survey, we use the following informa-tion from earlier waves that permits a strict many-to-one mapping: we apply the observed activityshares in earlier more detailed waves by single-digit KldB-88 occupation (Subsection A.3), gender,and industry (Subsection A.4) to randomly impute by worker the most likely detailed activity fora small set of activities in the waves 1985-86, 1991-92 and 1998-99.
Concretely, in wave 1985-86 a strict mapping of v28 (apply and interpret laws and regulations,certify) to 9 only and v29 (educate, instruct, train, guide vocationally) to 11 only would result in acompletely missing activity 10 for the wave; and a strict mapping of v23 (buy, sell, intermediate,attend customers, negotiate, promote) to 7 only would result in missing activity 13. Instead ofaggregating activities 9, 10 and 11 into a single activity and activities 7 and 13 into another singleactivity, we use the 1979 wave that permits a strict many-to-one mapping and apply the share ofactivity 10 in 9 and 10 for v28 and the share of 10 in 10 and 11 for v29 to map to 10, and the 1979share of activity 13 in 7 and 13 to map v23 to 13. Similarly, in wave 1991-92, a strict mappingof v59 (apply and interpret laws and regulations, certify) to 9 only and v60 (educate, instruct,train, guide vocationally) to 11 only would result in a completely missing activity 10 for the wave;and a strict mapping of v54 (buy, sell, intermediate, attend customers, promote) to 7 only wouldresult in missing activity 13. Instead of aggregating activities 9, 10 and 11 into a single activityand activities 7 and 13 into another single activity, we use the 1979 wave that permits a strictmany-to-one mapping and apply the share of activity 10 in 9 and 10 for v59 and the share of 10 in10 and 11 for v60 to map to 10, and the 1979 share of activity 13 in 7 and 13 to map v54 to 13.Finally, in wave 1998-99, a strict mapping of v201 (support, serve, take care of persons) to 12 onlywould result in a completely missing activity 3 for the wave. Instead of aggregating activities 3 and12 into a single activity, we use the 1991-92 wave that offers the most recent strict many-to-onemapping and apply the share of activity 3 in 3 and 12 to map v201 to 3.
We only retain activities that match up in every single wave. As a consequence, some activitiesthat are reported in richer waves cannot be related to any of our 15 longitudinally consistent ac-tivities. In the 1979 wave, numerous activities and groups of activities remain unmatched: Collectand dispose of garbage (v200), Construct and improve buildings and equipment, install, assemble(v149-v153), Keep stock and inventory accounts (v178), Negotiate and represent interests (v213),Pack, load, dispatch, deliver (v160, v162, v164), Cultivate and harvest plants, breed and farmanimals (v130-v135), Publish, entertain, perform, create artistically (v209-211), Clean, iron andpress, dry-clean (v158-v159), Mine, quarry, convey and produce primary products (v136-v137),
25

Type, handle correspondence and forms (v188-v192), Protect, safeguard and regulate (buildings,traffic, work safety) (v198-v199), Arrange and sort, file, mark, archive (v161, v163, v182), Make,bake, distill, prepare (v142). In the 1985-86 wave, the following six activities remain unmatched:Cultivate, breed, farm; mine, quarry, convey (v15), Construct, improve, install, assemble (v17),Iron and press, dry-clean; collect and dispose of garbage (v19), Handle correspondence and forms(v24), Safeguard and regulate (buildings, work safety), protect (v27), Publish, entertain, perform(v31). In the 1991-92 wave, the following ten activities remain unmatched: Cultivate and harvestplants, breed and farm animals (v43), Mine, quarry, convey and produce primary products (v44),Construct and improve buildings and equipment, install, assemble (v46), Clean, iron and press,dry-clean (v48), Pack, load, dispatch, deliver (v50), Arrange and sort, file, mark, archive (v51),Type, handle correspondence and forms (v55), Protect, safeguard and regulate (buildings, traffic,work safety) (v58), Collect and dispose of garbage (v49), Publish, entertain, perform, create ar-tistically (v62). In the 1998-99 wave, the following single activity remains unmatched: Conductnegotiations (v198). In the 2005-06 wave, the following three activities remain unmatched: Clean,dispose of garbage, recycle (F319A), Secure, protect, safeguard, monitor, regulate traffic (F317),Work with computers (F318).
A.2 Longitudinally consistent Job Performance Requirement definitionsBIBB asks the worker to report the intensity of requirements to perform a job (Arbeitsanforde-rungen). Table A.2 presents our longitudinally consistent definition of these job performance re-quirements. The columns report the variables in the BIBB data that characterize a performancerequirement and the values a variable needs to take so that our longitudinal concordance marks aperformance requirement as applicable to a worker at given intensity.
The BIBB survey recognizes 17 such performance requirements in the 1979 wave, 13 in 1985-86, 9 in 1991-92, and 14 each in 1998-99 and 2005-06. Out of those variables, we create ninelongitudinally consistent job performance requirement definitions so that, for none of the perfor-mance requirements, information is missing for more than one survey year.
In the first four waves from 1979 through 1999, the surveyed worker ranks the frequencywith which these performance requirements are applicable on a scale from 1 through 5 (5 “al-most never”, 4 “seldom”, 3 “occasionally”, 2 “frequently”, 1 “almost always”). In the final wave2005-06, the worker is given a scale from 1 through 4 (4 “never”, 3 “seldom”, 2 “occasionally”,1 “frequently”). We map these intensity measures into a new scale of 1 through 4 (1 “never oralmost never”, 2 “seldom”, 3 “occasionally”, 4 “frequently or almost always”), inverting the rankordering to be increasing with the frequency of the requirement and mapping the two most fre-quent categories of the four early waves (“frequently” and “almost always”) into a single category(“frequently or almost always”).
A.3 Longitudinally consistent Occupation definitionsThe Federal Employment Agency (Bundesagentur fur Arbeit) in Nuremberg and its research outfitInstitute for Employment Research (Institut fur Arbeitsmarkt- und Berufsforschung) maintain the
26

Tabl
eA
.2:
LO
NG
ITU
DIN
AL
LYC
ON
SIS
TE
NT
JOB
RE
QU
IRE
ME
NT
DE
FIN
ITIO
NS
BY
INT
EN
SIT
Y
Task
and
Inte
nsity
(1-4
)19
7919
85-8
619
91-9
219
98-9
920
05-0
6A
.Dea
dlin
es/p
ress
ure
tope
rfor
m1
A.D
eadl
ines
/pre
ssur
eto
perf
orm
2A
.Dea
dlin
es/p
ress
ure
tope
rfor
m3
A.D
eadl
ines
/pre
ssur
eto
perf
orm
4B
.Im
prov
e/ad
optn
ewte
chni
ques
1entries
B.I
mpr
ove/
adop
tnew
tech
niqu
es2
available
B.I
mpr
ove/
adop
tnew
tech
niqu
es3
uponrequest
B.I
mpr
ove/
adop
tnew
tech
niqu
es4
C.N
ewsi
tuat
ions
/act
iviti
es1
C.N
ewsi
tuat
ions
/act
iviti
es2
C.N
ewsi
tuat
ions
/act
iviti
es3
C.N
ewsi
tuat
ions
/act
iviti
es4
G.M
inim
umpe
rfor
man
ce/ti
me/
quan
tity
give
nto
exec
ute
activ
ity1a
27

D.R
epea
ted
wor
kst
eps
1D
.Rep
eate
dw
ork
step
s2
D.R
epea
ted
wor
kst
eps
3D
.Rep
eate
dw
ork
step
s4
E.W
ork
proc
edur
espr
escr
ibed
inde
tail
1E
.Wor
kpr
oced
ures
pres
crib
edin
deta
il2
E.W
ork
proc
edur
espr
escr
ibed
inde
tail
3E
.Wor
kpr
oced
ures
pres
crib
edin
deta
il4
F.Fi
nanc
iall
osse
sby
smal
lmis
take
s1a
F.Fi
nanc
iall
osse
sby
smal
lmis
take
s2a
entries
F.Fi
nanc
iall
osse
sby
smal
lmis
take
s3a
available
F.Fi
nanc
iall
osse
sby
smal
lmis
take
s4a
uponrequest
G.M
inim
umpe
rfor
man
ce/ti
me/
quan
tity
give
nto
exec
ute
activ
ity1a
G.M
inim
umpe
rfor
man
ce/ti
me/
quan
tity
give
nto
exec
ute
activ
ity2a
G.M
inim
umpe
rfor
man
ce/ti
me/
quan
tity
give
nto
exec
ute
activ
ity3a
G.M
inim
umpe
rfor
man
ce/ti
me/
quan
tity
give
nto
exec
ute
activ
ity4a
H.V
ersa
tility
/mul
tiple
activ
ities
atsa
me
time
1a
H.V
ersa
tility
/mul
tiple
activ
ities
atsa
me
time
2a
H.V
ersa
tility
/mul
tiple
activ
ities
atsa
me
time
3a
H.V
ersa
tility
/mul
tiple
activ
ities
atsa
me
time
4a
I.C
once
ntra
tion
onac
tivity
1b
I.C
once
ntra
tion
onac
tivity
2b
I.C
once
ntra
tion
onac
tivity
3b
I.C
once
ntra
tion
onac
tivity
4b
a Mis
sing
in19
92.
b Mis
sing
in20
0F.
Not
es:
Var
iabl
ena
mes
asin
BIB
Bsu
rvey
s.In
tens
ityra
nkin
g:1
“nev
eror
alm
ostn
ever
”,2
“sel
dom
”,3
“occ
asio
nally
”,4
“fre
quen
tlyor
alm
osta
lway
s”.
Ent
ries
show
valu
esth
ata
vari
able
need
sto
take
soth
atit
ism
arke
das
bein
gpe
rfor
med
with
agi
ven
inte
nsity
.
28

Table A.3: LONGITUDINALLY CONSISTENT OCCUPATION DEFINITIONS
Occupation classification KldB-88 1979 1985-86 1991-92 1998-99 2005-06
Occupation units, 3-digit level (369) v5(319)
Occupation classes, 4-digit level (2,287) v16 v9 F100 BA(1,329) (1,117) (983)
Individual KldB-88 occupations, 6-digit level v67(2,982)
Notes: Occupation codes according to KldB-88 (Klassifizierung der Berufe 1988), maintained by the Federal Employ-ment Agency, Nuremberg. Entries in brackets show the number of unique reported occupations at a given classificationlevel.
detailed Classification of Occupations called KldB-88 (Klassifizierung der Berufe 1988) for inter-nal reporting and research. The BIBB data from 1979 through 2006 consistently use the KldB-88classification in every wave at the 3-digit level so that no longitudinal treatment is needed at thatlevel.
The KldB-88 classification recognizes 6 occupation areas (Berufsbereiche) at the single-digitlevel, 33 occupation sections (Berufsabschnitte) at an intermediate level, 88 occupation groups(Berufsgruppen) at the 2-digit level, and 369 occupation units (Berufsordnungen) at the 3-digitlevel. At the 3-digit occupation-unit level, occupation classifications are available in all BIBBwaves from 1979 through 2006. The KldB-88 specifies 2,287 occupation classes (Berufsklassen)at the 4-digit level, and all but the one wave 1985/86 adopt at least the 4-digit occupation-classlevel.10 Table A.3 summarizes the available occupation information in the public-use version ofthe BIBB data.
For an understanding of occupation frequencies and their evolution, we tabulate the distribu-tion of the six occupation areas (Berufsbereiche) at the single-digit level in KldB-88. Table A.4shows that the importance of technical and services professionals grows over time whereas that ofother occupation areas (most importantly manufacturing workers) declines over time. This pro-vides evidence of a shift of the occupation distribution towards more white-collar occupations.The high frequency of services occupations throughout all periods also documents an importantclassification convention under KldB-88.
We reclassify occupation information for every wave to KldB-88 occupation units at the 3-digitlevel. In wave 1979 there are are 19 occupation units at the 3-digit level with no matching infor-mation in the KldB-88 classification (affecting 195 out of 29,737 observations); in wave 1985/86there is one occupation unit at the 3-digit level with no matching information in KldB-88 (af-fecting 160 out of 26,361 observations); in wave 1991/92 there are four occupation units at the3-digit level with no matching information in KldB-88 (affecting four out 34,277 observations).Given the small fraction of affected observations, we keep those unmatched occupation units as
10There are numerous individual occupations at the 7-digit level recognized by the Federal Employment Agency, butnot used in BIBB. The public-use version of the 1979 BIBB wave records 2,982 KldB-88 occupations at the six-digitlevel.
29

Table A.4: OCCUPATION AREAS
1979 1986 1992 1999 2006(1) (2) (3) (4) (5)
1 Farmers, Fishermen .028 .033 .027 .021 .0182 Miners, Quarriers .004 .003 .003 .002 .00083 Manufacturing Occupations .294 .296 .295 .241 .1894 Technical Occupations .069 .062 .075 .067 .0795 Services Occupations .564 .600 .592 .659 .7096 Other Workers .005 .002 .007 .009 .005missing .036 .005 .00003 0 .0003
Source: BIBB 1979-2006.Notes: 144,718 worker observations. Occupation areas according to KldB-88 (Berufsbereiche der Klassifizierung derBerufe 1988).
longitudinally undetermined, special occupations.Conversions of KldB-88 to other official German occupation classifications are problematic,
however. The KldB-88 classification in the BIBB data deviates from the official Federal StatisticalOffice’s Classification of Occupations in 1975 and 1992 (called KldB-75 and KldB-92). To ourknowledge, there is no converter from KldB-88 to either KldB-75 or KldB-92 and therefore also noofficial converter to the International Standard Classification of Occupations ISCO-68 or ISCO-88(or the intra-European version ISCO-88(COM)). Although the most recent KldB-88 classificationby the Federal Employment Agency and the most recent KldB-92 classification by the FederalStatistical Office are both based on a common classification from 1970 (KldB-70 reflecting theoccupational stricture of the 1950 and 1960s), cross-walks are ambiguous. Conversions betweenKldB-88 and KldB-92 are imprecise at any level, as Alfons Geis (GESIS Mannheim) reports.Using the 4,910 dictionary entries that characterize unambiguous occupation terms, 97 percent ofoccupations coincide between KldB-88 and KldB-92 at the single-digit level and 88 percent at the2-digit level, but only 65 percent at the 3-digit level and merely 38 percent at the 4-digit level.
An attempted conversion of KldB-88 to the International Standard Classification of Occupa-tions ISCO-88 suffers frequent ambiguities. In the 2005-06 BIBB survey wave, occupations forall 20,000 surveyed workers are coded both under the KldB-88 system at the 4-digit level (occu-pation classes) and under the ISCO-88 system at the four-digit level.11 This allows us to assessthe conversion quality from KldB-88 4-digit level occupation classes to ISCO-88 at any level. TheISCO-88 classification recognizes 10 major groups at the single-digit level, 28 sub-major groupsat the 2-digit level, 118 minor groups at the 3-digit level, and 390 unit groups at the 4-digit level.Whereas the official KldB-92 used by the German statistical office is widely considered to permita fairly precise mapping from the KldB 4-digit level to the ISCO-88 3-digit level, considerableproblems arise for the KldB-88 used in the BIBB survey (and at the German Federal EmploymentAgency more generally). Table A.5 reports the ambiguities. There are 2,287 occupation classes at
11They are also coded under KldB-88.
30

Table A.5: IMPLIED CONCORDANCES FROM KLDB-88 TO ISCO-88 IN 2005-06 WAVE
Duplicate KldB-88 ISCO-88occupation classes major groups sub-major groups minor groups unit groups(4-digit level) (4-digit) (3-digit) (2-digit) (1-digit)
Unique 783 818 828 850Single duplicates 141 119 122 1112 duplicates 41 32 25 193 duplicates 7 5 4 34 duplicates 4 3 35 duplicates 2 2 16 duplicates 2 37 duplicates 1 18+ duplicates 2Total 983 983 983 983
Notes: Occupation codes according to KldB-88 (Klassifizierung der Berufe 1988), maintained by the Federal Em-ployment Agency, Nuremberg. Attempted mappings from up to 2,287 KldB-88 occupation classes (4-digit level)to ISCO-88 at all levels (single-digit major groups, 2-digit sub-major groups, 3-digit minor groups and 4-digit unitgroups), using occupation records under both systems in the BIBB Survey wave 2005-06 (20,000 individual workers).Of the 2,287 existing KldB-88 occupation classes, the 20,000 sample workers fill 983 unique occupation classes.
the KldB-88 4-digit level, but the 20,000 workers in the 2005-06 wave fill only 983 of these occu-pation classes. Of these 983 occupation classes, the implied mapping from KldB-88 to ISCO-88major groups in the 2005-06 wave touches 310 occupation classes more than once so that KldB-88cannot be uniquely mapped to ISCO-88 major groups. While the ambiguities decrease, they do notgo away even for an attempted mapping to ISCO-88 unit groups at the single-digit level. For anattempting conversion to this crudest ISCO-88 level, only 850 KldB-88 occupation classes satisfya one-to-many mapping, whereas 133 KldB-88 occupation classes cannot be assigned unambigu-ously.
A.4 Longitudinally consistent Sector definitionsWe define a set of longitudinally consistent sectors in BIBB. These sectors are also defined in sucha way as to concord trade and other outside data uniquely (in a many-to-one mapping) to a singleset of longitudinally consistent sector definitions.
BIBB classifies an employer’s sector at different levels of aggregation over time. Table A.6presents our longitudinally consistent definition of sectors. In the first four waves 1979, 1985-86,1991-92 and 1998-99, BIBB used a sector classification of its own, loosely related to common Ger-man or European classification systems. With the last wave in 2005-06, the BIBB survey adopteda sector classification closely resembling NACE 1.1 for the European Communities (Nomenclaturegenerale des Activites economiques dans les Communautes Europeenness Revision 1.1 which isequivalent to the German Klassifikation der Wirtschaftszweige WZ 2003 at the 2-digit level).
31

Tabl
eA
.6:
LO
NG
ITU
DIN
AL
LYC
ON
SIS
TE
NT
SE
CT
OR
DE
FIN
ITIO
NS
Agg
rega
teSe
ctor
1979
1985
-86
1991
-92
1998
-99
2005
-06
1.A
gric
ultu
rean
dL
ives
tock
Prod
uctio
n2.
Ene
rgy
Supp
ly,W
ater
,Gas
and
Ele
ctri
city
3.M
inin
g4.
Man
ufac
ture
ofC
hem
ical
s,R
ubbe
rand
Plas
ticPr
oduc
ts5.
Man
ufac
ture
ofN
on-m
etal
licM
iner
alPr
oduc
ts6.
Iron
and
Stee
lInd
ustr
ies,
Man
ufac
ture
ofB
asic
Met
alPr
oduc
ts7.
Man
ufac
ture
ofFa
bric
ated
Met
alPr
oduc
ts8.
Man
ufac
ture
ofM
achi
nery
and
Equ
ipm
ent
9.M
anuf
actu
rean
dR
epai
rofR
oad
Tran
spor
tEqu
ipm
ent
entries
10.M
anuf
actu
rean
dR
epai
rofA
ircr
afta
ndSh
ips
available
11.M
anuf
actu
reof
Com
putin
gan
dO
ffice
Equ
ipm
ent
uponrequest
12.M
anuf
actu
reof
Ele
ctri
calE
quip
men
tand
App
arat
us13
.Man
ufac
ture
ofM
echa
nica
land
Opt
ical
Equ
ipm
ent,
Wat
ches
14.M
anuf
actu
reof
Mis
cella
neou
sPr
oduc
tsa
15.M
anuf
actu
reof
Woo
dPr
oduc
tsan
dFu
rnitu
re16
.Man
ufac
ture
ofPa
pera
ndPa
perP
rodu
cts
17.P
rint
ing
and
Rep
rodu
ctio
n18
.Man
ufac
ture
ofL
eath
eran
dL
eath
erPr
oduc
ts,S
hoes
19.M
anuf
actu
reof
Text
iles
and
App
arel
20.M
anuf
actu
reof
Food
,Bev
erag
es,T
obac
co33
.Oth
erPr
ivat
eSe
rvic
es72
-73,
29-3
0,29
-30,
2,29
-30,
37,7
0-73
,76
-77,
6161
-62
63-6
4,90
,92-
93,
81-8
6,90
66-6
795
,98
a Incl
udin
gM
anuf
actu
reof
Mis
cella
neou
sM
etal
Prod
ucts
,Mus
icIn
stru
men
ts,T
oys,
Spor
tsE
quip
men
t,Je
wel
lery
.
32

6.Ir
onan
dSt
eelI
ndus
trie
s,M
anuf
actu
reof
Bas
icM
etal
Prod
ucts
17-2
013
1313
2721
.Con
stru
ctio
n22
.Oth
erM
anuf
actu
ring
,Cra
ftor
Trad
e24
.Mai
land
Tele
com
mun
icat
ions
Serv
ices
25.T
rans
port
atio
nan
dL
ogis
tics
26.B
anki
ngan
dIn
sura
nce
27.H
otel
s,R
esta
uran
tsentries
28.N
ursi
ngH
omes
,Hos
pita
ls,H
ealth
Prof
essi
onal
savailable
31.E
duca
tion
uponrequest
32.O
ffice
sof
Self
-em
ploy
edPr
ofes
sion
als
33.O
ther
Priv
ate
Serv
ices
34.C
ivil,
Eco
nom
ican
dR
elig
ious
Ass
oc.,
Polit
ical
Part
ies
35.P
ublic
Sect
or36
.Who
lesa
leTr
ade
38.R
etai
lTra
de39
.Not
else
whe
recl
assi
fied,
nota
pplic
able
orm
issi
ng
Not
es:S
ecto
rcod
esas
inB
IBB
surv
eys,
vari
able
sv7
3(1
979)
,v8
(198
5-86
),v2
0(1
991-
92),
v134
(199
8-99
),F5
13N
AC
E(2
005-
06).
33
The BIBB survey recognizes 100 distinct industries in the 1979 wave, but only 42 in 1985-86, 43 in 1991-92, 51 in 1998-99 and 65 in 2005-06. Not only the number of industries but alsothe industry classifications change over time. We define 39 longitudinally consistent industries(including one code for not elsewhere classified industries, not applicable classifications or missinginformation), as shown in Table A.6.
In defining our 39 longitudinally consistent industries for the full 1979-2006 period, as shownin Table A.6, we made adjustments to the mapping for certain services sectors so as to accom-modate the 2005-06 wave, which is more aggregate in four specific services sectors. Contraryto the BIBB sector classifications for 1979 through 1999, the NACE 1.1 classification in 2005-06does not break out Commercial Agents as separate from Wholesale Trade, does not break out Rail-way Transportation as separate from Transportation and Logistics, does not break out Laundryand Dry Cleaning as separate from Other Private Services and does not break out Hairdressingand Cosmetician Services as separate from Other Private Services. Since the more detailed BIBB1979-1999 sectors are services sectors with arguably small traded components across countries,we choose to fold them into the more aggregate NACE 1.1 classification for our 39 longitudinallyconsistent industries in Table A.6.
There are other time varying industry classifications, however, which require more elaboratetreatment. Without these elaborate adjustments, our longitudinally consistent industries wouldhave to be aggregated into 36 categories, three of which would be unreasonably diverse. To avoidunreasonably diverse industry groupings, we use occupational information at the 2-digit and 3-digit KldB-88 level (Subsection A.3) to switch select subgroups of workers in specific waves fromthree aggregate industries to more finely defined industries.
Concretely, in wave 1985-86 Hotels, restaurants, cafeterias, and nursing homes (55) are joinedin a single category (nursery homes in 55 are for the elderly or sick; nursery schools go in theeducation sector). Moreover, both in wave 1985-86 and in wave 1991-92, Offices of self-employeddoctors, lawyers, accountants and other professionals (57) are joined in a single category. Ifthese choices of aggregation were carried through to all waves in a longitudinally consistent way,a single and highly diverse pseudo-sector “Hotels, Restaurants, Nursing Homes, Hospitals, andOffices of Self-employed Professionals” would have to be formed. Instead, we use occupationalinformation in 1985-86 and 1991-92 to select health professionals with KldB-88 2-digit codes 84,85 and 86 from sectors Hotels, restaurants, cafeterias, and nursing homes (55 in wave 1985-86)and Offices of self-employed doctors, lawyers, accountants and other professionals (57 in waves1985-86 and 1991-92) and map them to our longitudinally consistent aggregate sector 28 (NursingHomes, Hospitals, Health Professionals).
In wave 2005-06, the NACE sector classification results in reassignments of individual eco-nomic activities to different industries than in the prior BIBB surveys between 1985 and 1999.Whereas BIBB assigns the Manufacture of wooden furniture (23 in waves 1985-86, 1991-92 and1998-99, 40 in wave 1979) to the general Manufacture of wood products, NACE lumps furnitureof any material to a diverse residual sector Manufacture of furniture; manufacturing n.e.c., whichalso includes the Manufacture of miscellaneous metal products, music instruments, toys, sportsequipment, and jewellery. To reduce heterogeneity and to make the 2005-06 data more closelycomparable to earlier waves, we use occupational information in 2005-06 to select furniture mak-
34

ers with KldB-88 3-digit code 492 (Upholsterers, mattress makers) or KldB-88 4-digit codes 5011or 5013 (Carpenters making mobile or built-in furniture) from the diverse residual sector Man-ufacture of furniture; manufacturing n.e.c. (36 in 2005-06) and map them to our longitudinallyconsistent aggregate sector 15 (Manufacture of Wood Products and Furniture). Similarly, whereasBIBB assigns the Repair of road transport equipment (16 in waves 1985-86, 1991-92 and 1998-99,30 in wave 1979) to the Manufacture and repair of road transport equipment, NACE assigns the re-pair of road transport equipment to the retail sector Sale, maintenance and repair of motor vehiclesand motorcycles, which also includes the retail sale of automotive fuel. For comparability to earlierwaves, we use occupational information in 2005-06 to select vehicle repair workers with KldB-883-digit codes 281 (Motor vehicle repairers), 282 (Agricultural machinery repairers) or 936 (Vehi-cle cleaners, servicers) from the retail sector Sale, maintenance and repair of motor vehicles andmotorcycles, retail sale of automotive fuel (50 in 2005-06) and map them to our longitudinallyconsistent aggregate sector 9 (Manufacture and Repair of Road Transport Equipment).
These reassignments for specific occupations help us avert diverse industry groupings. A down-side is, however, that occupations outside the core occupations of an industry—administrative staff,security personnel or cleaners in wooden furniture manufacturing say—will not be reassigned tothe specific industry in the respective years but remain with the more crudely assigned industry—manufacturing not elsewhere classified in the wooden furniture example.
B Trade Data
B.1 WTF Trade FlowsWe obtain trade flow data to and from Germany for the years 1979, 1985-86, 1991-92 from theWorld Trade Flows 1962-2000 database by Feenstra et al. (2005) and for the years 1998-99 and2005-06 from their recent revision files (2011). When applicable, we aggregate the individualcountry information from the recent files (for 1998-99 and 2005-06) to the same aggregate countrygroups as defined by (Feenstra et al. 2005) in the early years (1979, 1985-86 and 1991-92). Wetransform the US$ data to Euro and deflate them with the German CPI to the base year 1998.
We map the SITC Rev. 2 sector information to a common sector definition across all waves ofthe BIBB data. Our consistent sector definition across all data sources is based on an aggregationof NACE 1.1 for the European Communities, which is equivalent to the German Klassifikationder Wirtschaftszweige WZ 2003 at the 2-digit level (see Section A.4). To create a concordancefrom SITC Rev. 2 to the 39 longitudinally consistent industries, as shown in Table A.6, we rely onexisting mappings from SITC Rev. 2 to ISIC Rev. 3.1 and from ISIC Rev. 3.1 to WZ 2003. The WTFdata contain aggregates that partly differ from the strict SITC sector definitions using higher-levelaggregates. Whenever WTF aggregates would happen to enter more than one of our longitudinallyconsistent industries we use the mode of SITC 4-digit line items behind the aggregate to create aunique many-to-one mapping. Our final concordance sitc2aggsec06-completed is available uponrequest.
35

Table C.7: OCCUPATION CONCORDANCE ISCO-68 AND ISCO-88
Occupation ISCO-68 ISCO-881. Legislators, senior officials and managers 2 12. Professionals, technicians and assoc. professionals 0/1 2, 3, 2¬33. Clerical workers 3 44. Service workers and sales workers 4, 5, 4¬5 5, 5,0,5. Agricultural and fishery workers 6 66. Craft workers, production workers, laborers 7/8/9 7, 8, 9, 7¬8, 7¬9, 8,9
Note: Individual and combined ISCO occupation codes as in ILO Labour Statistics Database.
B.2 Imported Intermediate InputsTo infer the use of imported intermediate inputs by German sector, we collect the import matricesfrom input-output tables in 1978 (there is no input-output table for 1979), 1986, 1992, 1999 and2006 by the German Statistical Office destatis. We deflate all import values with the German CPIto the base year 1998.
The import matrices in 1992, 1999 and 2006 (Tabelle 1.2 Importmatrix zu cif-Preisen from2010) are reported in Euro and based on the German Klassifikation der Wirtschaftszweige WZ
2003 at the 2-digit level values, which we map to our 39 longitudinally consistent industries(Appendix A.4). The import matrices in 1978 and 1986 (Tabelle 1.3 Einfuhr von Waren undDienstleistungen zu Ab-Zoll Preisen from 2009) are based on sector definitions related to NACE
1.1 and Deutsche Mark values, which we map to our 39 longitudinally consistent industries (Ap-pendix A.4) and Euro. The mapping is incomplete only for our longitudinally consistent sector 33Other Private Services, which for 1978 and 1986 includes a fraction of 32 Offices of Self-employedProfessionals. We use the fraction of 32 in the sum of 32 and 33 for the years 1992, 1999 and 2006to impute the likely total of 32 Offices of Self-employed Professionals and reduce 33 Other PrivateServices accordingly in the the early years 1978 and 1986.
C ILO Labour StatisticsWe obtain the shares of occupations by country from the Labour Statistics Database by the Inter-national Labour Organization, Geneva, Table 2C (Total employment by occupation) for 1975-2007(extracted on 25/02/2009). At present, we retain only the information on the total of men andwomen. Between 1975 and 2007, some countries report occupations according to ISCO-68 (majorgroup), others according to ISCO-88 (major group). We map the reported major groups into asingle concordance with six occupation groups of our own as documented in Table C.7.
We remove the five countries that report incompatible occupational categories based on na-tional classification systems (Brunei Darussalam, Guam, Jamaica, Macau China, Niue); these areminor trade partners of Germany. Some countries report more aggregate occupation groups thanthe ISCO major groups, but many aggregates coincide with our mapping in Table C.7. There
36

are some cases, however, where countries report information in incompatible ways. In particular,managers are not separable from professionals in several reports: Barbados (2001), DominicanRepublic (1991-96), Syrian Arab Republic (2001) and Jamaica (1998-2006). We drop those coun-tries. Cuba (1995-2007) and the United Kingdom (1991-2007) report skilled agricultural workersnot separate from unskilled laborers (and craft and production workers). For the United King-dom is a large trade partner of Germany, we use information on employment by industry (fromthe Labour Statistics Database by the International Labour Organization, Geneva, Table 2E (Totalemployment by industry) for 1975-2007; extracted on 25/02/2009) to infer Cuba’s and the UK’semployment share of agriculture by year and split the aggregate occupation group into its likelymajor-group components. For Cuba, which reports agricultural workers and craft and productionworkers jointly, the share of agricultural jobs in the aggregate occupation group is broken out asthe share of agriculture and fishing vis-a-vis mining, manufacturing, and construction in a givenyear. For the United Kingdom in contrast, which reports agricultural workers and unskilled labor-ers jointly, employment by industry is not available for the years 1991-1995 and 2006-07 so thatwe choose instead to assign the joint group to agriculture work under the assumption that Britishlaborers are mostly employed in agriculture and that they perform relatively skilled tasks.
The Labour Statistics Database draws on various member-country sources for occupationalinformation. If a country reports information from more than one source in a given year, weretain only information from a single source and disregard lower-ranking sources according to thefollowing hierarchy (first being most relevant for precise occupational records): 1. labour-relatedestablishment census; 2. labour-related establishment survey; 3. labour force survey; 4. populationcensus; 5. household survey; 6. insurance records; 7. official estimates. Similarly, some countriesreport occupations under both ISCO-88 and ISCO-68 in a given year. In those cases, we retainISCO-88 information.
D Supporting TablesThe following supporting tables report the point estimates and their standard errors. We presentthe point estimates in Figure 2 (Tables D.8 and D.9), Figure 3 (Tables D.10 and D.11), Figure 4(Tables D.12 and D.13), Figure 5 (Tables D.14 and D.15), Figure 7 (Tables D.16 through D.17)and Figure 8 (Tables D.20 through D.23).
37

Table D.8: ACTIVITY CONTENT OF GERMAN WORK
Log Employment 1979 1986 1992 1999 2006(1) (2) (3) (4) (5)
2 Repair/Maintain .86 1.25 1.23 1.24 1.19(.02) (.05) (.05) (.03) (.05)
3 Entertain/Accommodate .69 .97 1.03 1.37 1.08(.04) (.08) (.06) (.11) (.10)
4 Transport/Store .84 1.14 1.18 1.30 1.25(.05) (.08) (.05) (.05) (.06)
5 Measure/Inspect .91 1.02 1.04 1.32 1.34(.05) (.09) (.07) (.05) (.06)
6 Analyze/Research .99 1.21 1.27 1.39 1.46(.08) (.09) (.08) (.11) (.09)
7 Purchase/Sell .90 1.23 1.21 1.32 1.26(.09) (.11) (.10) (.08) (.08)
8 Program Computer .62 .97 1.19 .77 .89(.04) (.08) (.09) (.04) (.05)
9 Practice Law .74 .93 .91 1.12 1.42(.10) (.10) (.08) (.10) (.11)
10 Consult/Inform .71 1.18 1.17 1.56 1.50(.08) (.14) (.12) (.10) (.09)
11 Train/Educate .85 1.13 1.09 1.29 1.33(.10) (.12) (.11) (.10) (.10)
12 Nurse/Cure 1.00 1.23 1.41 1.23 1.11(.10) (.13) (.15) (.11) (.10)
13 Advertise/Promote .70 .95 .94 1.24 1.30(.05) (.07) (.07) (.10) (.10)
14 Organize/Plan .88 1.24 1.39 1.45 1.37(.06) (.10) (.11) (.09) (.08)
15 Oversee/Control .77 1.20 1.24 1.16 1.16(.02) (.04) (.05) (.04) (.04)
Observations 168,466R2 (overall) .05
Source: BIBB 1979-2006, workers ages 16 through 65.Notes: 168,466 activity-year-gender-age-sector-occupation observations. Controlling for fixed effects of 2 genders, 50age groups, and 5 survey waves; omitted activity 1 Manufacture, Produce Goods in each survey wave. Coefficientsreported as exponential functions of coefficients from single log employment OLS regression (standard errors computedwith the Delta method) to measure the ratios of workers in an activity relative to activity 1 in each survey wave.Clustered standard errors in parentheses (two-way clustered at activity and sector level): ∗ significance at ten, ∗∗ five,∗∗∗ one percent.
38

Table D.9: ACTIVITY CONTENT OF GERMAN WORK WITHIN SECTOR AND OCCUPATION
Log Employment 1979 1986 1992 1999 2006(1) (2) (3) (4) (5)
2 Repair/Maintain .80 1.20 1.19 1.19 1.16(.03) (.06) (.06) (.02) (.04)
3 Entertain/Accommodate .56 .80 .83 1.15 .93(.06) (.11) (.08) (.07) (.07)
4 Transport/Store .73 1.04 1.04 1.22 1.21(.03) (.05) (.04) (.04) (.05)
5 Measure/Inspect .83 .93 .97 1.31 1.35(.02) (.04) (.04) (.04) (.06)
6 Analyze/Research .90 1.12 1.20 1.34 1.46(.04) (.05) (.06) (.08) (.09)
7 Purchase/Sell .79 1.08 1.08 1.23 1.20(.06) (.07) (.06) (.07) (.06)
8 Program Computer .48 .81 1.08 .70 .80(.03) (.05) (.06) (.03) (.03)
9 Practice Law .53 .73 .75 .96 1.37(.06) (.06) (.05) (.06) (.10)
10 Consult/Inform .53 .94 .97 1.54 1.51(.04) (.08) (.08) (.08) (.09)
11 Train/Educate .64 .91 .91 1.21 1.28(.06) (.08) (.08) (.07) (.08)
12 Nurse/Cure .66 .90 1.03 1.11 .98(.07) (.11) (.13) (.08) (.08)
13 Advertise/Promote .53 .71 .71 1.10 1.21(.03) (.05) (.05) (.08) (.08)
14 Organize/Plan .77 1.12 1.30 1.41 1.35(.02) (.05) (.07) (.07) (.07)
15 Oversee/Control .72 1.17 1.24 1.14 1.14(.03) (.05) (.07) (.03) (.04)
Observations 168,466R2 (overall) .24
Source: BIBB 1979-2006, workers ages 16 through 65.Notes: 168,466 activity-year-gender-age-sector-occupation observations. Controlling for fixed effects of 2 genders,50 age groups, 5 survey waves, 6 occupation areas and 35 sectors; omitted activity 1 Manufacture, Produce Goodsin each survey wave. Coefficients reported as exponential functions of coefficients from single log employment OLSregression (standard errors computed with the Delta method) to measure the ratios of workers in an activity relativeto activity 1 in each survey wave. Clustered standard errors in parentheses (two-way clustered at activity and sectorlevel): ∗ significance at ten, ∗∗ five, ∗∗∗ one percent.
39

Table D.10: PERFORMANCE REQUIREMENTS OF GERMAN WORK
Log Employment 1979 1986 1992 1999 2006(1) (2) (3) (4) (5)
A Deadlines/pressure to perform 1.17 1.17 1.20 1.28 1.20(.01) (.01) (.01) (.01) (.01)
B Improve/adopt new techniques .98 1.00 1.06 1.05 1.15(.02) (.01) (.01) (.02) (.01)
C New situations/activities 1.23 1.11 1.16 1.12 1.18(.02) (.01) (.01) (.02) (.009)
D Repeated work steps 1.16 1.13 1.13 1.12 1.13(.009) (.007) (.006) (.008) (.008)
F Financial loss by small mistake 1.05 .96 .99 .93(.01) (.008) (.01) (.01)
G Versatility/multiple activities 1.02 .89 .94 1.02(.01) (.01) (.009) (.008)
H Concentration on activity 1.19 1.13 1.11 1.20(.02) (.01) (.02) (.01)
I Minimum performance to execute 1.18 1.15 1.22 1.05(.01) (.01) (.01) (.01)
Observations 180,022R2 (overall) .04
Source: BIBB 1979-2006, workers ages 16 through 65.Notes: 180,022 requirement-year-gender-age-sector-occupation observations. Controlling for fixed effects of 2 gen-ders, 50 age groups, and 5 survey waves; omitted performance requirement E Work procedures prescribed in detail ineach survey wave. Coefficients reported as exponential functions of coefficients from single log employment OLS re-gression (standard errors computed with the Delta method) to measure the ratios of workers performing a requirementrelative to requirement E in each survey wave. Performance requirements F-H missing in 1992, requirement I missingin 2006. Clustered standard errors in parentheses (two-way clustered at performance-requirement and sector level): ∗
significance at ten, ∗∗ five, ∗∗∗ one percent.
40

Table D.11: PERFORMANCE REQUIREMENTS OF GERMAN WORK WITHIN SECTOR AND OC-CUPATION
Log Employment 1979 1986 1992 1999 2006(1) (2) (3) (4) (5)
A Deadlines/pressure to perform 1.21 1.21 1.27 1.37 1.27(.02) (.02) (.02) (.03) (.02)
B Improve/adopt new techniques .99 1.02 1.09 1.09 1.20(.02) (.02) (.03) (.04) (.02)
C New situations/activities 1.28 1.14 1.22 1.17 1.24(.03) (.02) (.03) (.03) (.02)
D Repeated work steps 1.19 1.15 1.17 1.16 1.16(.02) (.02) (.01) (.02) (.009)
F Financial loss by small mistake 1.08 .97 1.01 .93(.02) (.02) (.02) (.02)
G Versatility/multiple activities 1.03 .89 .94 1.04(.01) (.02) (.01) (.02)
H Concentration on activity 1.24 1.16 1.16 1.26(.02) (.02) (.03) (.02)
I Minimum performance to execute 1.24 1.20 1.29 1.08(.02) (.02) (.03) (.02)
Observations 180,022R2 (overall) .28
Source: BIBB 1979-2006, workers ages 16 through 65.Notes: 180,022 requirement-year-gender-age-sector-occupation observations. Controlling for fixed effects of 2 gen-ders, 50 age groups, 5 survey waves, 6 occupation areas and 35 sectors; omitted performance requirement E Workprocedures prescribed in detail in each survey wave. Coefficients reported as exponential functions of coefficientsfrom single log employment OLS regression (standard errors computed with the Delta method) to measure the ratiosof workers performing a requirement relative to requirement E in each survey wave. Performance requirements F-H missing in 1992, requirement I missing in 2006. Clustered standard errors in parentheses (two-way clustered atperformance-requirement and sector level): ∗ significance at ten, ∗∗ five, ∗∗∗ one percent.
41
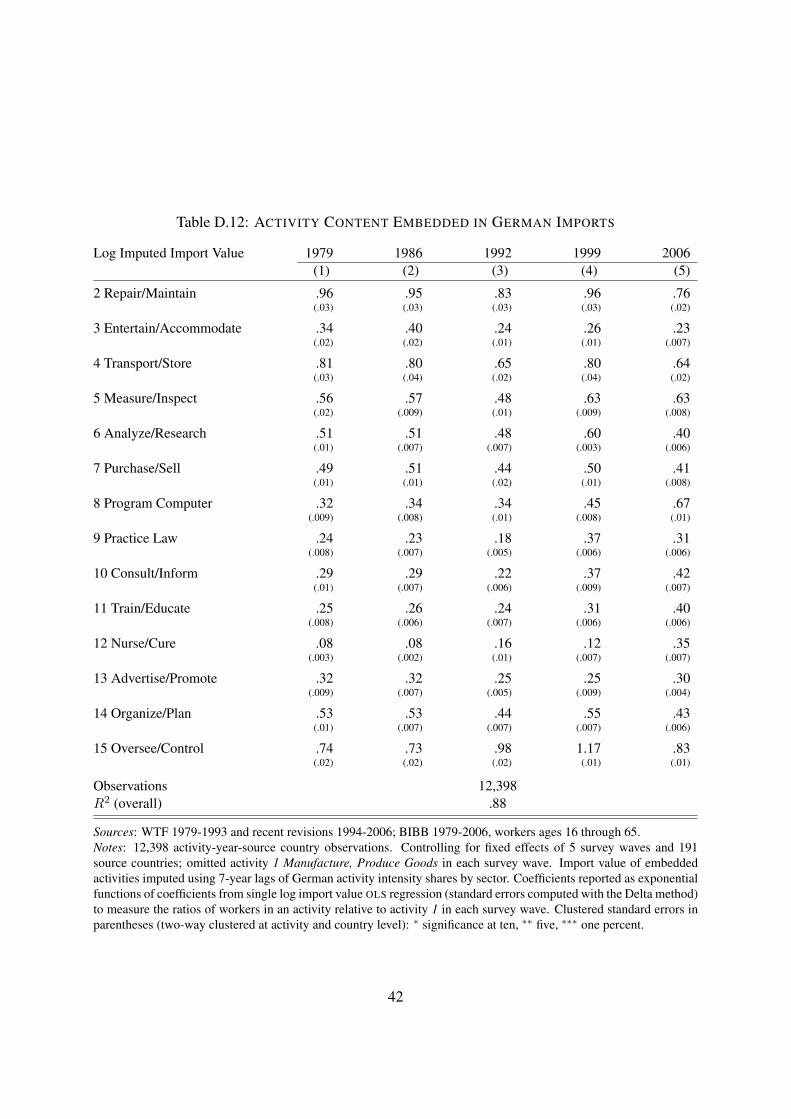
Table D.12: ACTIVITY CONTENT EMBEDDED IN GERMAN IMPORTS
Log Imputed Import Value 1979 1986 1992 1999 2006(1) (2) (3) (4) (5)
2 Repair/Maintain .96 .95 .83 .96 .76(.03) (.03) (.03) (.03) (.02)
3 Entertain/Accommodate .34 .40 .24 .26 .23(.02) (.02) (.01) (.01) (.007)
4 Transport/Store .81 .80 .65 .80 .64(.03) (.04) (.02) (.04) (.02)
5 Measure/Inspect .56 .57 .48 .63 .63(.02) (.009) (.01) (.009) (.008)
6 Analyze/Research .51 .51 .48 .60 .40(.01) (.007) (.007) (.003) (.006)
7 Purchase/Sell .49 .51 .44 .50 .41(.01) (.01) (.02) (.01) (.008)
8 Program Computer .32 .34 .34 .45 .67(.009) (.008) (.01) (.008) (.01)
9 Practice Law .24 .23 .18 .37 .31(.008) (.007) (.005) (.006) (.006)
10 Consult/Inform .29 .29 .22 .37 .42(.01) (.007) (.006) (.009) (.007)
11 Train/Educate .25 .26 .24 .31 .40(.008) (.006) (.007) (.006) (.006)
12 Nurse/Cure .08 .08 .16 .12 .35(.003) (.002) (.01) (.007) (.007)
13 Advertise/Promote .32 .32 .25 .25 .30(.009) (.007) (.005) (.009) (.004)
14 Organize/Plan .53 .53 .44 .55 .43(.01) (.007) (.007) (.007) (.006)
15 Oversee/Control .74 .73 .98 1.17 .83(.02) (.02) (.02) (.01) (.01)
Observations 12,398R2 (overall) .88
Sources: WTF 1979-1993 and recent revisions 1994-2006; BIBB 1979-2006, workers ages 16 through 65.Notes: 12,398 activity-year-source country observations. Controlling for fixed effects of 5 survey waves and 191source countries; omitted activity 1 Manufacture, Produce Goods in each survey wave. Import value of embeddedactivities imputed using 7-year lags of German activity intensity shares by sector. Coefficients reported as exponentialfunctions of coefficients from single log import value OLS regression (standard errors computed with the Delta method)to measure the ratios of workers in an activity relative to activity 1 in each survey wave. Clustered standard errors inparentheses (two-way clustered at activity and country level): ∗ significance at ten, ∗∗ five, ∗∗∗ one percent.
42

Table D.13: PERFORMANCE REQUIREMENTS EMBEDDED IN GERMAN IMPORTS
Log Imputed Import Value 1979 1986 1992 1999 2006(1) (2) (3) (4) (5)
A Deadlines/pressure to perform 1.18 1.19 1.03 .87 .85(.03) (.02) (.03) (.01) (.01)
B Improve/adopt new techniques .98 .99 .90 .86 .85(.03) (.01) (.03) (.008) (.01)
C New situations/activities 1.12 1.11 1.03 1.01 .97(.03) (.01) (.03) (.008) (.01)
D Repeated work steps
F Financial loss by small mistake 1.13 1.14 1.00 1.06(.03) (.01) (1.49e-09) (.01)
G Versatility/multiple activities 1.09 1.09 1.00 1.14(.03) (.01) (5.89e-09) (.01)
H Concentration on activity 1.04 1.05 1.00 .87(.03) (.01) (1.10e-09) (.01)
I Minimum performance to execute 1.04 1.05 .94 .88(.03) (.01) (.03) (.007)
Observations 6,918R2 (overall) .89
Sources: WTF 1979-1993 and recent revisions 1994-2006; BIBB 1979-2006, workers ages 16 through 65.Notes: 6,918 performance requirement-year-source country observations. Controlling for fixed effects of 5 surveywaves and 191 source countries; omitted performance requirement E Work procedures prescribed in detail in eachsurvey wave. Import value of embedded performance requirements imputed using 7-year lags of German performancerequirements shares by sector. Coefficients reported as exponential functions of coefficients from single log importvalue OLS regression (standard errors computed with the Delta method) to measure the ratios of workers performing arequirement relative to requirement E in each survey wave. Performance requirements F-H missing in 1992, require-ment I missing in 2006, requirement D dropped to avert multi-collinearity. Clustered standard errors in parentheses(two-way clustered at performance-requirement and country level): ∗ significance at ten, ∗∗ five, ∗∗∗ one percent.
43

Table D.14: ACTIVITY CONTENT EMBEDDED IN GERMAN EXPORTS
Log Imputed Export Value 1979 1986 1992 1999 2006(1) (2) (3) (4) (5)
2 Repair/Maintain .83 1.05 1.20 .78 .70(.01) (.01) (.02) (.007) (.006)
3 Entertain/Accommodate .20 .18 .22 .33 .28(.002) (.002) (.002) (.003) (.002)
4 Transport/Store .49 .56 .71 .62 .55(.006) (.005) (.008) (.004) (.004)
5 Measure/Inspect .66 .88 .94 .70 .64(.01) (.009) (.01) (.005) (.005)
6 Analyze/Research .52 .60 .78 .49 .57(.007) (.004) (.007) (.003) (.004)
7 Purchase/Sell .38 .40 .46 .44 .47(.005) (.004) (.003) (.003) (.003)
8 Program Computer .55 .74 .82 1.11 .89(.009) (.009) (.01) (.01) (.008)
9 Practice Law .19 .27 .41 .37 .42(.002) (.001) (.003) (.002) (.003)
10 Consult/Inform .29 .31 .44 .47 .52(.004) (.003) (.005) (.003) (.004)
11 Train/Educate .23 .29 .34 .49 .54(.002) (.002) (.002) (.003) (.004)
12 Nurse/Cure .06 .07 .08 .32 .25(.0007) (.0008) (.0009) (.003) (.002)
13 Advertise/Promote .41 .43 .49 .37 .38(.005) (.003) (.004) (.003) (.002)
14 Organize/Plan .57 .57 .67 .49 .54(.008) (.004) (.006) (.003) (.004)
15 Oversee/Control .91 1.12 1.37 .87 .77(.02) (.008) (.01) (.007) (.005)
Observations 12,629R2 (overall) .93
Sources: WTF 1979-1993 and recent revisions 1994-2006; BIBB 1979-2006, workers ages 16 through 65.Notes: 12,629 activity-year-destination country observations. Controlling for fixed effects of 5 survey waves and 192destination countries; omitted activity 1 Manufacture, Produce Goods in each survey wave. Export value of embeddedactivities imputed using current German activity intensity shares by sector. Coefficients reported as exponential func-tions of coefficients from single log export value OLS regression (standard errors computed with the Delta method)to measure the ratios of workers in an activity relative to activity 1 in each survey wave. Clustered standard errors inparentheses (two-way clustered at activity and country level): ∗ significance at ten, ∗∗ five, ∗∗∗ one percent.
44

Table D.15: PERFORMANCE REQUIREMENTS EMBEDDED IN GERMAN EXPORTS
Log Imputed Export Value 1979 1986 1992 1999 2006(1) (2) (3) (4) (5)
A Deadlines/pressure to perform .95 .89 .95 .97 .99(.02) (.004) (.006) (.007) (.006)
B Improve/adopt new techniques .85 .88 .95 .97 .99(.01) (.004) (.006) (.007) (.006)
C New situations/activities .91 .88 .93 .93 .93(.02) (.005) (.005) (.006) (.006)
D Repeated work steps
F Financial loss by small mistake 1.03 1.08 1.18 1.29(.02) (.005) (.009) (.009)
G Versatility/multiple activities 1.07 1.17 1.15 1.05(.02) (.006) (.008) (.008)
H Concentration on activity .88 .85 .94 .94(.02) (.004) (.007) (.007)
I Minimum performance to execute .92 .91 .94 1.07(.02) (.005) (.006) (.008)
Observations 6,882R2 (overall) .93
Sources: WTF 1979-1993 and recent revisions 1994-2006; BIBB 1979-2006, workers ages 16 through 65.Notes: 6,882 performance requirement-year-destination country observations. Controlling for fixed effects of 5 sur-vey waves and 192 destination countries; omitted performance requirement E Work procedures prescribed in detail ineach survey wave. Export value of embedded performance requirements imputed using current German performancerequirements shares by sector. Coefficients reported as exponential functions of coefficients from single log exportvalue OLS regression (standard errors computed with the Delta method) to measure the ratios of workers performing arequirement relative to requirement E in each survey wave. Performance requirements F-H missing in 1992, require-ment I missing in 2006, requirement D dropped to avert multi-collinearity. Clustered standard errors in parentheses(two-way clustered at performance-requirement and country level): ∗ significance at ten, ∗∗ five, ∗∗∗ one percent.
45

Table D.16: ACTIVITY CONTENT OF GERMAN WORK WITHIN SECTOR AND OCCUPATION:HIGH UNIONIZATION
Log Employment 1979 1986 1992 1999 2006(1) (2) (3) (4) (5)
2 Repair/Maintain .76 1.23 1.23 1.12 1.11(.03) (.08) (.08) (.02) (.04)
3 Entertain/Accommodate .41 .57 .62 .95 .74(.06) (.08) (.09) (.07) (.03)
4 Transport/Store .67 .97 1.00 1.10 1.13(.05) (.05) (.07) (.03) (.05)
5 Measure/Inspect .75 .90 .95 1.18 1.26(.03) (.06) (.06) (.05) (.06)
6 Analyze/Research .80 1.00 1.12 1.11 1.37(.05) (.05) (.07) (.09) (.09)
7 Purchase/Sell .58 .87 .90 .92 1.02(.03) (.05) (.06) (.04) (.02)
8 Program Computer .45 .83 1.06 .69 .84(.04) (.06) (.08) (.03) (.03)
9 Practice Law .61 .82 .81 .83 1.22(.09) (.08) (.07) (.11) (.10)
10 Consult/Inform .54 .97 .99 1.26 1.38(.05) (.14) (.12) (.09) (.09)
11 Train/Educate .51 .72 .74 1.01 1.19(.03) (.04) (.02) (.08) (.08)
12 Nurse/Cure .46 .59 .59 .88 .80(.04) (.07) (.07) (.07) (.04)
13 Advertise/Promote .45 .60 .63 .85 1.02(.03) (.05) (.06) (.06) (.07)
14 Organize/Plan .68 1.00 1.20 1.16 1.24(.03) (.06) (.09) (.08) (.07)
15 Oversee/Control .68 1.19 1.34 1.11 1.11(.03) (.05) (.08) (.02) (.03)
Observations 76,676R2 (overall) .26
Source: BIBB 1979-2006, workers ages 16 through 65; GSOEP select years with unionization.Notes: 76,676 activity-year-gender-age-sector-occupation observations with high unionization. Controlling for fixedeffects of 2 genders, 50 age groups, 5 survey waves, 6 occupation areas and 35 sectors; omitted activity 1 Manufacture,Produce Goods in each survey wave. Coefficients reported as exponential functions of coefficients from single logemployment OLS regression (standard errors computed with the Delta method) to measure the ratios of workers inan activity relative to activity 1 in each survey wave. Clustered standard errors in parentheses (two-way clustered atactivity and sector level): ∗ significance at ten, ∗∗ five, ∗∗∗ one percent.
46

Table D.17: ACTIVITY CONTENT OF GERMAN WORK WITHIN SECTOR AND OCCUPATION:LOW UNIONIZATION
Log Employment 1979 1986 1992 1999 2006(1) (2) (3) (4) (5)
2 Repair/Maintain .84 1.15 1.13 1.25 1.23(.05) (.11) (.10) (.05) (.08)
3 Entertain/Accommodate .76 .94 .96 1.32 1.06(.13) (.15) (.10) (.12) (.10)
4 Transport/Store .84 1.15 1.09 1.31 1.33(.06) (.11) (.10) (.09) (.10)
5 Measure/Inspect .97 .95 .99 1.45 1.50(.06) (.07) (.07) (.11) (.12)
6 Analyze/Research 1.11 1.30 1.35 1.59 1.64(.08) (.09) (.10) (.17) (.17)
7 Purchase/Sell 1.14 1.33 1.32 1.49 1.40(.15) (.13) (.12) (.11) (.10)
8 Program Computer .56 .81 1.13 .73 .75(.03) (.05) (.08) (.04) (.05)
9 Practice Law .51 .62 .69 1.05 1.58(.03) (.04) (.04) (.08) (.18)
10 Consult/Inform .56 .95 .97 1.86 1.72(.02) (.07) (.08) (.18) (.17)
11 Train/Educate .83 1.07 1.09 1.43 1.40(.14) (.13) (.15) (.14) (.14)
12 Nurse/Cure .91 1.05 1.25 1.30 1.10(.13) (.13) (.17) (.17) (.14)
13 Advertise/Promote .68 .82 .80 1.25 1.41(.04) (.04) (.06) (.12) (.13)
14 Organize/Plan .94 1.30 1.47 1.67 1.52(.05) (.08) (.11) (.16) (.14)
15 Oversee/Control .76 1.13 1.13 1.19 1.19(.05) (.09) (.09) (.08) (.07)
Observations 84,480R2 (overall) .28
Source: BIBB 1979-2006, workers ages 16 through 65; GSOEP select years with unionization.Notes: 84,480 activity-year-gender-age-sector-occupation observations with low unionization. Controlling for fixedeffects of 2 genders, 50 age groups, 5 survey waves, 6 occupation areas and 35 sectors; omitted activity 1 Manufacture,Produce Goods in each survey wave. Coefficients reported as exponential functions of coefficients from single logemployment OLS regression (standard errors computed with the Delta method) to measure the ratios of workers inan activity relative to activity 1 in each survey wave. Clustered standard errors in parentheses (two-way clustered atactivity and sector level): ∗ significance at ten, ∗∗ five, ∗∗∗ one percent.
47

Table D.18: PERFORMANCE REQUIREMENTS OF GERMAN WORK WITHIN SECTOR AND OC-CUPATION: HIGH UNIONIZATION
Log Employment 1979 1986 1992 1999 2006(1) (2) (3) (4) (5)
A Deadlines/pressure to perform 1.19 1.13 1.25 1.31 1.24(.03) (.02) (.04) (.04) (.03)
B Improve/adopt new techniques .91 .93 1.03 1.01 1.16(.03) (.02) (.04) (.04) (.03)
C New situations/activities 1.21 1.08 1.20 1.11 1.23(.04) (.02) (.04) (.04) (.03)
D Repeated work steps 1.15 1.07 1.12 1.11 1.13(.01) (.01) (.02) (.01) (.02)
F Financial loss by small mistake 1.05 .95 1.01 .96(.01) (.02) (.03) (.03)
G Versatility/multiple activities 1.02 .88 .94 1.02(.02) (.03) (.02) (.02)
H Concentration on activity 1.16 1.07 1.10 1.22(.03) (.02) (.03) (.03)
I Minimum performance to execute 1.21 1.13 1.25 1.05(.02) (.02) (.04) (.03)
Observations 89,092R2 (overall) .32
Source: BIBB 1979-2006, workers ages 16 through 65; GSOEP select years with unionization.Notes: 89,092 requirement-year-gender-age-sector-occupation observations with high unionization. Controlling forfixed effects of 2 genders, 50 age groups, 5 survey waves, 6 occupation areas and 35 sectors; omitted performancerequirement E Work procedures prescribed in detail in each survey wave. Coefficients reported as exponential func-tions of coefficients from single log employment OLS regression (standard errors computed with the Delta method) tomeasure the ratios of workers performing a requirement relative to requirement E in each survey wave. Performancerequirements F-H missing in 1992, requirement I missing in 2006. Clustered standard errors in parentheses (two-wayclustered at performance-requirement and sector level): ∗ significance at ten, ∗∗ five, ∗∗∗ one percent.
48

Table D.19: PERFORMANCE REQUIREMENTS OF GERMAN WORK WITHIN SECTOR AND OC-CUPATION: LOW UNIONIZATION
Log Employment 1979 1986 1992 1999 2006(1) (2) (3) (4) (5)
A Deadlines/pressure to perform 1.30 1.35 1.32 1.42 1.33(.03) (.04) (.04) (.05) (.06)
B Improve/adopt new techniques 1.12 1.11 1.17 1.09 1.26(.04) (.04) (.05) (.05) (.06)
C New situations/activities 1.42 1.24 1.27 1.18 1.29(.06) (.06) (.05) (.05) (.06)
D Repeated work steps 1.30 1.26 1.23 1.18 1.20(.04) (.03) (.02) (.02) (.03)
F Financial loss by small mistake 1.13 .99 .96 .89(.04) (.03) (.03) (.03)
G Versatility/multiple activities 1.07 .89 .91 1.06(.02) (.02) (.02) (.03)
H Concentration on activity 1.39 1.30 1.19 1.33(.05) (.05) (.04) (.06)
I Minimum performance to execute 1.33 1.32 1.35 1.07(.05) (.04) (.05) (.03)
Observations 83,667R2 (overall) .33
Source: BIBB 1979-2006, workers ages 16 through 65; GSOEP select years with unionization.Notes: 83,667 requirement-year-gender-age-sector-occupation observations with low unionization. Controlling forfixed effects of 2 genders, 50 age groups, 5 survey waves, 6 occupation areas and 35 sectors; omitted performancerequirement E Work procedures prescribed in detail in each survey wave. Coefficients reported as exponential func-tions of coefficients from single log employment OLS regression (standard errors computed with the Delta method) tomeasure the ratios of workers performing a requirement relative to requirement E in each survey wave. Performancerequirements F-H missing in 1992, requirement I missing in 2006. Clustered standard errors in parentheses (two-wayclustered at performance-requirement and sector level): ∗ significance at ten, ∗∗ five, ∗∗∗ one percent.
49

Table D.20: ACTIVITY CONTENT EMBEDDED IN GERMAN IMPORTS FROM HIGH RIGIDITY
COUNTRIES
Log Imputed Import Value 1979 1986 1992 1999 2006(1) (2) (3) (4) (5)
2 Repair/Maintain 1.08 1.20 1.20 1.30 .89(.07) (.09) (.17) (.16) (.05)
3 Entertain/Accommodate .42 .54 .35 .36 .18(.08) (.08) (.05) (.05) (.02)
4 Transport/Store .98 1.07 .92 1.25 .78(.09) (.12) (.11) (.19) (.04)
5 Measure/Inspect .57 .57 .54 .71 .67(.02) (.02) (.06) (.07) (.03)
6 Analyze/Research .52 .53 .61 .71 .41(.02) (.02) (.07) (.06) (.02)
7 Purchase/Sell .54 .56 .62 .65 .42(.05) (.06) (.08) (.06) (.02)
8 Program Computer .29 .27 .35 .49 .62(.02) (.02) (.05) (.04) (.05)
9 Practice Law .27 .28 .20 .44 .34(.02) (.02) (.03) (.04) (.02)
10 Consult/Inform .32 .32 .29 .49 .45(.02) (.02) (.04) (.06) (.02)
11 Train/Educate .27 .28 .32 .39 .41(.01) (.02) (.04) (.04) (.02)
12 Nurse/Cure .08 .09 .27 .21 .41(.007) (.009) (.05) (.04) (.02)
13 Advertise/Promote .31 .27 .25 .22 .30(.02) (.02) (.02) (.02) (.02)
14 Organize/Plan .53 .53 .55 .67 .46(.02) (.02) (.07) (.06) (.02)
15 Oversee/Control .69 .65 1.28 1.43 .90(.05) (.04) (.15) (.13) (.05)
Observations 2,653R2 (overall) .91
Sources: WTF 1979-1993 and recent revisions 1994-2006; BIBB 1979-2006, workers ages 16 through 65; WorldBank Doing Business 2004.Notes: 2,653 activity-year-source country observations with more rigid labor markets than Germany. Controlling forfixed effects of 5 survey waves and 37 source countries with more rigid labor markets than Germany; omitted activity1 Manufacture, Produce Goods in each survey wave. Import value of embedded activities imputed using 7-year lagsof German activity intensity shares by sector. Coefficients reported as exponential functions of coefficients from singlelog import value OLS regression (standard errors computed with the Delta method) to measure the ratios of workers inan activity relative to activity 1 in each survey wave. Clustered standard errors in parentheses (two-way clustered atactivity and country level): ∗ significance at ten, ∗∗ five, ∗∗∗ one percent.
50

Table D.21: ACTIVITY CONTENT EMBEDDED IN GERMAN IMPORTS FROM LOW RIGIDITY
COUNTRIES
Log Imputed Import Value 1979 1986 1992 1999 2006(1) (2) (3) (4) (5)
2 Repair/Maintain .94 .92 .75 .89 .74(.04) (.03) (.03) (.04) (.02)
3 Entertain/Accommodate .33 .38 .20 .23 .25(.02) (.02) (.01) (.01) (.01)
4 Transport/Store .77 .75 .56 .69 .61(.04) (.04) (.02) (.04) (.02)
5 Measure/Inspect .54 .56 .46 .61 .63(.02) (.01) (.02) (.02) (.008)
6 Analyze/Research .49 .51 .44 .57 .40(.02) (.01) (.01) (.006) (.008)
7 Purchase/Sell .48 .50 .38 .46 .41(.02) (.02) (.02) (.01) (.01)
8 Program Computer .31 .36 .35 .45 .70(.01) (.01) (.02) (.01) (.02)
9 Practice Law .22 .23 .17 .33 .32(.009) (.01) (.008) (.009) (.007)
10 Consult/Inform .27 .28 .21 .34 .42(.01) (.009) (.009) (.01) (.007)
11 Train/Educate .24 .25 .21 .28 .40(.009) (.009) (.009) (.008) (.006)
12 Nurse/Cure .08 .08 .13 .11 .34(.003) (.004) (.01) (.009) (.009)
13 Advertise/Promote .31 .34 .24 .26 .31(.01) (.009) (.006) (.01) (.007)
14 Organize/Plan .51 .52 .40 .51 .43(.02) (.01) (.01) (.009) (.007)
15 Oversee/Control .71 .73 .89 1.10 .81(.03) (.03) (.02) (.01) (.01)
Observations 6,657R2 (overall) .90
Sources: WTF 1979-1993 and recent revisions 1994-2006; BIBB 1979-2006, workers ages 16 through 65; WorldBank Doing Business 2004.Notes: 6,657 activity-year-source country observations with less rigid labor markets than Germany. Controlling forfixed effects of 5 survey waves and 101 source countries with less rigid labor markets than Germany; omitted activity1 Manufacture, Produce Goods in each survey wave. Import value of embedded activities imputed using 7-year lagsof German activity intensity shares by sector. Coefficients reported as exponential functions of coefficients from singlelog import value OLS regression (standard errors computed with the Delta method) to measure the ratios of workers inan activity relative to activity 1 in each survey wave. Clustered standard errors in parentheses (two-way clustered atactivity and country level): ∗ significance at ten, ∗∗ five, ∗∗∗ one percent.
51
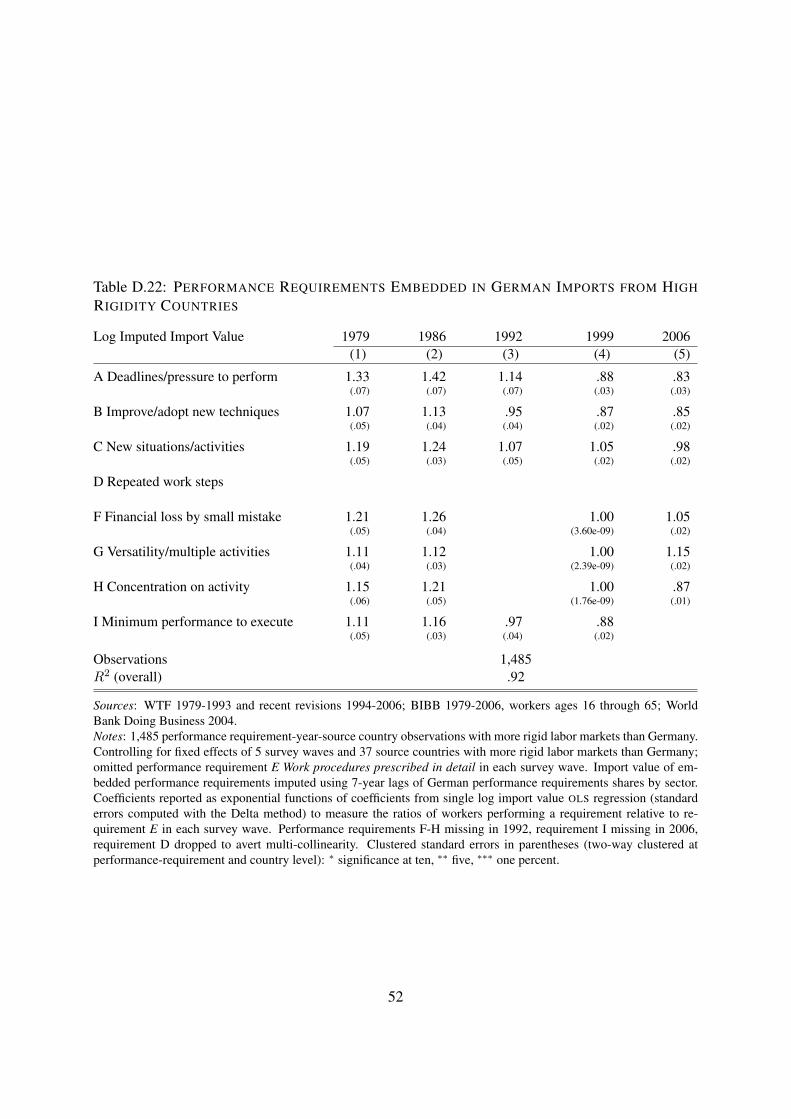
Table D.22: PERFORMANCE REQUIREMENTS EMBEDDED IN GERMAN IMPORTS FROM HIGH
RIGIDITY COUNTRIES
Log Imputed Import Value 1979 1986 1992 1999 2006(1) (2) (3) (4) (5)
A Deadlines/pressure to perform 1.33 1.42 1.14 .88 .83(.07) (.07) (.07) (.03) (.03)
B Improve/adopt new techniques 1.07 1.13 .95 .87 .85(.05) (.04) (.04) (.02) (.02)
C New situations/activities 1.19 1.24 1.07 1.05 .98(.05) (.03) (.05) (.02) (.02)
D Repeated work steps
F Financial loss by small mistake 1.21 1.26 1.00 1.05(.05) (.04) (3.60e-09) (.02)
G Versatility/multiple activities 1.11 1.12 1.00 1.15(.04) (.03) (2.39e-09) (.02)
H Concentration on activity 1.15 1.21 1.00 .87(.06) (.05) (1.76e-09) (.01)
I Minimum performance to execute 1.11 1.16 .97 .88(.05) (.03) (.04) (.02)
Observations 1,485R2 (overall) .92
Sources: WTF 1979-1993 and recent revisions 1994-2006; BIBB 1979-2006, workers ages 16 through 65; WorldBank Doing Business 2004.Notes: 1,485 performance requirement-year-source country observations with more rigid labor markets than Germany.Controlling for fixed effects of 5 survey waves and 37 source countries with more rigid labor markets than Germany;omitted performance requirement E Work procedures prescribed in detail in each survey wave. Import value of em-bedded performance requirements imputed using 7-year lags of German performance requirements shares by sector.Coefficients reported as exponential functions of coefficients from single log import value OLS regression (standarderrors computed with the Delta method) to measure the ratios of workers performing a requirement relative to re-quirement E in each survey wave. Performance requirements F-H missing in 1992, requirement I missing in 2006,requirement D dropped to avert multi-collinearity. Clustered standard errors in parentheses (two-way clustered atperformance-requirement and country level): ∗ significance at ten, ∗∗ five, ∗∗∗ one percent.
52

Table D.23: PERFORMANCE REQUIREMENTS EMBEDDED IN GERMAN IMPORTS FROM LOW
RIGIDITY COUNTRIES
Log Imputed Import Value 1979 1986 1992 1999 2006(1) (2) (3) (4) (5)
A Deadlines/pressure to perform 1.18 1.16 .98 .87 .86(.04) (.02) (.03) (.02) (.01)
B Improve/adopt new techniques .98 .97 .88 .86 .86(.03) (.02) (.03) (.01) (.01)
C New situations/activities 1.11 1.09 1.00 .98 .96(.04) (.02) (.03) (.01) (.01)
D Repeated work steps
F Financial loss by small mistake 1.13 1.12 1.00 1.07(.04) (.02) (4.21e-09) (.02)
G Versatility/multiple activities 1.09 1.08 1.00 1.13(.04) (.01) (3.41e-09) (.02)
H Concentration on activity 1.04 1.02 1.00 .87(.04) (.02) (2.40e-09) (.01)
I Minimum performance to execute 1.04 1.03 .93 .87(.03) (.01) (.02) (.01)
Observations 3,705R2 (overall) .91
Sources: WTF 1979-1993 and recent revisions 1994-2006; BIBB 1979-2006, workers ages 16 through 65; WorldBank Doing Business 2004.Notes: 3,705 performance requirement-year-source country observations with less rigid labor markets than Germany.Controlling for fixed effects of 5 survey waves and 101 source countries with less rigid labor markets than Germany;omitted performance requirement E Work procedures prescribed in detail in each survey wave. Import value of em-bedded performance requirements imputed using 7-year lags of German performance requirements shares by sector.Coefficients reported as exponential functions of coefficients from single log import value OLS regression (standarderrors computed with the Delta method) to measure the ratios of workers performing a requirement relative to re-quirement E in each survey wave. Performance requirements F-H missing in 1992, requirement I missing in 2006,requirement D dropped to avert multi-collinearity. Clustered standard errors in parentheses (two-way clustered atperformance-requirement and country level): ∗ significance at ten, ∗∗ five, ∗∗∗ one percent.
53
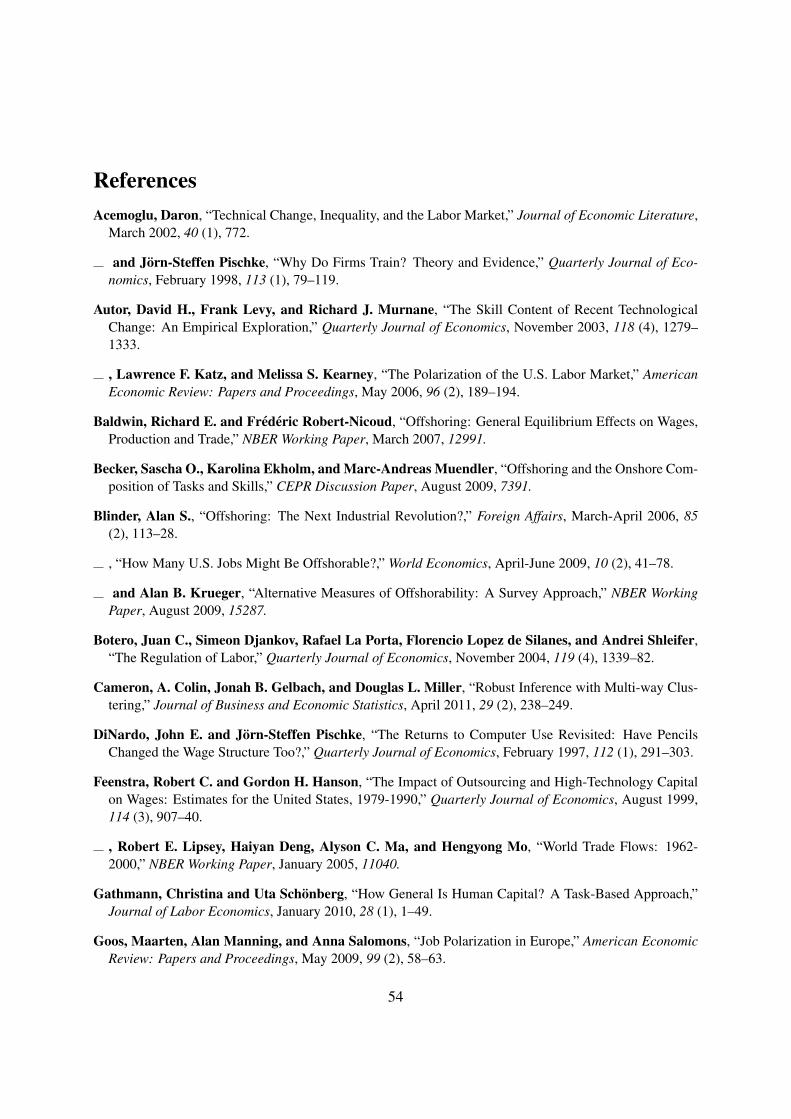
ReferencesAcemoglu, Daron, “Technical Change, Inequality, and the Labor Market,” Journal of Economic Literature,
March 2002, 40 (1), 772.
and Jorn-Steffen Pischke, “Why Do Firms Train? Theory and Evidence,” Quarterly Journal of Eco-nomics, February 1998, 113 (1), 79–119.
Autor, David H., Frank Levy, and Richard J. Murnane, “The Skill Content of Recent TechnologicalChange: An Empirical Exploration,” Quarterly Journal of Economics, November 2003, 118 (4), 1279–1333.
, Lawrence F. Katz, and Melissa S. Kearney, “The Polarization of the U.S. Labor Market,” AmericanEconomic Review: Papers and Proceedings, May 2006, 96 (2), 189–194.
Baldwin, Richard E. and Frederic Robert-Nicoud, “Offshoring: General Equilibrium Effects on Wages,Production and Trade,” NBER Working Paper, March 2007, 12991.
Becker, Sascha O., Karolina Ekholm, and Marc-Andreas Muendler, “Offshoring and the Onshore Com-position of Tasks and Skills,” CEPR Discussion Paper, August 2009, 7391.
Blinder, Alan S., “Offshoring: The Next Industrial Revolution?,” Foreign Affairs, March-April 2006, 85(2), 113–28.
, “How Many U.S. Jobs Might Be Offshorable?,” World Economics, April-June 2009, 10 (2), 41–78.
and Alan B. Krueger, “Alternative Measures of Offshorability: A Survey Approach,” NBER WorkingPaper, August 2009, 15287.
Botero, Juan C., Simeon Djankov, Rafael La Porta, Florencio Lopez de Silanes, and Andrei Shleifer,“The Regulation of Labor,” Quarterly Journal of Economics, November 2004, 119 (4), 1339–82.
Cameron, A. Colin, Jonah B. Gelbach, and Douglas L. Miller, “Robust Inference with Multi-way Clus-tering,” Journal of Business and Economic Statistics, April 2011, 29 (2), 238–249.
DiNardo, John E. and Jorn-Steffen Pischke, “The Returns to Computer Use Revisited: Have PencilsChanged the Wage Structure Too?,” Quarterly Journal of Economics, February 1997, 112 (1), 291–303.
Feenstra, Robert C. and Gordon H. Hanson, “The Impact of Outsourcing and High-Technology Capitalon Wages: Estimates for the United States, 1979-1990,” Quarterly Journal of Economics, August 1999,114 (3), 907–40.
, Robert E. Lipsey, Haiyan Deng, Alyson C. Ma, and Hengyong Mo, “World Trade Flows: 1962-2000,” NBER Working Paper, January 2005, 11040.
Gathmann, Christina and Uta Schonberg, “How General Is Human Capital? A Task-Based Approach,”Journal of Labor Economics, January 2010, 28 (1), 1–49.
Goos, Maarten, Alan Manning, and Anna Salomons, “Job Polarization in Europe,” American EconomicReview: Papers and Proceedings, May 2009, 99 (2), 58–63.
54

Grossman, Gene M. and Esteban Rossi-Hansberg, “Trading Tasks: A Simple Theory of Offshoring,”American Economic Review, December 2008, 98 (5), 1978–97.
Jensen, J. Bradford and Lori G. Kletzer, “Tradable Services: Understanding the Scope and Impact ofServices Offshoring,” in Lael Brainard and Susan M. Collins, eds., Offshoring white-collar work, Vol.2005 of Brookings Trade Forum, Washington, D.C.: Brookings Institution, 2006, chapter 3, pp. 75–133.
and , “Measuring Tradable Services and the Task Content of Offshorable Services Jobs,” inKatharine G. Abraham, James R. Spletzer, and Michael Harper, eds., Labor in the New Economy, NBERStudies in Income and Wealth, Chicago: University of Chicago Press, 2009, chapter 8. forthcoming.
Jones, Ronald W. and Henryk Kierzkowski, “The Role of Services in Production and International Trade:A Theoretical Framework,” in Ronald W. Jones and Anne O. Krueger, eds., The political economy ofinternational trade: Essays in honor of Robert E. Baldwin, Oxford and Cambridge, Mass.: Blackwell,1990, chapter 3, pp. 31–48.
Kohler, Wilhelm, “Offshoring: Why Do Stories Differ?,” CESifo Working Paper, February 2008, 2232.
Lazear, Edward P. and Kathryn L. Shaw, “Personnel Economics: The Economist’s View of HumanResources,” Journal of Economic Perspectives, Fall 2007, 21 (4), 91–114.
Leamer, Edward E. and Michael Storper, “The Economic Geography of the Internet Age,” Journal ofInternational Business Studies, 4th Quarter 2001, 32 (4), 641–65.
Levy, Frank and Richard J. Murnane, The New Division of Labor, Princeton: Princeton University Press,2004.
Markusen, James R., “Modeling the Offshoring of White-Collar Services: From Comparative Advantageto the New Theories of Trade and Foreign Direct Investment,” in Lael Brainard and Susan M. Collins,eds., Offshoring white-collar work, Vol. 2005 of Brookings Trade Forum, Washington, D.C.: BrookingsInstitution, 2006, chapter 1, pp. 1–34.
Mazzolari, Francesca and Giuseppe Ragusa, “Spillovers from High-Skill Consumption to Low-Skill La-bor Markets,” IZA Discussion Paper, September 2007, 3048.
Ottaviano, Gianmarco I.P., Giovanni Peri, and Greg C. Wright, “Immigration, Offshoring and AmericanJobs,” NBER Working Paper, October 2010, 16439.
Spitz-Oener, Alexandra, “Technical Change, Job Tasks, and Rising Educational Demands: Looking Out-side the Wage Structure,” Journal of Labor Economics, April 2006, 24 (2), 235–70.
55