trade creation and trade diversion effects in the eu-south
TRANSCRIPT

Louisiana State UniversityLSU Digital Commons
LSU Master's Theses Graduate School
2006
Trade creation and trade diversion effects in theEU-South Africa Free Trade AgreementGregory Emeka KwentuaLouisiana State University and Agricultural and Mechanical College, [email protected]
Follow this and additional works at: https://digitalcommons.lsu.edu/gradschool_theses
Part of the Agricultural Economics Commons
This Thesis is brought to you for free and open access by the Graduate School at LSU Digital Commons. It has been accepted for inclusion in LSUMaster's Theses by an authorized graduate school editor of LSU Digital Commons. For more information, please contact [email protected].
Recommended CitationKwentua, Gregory Emeka, "Trade creation and trade diversion effects in the EU-South Africa Free Trade Agreement" (2006). LSUMaster's Theses. 557.https://digitalcommons.lsu.edu/gradschool_theses/557

TRADE CREATION AND TRADE DIVERSION EFFECTS IN THE EU-SOUTH AFRICA FREE TRADE AGREEMENT
A Thesis
Submitted to the Graduate Faculty of the Louisiana State University and
Agricultural and Mechanical College In partial fulfillment of the
Requirements for the degree of Master of Science
in
The Department of Agricultural Economics and Agribusiness
by Gregory Emeka Kwentua
B.Ag.University of Nigeria, 1988 May 2006

ii
ACKNOWLEDGEMENTS I would like to express my profound gratitude to all those who made the
completion of this thesis possible. I am deeply indebted to my major professor, Dr. P
Lynn Kennedy whose patience, tolerance, guidance, and support motivated me
throughout the study period.
I want to thank my committee members, Dr. Wes Harrison Jr. and Dr. John
Westra, for their contributions throughout the development and completion of my thesis.
Furthermore, I would like to specially thank my wife Bolajoko whose patient love
and kindness enabled me to complete this thesis. I would like to thank my mom
Francisca, Brother Victor and his wife Rica, Alex, Sister Kate and her husband Obi,
nephew Adam, nieces Victoria, Meredith and Faith, Cousin Gladys and her family.
Finally, I would want to thank my fellow graduate students Hassan Marzougi,
Sachin Chitawar, Pawan Paudel, Brian Hilbun, Christane Aust and Carlos Ignacio Garcia
who have been of enormous support towards the completion of my thesis.

iii
TABLE OF CONTENTS
ACKNOWLEDGEMENTS............................................................................................... iv LIST OF TABLES.............................................................................................................. v LIST OF FIGURES ........................................................................................................... vi ABSTRACT...................................................................................................................... vii CHAPTER 1 INTRODUCTION ....................................................................................... 1
Regional Trade Agreements ........................................................................................... 1 Southern African Customs Union (SACU)................................................................. 3 Common Market for and East and Southern Africa (COMESA) ............................... 3 European Union (EU) ................................................................................................. 4
Historical Background .................................................................................................... 5 Problem Statement .......................................................................................................... 6 Justification..................................................................................................................... 7 Study Objective............................................................................................................... 8 Thesis Organization ........................................................................................................ 9
CHAPTER 2 LITERATURE REVIEW ........................................................................... 10
A Standard Gravity Model............................................................................................ 10 CHAPTER 3 METHODOLOGY ..................................................................................... 15
Economic Theory ......................................................................................................... 15 Theoretical Linkages to the Gravity Model.................................................................. 18
Impact of Income on Trade (Exporting Country) ..................................................... 19 Impact of Income on Trade (Importing Country) ..................................................... 19 Transaction Costs...................................................................................................... 20
Effects of Economic Integration: Trade Creation and Diversion Effects ..................... 21 A Standard Gravity Model............................................................................................ 30
CHAPTER 4 EMPIRICAL ANALYSIS.......................................................................... 34
Estimation Techniques.................................................................................................. 34 The Data........................................................................................................................ 34 The Variables................................................................................................................ 35 Results........................................................................................................................... 38
Interpretation of Model Coefficients ........................................................................ 39 Bilateral Trade Model ............................................................................................... 40 Export Model ............................................................................................................ 43
Summary....................................................................................................................... 47 CHAPTER 5 SUMMARY AND CONCLUSIONS......................................................... 51

iv
Summary....................................................................................................................... 51 Conclusions................................................................................................................... 52 Further Study and Limitations ...................................................................................... 53
REFERENCES ................................................................................................................. 54 APPENDIX 1: PTA MEMBERSHIP ............................................................................... 58 APPENDIX 2: REGIONAL AND PREFERENTIAL TRADE AGREEMENT
DUMMY VARIABLES ............................................................................................... 59 APPENDIX 3: NON TRADE AGREEMENT VARIABLES …………………………..95 VITA............................................................................................................................... 133

v
LIST OF TABLES
4.1. Gravity Model Variables by Symbol, Variable and Expected sign……………………………………………………… 36
4.2. Definition of Variables and Data Sources………………………...... 37
4.3. Gravity Model Estimated results (Log Bilateral Trade as Dependent Variable)…………………………………………............ 49
4.4. Gravity Model Estimated Results (Log Exports as Dependent Variable)…………………………………………............................... 50

vi
LIST OF FIGURES 3.1. Impact of Income on Trade (exporting country)……………………….. 22
3.2. Impact of Income on Trade (importing country)……………………….. 23 3.3. Impact of Transaction costs on Trade…………………………………... 24
3.4. Trade Creation effect of a customs union……………………………….. 28
3.5. Trade Diversion effect of a customs union……………………………….29

vii
ABSTRACT This study examines trade creation and trade diversion effects in the EUSAFTA
using the standard gravity model of bilateral trade flows. The estimation of the gravity
equation was carried out using the OLS analysis. In order to ascertain the overall trade
creation and trade diversion effects explanatory variables such as GDP, distance and
dummy variables were incorporated into the estimation equation to explain bilateral trade
flows and exports respectively. The main focus was on the estimation of trade creation
and trade diversion effects, resulting from participation in selected regional and
preferential trade agreements like EU, COMESA, SACU and EUSAFTA. Additionally,
the overall effects of regional and preferential trade agreements are positive and
significant indicating that trade agreements, induce and generate huge trade volume
among member countries. The trade creation effects of (SACU) were negative. This
study demonstrates that participation in Regional and Preferential Trade Agreements
stimulates trade between member countries. They also stimulate trade with non-member
countries, perhaps as a result of an income effect.

1
CHAPTER 1 INTRODUCTION
The conclusion of the Uruguay Round Agreement in 1994 and subsequent creation of the
World trade organization led to a proliferation of overlapping preferential trade and/or
integration initiatives in nearly all corners of the globe. A number of countries and South
Africa have been in a variety of Trade Agreements. The main objective of this study is to
investigate the effects of Regional Trade Agreements on bilateral and export trade. The
study focuses on the positive impact on member countries (trade creation) and the
negative impact on non-member countries (trade diversion).
Regional Trade Agreements
Regional trade agreements involve a group of countries deciding to pursue free
trade internally, while maintaining tariffs against the rest of the world. Under a customs
union, the countries involved choose a common external tariff with the rest of the world,
whereas under a free trade area the countries maintain different tariffs on imports from
the rest of the world. The analysis of customs union dates back to Viner (1950), who
introduced the terms “trade creation” versus “trade diversion”. Trade creation refers to a
situation where two countries within the customs union begin to trade with each other,
whereas formerly they produced the good in question for themselves. In international
trade terms it means the countries go from autarky (in this good) to trading with zero
tariffs, and they both gain. Trade diversion, on the other hand, occurs when two countries
begin to trade within the union, but one of these countries had formerly imported the
good from outside the union. The importing country formerly had the same tariffs on all
other countries, but purchased from outside the union because that was lowest. After the

2
union, the country switches its purchases from the lowest – price to a higher – price
country, in this case there is negative efficiency effect.
The possibility of trade diversion identified by Viner (1950) and any changes in
the terms of trade need to be evaluated empirically before judging actual agreements.
More generally, the issue of major concern is, whether regional trade agreements help or
hinder the movement towards global free trade through multilateral negotiations. The
idea that increasing returns might be a reason for trade between countries was well
recognized by Bertil Ohlin (1933) and also Frank Graham (1923), and has been the
motivation for policy actions. When dynamic effects such as the realization of economies
of scale and increased investment and technology flows are considered, the presumption
is more likely that the partners will benefit from the union, and that outside world may
also gain.
The European Union is an example of a single market project that has caused
excitement both within and outside Europe and has had important consequences for
international trade. Important economic integration is occurring in the African region
with the implementation of COMESA (Common Market for East and Southern Africa)
SACU (South Africa Customs Union), Southern Africa Development Community,
commission for East African Cooperation, Cross-Border initiative and Indian Ocean
Commission. Many African countries belong to several regional groupings. With
multiple groupings regulations can conflict, strategies can differ, and political difficulties
can abound (Sharer, 1999).

3
Southern African Customs Union (SACU)
In terms of the agreement, each member of the Southern African customs union
imposes a similar form of import control to that imposed by South Africa and each issues
import permits where necessary for the import of goods into its territory. An importer
who is in possession of an import permit for the import of goods into one member state
may not use that import permit for the importation of goods into another member state.
Common Market for East and Southern Africa (COMESA)
COMESA was established in Lusaka on 21 December 1981. The original treaty
called for the gradual reduction and eventual elimination of customs duties and non-tariff
barriers. The history of COMESA began in December 1994 when it was formed to
replace the former Preferential Trade Area (PTA) which had existed from the earlier days
of 1981. COMESA (as defined by its Treaty) was established ‘as an organization of free
independent sovereign states which have agreed to co-operate in developing their natural
and human resources for the good of all their people’ and as such it has a wide-ranging
series of objectives which necessarily include in its priorities the promotion of peace and
security.
However, due to COMESA’s economic history and background its main focus is
on the formation of a large economic and trading unit that is capable of overcoming some
of the barriers that are faced by individual states. COMESA’s current strategy can thus be
summed up in the phrase ‘economic prosperity through regional integration’. With its 20
member states, population of over 374 million and annual import bill of around US$32
billion COMESA forms a major market place for both internal and external trading. Its
area is impressive on the map of the African Continent and its achievements to date have
been significant.

4
European Union (EU)
European Union was brought into existence by a series of multilateral treaties
between sovereign states. The treaty of Rome, which came into force in January 1985,
established the European Economic Community (EEC) between the original six member
states, Belgium, France, Germany, Italy, Luxembourg and the Netherlands. The treaty of
the European Union, commonly known as the Maastricht Treaty identifies the goal of
Economic and Monetary Union but also covers areas such as visa policy, industry policy,
education, culture etc.
In over fifty years since Jacob Viner’s seminal article on customs unions, a vast
literature has amassed around the potential effects of preferential free trade agreements
(PTAs). Theoretical research in this area has generally suggested that welfare should
improve for members if more trade is created within the union relative to the trade
diverted from outside, with the effect on the rest of the world being ambiguous.
Empirical tests of these hypotheses have generally found positive welfare gains from
PTAs. However, existing studies may be biased because they do not sufficiently account
for the general equilibrium implications of PTA formation and spatial correlation among
bilateral trades across countries. As shown in this paper, the bias caused by these effects
is not trivial. In fact, after correcting for them, the estimates found here suggest that the
consequences of PTAs are likely to be sizeable.
This study focuses on the roles of four PTAs (The EU, COMESA, SACU and
EU-SOUTH AFRICA FTA) on trade patterns among 38 countries for which data is
available. The empirical test is designed to address the key question of Trade Creation
and Trade Diversion effects of the PTAs.

5
Historical Background
During the crisis years of apartheid, Britain was always more concerned with
safeguarding its interests in South Africa rather than exerting pressure which the
existence of those interests gave it, as a lever to alter the conditions that put the interests
at risk in the first place. After a long battle in the South Africa-Europe negotiations, the
European Union finally agreed that affirmative action criteria should be allowed to apply
in tenders for the supply of computers and other equipment for the South African
parliament: preference would be given to black tenderers or tenderers involved in
subcontracting or partnership agreements with black entrepreneurs. The European Union,
the stronger partner in the two-way negotiations, has in its Common Agricultural Policy
(CAP) the largest social-political-economic programme in the world. (Bozzoli, 1999 p.
195-197)
Agreement appeared to have been reached during February 1999 although full
details were not made public. The European Union had lowered its exclusion list of South
African agricultural exports from 46 to 38 per cent so that over ten years the European
Union was committed to lower tariffs on 62 per cent of South Africa's agricultural
exports. Free trade was to cover 'substantially all trade' - about 95 per cent - without
excluding any sector while, in its turn, South Africa agreed to drop tariffs on 81 per cent
of European Union agricultural imports over 12 years. South Africa would also be able to
export 60,000 tons of canned fruit at 'favorable conditions' to the European Union and
about 32 million liters of wine at 50 per cent rebates at the most favored nation rate.
However, five European countries rejected the deal as too favorable to South Africa.

6
These countries were Spain, Portugal, France, Italy and Greece, each of which is a major
fruit exporter.
Following this offer, South Africa requested and obtained access to GSP
preferences, and called for a long-term agreement under terms as close as possible to the
Lomé Convention. The European Union rejected this request and offered in its place a free
trade agreement and a qualified accession to Lomé (excluding the trade aspects of the
Convention). The negotiations for the Free Trade Agreement were formally opened in
June 1995 and were still on going at the time the study was completed (June 1998).
Problem Statement
To seek reasons for the treatment only in trade relations contradicts other South
African behavior. If trade was that important, why was South Africa consistently
unenthusiastic about giving favorable trade treatment to European Union, to the extent of
suppressing the opportunity whenever it was possible? Even during the apartheid era,
numerous import restrictions were imposed on European products. It was only in 1985
that the Republic decided to treat The European Union as a most favored nation and
stopped applying article 35 of the WTO to the already established major trading partner
(Bell, 2004, 45-49). The EU gives specific reference to internal support and export
subsidies and improved market access to the main export market could be beneficial for
the South African agricultural sector.
Through the process of gathering information about the Trade creation and trade
diversion effects in the EU-South Africa FTA, specific characteristics and influences
have been identified that help to further explain what comprises the total trade effect of a
free trade agreement. Once identified, the effects of trade creation and trade diversion can
be quantified to determine the total trade effect on South Africa resulting from the free

7
trade agreement. A successful estimation and quantification of trade creation and trade
diversion effects can provide assistance to future investigations with respect to free trade
agreements of this nature. The purpose of this study is to estimate the trade creation and
trade diversion effects in the EU-South Africa FTA and their participation in other
Regional and Preferential Trade Agreements using the gravity model of bilateral trade
flows.
Justification
The effects of trade creation and trade diversion in the bilateral free trade
agreement are important to study for several reasons. Free trade agreements are very
important for developing countries especially in a situation of an import-based economy.
With free trade, trade flows will be smooth for both trading partners and eventually
improve the welfare and consumption level of the populace at large, depending on the
total effect. For this reason trade creation and trade diversion effects play an important
role in identifying trade patterns.
In the empirical literature of studies that have been conducted in the area of trade
creation and trade diversion in various free trade agreements, there has been much
information and insight added to understand the trade creation and trade diversion
effects of free trade areas. Most of the research that has been published has focused
largely on the area of Customs Union type of preferential trade agreements. Viner (1950)
showed that regional trade agreements could be beneficial or harmful to the participating
countries because the preferential nature of these trade deals generated both trade creation
and trade diversion effects. The empirical work on the subject has proven to be
challenging, in that it could not answer “even the most basic issue regarding preferential
trading agreements: whether trade creation outweighs trade diversion” Clausing (2001,

8
p.678). This study deals specifically with FTA between two trading partners EU-South
Africa. The purpose for choosing the EU and South Africa is to broaden the
understanding of how countries benefit from free trade even when protectionists are of
the contrary opinion.
Tinbergen (1962) and Pöyhönen (1963) were the first authors applying the gravity
equation to analyze international trade flows. Since then, the gravity model has become a
popular instrument in empirical foreign trade analysis. The model has been successfully
applied to flows of varying types such as migration, foreign direct investment and more
specifically to international trade flows. According to this model, exports from country i
to country j are explained by their economic sizes (GDP or GNP), their populations,
direct geographical distances and a set of dummies incorporating some kind of
institutional characteristics common to specific flows.
This study is important because it offers a detailed analysis of the trade creation
and trade diversion effects in the EU-South Africa FTA using the gravity model of
bilateral trade to estimate trade flows from South Africa to the EU. This analysis is
differentiated on the basis of large country versus small country trade partnership and by
the fact that it will provide estimates of whether trade creation and trade diversion are
lower among trade partners that sign agreements than among those that decline the
option. The implications of this study can be far reaching and can project the impact of
the FTA between South Africa and the EU on the bilateral trade flows between the two.
Study Objective
Free trade agreements have a substantial impact on the participant countries in terms of
welfare, consumption, production and trade flows. This study will put emphasis on the
trade creation and trade diversion effects of the EU-South Africa FTA. The main

9
objective of this study is to investigate the trade creation and trade diversion effects in the
EUSAFTA. The focus area is on their participation in other regional and preferential
trade Agreements (EU, COMESA, SACU, and EUSAFTA) and the effects of trade
creation and trade diversion on trade volume.
The rest of this work summarizes the existing theoretical and empirical literature
on trade creation and trade diversion effects in the free trade agreements and a discussion
of the methods and procedures used which includes the gravity model used in this study.
The next section presents a discussion of the model, data and variables included in the
model. In conclusion, there will be a discussion of results.
Thesis Organization
This study is segmented into five chapters. Chapter one comprises of the
introduction, problem statement, justification, objectives, and estimation techniques.
Chapter two comprises of theoretical and empirical review of international trade theory to
support the analytical methods used in this study. Chapter three discusses the
methodologies employed. Chapter four discusses the data and variables used for the
analysis, along with the estimated results from the models used for this study. Chapter
five includes the summary and conclusions.

10
CHAPTER 2 LITERATURE REVIEW
When it comes to estimating and analyzing trade creation and trade diversion
effects in the trade among countries, and between member countries and non-members,
the theoretical literature showed that the formation of free trade areas, customs unions, or
other preferential trading blocs had uncertain effects on economic welfare. Viner (1950)
showed that regional trade agreements could be beneficial or harmful to the participating
countries because the preferential nature of these trade deals stimulates both trade
creation and trade diversion. The empirical work on the subject has proven to be
challenging that it could not answer “even the most basic issue regarding preferential
trading agreements: whether trade creation outweighs trade diversion” Clausing (2001,
p.678).
A Standard Gravity Model
The first formulations of the gravity equation are found in Timbergen (1962),
Pöyhönen (1963) and Pulliainen (1963). Linnemann (1966) and many other authors such
as Aitken (1973) and Leamer (1974) extended its use. According to Deardorff (1984), the
empirical success of the gravity equation is due to the fact that it can explain some real
phenomenon the conventional factor endowment theory of international trade cannot: the
trade between industrialized countries, the intra-industry trade and the lack of dramatic
reallocations of resources when trade liberalization processes have taken place.
Tinbergen (1962) and Pöyhönen (1963) were the first authors applying the gravity
equation to analyze international trade flows. Since then, the gravity model has become
popular instrument in empirical foreign trade analysis. The model has been successfully
applied to flows of varying types such as migration, foreign direct investment and more

11
specifically to international trade flows. According to this model, exports from country i
to country j are explained by their economic sizes (GDP or GNP), their populations,
direct geographical distances and a set of dummies incorporating some kind of
institutional characteristics common to specific flows.
Theoretical support of the research in this field was originally very poor, but since
the second half of the 1970s several theoretical developments have appeared in support of
the gravity model. Anderson (1979) made the first formal attempt to derive the gravity
equation from a model that assumed product differentiation. More recently Deardorff
(1995) has proven that the gravity equation characterizes many models and can be
justified from standard trade theories. The differences in these theories help to explain the
various specifications and some diversity in the results of the empirical applications.
More recent discussion by Deardoff (1984), Learmer and Levinohn (1995), and
Helpman (1999) show that the gravity model has a relatively long history. It differs from
most other theories (including traditional theory) in that it tries to explain the volume of
trade and does not focus on the composition of that trade. The model uses an equation
framework to predict the volume of trade on a bilateral basis between any two countries.
The particular equation form has some similarity to the law of gravity in physics, which
has resulted in the term gravity model being applied. These foundations were
subsequently developed by, among others, Anderson (1979) and Bergstrand (1985), who
derived gravity models from models of monopolistic competition, and Deardorff (1998),
who demonstrated that the gravity model can be derived within Ricardian and Heckscher-
Ohlin frameworks.
Trade patterns have also been investigated using gravity-type equations. The trade
overlap (i.e. two-way trade within industries) is examined in Bergstrand (1989) and
12
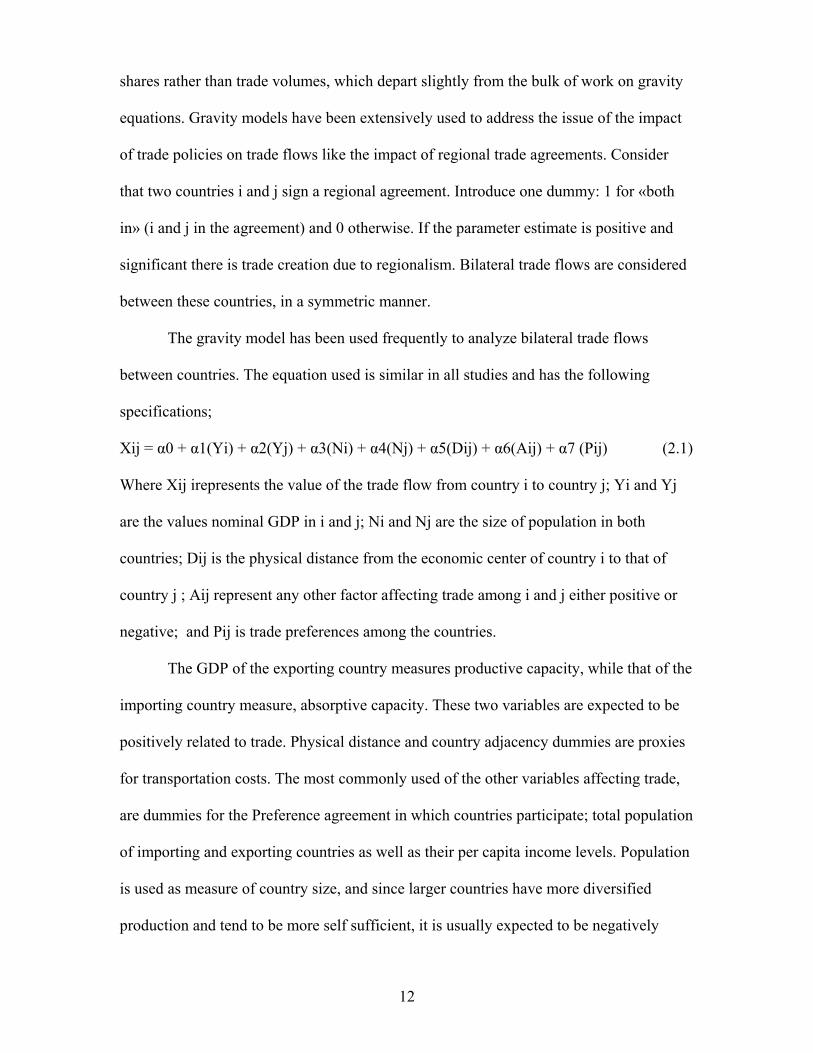
shares rather than trade volumes, which depart slightly from the bulk of work on gravity
equations. Gravity models have been extensively used to address the issue of the impact
of trade policies on trade flows like the impact of regional trade agreements. Consider
that two countries i and j sign a regional agreement. Introduce one dummy: 1 for «both
in» (i and j in the agreement) and 0 otherwise. If the parameter estimate is positive and
significant there is trade creation due to regionalism. Bilateral trade flows are considered
between these countries, in a symmetric manner.
The gravity model has been used frequently to analyze bilateral trade flows
between countries. The equation used is similar in all studies and has the following
specifications;
Xij = α0 + α1(Yi) + α2(Yj) + α3(Ni) + α4(Nj) + α5(Dij) + α6(Aij) + α7 (Pij) (2.1)
Where Xij irepresents the value of the trade flow from country i to country j; Yi and Yj
are the values nominal GDP in i and j; Ni and Nj are the size of population in both
countries; Dij is the physical distance from the economic center of country i to that of
country j ; Aij represent any other factor affecting trade among i and j either positive or
negative; and Pij is trade preferences among the countries.
The GDP of the exporting country measures productive capacity, while that of the
importing country measure, absorptive capacity. These two variables are expected to be
positively related to trade. Physical distance and country adjacency dummies are proxies
for transportation costs. The most commonly used of the other variables affecting trade,
are dummies for the Preference agreement in which countries participate; total population
of importing and exporting countries as well as their per capita income levels. Population
is used as measure of country size, and since larger countries have more diversified
production and tend to be more self sufficient, it is usually expected to be negatively

13
related to trade. As noted by Bergstrand (1989), there is an inconsistency in this
argument, as larger populations allow for economies of scale, which are translated into
higher exports.
Linnermann (1966), Aitken (1973) and Sapir (1981) used the same general
specification, but also included exporter and importer populations. Microeconomic
foundations of this alternative specification are discussed in Bergstrand (1984).
Bergstrand (1984) addressed the argument by critics that this approach is “loose” and
does not explain the multiplicative functional form and other issues in developing further
the microeconomic foundations of the gravity equation.
In a study using 1988 data just before the Canada - U.S. FTA was signed,
McCallum (1995) estimated a gravity model where the dependent variable was exports
from each Canadian province to other provinces and to U. S. states. Exports depend on
the province or state GDP’s, hence the estimated regression is
ln Χ јі = α + β1 ln Υi + β2 ln Υj + Χ δij + ρ ln dij (2.2)
Where δij irepresents an indicator variable that equals unity for trade between two
Canadian provinces and zero otherwise and dij is the distance between any two provinces
or states. The results showed negative relationship between distance and trade. The
results also show that cross provincial trade was some 22 times larger than cross-border
trade in 1988 and 15.7 times larger in 1993.
Apart from international trade flows, gravity models have achieved empirical
success in explaining various types of inter-regional and international flows, including
capital flows and labor migration (Vandekamp 1977). Evenett and Keller (1998) along
with Deardoff (1988) evaluated the usefulness of gravity models in testing alternative
theoretical models of trade. Apart from the dummy variables, other exogenous regressors

14
used are dummies for wars, conflicts, natural disasters, etc. Krueger (1999) also includes
a dummy for remoteness to take into account the fact that some countries are further
away from most of their trading partners than other countries.
According to the theorem (Krugman, 1980) with two countries trading, the larger
market will produce a greater number of products and be a net exporter of the
differentiated good. Helpman (1987), Wei, (1996), Soloaga and Winters (1999), Limao
and Venables (1999) and Bougheas et al, (1999) among others, contributed to the
refinement of the explanatory variables considered in the analysis and to the addition of
new variables.
According to the generalized gravity model of trade, the volume of exports
between a pair of countries, Xij, is a function of their incomes (GDPs), their populations,
their geographical distance and a set of dummies. Numerous empirical studies showed
that trade flows follow the physical principles of gravity: two opposite forces determine
the volume of bilateral trade between countries - the level of their economic activity and
income, and the extent of impediments to trade. National borders are among these
impediments, even for industrialized countries (MaCallum, 1995).

15
CHAPTER 3 METHODOLOGY
Economic Theory
Theoretical studies regarding the microeconomic foundations of the
gravity equation (Anderson (1979), Bergstrand (1985 and 1989) and Helpman and
Krugman (1985, ch. 8) provide rigorous explanations for the log linear form. Mátyás
(1997) and (1998), Chen and Wall (1999), Breuss and Egger (1999), and Egger (2000)
improved the econometric specification of the gravity equation. Second, Berstrand
(1985), Helpman (1987), Wei, (1996), Soloaga and Winters (1999), Limao and Venables
(1999) and Bougheas et al, (1999) among others, contributed to the refinement of the
explanatory variables considered in the analysis and to the addition of new variables.
According to the generalized gravity model of trade, the volume of exports
between pairs of countries, Xij, is a function of their incomes (GDPs), their populations,
their geographical distance and a set of dummies accounting for Regional and
Preferential trade Agreement membership. More recently, Deardoff (1984), Learmer and
Levinohn (1995), and Helpman (1999) show that the gravity model has a relatively long
history. It differs from most other theories (including traditional theory) in that it
explains the volume of trade and does not focus on the composition of that trade. The
model uses an equation framework to predict the volume of trade on a bilateral basis
between any two countries.
Other variables are often introduced, such as population size in the exporting and
or importing country (as related to market size or economies of scale) or a variable to
reflect an economic integration arrangement (such as a free trade area) between the two
16
countries. These foundations were subsequently developed by, Anderson (1979) and
Bergstrand (1985) among others, who derived gravity models from models of
monopolistic competition, and Deardorff (1998), who demonstrated that the gravity
model could be derived within the Ricardian and Heckscher-Ohlin frameworks.
Traditionally, the gravity model uses distance to model transportation costs.
However, Bougheas et al., (1999) showed that transport costs are a function not only of
distance but also of public infrastructure. They augmented the gravity model by
introducing additional infrastructure variables (stock of public capital and length of
motorway network). Their model predicts a positive relationship between the levels of
infrastructure and the volume of trade, which is supported using data from European
countries. They took a further step in this direction by introducing a new infrastructure
index (taking information on roads, paved roads, railroads and telephones) and
differentiating between exporter and importer infrastructure as explanatory variables of
bilateral trade flows.
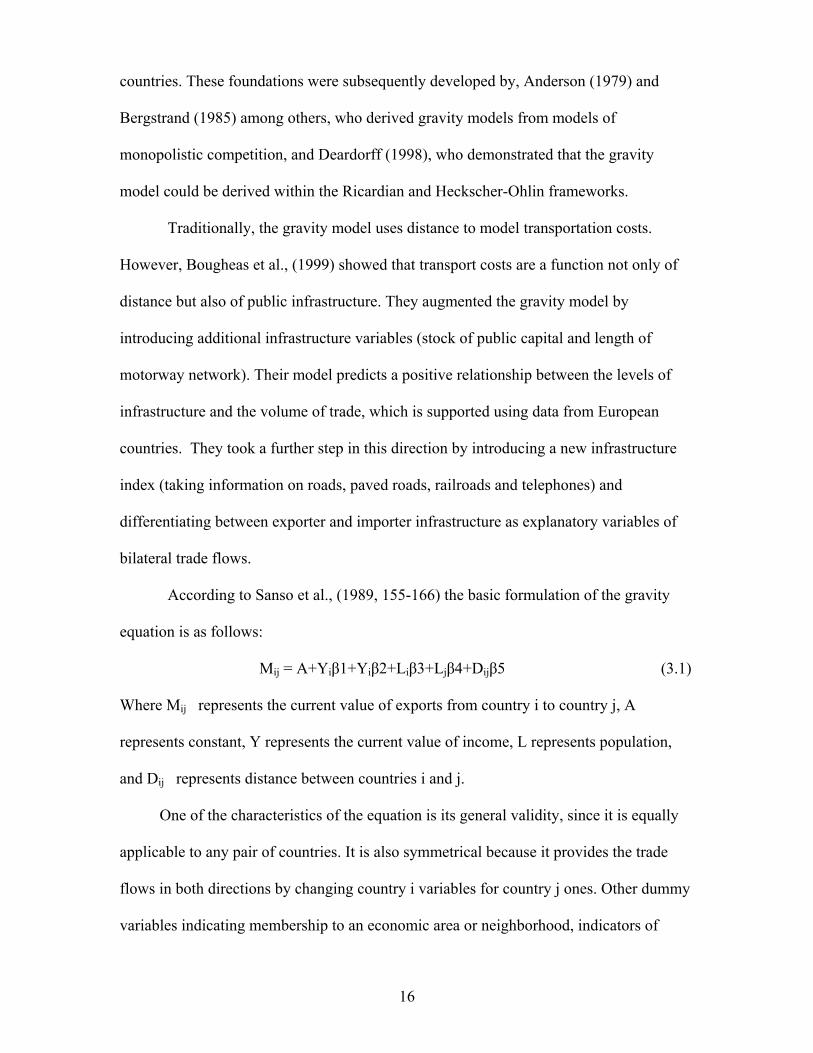
According to Sanso et al., (1989, 155-166) the basic formulation of the gravity
equation is as follows:
Mij = A+Yiβ1+Υіβ2+Liβ3+Ljβ4+Dijβ5 (3.1)
Where Mij represents the current value of exports from country i to country j, A
represents constant, Y represents the current value of income, L represents population,
and Dij represents distance between countries i and j.
One of the characteristics of the equation is its general validity, since it is equally
applicable to any pair of countries. It is also symmetrical because it provides the trade
flows in both directions by changing country i variables for country j ones. Other dummy
variables indicating membership to an economic area or neighborhood, indicators of
17
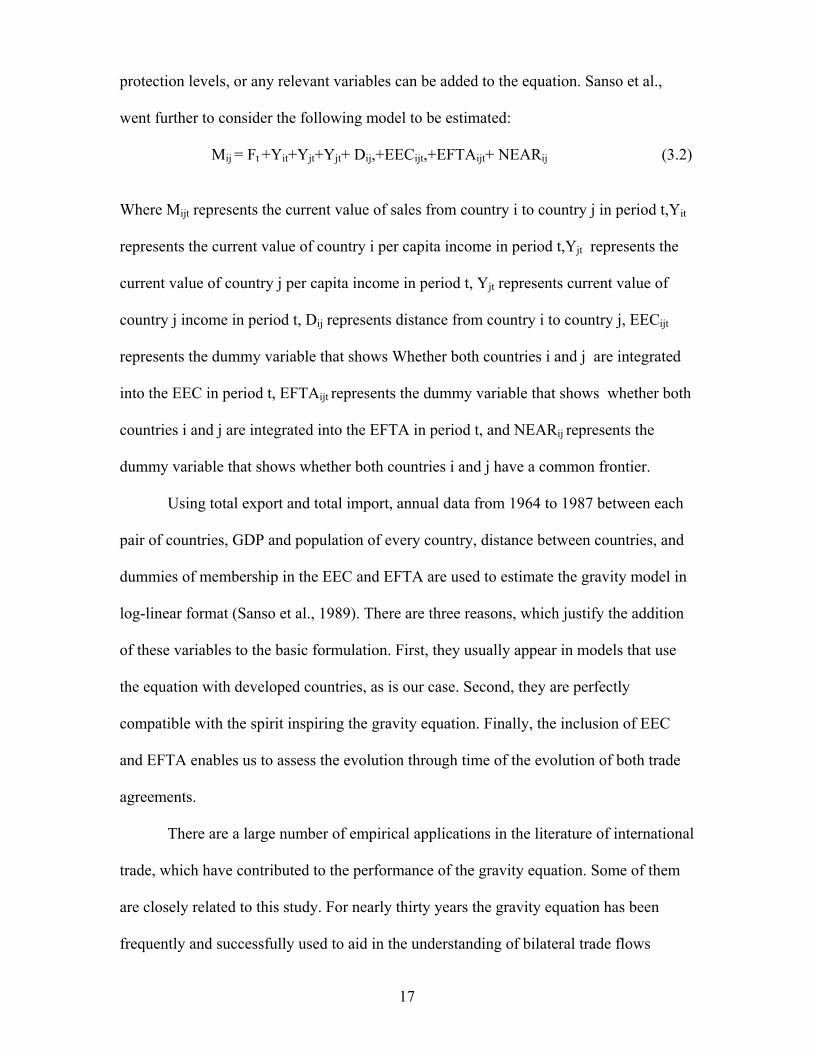
protection levels, or any relevant variables can be added to the equation. Sanso et al.,
went further to consider the following model to be estimated:
Mij = Ft +Yit+Yjt+Yjt+ Dij,+EECijt,+EFTAijt+ NEARij (3.2)
Where Mijt represents the current value of sales from country i to country j in period t,Yit
represents the current value of country i per capita income in period t,Yjt represents the
current value of country j per capita income in period t, Yjt represents current value of
country j income in period t, Dij represents distance from country i to country j, EECijt
represents the dummy variable that shows Whether both countries i and j are integrated
into the EEC in period t, EFTAijt represents the dummy variable that shows whether both
countries i and j are integrated into the EFTA in period t, and NEARij represents the
dummy variable that shows whether both countries i and j have a common frontier.
Using total export and total import, annual data from 1964 to 1987 between each
pair of countries, GDP and population of every country, distance between countries, and
dummies of membership in the EEC and EFTA are used to estimate the gravity model in
log-linear format (Sanso et al., 1989). There are three reasons, which justify the addition
of these variables to the basic formulation. First, they usually appear in models that use
the equation with developed countries, as is our case. Second, they are perfectly
compatible with the spirit inspiring the gravity equation. Finally, the inclusion of EEC
and EFTA enables us to assess the evolution through time of the evolution of both trade
agreements.
There are a large number of empirical applications in the literature of international
trade, which have contributed to the performance of the gravity equation. Some of them
are closely related to this study. For nearly thirty years the gravity equation has been
frequently and successfully used to aid in the understanding of bilateral trade flows

18
across countries as well as to analyze commercial policy measures. The formulation is a
log linear function upon a set of well-defined variables. The explanatory variables
include the incomes and populations of both countries and the distance between them.
Almost all of the empirical works use the log linear form and include these variables, but
they add others according to their particular circumstances.
Theoretical Linkages to the Gravity Model Economic theory gives several indications as to the factors that affect trade. These
factors include income, transaction costs and trade agreements. Higher income countries
trade more; transaction costs and trade agreements are determinants of export potentials
in the gravity model. Thus various combinations of microeconomic variables, such as
income and geographic distance, are powerful predictors of trade potentials. Hence,
gravity equations have been used extensively in the modeling of international trade flow.
It is common to augment the basic gravity model through additional bilateral variables.
For instance variables are added to account for common language, common border,
common colonial history, and common currency. The impact of income and transaction
costs on trade can also be explained in the partial equilibrium model.
Regional trading agreements are generally perceived to be potentially beneficial
in a trade sense. In the short-run, member countries benefit, as long-run trade diversion
does not outweigh immediate trade creation effects. Long-run gains occur through the
channels of increased efficiency through specialization, economies of scale, increased
trade, and investments.
19
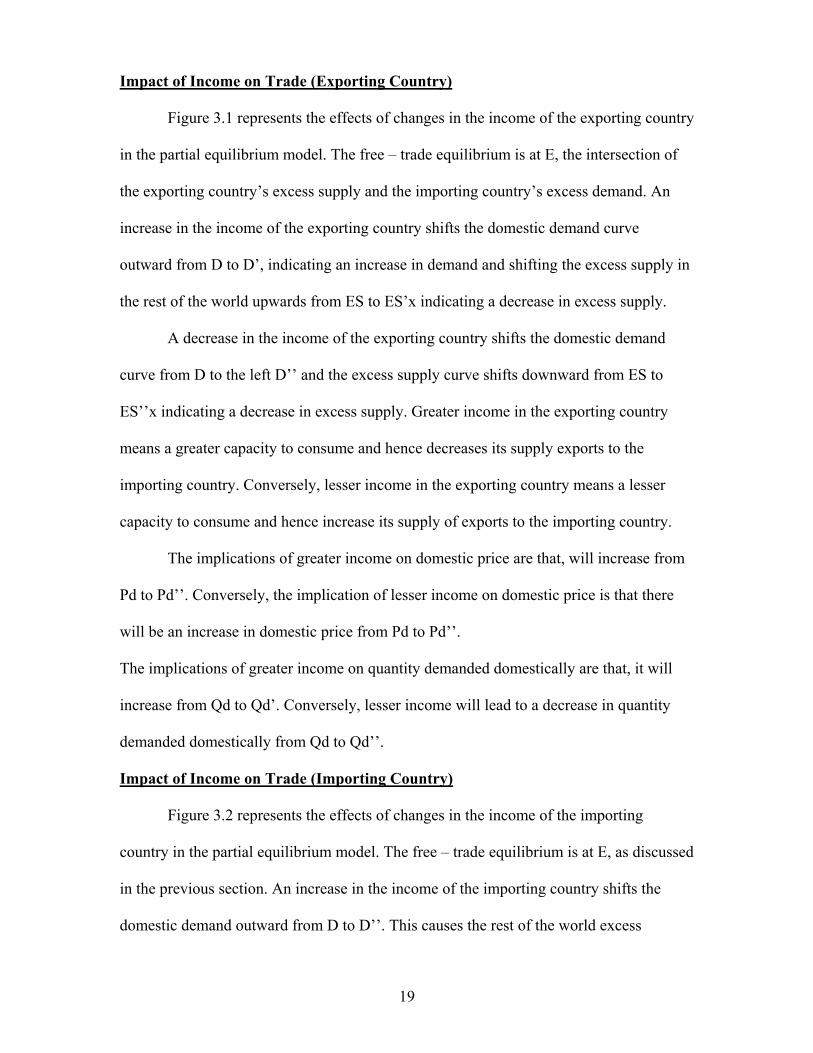
Impact of Income on Trade (Exporting Country)
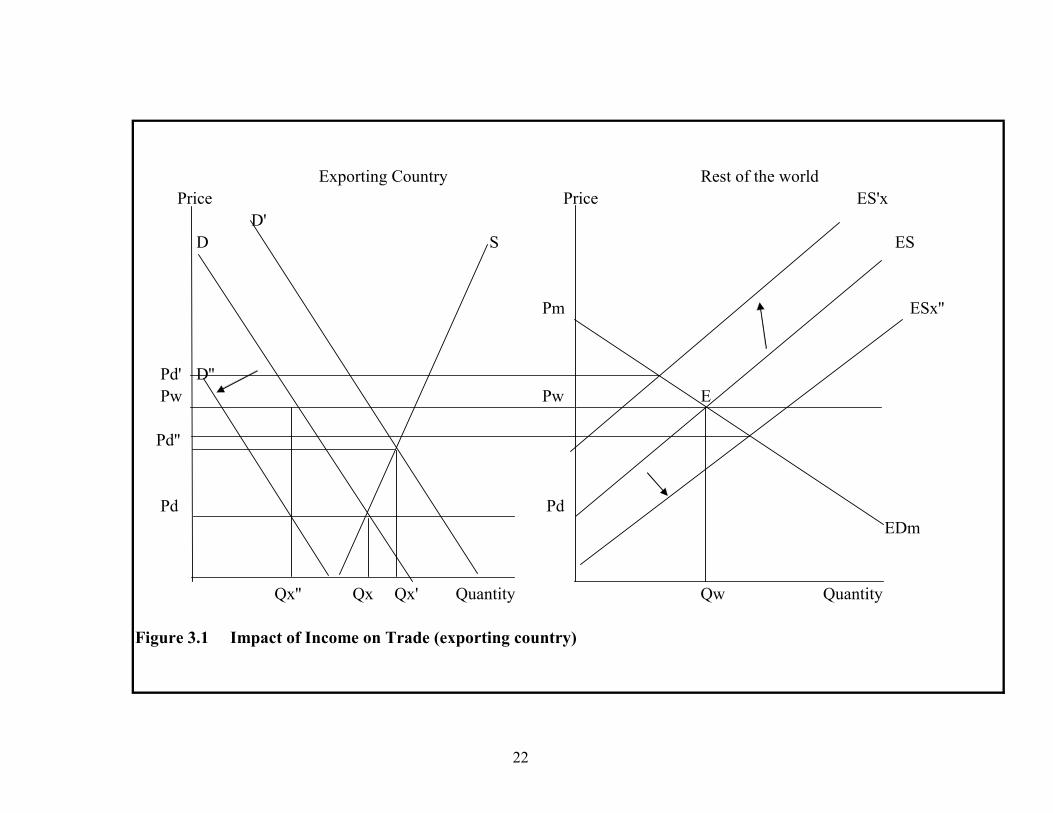
Figure 3.1 represents the effects of changes in the income of the exporting country
in the partial equilibrium model. The free – trade equilibrium is at E, the intersection of
the exporting country’s excess supply and the importing country’s excess demand. An
increase in the income of the exporting country shifts the domestic demand curve
outward from D to D’, indicating an increase in demand and shifting the excess supply in
the rest of the world upwards from ES to ES’x indicating a decrease in excess supply.
A decrease in the income of the exporting country shifts the domestic demand
curve from D to the left D’’ and the excess supply curve shifts downward from ES to
ES’’x indicating a decrease in excess supply. Greater income in the exporting country
means a greater capacity to consume and hence decreases its supply exports to the
importing country. Conversely, lesser income in the exporting country means a lesser
capacity to consume and hence increase its supply of exports to the importing country.
The implications of greater income on domestic price are that, will increase from
Pd to Pd’’. Conversely, the implication of lesser income on domestic price is that there
will be an increase in domestic price from Pd to Pd’’.
The implications of greater income on quantity demanded domestically are that, it will
increase from Qd to Qd’. Conversely, lesser income will lead to a decrease in quantity
demanded domestically from Qd to Qd’’.
Impact of Income on Trade (Importing Country) Figure 3.2 represents the effects of changes in the income of the importing
country in the partial equilibrium model. The free – trade equilibrium is at E, as discussed
in the previous section. An increase in the income of the importing country shifts the
domestic demand outward from D to D’’. This causes the rest of the world excess

20
demand curve to shift outward from ED to ED’m indicating an increase in demand for
imports.
A decrease in the income of the importing country causes the excess demand
curve to shift left from ED to ED’’m indicating a decrease in demand for imports. Greater
income in the importing country indicates greater capacity to demand imports from the
exporting country, while decreased income has the opposite effect.
The implication of greater income on price is that the domestic market price will
rise from Pd to Pd’. Conversely, lesser income will lead to a fall in domestic market
price from Pd to Pd’’. The implication of greater income in the exporting country on
quantity demanded in the domestic market is that, there will be an increase from Qx to
Qx’. Conversely, lesser income in the exporting country will lead to a decrease in
quantity demanded in the domestic market from Qx to Qx’’.
The implication of greater income in the importing country is that there will be an
increase in domestic price from Pm to Pm’. Conversely, lesser income in the importing
country will lead to a decrease in domestic price from Pm to Pm’’. The implication of
greater income in the importing country on domestic quantity demanded is an increase
from Qm to Qm’ indicating an increase in quantity demanded. Lesser income will lead to
a decrease in quantity demanded domestically from Qm to Qm’’.
Transaction Costs
Figure 3.3 represents the effects of changes in transaction costs on trade.
Transaction costs include factors related to transportation, handling costs, common
language and colonial ties. Greater distances between partner countries lead to increased
transportation costs, which lead to an upward shift of the excess supply curve. These
changes in transaction costs are seen in Figure 3.3 by a shift in ES. Conversely, lesser

21
distances between partner countries lead to a downward shift in the excess supply. The
consequence of greater distances (greater transportation costs) is to reduce the volume of
trade, while lesser distances will enhance trade.
A decrease in handling costs and potential ease of transportation as a result of
common borders between partner countries will lead to a downward shift of the excess
supply curve and an increase in trade between both countries. Another factor that can
reduce handling costs is common language between trading countries. If trading partners
speak a common language, there will be a shift of the excess supply to the right, resulting
in increased trade.
Colonial ties can be positive or negative depending on the countries involved.
Colonial ties between Canada and Great Britain as well as the Caribbean and other
European countries are typically viewed as positive. Contrary to this, the colonial ties
between Great Britain and countries such as South Africa may result in a less positive
relationship. Positive colonial ties will lead to increased trade between countries, whereas
negative colonial ties will lead to decreased trade between countries with such ties.
Effects of Economic Integration: Trade Creation and Diversion Effects Economic integration implies preferential treatment for member countries as
opposed to nonmember countries. Since this type of arrangement can lead to shifts in the
pattern of trade between members and nonmembers, the effects must be judged on the
basis of each individual country.
22
Rest of the world Price Price ES'x
D'D S ES
Pm ESx''
Pd' D'' Pw Pw E
Pd''
Pd PdEDm
Qx'' Qx Qx' Quantity Qw Quantity
Exporting Country
Figure 3.1 Impact of Income on Trade (exporting country)

23
Rest of the world Importing country Price Price
D SD'
ESx D''
Pm Pm
Pw' Pw E Pw
Pd'
ED'm Pd
EDm
ED''mQd Qw Quantity Qm Quantity
Figure 3.2 Impact of Income on Trade (importing country)

24
Exporting country Rest of the world Price Price ES'x
D D S ES
Pm ESx''
Pw Pw E
Pd PdEDm
Qx Quantity Qw Quantity
Figure 3.3 Impact of Transaction costs on Trade

25
While integration represents a movement to free trade on the part of member
countries, at the same time it can lead to the diversion of trade from lower-cost
nonmember source (which still faces the external tariffs of the group) to a higher - cost
member country source (which no longer faces any tariffs). These two effects of
economic integration are called trade creation and trade diversion. These terms were
initially used by Jacob Viner (1950), who defined trade creation as taking place whenever
economic integration leads to a shift in product origin from a domestic producer whose
resource costs are higher to a member producer whose resource costs are lower. This shift
represents a movement in the direction of the free- trade allocation of resources and thus
is presumably beneficial for welfare. Trade diversion takes place whenever there is a shift
in product origin from a nonmember producer whose resources costs are lower to a
member country producer whose resources costs are higher. This shift represents a
movement away from free-trade allocation of resources and could reduce welfare.
Figure 3.4 and 3.5 represent trade creation and trade diversion effects of a
Customs Union. Before the economic integration, the price of the good in country A is
PA ( PB plus the tariff). With integration between A and B, the tariff is removed, and A
now imports (Q4 – Q1) rather than (Q3 – Q2) from B. Q2 - Q1 of the increased imports
displace previous home production, and Q4 – Q3 reflect the greater consumption at the
new price PB facing country A’s consumers. The trade effect is the sum of areas b and d.
In general trade creation means that a free trade area creates trade that would not have
existed otherwise. As a result, supply occurs from a more efficient producer of the
product.
Before the union with country B, country A has a tariff on imports of the good.
Thus country C’s tariff – inclusive price in A’s market is PA = PC (1 + t). Before the

26
union, A imports (Q3 – Q2) from C. When the union is formed with B, country A imports
(Q4 – Q1), all coming from partner B, which no longer faces a tariff. In general trade
diversion means that a free trade area diverts trade that existed otherwise. The net trade
effects for A is the difference between areas b + d (a positive effect due to the lower price
in A) and area e (a negative effect due to lost tariff revenue by A that is not captured by
A’s consumers). Producers in the importing country suffer losses as a result of the free
trade area. The decrease in the price of their product on the domestic market reduces
producer surplus in the industry. The price decrease also induces a decrease in output of
existing firms, a decrease in employment, and a decrease in profit.
In addition to the trade effects of economic integration, it is likely that the
economic structure and performance of participating countries may evolve differently
than if they had not integrated economically. Reducing trade barriers brings about a more
competitive environment and possibly reduces the degree of monopoly power that was
present prior to integration. In addition, access to larger union markets may allow
economies of scale to be realized in certain export goods. These economies of scale may
result internally to the exporting firm in a participating country as it becomes larger, or
they may result from a lowering of costs of inputs due to economic changes external to
the firm. In either case they are triggered by market expansion brought about by
membership in the union. The realization of economies of scale may also involve
specialization on particular types of a good, and thus, trade may increasingly become
intra-industry trade rather than inter-industry trade.
It is also possible that integration will stimulate greater investment in the member
country from both internal and foreign sources. Investment can result from structural
changes, internal and external economies and geographic markets now open to producers.

27
Furthermore, foreigners may wish to invest in productive capacity in a member country
in order to avoid being choked out of the union by trade restrictions and a high common
external tariff. Economic integration at the level of the common market may lead to
dynamic benefits from increased factor mobility. If both capital and labor have the
increased ability to move from areas of surplus to areas of scarcity, increased economic
efficiency and correspondingly higher factor incomes in the integrated area will emerge.
The trade creation effect is caused by the extra output produced by the member
countries. This extra output is generated due to the freeing up of trade between them.
Increased specialization and economies of scale should increase productive efficiency
within member countries. The trade diversion effect exists because countries within
trading blocs, protected by trade barriers, will now find they can produce goods more
cheaply than countries outside the trade bloc. Production will be diverted away from
those countries outside the trade bloc that have a natural comparative advantage to those
within the trading bloc.
Preferential trade arrangements are often supported because they represent a
movement in the direction of free trade. If free trade is economically the most efficient
policy, it would seem to follow that any movement towards free trade should be
beneficial in terms of economic efficiency. Whether a preferential trade arrangement
raises a country's welfare and raises economic efficiency depends on the extent to which
the arrangement causes trade diversion versus trade creation. The theoretical literature
showed that the formation of free trade areas, customs unions, or other preferential
trading blocs had uncertain effects on economic welfare. Viner (1950) showed that
regional trade agreements could be beneficial or harmful to the participating countries.

28
Price DA SA
PA = PB (1 + t)
a cb d
PB
Q1 Q2 Q3 Q4 Quantity
Figure 3.4 Trade Creation effects of a customs union

29
Price DA SA
b d PA = PC (1+ t) a c
PBe
PC
Q1 Q2 Q3 Q4 Quantity
Figure 3.5 Trade Diversion effect of a customs union

30
A Standard Gravity Model
Gravity models were first applied to international trade by Tinbergen (1962) and
Pöyhönen (1963), who proposed that the volume of trade could be estimated as an
increasing function of the national incomes of the trading partners, and a decreasing
function of the distance between them. Although the gravity model became popular
because of its perceived empirical success, it was also criticized because it lacked
theoretical foundation.
The basic assumption of the gravity is that holding every other variable constant,
particular countries tend to have rich trading partners. Distance has an influence on trade
flows. Trade becomes cheaper when trading countries are nearby each other. An increase
in distance decreases trade flows, the more the transportation costs between trading
partners. There are also economic and political integrations like the EU, COMESA,
SACU, and EUSAFTA etc that create trade preference in selected countries. Dummy
variables are usually added to capture participation in Regional and Preferential Trade
Agreements. Whalley (1998) noted that the benefits from this form of integration might
be quite large, particularly in small country cases.
As a result of these factors and various Regional and Preferential Trade
Agreements between countries and their trading partners, the following specification of
the gravity model is considered in this study:
Yi = A + Xi1c1 + Xi2c2 + Di1c3 + Di2c4 + Di3c5 + Di4c6 (3.3)
Where Yi represents trade flows (exports or imports) between country 1 and country “i”,
Xi1 represents the GDP of country “i”, and Xi2 represents the Distance between country 1
and country “i”.

31
Dummy variable (Dij) indicate to which Regional and Preferential Trade
Agreement a particular country belongs: Di1 represents 1 – Membership in the EU (EU-
25), Di1 represents 0 – Otherwise, Di2 represents 1 – Member of COMESA (Common
market for the East and Southern Africa), Di2 represents 0 – Otherwise, Di3 represents 1 –
Member of SACU (South Africa Customs Union), Di3 represents 0 – Otherwise, Di4
represents 1 – Member of EUSA (EU – 25 and South Africa), and Xi1 represents 0 –
Otherwise.
Based on the gravity equations put forth by Whalley (1998), Sanso et al., (1989)
above specification of the gravity model (1), the following bilateral trade equations are
estimated. Four Regional preferential trade agreements as well as one overall Trade
Creation and Trade Diversion dummies are explained in both equations.
The (Bilateral Trade Model) is specified as follows:
LOG (Xij) = a0 + a1LOG (GDPi) + a2LOG (DISTij) + a3 (EUcij)
+ a4 (EUdij) + a5(COMEScij) + a6(COMESdij)
+ a7(SACUcij) + a8(SACUdij) + a9(EUSAcij)
+ a10 (EUSAdij) + a11 (PTAcij) + a12(PTAdij)
+ a13Σ (Sij)
(3.5)
Where PTAcij represents preference dummy (trade creation), PTAdij represents
Preference dummy (trade diversion), PTAcij represents 1 – If both countries belong to
any Preferential Trade Agreement, PTAcij represents 0 – otherwise, PTAdij represents 1
– If one of them belong to any Preferential Trade Agreement, PTAdij represents 0 –
Otherwise, Σ (Sij) represents other variables that affects trade like History, language,

32
land locked, borders etc., Σ (Sij) represents 1 – Colonial ties, Common language,
Landlocked, Common borders; and Σ (Sij) = 0 – Otherwise.
The (Export Model) is specified as follows
LOG (Xi) = b0 + b1 LOG (GDPj) + b2 LOG (DISTij) + b3 (EUcij)
+ b4 (EUdij) + b5 (COMEScij) + b6(COMESdij)
+ b7 (SACUcij) + b8 (SACUdij) + b9(EUSAcij)
+ b10 (EUSAdij) + b11 (PTAcij) + b12(PTAdij)
+ b13Σ(Sij)
(3.6)
Where, PTAcij represents preference dummy (trade creation), PTAdij represents
Preference dummy (trade diversion, PTAcij represents 1 – If both countries belong to any
Preferential Trade Agreement, PTAcij represents 0 – otherwise PTAdij represents 1 – If
one of them belong to any Preferential Trade Agreement, PTAdij represents 0 –
Otherwise, Σ (Sij) represents other variables that affects trade like History, language, land
locked, borders etc., Σ (Sij) represents 1 – Colonial ties, Common language, Landlocked,
Common borders; and Σ (Sij) represents 0 – Otherwise
The measure of the geographical distance between countries is defined as the
distance between capital cities. For neighboring countries this distance is defined as the
distance between their capital city and geographical center. The relationship between
trade flows and the various explanatory variables will be estimated by ordinary least -
squares (OLS) regression methods. The variables are measured in the following units:
Trade flows (Xij) measured in millions of dollars; GDP measured in millions of dollars;
Distance equals Thousands of miles; History equals 1 if they have colonial ties and 0
otherwise, Language represents 1 if they speak a common language and 0 otherwise,

33
Landlocked represents 1 If landlocked and 0 otherwise, Borders represents 1 If they share
a common border and 0 otherwise.
Preference dummy PTA, PTAcij equals 1 If both countries are members of any
and 0 otherwise, PTAdij represents 1 If one of them is a member and 0 otherwise, EUcij
represents 1 If both countries are members and 0 otherwise, EUdij represents 1 if one of
them is a member and 0 otherwise, COMESAcij represents 1 If both countries are
members and 0 otherwise, COMESAdij equals 1 If one of them is a member and 0
otherwise, SACUcij represents 1 If both countries are members and 0 otherwise,
SACUdij represents1 If one of them is a member and 0 otherwise,
EUSAcij represents 1 If both countries are members and 0 otherwise, and
EUSAdij represents 1 if one of them is a member and 0 otherwise
The basic gravity model has been expanded to include other variables that can
explain the trade creation and trade diversion effects of Regional Preferential trade
agreement. The resulting models shown in equations 3.5 and 3.6 represent an expanded
version of the basic gravity model. These models will be empirically estimated in log-
linear format in the next chapter.

34
CHAPTER 4 EMPIRICAL ANALYSIS
Estimation Techniques
Following the theoretical literature on the use of the gravity trade model, the
model used in this study will be the log-log form of the gravity equation, using standard
OLS regression analysis. The current gravity model is an adaptation of the model used by
some other variables like physical distance (measured as the great circle distance between
capital cities), common borders, and language. In order to capture the trade effects of
various PTA’s some interesting variables will be introduced notably dummies for each
PTA. These dummies are proxies for the two main trade effects – trade creation and
diversion. The welfare effects associated with trade creation and trade diversion are not
captured by these dummies, as noted by Viner (1950), the reason being that the
dependent variable exports from country i to country j measures the bilateral export flows
as against welfare. These dummies capture changes in volumes of trade among PTA
members as well as between them and non-members. The efficiency gains or losses
associated with changes in export volumes are the major factor that links changes in
export volumes with welfare.
The formulation is a log linear function upon a set of well-defined variables. The
explanatory variables are the incomes and populations of both countries and the distance
between them. Almost all the empirical works use the log linear form and these variables,
but they add others according to their particular circumstances.
The Data
The data is of 1998 trade data from the IMF direction of trade database.
The model is estimated for a cross-section dataset of 39 countries comprised of EU-25
(Austria, Belgium-Luxembourg, Bulgaria, Czechs Republic, Denmark, Estonia, Finland,

35
France, Germany, Sweden, Hungary, Ireland, Italy, Netherlands, United Kingdom, Poland,
Greece, Portugal, Spain, Cyprus, Latvia, Malta, Slovakia, Slovenia, and Lithuania),
COMESA member countries that hold 75% of trade share (South Africa, Egypt,
Kenya, Malawi, Mauritius, Zambia, Zimbabwe), SACU member countries (South
Africa, Botswana, Lesotho, Namibia and Swaziland), and the United States.
Information on four Regional and Preferential Trade Agreements used in the
study was from the WTO database. The data set consists of bilateral trade and
exports respectively.
The current GDP is expressed in purchasing power parity (PPP) values. PPP
values are in theory preferable as noted by Sirnivassan (1995); however PPP values are
subject to significant measurement errors. Yet, the risk of significant alterations of the
regression estimated is small, as shown by Linnemann (1966) and Frankel (1997). The
physical distances between countries were calculated using Indo (2005), web based
calculations of country distance based on the computer program. The information on
history, languages, landlocked and common border is based on Central Intelligence
Agency World Fact book.
The Variables A total bilateral trade flow for country pairs and exports in log form is the
dependent variable for this study. Table 4.1 lists the variables considered in the gravity
model analysis. The tables include both dependent and independent variables. The
dependent variables are bilateral trade flows and export respectively. The independent
variables are bilateral exports, exports from one of the country members, GDP of the
importing country and distance from the economic centers of country pairs.

36
Table4.1. Gravity model variables Symbol Variable Expected Sign LNXij The logarithm of bilateral trade flows c1LN GDPi The logarithm of GDP for country i (+) c2LNGDPj The logarithm of GDP for country j (+) c3 LNdistij The logarithm of distance between countries (-) c4EUcij EU membership trade creating dummy (+) c5EUdij EU membership trade diverting dummy (+/-) c6COMEScij COMESA membership trade creating dummy (+) c7COMESdij COMESA membership trade diverting dummy (+/-) c8SACUcij SACU membership trade creating dummy (+) c9SACUdij SACU membership trade diverting dummy (+/-) c10EUSAcij EUSA membership trade creating dummy (+) c11EUSAdij EUSA membership trade diverting dummy (+/-) c12PTAcij A trade creating Preference dummy (+) c13PTAdij A trade diverting Preference dummy (+/-) c14HISTORY Colonial ties dummy (-) c15LANDLOCKED Landlocked dummy (-) c16LANGUAGE Common language dummy (+) c17BORDERS Adjacency dummy (+) eij Normal distribution error term

37
Table 4.2.Definition of Variables and Data Sources
Variable Source Trade Flows IMF direction of trade (1998) GDP World Bank Development Indicator (2004A) Distance Programme developed by John A. Byers History Central Intelligence Agency World Factbook Languages Central Intelligence Agency World Factbook Landlocked Central Intelligence Agency World Factbook Borders Central Intelligence Agency World Factbook PTAs World Trade Organization database EU World Trade Organization database COMESA World Trade Organization database SACU World Trade Organization database

38
Results The main objective of this study is to estimate the trade creation and trade
diversion effects in the EU-South Africa bilateral trade agreement using the gravity
model. This section of the study examines the estimated gravity model. In particular it
examines whether the factors indicated in the gravity equation make a significant
contribution to an explanation of the bilateral and export trade. The applied regression
method used in determining the significance of variables within the model was the
standard OLS using the SAS.
Countries have developed more active foreign trade relations with other countries
where total GDP is higher. Distance negatively influences trade flows. Nearby country
partners have developed more active foreign trade relation with each other. Participation
in the EU, COMESA, SACU, EUSA etc., and influences trade flows and leads to trade
creation on one hand, and stimulates trade with non-members on the other hand, resulting
in minimal trade diversion from non-member countries.
The estimated regression equations are as follows:
LOG (Bilateral trade) = -7.7551E-12 + 0.7647*LOG (GDP)
– 1.09*LOG (DIST) + 3.0*(EUcij) + 0.93*(EUdij)
+ 3.297*(COMEScij) + 2.462*(COMESdij) – 2.558*(SACUcij)
– 0.061*(SACUdij) + 2.31*(EUSAcij + 1.38*(EUSAdij)
+ 3.85*(PTAcij) + 9.187*(PTAdij) - 0.328*(HISTORY)
+0.279*(LANDLOCKED) + 0.0131*(LANGUAGE)
+ 0.684*(BORDERS)
(4.1)

39
Where the coefficients represent α
LOG (EXPORT) = 1.39611E-12 + 0.696*LOG (GDP)
- 1.131*LOG (DIST) + 2.235*(EUcij) + 0.980*(EUdij)
+2.551*(COMEScij) +1.723*(COMESdij) - 2.276*(SACUcij)
– 0.286*(SACUdij) + 2.199*(EUSAcij) + 1.009*(EUSAdij)
+ 4.746*(PTAcij) + 9.7995*(PTAdij) – 0.447*(HISTORY)
- .362*(LANDLOCKED) + 0.017*(LANGUAGE)
+ 0.4694*(BORDERS)
Where the coefficients represent β
(4.2)
Interpretation of Model Coefficients Two models were estimated, one for bilateral trade and the other for exports (See
tables 4.3 and 4.4). Dummy trap problem was encountered in this study. However, an
interaction country with respect to the United States was introduced to the model as non-
members so as to nullify the effect. The estimated coefficients on GDP, distance and the
dummy variables have the expected signs and are significantly different from zero in both
regressions. The positive and significant coefficients of GDP indicate that richer
countries usually trade more compared to poor ones.
All coefficients of variables that make up the bilateral trade had the expected
signs and were significant at the 10 per cent level except the (SACUdij), which were
insignificant but had the expected signs. The negative sign of the coefficient also,
indicate that participation in the integration schemes does not stimulate enough mutual
trade with member countries. This sign suggests that this economic integration
40
arrangement is not sufficiently strong to influence trade with non-member countries
positively and significantly.
Bilateral Trade Model Table 4.3 shows the results of the estimations based on bilateral trade between
countries. The GDP coefficient was positive as expected and statistically significant at
the 1 per cent level as expected. This is as a result of the positive relationship between
trade and the income of trading countries. The coefficient of distance variable (dist) was
negative and significant at the 1 per cent level indicating that transportation costs act as a
constraint to trade. A country faces higher trading costs if the port is not located in the
economic center. Distance is negatively related to trade.
The coefficient of the European Union Trade Creation dummy variable (EUCij)
was positive and statistically significant at the 5 per cent level, indicating the trade
creating effects of participating in a regional trade arrangement. This suggests that
economic integration scheme is sufficiently deep and strong to influence the mutual trade
between member countries positively and significantly. The coefficient of the European
Union Trade Diversion dummy variable (EUDij) was positive and statistically significant
at the 10 per cent level, suggesting that the trade diverting effects of the EU is minimal
compared to the trade creation.
The coefficient of the Common Market for the East and Southern Africa Trade
Creation dummy variable (COMESACij) was positive and statistically significant at the 1
per cent level, indicating that participation in the regional trade arrangement influences
trade flows and leads to trade creation. The coefficient of the Common Market of the East
and Southern Africa Trade Diversion dummy variable (COMESADij) was positive and

41
statistically significant at the 1 per cent level, this suggests that these arrangements are
important to these members performance and the impact was so strong that it generated
trade between these countries and non-member countries resulting from the fact that the
demand increasing income effect of Regional and Preferential Trade Agreements out -
weighed trade diversion from non-member countries.
The coefficient of the Southern African Customs Union Trade Creation dummy
variable (SACUCij) was negative and statistically significant at the 5 per cent level for
the simple reason that most of the participating countries originated from the Southern
Africa region. The negative sign of the coefficient also, indicate that participation in the
integration schemes does not stimulate enough mutual trade with member countries. The
coefficient of the Southern African Customs Union Trade Diversion dummy variable
(SACUDij) was negative but not statistically different from zero, suggesting that this
economic integration arrangement is not sufficiently strong to influence trade with non-
member countries positively and significantly. The negative signs of the (SACUCij) and
(SACUDij) coefficients are in line with the hypothesis tested. Although there are other
factors responsible for the (SACUCij) and (SACUDdij) negative signs. These factors are;
participation of smaller countries that are very similar, overlapping memberships of other
regional trade agreements like Comesa, conflicting regulations, different strategy and
objectives that can result to negative trade creation and trade diversion effects
The coefficient of the EU-South African Trade Creation dummy variable
(EUSACij) was positive and statistically significant at the 1 per cent level resulting from
the strong trade creating effects of the free trade agreement between the EU and South
Africa. It indicates that participation in the trade agreement stimulates a high volume of

42
trade between South Africa and the EU. The EU- South African Trade Diversion dummy
variable (EUSADij) was positive and statistically significant at the 5 per cent level
resulting from the strong impact of the trade agreement which gave rise to trade between
the trading partners and non-member countries. This also, indicates that the overall effect
of trade agreements is positive but can also lead to stronger trade stimulation with non-
member countries.
The coefficient of the preference Trade Creation dummy variable (PTAcij) was
positive and statistically significant at the 10 per cent level indicating that participation in
preferential trade agreements induce trade flows, stimulate mutual trade and leads to
trade creation. It also suggests that Regional and Preferential Trade Agreements had a
positive and statistically significant effect on overall trade. The coefficient of the
preference Trade Diversion dummy variable (PTAdij) was positive and highly significant
at the 1 per cent level, resulting from the overall effect of preferential trade agreements
which gave rise to additional trade which did not have enough trade diverting effect with
non-member countries especially, with the presence of the United States in the trade
matrix. The demand increasing income effect of regional and preferential trade
arrangements outweighs any trade diverting effect, which resulted to high volume of
trade with non-member countries.
The coefficient of the History dummy variable (history) was negative and
significant at the 10 per cent level but had the expected signs indicating that common
colonial links between the Great Britain and South Africa as a result of the apartheid era
also had a negative impact on trade as expected. The coefficient of the Landlocked
dummy variable (landlocked) was negative and not significantly different from zero as

43
expected, indicating that inaccessibility to sea or ocean transportation hinders countries
ability to trade with each other.
The coefficient of the language dummy variable (language) was positive but not
significantly different from zero. The sign was as expected because common language
amongst countries facilitates trade negotiations. Most of the countries considered in the
study speak English as a common language, which is responsible for the positive sign.
There is a positive relationship between language and trade. The coefficient of the
borders dummy variable (borders) was positive and statistically significant at the 5 per
cent level indicating that trade tends to increase if countries shared a common land border
(i.e. there is a positive relationship between the adjacency variable and trade between
countries).
The R2 coefficients for the estimated equation was 0.5725 and is at satisfactory
levels for cross section analysis, although they are somewhat lower than those obtained in
other previous gravity equation applications to trade. This indicates that 57 per cent of
variation in bilateral trade flows is explained by the variables used in the model. The F
value is 110.06 indicating that all the variables are relevant to the model.
Export Model Table 4.4 shows the results of the estimations based on exports trade from one
country to the other. The GDP coefficient was positive and statistically significant at the
1 per cent level as expected. This is as a result of the positive relationship between trade
and the income of the recipient countries. The coefficient of distance variable (dist) is
negative and statistically significant at the 1 per cent level significant indicating the trade

44
barrier effects of transportation costs. A country faces higher trading costs if the port is
not located in the economic center.
The coefficient of the European Union Trade Creation dummy variable (EUCij)
was positive and statistically significant at the 5 per cent level, indicating the trade
creation effects of participation in a regional trade arrangement. This suggests that
economic integration scheme is sufficiently deep and strong to influence the mutual trade
between member countries positively and significantly. The coefficient of the European
Union Trade Diversion dummy variable (EUDij) is positive and statistically significant at
the 10 per cent level, suggesting that the trade diverting effects of the EU is minimal
compared to the trade creation.
The coefficient of the Common Market for the East and Southern Africa Trade
Creation dummy variable (COMESACij) was positive and statistically significant at the 1
per cent level indicating that participation in the regional trade arrangement enhances
exports and has the trade creating capabilities. The coefficient of the Common Market for
the East and Southern Africa Trade Creation dummy variable (COMESADij) was
positive and statistically significant at the 1 per cent level, this suggests that these
arrangements are important to these members performance and the impact was so strong
that it generated trade between these countries and non-member countries resulting from
the demand increasing income effect of RPTAs which out-weighs the trade diverting
effect.
The coefficient of the Southern African Customs Union Trade Creation dummy
variable (SACUCij) was negative and statistically significant at the 1 per cent level for
the simple reason that most of the participating countries originated from the Southern

45
Africa region. The negative sign of the coefficient also, indicate that participation in the
integration schemes does not stimulate enough mutual trade. The coefficient of the
Southern African Customs Union Trade Diversion dummy variable (SACUDij) was
negative but not statistically different from zero, suggesting that this economic
integration arrangement is not sufficiently strong to influence trade with non-member
countries significantly. The negative signs of the (SACUCij) and (SACUDij) coefficients
are in line with the hypothesis tested. Although there are other factors responsible for the
(SACUCij) and (SACUDij) negative signs. These factors are; participation of smaller
countries that are very similar, overlapping memberships of other regional trade
agreements like Comesa, conflicting regulations, different strategy and objectives that
can result to negative trade creation and trade diversion effects.
The coefficient of the EU - South African Trade Creation dummy variable
(EUSACij) was positive and statistically significant at the 1 per cent level resulting from
the strong trade creating effects of the free trade agreement between the EU and South
Africa. It indicates that participation in the trade agreement stimulates a high volume of
trade between South Africa and the EU. The coefficient of the EU - South African Trade
Diversion dummy variable (EUSADij) was positive and significant at the 5 per cent level,
resulting from the strong impact of the trade agreement towards generating trade between
the trading partners and non-member countries. This also, indicates that the overall effect
of trade agreements is positive but can also lead to stronger trade relations with non-
member countries, which led to minimal trade diverting tendencies.
The coefficient of the preference Trade Creation dummy variable (PTAcij) was
positive and statistically significant at the 10 per cent level indicating that participation in
46
preferential trade agreements induce trade flows, stimulate mutual trade and leads to
trade creation. It also suggests that Regional and Preferential Trade Agreements PTAs
had a positive and statistically significant effect on overall trade. The coefficient of the
preference Trade Diversion dummy variable (PTAdij) was positive and statistically
significant at the 1 per cent level, resulting from the overall effect of preferential trade
agreements which gave rise to additional trade which did not have enough trade diverting
effect with non-member countries especially, with the presence of the U.S in the trade
matrix. The demand increasing income effect of regional and preferential trade
arrangements outweighs any trade diverting effect, which resulted to high volume of
trade with non-member countries.
The coefficient of the History dummy variable (history) was negative and
significant at the 1 per cent level, but had the expected signs indicating that common
colonial ties between the Great Britain and South Africa coupled with apartheid had a
negative impact on trade as expected. The coefficient of the Land locked dummy variable
(landlocked) was negative and not significantly different from zero as expected,
indicating that lack of access to sea or ocean transportation hinders countries ability to
trade with each other.
The coefficient of the Language dummy variable (language) was positive but not
significantly different from zero. The sign was as expected because common language
amongst countries facilitates trade negotiations. Most of the countries considered in the
study speak English as a common language which is responsible for the positive sign.
There is a positive relationship between language and trade. The coefficient of the
borders dummy variable (borders) was positive and statistically significant at the 5 per

47
cent level indicating that trade tended to increase if countries shared a common land
border (i.e. there is a positive relationship between the adjacency variable and trade
between countries).
The R2 coefficient for the estimated equation was 0.5646. This indicates that 56
per cent of variation in export trade is explained by the variables used in the model. (The
explanation for the export trade is the same as in the bilateral trade). The F value is
106.57 indicating that all the variables are relevant to the model.
Summary
The gravity model was used to estimate trade creation and trade diversion effects
in the EU and South Africa bilateral and exports trade. The results of the regression
analyses show that the explanatory variables explain more than 57% and 56% of the
variation in the dependent variables of the standard gravity equation used in this study.
The estimates for the entire group of countries confirm the hypothesis put
forward in the analysis that participation in a Regional Preferential Trade Agreement
leads to Trade Creation. All the regression coefficients have the expected sign, and most
including the dummy variables are statistically different from zero. Significant
coefficients for GDP in the analysis confirm that it has a positive relationship with trade.
The negative and statistically significant coefficients of the distance variable indicates the
trade barrier impact of transportation costs,
The significant coefficients of the preference dummy variables suggest that this
economic integration scheme is sufficiently deep to influence the mutual trade between
member countries. The positive sign of the preference dummy variables indicates that
participation in trade agreements stimulate mutual trade and lead to trade with other non

48
member nations because the income effect is sufficiently strong to create trade between
member countries.
The significance and size of the coefficients for the preferential trade agreements
suggest that these arrangements create trade with non-member countries compared to
diversion. The significance and size of the Trade Creation and Diversion dummy
coefficients (COMESAcij, COMESAdij, EUSAcij, EUSAdij SACUcij, PTAcij and
PTAdij), suggest that these arrangements are important to the performance of
participating countries.
The coefficients on the history dummy indicate that the impact of the British
Colonial links was weak as a result of recovery from the negative impact of apartheid era.
The coefficient of landlocked was negative and not significant. The coefficient on the
language dummy was positive but not significant. The coefficient on the borders was
positive and significant. The extent of trade flows can increase if countries share a
common land border (i.e. there is a positive sign on the adjacent variable).
The R2 coefficients for the estimated equation were 56% and 57% which were at
satisfactory levels for cross section analysis, although they were somewhat lower than
those obtained in some other gravity equation application to international trade.
Lastly, the overall statistical significance of trade creating and trade diverting
effects were tested for, as shown in tables 4.3 and 4.4 respectively. The hypothesis that
trade creation and trade diversion effects were zero was rejected at all statistical levels.
The trade creating effects were positive as expected. Furthermore, the trade diverting
effects were also positive and higher than the trade creating effects.

49
Table 4.3 Gravity Model Estimated Results (Log (Bilateral Trade) as dependent Variable) Variables Model Coefficient Standard Error Intercept -7.7551E-12 2.47641 LNGDP 0.76147* 0.04129 LNDISTANCE -1.09102* 0.11538 EUCIJ 3.07695** 0.92809 EUDIJ 0.92739*** 0.61214 COMESACIJ 3.29731* 0.68448 COMESADIJ 2.46171* 0.28370 SACUCIJ -2.55774* 0.47356 SACUDIJ -0.06120 0.25682 EUSACIJ 2.30857* 0.51991 EUSADIJ 1.38073** 0.48727 PTACIJ 3.84644*** 2.75702 PTADIJ 9.18651* 2.72985 HISTORY 0.0131*** 0.18103 LANDLOCKED -0.27860 0.26143 LANGUAGE 0.01317 0.01278 BORDERS 0.68413** 0.20022 R-Square Number of observations F-Value (overall) p-Value
0.5725 1331 106.57 <.0001
*=0.01 **= 0.05 ***=0.1 (level of significance)

50
Table 4.4 Gravity Model estimated Results (Log (Exports) as Dependent Variable) Variables Model Coefficient Standard Error Intercept 1.39611E-12 2.46066 LNGDP 0.69616* 0.04102 LNDISTANCE -1.13124* 0.11465 EUCIJ 2.23487** 0.11465 EUDIJ 0.98009*** 0.92020 COMESACIJ 2.55126* 0.68012 COMESADIJ 1.72349* 0.28189 SACUCIJ -2.27579* 0.47055 SACUDIJ -0.28629 0.25519 EUSACIJ 2.19948* 0.51660 EUSADIJ 1.00907** 0.48417 PTACIJ 4.74552*** 2.73949 PTADIJ 9.79951* 2.71249 HISTORY -0.44683* 0.17988 LANDLOCKED -0.36194 0.25976 LANGUAGE 0.01740 0.01270 BORDERS 0.48936** 0.19895 R-Square Number of observations F-Value (overall) p-Value
0.5646 1331 106.57 <.0001
*=0.01 **= 0.05 ***=0.1 (level of significance)

51
CHAPTER 5
SUMMARY AND CONCLUSIONS
Summary The economic structure and the level of economic development differ between
these different groupings of countries. The difference in economic structure and
economic development among these countries may cause the effects of the variables such
as GDP, distance etc., on trade flows to differ from one group to another.
This study has considered trade creation and trade diversion effects of the EU,
COMESA, SACU and EUSAFTA regional and preferential trade agreements. The
objective of this study was accomplished using the standard gravity model of
international trade. Countries have developed more mutual foreign trade relations with
other countries where GDP is higher. Distance negatively influences trade flows. Nearby
country pairs have developed more active foreign trade relations with each other.
Participation in the regional and preferential trade agreements influences trade flows and
leads to trade creation.
The positive and significant GDP coefficients confirm that bilateral and export
trade is strongly affected by the trading partner’s incomes. The negative but statistically
significant coefficients of the distance variable indicate the trade barrier impact of
transportation costs, but the extent of trade flows can increase if the countries share a
common land border which was positive and statistically different from zero. The
coefficients on landlocked was negative but not statistically different from zero. History
coefficient was negative but statistically different from zero. Most preferential trade
agreement variables were statistically significant at the 5% and 10% levels of

52
significance, but SACU trade creating dummy variable coefficients were negative but
statistically significant at the 10% level of significance. The overall trade creation
coefficients were positive and statistically significant at the 5% and 10% levels of
significance except for SACU, which was negative but statistically significant at the 5%
level.
The overall trade diversion effects were positive and statistically significant at the
5% level except for SACU, which was negative and insignificant. The creation
coefficients indicate that preferential trade agreements create trade opportunities for
member countries. The positive effects of a trade-diverting dummy suggest that
additional trade due to preferential trade agreements does not lead to diverting trade with
non-member countries. Preferential trade agreements most likely stimulate demand for
imports and supply of exports from non participating countries by increasing countries
overall income.
Conclusions
The overall trade creation and trade diversion effects of (EUSAFTA) along with
other regional preferential trade arrangements were analyzed for bilateral and export
trade respectively using the gravity model. The overall effects of regional and preferential
trade agreements are positive and significant indicating that trade agreements, induce and
generate trade among member countries. The trade creating effects of (SACU) was
negative and statistically significant perhaps because these countries operate within the
same geographical area and have similar economies.
Overall trade-diverting effects were positive, suggesting that regional and
preferential trade agreements do not necessarily divert trade with non-member countries.

53
The rationale for this is that the trade creating impact of regional and preferential trade
agreements increases overall demand to such an extent that the income effect outweighs
the trade diverting effect of the agreements. It has been noted that the benefits of regional
and preferential trade agreements are larger for member countries than for non-member
countries. Overall, the results suggest that there were significant trade creation and trade
diversion effects in the European Union and South Africa preferential trade agreement.
Further Study and Limitations
This study showed that trade can be influenced positively when countries
participate in regional and preferential trade agreements as a result of trade creation
effects which lead to demand increasing income effects that out-weigh any trade
diversion effect with non-members. The usefulness of using cross-section data in a
gravity model to assess the effects of most regional and preferential trade agreement was
highlighted by this study. Contrary to the use of bilateral trade flows in estimating the
gravity model, the use of export of one of the trading country pairs was introduced in this
study. One implication of this study is the positive trade creation and trade diversion
effects of being a participating country in a regional and preferential trade agreement
contrary to the notion of negative trade diversion effects.
The limitations of the gravity model include the inability of the model to predict
the welfare effects of Regional and Preferential Trade Agreements. The second limitation
is the model’s dependence upon aggregated data as opposed to disaggregated data which
can help in analyzing the effects of trade agreements on specific commodities.

54
REFERENCES Aitken, Samir. "Preface." In Adjustment or Delinking? The African Experience, edited by
Azzam Mabjoub, ix-xvi. Atlantic Highlands, N.J.: Zed Books, 2003, pp 13-14. Anderson, J. (1979) “A theoretical foundation of the gravity model”. American Economic Review 69(1), 106-16. Balassa, Bela (1989) “Trade Creation and Trade Diversion in the European Common
Market.” In Bela Balassa (ed.), Comparative Advantage. Trade Policy and economic Development, New York: New York University Press, Washington Square, 109-130.
Bell, Trevor. "Should South Africa Further Liberalize Its Foreign Trade?" In State and
Market in Post Apartheid South Africa, edited by Merle Lipton and Charles Simkins, 81-127. Boulder, Cob: Westview Press, 2004, pp 45-49.
Bergstrand, J. (1989) “The Generalized Gravity Equation, Monopolistic Competition, and the Factor-Proportions Theory in International Trade” The Review of Economics and Statistics 71, 143-53. Bozzoli, Belinda. "The Origins, Development and Ideology of Local Manufacturing in
South Africa." Journal of Southern African Studies 1, no. 2(1999): 194-214. Cambridge, Massachusetts: MIT Press. Clark, Nancy L. "The Limits of Industrialization under Apartheid." In Apartheid's
Genesis 1935-1962, edited by P. Bonner, P. Delius, and D. Posel, 65-95. Johannesburg: Witwatersrand University Press, 2004.
Clausing, Kimberly (1996), “Trade Creation and Trade Diversion in the Canada-United
States Free Trade Agreement.” Ph.D. Thesis, Harvard University. Coe, D.T. and A.W. Hoffmaister (1999) ‘North-South Trade: Is Africa Unusual’ Journal of African Economies, Vol. 8, No. 2, pp.228-256. Cross-section Analysis”. American Economic Review, Vol. 63, pp. 881-892.
Deardorff, A. (1997) “Determinants of Bilateral Trade: Does Gravity Work in a Classical World?” In The Regionalization of the World Economy ed. by Jeffrey Frankel. Chicago: Deardorff, A. V. (1995), 'Determinants of bilateral trade: does gravity work in a neoclassic Development Economic Group of the World Bank, mimeo. Disinvestment, October-November 2002." Journal of Southern African Studies 15, no. 3 (April 2003): 415-437.

55
Evennett, S. and W.W. Keller (1998). On Theories Explaining the Success of the Gravity Equation, NBER Working Paper 6529, New York: National Bureau of Economic Research. Feenstra, R., J.A. Markusen and A. Rose (1998). Understanding the home Market Effect and the Gravity Equation: The Role of Differentiating Goods, NBER Working Papers No. W6804. New York: National Bureau of Economic Research. Frankel, J.A. (1997). Regional Trading Blocs in the World Economic Systems. Washington, DC; Institute for International Economics. Helpman, Elhanan. (1987). “Imperfect Competition and International Trade: Evidence from fourteenrt Industrial Countries.” Journal of the Japanese and International Economics 1:62-81. Indo (2005), “Using Latitude and Longitude to Calculate the Distance between Economic Centers” Website accessed November, 2005 http://www.indo.com/distance Koo, Mareelle, and Hector M. Robertson. "The South African Board of Trade and
Industries; The South African Customs Tariff and the Development of South African Industries." South African Journal of Economics 34 (2004): 205-224.
Krueger A.O., (1999), Trade Creation and Trade Diversion under NAFTA, NBER Working Paper, N 7429, December, New York: National Bureau of Economic Research. Leamer, E.E., and J. Levinsohn, (1995). “International Trade Theory: The Evidence”, in G. Grossman and K. Rogoff (eds.), Handbook of International Economics, Vol. 3, Amsterdam: North-Holland, pp. 1339-1394. Linnemann, Hans, An Econometrics study of International Trade Flows (Amsterdam: North-Holland, 1966. Macphee, C.R. and V.I. Ogunledo (1991) ‘The Trade Effects of the U.S Generalized System of Preferences’, Atlantic Economics Journal, Vol. XIX, No. 4, pp. 19- 26. Martinez-Zarzoso, I. (2001) Trade in distance-sensitive products: Explaining Mercosur exports to the EU. Paper presented at the conference ‘IV Encuentro de Economia Aplicada’, Departament D’ Economia, Universitat Rovira I Virgili. Martinez-Zarzoso, I. and F. Nowak-Lehmann (2000) Augmented gravity model: An empirical application to Mercosur-European Union trade flows, Ibero American institute for Economic Research Discussion Paper.

56
Mátyás, L., (1997). The Gravity Model: Some Econometric Considerations. The World Economy 21 (3):397-401. McCallum, J., (1995). “National Borders Matter: Canada-U.S. Regional Trade Patterns”, American Economic Review, Vol. 85, pp. 615-623. Nilsson, L. (2002) ‘Trading Relations: Is the roadmap from Lome to Cotonou correct’ Applied Economies, Vol. 34. pp.439-452. North-Holland Publishing Co., 1966). Nouve, K. and J. Staatz (2003) ‘Has AGOA Increased Agricultural exports from Sub- Saharan Africa to the United States?’ Contributed paper presented at the International Agricultural Trade Research Consortium (IATRC) Conference, Capri, Italy. Ogunledo and Macphee (1994) ‘Gravity models: a reformulation and an application to discriminatory trade arrangements’, Applied Economics, Vol. 26, No.2, pp.107-120. Pöyhönen, P. (1963) “A tentative model for the flows of trade between countries”. Predictions from a gravity model’, The Journal of International Trade and Economic. Pulliainen, Kyosti, “A World Trade Study: An Econometric model of the Pattern of the Commodity Flows of International Trade in 1948-1960, “Economiska Samfundets, Tidskrift 16 (1963), 78-91. Sapir, Andre, “Trade Benefits under the EEC Generalized System of Preferences. “ European Economic Review 15 (1981), 339-355. Sirnivasan, T.N. (1995). “Long-run growth theories: anything new?” in Takatoshi, I. and A. Krueger, eds., Growth theories in the Light of the East Asia experience, Chicago: University of Chicago Press. Soloaga, I. and Winters, A. (1999) ‘Regionalism in the Nineties: What effects on trade?’
Tinbergen, J. (1962) Shaping the World Economy: Suggestions for an International Economic Policy. Tinbergen, Jan, Shaping the World Economy: Suggestions for an International Economic Policy (New York: The Twentieth Century Fund, 1962). Valodia, Imraan. "Productivity, Trade and Employment: A Contribution to the Bell-ISP
Debate." Transformation 31 (1996): 57-65.

57
Vanderkamp, John (1977). “The Gravity Model and Migration Behavior: An Economic Interpretation”, Journal of Economic Studies, Vol. 4 (2), pp. 90- 102. Viner, Jacob, (1950), the Customs Union Issue (Carnegie Endowment for International
Peace: New York. Wei, Shang-Jim (1996), “Intra-National versus International Trade: How Stubborn is
Nations in Global Integration?” NBER Working Paper No. 5531, Cambridge: National Bureau of Economic Research.
WTO, “Coverage, Liberalization Process and Transitional Provisions in Regional Trade
Agreements,” Tech. Rep. WT/REG/W/46, April 2002. Wylie, Peter J. (1995), “Partial Equilibrium Estimates of Manufacturing Trade Creation
and Diversion Due to NAFTA. “The North America Journal of Economics and Finance, 6: 65-84.

58
APPENDIX 1: PTA MEMBERSHIP Agreement Full name Membership EU European Union Austria, Belgium-Luxembourg France, Germany, Sweden, Greece, Portugal, Spain, Netherlands, Denmark, UK, Italy, Ireland, Finland, Slovak Republic, Slovenia, Czech Republic, Latvia, Lithuania, Malta, Estonia, Bulgaria, Cyprus, Hungary, Poland COMESA Common market for Egypt, Kenya, Malawi, Mauritius the East and Southern Africa Namibia, Zimbabwe, Zambia, South Africa SACU South African Customs Union Botswana, Lesotho, Namibia, Swaziland, South Africa

59
APPENDIX 2: REGIONAL AND PREFERENTIAL TRADE AGREEMENT DUMMY VARIABLES
from to EUcij EUdij COMEScij COMESdij SACUcij SACUdijEU-SAcij
EU-SAdij PTAcij PTAdij
SA Austria 0 1 0 1 0 1 1 0 1 0 Belg 0 1 0 1 0 1 1 0 1 0 Bulg 0 1 0 1 0 1 1 0 1 0 czech 0 1 0 1 0 1 1 0 1 0 Denm 0 1 0 1 0 1 1 0 1 0 Eston 0 1 0 1 0 1 1 0 1 0 Finl 0 1 0 1 0 1 1 0 1 0 Fran 0 1 0 1 0 1 1 0 1 0 Germ 0 1 0 1 0 1 1 0 1 0 Swed 0 1 0 1 0 1 1 0 1 0 Hung 0 1 0 1 0 1 1 0 1 0 Irel 0 1 0 1 0 1 1 0 1 0 Italy 0 1 0 1 0 1 1 0 1 0 Nether 0 1 0 1 0 1 1 0 1 0 UK 0 1 0 1 0 1 1 0 1 0 Poland 0 1 0 1 0 1 1 0 1 0 Egypt 0 0 1 0 0 1 0 1 1 0 Keny 0 0 1 0 0 1 0 1 1 0 Malaw 0 0 1 0 1 0 0 1 1 0 Mauri 0 0 1 0 1 0 0 1 1 0 Zamb 0 0 1 0 1 0 0 1 1 0 Zimbab 0 0 1 0 1 0 0 1 1 0 Gree 0 1 0 1 0 1 1 1 1 0 Portu 0 1 0 1 0 1 1 0 1 0 Spain 0 1 0 1 0 1 1 0 1 0 Cyp 0 1 0 1 0 1 1 0 1 0 Latvia 0 1 0 1 0 1 1 0 1 0 Malta 0 1 0 1 0 1 1 0 1 0 Slovak 0 1 0 1 0 1 1 0 1 0 Slove 0 1 0 1 0 1 1 0 1 0 Lithu 0 1 0 1 0 1 1 0 1 0 Bots 0 0 1 0 1 0 0 1 1 0 Lesot 0 0 1 0 1 0 0 1 1 0 Namib 0 0 1 0 1 0 0 1 1 0 Swazi 0 0 1 0 1 0 0 1 1 0 USA 0 0 0 1 0 1 0 1 1 0

60
Continued from appendix 2
from to EUcij EUdij COMEScij COMESdij SACUcij SACUdijEU-SAcij
EU-SAdij PTAcij PTAdij
Aus SA 0 1 0 1 0 1 1 0 1 0 Belg 1 0 0 0 0 0 1 0 1 0 Bulg 1 0 0 0 0 0 1 0 1 0 czech 1 0 0 0 0 0 1 0 1 0 Denm 1 0 0 0 0 0 1 0 1 0 Eston 1 0 0 0 0 0 1 0 1 0 Finl 1 0 0 0 0 0 1 0 1 0 Fran 1 0 0 0 0 0 1 0 1 0 Germ 1 0 0 0 0 0 1 0 1 0 Swed 1 0 0 0 0 0 1 0 1 0 Hung 1 0 0 0 0 0 1 0 1 0 Irel 1 0 0 0 0 0 1 0 1 0 Italy 1 0 0 0 0 0 1 0 1 0 Nether 1 0 0 0 0 0 1 0 1 0 UK 1 0 0 0 0 0 1 0 1 0 Poland 1 0 0 0 0 0 1 0 1 0 Egypt 0 1 0 1 0 0 0 1 1 0 Keny 0 1 0 1 0 0 0 1 1 0 Malaw 0 1 0 1 0 1 0 1 1 0 Mauri 0 1 0 1 0 1 0 1 1 0 Zamb 0 1 0 1 0 1 0 1 1 0 Zimbab 0 1 0 1 0 1 0 1 1 0 Gree 1 0 0 0 0 0 1 0 1 0 Portu 1 0 0 0 0 0 1 0 1 0 Spain 1 0 0 0 0 0 1 0 1 0 Cyp 1 0 0 0 0 0 1 0 1 0 Latvia 1 0 0 0 0 0 1 0 1 0 Malta 1 0 0 0 0 0 1 0 1 0 Slovak 1 0 0 0 0 0 1 0 1 0 Slove 1 0 0 0 0 0 1 0 1 0 Lithu 1 0 0 0 0 0 1 0 1 0 Bots 0 1 0 1 0 1 0 1 1 0 Lesot 0 1 0 1 0 1 0 1 1 0 Namib 0 1 0 1 0 1 0 1 1 0 Swazi 0 1 0 1 0 1 0 1 1 0 USA 0 1 0 0 0 0 0 1 0 1
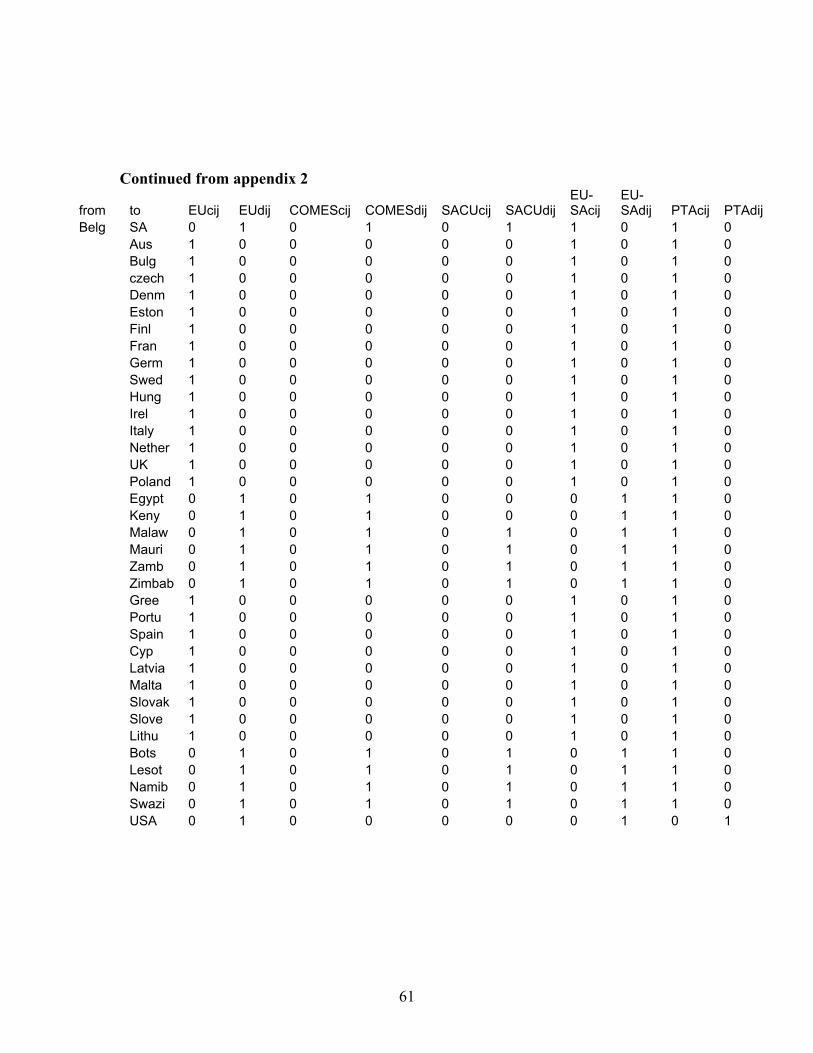
61
Continued from appendix 2
from to EUcij EUdij COMEScij COMESdij SACUcij SACUdijEU-SAcij
EU-SAdij PTAcij PTAdij
Belg SA 0 1 0 1 0 1 1 0 1 0 Aus 1 0 0 0 0 0 1 0 1 0 Bulg 1 0 0 0 0 0 1 0 1 0 czech 1 0 0 0 0 0 1 0 1 0 Denm 1 0 0 0 0 0 1 0 1 0 Eston 1 0 0 0 0 0 1 0 1 0 Finl 1 0 0 0 0 0 1 0 1 0 Fran 1 0 0 0 0 0 1 0 1 0 Germ 1 0 0 0 0 0 1 0 1 0 Swed 1 0 0 0 0 0 1 0 1 0 Hung 1 0 0 0 0 0 1 0 1 0 Irel 1 0 0 0 0 0 1 0 1 0 Italy 1 0 0 0 0 0 1 0 1 0 Nether 1 0 0 0 0 0 1 0 1 0 UK 1 0 0 0 0 0 1 0 1 0 Poland 1 0 0 0 0 0 1 0 1 0 Egypt 0 1 0 1 0 0 0 1 1 0 Keny 0 1 0 1 0 0 0 1 1 0 Malaw 0 1 0 1 0 1 0 1 1 0 Mauri 0 1 0 1 0 1 0 1 1 0 Zamb 0 1 0 1 0 1 0 1 1 0 Zimbab 0 1 0 1 0 1 0 1 1 0 Gree 1 0 0 0 0 0 1 0 1 0 Portu 1 0 0 0 0 0 1 0 1 0 Spain 1 0 0 0 0 0 1 0 1 0 Cyp 1 0 0 0 0 0 1 0 1 0 Latvia 1 0 0 0 0 0 1 0 1 0 Malta 1 0 0 0 0 0 1 0 1 0 Slovak 1 0 0 0 0 0 1 0 1 0 Slove 1 0 0 0 0 0 1 0 1 0 Lithu 1 0 0 0 0 0 1 0 1 0 Bots 0 1 0 1 0 1 0 1 1 0 Lesot 0 1 0 1 0 1 0 1 1 0 Namib 0 1 0 1 0 1 0 1 1 0 Swazi 0 1 0 1 0 1 0 1 1 0 USA 0 1 0 0 0 0 0 1 0 1

62
Continued from appendix A2
from to EUcij EUdij COMEScij COMESdij SACUcij SACUdijEU-SAcij
EU-SAdij PTAcij PTAdij
Bulg SA 0 1 0 1 0 1 1 0 1 0 Austria 1 0 0 0 0 0 1 0 1 0 Belg 1 0 0 0 0 0 1 0 1 0 czech 1 0 0 0 0 0 1 0 1 0 Denm 1 0 0 0 0 0 1 0 1 0 Eston 1 0 0 0 0 0 1 0 1 0 Finl 1 0 0 0 0 0 1 0 1 0 Fran 1 0 0 0 0 0 1 0 1 0 Germ 1 0 0 0 0 0 1 0 1 0 Swed 1 0 0 0 0 0 1 0 1 0 Hung 1 0 0 0 0 0 1 0 1 0 Irel 1 0 0 0 0 0 1 0 1 0 Italy 1 0 0 0 0 0 1 0 1 0 Nether 1 0 0 0 0 0 1 0 1 0 UK 1 0 0 0 0 0 1 0 1 0 Poland 1 0 0 0 0 0 1 0 1 0 Egypt 0 1 0 1 0 0 0 1 1 0 Keny 0 1 0 1 0 0 0 1 1 0 Malaw 0 1 0 1 0 1 0 1 1 0 Mauri 0 1 0 1 0 1 0 1 1 0 Zamb 0 1 0 1 0 1 0 1 1 0 Zimbab 0 1 0 1 0 1 0 1 1 0 Gree 1 0 0 0 0 0 1 0 1 0 Portu 1 0 0 0 0 0 1 0 1 0 Spain 1 0 0 0 0 0 1 0 1 0 Cyp 1 0 0 0 0 0 1 0 1 0 Latvia 1 0 0 0 0 0 1 0 1 0 Malta 1 0 0 0 0 0 1 0 1 0 Slovak 1 0 0 0 0 0 1 0 1 0 Slove 1 0 0 0 0 0 1 0 1 0 Lithu 1 0 0 0 0 0 1 0 1 0 Bots 0 1 0 1 0 1 0 1 1 0 Lesot 0 1 0 1 0 1 0 1 1 0 Namib 0 1 0 1 0 1 0 1 1 0 Swazi 0 1 0 1 0 1 0 1 1 0 USA 0 1 0 0 0 0 0 1 0 1
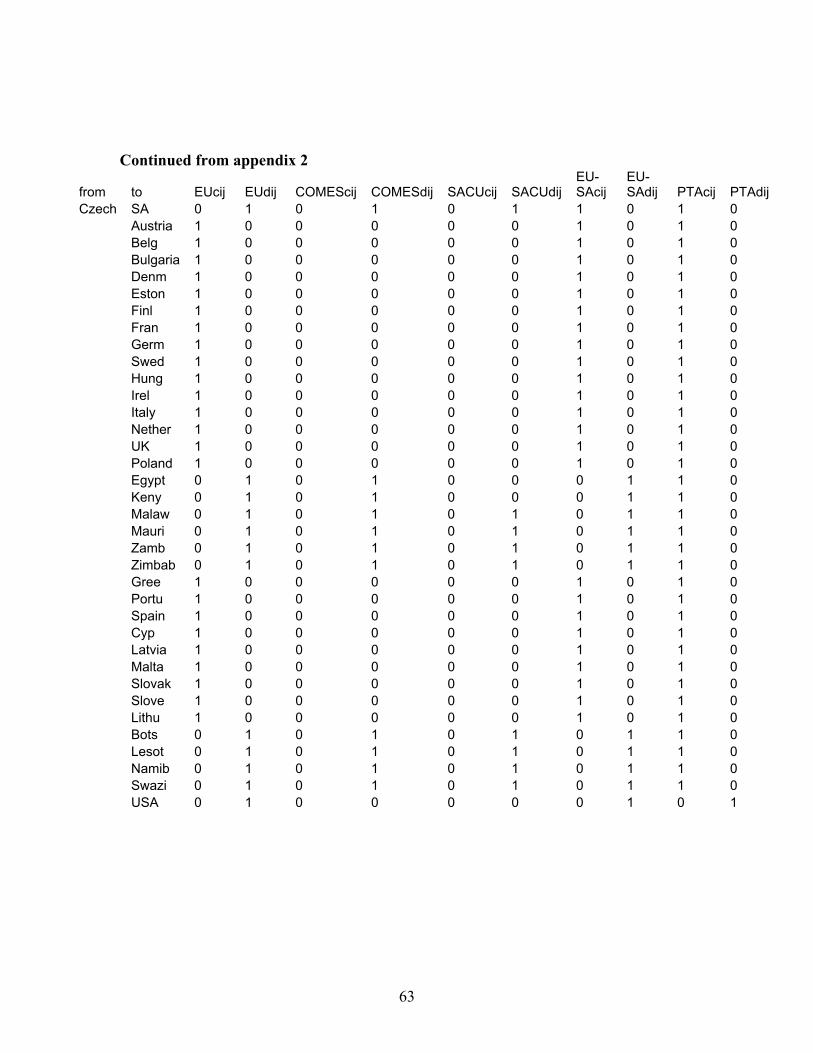
63
Continued from appendix 2
from to EUcij EUdij COMEScij COMESdij SACUcij SACUdijEU-SAcij
EU-SAdij PTAcij PTAdij
Czech SA 0 1 0 1 0 1 1 0 1 0 Austria 1 0 0 0 0 0 1 0 1 0 Belg 1 0 0 0 0 0 1 0 1 0 Bulgaria 1 0 0 0 0 0 1 0 1 0 Denm 1 0 0 0 0 0 1 0 1 0 Eston 1 0 0 0 0 0 1 0 1 0 Finl 1 0 0 0 0 0 1 0 1 0 Fran 1 0 0 0 0 0 1 0 1 0 Germ 1 0 0 0 0 0 1 0 1 0 Swed 1 0 0 0 0 0 1 0 1 0 Hung 1 0 0 0 0 0 1 0 1 0 Irel 1 0 0 0 0 0 1 0 1 0 Italy 1 0 0 0 0 0 1 0 1 0 Nether 1 0 0 0 0 0 1 0 1 0 UK 1 0 0 0 0 0 1 0 1 0 Poland 1 0 0 0 0 0 1 0 1 0 Egypt 0 1 0 1 0 0 0 1 1 0 Keny 0 1 0 1 0 0 0 1 1 0 Malaw 0 1 0 1 0 1 0 1 1 0 Mauri 0 1 0 1 0 1 0 1 1 0 Zamb 0 1 0 1 0 1 0 1 1 0 Zimbab 0 1 0 1 0 1 0 1 1 0 Gree 1 0 0 0 0 0 1 0 1 0 Portu 1 0 0 0 0 0 1 0 1 0 Spain 1 0 0 0 0 0 1 0 1 0 Cyp 1 0 0 0 0 0 1 0 1 0 Latvia 1 0 0 0 0 0 1 0 1 0 Malta 1 0 0 0 0 0 1 0 1 0 Slovak 1 0 0 0 0 0 1 0 1 0 Slove 1 0 0 0 0 0 1 0 1 0 Lithu 1 0 0 0 0 0 1 0 1 0 Bots 0 1 0 1 0 1 0 1 1 0 Lesot 0 1 0 1 0 1 0 1 1 0 Namib 0 1 0 1 0 1 0 1 1 0 Swazi 0 1 0 1 0 1 0 1 1 0 USA 0 1 0 0 0 0 0 1 0 1

64
Continued from appendix 2
from to EUcij EUdij COMEScij COMESdij SACUcij SACUdijEU-SAcij
EU-SAdij PTAcij PTAdij
Denm SA 0 1 0 1 0 1 1 1 0 Aus 1 0 0 0 0 0 1 0 1 0 Belg 1 0 0 0 0 0 1 0 1 0 Bulg 1 0 0 0 0 0 1 0 1 0 czech 1 0 0 0 0 0 1 0 1 0 Eston 1 0 0 0 0 0 1 0 1 0 Finl 1 0 0 0 0 0 1 0 1 0 Fran 1 0 0 0 0 0 1 0 1 0 Germ 1 0 0 0 0 0 1 0 1 0 Swed 1 0 0 0 0 0 1 0 1 0 Hung 1 0 0 0 0 0 1 0 1 0 Irel 1 0 0 0 0 0 1 0 1 0 Italy 1 0 0 0 0 0 1 0 1 0 Nether 1 0 0 0 0 0 1 0 1 0 UK 1 0 0 0 0 0 1 0 1 0 Poland 1 0 0 0 0 0 1 0 1 0 Egypt 0 1 0 1 0 0 0 1 1 0 Keny 0 1 0 1 0 0 0 1 1 0 Malaw 0 1 0 1 0 1 0 1 1 0 Mauri 0 1 0 1 0 1 0 1 1 0 Zamb 0 1 0 1 0 1 0 1 1 0 Zimbab 0 1 0 1 0 1 0 1 1 0 Gree 1 0 0 0 0 0 1 0 1 0 Portu 1 0 0 0 0 0 1 0 1 0 Spain 1 0 0 0 0 0 1 0 1 0 Cyp 1 0 0 0 0 0 1 0 1 0 Latvia 1 0 0 0 0 0 1 0 1 0 Malta 1 0 0 0 0 0 1 0 1 0 Slovak 1 0 0 0 0 0 1 0 1 0 Slove 1 0 0 0 0 0 1 0 1 0 Lithu 1 0 0 0 0 0 1 0 1 0 Bots 0 1 0 1 0 1 0 1 1 0 Lesot 0 1 0 1 0 1 0 1 1 0 Namib 0 1 0 1 0 1 0 1 1 0 Swazi 0 1 0 1 0 1 0 1 1 0 USA 0 1 0 0 0 0 0 1 0 1

65
Continued from appendix 2
from from EUcij EUdij COMEScij COMESdij SACUcij SACUdijEU-SAcij
EU-SAdij PTAcij PTAdij
Eston SA 0 1 0 1 0 1 1 0 1 0 Austria 1 0 0 0 0 0 1 0 1 0 Belg 1 0 0 0 0 0 1 0 1 0 Bulg 1 0 0 0 0 0 1 0 1 0 Czech 1 0 0 0 0 0 1 0 1 0 Denmark 1 0 0 0 0 0 1 0 1 0 Finl 1 0 0 0 0 0 1 0 1 0 Fran 1 0 0 0 0 0 1 0 1 0 Germ 1 0 0 0 0 0 1 0 1 0 Swed 1 0 0 0 0 0 1 0 1 0 Hung 1 0 0 0 0 0 1 0 1 0 Irel 1 0 0 0 0 0 1 0 1 0 Italy 1 0 0 0 0 0 1 0 1 0 Nether 1 0 0 0 0 0 1 0 1 0 UK 1 0 0 0 0 0 1 0 1 0 Poland 1 0 0 0 0 0 1 0 1 0 Egypt 0 1 0 1 0 0 0 1 1 0 Keny 0 1 0 1 0 0 0 1 1 0 Malaw 0 1 0 1 0 1 0 1 1 0 Mauri 0 1 0 1 0 1 0 1 1 0 Zamb 0 1 0 1 0 1 0 1 1 0 Zimbab 0 1 0 1 0 1 0 1 1 0 Gree 1 0 0 0 0 0 1 0 1 0 Portu 1 0 0 0 0 0 1 0 1 0 Spain 1 0 0 0 0 0 1 0 1 0 Cyp 1 0 0 0 0 0 1 0 1 0 Latvia 1 0 0 0 0 0 1 0 1 0 Malta 1 0 0 0 0 0 1 0 1 0 Slovak 1 0 0 0 0 0 1 0 1 0 Slove 1 0 0 0 0 0 1 0 1 0 Lithu 1 0 0 0 0 0 1 0 1 0 Bots 0 1 0 1 0 1 0 1 0 1 Lesot 0 1 0 1 0 1 0 1 0 1 Namib 0 1 0 1 0 1 0 1 0 1 Swazi 0 1 0 1 0 1 0 1 0 1 USA 0 1 0 0 0 0 0 1 1 0

66
Continued from appendix 2
from to EUcij EUdij COMEScij COMESdij SACUcij SACUdijEU-SAcij
EU-SAdij PTAcij PTAdij
Fran SA 0 1 0 1 0 1 1 0 1 0 Aus 1 0 0 0 0 0 1 0 1 0 Belg 1 0 0 0 0 0 1 0 1 0 Bulg 1 0 0 0 0 0 1 0 1 0 czech 1 0 0 0 0 0 1 0 1 0 Denm 1 0 0 0 0 0 1 0 1 0 Eston 1 0 0 0 0 0 1 0 1 0 Finland 1 0 0 0 0 0 1 0 1 0 Germ 1 0 0 0 0 0 1 0 1 0 Swed 1 0 0 0 0 0 1 0 1 0 Hung 1 0 0 0 0 0 1 0 1 0 Irel 1 0 0 0 0 0 1 0 1 0 Italy 1 0 0 0 0 0 1 0 1 0 Nether 1 0 0 0 0 0 1 0 1 0 UK 1 0 0 0 0 0 1 0 1 0 Poland 1 0 0 0 0 0 1 0 1 0 Egypt 0 1 0 1 0 0 0 1 1 0 Keny 0 1 0 1 0 0 0 1 1 0 Malaw 0 1 0 1 0 1 0 1 1 0 Mauri 0 1 0 1 0 1 0 1 1 0 Zamb 0 1 0 1 0 1 0 1 1 0 Zimbab 0 1 0 1 0 1 0 1 1 0 Gree 1 0 0 0 0 0 1 0 1 0 Portu 1 0 0 0 0 0 1 0 1 0 Spain 1 0 0 0 0 0 1 0 1 0 Cyp 1 0 0 0 0 0 1 0 1 0 Latvia 1 0 0 0 0 0 1 0 1 0 Malta 1 0 0 0 0 0 1 0 1 0 Slovak 1 0 0 0 0 0 1 0 1 0 Slove 1 0 0 0 0 0 1 0 1 0 Lithu 1 0 0 0 0 0 1 0 1 0 Bots 0 1 0 1 0 1 0 1 1 0 Lesot 0 1 0 1 0 1 0 1 1 0 Namib 0 1 0 1 0 1 0 1 1 0 Swazi 0 1 0 1 0 1 0 1 1 0 USA 0 1 0 0 0 0 0 1 0 1
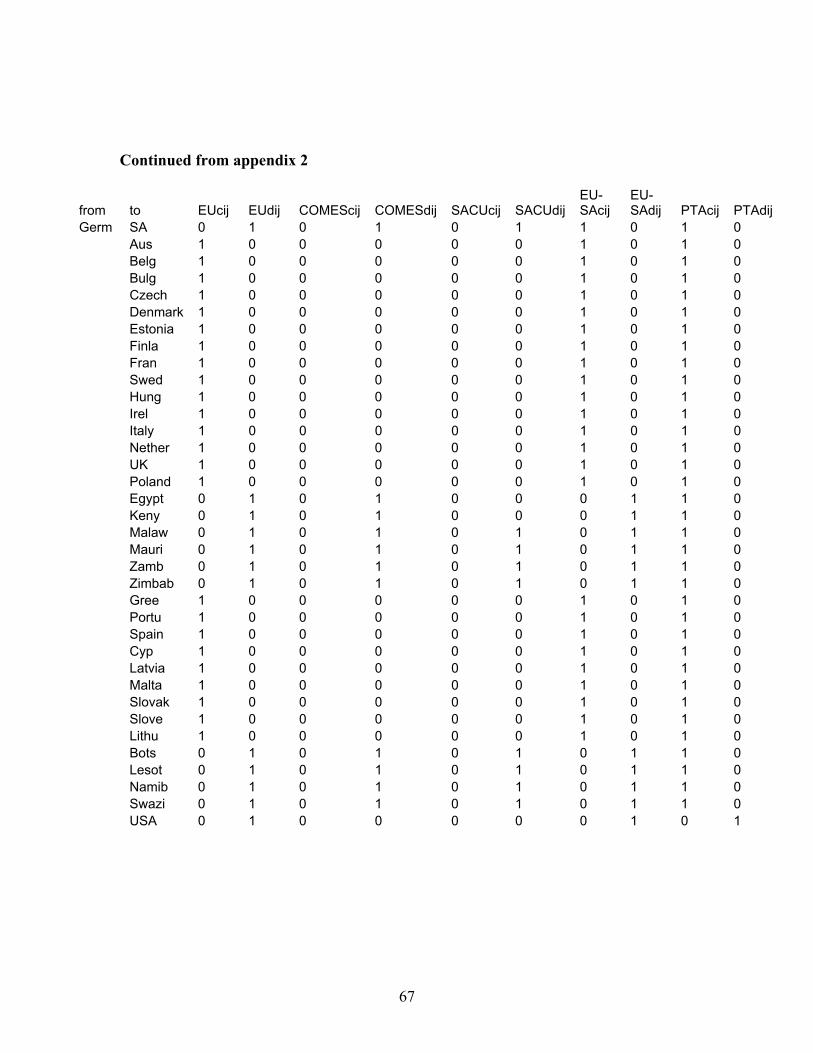
67
Continued from appendix 2
from to EUcij EUdij COMEScij COMESdij SACUcij SACUdijEU-SAcij
EU-SAdij PTAcij PTAdij
Germ SA 0 1 0 1 0 1 1 0 1 0 Aus 1 0 0 0 0 0 1 0 1 0 Belg 1 0 0 0 0 0 1 0 1 0 Bulg 1 0 0 0 0 0 1 0 1 0 Czech 1 0 0 0 0 0 1 0 1 0 Denmark 1 0 0 0 0 0 1 0 1 0 Estonia 1 0 0 0 0 0 1 0 1 0 Finla 1 0 0 0 0 0 1 0 1 0 Fran 1 0 0 0 0 0 1 0 1 0 Swed 1 0 0 0 0 0 1 0 1 0 Hung 1 0 0 0 0 0 1 0 1 0 Irel 1 0 0 0 0 0 1 0 1 0 Italy 1 0 0 0 0 0 1 0 1 0 Nether 1 0 0 0 0 0 1 0 1 0 UK 1 0 0 0 0 0 1 0 1 0 Poland 1 0 0 0 0 0 1 0 1 0 Egypt 0 1 0 1 0 0 0 1 1 0 Keny 0 1 0 1 0 0 0 1 1 0 Malaw 0 1 0 1 0 1 0 1 1 0 Mauri 0 1 0 1 0 1 0 1 1 0 Zamb 0 1 0 1 0 1 0 1 1 0 Zimbab 0 1 0 1 0 1 0 1 1 0 Gree 1 0 0 0 0 0 1 0 1 0 Portu 1 0 0 0 0 0 1 0 1 0 Spain 1 0 0 0 0 0 1 0 1 0 Cyp 1 0 0 0 0 0 1 0 1 0 Latvia 1 0 0 0 0 0 1 0 1 0 Malta 1 0 0 0 0 0 1 0 1 0 Slovak 1 0 0 0 0 0 1 0 1 0 Slove 1 0 0 0 0 0 1 0 1 0 Lithu 1 0 0 0 0 0 1 0 1 0 Bots 0 1 0 1 0 1 0 1 1 0 Lesot 0 1 0 1 0 1 0 1 1 0 Namib 0 1 0 1 0 1 0 1 1 0 Swazi 0 1 0 1 0 1 0 1 1 0 USA 0 1 0 0 0 0 0 1 0 1

68
Continued from appendix 2
from from EUcij EUdij COMEScij COMESdij SACUcij SACUdijEU-SAcij
EU-SAdij PTAcij PTAdij
Swed SA 0 1 0 1 0 1 1 0 1 0 Austria 1 0 0 0 0 0 1 0 1 0 Belg 1 0 0 0 0 0 1 0 1 0 Bulg 1 0 0 0 0 0 1 0 1 0 Czech 1 0 0 0 0 0 1 0 1 0 Denm 1 0 0 0 0 0 1 0 1 0 Estonia 1 0 0 0 0 0 1 0 1 0 Finla 1 0 0 0 0 0 1 0 1 0 Fran 1 0 0 0 0 0 1 0 1 0 Germ 1 0 0 0 0 0 1 0 1 0 Hung 1 0 0 0 0 0 1 0 1 0 Irel 1 0 0 0 0 0 1 0 1 0 Italy 1 0 0 0 0 0 1 0 1 0 Nether 1 0 0 0 0 0 1 0 1 0 UK 1 0 0 0 0 0 1 0 1 0 Poland 1 0 0 0 0 0 1 0 1 0 Egypt 0 1 0 1 0 0 0 1 1 0 Keny 0 1 0 1 0 0 0 1 1 0 Malaw 0 1 0 1 0 1 0 1 1 0 Mauri 0 1 0 1 0 1 0 1 1 0 Zamb 0 1 0 1 0 1 0 1 1 0 Zimbab 0 1 0 1 0 1 0 1 1 0 Gree 1 0 0 0 0 0 1 0 1 0 Portu 1 0 0 0 0 0 1 0 1 0 Spain 1 0 0 0 0 0 1 0 1 0 Cyp 1 0 0 0 0 0 1 0 1 0 Latvia 1 0 0 0 0 0 1 0 1 0 Malta 1 0 0 0 0 0 1 0 1 0 Slovak 1 0 0 0 0 0 1 0 1 0 Slove 1 0 0 0 0 0 1 0 1 0 Lithu 1 0 0 0 0 0 1 0 1 0 Bots 0 1 0 1 0 1 0 1 1 0 Lesot 0 1 0 1 0 1 0 1 1 0 Namib 0 1 0 1 0 1 0 1 1 0 Swazi 0 1 0 1 0 1 0 1 1 0 USA 0 1 0 0 0 0 0 1 0 1

69
Continued from appendix 2
from to EUcij EUdij COMEScij COMESdij SACUcij SACUdijEU-SAcij
EU-SAdij PTAcij PTAdij
Hung SA 0 1 0 1 0 1 1 0 1 0 Aus 1 0 0 0 0 0 1 0 1 0 Belg 1 0 0 0 0 0 1 0 1 0 Bulg 1 0 0 0 0 0 1 0 1 0 czech 1 0 0 0 0 0 1 0 1 0 Denm 1 0 0 0 0 0 1 0 1 0 Eston 1 0 0 0 0 0 1 0 1 0 Finl 1 0 0 0 0 0 1 0 1 0 Fran 1 0 0 0 0 0 1 0 1 0 Germ 1 0 0 0 0 0 1 0 1 0 Sweden 1 0 0 0 0 0 1 0 1 0 Irel 1 0 0 0 0 0 1 0 1 0 Italy 1 0 0 0 0 0 1 0 1 0 Nether 1 0 0 0 0 0 1 0 1 0 UK 1 0 0 0 0 0 1 0 1 0 Poland 1 0 0 0 0 0 1 0 1 0 Egypt 0 1 0 1 0 0 0 1 1 0 Keny 0 1 0 1 0 0 0 1 1 0 Malaw 0 1 0 1 0 1 0 1 1 0 Mauri 0 1 0 1 0 1 0 1 1 0 Zamb 0 1 0 1 0 1 0 1 1 0 Zimbab 0 1 0 1 0 1 0 1 1 0 Gree 1 0 0 0 0 0 1 0 1 0 Portu 1 0 0 0 0 0 1 0 1 0 Spain 1 0 0 0 0 0 1 0 1 0 Cyp 1 0 0 0 0 0 1 0 1 0 Latvia 1 0 0 0 0 0 1 0 1 0 Malta 1 0 0 0 0 0 1 0 1 0 Slovak 1 0 0 0 0 0 1 0 1 0 Slove 1 0 0 0 0 0 1 0 1 0 Lithu 1 0 0 0 0 0 1 0 1 0 Bots 0 1 0 1 0 1 0 1 1 0 Lesot 0 1 0 1 0 1 0 1 1 0 Namib 0 1 0 1 0 1 0 1 1 0 Swazi 0 1 0 1 0 1 0 1 1 0 USA 0 1 0 0 0 0 0 1 0 1

70
Continued from appendix 2
from to EUcij EUdij COMEScij COMESdij SACUcij SACUdijEU-SAcij
EU-SAdij PTAcij PTAdij
Italy SA 0 1 0 1 0 1 1 0 1 0 Austria 1 0 0 0 0 0 1 0 1 0 Belg 1 0 0 0 0 0 1 0 1 0 Bulg 1 0 0 0 0 0 1 0 1 0 Czech 1 0 0 0 0 0 1 0 1 0 Denm 1 0 0 0 0 0 1 0 1 0 Eston 1 0 0 0 0 0 1 0 1 0 Finl 1 0 0 0 0 0 1 0 1 0 Fran 1 0 0 0 0 0 1 0 1 0 Germ 1 0 0 0 0 0 1 0 1 0 Swed 1 0 0 0 0 0 1 0 1 0 Hung 1 0 0 0 0 0 1 0 1 0 Irel 1 0 0 0 0 0 1 0 1 0 Nether 1 0 0 0 0 0 1 0 1 0 UK 1 0 0 0 0 0 1 0 1 0 Poland 1 0 0 0 0 0 1 0 1 0 Egypt 0 1 0 1 0 0 0 1 1 0 Keny 0 1 0 1 0 0 0 1 1 0 Malaw 0 1 0 1 0 1 0 1 1 0 Mauri 0 1 0 1 0 1 0 1 1 0 Zamb 0 1 0 1 0 1 0 1 1 0 Zimbab 0 1 0 1 0 1 0 1 1 0 Gree 1 0 0 0 0 0 1 0 1 0 Portu 1 0 0 0 0 0 1 0 1 0 Spain 1 0 0 0 0 0 1 0 1 0 Cyp 1 0 0 0 0 0 1 0 1 0 Latvia 1 0 0 0 0 0 1 0 1 0 Malta 1 0 0 0 0 0 1 0 1 0 Slovak 1 0 0 0 0 0 1 0 1 0 Slove 1 0 0 0 0 0 1 0 1 0 Lithu 1 0 0 0 0 0 1 0 1 0 Bots 0 1 0 1 0 1 0 1 1 0 Lesot 0 1 0 1 0 1 0 1 1 0 Namib 0 1 0 1 0 1 0 1 1 0 Swazi 0 1 0 1 0 1 0 1 1 0 USA 0 1 0 0 0 0 0 0 0 1

71
Continued from appendix 2
from to EUcij EUdij COMEScij COMESdij SACUcij SACUdijEU-SAcij
EU-SAdij PTAcij PTAdij
Nether SA 0 1 0 1 0 1 1 0 1 0 Aus 1 0 0 0 0 0 1 0 1 0 Belg 1 0 0 0 0 0 1 0 1 0 Bulg 1 0 0 0 0 0 1 0 1 0 Czech 1 0 0 0 0 0 1 0 1 0 Denm 1 0 0 0 0 0 1 0 1 0 Estonia 1 0 0 0 0 0 1 0 1 0 Finl 1 0 0 0 0 0 1 0 1 0 Fran 1 0 0 0 0 0 1 0 1 0 Germ 1 0 0 0 0 0 1 0 1 0 Swed 1 0 0 0 0 0 1 0 1 0 Hung 1 0 0 0 0 0 1 0 1 0 Irel 1 0 0 0 0 0 1 0 1 0 Italy 1 0 0 0 0 0 1 0 1 0 UK 1 0 0 0 0 0 1 0 1 0 Poland 1 0 0 0 0 0 1 0 1 0 Egypt 0 1 0 1 0 0 0 1 1 0 Keny 0 1 0 1 0 0 0 1 1 0 Malaw 0 1 0 1 0 1 0 1 1 0 Mauri 0 1 0 1 0 1 0 1 1 0 Zamb 0 1 0 1 0 1 0 1 1 0 Zimbab 0 1 0 1 0 1 0 1 1 0 Gree 1 0 0 0 0 0 1 0 1 0 Portu 1 0 0 0 0 0 1 0 1 0 Spain 1 0 0 0 0 0 1 0 1 0 Cyp 1 0 0 0 0 0 1 0 1 0 Latvia 1 0 0 0 0 0 1 0 1 0 Malta 1 0 0 0 0 0 1 0 1 0 Slovak 1 0 0 0 0 0 1 0 1 0 Slove 1 0 0 0 0 0 1 0 1 0 Lithu 1 0 0 0 0 0 1 0 1 0 Bots 0 1 0 1 0 1 0 1 1 0 Lesot 0 1 0 1 0 1 0 1 1 0 Namib 0 1 0 1 0 1 0 1 1 0 Swazi 0 1 0 1 0 1 0 1 1 0 USA 0 1 0 0 0 0 0 1 0 1

72
Continued from appendix 2
from to EUcij EUdij COMEScij COMESdij SACUcij SACUdijEU-SAcij
EU-SAdij PTAcij PTAdij
UK SA 0 1 0 1 0 1 1 0 1 0 Aus 1 0 0 0 0 0 1 0 1 0 Belg 1 0 0 0 0 0 1 0 1 0 Bulg 1 0 0 0 0 0 1 0 1 0 Czech 1 0 0 0 0 0 1 0 1 0 Denm 1 0 0 0 0 0 1 0 1 0 Eston 1 0 0 0 0 0 1 0 1 0 Finl 1 0 0 0 0 0 1 0 1 0 Fran 1 0 0 0 0 0 1 0 1 0 Germ 1 0 0 0 0 0 1 0 1 0 Swed 1 0 0 0 0 0 1 0 1 0 Hung 1 0 0 0 0 0 1 0 1 0 Irel 1 0 0 0 0 0 1 0 1 0 Italy 1 0 0 0 0 0 1 0 1 0 Nether 1 0 0 0 0 0 1 0 1 0 Poland 1 0 0 0 0 0 1 0 1 0 Egypt 0 1 0 1 0 0 0 1 1 0 Keny 0 1 0 1 0 0 0 1 1 0 Malaw 0 1 0 1 0 1 0 1 1 0 Mauri 0 1 0 1 0 1 0 1 1 0 Zamb 0 1 0 1 0 1 0 1 1 0 Zimbab 0 1 0 1 0 1 0 1 1 0 Gree 1 0 0 0 0 0 1 0 1 0 Portu 1 0 0 0 0 0 1 0 1 0 Spain 1 0 0 0 0 0 1 0 1 0 Cyp 1 0 0 0 0 0 1 0 1 0 Latvia 1 0 0 0 0 0 1 0 1 0 Malta 1 0 0 0 0 0 1 0 1 0 Slovak 1 0 0 0 0 0 1 0 1 0 Slove 1 0 0 0 0 0 1 0 1 0 Lithu 1 0 0 0 0 0 1 0 1 0 Bots 0 1 0 1 0 1 0 1 1 0 Lesot 0 1 0 1 0 1 0 1 1 0 Namib 0 1 0 1 0 1 0 1 1 0 Swazi 0 1 0 1 0 1 0 1 1 0 USA 0 1 0 0 0 0 0 1 0 1

73
Continued from appendix 2
from to EUcij EUdij
COMEScij
COMESdij
SACUcij
SACUdij
EU-SAcij
EU-SAdij PTAcij PTAdij
Pola SA 0 1 0 1 0 1 1 0 1 0 Aus 1 0 0 0 0 0 1 0 1 0 Belg 1 0 0 0 0 0 1 0 1 0 Bulg 1 0 0 0 0 0 1 0 1 0 Czech 1 0 0 0 0 0 1 0 1 0 Denm 1 0 0 0 0 0 1 0 1 0 Eston 1 0 0 0 0 0 1 0 1 0 Finl 1 0 0 0 0 0 1 0 1 0 Fran 1 0 0 0 0 0 1 0 1 0 Germ 1 0 0 0 0 0 1 0 1 0 Swed 1 0 0 0 0 0 1 0 1 0 Hung 1 0 0 0 0 0 1 0 1 0 Irel 1 0 0 0 0 0 1 0 1 0 Italy 1 0 0 0 0 0 1 0 1 0 Nether 1 0 0 0 0 0 1 0 1 0 UK 1 0 0 0 0 0 1 0 1 0 Egypt 0 1 0 1 0 0 0 1 1 0 Keny 0 1 0 1 0 0 0 1 1 0 Malaw 0 1 0 1 0 1 0 1 1 0 Mauri 0 1 0 1 0 1 0 1 1 0 Zamb 0 1 0 1 0 1 0 1 1 0 Zimbab 0 1 0 1 0 1 0 1 1 0 Gree 1 0 0 0 0 0 1 0 1 0 Portu 1 0 0 0 0 0 1 0 1 0 Spain 1 0 0 0 0 0 1 0 1 0 Cyp 1 0 0 0 0 0 1 0 1 0 Latvia 1 0 0 0 0 0 1 0 1 0 Malta 1 0 0 0 0 0 1 0 1 0 Slovak 1 0 0 0 0 0 1 0 1 0 Slove 1 0 0 0 0 0 1 0 1 0 Lithu 1 0 0 0 0 0 1 0 1 0 Bots 0 1 0 1 0 1 0 1 1 0 Lesot 0 1 0 1 0 1 0 1 1 0 Namib 0 1 0 1 0 1 0 1 1 0 Swazi 0 1 0 1 0 1 0 1 1 0 USA 0 1 0 0 0 0 0 1 0 1
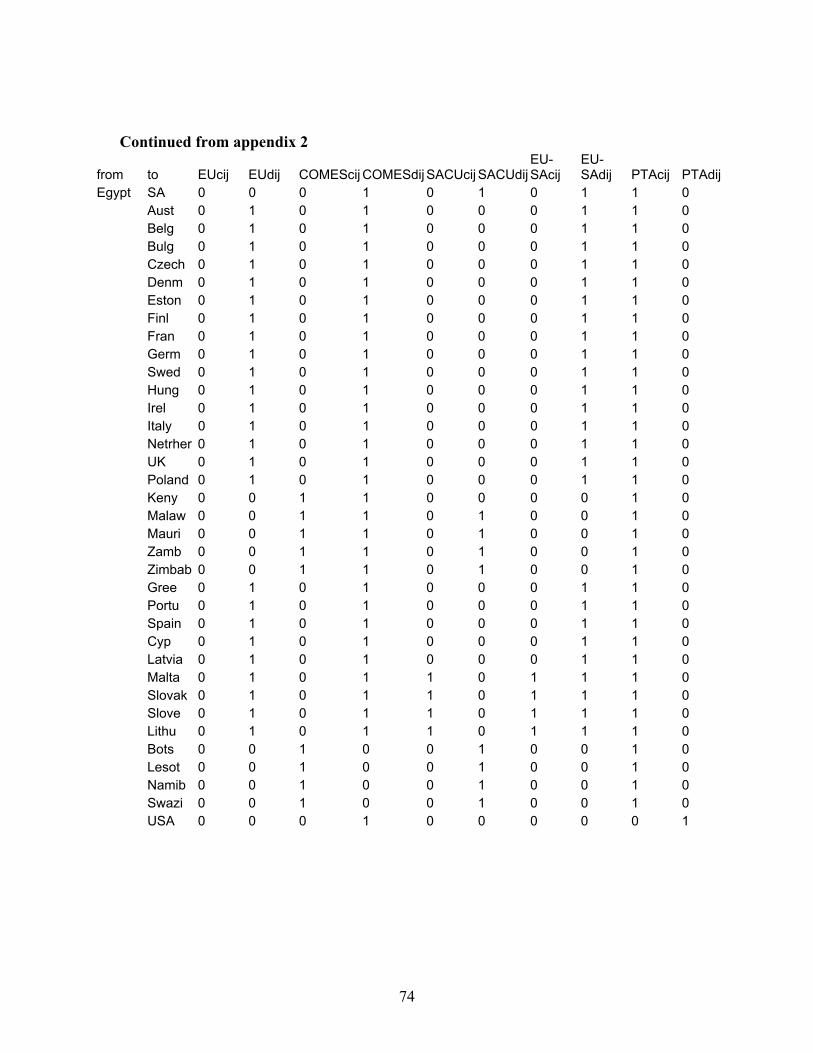
74
Continued from appendix 2
from to EUcij EUdij COMEScij COMESdij SACUcij SACUdijEU-SAcij
EU-SAdij PTAcij PTAdij
Egypt SA 0 0 0 1 0 1 0 1 1 0 Aust 0 1 0 1 0 0 0 1 1 0 Belg 0 1 0 1 0 0 0 1 1 0 Bulg 0 1 0 1 0 0 0 1 1 0 Czech 0 1 0 1 0 0 0 1 1 0 Denm 0 1 0 1 0 0 0 1 1 0 Eston 0 1 0 1 0 0 0 1 1 0 Finl 0 1 0 1 0 0 0 1 1 0 Fran 0 1 0 1 0 0 0 1 1 0 Germ 0 1 0 1 0 0 0 1 1 0 Swed 0 1 0 1 0 0 0 1 1 0 Hung 0 1 0 1 0 0 0 1 1 0 Irel 0 1 0 1 0 0 0 1 1 0 Italy 0 1 0 1 0 0 0 1 1 0 Netrher 0 1 0 1 0 0 0 1 1 0 UK 0 1 0 1 0 0 0 1 1 0 Poland 0 1 0 1 0 0 0 1 1 0 Keny 0 0 1 1 0 0 0 0 1 0 Malaw 0 0 1 1 0 1 0 0 1 0 Mauri 0 0 1 1 0 1 0 0 1 0 Zamb 0 0 1 1 0 1 0 0 1 0 Zimbab 0 0 1 1 0 1 0 0 1 0 Gree 0 1 0 1 0 0 0 1 1 0 Portu 0 1 0 1 0 0 0 1 1 0 Spain 0 1 0 1 0 0 0 1 1 0 Cyp 0 1 0 1 0 0 0 1 1 0 Latvia 0 1 0 1 0 0 0 1 1 0 Malta 0 1 0 1 1 0 1 1 1 0 Slovak 0 1 0 1 1 0 1 1 1 0 Slove 0 1 0 1 1 0 1 1 1 0 Lithu 0 1 0 1 1 0 1 1 1 0 Bots 0 0 1 0 0 1 0 0 1 0 Lesot 0 0 1 0 0 1 0 0 1 0 Namib 0 0 1 0 0 1 0 0 1 0 Swazi 0 0 1 0 0 1 0 0 1 0 USA 0 0 0 1 0 0 0 0 0 1

75
Continued from appendix 2
from to EUcij EUdij
COMEScij
COMESdij
SACUcij
SACUdij
EU-SAcij
EU-SAdij PTAcij PTAdij
Kenya SA 0 0 0 1 0 1 0 1 1 0 Aust 0 1 0 1 0 0 0 1 1 0 Belg 0 1 0 1 0 0 0 1 1 0 Bulg 0 1 0 1 0 0 0 1 1 0 Czech 0 1 0 1 0 0 0 1 1 0 Denm 0 1 0 1 0 0 0 1 1 0 Eston 0 1 0 1 0 0 0 1 1 0 Finl 0 1 0 1 0 0 0 1 1 0 Fran 0 1 0 1 0 0 0 1 1 0 Germ 0 1 0 1 0 0 0 1 1 0 Swed 0 1 0 1 0 0 0 1 1 0 Hung 0 1 0 1 0 0 0 1 1 0 Irel 0 1 0 1 0 0 0 1 1 0 Italy 0 1 0 1 0 0 0 1 1 0 Nether 0 1 0 1 0 0 0 1 1 0 UK 0 1 0 1 0 0 0 1 1 0 Poland 0 1 0 1 0 0 0 1 1 0 Egypt 0 0 1 1 0 0 0 0 1 0 Malaw 0 0 1 1 0 1 0 0 1 0 Mauri 0 0 1 1 0 1 0 0 1 0 Zamb 0 0 1 1 0 1 0 0 1 0 Zimbab 0 0 1 1 0 1 0 0 1 0 Gree 0 1 0 1 0 0 0 1 1 0 Portu 0 1 0 1 0 0 0 1 1 0 Spain 0 1 0 1 0 0 0 1 1 0 Cyp 0 1 0 1 0 0 0 1 1 0 Latvia 0 1 0 1 0 0 0 1 1 0 Malta 0 1 0 1 1 0 1 1 1 0 Slovak 0 1 0 1 1 0 1 1 1 0 Slove 0 1 0 1 1 0 1 1 1 0 Lithu 0 1 0 1 1 0 1 1 1 0 Bots 0 0 0 1 1 1 0 0 1 0 Lesot 0 0 0 1 1 1 0 0 1 0 Namib 0 0 0 1 1 1 0 0 1 0 Swazi 0 0 1 1 0 1 0 0 1 0 USA 0 0 0 1 0 0 0 0 0 1

76
Continued from appendix 2
from to EUcij EUdij
COMEScij
COMESdij
SACUcij
SACUdij
EU-SAcij
EU-SAdij PTAcij PTAdij
Malaw SA 0 0 0 1 0 1 0 1 1 0 Aus 0 1 0 1 0 0 0 1 1 0 Belg 0 1 0 1 0 0 0 1 1 0 Bulg 0 1 0 1 0 0 0 1 1 0 Czech 0 1 0 1 0 0 0 1 1 0 Denm 0 1 0 1 0 0 0 1 1 0 Eston 0 1 0 1 0 0 0 1 1 0 Finl 0 1 0 1 0 0 0 1 1 0 Fran 0 1 0 1 0 0 0 1 1 0 Germ 0 1 0 1 0 0 0 1 1 0 Swed 0 1 0 1 0 0 0 1 1 0 Hung 0 1 0 1 0 0 0 1 1 0 Irel 0 1 0 1 0 0 0 1 1 0 Italy 0 1 0 1 0 0 0 1 1 0 Nether 0 1 0 1 0 0 0 1 1 0 UK 0 1 0 1 0 0 0 1 1 0 Poland 0 1 0 1 0 0 0 1 1 0 Egypt 0 0 1 1 0 0 0 0 1 0 Keny 0 0 1 1 0 0 0 0 1 0 Mauri 0 0 1 1 0 1 0 0 1 0 Zamb 0 0 1 1 0 1 0 0 1 0 Zimbab 0 0 1 1 0 1 0 0 1 0 Gree 0 1 0 1 0 1 0 1 1 0 Portu 0 1 0 1 0 0 0 1 1 0 Spain 0 1 0 1 0 0 0 1 1 0 Cyp 0 1 0 1 0 0 0 1 1 0 Latvia 0 1 0 1 0 0 0 1 1 0 Malta 0 1 0 1 1 0 1 1 1 0 Slovak 0 1 0 1 1 0 1 1 1 0 Slove 0 1 0 1 1 0 1 1 1 0 Lithu 0 1 0 1 1 0 1 1 1 0 Bots 0 0 1 0 1 1 0 0 1 0 Lesot 0 0 1 0 1 1 0 0 1 0 Namib 0 0 1 0 1 1 0 0 1 0 Swazi 0 0 1 0 1 1 0 0 1 0 USA 0 0 0 1 0 0 0 0 0 1

77
Continued from appendix 2
from to EUcij EUdij COMEScij COMESdij SACUcij SACUdijEU-SAcij
EU-SAdij PTAcij PTAdij
Mauri SA 0 0 0 1 0 1 0 1 1 0 Aust 0 1 0 1 0 0 0 1 1 0 Belg 0 1 0 1 0 0 0 1 1 0 Bulg 0 1 0 1 0 0 0 1 1 0 Czech 0 1 0 1 0 0 0 1 1 0 Denm 0 1 0 1 0 0 0 1 1 0 Eston 0 1 0 1 0 0 0 1 1 0 Finl 0 1 0 1 0 0 0 1 1 0 Fran 0 1 0 1 0 0 0 1 1 0 Germ 0 1 0 1 0 0 0 1 1 0 Swed 0 1 0 1 0 0 0 1 1 0 Hung 0 1 0 1 0 0 0 1 1 0 Irel 0 1 0 1 0 0 0 1 1 0 Italy 0 1 0 1 0 0 0 1 1 0 Nether 0 1 0 1 0 0 0 1 1 0 UK 0 1 0 1 0 0 0 1 1 0 Poland 0 1 0 1 0 0 0 1 1 0 Egypt 0 0 1 1 0 0 0 0 1 0 Keny 0 0 1 1 0 0 0 0 1 0 Malaw 0 0 1 1 1 0 0 0 1 0 Zamb 0 0 1 1 1 0 0 0 1 0 Zimbab 0 0 1 1 1 0 0 0 1 0 Gree 0 1 0 1 1 0 0 1 1 0 Portu 0 1 0 1 0 0 0 1 1 0 Spain 0 1 0 1 0 0 0 1 1 0 Cyp 0 1 0 1 0 0 0 1 1 0 Latvia 0 1 0 1 0 0 0 1 1 0 Malta 0 1 0 1 1 0 1 1 1 0 Slovak 0 1 0 1 1 0 1 1 1 0 Slove 0 1 0 1 1 0 1 1 1 0 Lithu 0 1 0 1 1 0 1 1 1 0 Bots 0 0 1 0 1 1 0 0 1 0 Lesot 0 0 1 0 1 1 0 0 1 0 Namib 0 0 1 0 1 1 0 0 1 0 Swazi 0 0 1 0 1 1 0 0 1 0 USA 0 0 0 1 0 0 0 0 0 1
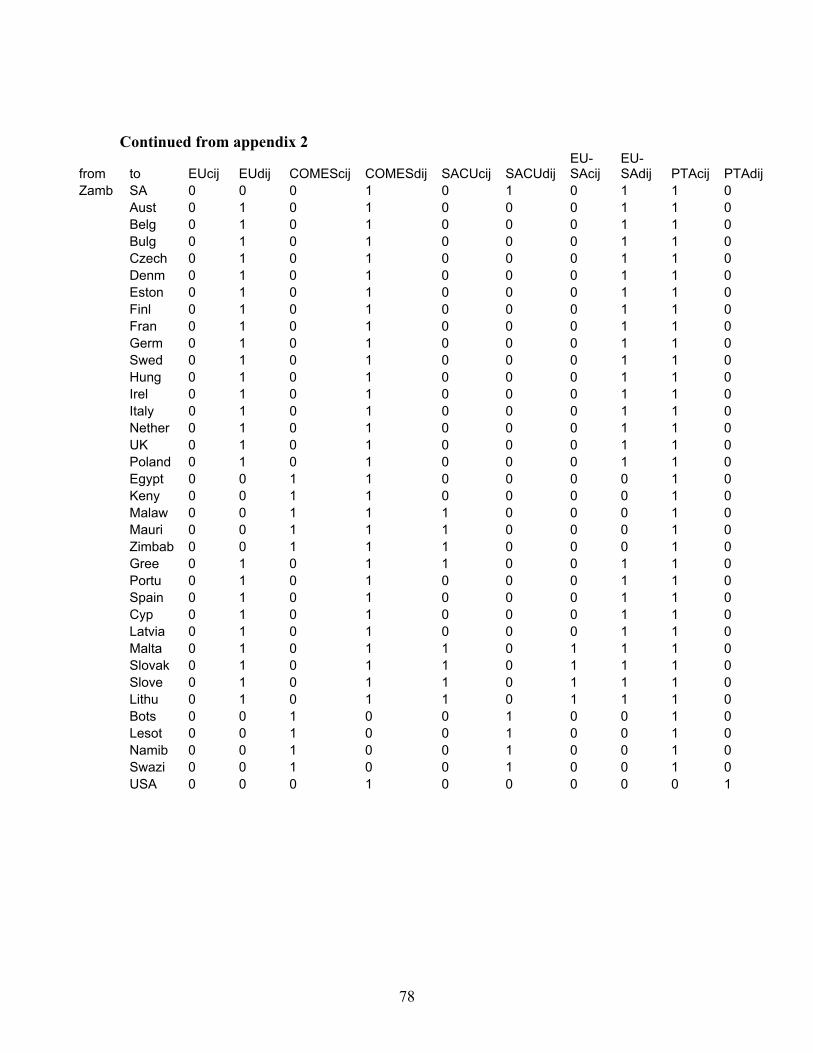
78
Continued from appendix 2
from to EUcij EUdij COMEScij COMESdij SACUcij SACUdijEU-SAcij
EU-SAdij PTAcij PTAdij
Zamb SA 0 0 0 1 0 1 0 1 1 0 Aust 0 1 0 1 0 0 0 1 1 0 Belg 0 1 0 1 0 0 0 1 1 0 Bulg 0 1 0 1 0 0 0 1 1 0 Czech 0 1 0 1 0 0 0 1 1 0 Denm 0 1 0 1 0 0 0 1 1 0 Eston 0 1 0 1 0 0 0 1 1 0 Finl 0 1 0 1 0 0 0 1 1 0 Fran 0 1 0 1 0 0 0 1 1 0 Germ 0 1 0 1 0 0 0 1 1 0 Swed 0 1 0 1 0 0 0 1 1 0 Hung 0 1 0 1 0 0 0 1 1 0 Irel 0 1 0 1 0 0 0 1 1 0 Italy 0 1 0 1 0 0 0 1 1 0 Nether 0 1 0 1 0 0 0 1 1 0 UK 0 1 0 1 0 0 0 1 1 0 Poland 0 1 0 1 0 0 0 1 1 0 Egypt 0 0 1 1 0 0 0 0 1 0 Keny 0 0 1 1 0 0 0 0 1 0 Malaw 0 0 1 1 1 0 0 0 1 0 Mauri 0 0 1 1 1 0 0 0 1 0 Zimbab 0 0 1 1 1 0 0 0 1 0 Gree 0 1 0 1 1 0 0 1 1 0 Portu 0 1 0 1 0 0 0 1 1 0 Spain 0 1 0 1 0 0 0 1 1 0 Cyp 0 1 0 1 0 0 0 1 1 0 Latvia 0 1 0 1 0 0 0 1 1 0 Malta 0 1 0 1 1 0 1 1 1 0 Slovak 0 1 0 1 1 0 1 1 1 0 Slove 0 1 0 1 1 0 1 1 1 0 Lithu 0 1 0 1 1 0 1 1 1 0 Bots 0 0 1 0 0 1 0 0 1 0 Lesot 0 0 1 0 0 1 0 0 1 0 Namib 0 0 1 0 0 1 0 0 1 0 Swazi 0 0 1 0 0 1 0 0 1 0 USA 0 0 0 1 0 0 0 0 0 1
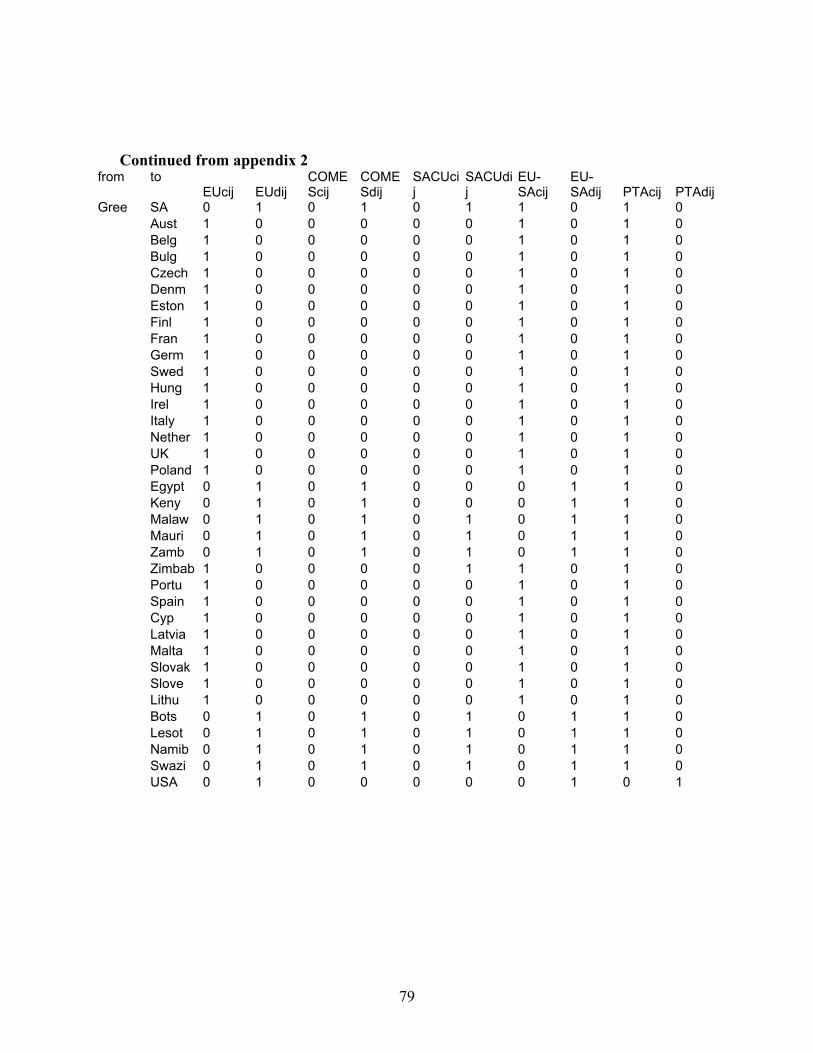
79
Continued from appendix 2
from to EUcij EUdij
COMEScij
COMESdij
SACUcij
SACUdij
EU-SAcij
EU-SAdij PTAcij PTAdij
Gree SA 0 1 0 1 0 1 1 0 1 0 Aust 1 0 0 0 0 0 1 0 1 0 Belg 1 0 0 0 0 0 1 0 1 0 Bulg 1 0 0 0 0 0 1 0 1 0 Czech 1 0 0 0 0 0 1 0 1 0 Denm 1 0 0 0 0 0 1 0 1 0 Eston 1 0 0 0 0 0 1 0 1 0 Finl 1 0 0 0 0 0 1 0 1 0 Fran 1 0 0 0 0 0 1 0 1 0 Germ 1 0 0 0 0 0 1 0 1 0 Swed 1 0 0 0 0 0 1 0 1 0 Hung 1 0 0 0 0 0 1 0 1 0 Irel 1 0 0 0 0 0 1 0 1 0 Italy 1 0 0 0 0 0 1 0 1 0 Nether 1 0 0 0 0 0 1 0 1 0 UK 1 0 0 0 0 0 1 0 1 0 Poland 1 0 0 0 0 0 1 0 1 0 Egypt 0 1 0 1 0 0 0 1 1 0 Keny 0 1 0 1 0 0 0 1 1 0 Malaw 0 1 0 1 0 1 0 1 1 0 Mauri 0 1 0 1 0 1 0 1 1 0 Zamb 0 1 0 1 0 1 0 1 1 0 Zimbab 1 0 0 0 0 1 1 0 1 0 Portu 1 0 0 0 0 0 1 0 1 0 Spain 1 0 0 0 0 0 1 0 1 0 Cyp 1 0 0 0 0 0 1 0 1 0 Latvia 1 0 0 0 0 0 1 0 1 0 Malta 1 0 0 0 0 0 1 0 1 0 Slovak 1 0 0 0 0 0 1 0 1 0 Slove 1 0 0 0 0 0 1 0 1 0 Lithu 1 0 0 0 0 0 1 0 1 0 Bots 0 1 0 1 0 1 0 1 1 0 Lesot 0 1 0 1 0 1 0 1 1 0 Namib 0 1 0 1 0 1 0 1 1 0 Swazi 0 1 0 1 0 1 0 1 1 0 USA 0 1 0 0 0 0 0 1 0 1

80
Continued from appendix 2
from to EUcij EUdij COMEScij COMESdij SACUcij SACUdijEU-SAcij
EU-SAdij PTAcij PTAdij
Portu SA 0 1 0 1 0 1 1 0 1 0 Aust 1 0 0 0 0 0 1 0 1 0 Belg 1 0 0 0 0 0 1 0 1 0 Bulg 1 0 0 0 0 0 1 0 1 0 Czech 1 0 0 0 0 0 1 0 1 0 Denm 1 0 0 0 0 0 1 0 1 0 Eston 1 0 0 0 0 0 1 0 1 0 Finl 1 0 0 0 0 0 1 0 1 0 Fran 1 0 0 0 0 0 1 0 1 0 Germ 1 0 0 0 0 0 1 0 1 0 Swed 1 0 0 0 0 0 1 0 1 0 Hung 1 0 0 0 0 0 1 0 1 0 Irel 1 0 0 0 0 0 1 0 1 0 Italy 1 0 0 0 0 0 1 0 1 0 Nether 1 0 0 0 0 0 1 0 1 0 UK 1 0 0 0 0 0 1 0 1 0 Poland 1 0 0 0 0 0 1 0 1 0 Egypt 0 1 0 1 0 0 0 1 1 0 Keny 0 1 0 1 0 0 0 1 1 0 Malaw 0 1 0 1 0 1 0 1 1 0 Mauri 0 1 0 1 0 1 0 1 1 0 Zamb 0 1 0 1 0 1 0 1 1 0 Zimbab 1 0 0 0 0 1 1 0 1 0 Gree 1 0 0 0 0 0 1 0 1 0 Spain 1 0 0 0 0 0 1 0 1 0 Cyp 1 0 0 0 0 0 1 0 1 0 Latvia 1 0 0 0 0 0 1 0 1 0 Malta 1 0 0 0 0 0 1 0 1 0 Slovak 1 0 0 0 0 0 1 0 1 0 Slove 1 0 0 0 0 0 1 0 1 0 Lithu 1 0 0 0 0 0 1 0 1 0 Bots 0 1 0 1 0 1 0 1 1 0 Lesot 0 1 0 1 0 1 0 1 1 0 Namib 0 1 0 1 0 1 0 1 1 0 Swazi 0 1 0 1 0 1 0 1 1 0 USA 0 1 0 0 0 0 0 1 0 1

81
Continued from appendix 2
from to EUcij EUdij
COMEScij
COMESdij
SACUcij
SACUdij
EU-SAcij
EU-SAdij PTAcij PTAdij
Spain SA 0 1 0 1 0 1 1 0 1 0 Aus 1 0 0 0 0 0 1 0 1 0 Belg 1 0 0 0 0 0 1 0 1 0 Bulg 1 0 0 0 0 0 1 0 1 0 Czech 1 0 0 0 0 0 1 0 1 0 Denm 1 0 0 0 0 0 1 0 1 0 Eston 1 0 0 0 0 0 1 0 1 0 Finl 1 0 0 0 0 0 1 0 1 0 Fran 1 0 0 0 0 0 1 0 1 0 Germ 1 0 0 0 0 0 1 0 1 0 Swed 1 0 0 0 0 0 1 0 1 0 Hung 1 0 0 0 0 0 1 0 1 0 Irel 1 0 0 0 0 0 1 0 1 0 Italy 1 0 0 0 0 0 1 0 1 0 Nether 1 0 0 0 0 0 1 0 1 0 UK 1 0 0 0 0 0 1 0 1 0 Polan 1 0 0 0 0 0 1 0 1 0 Egypt 0 1 0 1 0 0 0 1 1 0 Keny 0 1 0 1 0 0 0 1 1 0 Malaw 0 1 0 1 0 1 0 1 1 0 Mauri 0 1 0 1 0 1 0 1 1 0 Zamb 0 1 0 1 0 1 0 1 1 0 Zimbab 1 0 0 0 0 1 1 0 1 0 Gree 1 0 0 0 0 0 1 0 1 0 Portu 1 0 0 0 0 0 1 0 1 0 Cyp 1 0 0 0 0 0 1 0 1 0 Latvia 1 0 0 0 0 0 1 0 1 0 Malta 1 0 0 0 0 0 1 0 1 0 Slovak 1 0 0 0 0 0 1 0 1 0 Slove 1 0 0 0 0 0 1 0 1 0 Lithu 1 0 0 0 0 0 1 0 1 0 Bots 0 1 0 1 0 1 0 1 1 0 Lesot 0 1 0 1 0 1 0 1 1 0 Namib 0 1 0 1 0 1 0 1 1 0 Swazi 0 1 0 1 0 1 0 1 1 0 USA 0 1 0 0 0 0 0 1 0 1

82
Continued from appendix 2
from to EUcij EUdij
COMEScij
COMESdij
SACUcij
SACUdij
EU-SAcij
EU-SAdij PTAcij PTAdij
Cyp SA 0 1 0 1 0 1 1 0 1 0 Aust 1 0 0 0 0 0 1 0 1 0 Belg 1 0 0 0 0 0 1 0 1 0 Bulg 1 0 0 0 0 0 1 0 1 0 Czech 1 0 0 0 0 0 1 0 1 0 Denm 1 0 0 0 0 0 1 0 1 0 Eston 1 0 0 0 0 0 1 0 1 0 Finl 1 0 0 0 0 0 1 0 1 0 Fran 1 0 0 0 0 0 1 0 1 0 Germ 1 0 0 0 0 0 1 0 1 0 Swed 1 0 0 0 0 0 1 0 1 0 Hung 1 0 0 0 0 0 1 0 1 0 Irel 1 0 0 0 0 0 1 0 1 0 Italy 1 0 0 0 0 0 1 0 1 0 Nether 1 0 0 0 0 0 1 0 1 0 UK 1 0 0 0 0 0 1 0 1 0 Polan 1 0 0 0 0 0 1 0 1 0 Egypt 0 1 0 1 0 0 0 1 1 0 Keny 0 1 0 1 0 0 0 1 1 0 Malaw 0 1 0 1 0 1 0 1 1 0 Mauri 0 1 0 1 0 1 0 1 1 0 Zamb 0 1 0 1 0 1 0 1 1 0 Zimbab 1 0 0 0 0 1 1 0 1 0 Gree 1 0 0 0 0 0 1 0 1 0 Portu 1 0 0 0 0 0 1 0 1 0 Spain 1 0 0 0 0 0 1 0 1 0 Latvia 1 0 0 0 0 0 1 0 1 0 Malta 1 0 0 0 0 0 1 0 1 0 Slovak 1 0 0 0 0 0 1 0 1 0 Slove 1 0 0 0 0 0 1 0 1 0 Lithu 1 0 0 0 0 0 1 0 1 0 Bots 0 1 0 1 0 1 0 1 1 0 Lesot 0 1 0 1 0 1 0 1 1 0 Namib 0 1 0 1 0 1 0 1 1 0 Swazi 0 1 0 1 0 1 0 1 1 0 USA 0 1 0 0 0 0 0 1 0 1

83
Continued from appendix 2
from to EUcij EUdij
COMEScij
COMESdij
SACUcij
SACUdij
EU-SAcij
EU-SAdij PTAcij PTAdij
Latvia SA 0 1 0 1 0 1 1 0 1 0 Aust 1 0 0 0 0 0 1 0 1 0 Belg 1 0 0 0 0 0 1 0 1 0 Bulg 1 0 0 0 0 0 1 0 1 0 Czech 1 0 0 0 0 0 1 0 1 0 Denm 1 0 0 0 0 0 1 0 1 0 Eston 1 0 0 0 0 0 1 0 1 0 Finl 1 0 0 0 0 0 1 0 1 0 Fran 1 0 0 0 0 0 1 0 1 0 Germ 1 0 0 0 0 0 1 0 1 0 Swed 1 0 0 0 0 0 1 0 1 0 Hung 1 0 0 0 0 0 1 0 1 0 Irel 1 0 0 0 0 0 1 0 1 0 Italy 1 0 0 0 0 0 1 0 1 0 Nether 1 0 0 0 0 0 1 0 1 0 UK 1 0 0 0 0 0 1 0 1 0 Polan 1 0 0 0 0 0 1 0 1 0 Egypt 0 1 0 1 0 0 0 1 1 0 Keny 0 1 0 1 0 0 0 1 1 0 Malaw 0 1 0 1 0 1 0 1 1 0 Mauri 0 1 0 1 0 1 0 1 1 0 Zamb 0 1 0 1 0 1 0 1 1 0 Zimbab 1 0 0 0 0 1 1 0 1 0 Gree 1 0 0 0 0 0 1 0 1 0 Portu 1 0 0 0 0 0 1 0 1 0 Spain 1 0 0 0 0 0 1 0 1 0 Cyp 1 0 0 0 0 0 1 0 1 0 Malta 1 0 0 0 0 0 1 0 1 0 Slovak 1 0 0 0 0 0 1 0 1 0 Slove 1 0 0 0 0 0 1 0 1 0 Lithu 1 0 0 0 0 0 1 0 1 0 Bots 0 1 0 1 0 1 0 1 1 0 Lesot 0 1 0 1 0 1 0 1 1 0 Namib 0 1 0 1 0 1 0 1 1 0 Swazi 0 1 0 1 0 1 0 1 1 0 USA 0 1 0 0 0 0 0 1 0 1

84
Continued from appendix 2
from to EUcij EUdij
COMEScij
COMESdij
SACUcij
SACUdij
EU-SAcij
EU-SAdij PTAcij PTAdij
Malta SA 0 1 0 1 0 1 1 0 1 0 Aus 1 0 0 0 0 0 1 0 1 0 Belg 1 0 0 0 0 0 1 0 1 0 Bulg 1 0 0 0 0 0 1 0 1 0 Czech 1 0 0 0 0 0 1 0 1 0 Denm 1 0 0 0 0 0 1 0 1 0 Eston 1 0 0 0 0 0 1 0 1 0 Finl 1 0 0 0 0 0 1 0 1 0 Fran 1 0 0 0 0 0 1 0 1 0 Germ 1 0 0 0 0 0 1 0 1 0 Swed 1 0 0 0 0 0 1 0 1 0 Hung 1 0 0 0 0 0 1 0 1 0 Irel 1 0 0 0 0 0 1 0 1 0 Italy 1 0 0 0 0 0 1 0 1 0 Nether 1 0 0 0 0 0 1 0 1 0 UK 1 0 0 0 0 0 1 0 1 0 Polan 1 0 0 0 0 0 1 0 1 0 Egypt 0 1 0 1 0 0 0 1 1 0 Keny 0 1 0 1 0 0 0 1 1 0 Malaw 0 1 0 1 0 0 0 1 1 0 Mauri 0 1 0 1 0 1 0 1 1 0 Zamb 0 1 0 1 0 1 0 1 1 0 Zimbab 1 0 0 0 0 1 1 0 1 0 Gree 1 0 0 0 0 0 0 0 1 0 Portu 1 0 0 0 0 0 1 0 1 0 Spain 1 0 0 0 0 0 1 0 1 0 Cyp 1 0 0 0 0 0 1 0 1 0 Latvia 1 0 0 0 0 0 1 0 1 0 Slovak 1 0 0 0 0 0 1 0 1 0 Slove 1 0 0 0 0 0 1 0 1 0 Lithu 1 0 0 0 0 0 1 0 1 0 Bots 0 1 0 1 0 1 0 1 1 0 Lesot 0 1 0 1 0 1 0 1 1 0 Namib 0 1 0 1 0 1 0 1 1 0 Swazi 0 1 0 1 0 1 0 1 1 0 USA 0 1 0 0 0 0 0 1 0 1

85
Continued from appendix 2
from to EUcij EUdij
COMEScij
COMESdij
SACUcij
SACUdij
EU-SAcij
EU-SAdij PTAcij PTAdij
Slovak SA 0 1 0 1 0 1 1 0 1 0 Aust 1 0 0 0 0 0 1 0 1 0 Belg 1 0 0 0 0 0 1 0 1 0 Bulg 1 0 0 0 0 0 1 0 1 0 Czech 1 0 0 0 0 0 1 0 1 0 Denm 1 0 0 0 0 0 1 0 1 0 Eston 1 0 0 0 0 0 1 0 1 0 Finl 1 0 0 0 0 0 1 0 1 0 Fran 1 0 0 0 0 0 1 0 1 0 Germ 1 0 0 0 0 0 1 0 1 0 Swed 1 0 0 0 0 0 1 0 1 0 Hung 1 0 0 0 0 0 1 0 1 0 Irel 1 0 0 0 0 0 1 0 1 0 Italy 1 0 0 0 0 0 1 0 1 0 Nether 1 0 0 0 0 0 1 0 1 0 UK 1 0 0 0 0 0 1 0 1 0 polan 1 0 0 0 0 0 1 0 1 0 Egypt 0 1 0 1 0 0 0 1 1 0 Keny 0 1 0 1 0 0 0 1 1 0 Malaw 0 1 0 1 0 1 0 1 1 0 Mauri 0 1 0 1 0 1 0 1 1 0 Zamb 0 1 0 1 0 1 0 1 1 0 Zimbab 1 0 0 0 0 1 1 0 1 0 Gree 1 0 0 0 0 0 1 0 1 0 Portu 1 0 0 0 0 0 1 0 1 0 Spain 1 0 0 0 0 0 1 0 1 0 Cyp 1 0 0 0 0 0 1 0 1 0 Latvia 1 0 0 0 0 0 1 0 1 0 Malta 1 0 0 0 0 0 1 0 1 0 Slove 1 0 0 0 0 0 1 0 1 0 Lithu 1 0 0 0 0 0 1 0 1 0 Bots 0 1 0 1 0 1 0 1 1 0 Lesot 0 1 0 1 0 1 0 1 1 0 Namib 0 1 0 1 0 1 0 1 1 0 Swazi 0 1 0 1 0 1 0 1 1 0 USA 0 1 0 0 0 0 0 1 0 1

86
Continued from appendix 2
from to EUcij EUdij
COMEScij
COMESdij
SACUcij
SACUdij
EU-SAcij
EU-SAdij PTAcij PTAdij
Slove SA 0 1 0 1 0 1 1 0 1 0 Aust 1 0 0 0 0 0 1 0 1 0 Belg 1 0 0 0 0 0 1 0 1 0 Bulg 1 0 0 0 0 0 1 0 1 0 Czech 1 0 0 0 0 0 1 0 1 0 Denm 1 0 0 0 0 0 1 0 1 0 Eston 1 0 0 0 0 0 1 0 1 0 Finl 1 0 0 0 0 0 1 0 1 0 Fran 1 0 0 0 0 0 1 0 1 0 Germ 1 0 0 0 0 0 1 0 1 0 Swed 1 0 0 0 0 0 1 0 1 0 Hung 1 0 0 0 0 0 1 0 1 0 Irel 1 0 0 0 0 0 1 0 1 0 Italy 1 0 0 0 0 0 1 0 1 0 Nether 1 0 0 0 0 0 1 0 1 0 UK 1 0 0 0 0 0 1 0 1 0 Pola 1 0 0 0 0 0 1 0 1 0 Egypt 0 1 0 1 0 0 0 1 1 0 Keny 0 1 0 1 0 0 0 1 1 0 Malaw 0 1 0 1 0 1 0 1 1 0 Mauri 0 1 0 1 0 1 0 1 1 0 Zamb 0 1 0 1 0 1 0 1 1 0 Zimbab 1 0 0 0 0 1 1 0 1 0 Gree 1 0 0 0 0 0 1 0 1 0 Portu 1 0 0 0 0 0 1 0 1 0 Spain 1 0 0 0 0 0 1 0 1 0 Cyp 1 0 0 0 0 0 1 0 1 0 Latvia 1 0 0 0 0 0 1 0 1 0 Malta 1 0 0 0 0 0 1 0 1 0 Slovak 1 0 0 0 0 0 1 0 1 0 Lithu 1 0 0 0 0 0 1 0 1 0 Bots 0 1 0 1 0 1 0 1 1 0 Lesot 0 1 0 1 0 1 0 1 1 0 Namib 0 1 0 1 0 1 0 1 1 0 Swazi 0 1 0 1 0 1 0 1 1 0 USA 0 1 0 0 0 0 0 1 0 1

87
Continued from appendix 2
from to EUcij EUdij
COMEScij
COMESdij
SACUcij
SACUdij
EU-SAcij
EU-SAdij PTAcij PTAdij
Lithu SA 0 1 0 1 0 1 1 0 1 0 Aus 1 0 0 0 0 0 1 0 1 0 Belg 1 0 0 0 0 0 1 0 1 0 Bulg 1 0 0 0 0 0 1 0 1 0 Czech 1 0 0 0 0 0 1 0 1 0 Denm 1 0 0 0 0 0 1 0 1 0 Eston 1 0 0 0 0 0 1 0 1 0 Finl 1 0 0 0 0 0 1 0 1 0 Fran 1 0 0 0 0 0 1 0 1 0 Germ 1 0 0 0 0 0 1 0 1 0 Swed 1 0 0 0 0 0 1 0 1 0 Hung 1 0 0 0 0 0 1 0 1 0 Irel 1 0 0 0 0 0 1 0 1 0 Italy 1 0 0 0 0 0 1 0 1 0 Nether 1 0 0 0 0 0 1 0 1 0 UK 1 0 0 0 0 0 1 0 1 0 Polan 1 0 0 0 0 0 1 0 1 0 Egypt 0 1 0 1 0 0 0 1 1 0 Keny 0 1 0 1 0 0 0 1 1 0 Malaw 0 1 0 1 0 1 0 1 1 0 Mauri 0 1 0 1 0 1 0 1 1 0 Zamb 0 1 0 1 0 1 0 1 1 0 Zimbab 1 0 0 0 0 1 1 0 1 0 Gree 1 0 0 0 0 0 1 0 1 0 Portu 1 0 0 0 0 0 1 0 1 0 Spain 1 0 0 0 0 0 1 0 1 0 Cyp 1 0 0 0 0 0 1 0 1 0 Latvia 1 0 0 0 0 0 1 0 1 0 Malta 1 0 0 0 0 0 1 0 1 0 Slovak 1 0 0 0 0 0 1 0 1 0 Slove 1 0 0 0 0 0 1 0 1 0 Bots 0 1 0 1 0 1 0 1 1 0 Lesot 0 1 0 1 0 1 0 1 1 0 Namib 0 1 0 1 0 1 0 1 1 0 Swazi 0 1 0 1 0 1 0 1 1 0 USA 0 1 0 0 0 0 0 1 0 1

88
Continued from appendix 2
from to EUcij EUdij
COMEScij
COMESdij
SACUcij
SACUdij
EU-SAcij
EU-SAdij PTAcij PTAdij
Botswa SA 0 0 0 1 1 0 0 1 1 0 Aust 0 1 0 0 0 1 0 1 1 0 Belg 0 1 0 0 0 1 0 1 1 0 Bulg 0 1 0 0 0 1 0 1 1 0 Czech 0 1 0 0 0 1 0 1 1 0 Denm 0 1 0 0 0 1 0 1 1 0 Eston 0 1 0 0 0 1 0 1 1 0 Finl 0 1 0 0 0 1 0 1 1 0 Fran 0 1 0 0 0 1 0 1 1 0 Germ 0 1 0 0 0 1 0 1 1 0 Swed 0 1 0 0 0 1 0 1 1 0 Hung 0 1 0 0 0 1 0 1 1 0 Irel 0 1 0 0 0 1 0 1 1 0 Italy 0 1 0 0 0 1 0 1 1 0 Nether 0 1 0 0 0 1 0 1 1 0 UK 0 1 0 0 0 1 0 1 1 0 Polan 0 1 0 0 0 1 0 1 1 0 Egypt 0 0 1 0 0 1 0 0 1 0 Keny 0 0 1 0 0 1 0 0 1 0 Malaw 0 0 1 0 1 0 0 0 1 0 Mauriu 0 0 1 0 1 0 0 0 1 0 Zamb 0 0 1 0 1 0 0 0 1 0 Zimbab 0 0 1 0 1 0 0 0 1 0 Gree 0 1 0 0 0 1 0 1 1 0 Portu 0 1 0 0 0 1 0 1 1 0 Spain 0 1 0 0 0 1 0 1 1 0 Cyp 0 1 0 0 0 1 0 1 1 0 Latvia 0 1 0 0 0 1 0 1 1 0 Malta 0 1 0 0 0 1 0 1 1 0 Slovak 0 1 0 0 0 1 0 1 1 0 Slove 0 1 0 0 0 1 0 1 1 0 Lithu 0 1 0 0 0 1 0 1 1 0 Lesot 0 0 1 0 1 0 0 0 1 0 Namib 0 0 1 0 1 0 0 0 1 0 Swazi 0 0 1 0 1 0 0 0 1 0 USA 0 0 0 0 0 1 0 0 0 1

89
Continued from appendix 2
from to EUcij EUdij
COMEScij
COMESdij
SACUcij
SACUdij
EU-SAcij
EU-SAdij PTAcij PTAdij
Lesotho SA 0 0 0 1 1 0 0 1 1 0 Aust 0 1 0 0 0 1 0 1 1 0 Belg 0 1 0 0 0 1 0 1 1 0 Bulg 0 1 0 0 0 1 0 1 1 0 Czech 0 1 0 0 0 1 0 1 1 0 Denm 0 1 0 0 0 1 0 1 1 0 Eston 0 1 0 0 0 1 0 1 1 0 Finl 0 1 0 0 0 1 0 1 1 0 Fran 0 1 0 0 0 1 0 1 1 0 Germ 0 1 0 0 0 1 0 1 1 0 Swed 0 1 0 0 0 1 0 1 1 0 Hung 0 1 0 0 0 1 0 1 1 0 Irel 0 1 0 0 0 1 0 1 1 0 Italy 0 1 0 0 0 1 0 1 1 0 Nether 0 1 0 0 0 1 0 1 1 0 UK 0 1 0 0 0 1 0 1 1 0 Polan 0 1 0 0 0 1 0 1 1 0 Egypt 0 0 1 0 0 1 0 0 1 0 Keny 0 0 1 0 0 1 0 0 1 0 Malaw 0 0 1 0 1 0 0 0 1 0 Mauri 0 0 1 0 1 0 0 0 1 0 Zamb 0 0 1 0 1 0 0 0 1 0 Zimbab 0 0 1 0 1 0 0 0 1 0 Gree 0 1 0 0 0 1 0 1 1 0 Portu 0 1 0 0 0 1 0 1 1 0 Spain 0 1 0 0 0 1 0 1 1 0 Cyp 0 1 0 0 0 1 0 1 1 0 Latvia 0 1 0 0 0 1 0 1 1 0 Malta 0 1 0 0 0 1 0 1 1 0 Slovak 0 1 0 0 0 1 0 1 1 0 Slove 0 1 0 0 0 1 0 1 1 0 Lithu 0 1 0 0 0 1 0 1 1 0 Bots 0 0 1 0 1 0 0 0 1 0 Namib 0 0 1 0 1 0 0 0 1 0 Swazi 0 0 1 0 1 0 0 0 1 0 USA 0 0 0 0 0 1 0 0 0 1

90
Continued from appendix 2
from to EUcij EUdij
COMEScij
COMESdij
SACUcij
SACUdij
EU-SAcij
EU-SAdij PTAcij PTAdij
Namib SA 0 0 0 1 1 0 0 1 1 0 Aus 0 1 0 0 0 1 0 1 1 0 Belg 0 1 0 0 0 1 0 1 1 0 Bulg 0 1 0 0 0 1 0 1 1 0 Czech 0 1 0 0 0 1 0 1 1 0 Denm 0 1 0 0 0 1 0 1 1 0 Eston 0 1 0 0 0 1 0 1 1 0 Finl 0 1 0 0 0 1 0 1 1 0 Fran 0 1 0 0 0 1 0 1 1 0 Germ 0 1 0 0 0 1 0 1 1 0 Swed 0 1 0 0 0 1 0 1 1 0 Hung 0 1 0 0 0 1 0 1 1 0 Irel 0 1 0 0 0 1 0 1 1 0 Italy 0 1 0 0 0 1 0 1 1 0 Nether 0 1 0 0 0 1 0 1 1 0 UK 0 1 0 0 0 1 0 1 1 0 Polan 0 1 0 0 0 1 0 1 1 0 Egypt 0 0 1 0 0 1 0 0 1 0 Keny 0 0 1 0 0 1 0 0 1 0 Malaw 0 0 1 0 1 0 0 0 1 0 Maur 0 0 1 0 1 0 0 0 1 0 Zamb 0 0 1 0 1 0 0 0 1 0 Zimbab 0 0 1 0 1 0 0 0 1 0 Gree 0 1 0 0 0 1 0 1 1 0 Portu 0 1 0 0 0 1 0 1 1 0 Spain 0 1 0 0 0 1 0 1 1 0 Cyp 0 1 0 0 0 1 0 1 1 0 Latvia 0 1 0 0 0 1 0 1 1 0 Malta 0 1 0 0 0 1 0 1 1 0 Slovak 0 1 0 0 0 1 0 1 1 0 Slove 0 1 0 0 0 1 0 1 1 0 Lithu 0 1 0 0 0 1 0 1 1 0 Bots 0 0 1 0 1 0 0 0 1 0 Lesoth 0 0 1 0 1 0 0 0 1 0 Swazi 0 0 1 0 1 0 0 0 1 0 USA 0 0 0 0 0 1 0 0 0 1
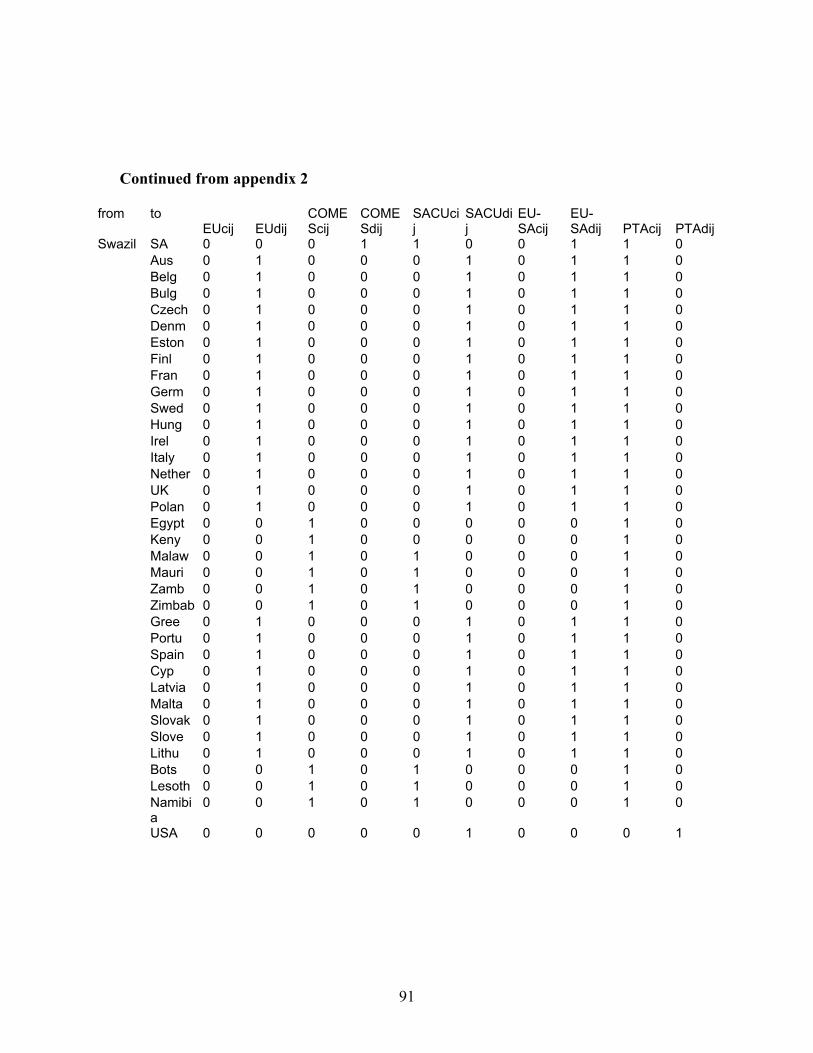
91
Continued from appendix 2
from to EUcij EUdij
COMEScij
COMESdij
SACUcij
SACUdij
EU-SAcij
EU-SAdij PTAcij PTAdij
Swazil SA 0 0 0 1 1 0 0 1 1 0 Aus 0 1 0 0 0 1 0 1 1 0 Belg 0 1 0 0 0 1 0 1 1 0 Bulg 0 1 0 0 0 1 0 1 1 0 Czech 0 1 0 0 0 1 0 1 1 0 Denm 0 1 0 0 0 1 0 1 1 0 Eston 0 1 0 0 0 1 0 1 1 0 Finl 0 1 0 0 0 1 0 1 1 0 Fran 0 1 0 0 0 1 0 1 1 0 Germ 0 1 0 0 0 1 0 1 1 0 Swed 0 1 0 0 0 1 0 1 1 0 Hung 0 1 0 0 0 1 0 1 1 0 Irel 0 1 0 0 0 1 0 1 1 0 Italy 0 1 0 0 0 1 0 1 1 0 Nether 0 1 0 0 0 1 0 1 1 0 UK 0 1 0 0 0 1 0 1 1 0 Polan 0 1 0 0 0 1 0 1 1 0 Egypt 0 0 1 0 0 0 0 0 1 0 Keny 0 0 1 0 0 0 0 0 1 0 Malaw 0 0 1 0 1 0 0 0 1 0 Mauri 0 0 1 0 1 0 0 0 1 0 Zamb 0 0 1 0 1 0 0 0 1 0 Zimbab 0 0 1 0 1 0 0 0 1 0 Gree 0 1 0 0 0 1 0 1 1 0 Portu 0 1 0 0 0 1 0 1 1 0 Spain 0 1 0 0 0 1 0 1 1 0 Cyp 0 1 0 0 0 1 0 1 1 0 Latvia 0 1 0 0 0 1 0 1 1 0 Malta 0 1 0 0 0 1 0 1 1 0 Slovak 0 1 0 0 0 1 0 1 1 0 Slove 0 1 0 0 0 1 0 1 1 0 Lithu 0 1 0 0 0 1 0 1 1 0 Bots 0 0 1 0 1 0 0 0 1 0 Lesoth 0 0 1 0 1 0 0 0 1 0 Namibi
a 0 0 1 0 1 0 0 0 1 0
USA 0 0 0 0 0 1 0 0 0 1

92
Continued from appendix 2
from to EUcij EUdij
COMEScij
COMESdij
SACUcij
SACUdij
EU-SAcij
EU-SAdij PTAcij PTAdij
USA SA 0 0 0 1 0 1 0 1 0 1 Aus 0 1 0 0 0 0 0 1 0 1 Belg 0 1 0 0 0 0 0 1 0 1 Bulg 0 1 0 0 0 0 0 1 0 1 Czech 0 1 0 0 0 0 0 1 0 1 Denm 0 1 0 0 0 0 0 1 0 1 Eston 0 1 0 0 0 0 0 1 0 1 Finl 0 1 0 0 0 0 0 1 0 1 Fran 0 1 0 0 0 0 0 1 0 1 Germ 0 1 0 0 0 0 0 1 0 1 Swed 0 1 0 0 0 0 0 1 0 1 Hung 0 1 0 0 0 0 0 1 0 1 Irel 0 1 0 0 0 0 0 1 0 1 Italy 0 1 0 0 0 0 0 1 0 1 Nether 0 1 0 0 0 0 0 1 0 1 UK 0 1 0 0 0 0 0 1 0 1 Polan 0 1 0 0 0 0 0 1 0 1 Egypt 0 0 0 1 0 0 0 0 0 1 Keny 0 0 0 1 0 0 0 0 0 1 Malaw 0 0 0 1 0 1 0 0 0 1 Mauri 0 0 0 1 0 1 0 0 0 1 Zamb 0 0 0 1 0 1 0 0 0 1 Zimbab 0 0 0 1 0 1 0 0 0 1 Gree 0 1 0 0 0 0 0 1 0 1 Portu 0 1 0 0 0 0 0 1 0 1 Spain 0 1 0 0 0 0 0 1 0 1 Cyp 0 1 0 0 0 0 0 1 0 1 Latvia 0 1 0 0 0 0 0 1 0 1 Malta 0 1 0 0 0 0 0 1 0 1 Slovak 0 1 0 0 0 0 0 1 0 1 Slove 0 1 0 0 0 0 0 1 0 1 Lithu 0 1 0 0 0 0 0 1 0 1 Bots 0 0 0 1 0 1 0 0 0 1 Lesoth 0 0 0 1 0 1 0 0 0 1 Namibi
a 0 0 0 1 0 1 0 0 0 1
Swazi 0 0 0 1 0 1 0 0 0 1 interact 0 0 0 0 0 0 0 0 0 0

93
Continued from appendix 2
from to EUcij EUdij COMEScij COMESdij SACUcij SACUdijEU-SAcij
EU-SAdij PTAcij PTAdij
Ire SA 0 1 0 1 0 1 1 0 1 0 Austria 1 0 0 0 0 0 1 0 1 0 Belg 1 0 0 0 0 0 1 0 1 0 Bulg 1 0 0 0 0 0 1 0 1 0 Czech 1 0 0 0 0 0 1 0 1 0 Denm 1 0 0 0 0 0 1 0 1 0 Eston 1 0 0 0 0 0 1 0 1 0 Finl 1 0 0 0 0 0 1 0 1 0 Fran 1 0 0 0 0 0 1 0 1 0 Germ 1 0 0 0 0 0 1 0 1 0 Swed 1 0 0 0 0 0 1 0 1 0 Hunga 1 0 0 0 0 0 1 0 1 0 Italy 1 0 0 0 0 0 1 0 1 0 Nether 1 0 0 0 0 0 1 0 1 0 UK 1 0 0 0 0 0 1 0 1 0 Poland 1 0 0 0 0 0 1 0 1 0 Egypt 0 1 0 1 0 0 0 1 1 0 Keny 0 1 0 1 0 0 0 1 1 0 Malaw 0 1 0 1 0 1 0 1 1 0 Mauri 0 1 0 1 0 1 0 1 1 0 Zamb 0 1 0 1 0 1 0 1 1 0 Zimbab 0 1 0 1 0 1 0 1 1 0 Gree 1 0 0 0 0 0 1 0 1 0 Portu 1 0 0 0 0 0 1 0 1 0 Spain 1 0 0 0 0 0 1 0 1 0 Cyp 1 0 0 0 0 0 1 0 1 0 Latvia 1 0 0 0 0 0 1 0 1 0 Malta 1 0 0 0 0 0 1 0 1 0 Slovak 1 0 0 0 0 0 1 0 1 0 Slove 1 0 0 0 0 0 1 0 1 0 Lithu 1 0 0 0 0 0 1 0 1 0 Bots 0 1 0 1 0 1 0 1 1 0 Lesot 0 1 0 1 0 1 0 1 1 0 Namib 0 1 0 1 0 1 0 1 1 0 Swazi 0 1 0 1 0 1 0 1 1 0 USA 0 1 0 0 0 0 0 1 0 1

94
Continued from appendix 2
from to EUcij EUdij COMEScij COMESdij SACUcij SACUdijEU-SAcij
EU-SAdij PTAcij PTAdij
Zimbab SA 0 0 0 1 0 1 0 1 1 0 Aus 0 1 0 1 0 0 0 1 1 0 Belg 0 1 0 1 0 0 0 1 1 0 Bulg 0 1 0 1 0 0 0 1 1 0 Czech 0 1 0 1 0 0 0 1 1 0 Denm 0 1 0 1 0 0 0 1 1 0 Eston 0 1 0 1 0 0 0 1 1 0 Finl 0 1 0 1 0 0 0 1 1 0 Fran 0 1 0 1 0 0 0 1 1 0 Germ 0 1 0 1 0 0 0 1 1 0 Swed 0 1 0 1 0 0 0 1 1 0 Hung 0 1 0 1 0 0 0 1 1 0 Irel 0 1 0 1 0 0 0 1 1 0 Italy 0 1 0 1 0 0 0 1 1 0 Nether 0 1 0 1 0 0 0 1 1 0 UK 0 1 0 1 0 0 0 1 1 0 Poland 0 1 0 1 0 0 0 1 1 0 Egypt 0 0 1 0 0 0 0 0 1 0 Keny 0 0 1 0 0 0 0 0 1 0 Malaw 0 0 1 0 1 0 0 0 1 0 Mauri 0 0 1 0 1 0 0 0 1 0 Zamb 0 0 1 0 1 0 0 0 1 0 Gree 0 1 0 1 0 1 0 1 1 0 Portu 0 1 0 1 0 0 0 1 1 0 Spain 0 1 0 1 0 0 0 1 1 0 Cyp 0 1 0 1 0 0 0 1 1 0 Latvia 0 1 0 1 0 0 0 1 1 0 Malta 0 1 0 1 1 0 1 1 1 0 Slovak 0 1 0 1 1 0 1 1 1 0 Slove 0 1 0 1 1 0 1 1 1 0 Lithu 0 1 0 1 1 0 1 1 1 0 Bots 0 0 1 0 1 0 0 0 1 0 Lesot 0 0 1 0 1 0 0 0 1 0 Namib 0 0 1 0 1 0 0 0 1 0 Swazi 0 0 1 0 1 0 0 0 1 0 USA 0 0 0 1 0 0 0 0 0 1

95
APPENDIX 3: NON TRADE AGREEMENT VARIABLES from to Xij gdp dist history landlocked language bordersSA Austria 177 290.1 5166 0 0 0 0
Belg 1309 349.8 5491 0 0 0 0Bulg 12 24.1 4746 0 0 0 0czech 25 107 5310 0 0 0 0Denm 205 243 5708 0 0 0 0Eston 13 10.8 5894 0 0 0 0Finl 238 186.6 5945 0 0 0 0Fran 1449 2000 5397 0 0 0 0Germ 5167 2700 5485 0 0 0 0Swed 348 346.4 5916 0 0 0 0Hung 24 99.7 5091 0 0 0 0Irel 358 183.6 5848 1 0 0 0Italy 2277 1000.7 4779 1 0 0 0Nether 1609 577.3 5579 0 0 0 0UK 6427 2000.1 5609 0 0 0 0Poland 52 241.8 5434 0 0 0 0Egypt 76 75.1 3866 0 0 0 0Keny 373 15.6 1809 0 0 0 0Malaw 341 1.8 919 1 0 0 0Mauri 242 6.1 1930 1 0 0 0Zamb 527 5.4 744 1 0 0 0Zimbab 1669 7.2 606 1 0 0 1Gree 67 203.4 4421 1 0 0 1Portu 181 168.3 5061 0 0 0 0Spain 977 991.4 5010 0 0 0 0Cyp 16 15.4 4229 0 0 0 0Latvia 0.2 13.6 5725 1 0 0 0Malta 5.4 5.4 5566 0 0 0 0Slovak 5 41.1 4353 1 0 0 0Slove 3 32.2 5156 0 0 0 0Lithu 1.2 22.3 5037 0 0 0 0Bots 46 8.7 160 0 0 0 0Lesot 21 1.4 140 1 0 0 0Namib 18.2 5.5 152 1 0 0 1Swazi 22 2.4 201 1 0 0 1USA 5616 12000.2 7960 0 0 0 0interact 0 0 0 0

96
from to Xij gdp dist history landlocked language bordersAus SA 349.7 212.8 5166 0 0 0 0
Belg 2545.8 349.8 570 0 0 0 0Bulg 223.9 24.1 508 0 0 0 1czech 3162 107 156 0 0 0 0Denm 885.8 243 545 0 1 0 1Eston 35.4 10.8 846 0 0 0 1Finl 741.3 186.6 842 0 0 0 0Fran 5425.6 2000 645 0 0 0 0Germ 47002 2700 326 0 0 0 1Swed 1591.2 346.4 775 0 0 1 1Hung 4866 99.7 145 0 0 0 0Irel 420.7 183.6 1048 0 1 0 1Italy 10185.4 1000.7 145 0 0 0 0Nether 3687 577.3 583 0 0 0 1UK 4334 2000.1 769 1 0 0 1Poland 2081.8 241.8 367 0 0 0 0Egypt 123.5 75.1 1485 0 0 0 1Keny 13.8 15.6 3623 0 1 0 1Malaw 4.6 1.8 4413 0 0 0 0Mauri 7.1 6.1 5372 0 0 0 0Zamb 4.8 5.4 4437 0 1 0 0Zimbab 14.9 7.2 4635 0 0 0 0Gree 398.4 203.4 795 0 1 0 0Portu 625.7 168.3 1429 0 1 0 0Spain 184 991.4 1126 1 0 0 0Cyp 26.7 15.4 1251 0 0 0 0Latvia 32.4 13.6 685 0 0 0 0Malta 21 5.4 858 0 0 0 0Slovak 1453.3 41.1 35 0 0 0 0Slove 1611.3 32.2 173 0 0 0 0Lithu 64.7 22.3 590 0 1 0 1Bots 0.6 8.7 4635 0 0 0 1Lesot 0.1 1.4 5166 0 0 0 0Namib 1.4 5.5 5166 0 1 0 0Swazi 0.3 2.4 5210 0 1 0 0USA 4526 12000.1 4233 0 0 0 0interact 0 0 0 0

97
from to Xij gdp dist history landlocked language bordersBelg SA 1307 212.8 5491 0 1 0 0
Aus 2545.8 290.1 570 0 0 0 0Bulg 135 24.1 1057 0 0 0 0czech 1037 107 448 0 0 0 1Denm 1718 243 475 0 0 0 0Eston 113 10.8 996 0 0 0 1Finl 1919 186.6 675 0 0 0 1Fran 47100 2000 165 0 0 0 0Germ 59194 2700 403 0 0 0 0Swed 4561 346.4 798 0 0 0 0Hung 1072 99.7 714 0 0 0 1Irel 3300 183.6 484 0 0 0 0Italy 14923 1000.7 735 0 0 0 0Nether 47464 577.3 514 0 0 0 0UK 29454 2000.1 199 0 0 0 0Poland 1762 241.8 727 0 0 1 1Egypt 374 75.1 2000 0 0 0 0Keny 94 15.6 4067 0 0 0 0Malaw 12.4 1.8 4804 1 0 0 1Mauri 100 6.1 5879 0 0 0 0Zamb 41 5.4 4784 0 0 0 0Zimbab 74.9 7.2 4998 0 0 0 0Gree 1126 203.4 1298 0 0 0 0Portu 2121 168.3 1064 0 0 0 0Spain 7575 991.4 5010 0 0 0 0Cyp 84 15.4 1804 0 0 0 0Latvia 68 13.6 906 0 0 0 0Malta 113 5.4 1151 0 0 0 1Slovak 283 41.1 603 0 0 0 0Slove 182 32.2 572 0 0 0 0Lithu 214 22.3 914 0 0 0 0Bots 20.4 8.7 5362 0 0 0 1Lesot 44.1 1.4 404 0 0 0 1Namib 41.7 5.5 360 0 0 0 0Swazi 8.7 2.4 5558 0 0 0 0USA 22515 12000.1 3668 0 0 0 0interact 0 0 0 0
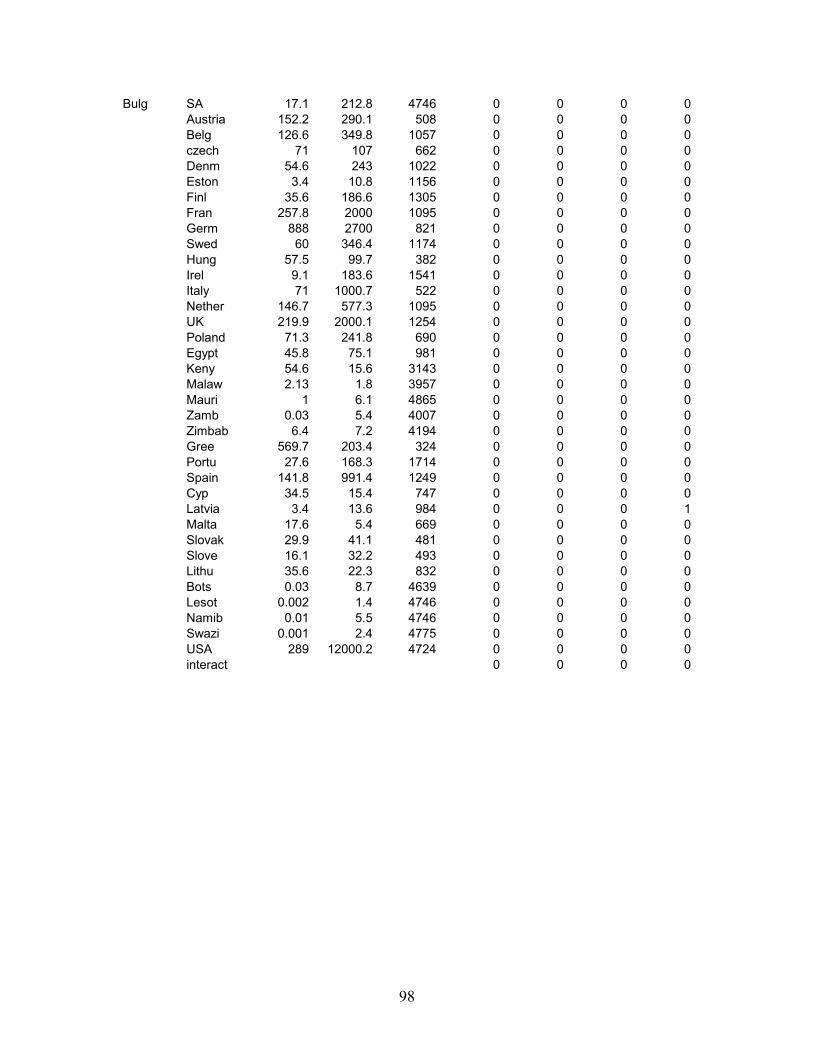
98
Bulg SA 17.1 212.8 4746 0 0 0 0Austria 152.2 290.1 508 0 0 0 0Belg 126.6 349.8 1057 0 0 0 0czech 71 107 662 0 0 0 0Denm 54.6 243 1022 0 0 0 0Eston 3.4 10.8 1156 0 0 0 0Finl 35.6 186.6 1305 0 0 0 0Fran 257.8 2000 1095 0 0 0 0Germ 888 2700 821 0 0 0 0Swed 60 346.4 1174 0 0 0 0Hung 57.5 99.7 382 0 0 0 0Irel 9.1 183.6 1541 0 0 0 0Italy 71 1000.7 522 0 0 0 0Nether 146.7 577.3 1095 0 0 0 0UK 219.9 2000.1 1254 0 0 0 0Poland 71.3 241.8 690 0 0 0 0Egypt 45.8 75.1 981 0 0 0 0Keny 54.6 15.6 3143 0 0 0 0Malaw 2.13 1.8 3957 0 0 0 0Mauri 1 6.1 4865 0 0 0 0Zamb 0.03 5.4 4007 0 0 0 0Zimbab 6.4 7.2 4194 0 0 0 0Gree 569.7 203.4 324 0 0 0 0Portu 27.6 168.3 1714 0 0 0 0Spain 141.8 991.4 1249 0 0 0 0Cyp 34.5 15.4 747 0 0 0 0Latvia 3.4 13.6 984 0 0 0 1Malta 17.6 5.4 669 0 0 0 0Slovak 29.9 41.1 481 0 0 0 0Slove 16.1 32.2 493 0 0 0 0Lithu 35.6 22.3 832 0 0 0 0Bots 0.03 8.7 4639 0 0 0 0Lesot 0.002 1.4 4746 0 0 0 0Namib 0.01 5.5 4746 0 0 0 0Swazi 0.001 2.4 4775 0 0 0 0USA 289 12000.2 4724 0 0 0 0interact 0 0 0 0

99
from to Xij gdp dist history landlocked language bordersBulg SA 17.1 212.8 4746 0 0 0 0
Austria 152.2 290.1 508 0 0 0 0Belg 126.6 349.8 1057 0 0 0 0czech 71 107 662 0 0 0 0Denm 54.6 243 1022 0 0 0 0Eston 3.4 10.8 1156 0 0 0 0Finl 35.6 186.6 1305 0 0 0 0Fran 257.8 2000 1095 0 0 0 0Germ 888 2700 821 0 0 0 0Swed 60 346.4 1174 0 0 0 0Hung 57.5 99.7 382 0 0 0 0Irel 9.1 183.6 1541 0 0 0 0Italy 71 1000.7 522 0 0 0 0Nether 146.7 577.3 1095 0 0 0 0UK 219.9 2000.1 1254 0 0 0 0Poland 71.3 241.8 690 0 0 0 0Egypt 45.8 75.1 981 0 0 0 0Keny 54.6 15.6 3143 0 0 0 0Malaw 2.13 1.8 3957 0 0 0 0Mauri 1 6.1 4865 0 0 0 0Zamb 0.03 5.4 4007 0 0 0 0Zimbab 6.4 7.2 4194 0 0 0 0Gree 569.7 203.4 324 0 0 0 0Portu 27.6 168.3 1714 0 0 0 0Spain 141.8 991.4 1249 0 0 0 0Cyp 34.5 15.4 747 0 0 0 0Latvia 3.4 13.6 984 0 0 0 1Malta 17.6 5.4 669 0 0 0 0Slovak 29.9 41.1 481 0 0 0 0Slove 16.1 32.2 493 0 0 0 0Lithu 35.6 22.3 832 0 0 0 0Bots 0.03 8.7 4639 0 0 0 0Lesot 0.002 1.4 4746 0 0 0 0Namib 0.01 5.5 4746 0 0 0 0Swazi 0.001 2.4 4775 0 0 0 0USA 289 12000.2 4724 0 0 0 0interact 0 0 0 0

100
from to Xij gdp dist history landlocked language bordersCzech SA 594 212.8 5310 0 0 0 0
Austria 967 290.1 156 0 0 0 0Belg 887 349.8 448 0 0 0 0Bulgaria 66 24.1 662 0 0 0 0Denm 304 107 398 0 0 0 0Eston 27 243 764 1 0 0 1Finl 368 10.8 697 0 0 0 1Fran 1806 186.6 551 0 0 0 0Germ 16742 2000 175 0 0 0 1Swed 569 2700 659 0 0 0 0Hung 785 346.4 286 0 0 0 0Irel 174 99.7 914 0 0 0 1Italy 2289 183.6 574 0 0 0 1Nether 1131 1000.7 472 0 0 0 0UK 1911 577.3 644 1 0 0 1Poland 1221 2000.1 336 0 0 0 0Egypt 120 31.1 1640 0 0 0 1Keny 6 75.1 3778 0 0 0 1Malaw 11.48 15.6 4574 0 0 0 0Mauri 0.28 1.8 5527 0 0 0 1Zamb 0.77 6.1 4583 1 0 0 1Zimbab 18 5.4 4783 0 0 0 0Gree 147 7.2 951 0 0 0 0Portu 52 203.4 1395 1 0 0 0Spain 594 168.3 943 0 0 0 0Cyp 9 991.4 4229 1 1 0 0Latvia 29.5 15.4 619 1 0 0 0Malta 4.39 13.6 981 0 0 0 0Slovak 6370 5.4 181 0 0 0 0Slove 360 41.1 279 0 0 0 0Lithu 124 32.2 559 0 0 0 0Bots 0.3 22.3 5193 0 1 0 0Lesot 0.02 1.4 5310 0 0 0 0Namib 0.2 5.5 5310 1 0 0 1Swazi 0.04 2.4 5357 0 0 0 1USA 1230 12000.2 4094 0 0 0 0interact 0 0 0 0

101
from to Xij gdp dist history landlocked language bordersDenm SA 315 212.8 5708 1 0 0 0
Aus 2635 290.1 545 1 0 0 0Belg 2635 349.8 475 0 1 0 0Bulg 58 24.1 1022 1 1 0 0czech 317 107 398 0 0 0 0Eston 178 243 523 0 0 0 0Finl 2586 10.8 299 0 0 0 1Fran 5041 186.6 639 0 0 0 1Germ 20059 2000 224 0 0 0 0Swed 11307 2700 5916 0 0 0 1Hung 198 346.4 643 0 0 0 0Irel 846 99.7 765 0 0 0 0Italy 3740 183.6 4779 0 0 0 1Nether 5662 1000.7 455 0 0 0 0UK 8049 577.3 5609 0 0 0 0Poland 1639 2000.1 412 0 0 0 0Egypt 144 31.1 2002 0 0 0 0Keny 23 75.1 4160 0 0 0 0Malaw 7.96 15.6 4957 0 0 0 1Mauri 10.59 1.8 5874 0 0 0 0Zamb 6.28 6.1 4980 0 0 0 1Zimbab 31.42 5.4 5180 0 0 0 1Gree 468 7.2 1330 0 0 0 0Portu 678 203.4 1539 0 0 0 0Spain 1560 168.3 5010 0 0 0 0Cyp 27 991.4 4229 0 0 0 0Latvia 187 15.4 455 0 0 0 0Malta 46 13.6 5566 0 0 0 0Slovak 69 5.4 4353 0 0 0 0Slove 106 41.1 5156 0 0 0 0Lithu 362 32.2 513 0 0 0 0Bots 1.32 22.3 5591 0 0 0 0Lesot 0.07 1.4 5708 0 0 0 0Namib 2.36 5.5 5708 0 0 0 0Swazi 0.89 2.4 5754 0 0 0 0USA 3983 12000.2 3850 0 0 0 0interact 0 0 0 0

102
from to Xij gdp dist history landlocked language borderseston SA 1.9 212.8 5945 0 0 0 0
Austria 37.4 290.1 842 0 0 0 0Belg 113.5 349.8 996 0 0 0 0Bulg 3.7 24.1 1156 0 0 0 0Czech 31.7 107 764 0 0 0 0Denmark 182 243 523 1 0 0 0Finl 1730.7 186.6 493 0 0 0 0Fran 108.3 2000 1158 0 0 0 0Germ 655 2700 650 0 0 0 0Swed 893.8 346.4 238 0 0 0 0Hung 16.2 99.7 931 0 0 0 1Irel 20.3 183.6 1245 0 0 0 1Italy 129.9 1000.7 1252 0 0 0 0Nether 178.6 577.3 978 1 0 0 0UK 345.1 2000.1 1111 0 0 0 0Poland 82.1 241.8 493 0 0 0 0Egypt 4.4 75.1 2054 1 0 0 0Keny 2.1 15.6 4234 0 0 0 0Malaw 0.03 1.8 5252 0 0 0 0Mauri 0.08 6.1 6133 0 0 0 0Zamb 0.04 5.4 5278 0 0 0 0Zimbab 0.17 7.2 5477 0 0 0 1Gree 6 203.4 1619 0 0 0 0Portu 7.6 168.3 2060 0 0 0 0Spain 48 991.4 1651 0 0 0 0Cyp 0.4 15.4 1720 0 0 0 0Latvia 224.7 13.6 528 0 0 0 0Malta 2 5.4 1671 0 0 0 0Slovak 9.1 41.1 838 0 0 0 0Slove 3 32.2 1016 0 0 0 0Lithu 212 22.3 328 0 0 0 0Bots 0.19 8.7 5790 0 0 0 0Lesot 0.15 1.4 5945 0 0 0 0Namib 0.11 5.5 5945 1 0 0 1Swazi 0.13 2.4 5915 0 0 0 0USA 134 12000.2 4145 0 0 0 0interact 0 0 0 0

103
from to Xij gdp dist history landlocked language bordersSwed SA 452 212.8 5916 1 0 0 0
Austria 1690 290.1 775 0 0 0 0Belg 5685 349.8 798 1 0 0 1Bulg 61 24.1 1174 1 0 0 1Czech 590 107 659 1 0 0 1Denm 9777 243 327 0 0 0 0Estonia 898 10.8 238 0 0 0 0Finla 7814 186.6 259 0 0 0 0Fran 7530 2000 963 0 0 0 0Germ 21223 2700 508 0 0 0 0Hung 448 99.7 828 0 0 0 0Irel 1270 183.6 1010 0 0 0 0Italy 4600 1000.7 1233 0 0 0 0Nether 9601 577.3 773 0 0 0 0UK 13945 2000.1 892 0 0 0 0Poland 1949 241.8 485 0 0 0 0Egypt 559 75.1 2123 0 0 0 0Keny 56 15.6 4303 0 0 1 1Malaw 1.5 1.8 5130 0 0 0 0Mauri 11 6.1 5938 0 0 0 0Zamb 7 5.4 5179 0 0 0 0Zimbab 20.8 7.2 5369 0 0 0 0Gree 537 203.4 1497 0 0 0 0Portu 842 168.3 1860 0 0 0 0Spain 2640 991.4 1473 0 0 0 0Cyp 55 15.4 1812 0 0 0 0Latvia 662 13.6 279 0 0 0 0Malta 37 5.4 1632 0 0 0 0Slovak 140 41.1 778 0 0 0 0Slove 167 32.2 933 0 0 0 0Lithu 269 22.3 426 0 0 0 0Bots 34.1 8.7 5805 0 0 0 0Lesot 0.4 1.4 5916 0 0 0 0Namib 1.6 5.5 5916 0 0 0 0Swazi 0.9 2.4 5949 0 0 0 0USA 10847 12000.2 3934 0 0 0 0interact 0 0 0 0

104
from to Xij gdp dist history landlocked language bordersHung SA 37.5 212.8 5091 0 0 0 0
Aus 4430 290.1 145 0 0 0 0Belg 988 349.8 714 0 0 0 0Bulg 69 24.1 382 0 0 0 0czech 831.3 107 286 0 0 0 0Denm 200.1 243 643 0 0 0 0Eston 2.3 10.8 859 0 0 0 0Finl 319.2 186.6 931 0 0 0 0Fran 1561 2000 787 0 0 0 0Germ 128871 2700 439 0 0 0 0Sweden 408.6 346.4 828 0 0 0 0Irel 141.31 183.6 1192 0 0 0 0Italy 2736.8 1000.7 504 0 1 0 1Nether 1084.9 1000.7 745 0 0 0 0UK 1305.5 2000.1 913 0 0 0 0Poland 8957 241.8 365 1 1 0 1Egypt 53.6 75.1 1363 0 0 0 0Keny 2.47 15.6 3515 1 0 0 0Malaw 10.73 1.8 4321 0 0 0 0Mauri 0.49 6.1 5246 0 0 0 0Zamb 0.23 5.4 4357 1 0 0 1Zimbab 13.96 7.2 4551 0 0 0 0Gree 130.1 203.4 688 0 0 0 0Portu 89.71 168.3 1545 0 0 0 1Spain 559.2 991.4 1075 0 0 0 0Cyp 103.9 15.4 1115 0 0 0 0Latvia 25.4 13.6 689 1 0 0 1Malta 680.3 5.4 835 0 1 0 0Slovak 669.7 41.1 111 0 0 0 0Slove 400.4 32.2 244 0 0 0 0Lithu 67.6 22.3 566 0 1 0 0Bots 0.3 8.7 4979 0 0 0 0Lesot 0.2 1.4 5091 0 1 0 0Namib 0.1 5.5 5091 0 1 0 1Swazi 0.1 2.4 5129 0 0 0 1USA 1594 12000.2 4376 0 0 0 0interact 0 0 0 0

105
from to Xij gdp dist history landlocked language bordersItaly SA 3899 212.8 4779 0 0 0 0
Austria 10173 290.1 145 0 0 0 0Belg 16215 349.8 735 1 0 0 0Bulg 982 24.1 522 0 0 0 0Czech 2367 107 574 1 0 1 0Denm 3719 243 957 0 0 0 0Eston 2306 10.8 1320 0 0 0 0Finl 2445 186.6 1252 0 0 0 0Fran 56486 2000 694 1 0 1 0Germ 76394 2700 327 1 0 1 0Swed 5273 346.4 1233 0 0 1 0Hung 2969 99.7 504 1 0 1 0Irel 2954 183.6 1182 1 0 0 0Nether 19594 577.3 810 1 0 0 0UK 30864 2000.1 897 0 0 0 0Poland 5258 241.8 839 0 0 0 1Egypt 2306 75.1 1323 0 0 0 0Keny 158 15.6 3333 0 0 0 1Malaw 4.7 1.8 4073 0 0 0 0Mauri 123.9 6.1 5165 0 0 0 0Zamb 16 5.4 4063 0 0 0 0Zimbab 215.7 7.2 4273 0 0 0 0Gree 5971 203.4 646 0 0 0 0Portu 4113 168.3 1164 0 0 0 0Spain 22173 991.4 855 0 0 0 0Cyp 348 15.4 1208 1 0 0 0Latvia 124 13.6 1160 0 0 0 0Malta 847 5.4 426 0 0 0 0Slovak 1261 41.1 486 0 0 0 0Slove 3191 32.2 304 0 0 0 0Lithu 273 22.3 1058 1 0 0 0Bots 10.9 8.7 4656 1 0 0 0Lesot 1.1 1.4 4779 1 0 0 0Namib 33.4 5.5 4779 1 0 0 0Swazi 5.6 2.4 4838 1 0 0 0USA 29166 12000.2 4298 0 0 0 0interact 0 0 0 0

106
from to Xij gdp dist history landlocked language bordersNether SA 1551 212.8 5579 0 0 0 0
Aus 3655 290.1 583 0 0 0 0Belg 43015 349.8 514 0 0 0 1Bulg 146 24.1 1095 1 0 0 0Czech 1051 107 472 1 0 0 0Denm 5565 243 455 0 0 0 0Estonia 314 10.8 978 0 0 0 1Finl 2851 186.6 638 0 0 0 1Fran 26157 2000 198 0 0 0 0Germ 72998 2700 408 1 0 0 0Swed 9607 346.4 773 0 0 0 0Hung 1089 99.7 745 0 0 0 0Irel 5125 183.6 448 1 0 0 0Italy 19109 1000.7 810 0 0 0 0UK 30848 2000.1 173 1 0 0 0Poland 2370 241.8 734 0 0 0 1Egypt 613 75.1 2043 0 0 1 1Keny 253 15.6 4116 0 0 0 0Malaw 40.2 1.8 4855 0 0 0 1Mauri 53.1 6.1 5924 0 0 0 1Zamb 18.6 5.4 4835 0 0 0 0Zimbab 126 7.2 5049 0 0 0 0Gree 1482 203.4 702 0 0 0 1Portu 2289 168.3 1087 0 0 0 1Spain 8593 991.4 1970 0 0 0 0Cyp 75 15.4 1842 0 0 0 0Latvia 137 13.6 1893 0 0 0 0Malta 102 5.4 1055 0 0 0 0Slovak 343 41.1 1460 0 0 0 0Slove 195 32.2 1430 0 0 0 1Lithu 228 22.3 1729 0 0 0 1Bots 6.6 8.7 5413 0 0 0 0Lesot 1.5 1.4 5579 0 0 0 0Namib 10.3 5.5 5579 0 0 0 0Swazi 4.3 2.4 5609 0 0 0 0USA 27505 12000.2 3652 0 0 0 0interact 0 0 0 0
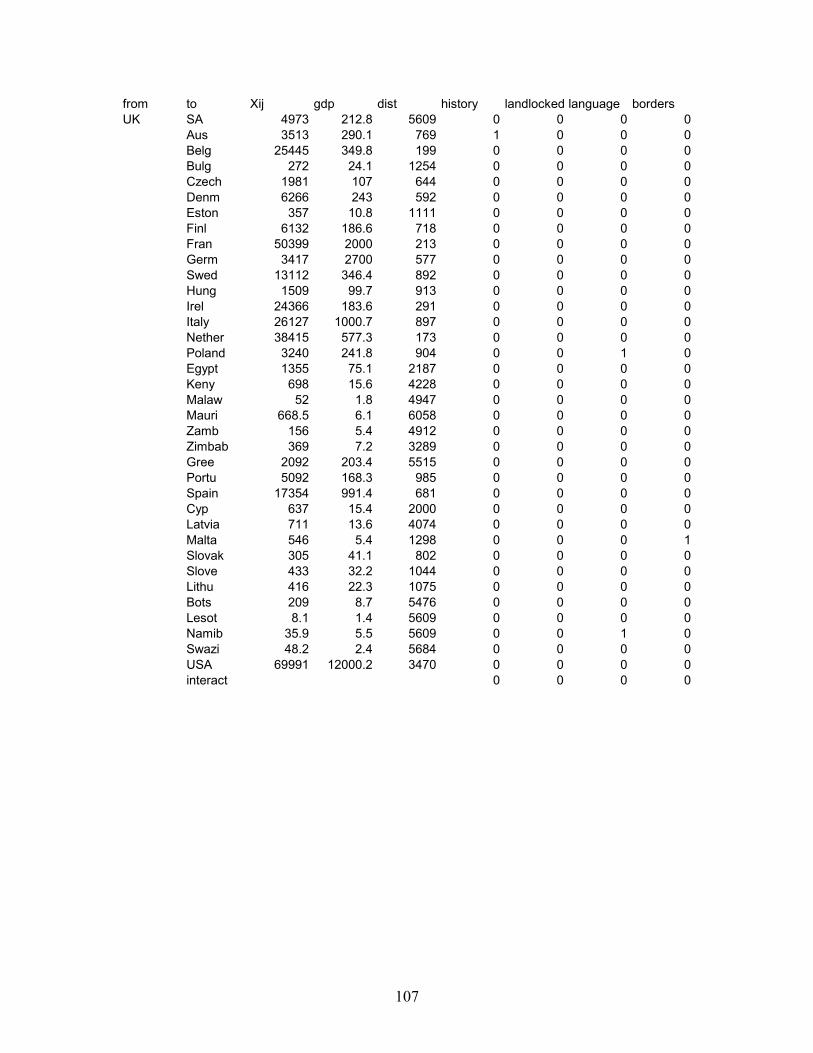
107
from to Xij gdp dist history landlocked language bordersUK SA 4973 212.8 5609 0 0 0 0
Aus 3513 290.1 769 1 0 0 0Belg 25445 349.8 199 0 0 0 0Bulg 272 24.1 1254 0 0 0 0Czech 1981 107 644 0 0 0 0Denm 6266 243 592 0 0 0 0Eston 357 10.8 1111 0 0 0 0Finl 6132 186.6 718 0 0 0 0Fran 50399 2000 213 0 0 0 0Germ 3417 2700 577 0 0 0 0Swed 13112 346.4 892 0 0 0 0Hung 1509 99.7 913 0 0 0 0Irel 24366 183.6 291 0 0 0 0Italy 26127 1000.7 897 0 0 0 0Nether 38415 577.3 173 0 0 0 0Poland 3240 241.8 904 0 0 1 0Egypt 1355 75.1 2187 0 0 0 0Keny 698 15.6 4228 0 0 0 0Malaw 52 1.8 4947 0 0 0 0Mauri 668.5 6.1 6058 0 0 0 0Zamb 156 5.4 4912 0 0 0 0Zimbab 369 7.2 3289 0 0 0 0Gree 2092 203.4 5515 0 0 0 0Portu 5092 168.3 985 0 0 0 0Spain 17354 991.4 681 0 0 0 0Cyp 637 15.4 2000 0 0 0 0Latvia 711 13.6 4074 0 0 0 0Malta 546 5.4 1298 0 0 0 1Slovak 305 41.1 802 0 0 0 0Slove 433 32.2 1044 0 0 0 0Lithu 416 22.3 1075 0 0 0 0Bots 209 8.7 5476 0 0 0 0Lesot 8.1 1.4 5609 0 0 0 0Namib 35.9 5.5 5609 0 0 1 0Swazi 48.2 2.4 5684 0 0 0 0USA 69991 12000.2 3470 0 0 0 0interact 0 0 0 0

108
from to Xij gdp dist history landlocked language bordersPola SA 65.88 212.8 5434 0 0 1 0
Aus 2137 290.1 363 0 0 1 0Belg 1810 349.8 727 0 0 0 0Bulg 70 24.1 690 0 0 0 0Czech 2198 107 336 0 0 0 0Denm 1660 243 412 0 0 0 0Eston 140 10.8 493 0 0 0 0Finl 1057 186.6 646 0 0 1 0Fran 20624 2000 859 0 0 0 0Germ 2025 2700 327 0 0 0 0Swed 887 346.4 892 0 0 0 0Hung 303 99.7 365 0 0 1 0Irel 5492 183.6 1135 0 0 1 0Italy 2692 1000.7 839 0 0 1 0Nether 3240 577.3 734 0 0 1 0UK 3369 2000.1 904 0 0 1 0Egypt 84 75.1 1643 0 0 0 0Keny 7.67 15.6 3821 0 0 0 1Malaw 8.19 1.8 4645 0 0 0 1Mauri 0.23 6.1 5487 0 0 0 0Zamb 0.89 5.4 4696 1 0 0 1Zimbab 33.73 7.2 4884 0 0 0 1Gree 286 203.4 1013 0 0 0 1Portu 110 168.3 1728 0 0 0 1Spain 1162 991.4 1279 0 0 0 1Cyp 5 15.4 1345 1 0 0 1Latvia 101 13.6 325 0 0 0 0Malta 7 5.4 1199 1 0 0 1Slovak 784 41.1 353 0 0 0 0Slove 224 32.2 540 0 0 0 0Lithu 424 22.3 227 0 0 0 1Bots 2621 8.7 5325 0 0 0 0Lesot 2404 1.4 5434 0 0 0 1Namib 1074 5.5 5434 0 0 0 0Swazi 1231 2.4 5465 0 0 0 0USA 1915 12000.2 4261 0 0 0 0interact 0 0 0 0

109
from to Xij gdp dist history landlocked language bordersEgypt SA 79.5 212.8 3866 0 0 0 0
Aust 133.4 290.1 1485 0 0 0 0Belg 393.1 349.8 2000 0 0 0 0Bulg 49.5 24.1 981 0 0 0 0Czech 130.2 107 1640 0 0 0 0Denm 157.2 243 2002 0 0 0 0Eston 4.7 10.8 374 0 0 0 0Finl 198.3 186.6 2279 1 0 0 1Fran 1774 2000 2001 0 0 0 0Germ 23191 2700 1802 1 0 0 1Swed 5617 346.4 2123 1 0 0 1Hung 56.7 99.7 5246 1 0 0 1Irel 167.2 183.6 2478 0 0 0 0Italy 2369.2 1000.7 1323 0 0 0 0Netrher 647.4 577.3 2043 0 0 0 0UK 1387.6 2000.1 2187 0 0 0 0Poland 911 241.8 1643 0 0 0 0Keny 105.7 15.6 2182 0 0 0 0Malaw 12.7 1.8 3029 0 1 0 1Mauri 0.9 6.1 3888 1 0 0 1Zamb 6.1 5.4 3122 0 0 0 0Zimbab 15.01 7.2 3289 0 0 0 1Gree 269.9 203.4 4587 0 0 0 1Portu 157 168.3 5933 0 0 0 0Spain 510.9 991.4 5688 0 0 0 0Cyp 50.2 15.4 4145 0 0 0 1Latvia 4 13.6 5674 0 0 0 1Malta 5.7 5.4 4795 0 0 0 0Slovak 22.8 41.1 5347 0 1 0 0Slove 46.8 32.2 5314 0 0 0 0Lithu 0.5 22.3 5515 0 0 0 1Bots 0.07 8.7 3779 0 0 0 1Lesot 0.02 1.4 3866 0 0 0 0Namib 0.04 5.5 3866 0 0 0 1Swazi 0.06 2.4 3872 0 0 0 0USA 4535 12000.2 5621 0 0 0 0interact 0 0 0 0
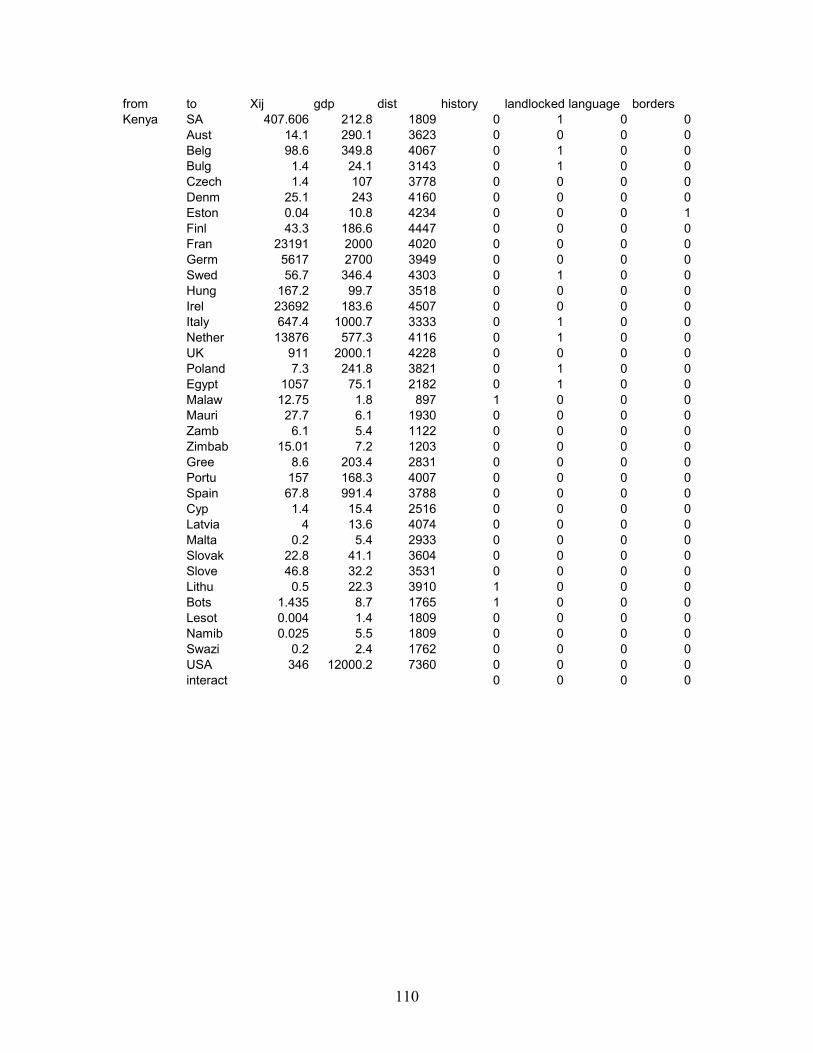
110
from to Xij gdp dist history landlocked language bordersKenya SA 407.606 212.8 1809 0 1 0 0
Aust 14.1 290.1 3623 0 0 0 0Belg 98.6 349.8 4067 0 1 0 0Bulg 1.4 24.1 3143 0 1 0 0Czech 1.4 107 3778 0 0 0 0Denm 25.1 243 4160 0 0 0 0Eston 0.04 10.8 4234 0 0 0 1Finl 43.3 186.6 4447 0 0 0 0Fran 23191 2000 4020 0 0 0 0Germ 5617 2700 3949 0 0 0 0Swed 56.7 346.4 4303 0 1 0 0Hung 167.2 99.7 3518 0 0 0 0Irel 23692 183.6 4507 0 0 0 0Italy 647.4 1000.7 3333 0 1 0 0Nether 13876 577.3 4116 0 1 0 0UK 911 2000.1 4228 0 0 0 0Poland 7.3 241.8 3821 0 1 0 0Egypt 1057 75.1 2182 0 1 0 0Malaw 12.75 1.8 897 1 0 0 0Mauri 27.7 6.1 1930 0 0 0 0Zamb 6.1 5.4 1122 0 0 0 0Zimbab 15.01 7.2 1203 0 0 0 0Gree 8.6 203.4 2831 0 0 0 0Portu 157 168.3 4007 0 0 0 0Spain 67.8 991.4 3788 0 0 0 0Cyp 1.4 15.4 2516 0 0 0 0Latvia 4 13.6 4074 0 0 0 0Malta 0.2 5.4 2933 0 0 0 0Slovak 22.8 41.1 3604 0 0 0 0Slove 46.8 32.2 3531 0 0 0 0Lithu 0.5 22.3 3910 1 0 0 0Bots 1.435 8.7 1765 1 0 0 0Lesot 0.004 1.4 1809 0 0 0 0Namib 0.025 5.5 1809 0 0 0 0Swazi 0.2 2.4 1762 0 0 0 0USA 346 12000.2 7360 0 0 0 0interact 0 0 0 0

111
from to Xij gdp dist history landlocked language bordersMalaw SA 407.606 212.8 919 1 0 0 1
Aus 14.1 290.1 4413 1 0 0 0Belg 98.6 349.8 4804 1 0 0 0Bulg 1.4 24.1 3957 1 0 0 0Czech 6.5 107 4574 1 0 0 0Denm 25.1 243 4957 0 0 0 0Eston 1.21 10.8 5081 0 0 0 0Finl 43.3 186.6 5252 0 0 0 0Fran 202.9 2000 4734 1 0 0 0Germ 82.63 2700 4738 0 0 0 0Swed 54.4 346.4 5130 1 0 0 0Hung 2.6 99.7 4321 0 0 0 0Irel 34 183.6 5211 0 0 0 0Italy 161.8 1000.7 4073 0 0 0 0Nether 250.3 577.3 4855 1 0 0 0UK 706.7 2000.1 4947 1 0 0 0Poland 7.3 241.8 4645 0 0 0 0Egypt 97.7 75.1 3029 1 0 0 0Keny 6.58 15.6 897 1 0 1 0Mauri 27.7 6.1 1640 1 0 1 0Zamb 5.9 5.4 369 0 0 0 0Zimbab 31.279 7.2 321 0 0 0 0Gree 8.6 203.4 4587 0 0 0 0Portu 22.4 168.3 4561 0 0 0 0Spain 67.6 991.4 4427 0 0 0 0Cyp 1.4 15.4 3379 0 0 0 0Latvia 1.1 13.6 4916 0 0 0 0Malta 0.2 5.4 3654 0 0 0 0Slovak 0.8 41.1 4398 0 0 0 0Slove 1.6 32.2 4302 0 0 0 0Lithu 6.397 22.3 4754 0 0 0 0Bots 1.435 8.7 896 1 0 1 0Lesot 0.004 1.4 606 1 0 0 0Namib 0.025 5.5 606 0 0 0 0Swazi 0.2 2.4 866 0 0 1 0USA 105.6 12000.2 7769 0 0 0 0interact 0 0 0 0

112
from to Xij gdp dist history landlocked language bordersMauri SA 266.1 212.8 1930 0 0 0 0
Aust 7 290.1 5372 1 0 0 1Belg 99.8 349.8 5879 1 0 0 1Bulg 0.13 24.1 4865 1 0 0 0Czech 0.3 107 5527 1 0 1 1Denm 10.8 243 5874 1 0 1 0Eston 0.1 10.8 5807 0 0 0 0Finl 9 186.6 6133 0 0 0 0Fran 707.7 2000 5859 0 0 0 0Germ 180.2 2700 5685 1 0 0 0Swed 10.6 346.4 5938 0 0 0 0Hung 0.68 99.7 5246 1 0 0 0Irel 4.9 183.6 6346 0 0 0 0Italy 3743 1000.7 5165 0 0 0 0Nether 53 577.3 5924 0 0 0 0UK 7.45 2000.1 6058 1 0 1 0Poland 0.2 241.8 5487 1 0 1 0Egypt 6.58 75.1 3888 0 0 1 0Keny 29.8 15.6 2182 1 0 1 0Malaw 11.21 1.8 1640 1 0 0 1Zamb 13.36 5.4 1955 1 0 0 1Zimbab 20.207 7.2 1749 0 1 0 0Gree 5.6 203.4 4587 0 0 0 0Portu 1.4 168.3 5933 0 0 0 0Spain 58 991.4 5688 0 1 0 0Cyp 5.8 15.4 4145 0 0 0 0Latvia 0.3 13.6 5674 0 0 0 0Malta 0.2 5.4 4795 0 0 0 0Slovak 0.13 41.1 5347 0 0 0 0Slove 1.05 32.2 5314 0 0 0 0Lithu 0.23 22.3 5515 0 0 0 0Bots 0.62 8.7 2048 0 1 0 0Lesot 0.13 1.4 1930 1 0 0 0Namib 0.02 5.5 1930 1 0 0 0Swazi 0.12 2.4 1732 1 0 0 0USA 285 12000.2 9288 0 0 0 0interact 0 0 0 0

113
from to Xij gdp dist history landlocked language bordersZamb SA 37.4 212.8 744 0 0 0 0
Aust 4.5 290.1 4437 0 1 0 0Belg 37.6 349.8 4784 1 0 0 0Bulg 2.15 24.1 4007 1 0 0 1Czech 0.7 107 4583 1 0 0 0Denm 6.2 243 4980 1 1 0 1Eston 0.32 10.8 5152 1 1 0 1Finl 13.9 186.6 5278 0 0 0 0Fran 87.6 2000 4699 0 0 0 0Germ 10.6 2700 4758 0 0 0 0Swed 78.8 346.4 5179 1 0 0 0Hung 24.3 99.7 4357 0 0 0 0Irel 4.3 183.6 5163 1 0 0 0Italy 15.8 1000.7 4063 0 0 0 0Nether 17.7 577.3 4835 0 0 0 0UK 143.7 2000.1 4912 0 0 0 0Poland 1017.5 241.8 4696 1 1 0 1Egypt 0.2 75.1 3122 1 1 0 0Keny 5.5 15.6 1122 0 0 0 1Malaw 12.29 1.8 369 1 1 0 1Mauri 1.23 6.1 1955 1 0 0 0Zimbab 38.1 7.2 243 1 0 0 0Gree 3 203.4 3683 0 0 0 0Portu 10.6 168.3 4440 0 0 0 0Spain 12.26 991.4 4351 0 0 0 0Cyp 0.1 15.4 3486 0 0 0 0Latvia 0.03 13.6 4984 0 0 0 0Malta 0.1 5.4 3638 0 0 0 0Slovak 0 41.1 4425 0 0 0 0Slove 493 32.2 4313 0 0 0 0Lithu 32 22.3 4824 0 0 0 0Bots 2.91 8.7 663 0 0 0 0Lesot 0.071 1.4 744 0 0 0 0Namib 5.267 5.5 744 1 0 0 0Swazi 7.614 2.4 775 1 0 0 0USA 86.5 12000.2 7546 0 0 0 0interact 0 0 0 0

114
from to Xij gdp dist history landlocked language bordersZimbab SA 1668.7 212.8 606 0 0 0 0
Aus 18.9 290.1 4635 0 0 0 0Belg 70.4 349.8 4998 0 0 0 0Bulg 5.8 24.1 4194 1 0 0 0Czech 19.5 107 4783 1 0 0 0Denm 43.3 243 5180 1 0 0 0Eston 3.2 10.8 5332 1 0 0 0Finl 21.1 186.6 5477 1 0 0 0Fran 149.6 2000 4918 0 0 0 0Germ 7.6 2700 4958 0 0 0 0Swed 20.3 346.4 5369 0 0 0 0Hung 14.4 99.7 4551 1 0 0 0Irel 22.6 183.6 5385 0 0 0 0Italy 250.5 1000.7 4273 1 0 0 0Nether 117.5 577.3 5049 0 0 0 0UK 143.7 2000.1 5131 0 0 0 0Poland 30.8 241.8 4884 0 0 0 0Egypt 14 75.1 3289 1 0 0 0Keny 34.9 15.6 1203 1 0 0 0Malaw 136.6 1.8 321 0 0 0 0Mauri 27.682 6.1 1749 1 0 0 0Zamb 149.9 5.4 243 1 0 1 0Gree 13.6 203.4 3871 1 0 1 1Portu 0.2 168.3 4677 0 1 0 0Spain 64.1 991.4 4580 0 0 0 0Cyp 0.6 15.4 3647 0 0 0 0Latvia 0.2 13.6 5165 0 1 0 0Malta 0.1 5.4 3849 0 0 0 0Slovak 0.7 41.1 4622 0 0 0 0Slove 1.8 32.2 4516 0 0 0 0Lithu 1.04 22.3 5004 0 0 0 0Bots 263.7 8.7 575 0 0 0 0Lesot 3.131 1.4 606 0 0 0 0Namib 56.584 5.5 606 0 1 0 0Swazi 25.029 2.4 584 1 0 1 0USA 230 12000.2 7788 0 0 0 0interact 0 0 0 0

115
from to Xij gdp dist history landlocked language bordersGree SA 18.9 212.8 4421 0 0 0 0
Aust 70.4 290.1 795 0 0 1 0Belg 5.8 349.8 1298 0 0 0 0Bulg 17.8 24.1 324 0 1 0 0Czech 29.8 107 951 1 0 0 0Denm 499.6 243 1330 1 0 1 1Eston 12.4 10.8 1479 1 1 0 1Finl 91.4 186.6 1619 1 0 0 0Fran 3023.9 2000 1301 1 1 1 1Germ 20.3 2700 1119 0 0 0 0Swed 12.9 346.4 1497 0 0 0 0Hung 15 99.7 688 0 0 0 0Irel 200.6 183.6 1777 1 0 0 0Italy 117.5 1000.7 646 0 0 0 0Nether 349.5 577.3 1341 1 0 0 0UK 30.8 2000.1 1486 0 1 0 0Poland 70.4 241.8 1013 0 0 0 0Egypt 29 75.1 702 0 0 0 0Keny 130.9 15.6 2831 1 1 1 1Malaw 19.169 1.8 3636 1 1 1 0Mauri 112.2 6.1 4587 0 0 1 1Zamb 11.2 5.4 3683 1 1 1 1Zimbab 0.1 7.2 3871 1 0 1 0Portu 64.1 168.3 1773 1 1 1 1Spain 0.4 991.4 1337 0 0 0 0Cyp 0.1 15.4 576 0 0 0 0Latvia 0.1 13.6 1307 0 0 0 0Malta 0.7 5.4 533 0 1 0 0Slovak 1.8 41.1 774 0 0 0 0Slove 1.4 32.2 728 0 0 0 0Lithu 210.3 22.3 1153 0 0 0 0Bots 3.023 8.7 4314 0 0 0 0Lesot 45.517 1.4 4421 0 0 0 0Namib 14.676 5.5 4421 0 0 0 0Swazi 9.23 2.4 4452 0 1 0 0USA 1552 12000.1 5289 0 0 0 0interact 0 0 0 0

116
from to Xij gdp dist history landlocked language bordersPortu SA 219 212.8 5061 0 0 0 0
Aust 236 290.1 1429 0 0 0 0Belg 2076 349.8 1064 0 0 1 0Bulg 30 24.1 1714 0 0 0 0Czech 50 107 1395 0 1 0 0Denm 320 243 1539 1 0 0 0Eston 21 10.8 2060 1 0 1 0Finl 439 186.6 1703 1 1 0 1Fran 6877 2000 902 1 0 0 0Germ 10175 2700 1435 1 1 1 1Swed 422 346.4 1860 0 0 0 0Hung 87 99.7 1545 0 0 0 0Irel 325 183.6 1026 0 0 0 0Italy 3979 1000.7 1164 1 0 0 0Nether 2734 577.3 1087 0 0 0 0UK 5221 2000.1 985 1 0 0 0Poland 74 241.8 1728 0 1 0 0Egypt 170 75.1 2364 0 0 0 0Keny 22.37 15.6 4007 0 0 0 0Malaw 7.25 1.8 4561 1 1 1 1Mauri 8.13 6.1 5933 1 1 1 0Zamb 11.57 5.4 4440 0 0 1 1Zimbab 12.13 7.2 4677 1 1 1 1Gree 165 203.4 1773 1 1 1 1Spain 1352.5 991.4 472 0 0 0 0Cyp 6 15.4 2337 1 0 0 0Latvia 1 13.6 1960 0 0 0 0Malta 4 5.4 1309 0 0 0 0Slovak 26 41.1 1461 0 0 0 0Slove 12 32.2 1301 0 0 0 0Lithu 6.2 22.3 1942 0 0 0 0Bots 1.04 18.7 4913 0 0 0 0Lesot 1 1.4 5061 0 0 0 0Namib 1.01 5.5 5061 0 0 0 0Swazi 1.2 2.4 5174 0 0 0 0USA 2149 12000.2 4266 0 0 0 0interact 0 0 0 0

117
from to Xij gdp dist history landlocked language bordersSpain SA 758 212.8 5010 0 0 0 0
Aus 2149 290.1 1126 0 0 0 0Belg 7181 349.8 685 1 0 0 0Bulg 161 24.1 1249 0 0 0 0Czech 611 107 943 0 0 0 0Denm 1612 243 1146 0 0 0 0Eston 46 10.8 1651 0 0 0 0Finl 1315 186.6 1358 0 0 0 0Fran 40560 2000 523 0 0 0 0Germ 87 2700 1007 0 0 0 0Swed 2473 346.4 1473 0 0 0 0Hung 650 99.7 1075 0 0 0 0Irel 1897 183.6 848 0 0 0 0Italy 21756 1000.7 855 0 0 0 0Nether 8647 577.3 721 0 0 1 0UK 18426 2000.1 681 0 0 0 0Polan 1110 241.8 1279 0 0 0 0Egypt 492 75.1 1970 0 0 0 0Keny 66 15.6 3788 0 0 0 0Malaw 11.41 1.8 4427 0 0 0 0Mauri 59.14 6.1 5688 0 0 0 0Zamb 8.47 5.4 4351 0 0 0 0Zimbab 69.03 7.2 4580 0 0 0 0Gree 1270 203.4 1337 0 0 0 0Portu 12736 168.3 472 0 0 0 0Cyp 186 15.4 1903 0 0 0 0Latvia 35 13.6 1535 0 0 0 0Malta 109 5.4 927 0 0 0 0Slovak 169 41.1 944 0 0 0 0Slove 247 32.2 833 0 0 0 0Lithu 114 22.3 1500 0 0 0 0Bots 1.58 8.7 4879 0 0 0 0Lesot 0.28 1.4 5010 0 0 0 0Namib 142 5.5 5010 0 0 0 0Swazi 3.03 2.4 5110 0 0 0 0USA 10455 12000.2 3591 0 0 0 0interact 0 0 0 0

118
from to Xij gdp dist history landlocked language bordersCyp SA 3.503 212.8 4229 0 0 0 0
Aust 24.1 290.1 1251 0 0 0 0Belg 81.8 349.8 1208 0 0 0 0Bulg 107.1 24.1 747 0 0 0 0Czech 10.1 107 1401 0 0 0 0Denm 34.2 243 1730 0 0 0 0Eston 0.4 10.8 1720 0 0 0 0Finl 22.6 186.6 1990 0 0 0 0Fran 168.7 2000 1834 0 0 0 0Germ 650 2700 1549 0 0 0 0Swed 60.7 346.4 1812 0 0 0 0Hung 10.8 99.7 1115 0 0 0 0Irel 30.7 183.6 2288 0 0 0 0Italy 320.2 1000.7 1208 0 0 0 0Nether 80.2 577.3 1842 0 0 0 1UK 539.6 2000.1 2000 0 0 0 0Polan 2.5 241.8 1345 0 0 0 0Egypt 48.3 75.1 374 0 0 0 0Keny 1.3 15.6 2516 0 0 0 0Malaw 0.099 1.8 3379 0 0 0 0Mauri 0.278 6.1 4145 0 0 0 0Zamb 0.2 5.4 3486 0 0 0 0Zimbab 0.483 7.2 3647 0 0 0 0Gree 354.3 203.4 567 0 0 0 0Portu 14.9 168.3 2337 0 0 0 0Spain 102.5 991.4 1903 0 0 0 0Latvia 0.1 13.6 1566 0 0 0 0Malta 3.2 5.4 1059 0 0 0 0Slovak 247 41.1 1222 0 0 0 1Slove 114 32.2 1236 0 0 0 0Lithu 3 22.3 1402 0 0 0 0Bots 0.726 8.7 4142 0 0 0 0Lesot 0.014 1.4 4229 0 0 0 0Namib 0.012 5.5 4229 0 0 0 0Swazi 0.018 2.4 4230 0 0 0 0USA 261 12000.2 5468 0 0 0 0interact 0 0 0 0
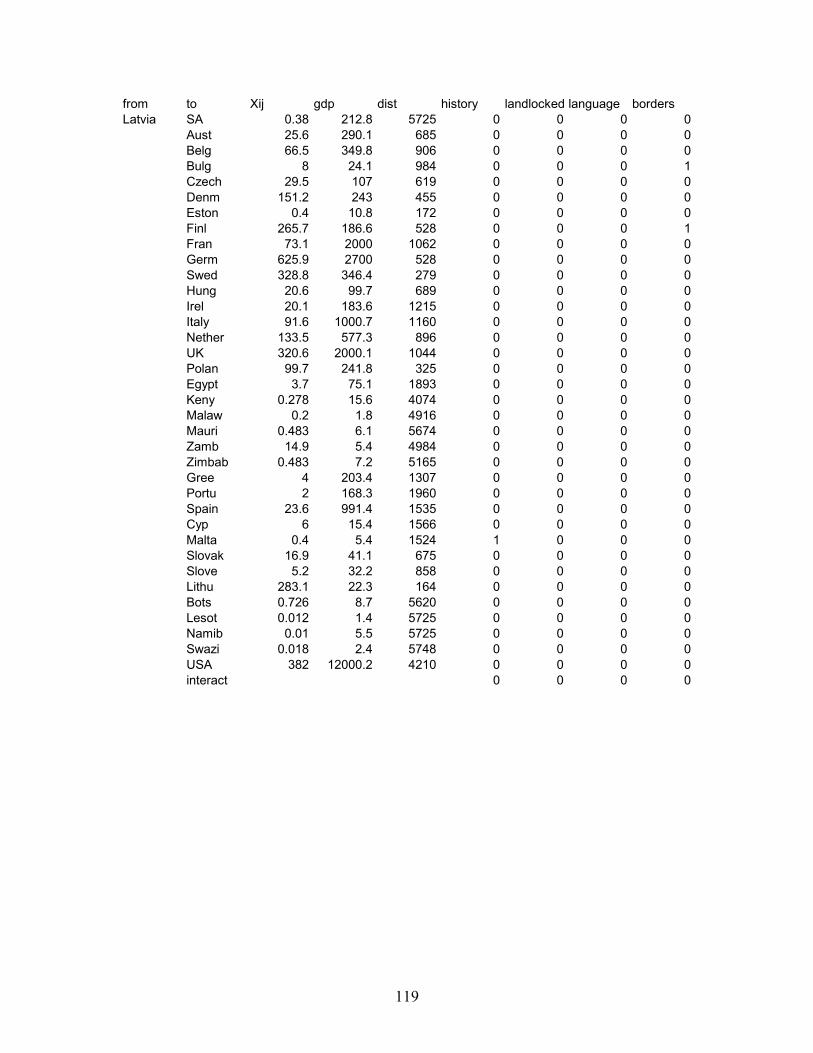
119
from to Xij gdp dist history landlocked language bordersLatvia SA 0.38 212.8 5725 0 0 0 0
Aust 25.6 290.1 685 0 0 0 0Belg 66.5 349.8 906 0 0 0 0Bulg 8 24.1 984 0 0 0 1Czech 29.5 107 619 0 0 0 0Denm 151.2 243 455 0 0 0 0Eston 0.4 10.8 172 0 0 0 0Finl 265.7 186.6 528 0 0 0 1Fran 73.1 2000 1062 0 0 0 0Germ 625.9 2700 528 0 0 0 0Swed 328.8 346.4 279 0 0 0 0Hung 20.6 99.7 689 0 0 0 0Irel 20.1 183.6 1215 0 0 0 0Italy 91.6 1000.7 1160 0 0 0 0Nether 133.5 577.3 896 0 0 0 0UK 320.6 2000.1 1044 0 0 0 0Polan 99.7 241.8 325 0 0 0 0Egypt 3.7 75.1 1893 0 0 0 0Keny 0.278 15.6 4074 0 0 0 0Malaw 0.2 1.8 4916 0 0 0 0Mauri 0.483 6.1 5674 0 0 0 0Zamb 14.9 5.4 4984 0 0 0 0Zimbab 0.483 7.2 5165 0 0 0 0Gree 4 203.4 1307 0 0 0 0Portu 2 168.3 1960 0 0 0 0Spain 23.6 991.4 1535 0 0 0 0Cyp 6 15.4 1566 0 0 0 0Malta 0.4 5.4 1524 1 0 0 0Slovak 16.9 41.1 675 0 0 0 0Slove 5.2 32.2 858 0 0 0 0Lithu 283.1 22.3 164 0 0 0 0Bots 0.726 8.7 5620 0 0 0 0Lesot 0.012 1.4 5725 0 0 0 0Namib 0.01 5.5 5725 0 0 0 0Swazi 0.018 2.4 5748 0 0 0 0USA 382 12000.2 4210 0 0 0 0interact 0 0 0 0
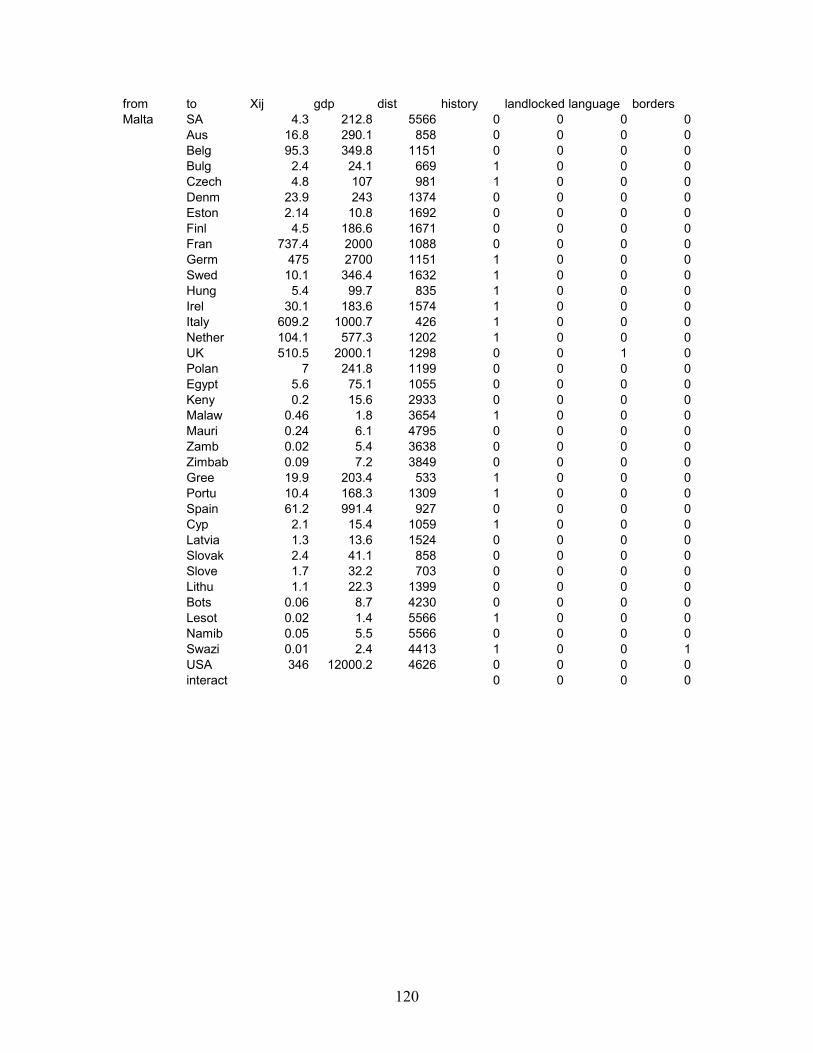
120
from to Xij gdp dist history landlocked language bordersMalta SA 4.3 212.8 5566 0 0 0 0
Aus 16.8 290.1 858 0 0 0 0Belg 95.3 349.8 1151 0 0 0 0Bulg 2.4 24.1 669 1 0 0 0Czech 4.8 107 981 1 0 0 0Denm 23.9 243 1374 0 0 0 0Eston 2.14 10.8 1692 0 0 0 0Finl 4.5 186.6 1671 0 0 0 0Fran 737.4 2000 1088 0 0 0 0Germ 475 2700 1151 1 0 0 0Swed 10.1 346.4 1632 1 0 0 0Hung 5.4 99.7 835 1 0 0 0Irel 30.1 183.6 1574 1 0 0 0Italy 609.2 1000.7 426 1 0 0 0Nether 104.1 577.3 1202 1 0 0 0UK 510.5 2000.1 1298 0 0 1 0Polan 7 241.8 1199 0 0 0 0Egypt 5.6 75.1 1055 0 0 0 0Keny 0.2 15.6 2933 0 0 0 0Malaw 0.46 1.8 3654 1 0 0 0Mauri 0.24 6.1 4795 0 0 0 0Zamb 0.02 5.4 3638 0 0 0 0Zimbab 0.09 7.2 3849 0 0 0 0Gree 19.9 203.4 533 1 0 0 0Portu 10.4 168.3 1309 1 0 0 0Spain 61.2 991.4 927 0 0 0 0Cyp 2.1 15.4 1059 1 0 0 0Latvia 1.3 13.6 1524 0 0 0 0Slovak 2.4 41.1 858 0 0 0 0Slove 1.7 32.2 703 0 0 0 0Lithu 1.1 22.3 1399 0 0 0 0Bots 0.06 8.7 4230 0 0 0 0Lesot 0.02 1.4 5566 1 0 0 0Namib 0.05 5.5 5566 0 0 0 0Swazi 0.01 2.4 4413 1 0 0 1USA 346 12000.2 4626 0 0 0 0interact 0 0 0 0

121
from to Xij gdp dist history landlocked language bordersSlovak SA 5 212.8 4353 0 0 0 0
Aust 1472.03 290.1 35 1 0 0 0Belg 292.7 349.8 603 0 0 0 0Bulg 29.98 24.1 481 1 0 0 0Czech 6258.08 107 181 0 0 0 0Denm 72.02 243 560 0 0 0 0Eston 1.45 10.8 838 0 0 0 0Finl 121.43 186.6 855 0 0 0 0Fran 797.62 2000 679 1 0 0 0Germ 5528.68 2700 345 0 0 0 0Swed 92.9 346.4 778 0 0 0 0Hung 656.68 99.7 111 0 0 0 0Irel 31.31 183.6 1081 0 0 0 0Italy 1273.98 1000.7 486 0 0 0 0Nether 426.73 577.3 634 0 0 0 0UK 195.9 2000.1 802 0 0 0 0polan 622.61 241.8 353 0 0 0 0Egypt 21.27 75.1 1460 0 0 0 0Keny 0.82 15.6 3604 0 0 0 0Malaw 0.14 1.8 4398 0 0 0 1Mauri 0.09 6.1 5347 0 0 0 0Zamb 0.054 5.4 4425 1 0 0 0Zimbab 0.61 7.2 4622 1 0 0 0Gree 48.89 203.4 774 1 0 0 0Portu 19.92 168.3 1461 0 0 0 0Spain 102.3 991.4 944 0 0 0 0Cyp 5.57 15.4 1222 0 0 0 1Latvia 2.4 13.6 675 0 0 0 1Malta 1.7 5.4 858 0 0 0 0Slove 0.85 32.2 190 1 0 1 0Lithu 30.84 22.3 573 0 0 0 0Bots 0.04 8.7 5041 0 0 0 0Lesot 0.02 1.4 4353 0 0 0 0Namib 0.015 5.5 4353 0 0 0 0Swazi 0.01 2.4 5198 0 0 0 0USA 258 12000.2 4233 0 0 0 0interact 0 0 0 0

122
from to Xij gdp dist history landlocked language bordersSlove SA 11 212.8 5156 0 0 0 0
Aust 1354 290.1 173 0 0 0 0Belg 246 349.8 572 0 0 0 0Bulg 28 24.1 493 0 0 0 0Czech 381 107 279 0 0 0 0Denm 101 243 674 1 0 1 0Eston 2.92 10.8 1016 1 0 0 0Finl 59 186.6 973 1 0 0 0Fran 1443 2000 602 0 0 1 0Germ 4398 2700 450 0 0 0 0Swed 166 346.4 933 0 0 0 0Hung 413 99.7 244 1 0 0 0Irel 401.93 183.6 1055 1 0 1 0Italy 2803 1000.7 304 1 0 0 0Nether 323 577.3 614 1 0 0 0UK 391 2000.1 765 1 0 1 0Pola 213 241.8 540 1 0 1 0Egypt 45 75.1 1430 0 0 0 0Keny 0.08 15.6 3531 0 0 0 0Malaw 1 1.8 4302 0 0 0 0Mauri 0.8 6.1 5314 1 0 0 0Zamb 0.7 5.4 4313 0 0 0 0Zimbab 2 7.2 4516 0 0 0 0Gree 39 203.4 728 0 0 0 0Portu 24 168.3 1301 0 0 0 0Spain 252 991.4 833 1 0 1 0Cyp 4 15.4 1236 1 0 1 0Latvia 6 13.6 858 0 0 1 0Malta 2 5.4 703 1 0 1 0Slovak 159 41.1 190 0 0 0 0Lithu 15 22.3 762 0 0 0 0Bots 0.082 8.7 4918 0 1 0 1Lesot 0.002 1.4 5156 0 0 0 0Namib 0.021 5.5 5156 0 0 0 0Swazi 0.001 2.4 5088 1 1 0 1USA 402 12000.2 3591 0 0 0 0interact 0 0 0 0

123
from to Xij gdp dist history landlocked language bordersLithu SA 0.08 212.8 5037 1 0 0 0
Aus 66.2 290.1 590 0 0 0 0Belg 185.6 349.8 914 0 0 0 0Bulg 11 24.1 832 1 0 0 1Czech 117.2 107 559 0 0 0 0Denm 375.6 243 513 1 1 0 1Eston 291.2 10.8 328 0 0 0 0Finl 197.7 186.6 655 0 0 0 1Fran 291.1 2000 1059 0 0 0 0Germ 413 2700 514 0 0 0 0Swed 278.3 346.4 426 1 0 0 1Hung 73.3 99.7 566 0 1 0 0Irel 20.3 183.6 1276 0 0 0 0Italy 284.6 1000.7 1058 0 0 0 0Nether 274.1 577.3 914 0 1 0 0UK 411.4 2000.1 1075 0 0 0 0Polan 399.6 241.8 227 0 1 0 0Egypt 0.8 75.1 1729 0 1 0 0Keny 0.9 15.6 3910 0 0 0 0Malaw 1.2 1.8 4754 0 0 0 0Mauri 2 6.1 5515 0 0 0 0Zamb 1 5.4 4824 0 0 0 0Zimbab 24 7.2 5004 1 0 0 0Gree 5.4 203.4 1153 0 0 0 0Portu 17 168.3 1942 1 1 0 1Spain 113.6 991.4 1500 1 0 0 1Cyp 3.2 15.4 1402 0 0 0 0Latvia 295.5 13.6 164 0 1 0 0Malta 11.3 5.4 1399 0 0 0 0Slovak 25.7 41.1 573 0 1 0 0Slove 16.8 32.2 762 0 1 0 0Bots 0.33 8.7 5463 0 0 0 0Lesot 0.02 1.4 5037 0 0 0 1Namib 0.01 5.5 5037 0 0 0 0Swazi 0.01 2.4 5587 0 0 0 0USA 177 12000.2 4333 0 0 0 0interact 0 0 0 0

124
from to Xij gdp dist history landlocked language bordersBotswa SA 0.003 212.8 160 0 0 0 0
Aust 0.6 290.1 4635 1 0 0 0Belg 20.4 349.8 5362 0 0 0 0Bulg 0.03 24.1 4639 0 0 0 1Czech 1.1 107 5193 1 0 0 1Denm 1.32 243 5591 0 0 0 0Eston 1 10.8 5790 1 0 0 0Finl 0.4 186.6 5890 0 0 0 1Fran 18.7 2000 5266 0 0 0 1Germ 24.1 2700 5367 0 0 0 0Swed 34.1 346.4 5805 0 0 0 0Hung 1.4 99.7 4979 1 0 0 0Irel 2.7 183.6 5712 0 0 0 0Italy 10.9 1000.7 4875 0 0 0 0Nether 6.6 577.3 5413 0 0 0 0UK 209 2000.1 5476 0 0 0 0Polan 0.4 241.8 5325 0 0 0 0Egypt 1.23 75.1 3779 0 0 0 0Keny 1.435 15.6 1765 0 0 0 0Malaw 1.435 1.8 896 0 0 0 0Mauriu 0.92 6.1 2048 0 0 0 0Zamb 5.07 5.4 663 0 0 0 0Zimbab 263.7 7.2 575 0 0 0 0Gree 3.023 203.4 4314 1 0 0 0Portu 2.01 168.3 4913 0 0 0 0Spain 1.58 991.4 4879 1 0 0 1Cyp 0.726 15.4 4142 1 0 0 0Latvia 0.726 13.6 5620 0 0 0 0Malta 0.662 5.4 4230 0 0 0 0Slovak 0.04 41.1 5041 0 0 0 0Slove 0.06 32.2 4918 0 0 0 0Lithu 0.05 22.3 5463 0 0 0 0Lesot 0.013 1.4 160 0 0 0 0Namib 0.011 5.5 160 0 0 0 0Swazi 0.002 2.4 345 0 0 0 0USA 66.2 12000.2 7801 0 0 0 0interact 0 0 0 0
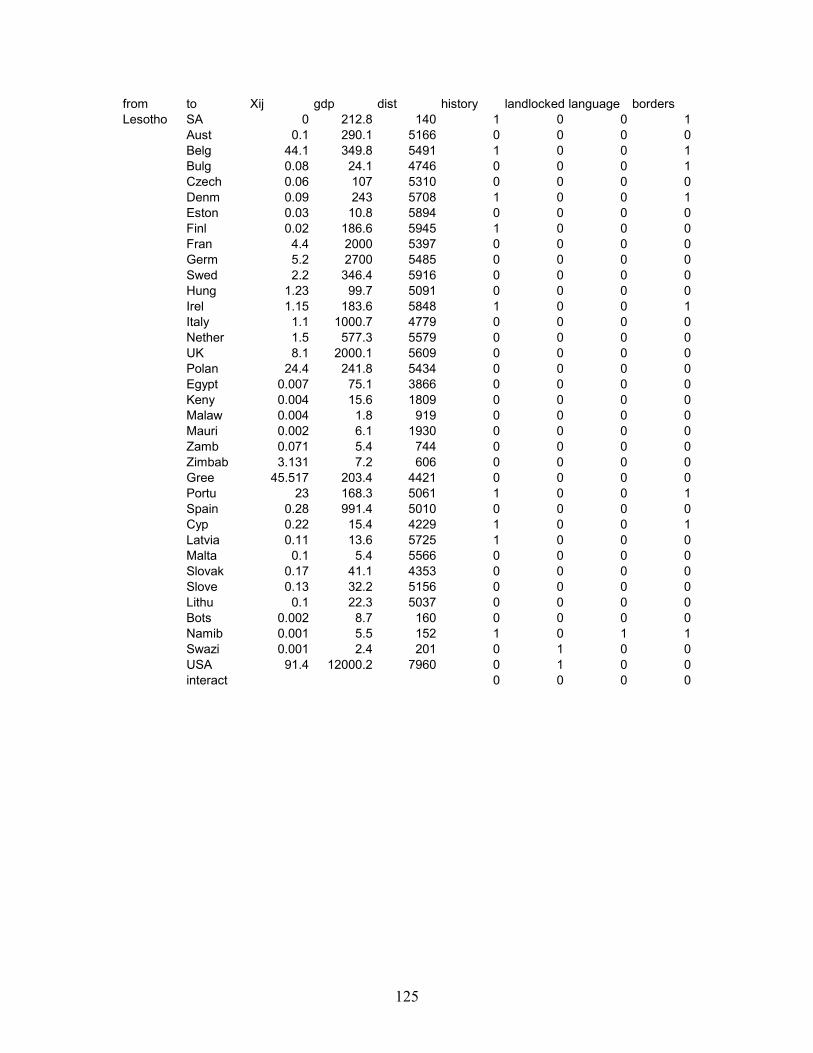
125
from to Xij gdp dist history landlocked language bordersLesotho SA 0 212.8 140 1 0 0 1
Aust 0.1 290.1 5166 0 0 0 0Belg 44.1 349.8 5491 1 0 0 1Bulg 0.08 24.1 4746 0 0 0 1Czech 0.06 107 5310 0 0 0 0Denm 0.09 243 5708 1 0 0 1Eston 0.03 10.8 5894 0 0 0 0Finl 0.02 186.6 5945 1 0 0 0Fran 4.4 2000 5397 0 0 0 0Germ 5.2 2700 5485 0 0 0 0Swed 2.2 346.4 5916 0 0 0 0Hung 1.23 99.7 5091 0 0 0 0Irel 1.15 183.6 5848 1 0 0 1Italy 1.1 1000.7 4779 0 0 0 0Nether 1.5 577.3 5579 0 0 0 0UK 8.1 2000.1 5609 0 0 0 0Polan 24.4 241.8 5434 0 0 0 0Egypt 0.007 75.1 3866 0 0 0 0Keny 0.004 15.6 1809 0 0 0 0Malaw 0.004 1.8 919 0 0 0 0Mauri 0.002 6.1 1930 0 0 0 0Zamb 0.071 5.4 744 0 0 0 0Zimbab 3.131 7.2 606 0 0 0 0Gree 45.517 203.4 4421 0 0 0 0Portu 23 168.3 5061 1 0 0 1Spain 0.28 991.4 5010 0 0 0 0Cyp 0.22 15.4 4229 1 0 0 1Latvia 0.11 13.6 5725 1 0 0 0Malta 0.1 5.4 5566 0 0 0 0Slovak 0.17 41.1 4353 0 0 0 0Slove 0.13 32.2 5156 0 0 0 0Lithu 0.1 22.3 5037 0 0 0 0Bots 0.002 8.7 160 0 0 0 0Namib 0.001 5.5 152 1 0 1 1Swazi 0.001 2.4 201 0 1 0 0USA 91.4 12000.2 7960 0 1 0 0interact 0 0 0 0

126
from to Xij gdp dist history landlocked language bordersNamib SA 0.02 212.8 152 0 0 0 0
Aus 1.4 290.1 5166 0 1 0 0Belg 41.7 349.8 5491 0 0 0 0Bulg 0.4 24.1 4746 0 0 0 0Czech 0.2 107 5310 0 0 0 0Denm 2.36 243 5708 0 0 0 0Eston 1.23 10.8 5894 0 0 0 0Finl 2.06 186.6 5945 0 0 0 0Fran 26 2000 5397 0 1 0 0Germ 45 2700 5485 1 0 1 0Swed 1.6 346.4 5916 1 0 0 0Hung 1.1 99.7 5091 0 0 0 0Irel 0.6 183.6 5848 0 0 1 0Italy 33.4 1000.7 4779 0 0 0 0Nether 10.3 577.3 5579 0 1 0 0UK 35.9 2000.1 5609 1 0 0 0Polan 1074 241.8 5434 1 0 1 0Egypt 0.041 75.1 3866 1 1 0 1Keny 0.025 15.6 1809 1 0 0 0Malaw 0.025 1.8 919 1 1 1 1Maur 0.014 6.1 1930 1 1 1 1Zamb 5.267 5.4 744 0 0 0 0Zimbab 56.584 7.2 606 0 0 0 0Gree 14.676 203.4 4421 0 0 0 0Portu 2.14 168.3 5061 1 0 0 0Spain 142 991.4 5010 0 0 0 0Cyp 3 15.4 4229 0 0 1 0Latvia 0.01 13.6 5725 0 1 0 0Malta 0.01 5.4 5566 0 0 0 0Slovak 0.21 41.1 4353 0 0 0 0Slove 0.2 32.2 5156 1 1 1 1Lithu 0.1 22.3 5037 0 0 0 1Bots 0.03 1.4 160 1 1 1 1Lesoth 0.02 5.5 140 0 0 0 0Swazi 0.01 2.4 201 1 0 1 0USA 90.9 12000.2 7960 0 0 0 0interact 0 0 0 0

127
from to Xij gdp dist history landlocked language bordersSwazil SA 0.02 212.8 201 0 0 0 0
Aus 0.3 290.1 5210 0 0 0 0Belg 8.7 349.8 5558 0 1 0 0Bulg 0 24.1 4775 0 0 0 0Czech 0.04 107 5357 0 0 0 0Denm 0.89 243 5754 0 0 0 0Eston 0.13 10.8 5915 0 0 0 0Finl 16.12 186.6 6052 0 0 0 0Fran 45.6 2000 5471 0 0 0 0Germ 6.9 2700 5532 0 1 0 0Swed 3.4 346.4 5949 1 0 1 0Hung 0.1 99.7 5129 1 0 0 0Irel 1.71 183.6 6930 0 0 0 0Italy 5.6 1000.7 4838 0 0 0 0Nether 4.3 577.3 5609 0 0 0 0UK 48.2 2000.1 5684 0 1 0 0Polan 1231 241.8 5465 1 0 0 0Egypt 0.06 75.1 3872 1 0 1 0Keny 0.2 15.6 1762 1 1 0 0Malaw 0.2 1.8 866 1 0 0 0Mauri 0.15 6.1 1732 1 1 1 0Zamb 7.614 5.4 775 1 1 1 1Zimbab 25.029 7.2 584 0 0 0 0Gree 4.3 203.4 4452 0 0 0 0Portu 3.03 168.3 5174 0 0 0 0Spain 0.018 991.4 5110 1 0 0 0Cyp 0.018 15.4 4230 0 0 0 0Latvia 0.01 13.6 5748 1 0 1 0Malta 0.01 5.4 4413 0 1 0 0Slovak 1.1 41.1 5198 0 0 0 0Slove 1.2 32.2 5088 0 0 0 0Lithu 1.13 22.3 5587 1 1 1 1Bots 0.04 8.7 345 0 0 1 1Lesoth 0.03 1.4 201 1 1 1 1Namibia 0.01 5.5 201 1 0 1 1USA 52.4 12000.2 8133 0 0 0 0interact 0 0 0 0

128
from to Xij gdp dist history landlocked language bordersUSA SA 5616 212.8 7960 0 0 0 0
Aus 4526 290.1 4233 0 0 0 0Belg 22515 349.8 3668 0 1 0 0Bulg 289 24.1 4724 0 0 0 0Czech 1230 107 4094 0 0 0 0Denm 3983 243 3850 0 0 0 0Eston 134 10.8 4145 0 0 0 0Finl 4269 186.6 4123 0 0 0 0Fran 37331 2000 3635 0 0 0 0Germ 68660 2700 4042 0 1 0 0Swed 10847 346.4 3934 1 0 1 0Hung 1594 99.7 4376 1 0 0 0Irel 10600 183.6 3185 0 0 0 0Italy 29166 1000.7 4298 0 0 0 0Nether 27505 577.3 3652 0 0 0 0UK 69991 2000.1 3470 1 1 1 0Polan 1915 241.8 4261 1 0 0 0Egypt 4535 75.1 5621 0 0 1 0Keny 346 15.6 7360 0 1 0 0Malaw 105.6 1.8 7769 0 0 0 0Mauri 285 6.1 9288 0 1 1 0Zamb 86.5 5.4 7546 0 1 1 0Zimbab 230 7.2 7788 0 0 0 0Gree 1552 203.4 5289 0 0 0 0Portu 2149 168.3 4266 0 0 0 0Spain 10455 991.4 3591 1 0 0 0Cyp 261 15.4 5468 0 0 0 0Latvia 382 13.6 4210 1 0 1 0Malta 346 5.4 4626 0 1 0 0Slovak 258 41.1 4233 0 0 0 0Slove 402 32.2 3591 0 0 0 0Lithu 177 22.3 4333 1 1 0 0Bots 68.2 8.7 7801 0 0 0 0Lesoth 91.4 1.4 7960 0 0 0 0Namibia 90.9 5.5 7960 0 0 0 0Swazi 52.4 2.4 8133 0 0 0 0interact 0 0 0 0

129
from to Xij gdp dist history landlocked language bordersIre SA 396 212.8 5848 0 0 0 0
Austria 285 290.1 1048 0 0 0 0Belg 3040 349.8 484 1 0 0 0Bulg 8 24.1 1541 0 0 0 0Czech 178 107 914 1 1 0 1Denm 852 243 765 1 0 0 1Eston 554 10.8 1245 1 0 0 0Finl 325 186.6 783 0 1 0 0Fran 1808 2000 489 0 1 0 0Germ 2311 2700 817 0 0 0 0Swed 1203 346.4 1010 0 1 0 0Hunga 188 99.7 1192 1 0 0 0Italy 2428 1000.7 1182 1 0 0 0Nether 4879 577.3 448 0 0 0 0UK 25774 2000.1 291 0 0 0 0Poland 291 241.8 1135 0 0 0 0Egypt 153.28 75.1 2478 0 0 0 0Keny 35 15.6 4507 0 0 0 0Malaw 0.66 1.8 5211 0 0 0 0Mauri 16.79 6.1 6346 0 0 0 0Zamb 4 5.4 5163 0 0 0 0Zimbab 15.77 7.2 5385 0 0 0 0Gree 5907 203.4 1777 0 0 0 0Portu 325 168.3 1026 0 0 0 0Spain 1740 991.4 848 0 0 0 0Cyp 50 15.4 2288 0 0 0 0Latvia 27 13.6 1215 1 0 1 1Malta 35 5.4 1574 0 0 0 0Slovak 30 41.1 1081 0 0 0 0Slove 26 32.2 1055 0 0 0 0Lithu 19 22.3 1276 1 0 1 0Bots 2.71 8.7 5712 1 0 0 0Lesot 1.12 1.4 5609 1 0 0 0Namib 0.6 5.5 5609 1 0 1 0Swazi 1.71 2.4 5930 1 0 1 0USA 10600 12000.2 3185 0 0 0 0interact 0 0 0 0

130
from to Xij gdp dist history landlocked language bordersFinl SA 248 212.8 5387 1 0 0 0
Austria 690 290.1 645 1 0 0 1Belg 1685 349.8 675 0 0 0 0Bulg 36 24.1 1305 0 0 0 0Czech 378 107 697 0 0 0 0Denm 2229 243 299 0 0 0 0Eston 1646 10.8 493 0 0 0 0Fran 3089 2000 836 0 0 0 0Germ 8651 2700 523 0 0 0 0Swed 7404 346.4 259 0 0 0 0Hung 276 99.7 931 0 0 0 0Irel 550 183.6 783 0 0 0 0Italy 2379 1000.7 694 0 0 0 0Nether 2798 577.3 638 0 0 0 1UK 6151 2000.1 718 0 0 0 0Poland 1020 241.8 648 0 0 0 0Egypt 183 75.1 2279 0 0 0 1Keny 44 15.6 4447 0 0 0 0Malaw 5.31 1.8 5252 0 0 0 0Mauri 9.16 6.1 6133 0 0 0 0Zamb 14 5.4 5278 0 0 0 0Zimbab 13 7.2 5477 0 0 0 0Gree 309 203.4 1619 0 0 0 0Portu 437 168.3 1703 0 0 0 0Spain 1282 991.4 1358 0 0 0 0Cyp 18 15.4 1990 0 0 0 0Latvia 295 13.6 528 0 0 0 0Malta 6 5.4 1671 0 0 0 0Slovak 99 41.1 855 0 0 0 0Slove 55 32.2 973 0 0 0 0Lithu 185 22.3 655 0 0 0 0Bots 0.4 8.7 5890 0 0 0 0Lesot 0.02 1.4 5387 0 0 0 0Namib 2.06 5.5 5387 0 0 0 0Swazi 16.12 2.4 6052 0 0 0 1USA 4269 12000.2 4123 0 0 0 0interact 0 0 0 0

131
from to Xij gdp dist history landlocked language bordersFran SA 1672 212.8 5091 0 0 0 0
Aus 4985 290.1 645 0 0 0 0Belg 43199 349.8 165 0 0 0 1Bulg 349 24.1 1095 0 0 0 0czech 1866 107 551 0 0 0 0Denm 4617 243 639 0 0 0 0Eston 105 10.8 1158 0 0 0 0Finland 1653 186.6 836 0 0 0 0Germ 87472 2700 545 0 0 0 0Swed 7857 346.4 963 0 0 0 1Hung 1758 99.7 787 0 0 1 1Irel 5687 183.6 489 0 0 0 0Italy 51120 1000.7 694 0 0 0 1Nether 26040 577.3 198 0 0 0 1UK 49955 2000.1 213 0 0 0 0Poland 3558 241.8 859 0 0 0 0Egypt 1653 75.1 2001 0 0 0 1Keny 198.6 15.6 4020 0 0 0 0Malaw 13.8 1.8 4734 0 0 0 0Mauri 701 6.1 5859 0 0 0 0Zamb 95.3 5.4 4699 0 0 0 0Zimbab 94.7 7.2 4918 0 0 0 1Gree 2824 203.4 1301 0 0 0 0Portu 6845 168.3 902 0 0 0 1Spain 39757 991.4 523 0 0 0 1Cyp 182 15.4 1834 0 0 0 0Latvia 132 13.6 1062 0 0 0 0Malta 631 5.4 1088 0 0 0 0Slovak 618 41.1 679 0 0 0 0Slove 1562 32.2 602 0 0 0 0Lithu 291 22.3 1059 0 0 0 0Bots 18.7 8.7 5265 0 0 0 0Lesot 4.4 1.4 5091 0 0 0 0Namib 26 5.5 5091 0 0 0 0Swazi 45.6 2.4 5471 0 0 0 0USA 37331 12000.2 3635 0 0 0 0interact 0 0 0 0

132
from to Xij gdp dist history landlocked language bordersGerm SA 4435 212.8 5848 0 0 0 0
Aus 42515 290.1 326 0 0 0 0Belg 56634 349.8 403 0 0 0 1Bulg 1170 24.1 821 0 0 0 0Czech 17465 107 175 0 0 0 0Denmark 17008 243 224 0 0 0 0Estonia 641 10.8 650 0 0 0 1Finla 8825 186.6 523 0 0 0 1Fran 100299 2000 545 0 0 0 1Swed 20167 346.4 508 0 0 0 0Hung 12959 99.7 439 0 0 1 1Irel 7237 183.6 817 0 0 1 1Italy 71754 1000.7 736 0 0 0 0Nether 72784 577.3 408 1 0 0 1UK 73594 2000.1 577 0 0 0 0Poland 20184 241.8 327 1 0 0 0Egypt 2156 75.1 1802 0 0 0 0Keny 342 15.6 3949 0 0 0 1Malaw 88.3 1.8 4738 0 0 0 0Mauri 180.6 6.1 5685 1 0 0 1Zamb 41 5.4 4758 0 0 0 1Zimbab 270 7.2 4958 0 0 0 1Gree 5351 203.4 1119 0 0 0 1Portu 10477 168.3 1435 0 0 0 0Spain 33802 991.4 1007 1 0 0 1Cyp 384 15.4 1549 0 0 0 1Latvia 891 13.6 528 0 0 0 0Malta 462 5.4 1151 0 0 0 0Slovak 5046 41.1 345 0 0 0 0Slove 4435 32.2 450 0 0 0 0Lithu 1474 22.3 514 0 0 0 0Bots 24.1 8.7 5367 0 0 0 0Lesot 5.2 1.4 5848 0 0 0 0Namib 45 5.5 5848 0 0 0 0Swazi 6.9 2.4 5532 0 0 0 1USA 68660 12000.2 4042 0 0 0 0interact 0 0 0 0

133
VITA Gregory Chukwuemeka Kwentua is a native of Asaba, Delta State, Nigeria. In 1988, he
received his Bachelor of Agriculture degree in animal science at University of Nigeria.
After receiving his degree, he pursued a career in the advertising industry as a client
service executive for new generation advertising. There he was responsible for
preparation of proposals, coordinating analysis, reporting, providing commercial analysis
to new marketing initiative, and support management client service and sales activities.
He worked at new generation advertising for over ten years. He later joined Brokers
Eureka, Lagos, Nigeria, as a client service manager; there he was responsible for
supervising the client service department, ensuring that clients receive personalized
service, completion of transaction and providing professional relationship management.
In 2002, Gregory migrated to Louisiana where he secured a job at Dillard’s as a sales
associate. A year later, he gained admission into Louisiana State University to pursue his
Master of Science degree in agricultural economics.