trade finance in africa - african development bank · pdf file6 7. trade finance contributes...
TRANSCRIPT

Trade Finance in Africa
3 December 2014

1
Table of Contents
i. Acknowledgement ............................................................................................................................................ 3
ii. Executive Summary .......................................................................................................................................... 5
I. Introduction ...................................................................................................................................................... 7
II. African Trade: Recent Trends .......................................................................................................................... 8
III. The Data ......................................................................................................................................................... 11
IV. Main Findings ................................................................................................................................................. 14
a. Participation in Trade Finance by African Banks ........................................................................................... 14
b. Importance of Trade Finance for African Banks ............................................................................................ 15
c. Trade Finance Assets: On and Off-Balance Sheet Transactions .................................................................... 17
d. The Size of Bank-Intermediated Trade Finance in Africa .............................................................................. 19
e. Trade Finance Supporting Intra-African Trade .............................................................................................. 20
f. Letters of Credit .............................................................................................................................................. 22
f.1. Pricing of Letters of Credit .................................................................................................................... 25
f.2. Unmet Demand: Rejection Rates for Letters of Credit .......................................................................... 26
g. On-balance Sheet Trade Finance Facilities (e.g. Short-Term Pre-Export and Post-Import Loans) ................ 31
g.1. Reasons for Rejecting On-Balance Sheet Trade Finance Requests ....................................................... 33
h. Default Rates on Trade Finance Operations ................................................................................................... 35
i. Size of Unmet Demand for Trade Finance in Africa ...................................................................................... 37
j. The Market for Confirming Banks ................................................................................................................. 37
k. Africa-Based Confirming Banks .................................................................................................................... 39
l. Outlook for Trade Finance Activities ............................................................................................................. 42
V. Conclusion ...................................................................................................................................................... 47
References ................................................................................................................................................................... 48
Appendix ..................................................................................................................................................................... 51

2
Figures
Figure 1: African Trade (Exports and Imports) and GDP (in USD Billions - Constant 2000). ....................................................... 10 Figure 2: Distribution of Bank Type (Ownership Structure) by Sub-Region. ................................................................................. 12 Figure 3: Distribution of Bank Size by Assets, Deposits, Equity (Tier 1) and Profit (in USD million). ......................................... 13 Figure 4: Average Bank’s Return on Assets (ROA) and Return on Equity (ROE). ........................................................................ 13 Figure 5: Average Bank’s Non-Performing Loans (NPLs) Ratio by Year and Sub-Regions. ........................................................ 14 Figure 6: Proportion of Banks Engaged in Trade Finance by Year. ............................................................................................... 15 Figure 7: Proportion of Banks Engaged in Trade Finance by Sub-Region. .................................................................................... 15 Figure 8: Average Share of Bank’s Income from Trade Finance by Year and Bank Type. ............................................................ 16 Figure 9: Average Share of Income from Trade Finance by Bank Age and Country Type. ........................................................... 17 Figure 10: Average Values of On and Off-Balance Sheet Trade Finance Assets by Various Categories (in million USD). .......... 18 Figure 11: Average Share of Banks’ On and Off-Balance Sheet Trade Finance Assets Supporting Intra-African Trade by Year
and Sub-Region. .................................................................................................................................................................... 22 Figure 12: Average Number of Letters of Credit Issuances and Proportion of Banks Issuing Letters of Credit by Various
Categories. ............................................................................................................................................................................ 24 Figure 13: Average Values of Letters of Credit Issuances by Various Categories (in million USD). ............................................. 25 Figure 14: Average Fee Rate (quarterly) for Letters of Credit Issuance by Year and Sub-Region. ................................................ 26 Figure 15: Distribution of Banks’ Rejection Rates for Issuing Letters of Credit by Sub-Region and Bank Type. ......................... 27 Figure 16: Reasons for Banks’ Rejection of Letter of Credit Applications. .................................................................................... 29 Figure 17: Reasons of Banks’ Rejection of Letters of Credit Applications by Various Categories. ............................................... 30 Figure 18: Average Approval Rates of On-Balance Sheet Trade Finance Transactions by Various Categories. ............................ 32 Figure 19: Average Approval Rates of On-Balance Sheet Trade Finance Transactions by Country Type. .................................... 33 Figure 20: Banks’ Reasons for Rejecting Firms’ On-Balance Sheet Trade Finance Facilities Application. ................................... 33 Figure 21: Banks’ Reasons for Rejecting Firms’ On-Balance Sheet Trade Finance Facilities Application by Various Categories.
.............................................................................................................................................................................................. 34 Figure 22: Average Default Rates on Trade Finance Activities by Various Categories. ................................................................ 36 Figure 23: Top International Confirming Banks for Letters of Credit Issued by African Banks. .................................................. 39 Figure 24: Proportion of Global Systemically Important Banks (G-SIBs) among International Banks Confirming Letters of Credit
Issued by African Banks. ...................................................................................................................................................... 39 Figure 25: Proportion of African-Based Confirming Banks and their Distribution by Sub-Region. .............................................. 41 Figure 26: Average Annual Value of Trade Finance Confirmation by African-Based Banks (in million USD). ........................... 41 Figure 27: Proportion of Banks in 2012 that Expect an Increase in their Trade Finance Activities in the Following Year by
Various Categories. ............................................................................................................................................................... 42 Figure 28: Banks’ Reported Constraints to their Trade Finance Portfolio Growth. ........................................................................ 43 Figure 29: Banks’ Reported Constraints to Their Trade Finance Portfolio Growth by Various Categories. .................................. 44 Figure A 1: Countries Breakdown of the Surveyed Banks. ............................................................................................................ 51
Box
Box 1: The African Development Bank’s Trade Finance Program. ............................................................................................... 45
Tables
Table 1: Selected Projects Approved by the African Development Bank under its Trade Finance Program. ................................. 46 Table A 1: Sub-Regional Breakdown. ............................................................................................................................................ 52 Table A 2: Other Country Groupings.............................................................................................................................................. 53

3
i. Acknowledgement
The authors of this report are Ousman Gajigo (Principal Economist, Research Department),
Thouraya Triki (Chief Country Economist, North Africa Regional Department) and Lamin
Drammeh (Senior Investment Officer, Financial Sector Development Department) - all from the
African Development Bank (AfDB). It was produced under the supervision of Issa Faye
(Division Manager, Research Department), Yaw Kuffour (Head, Trade Finance Operations,
Financial Sector Development Department), and under the overall guidance of Steve Kayizzi-
Mugerwa (Chief Economist and Director, Research Department).
The report was made possible thanks to the active collaboration of many individuals. The
AfDB’s Resident Representatives, regional economists, country economists, private sector
specialists, investment officers and country program officers were particularly helpful in
identifying and contacting the banks that participated in the survey in their respective countries.
This was critical to ensure that virtually all banks operating in Africa received the survey
questionnaire. We would like to particularly highlight the help of the following staff members:
Adalbert Nshimyumuremyi, Alassane Diabate, Albert Mafusire, Andre Almeida Santos,
Anthony Simpasa, Audrey Vergnes, Babatunde Tijani, Babucarr Koma, Barbara Barungi, Basil
Jones, Carpophore Ntagungira, Claude N’kodia, Daniel Ndoye, Edirisa Nseera, Edward
Sennoga, Emanuele Santi, Emmanuel Akinwumi, Erwin Wiss, Flavio Soares de Gama, George
Honde, Ismael Touré, Jacob Odour, Joel Munzima, Jonathan Banda, Josef Loening, Julius
Karuga, Kalidou Diallo, Karim Mhirsi, Laura French, Magidu Nyende, Malek Bouzgarrou,
Mamadou Sakho, Martha Phiri, Mary Monyau, Mkola Tambwe, Mouhamadou Sy, Mouna
Diawara, Nekati Bleming, Nouridine Kan Dia, Olusegun Alebiosu, Patrick Hettinger, Peninah
Kariuki, Peter Mwanakatwe, Peter Rasmussen, Robert Peprah, Seraphine Wakana, Sibaye
Tokindang, Sofiane Sekioua, Stefan Muller, Susan Mpande, Suwareh Darbo, Tarek Ammar,
Tarik Benbahmed, Thierry Kangoye, Toussaint Houeninvo, Wolassa Kumo, Wilberforce Mariki,
Yannis Arvanitis and Zuzana Brixiova. We also owe a lot of thanks to African central banks that
significantly increased the response rate of the survey by encouraging the participation of
commercial banks under their purview. Excellent research support was provided by Mouna Ben
Dhaou and Zenia Lewis, both of whom worked as consultants on this project.

4
We are grateful for comments from colleagues in the research and operations departments of the
AfDB, as well as participants at the Making Finance Work for Africa forum held in Dakar on 10-
12 June 2014. And finally, we would like to thank all the commercial banks that responded to
our survey since without their participation there would have been no data.
The findings, interpretations, and conclusions expressed in this report are entirely those of the
authors and do not necessarily represent the view of the African Development Bank, its Board of
Directors, or the countries they represent.

5
ii. Executive Summary
The objective of this report is to improve understanding of the trade finance market in Africa,
which remains under explored because of data scarcity. The report is based on a unique and
primary survey of African commercial banks collected specifically for this purpose. The survey
covered about 276 banks across 45 African countries on their trade finance activities in 2011 and
2012. The main findings of the report can be summarized as follows:
1. The value of bank-intermediated trade finance in Africa is estimated to range from USD
330 billion to USD 350 billion. This is roughly equal to one-third of total African trade. Notably,
there is significant sub-regional heterogeneity, with the average trade finance assets per bank in
Northern Africa dwarfing those of the other sub-regions.
2. The share of bank-intermediated trade finance that is devoted to intra-African trade is
limited, and comprises approximately 18% (USD 68 billion) of the total trade finance assets of
African banks. It should be noted, however, that the share of intra-African trade accounts for 11%
(USD 110 billion) of the value of total African trade. Hence, while the value of trade finance that
African banks devote to support intra-African trade is lower than the amount of the region’s
internal trade, the proportion is much higher than the latter’s.
3. There are still significant deficits in meeting the demand for trade finance in Africa. Given
the estimated rejection/approval rates reported in the survey, the conservative estimate for the
value of unmet demand for bank-intermediated trade finance is USD 110 billion to USD 120
billion, significantly higher than estimated earlier figures of about USD 25 billion. These figures
suggest that the market is significantly underserved. Unmet demand is also much higher in fragile
and low-income countries (LICs) than in middle-income countries (MICs).
4. Trade finance is a relatively low-risk bank activity in Africa but not to the same degree as
other regions. Average trade finance default rates in Africa (4%), while low, are still higher than
other regions of the world where it averages less than 1%. Default rates are also highly variable
across sub-regions. However, the trade finance default rates are significantly lower than banks’
overall non-performing loans ratio.
5. The outlook for trade finance remains positive, with about 72% of the responding banks
expecting to increase their trade finance activities in the immediate future. However, banks
foresee obstacles to their trade finance portfolio growth such as low US dollar liquidity,
regulation compliance, slow economic growth, and the inability to assess the credit-worthiness of
potential borrowers.
6. Trade finance is an appealing activity for African commercial banks and is attracting a
growing number of players. The majority (93%) of surveyed banks undertook trade finance
activities in 2012. This high participation rate in the sector is true for all sub-regions of the
continent. We also find a slight increase in the share of banks that have had trade finance assets
from 92% in 2011 to 93% in 2012.

6
7. Trade finance contributes about 17% of African banks’ earnings on average. Banks’ share
of earnings from trade finance is inversely proportional to the depth of financial markets in their
home countries. Whether this adds to the diversification of banks’ earnings is not clear from
available data.
8. The most common fee rate (on a quarterly basis) for issuing letters of credit in Africa
remains virtually unchanged within the range of 0.5% to 1% between 2011 and 2012. The
effects of the global financial crisis seem to be abating, at least with regards to pricing in the trade
finance market. While there have been significant increases in pricing for trade finance
instruments during the financial crisis (2008-2010), the results of our survey suggest that pricing
has stabilized between 2011 and 2012 in Africa.
9. African banks face numerous constraints in meeting the demand for trade finance. The
survey reveals that the main constraints are limited US dollar liquidity (by far the dominant
currency in international trade, and by extension, trade finance) and insufficient limits with
confirming banks. Indeed, the requirement of confirmation of letters of credit (LCs) remains a
major challenge for African banks as virtually all LCs issued by banks on the continent require
confirmation when the counterparty is located outside the region. Given the limits on risk
headroom by confirming banks for African issuing banks, a large number of the latter are highly
constrained in providing needed trade finance.
10. There is a growing list of African confirming banks, though most of these are located in the
more developed markets of the region. In fact, the biggest determinant of the likelihood of a
bank confirming letters of credit is whether it is located in a country with high GDP level and
financial sector development. Other factors that determine the likelihood of a bank confirming
letters of credit is size (in terms of total assets) and local ownership. It is not clear to what extent
African-based confirming banks can confirm letters of credit when the beneficiary of the letter of
credit is located outside of the continent. Confirming banks are significantly less likely to be in
low-income and fragile states.
11. Given the above constraints, there exists a significant role for governments and
development finance institutions (DFIs). In particular, trade facilitation programs that address
USD liquidity and relax constraints from binding risk limit are needed to meet the increasing
demand of African firms for trade finance. Given this reality, the AfDB’s trade finance program
is a welcome addition to on-going trade facilitation programs instituted by a number of DFIs.

7
I. Introduction
Trade is an important driver of economic growth and development. The value of African trade
(the sum of imports and exports) amounts to approximately two-thirds of its GDP, making it one
of the most open1 regions. These export and import flows have development implications for the
continent. Exports allow African firms to access larger markets and innovate through greater
competition, leading to higher productivity and growth. Imports of consumption goods are
essential for consumers, while imports of machinery and other intermediate goods allow
manufacturing firms to generate employment through greater production and exports.
For firms operating in Africa, trade finance is of paramount importance. When bank financing is
not available, firms typically enter into inter-firm credit arrangements such as cash-in-advance
and open account transactions. In a cash-in-advance arrangement, the importer extends credit to
the exporter by making payment before the goods are transferred with transaction risk borne by
the importer. In an open account transaction, the exporter bears the risk by transferring goods
before full payment is received. Both mechanisms carry significant risk and firms mostly partake
due to lack of alternatives. For instance, cash-in-advance arrangements impose liquidity-
constraints and therefore limit profitability and growth. Similarly, open-account transactions are
often unavailable as sellers tend to have a high risk aversion to buyers and are not willing to ship
goods before full payment. To navigate these challenges, firms commonly seek trade finance
from financial intermediaries, such as commercial or development banks and export promoting
agencies. Bank-intermediated trade finance may be provided “off-balance sheet” in the form of
documentary, commercial or standby letters of credit, promissory notes, bills of exchange, and
guarantees. It may also be extended through “on-balance sheet” transactions in the form of short-
term trade finance loans such as pre or post-shipment loans, trade-related revolving credit and
export factoring, among others.
Despite the importance of trade finance for firms engaged in international trade, there is a great
deal we do not know about the market in Africa. This includes the approximate size of trade that
1 One of the most common definitions of openness is the ratio of trade (the sum of exports and imports) to GDP. For
example, the average value of trade as a percentage of GDP for OECD countries is approximately 40%.
8
is facilitated by banks, its variation across countries, the share of trade finance going to intra-
African trade, the importance of this sector for banks’ earnings, and how the characteristics of
trade finance evolve with other macroeconomic variables. Without an accurate picture of the
current trade finance landscape on the continent, it is challenging for policy makers and
development finance institutions (DFIs) to implement targeted programs and actions.
While the lack of data is not limited to Africa, the degree is more acute for the region. This
limitation has already been recognized by a number of recent publications (BIS 2014; Auboin
2007; Auboin and Engemann 2013; Mora and Power 2011). With the impact of the 2008/09
financial crisis, there has been an increase in the rate of publications on trade finance. The World
Bank, the International Monetary Fund, the Asian Development Bank and the International
Chamber of Commerce have all carried out some surveys on the market. Unfortunately, the
coverage of the African trade finance market in these surveys has been limited2.
This report seeks to fill the above information gap. It is based on a unique survey of the trade
finance activities performed by commercial banks in Africa in 2011 and 2012. Our sample
covers 276 banks in 45 countries. We find a significant participation in trade finance activities by
African banks through both on-balance sheet and off-balance sheet financing. Yet, despite the
high participation rate of commercial banks, there is a substantial degree of unmet demand as
evidenced by a significant rejection rate of finance requests made by firms. There is some silver
lining in that some of the constraints faced by banks can be addressed through appropriate
policies, both through individual country policies and interventions by development finance
institutions such as the African Development Bank.
II. African Trade: Recent Trends
Africa’s GDP grew, on average, at 4% per annum between 2000 and 2012, with trade being an
important engine of this growth, mainly driven by high commodity prices. Since 2000, growth in
African trade outpaced the continent’s GDP growth, at about 8% per annum (Figure 1) resulting
2 The World Bank survey (Malouche 2009) is an exemption as African banks constituted about half of their sample
size of 78 banks.

9
in the value of trade surpassing the USD 1 trillion mark in 2012. Growth in Africa’s trade has
also exceeded the global rate, which was about 4% in 2012.
Intra-African trade remains, however, very limited. Notably, among all the regions of the world,
intra-regional trade is lowest in Africa, accounting for approximately 11% of the total value of
African trade in 2012 (UNCTAD 2013). For Asia, Europe and Latin America, intra-regional
trade represented, on average, about 51%, 68% and 21% of their trade over the period 2007-
2011, respectively. The share of intra-African trade is not uniform across sub-regions. North
Africa has the lowest proportion of intra-regional trade mainly because of the limited integration
of the 6 countries in this sub-region (5%). The sub-region with the highest proportion of intra-
regional trade is Eastern Africa (27% in 2012). Western and Southern Africa have almost similar
proportions of their trade done within the region. Interestingly, this ordering of sub-regions
changes when the values, instead of the proportions of intra-regional, are considered.
Specifically, when expressed in US dollar values, the small proportion of intra-regional trade in
North Africa surpasses the value of intra-regional trade for those of Eastern and Central Africa.
Southern Africa has the largest value of intra-regional trade, almost as high as Western, Eastern
and Central Africa combined.
Africa had also showed some resilience to the 2008 global crisis. Yet, in all sub-regions of the
continent, GDP and trade grew at a much lower pace between 2008 and 2012 compared to pre-
crisis levels. Not surprisingly, the more globally integrated Northern and Southern sub-regions
experienced a more pronounced effect on their trade and GDP than other less integrated parts of
the continent (e.g. Central Africa). The 2008 financial crisis affected African trade both directly
through a contraction of demand for African goods and services (Berman and Martin 2010; Chor
and Manova 2009) and indirectly through reduction in available trade finance facilities. Indeed,
a large share of African trade depends on trade finance from local and international banks,
including the confirmation of letters of credit. When the crisis hit, many international financial
institutions started cutting financing for counterparts in countries that were considered high risk.
This was reflected in reduced financing limits for these countries, higher pricing and stricter
requirements on counter-party banks such as cash collateral, as well as shortened maturities.

10
Changes in prudential regulation that followed the crisis further compounded trade finance
scarcity.
Figure 1: African Trade (Exports and Imports) and GDP (in USD Billions - Constant 2000).
Source: IMF Direction of Trade (2013) and African Development Bank (2013).
0
200
400
600
800
1 000
1 200
20
00
20
01
20
02
20
03
20
04
20
05
20
06
20
07
20
08
20
09
20
10
20
11
20
12
AfricaImports
Exports
PIB
0
10
20
30
40
50
60
70
20
00
20
01
20
02
20
03
20
04
20
05
20
06
20
07
20
08
20
09
20
10
20
11
20
12
Central Africa
Imports
Exports
GDP
0
20
40
60
80
100
120
20
00
20
01
20
02
20
03
20
04
20
05
20
06
20
07
20
08
20
09
20
10
20
11
20
12
East Africa Imports
Exports
GDP
0
50
100
150
200
250
3002
00
0
20
01
20
02
20
03
20
04
20
05
20
06
20
07
20
08
20
09
20
10
20
11
20
12
West Africa
Imports
Exports
GDP
0
50
100
150
200
250
300
20
00
20
01
20
02
20
03
20
04
20
05
20
06
20
07
20
08
20
09
20
10
20
11
20
12
Southern AfricaImports
Exports
GDP
0
100
200
300
400
500
20
00
20
01
20
02
20
03
20
04
20
05
20
06
20
07
20
08
20
09
20
10
20
11
20
12
North AfricaImports
Exports
GDP

11
III. The Data
Data on trade finance used in this report come from an original survey of banks conducted by the
African Development Bank in 2013. Its covers trade finance activities of commercial banks over
the period 2011-2012. Commercial banks were identified through Bankscope, AfDB field offices
and country economists as well as contacts in African central banks and banking associations.
The survey questionnaire was emailed to approximately 900 commercial banks in 52 African
countries in late 2013. Follow-up enquiries were made by both email and phone calls. A total of
276 banks completed the questionnaire for 2011 and 2012, bringing the total number of
observations over the 2-year period to 542. This response rate of about 30% compares favorably
with those of other recent trade finance surveys. The sample covers 45 countries from all African
sub-regions3. The sub-regional composition of the respondents is as follows: West Africa (27%),
East Africa (21%), Southern Africa (20%), North Africa (8%) and Central Africa (4%). The data
also has a good coverage of countries in terms of income level with 58% of responding banks
located in low-income countries (LICs), and 23% in fragile states4.
The survey also included questions about some basic but key information such as size (total
assets, deposits and equity) and financial soundness. Those data show some variation in bank
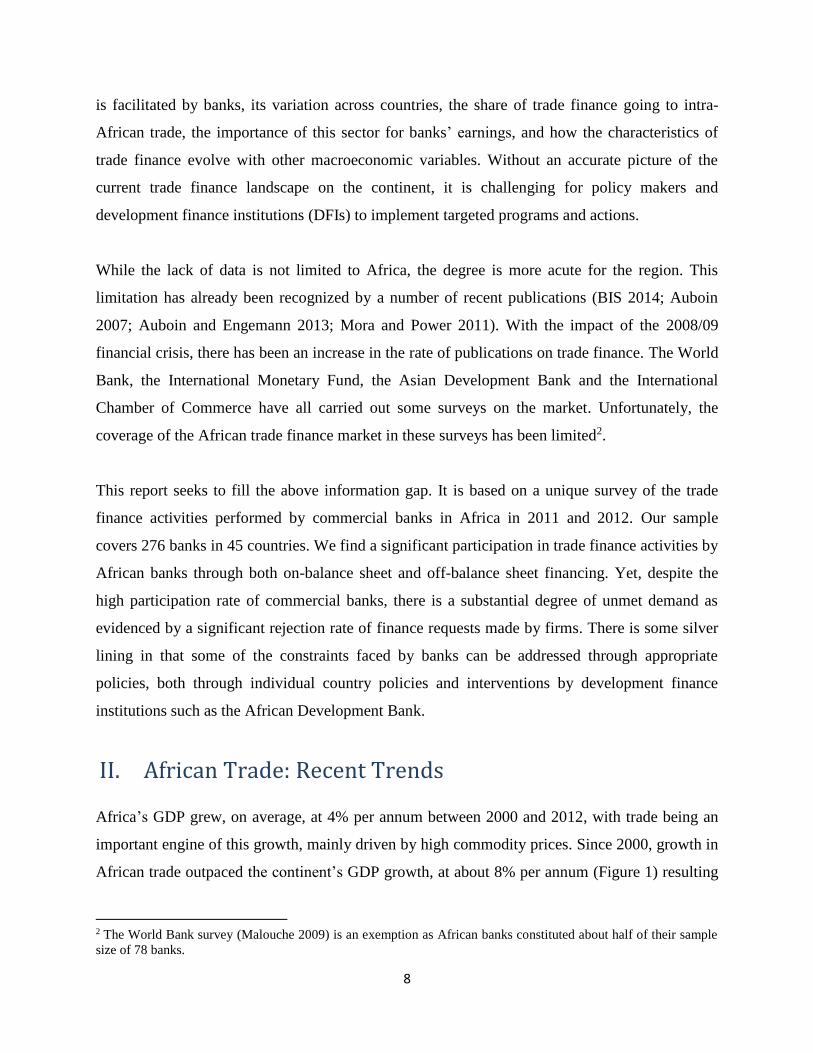
characteristics across countries. The modal responding bank is majority privately-owned by a
non-national (foreign) entity (Figure 2). Foreign ownership is particularly dominant for banks
located in West and Southern Africa. About 12% of responding banks are majority government-
owned. This proportion varies significantly across sub-regions. Government ownership is
significantly higher in North Africa (36%) and Central Africa (26%) than in other sub-regions.
East Africa has the highest proportion (40%) of domestic privately-owned commercial banks.
3 The full list of countries represented in the sample is presented in the Appendix. 4 See the Appendix for a list of country classifications.
12
Figure 2: Distribution of Bank Type (Ownership Structure) by Sub-Region.
Bank size, as measured by total assets, also varies significantly across sub-regions (Figure 3).
Responding banks in Southern and North Africa are significantly larger in terms of assets, equity
and customer deposits than those located in other sub-regions, especially in Central and West
Africa. This result reflects the larger size of economies in these sub-regions as well as their more
advanced financial systems. The larger size of many North African banks also reflects the
dominance of public sector banks where government resources, including those derived from oil
and gas, are often deposited.
The data also show that responding banks are profitable, though far from universally so. The
average rate of return on assets (ROA) in 2011 and 2012 was approximately 1% per annum
(Figure 4) while the average return on equity (ROE) stands at 14%. Returns are quite
heterogeneous across sub-regions, with the most profitable banks located in Southern Africa and
the least profitable situated in the Central Africa sub-region. These rates are also correlated with
ownership structure, with private locally owned banks exhibiting the highest returns.
In terms of soundness, the average non-performing loans (NPLs) ratio for our responding banks
stands at approximately 9% (Figure 5), but this indicator is highly variable across sub-regions
and ownership types. Average NPL ratio is highest for West African banks at 12% and lowest
26%40%
32% 26% 21%27%
48%
46%
27%
61%63% 55%
26%9%
36%
8%9% 12%
5% 5% 4% 8% 6%
0%
20%
40%
60%
80%
100%
CentralAfrica
East Africa NorthAfrica
SouthernAfrica
WestAfrica
AllRegions
Other
Maj Public
Maj Foreign & Private
Maj Local & Private

13
for those in Southern Africa at 4%. Banks with majority government ownership have also the
highest average NPL ratio (16%) and those with majority private and foreign ownership low
average NPL ratio (7%). The positive relationship between performance and foreign ownership
of banks in Africa is consistent with other findings (Figueira et al. 2006). The lower performance
of government-owned banks supports the widely held belief that they are more prone to
mismanagement.
Figure 3: Distribution of Bank Size by Assets, Deposits, Equity (Tier 1) and Profit (in USD million).
Figure 4: Average Bank’s Return on Assets (ROA) and Return on Equity (ROE).
4208
569
140
196
71
2899
360
87
115
50
339
41
16
19
11
34
10
2
2
1
0 1000 2000 3000 4000 5000
NorthAfrica
SouthernAfrica
East Africa
WestAfrica
CentralAfrica
Median Value of After TaxProfits
Median Value of Equity
Median Value of CustomerDeposits
Median Value of Assets
5,7%
12,5% 11,2%
18,7%
13,3%
-0,5%
1,4% 0,9% 1,4% 0,7%
CentralAfrica
East Africa NorthAfrica
SouthernAfrica
WestAfrica
Average ROE Average ROA
17%
12% 13%
10%
1,5% 0,7% 0,7% 1,1%
Maj Local &Private
Maj Foreign& Private
Maj Public Other
Average ROE Average ROA

14
Figure 5: Average Bank’s Non-Performing Loans (NPLs) Ratio by Year and Sub-Regions.
IV. Main Findings
The focus of this report is on bank-intermediated trade finance in Africa. The survey focuses on
the intermediation activities of African commercial banks where the underlying transactions
financed are the exchange of goods and services between firms in different countries. Usually,
these transactions are short-termed and asset-backed, which makes them low-risk. Banks are also
versatile in terms of instruments for trade finance. Specifically, financing can be provided
through both on-balance sheet and off-balance sheet instruments.
a. Participation in Trade Finance by African Banks
Nearly all African commercial banks engage in trade finance (Figure 6). Indeed, about 93% of
banks in our sample had trade finance assets. This proportion is roughly the same in both 2011
and 2012. This high level of participation holds across the different sub-regions. Specifically, the
participation rate of commercial banks in trade finance in Central, East, North, Southern and
West Africa are 100%, 91%, 95%, 89% and 94%, respectively (Figure 7). In addition, there is no
significant difference between fragile and non-fragile states in terms of the proportion of banks
engaged in trade finance.
8,65% 9,15%
2011 2012
4%
6% 7%
10%
12%
SouthernAfrica
East Africa CentralAfrica
NorthAfrica
WestAfrica

15
Figure 6: Proportion of Banks Engaged in Trade Finance by Year.
Figure 7: Proportion of Banks Engaged in Trade Finance by Sub-Region.
b. Importance of Trade Finance for African Banks
Our survey also reveals that trade finance generates significant income for our responding banks.
On average, about 17% of banks’ income comes from trade finance. This share remained stable
over the period 2011- 2012 (Figure 8) and is relatively lower for banks that are majority
government owned (14%). This group is followed by majority foreign-owned banks at 17%,
while 18% of the income for majority private (local) banks comes from trade finance. Banks
with other forms of ownership structure report the highest share of income from trade finance
(21%).
8%
92%
2011
No tradefinance activity
Engaged intrade finance
7%
93%
2012
No tradefinance activity
Engaged intrade finance
100%
91%
95%
89%
94%
9%
5%
11%
6%
50% 55% 60% 65% 70% 75% 80% 85% 90% 95% 100%
Central Africa
East Africa
North Africa
Southern Africa
West Africa
Engaged in Trade Finance No Trade Finance Activities

16
Figure 8: Average Share of Bank’s Income from Trade Finance by Year and Bank Type.
There is a greater variation in the share of income produced from trade finance geographically.
The share is lowest in Southern Africa (12%) and highest in West Africa (21%). There is also
negative correlation between the level of financial sector development5 and the share of banks’
income from trade finance activities. For instance, banks in fragile and low-income countries
derive a greater share of their income from trade finance (25% and 19% respectively) relative to
non-fragile states and middle-income countries (15% and 16% respectively). This result could
reflect the greater supply of trade finance and/or higher level of competition in more developed
countries, which would tend to reduce margins and therefore income. It is also likely that banks
in relatively more advanced countries have a wider range of financial products, making their
incomes more diversified. The difference could also reflect a higher level of demand for bank-
intermediated trade finance in less developed countries since firms located in these countries
have less access to alternatives to trade finance such as inter-firm credit (trade credit). We also
find that banks in oil-importing countries derive a greater share of their income from trade
finance (21%) than those in oil exporting countries (17%) (Figure 9). This difference could
reflect greater demand for bank-intermediated trade finance in oil importing countries where
African importers are often subject to more stringent requirements than African sellers. It should
be noted that this finding could reflect government efforts to facilitate trade in such sectors
considered strategic (e.g. energy). For instance in Ghana, the Central Bank has trade facilitation
5 We proxy financial sector development by the ratio of private credit to GDP.
17% 18%
2011 2012
14%17%
18%21%
Majoritygovt-owned
Majorityforeign &
private
Majoritylocal &private
Other

17
programs to support trade finance for strategic sectors of which oil importation is the most
important component.
Figure 9: Average Share of Income from Trade Finance by Bank Age and Country Type.
c. Trade Finance Assets: On and Off-Balance Sheet Transactions
Banks undertake trade finance both through on-balance sheet and off-balance sheet operations.
The main on-balance sheet trade finance instruments are short-term loans such as pre-export
loans, post-import loans and trade-related revolving credit, while the key off-balance sheet
activity is the issuing of letters of credit. In Africa, our sample suggests that off-balance sheet
operations are more commonly used, with the average annual value of off-balance sheet trade
finance assets of USD 297 million in 2011 and USD 270 million in 2012. On the other hand, the
average value of on-balance sheet trade finance assets was USD 136 million in 2011 and USD
127 million in 2012. This is consistent with the composition of bank assets in more developed
countries where off-balance sheet activities constituted high proportion of assets in the period
leading to and including the financial crisis (Kalemli-Ozcan et al. 2012). Both on-balance and
off-balance sheet operations have declined in 2012 compared to 2011 which is consistent with
the findings of the survey conducted by the International Chamber of Commerce on mostly
advanced countries. The latter shows a decline in certain trade finance activities over this period
19%
16%
21%20%
11%
Less than10 Years
10 to 20Years
20 to 30Years
30 to 40Years
Above 40Years
16,6%
20,7%
Net Oil ExportingCountries
Net Oil ImportingCountries

18
as well. For instance, a majority of banks in that survey reported either a decline or no change in
both import and export letters of credit over this period (ICC 2013).
There are major differences across sub-regions in the average value of trade finance assets.
Specifically, the average values for both off-balance (USD 1.4 billion) and on-balance sheet
(USD 319 million) trade finance assets of North African banks dwarf those of other sub-regions
(Figure 10). Most of these figures in North Africa are driven by banks in Algeria and Egypt. The
average trade finance asset values in West and East Africa are more representative of the
continent in terms of size. Central Africa has the lowest average values for on-balance sheet
(USD 6 million) and off-balance sheet (USD 136 million) trade finance assets.
The average value of off-balance sheet transactions is significantly higher than for on-balance
sheet trade finance transactions. This could be the result of balance sheet restrictions that are
more exacting for on-balance sheet instruments.
Figure 10: Average Values of On and Off-Balance Sheet Trade Finance Assets by Various Categories (in million USD).
297270
136 127
2011 2012
Off Balance Sheet On Balance Sheet
136
145
177
324
1 393
6
134
114
114
319
Central Africa
East Africa
West Africa
Southern Africa
North Africa
On Balance Sheet Off Balance Sheet

19
d. The Size of Bank-Intermediated Trade Finance in Africa
From average values of trade finance assets and the proportion of commercial banks engaged in
trade finance, we provide a rough estimate of the size of bank-intermediated trade finance market
on the continent. This value amounts to about USD 350 billion in 2011 and USD 330 billion in
20126. The value of African trade (sum of imports and exports) stood at approximately USD 950
billion in 2011 and USD 1 trillion in 2012. Therefore, our survey data suggests that the level of
trade finance provided by African commercial banks covers about 1/3 of the value of African
trade flows in 2011 and 2012. The majority of this bank-intermediated trade finance (about 68%)
was done using off-balance sheet instruments (e.g. letters of credit), while the rest was financed
with on-balance sheet instruments (e.g. short-term loans).
6 This estimate is based on the following key assumptions: the mean value of on an off-balance sheet trade finance
transactions (Figure 10), the share of banks providing trade finance in Africa (Figure 6), the fact that banks in
Africa usually finance about 70% of the underlying value of goods traded and the estimated number of commercial
banks on the continent.
345
186
489
620
132 135 117 156
Maj Local &Private
Maj Foreign& Private
Maj Public Other
Off Balance Sheet On Balance Sheet
105
538
51
343
77
205
30
164
Low IncomeCountries
MiddleIncome
Countries
FragileStates
Non FragileStates
Off Balance Sheet On Balance Sheet
60
169
491
317
606
29
128209 244
179
Less than10 Years
10 to 20Years
20 to 30Years
30 to 40Years
Above 40Years
Off Balance Sheet On Balance Sheet

20
The above estimate is within the range found in other recent studies focusing on the global trade
finance market. For instance, BIS (2014) estimates global bank-intermediated trade finance to
range between USD 6.5 trillion to USD 8 trillion in 2011, covering about one-fifth to a third of
global trade. Within this amount, it is estimated that African bank-intermediated trade finance
represents about 5% or roughly USD 300-400 billion. Similarly, the IMF and BAFTA-IFSA
(2011) estimate that bank-intermediated trade finance covers about 40% of total trade, while
Dornel (2014) estimates the share of bank-intermediated trade finance in Africa to be about 30%,
which is very close to our estimate.
While global estimates of the value of bank-intermediated trade finance vary depending on the
source, there seems to be consensus on the relative regional shares of the market. The Asia-
Pacific region is the largest, accounting for about 45% of global trade finance. This has been
attributed to the relatively long distance between the Asia Pacific region and its trading partners
and the types of goods traded (e.g. cars and commodities). The European region is estimated to
be next in line, with about 30%. Africa and Latin America regions are each estimated to account
for no more than 5% (BIS 2014).
e. Trade Finance Supporting Intra-African Trade
Intra-African trade stood at approximately USD 130 billion in 2011 (UNCTAD 2013),
representing about 11% of the total value of African trade. This is however an underestimation of
trade flows among African countries since a significant amount of informal cross-border trade
takes place on the continent. Yet, even if the value of informal trade were to be included, it is
doubtful that the degree of intra-African trade would match that of intra-regional trade in other
parts of the world. For instance, intra-regional trade in Europe and Asia, as a share of their total
trade, exceeds 65% and 40% respectively.
Facilitating intra-African trade is important for a number of reasons. First, intra-regional trade
helps to address the constraint posed by the large number of small African economies. These
small sizes are impediments to the exploitation of economies of scale, which hinder firm growth
and economic development. Second, intra-regional trade in Africa contributes to economic
sophistication. For instance, the share of the manufacturing sector in intra-African trade is
relatively higher than in total African trade, which tends to be dominated by the export of

21
primary commodities. Intra-regional trade is particularly important for landlocked African
countries – a group that faces significant barriers to global integration. Therefore, the facilitation
of intra-regional trade through trade finance can contribute to Africa’s economic transformation
and enhanced macroeconomic resilience.
The proportion of bank-intermediated trade finance that is dedicated to intra-African trade is
roughly equal for both on-balance and off-balance sheet financing. The average share of trade
finance provided by our responding banks to support intra-African trade stood at 16.9% and
21.2% in 2011 and 2012 respectively. Interestingly, there are significant variations in the
financing of intra-African trade by banks across sub-regions (Figure 11). North Africa shows the
lowest share of financing of intra-African trade while Southern and East Africa show the highest
averages. This sub-regional difference is not surprising as trade finance is reflective of the
underlying pattern in goods and services traded, and Northern Africa sub-region has the lowest
proportion of trade among its countries than the other sub-regions on the continent.
It is also noteworthy that the proportion of financing that banks devote to intra-African trade
(17% to 21%) – while not particularly high – compares favorably with the intra-African
proportion of total African trade (11%). However, it is important to note that the actual value of
bank-intermediated intra-African trade (USD 56-73 billion) is still lower than the total value of
intra-African trade (about USD 110 billion). Also interesting is the fact that the share of on-
balance sheet intra-African trade finance is higher than the off-balance sheet, unlike the overall
picture for total trade finance for African banks. It is not clear what accounts for this particular
difference for trade finance dedicated to intra-African trade.

22
Figure 11: Average Share of Banks’ On and Off-Balance Sheet Trade Finance Assets Supporting Intra-African Trade by Year and Sub-Region.
f. Letters of Credit
The most prominent component of off-balance sheet trade finance assets is the letter of credit.
Letters of credit are vital to international trade given that counterparties are often separated by
distance and face high levels of information asymmetry, which makes contract enforcement and
risk assessment difficult. This can be particularly problematic when firms have no pre-existing
business relationships. In a typical scenario, an exporter (seller) requests the importer to produce
a letter of credit that would represent a guarantee that the issuing bank7 would pay him (seller)
provided terms of the contract are fulfilled. This letter of credit provides comfort to the exporter
(seller8) that the payment for the goods transferred will be made since an established financial
institution is not expected to default on a payment. From his end, the exporter engages his bank
to help process the letter of credit. The exporter could also request a ‘confirmation’ of the issued
letter of credit. Confirmation could be done by the exporter’s bank or a different bank. It means
that the bank providing the confirmation (confirming bank) becomes obligated to pay the seller
(exporter) if the issuing bank defaults, while it sends the documents to the issuing bank for its
reimbursement. This intermediation effectively transfers risks to the parties best suited to handle
them. Specifically, the seller/exporter’s exposure is to the confirming bank, whose exposure is to
the issuing bank, whose exposure is to the importer.
7 The bank that opens or issues the letter of credit is known as the issuing bank. 8 Also known sometimes as the ‘beneficiary’.
16,1%17,7% 16,9%
21,4% 21,0% 21,2%
2011 2012 Total
Off Balance Sheet On Balance Sheet
4%
4%
10%
25%
29%
45%
8%
18%
28%
24%
Central Africa
North Africa
West Africa
Southern Africa
East Africa
On Balance Sheet Off Balance Sheet

23
According to BIS (2014), letters of credit account for about 50% of the value of global trade
finance. In Africa, our survey suggests that virtually all banks engaged in trade finance issue
letters of credit. The proportion of responding banks that issued letters of credit was 94% in 2011
and 96% in 2012 (Figure 12). These rates are similar across banks with different ownership
structures, as well as across sub-regions. As will be discussed later, most of these letters of credit
require confirmation9.
The average number of letters of credit issued by African banks in 2011 and 2012 are 380 and
400 respectively (Figure 13). The average annual value of these issued letters of credit over this
2-year period ranged from USD 1.65 million to USD 2.34 million. In addition, there is a slight
positive correlation between the average value of letters of credit by banks and the GDP level of
the country. The average values differ significantly across sub-regions. For instance, the average
value of a letter of credit is USD 0.6 million in East Africa and USD 7 million in Southern
Africa. There is also significant variation across bank types. For instance, the average value of
letters of credit for majority public or government-owned banks (USD 5 million) is significantly
higher than other types of banks, which all have average values less than USD 2 million (Figure
12).
9 Confirmation would arise when the exporter needs extra comfort about the letter of credit issued by the importer’s
bank. This usually arises when the importer is from a country that is perceived as risky or the knowledge about the
importer’s bank is limited.

24
Figure 12: Average Number of Letters of Credit Issuances and Proportion of Banks Issuing Letters of Credit by Various Categories.
382403
2011 2012
Average LCs Number
94% 96%
6% 4%
0%
20%
40%
60%
80%
100%
2011 2012
LCs not Issued
LCs Issued
96% 94% 95% 100%
4% 6% 5%
0%
20%
40%
60%
80%
100%
Maj Local &Private
Maj Foreign& Private
Maj Public Other
LCs not Issued
LCs Issued
100%91%
100%92%
98%
9% 8%3%
0%
20%
40%
60%
80%
100%
CentralAfrica
EastAfrica
NorthAfrica
SouthernAfrica
WestAfrica
LCs not Issued
LCs Issued

25
Figure 13: Average Values of Letters of Credit Issuances by Various Categories (in million USD).
f.1. Pricing of Letters of Credit
Pricing of a major instrument such as a letter of credit is an important indicator of constraints
faced by banks, and by extension the availability of financing to firms. The distribution of the fee
rates (on a quarterly basis) for banks in our sample in issuing letters of credit are presented in
figure 14. The most frequently reported range for quarterly fee rate for issuing a letter of credit is
between 0.6% and 1%. For about two-thirds of the responding banks, the quarterly fee rate for
letters of credit does not exceed 1%. It appears that fees charged for issuing letters of credit in
Africa do not significantly differ from other regions.
The distribution of fee rates for African banks has not changed much between 2011 and 2012.
Unfortunately, it is difficult to tell how the distribution of the current rates compares to the
height of the 2008 financial crisis or to the pre-crisis level. In ICC’s survey of banks in 2013, the
majority of banks reported no increase in fees between 2011 and 2012 compared to the preceding
two years. So there is some evidence that pricing for letters of credit has stabilized somewhat
1,65
2,34
2011 2012
0,58 0,72 0,79
6,116,98
East Africa NorthAfrica
WestAfrica
CentralAfrica
SouthernAfrica
1,74 1,72
5,11
1,15
Maj Local &Private
Maj Foreign& Private
Maj Public Other
1,76
2,96
1,97 2,05
Non FragileStates
FragileStates
Low IncomeCountries
MiddleIncome
Countries

26
after the increases that were registered in 2009 and 2010. Given the conclusion reached by the
IMF/BAFT-IFSA (2011) survey that the letter of credit pricing increased by about 2 percentage
points between 2009 and 2010, current rates are likely to be higher than the pre-crisis level.
Across countries, there seems to be a correlation between fees charged for opening letters of
credit and the level of financial sector development. This difference is noticeable in figure 14,
which shows that North and Southern African banks charge the lowest average fee rate when
issuing letters of credit. It is likely that lower fee is the result of greater competition among banks
in relatively more advanced economies. The correlation is not perfect, however, as East Africa
shows a slightly higher average fee rate than the Central African sub-region.
FIGURE 14: Average Fee Rate (quarterly) for Letters of Credit Issuance by Year and Sub-Region.
f.2. Unmet Demand: Rejection Rates for Letters of Credit
A major issue relevant for policy is understanding the level of unmet trade finance demand. For
African banks, direct information on this deficit has been lacking due to limited data. We provide
some evidence on this using the unmet demand levels provided by commercial banks. The modal
rejection rate in banks issuances of letters of credit is about 10% (Figure 15). Only about 2% of
the banks have a rejection rate of over 30%. This rate is lower than rejection rates reported on
regular loans from banks in Africa. The lower rejection rate could reflect the lower risk that trade
finance entails compared to a regular loan as it is short termed and often asset backed.
34% 34%
35% 35%
23% 23%
9% 8%
0%
20%
40%
60%
80%
100%
2011 2012
[above 2%]
[1.1% to 2%]
[0.6% to 1%]
[0% to 0.5%]
41%
26%
35%
48%
31%
34%
35%
51%
53%
35%
24%
35%
12%
24%
12%
12%
30%
23%
12%
5%
15%
9%
0% 50% 100%
Central Africa
East Africa
North Africa
Southern Africa
West Africa
All Regions
[0% to 0.5%] [0.6% to 1%]
[1.1% to 2%] [above 2%]

27
Figure 15: Distribution of Banks’ Rejection Rates for Issuing Letters of Credit by Sub-Region and Bank Type.
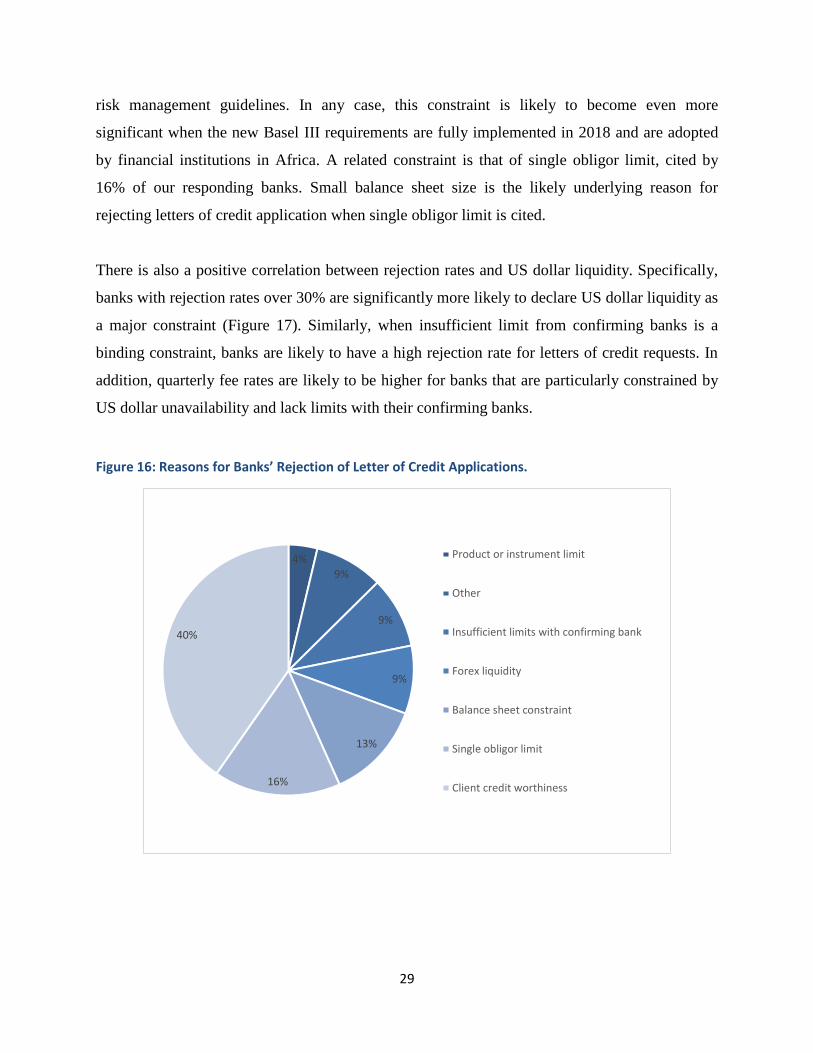
Reasons put forward by responding banks to justify rejections of letters of credit are quite varied
(Figure 17). The most commonly cited reason (40%) for rejection is concern about the credit
worthiness of clients. This underscores the limited capacity of most African banks in appraising
the credit risk of their clients, in the absence of well-functioning credit reporting systems. In
more developed markets, this problem is mitigated by the presence of credit bureaus that provide
credible information on the credit histories of borrowers, in addition to the widespread use of
audited financial statements in applicable circumstances. Client credit worthiness, while a
persistent problem, can also be exacerbated during or after a financial crisis. This is because
counterparts in other regions of the world may require more stringent requirements that can
compel African banks to be more risk averse even though trade finance is not as risky as other
89% 89%
93% 92%
3%
7%2%
0%5%
3% 5%8%
3%1%
80%
85%
90%
95%
100%
Majority Local &Private
Majority Foreign &Private
Majority Public Other
Rejection rate greater 30%
Rejection rate between 20%and 29%
Rejection rate between 10%and 19%
Rejection rate below 10%
87%88% 89%
92%89% 89%
13%
5% 6%4%
4% 5%
6% 6%2%
4%4%
2% 3% 2%
80%
85%
90%
95%
100%
CentralAfrica
East Africa North Africa SouthernAfrica
West Africa All Regions
Rejection rate greater 30%
Rejection rate between20% and 29%
Rejection rate between10% and 19%
Rejection rate below 10%

28
bank activities (Malouche 2009). This issue is particularly important for foreign-owned African
banks.
Another major reason for rejecting letters of credit requests cited by banks is limited foreign
currency liquidity (especially US dollars) (Figure 16). This constraint does not seem to be
specific to Africa and emerges as a universal problem in the trade finance market (BIS 2014).
About 80% of letters of credit are denominated in US dollars (ICC 2012) making it the main
currency for trade finance transactions. On the other hand, the Euro accounted for 7% of trade
finance globally in 2012, though this share is likely to be higher for Africa given the size of
African-European trade. While the Euro, and especially the Chinese Renminbi should play
larger roles in this market, the US dollar is expected to remain the dominant currency in trade
finance at least in the foreseeable future.
Another significant reason for banks rejecting requests to issue letters of credit is the inadequacy
of limits granted to them by confirming banks. For reasons of risk management best practices
and prudential requirements, confirming banks establish limits by issuing bank and country. The
size of the limit granted to each African bank is usually positively correlated with country size
but negatively correlated with country’s fragility and risk. In fact, many foreign-based
confirming banks require cash collateral from African banks to confirm letters of credit when the
limits are exhausted even though trade finance transactions are asset-backed and self-liquidating.
Risk Participation Agreements (RPAs) provided through trade facilitation programs offered by
development finance institutions such as the AfDB are particularly suited to address this type of
constraint10. In a typical RPA, the AfDB equally shares the credit risk, on a portfolio basis, with
a confirming bank for trade finance transactions that are originated by African banks. This
allows confirming banks to increase their limits for African banks and enable them to confirm a
larger volume or greater number of letters of credit issued by these banks.
The size of the balance sheet is another significant constraint. About 13% of respondents
identified small size of balance sheet as a binding constraint. This constraint probably reflects
10 The African Development Bank’s trade finance program is described in more detail in Box 1.
29
risk management guidelines. In any case, this constraint is likely to become even more
significant when the new Basel III requirements are fully implemented in 2018 and are adopted
by financial institutions in Africa. A related constraint is that of single obligor limit, cited by
16% of our responding banks. Small balance sheet size is the likely underlying reason for
rejecting letters of credit application when single obligor limit is cited.
There is also a positive correlation between rejection rates and US dollar liquidity. Specifically,
banks with rejection rates over 30% are significantly more likely to declare US dollar liquidity as
a major constraint (Figure 17). Similarly, when insufficient limit from confirming banks is a
binding constraint, banks are likely to have a high rejection rate for letters of credit requests. In
addition, quarterly fee rates are likely to be higher for banks that are particularly constrained by
US dollar unavailability and lack limits with their confirming banks.
Figure 16: Reasons for Banks’ Rejection of Letter of Credit Applications.
4%
9%
9%
9%
13%
16%
40%
Product or instrument limit
Other
Insufficient limits with confirming bank
Forex liquidity
Balance sheet constraint
Single obligor limit
Client credit worthiness

30
Figure 17: Reasons of Banks’ Rejection of Letters of Credit Applications by Various Categories.
48%41%
35%40% 41%
7% 19%
13%
16%9%
15%
18%
28% 13%
15%
11%2%
0%4%
4%
0%9%
5% 10%11%
11%3%
10% 10%11%
7% 8% 9% 7% 10%
0%
10%
20%
30%
40%
50%
60%
70%
80%
90%
100%Other
Forex liquidity
Insufficient limitswith confirmingbankProduct orinstrument limit
Single obligorlimit
Balance sheetconstraint
Client creditworthiness
40% 41% 38%44%
13% 12% 14%11%
17%13% 15%
18%
4%4% 4%
4%8% 12% 11%
7%
9% 11% 10% 8%
9% 8% 9% 9%
0%
10%
20%
30%
40%
50%
60%
70%
80%
90%
100%Other
Forex liquidity
Insufficient limitswith confirmingbankProduct orinstrument limit
Single obligorlimit
Balance sheetconstraint
40% 41% 42% 40%
13% 14% 11% 12%
16%20%
14%12%
4%3%
3%2%
6%6%
14%17%
9%7% 9% 14%
11% 9% 6% 2%
0%
10%
20%
30%
40%
50%
60%
70%
80%
90%
100%
[0% to0.5%]
[0.6%to 1%]
[1.1%to 2%]
[above2%]
Average fee rate charged by banks for issuing letters of credit
Other
Forex liquidity
Insufficient limitswith confirmingbankProduct orinstrument limit
Single obligorlimit
Balance sheetconstraint 37% 41%
46% 42%
12%14%
10%13%
16%
17%22%
13%
4%
5%0%
0%
13%7%
8%
8%
12% 7%11%
8%
7% 9%3%
17%
0%
10%
20%
30%
40%
50%
60%
70%
80%
90%
100%
MajLocal &Private
MajForeign
&Private
MajPublic
Other
Other
Forex liquidity
Insufficient limitswith confirmingbankProduct orinstrument limit
Single obligorlimit
Balance sheetconstraint

31
g. On-balance Sheet Trade Finance Facilities (e.g. Short-Term Pre-Export and Post-Import Loans)
The most commonly used on-balance sheet instruments are short-term trade finance loans and
trade-related revolving credits. These instruments are critical for many firms as they help tidy
over liquidity needs when goods are exported, or provide needed working capital for the import
of machinery or other inputs. The figures reported under this category are likely an
underestimate since some short term loans made to firms may be trade finance-related but are not
always recorded as trade finance assets.
The average approval rate for on-balance sheet facilities for banks in our sample is 75% (Figure
18). There is therefore a much higher rejection rate compared to off-balance sheet operations.
This number may underestimate the unmet demand for such instruments since not every firm that
needs a trade finance loan may submit an application. There is likely a selection bias in that those
most likely to get favorable responses are those that apply in the first place. It is also noteworthy
that the rejection rate of trade finance loans in Africa is higher than those reported for other
regions of the world (Danielson and Scott 2004). This is consistent with the well documented
evidence in the literature that African firms face bigger challenges to access finance.
41% 43%30%
40%
14%19%
9%0%
17%
19%
26%
0%
4%
5%
4%
0%
8%
7%
13%
27%
8%
5%
9%
27%
8%2%
9% 7%
0%
10%
20%
30%
40%
50%
60%
70%
80%
90%
100%
[0% to 9%] [10% to 19%] [20% to 29%] [over 30%]
Approximate rejection rate of banks for letters of credit applications
Other
Forex liquidity
Insufficient limits with confirming bank
Product or instrument limit
Single obligor limit
Balance sheet constraint
Client credit worthiness

32
In terms of bank characteristics, bank age seems to be a significant determinant of approval rate
of trade finance loans. Banks that have been in operation for at least 40 years have an approval
rate of about 81%, while those with less than a decade of operation have an approval rate of
about 65%. The significance of bank age on approval rate holds even after controlling for other
bank characteristics such as size in a multivariate regression. It is also noteworthy that approval
rates are positively associated with overall bank profit or returns on asset. While there are
differences in approval rate depending on ownership type (Figure 18), this difference disappears
when other bank characteristics are controlled for.
Difference in approval rates between low-income and middle-income countries is not significant
(Figure 19). The approval rate for banks in fragile states (72%) is slightly lower than in non-
fragile states. In general, banks in larger economies (as measured by GDP levels) have higher
approval rates than those in smaller economies even when bank characteristics are controlled for.
Figure 18: Average Approval Rates of On-Balance Sheet Trade Finance Transactions by Various Categories.
75% 76%
2011 2012
71% 75% 75%85%
Other Maj Foreign& Private
Maj Local &Private
Maj Public
65%74% 74% 79% 80%
CentralAfrica
SouthernAfrica
WestAfrica
East Africa NorthAfrica

33
Figure 19: Average Approval Rates of On-Balance Sheet Trade Finance Transactions by Country Type.
g.1. Reasons for Rejecting On-Balance Sheet Trade Finance Requests
While there are some differences, reasons put forward by banks for denying on-balance sheet
trade finance (Figure 20) largely mirror reasons cited for denying the issuances of letters of
credit. For instance, client credit worthiness is the most frequently reported reason (42%) for
banks’ rejection of an on-balance sheet trade finance facility. Also, single obligor limit (16%)
and balance sheet constraint (15%) are highly prevalent. The single obligor limit constraint also
suggests that many African banks have small capital that constraint their ability to process large
transactions. Banks in fragile states, LICs and MICs show no significant differences in the
reasons for rejections such facilities (Figure 21).
Figure 20: Banks’ Reasons for Rejecting Firms’ On-Balance Sheet Trade Finance Facilities Application.
75% 75%
72%
76%
Low IncomeCountries
Middle IncomeCountries
Fragile States Non FragileStates
6%
9%
12%
15%
16%
42%
Product or instrument limit
Forex liquidity
Other
Balance sheet constraint
Single obligor limit
Client credit worthiness

34
Figure 21: Banks’ Reasons for Rejecting Firms’ On-Balance Sheet Trade Finance Facilities Application by Various Categories.
41% 42% 39% 43% 43%
0%
16%14%
18% 15%7%
18%20%
12% 16%
15%
6% 6% 7% 6%
0%
7% 9% 8% 10%37%
12% 12% 12% 9%
0%
10%
20%
30%
40%
50%
60%
70%
80%
90%
100%
CentralAfrica
East Africa North Africa SouthernAfrica
West Africa
Other
Forex liquidity
Product or instrument limit
Single obligor limit
Balance sheet constraint
Client credit worthiness
42% 43% 41% 44%
15% 14% 17% 12%
18%11% 15% 17%
6%7%
6% 7%
8%12% 9% 9%
11% 13% 12% 10%
0%
10%
20%
30%
40%
50%
60%
70%
80%
90%
100%
Non FragileStates
Fragile States Low IncomeCountries
Middle IncomeCountries
Other
Forex liquidity
Product or instrument limit
Single obligor limit
Balance sheet constraint
Client credit worthiness

35
h. Default Rates on Trade Finance Operations
This report provides first estimates of default rates on trade finance operations of African banks.
Our findings are consistent with the view that trade finance is less risky compared to the average
intermediation activities of banks because it is short-termed, self-liquidating and asset-backed.
Specifically, the average default rate on trade finance operations reported by our responding
banks in 2011 and 2012 is 4% (Figure 22). This is significantly lower than their average non-
performing loan (NPL) ratios, which stood at about 9% over the same period.
38% 44% 41% 46%
16%14% 15%
14%
16%17% 21% 7%
8%6% 5%
4%
10% 8% 8%
14%
12% 12% 10% 14%
0%
10%
20%
30%
40%
50%
60%
70%
80%
90%
100%
Maj Local &Private
Maj Foreign &Private
Maj Public Other
Other
Forex liquidity
Product or instrument limit
Single obligor limit
Balance sheet constraint
Client credit worthiness
43%33% 33% 33% 27%
38%
12% 27%14% 11%
7%
9%
16%17%
30%
11%16%
11%
4%3% 2%
19%
2%2%
9%9% 9%
8%
20% 4%
8%5% 6%
6% 25%
9%
9% 7% 5%13%
1%
26%
0%
10%
20%
30%
40%
50%
60%
70%
80%
90%
100%
Clientcredit
worthiness
Balancesheet
constraint
Singleobligor
limit
Product orinstrument
limit
Forexliquidity
Other
Rea
son
s fo
r b
anks
' rej
ject
ion
of
lett
ers
of
cred
it a
pp
licat
ion
s
Reasons for rejecting firms’ on-balance sheet trade finance facilities applications
Other
Forex liquidity
Insufficient limits withconfirming bank
Product or instrument limit
Single obligor limit
Balance sheet constraint
Client credit worthiness

36
Notably, our findings suggest that default rates on trade finance operations in Africa are much
higher than in other regions. So while it may be low risk compared to other African banking
activities, trade finance is hardly a ‘free lunch’ for African banks. By way of comparison, trade
finance default rates of major international banks are much lower – about 0.2%. This reported
difference provides some basis for the higher risk aversion that international banks have towards
African markets.
As one would expect, trade finance default rates are positively correlated with NPLs ratios
(correlation coefficient of 0.4). Our data also shows that default rates on trade finance operations
are negatively correlated with bank age, which is probably an indicator of experience in the
sector. On the other hand, default rates are positively correlated with banks’ share of income
from trade finance. The correlation is robust even when other factors are considered such as
banks size and location.
Figure 22: Average Default Rates on Trade Finance Activities by Various Categories.
4% 4%
2011 2012
3,5%4,4% 4,8%
6,1%
Maj Foreign& Private
Maj Local &Private
Maj Public Other
6,4%
3,7%2,9% 2,8%
1,6%
Less than10 Years
10 to 20Years
20 to 30Years
30 to 40Years
Above 40Years
1,1%
2,6%3,6% 3,9%
6,3%
SouthernAfrica
East Africa NorthAfrica
CentralAfrica
WestAfrica

37
i. Size of Unmet Demand for Trade Finance in Africa
Based on our estimate of the trade finance market size in Africa and the approval rates reported
by our responding banks, it is possible to provide a rough estimate of the size of unmet demand
in trade finance in Africa. This estimate is important because it represents a key barometer of the
degree of limited access to finance in this market. It also provides policy makers with an
important indicator to help prioritize interventions given competing demands on limited budgets.
Our estimate of unmet bank-intermediated trade finance demand in Africa is approximately USD
120 billion and USD 110 billion in 2011 and 2012 respectively. Given that approval rates are
positively correlated with banks’ total assets, this unmet demand is expected to be higher in less
developed regions of the continent. It should be noted that this unmet demand does not include
demand for trade credit insurance, a significant form of intermediation in trade finance, which is
not covered by our survey.
j. The Market for Confirming Banks
As documented earlier, letters of credit are commonly used to support African trade operations.
African countries, and by extension their financial institutions, are considered risky in other
regions of the world. Due to this risk perception, letters of credit issued by African banks almost
invariably require confirmation by other commercial banks that are often located in a more
developed region.
In 2011 and 2012, approximately 130 banks were identified as major confirming banks for the
letters of credit issued by our responding banks. Ten (10) confirming banks account for 52% of
the confirmations observed in our sample over the 2-year period (Figure 23). These are: Standard
Chartered bank (9%), Citibank (9%), Deutsche Bank (7%), Commerzbank (7%), Standard Bank
(5%), Union de Banques Arabes et Françaises (5%), HSBC (4%), BNP Paribas (3%), Société
Générale (3%) and Banque BIA (2%). Interestingly, among the top 10 confirming banks, only
Standard Chartered Bank is headquartered in Africa, though most of these top banks also have
African-based subsidiaries. Naturally, these top confirming banks are major banks with strong
international presence given the necessity to carry out due diligence on issuing banks where their
credit exposures lie.

38
Among the full list of confirming banks, there are numerous banks that are owned by African
entities. These include major commercial banks such as EBI SA, Mauritius Commercial Bank,
FirstRand, Banque Marocaine du Commerce Extérieur, First Bank of Nigeria, Ghana
International Bank, Bank of Africa, Nedbank, Kenya Commercial Bank, ABSA and Attijariwafa
Bank. It should be pointed out that some of the subsidiaries of the above mentioned banks that
provide confirmation are incorporated outside the continent (e.g. EBI SA is a subsidiary of
Ecobank incorporated in France). Among Development Finance Institutions (DFIs) that directly
engage in trade finance, as opposed to indirect engagement through financial intermediaries, only
the International Finance Institution (IFC) 11 and the Africa Export and Import Bank
(Afreximbank) feature among the list of confirming banks.
This high proportion of confirming banks based outside Africa is mostly reflective of the fact
that most of the trade in Africa is undertaken with countries outside the region. These developed
regions have a high demand for confirmation of LCs issued by African banks because they
usually have high risk aversion towards Africa. Therefore, it is not surprising that the value of
Africa-specific trade finance assets of major international banks are overwhelmingly for exports
of goods into Africa as the seller (exporter) is usually seeking to transfer risk to established
banks that can perform the necessary due diligence on the issuing banks.
The list of confirming banks reveals that commercial banks confirming the bulk of African
letters of credit include several Global Systemically Important Banks (G-SIB)12 (Figure 24).
Given the reach and network of these institutions, their over-representation among the top
confirming banks is not surprising. In 2011 and 2012, G-SIB comprised 16% of banks that
11 While some banks reported the IFC as a confirming bank, it is likely that the confirmation will be done by a
commercial bank through the Global Trade Finance Program. 12 G-SIBs or more generally, global systemically important financial institutions (G-SIFIs) is a special category of
financial institutions that are identified by the Basel Committee on Banking Supervision for special regulation to
lessen their likelihood of failure, which can be a major shock to the global economy. The list was started in 2011,
and is updated annually. While no formal criteria for the categorization is available, inclusion in the G-SIBs/G-SIFIs
list seems to be based mainly on the financial institution’s size and reach. The composition of the G-SIBs/G-SIFIs
list changes only a little each year as it is mainly composed of the same financial institutions that are major players
globally, either directly or through subsidiaries.

39
confirmed the letters of credit issued by African banks. This share remained stable over the 2-
year period.
Figure 23: Top International Confirming Banks for Letters of Credit Issued by African Banks.
Figure 24: Proportion of Global Systemically Important Banks (G-SIBs) among International Banks Confirming Letters of Credit Issued by African Banks.
k. Africa-Based Confirming Banks
While a large number of confirming banks are based outside Africa, there are a significant
number of African-based banks that engage in this activity. Specifically about 33% of our
9%
9%
7%
6%
5%
5%
3%3%3%2%
48%
Standard Chartered Bank
Citibank
Deutsche Bank
Commerzbank
Standard Bank
UBAF
HSBC
BNP Paribas
Société Générale
Banque BIA
Other
43%
57%
G-SIBs ConfirmingBanks
Non G-SIBsConfirming Banks

40
responding banks have served as a confirming bank (Figure 25). It is not clear from the data if all
or most of the confirmations are done for letters of credit issued by other African banks. The sub-
regions with the highest proportion of African confirming banks are North and Central Africa
while the sub-regions with the lowest are West and Eastern Africa.
The average annual value of trade finance assets for which African banks performed
confirmation services in 2011 and 2012 stood at USD 295 million and USD 446 million,
respectively (Figure 26). It is not clear if this positive trend is a reflection of increasing risk
perception over time or from the growth in trade over time. Given the end of the global financial
and resumption of growth on the continent, it is likely the above trend is reflective of trade and
GDP growth.
There is also significant variation across sub-regions in value of letter of credit confirmation. The
average annual values of confirmed letters of credit in North (USD 951 million) and Southern
Africa (USD 969 million) are significantly higher than the other sub-regions. In terms of
ownership type, banks with majority government ownership have the highest average value
(USD 1.4 billion), far above privately (USD 801 million) or foreign-owned banks (USD 39
million).
The non-uniformity in the prevalence of confirming banks’ presence in all countries raises the
question about the determinants of being a confirming bank in Africa. On bank characteristics,
the results of a multivariate regression suggest that the main determinants are size and ownership
structure. Specifically, larger assets and majority ownership by government or a local entity
increases the likelihood that a bank confirms letters of credit. Presumably banks with majority
foreign ownership leave confirmation activity to their parent companies, which are normally
located outside the continent. Our results also show that, the size of the economy (measured by
GDP level) and the level of financial sector development (measured by private credit to GDP
ratio) are major determinants of a bank becoming a confirming one. It is also noteworthy that,
when considered together, macroeconomic variables have greater explanatory power in
predicting the likelihood of a bank confirming letters of credit in Africa than bank-level
variables. This suggests that becoming a confirming bank is highly dependent on the economic

41
environment in which the bank operates, which would explain why African confirming banks
tend to be located in more developed areas (North and Southern Africa).
FIGURE 25: PROPORTION OF AFRICAN-BASED CONFIRMING BANKS AND THEIR DISTRIBUTION BY SUB-REGION.
Figure 26: Average Annual Value of Trade Finance Confirmation by African-Based Banks (in million USD).
33%
67%
Served as aconfirming bank
No confirmingbanking role
26%
30%
31%
80%
33%
74%
70%
69%
20%
67%
0% 20% 40% 60% 80% 100%
West Africa
East Africa
Southern Africa
Northern Africa
Central Africa
Carried out Confirmation No confirmation
446
294
2011 2012
0,25
16
19
951
969
Central Africa
West Africa
East Africa
North Africa
Southern Africa
33
801
39
1429
Other Maj Local &Private
Maj Foreign& Private
Maj Public
5
426
21
618
FragileStates
Non FragileStates
Low IncomeCountries
MiddleIncome
Countries

42
l. Outlook for Trade Finance Activities
With the resumption of GDP growth and trade in the post 2008 crisis period, the need for trade
finance is bound to continue its growth. The African Economic Outlook (2014) expects GDP
growth on the continent to average about 5% from 2013 to 2015. Given the correlation between
GDP and trade, the demand for trade finance is expected to remain high. Therefore, it is not
surprising that a large majority of banks (72%) expect to increase their trade finance assets in the
immediate future (Figure 27). Only a small minority (15%) expects no increase in trade finance
lending in the upcoming year. Among banks with majority government ownership, only 56%
expected increase in trade financing lending. This lower optimism among this latter group may
reflect the fact that management decisions of majority government-owned banks depend on a
range of considerations, which may not be exclusively commercial in nature.
Figure 27: Proportion of Banks in 2012 that Expect an Increase in their Trade Finance Activities in the Following Year by Various Categories.
13%
15%
72%
No response
No
Yes
70% 77%56%
67%
23% 10%
22%13%
7% 13%22% 20%
0%
20%
40%
60%
80%
100%
Maj Local& Private
MajForeign &
Private
Maj Public Other
No response
No
Yes
50%
83%
50%68% 74%
42%
8%
36%17% 12%
8% 8% 14% 15% 14%
0%
20%
40%
60%
80%
100%
CentralAfrica
East Africa NorthAfrica
SouthernAfrica
West Africa
No response
No
Yes

43
The most frequently cited impediment to growth of trade finance operations is economic growth
(Figure 28). This contrasts with the positive growth outlook forecasted for Africa. It is
noteworthy that banks located in North Africa are the most likely to cite this as a barrier, which
is understandable as the sub-region has been suffering from sluggish growth since 2011 as a
consequence of both the Arab spring and slow growth in Europe, which is the region’s main
trade partner. Foreign exchange liquidity is the next most cited threat to growth of trade finance
activities. This is a major constraint that is unlikely to be fully addressed by banks. Capital
constraint is the third most cited threat for banks. This concern is more prevalent for banks that
are majority government-owned. It is also a concern that seems to be relatively more prevalent
for banks that are located in East and Southern Africa relative to the other sub-regions (Figure
29). It is not clear what accounts for these particular sub-regional differences. Bank regulation is
another major concern. Whether this is related to compliance with regulation that is specific to
trade finance is not clear. Some other concerns raised by banks include intense competition with
other banks, solvency of clients and lack of centralized credit risk information systems.
Figure 28: Banks’ Reported Constraints to their Trade Finance Portfolio Growth.
8%
11%
13%
14%
15%
17%
22% Forex volatility
Other
Bank regulations
Limited bank capacity
Capital constraint
Forex liquidity
Limited economic growth

44
Figure 29: Banks’ Reported Constraints to Their Trade Finance Portfolio Growth by Various Categories.
15% 20%9%
22%12%
25% 20%
29%
31%
18%
20% 17%
0%
13%
15%
10% 15%
14%
12%
21%
0%6%
9%
6%
10%5%
11%
20%
9%15%
25%
11%20%
8% 10%
0%
10%
20%
30%
40%
50%
60%
70%
80%
90%
100%
Central Africa East Africa North Africa Southern Africa West Africa
Other
Bank regulations
Forex volatility
Forex liquidity
Limited bank capacity
Limited economic growth
Capital constraint
11% 16%25% 23%
23%24%
13% 16%
16%13% 15%
19%
20% 16% 15%13%
8% 9%2%
10%
12% 13%
13%
13%
11% 9%19%
6%
0%
10%
20%
30%
40%
50%
60%
70%
80%
90%
100%
Maj Local & Private Maj Foreign &Private
Maj Public Other
Other
Bank regulations
Forex volatility
Forex liquidity
Limited bank capacity
Limited economic growth
Capital constraint
16% 13% 17% 13%
23%18%
21% 23%
13%
17%
16%11%
16% 21%19%
14%
8% 7%6%
10%
13% 11% 11%16%
11% 12% 11% 11%
0%
10%
20%
30%
40%
50%
60%
70%
80%
90%
100%
Non Fragile States Fragile States Low Income Countries Middle IncomeCountries
Other
Bank regulations
Forex volatility
Forex liquidity
Limited bank capacity
Limited economic growth
Capital constraint

45
With the approval of the USD 1 billion Trade Finance program in 2013, the Bank significantly
stepped up its efforts to improve access to finance in the trade finance market in Africa. The
instruments used by the Bank under this program are Risk Participation Agreements (RPA),
Trade Finance Lines of Credit (TF-LOC) and Commodity Finance Facility (CFF). In RPAs, the
AfDB enters into 3-year agreements with international commercial banks to share the credit
risk on trade finance transactions originated by African banks. This allows confirming banks to
increase their exposure to African banks issuing letters of credits and other instruments. As the
preceding sections show, limits with confirming banks are binding for a large number of
African banks. Under the TF-LOC, the AfDB extends 4-year lines of credit to facilitate the
provision of short to medium finance such as pre-export and post-import loans for African
firms, particularly SMEs. Since almost all TF-LOCs are disbursed in US dollars, these projects
are likely to ameliorate the USD liquidity constraint that is prevalent among African banks. As
of 31 May 2014, the Bank has approved 8 RPAs and 4 TF-LOCs under this program (Table 1).
The average number of issuing banks in Africa covered per RPA project is about 100. Both the
RPA and TF-LOC projects are projected to support at least USD 10 billion worth of trade,
including a substantial share of intra-African trade.
While the above figures are impressive, they address just a fraction of the estimated unmet
demand in this sector on the continent. Therefore, there is a strong case for scaling up the
Bank’s trade finance program after its initial 3-year period. Furthermore, there is evidence that
the Bank’s trade finance projects so far have been well targeted. Specifically, 5 of the Bank’s 8
RPAs that have been approved are with banks that feature among the top 10 confirming banks
for letters of credit issued by African banks. And 2 of the RPAs (Afreximbank and Ecobank)
are with African-based confirming banks that finance a significant amount of intra-African
trade.
It should be noted that even before this trade finance program, the African Development Bank
has been active in addressing constraints in the trade finance market on the continent. It
spearheaded the creation in 1993 of the African-Export-Import Bank (Afreximbank), an
international financial institution with a trade promotion mandate. Afreximbank currently has
assets worth about USD 4.5 billion. It also helped create the PTA bank, which is also mostly
engaged in trade finance. More recently, the AfDB is one of the DFIs that are implementing the
Global Trade Liquidity Program (GTLP). It contributed USD 500 million to the USD 4 billion
GTLP, which offers guarantees to banks on payments risk from emerging markets. The GTLP
was a crisis response program that was designed by the development community and
implemented by DFIs to address the trade finance shortage caused by the global financial
crisis.
Box 1: The African Development Bank’s Trade Finance Program.

46
Table 1: Selected Projects Approved by the African Development Bank under its Trade Finance Program.
Risk Participation
Agreements (RPAs)*
Trade Finance Lines of
Credit (TF-LOCs)
Citibank N.A. USD 50 million
Standard Chartered Bank USD 200 million
BNP Paribas EUR 40 million
UT Bank (Ghana) USD 20 million
Union de Banques Arabes et
Françaises
USD 50 million
Africa Export and Import
Bank (Afreximbank)
USD 100 million USD 150 million
Ecobank Transnational
Incorporated
USD 100 million USD 100 million
Commercial International
Bank Egypt
USD 50 million
Commerzbank AG USD 100 million
Shelter Afrique USD 20 million
*In RPAs, the AfDB usually shares credit risk with the institutions, not exceeding 50%. So the AfDB’s contribution
to the RPA facility is 50%.

47
V. Conclusion
Trade finance is vital in facilitating international trade, and therefore critical for economic
growth. It is especially critical when trading parties are separated by distance, firms are small in
size, contract enforcement is difficult or information asymmetry is prevalent. Given the
continent’s large number of small countries, a relatively high level of trade openness and
underdeveloped financial systems, greater trade facilitation is important for Africa. Yet, despite
this importance, up to date information on African trade finance is limited. This makes it difficult
for policy makers to understand the market and design targeted policy response. This report is an
attempt to remedy the information gap on trade finance in Africa. It is based on a primary survey
of commercial banks in Africa. About 900 commercial banks in 52 countries were contacted in
late 2013. The response rate of about 30% resulted in good geographic coverage, with a sample
of 276 banks from 45 countries
The survey data provides a good picture of the trade finance landscape on the continent. Most
commercial banks were found to be active in trade finance. The size of bank-intermediated trade
finance was over USD 300 billion in both 2011 and 2012, covering about a third of the total
value of the region's trade. This estimated size of the market is within the range suggested by
other reports. The data also suggests that the value of bank-intermediated trade finance declined
from 2011 to 2012, which is consistent with the findings of other trade finance reports. The large
size of the bank-intermediated trade finance notwithstanding, there is a significant unmet
demand based on bank rejection rate data. This unmet demand is conservatively estimated to be
at least USD 110 billion. There are also numerous constraints that prevent banks from meeting
firms' demand for trade finance. Among these are the inability to thoroughly assess the credit
worthiness of clients, limited US dollar liquidity and insufficient limits with confirming banks
(for issuing letters of credit).
The size of the unmet demand suggests a role for development finance institutions such as the
African Development Bank and governments to help improve access to finance in this market.
The nature of the constraints also suggests that AfDB’s recently approved Trade Finance
Program is well-positioned to relax those constraints and improve access to finance for firms.

48
References
African Development Bank and World Bank. 2013. “Africa Competitiveness Report”,
Washington, DC.
African Development Bank, OECD and UNDP. 2014. “African Economic Outlook”. Tunis,
Tunisia.
Ahn, J.B. 2013. “Estimating the Direct Impact of Bank Liquidity Shocks on the Real Economy:
Evidence from Letter-of-Credit Import Transactions in Colombia”, Working Paper, International
Monetary Fund.
Ahn, J.B., A.K. Khandelwal and S-J Wei. 2010. “The Role of Intermediaries in Facilitating
Trade”, Working Paper, National Bureau of Economic Research.
Ancharaz, V., K. Mbekeani and Z. Brixiova. 2011. “Impediments to Regional Trade Integration
in Africa”, Africa Economic Brief, African Development Bank.
Asian Development Bank. 2013. “Trade Finance Survey”, Manila, Philippines.
Auboin, M. 2007. “Boosting Trade Finance in Developing Countries: What link with the WTO?”
World Trade Organization, Geneva.
Auboin, M. and M. Engemann, 2013. “Testing the Trade Credit and Trade Link: Evidence from
Data on Export Credit Insurance”, Working Paper, World Trade Organization.
Berman, N. and P. Martin. 2010. “The vulnerability of sub-Saharan Africa to the financial crisis:
the case of trade”, Working Paper, Paris School of Economics.
Bank of International Settlement (BIS). 2014. Trade Finance: Development and Issues.
Chauffour, J-P. and T. Farole, 2009. “Trade Finance in Crisis: Market Adjustment or Market
Failure?”, Working Paper, World Bank.
Chor, D. and K. Manova. 2009, “Off the Cliff and Back? Credit Conditions and International
Trade during the Global Financial Crisis”, Stanford University mimeo.
Danielson, M.G. and J.A. Scott. 2004. "Bank Loan Availability and Trade Credit Demand", The
Financial Review, 39: 579-600.
Dornel, A. 2014. “Credit Insurance: Trade Finance Situation Prospects for Africa”, Presented at
the Making Finance Work for Africa forum in Dakar, June 2014.
Duval, Y. and W. Liu. 2009. “The Global Crisis: A wake-up Call for Trade Finance Capacity-
Building in Emerging Asia”, United Nations Economic and Social Commission for Asia and the
Pacific.

49
European Central Bank. 2007. “Trade Credit Defaults and Liquidity Provision by Firms”,
Frankfurt, Germany.
Figueira, C., J. G. Nellis, D. Parker. 2006, “Does Ownership Affect the Efficiency of African
Banks?”, Journal of Developing Areas, 40(1): 37-62.
Financial Conduct Authority. 2013. “Banks’ Control of Financial Crime Risks in Trade
Finance”, London, UK.
Humphrey, J. 2009. “Are Exporters in Africa Facing Reduced Availability of Trade Finance?”
Institute of Development Studies.
International Chamber of Commerce (ICC). 2013. “Rethinking Trade and Finance”, Paris,
France.
International Chamber of Commerce (ICC). 2012. “Rethinking Trade and Finance”, Paris,
France.
International Monetary Fund (IMF), the Bankers Association for Trade & Finance (BAFT) and
the International Financial Services Association (IFSA). 2011. “Trade Finance Study”,
Washington, DC.
Kalemli-Ozcan, S., B. Sorensen and S. Yesiltasf. 2012. “Leverage Across Firms, Banks, and
Countries", Journal of International Economics, 88(2): 284-298.
Kohler, M. and A. Saville. 2011. “Measuring the Impact of Trade Finance on South African
Export Flows”, Economic Research South Africa.
Malouche, M. 2009. “Trade and Trade Finance Developments in 14 Developing Countries Post
September 2008: A World Bank Survey”, World Bank
Mann, R.J. 2000. “The Role of Letters of Credit in Payment Transactions”, Michigan Law
Review, 98(8): 2494-2536.
Ronci, M. 2004. “Trade Finance and Trade Flows: Panel Data Evidence from 10 Crises”,
Working Paper, IMF.
Olsen, M.G. 2011. “Banks in International Trade: Incomplete International Contract
Enforcement and Reputation”, Working paper, IESE Business School.
Thomas, A. 2009. “Financial Crises and Emerging Market Trade”, Working Paper, IMF.
Turner, T., Mokaddem, L. and Ben Ahmed, G. 2010. “Assessment of Trade Finance Market in
Africa Post-Crisis”, Working Paper No. 118, African Development Bank.

50
Djankov, S., C. Freund, C. S. Pham, 2010. “Trading on Time”, World Bank, Washington DC.
United Nations Conference on Trade and Development (UNCTAD), 2013. “Intra-African Trade:
Unlocking Private Sector Dynamism”, Geneva, Switzerland.
Van der Veer, K. 2010. “The Private Credit Insurance Effect on Trade”, Working Paper, De
Nederlandsche Bank.

51
Appendix
Figure A 1: Countries Breakdown of the Surveyed Banks.
0% 1% 2% 3% 4% 5% 6% 7% 8%
MauritaniaLibyaChad
SudanLesotho
SeychellesComoros
SwazilandGuinea-Bissau
MadagascarCongo, Dem. Rep.
Sao Tome and PrincipeMorocco
South AfricaRwanda
Central African RepublicLiberiaAngola
Sierra LeoneCape Verde
TunisiaNamibia
ZimbabweBurundiAlgeria
BotswanaMalawiGuineaZambia
Egypt, Arab Rep.Mozambique
GhanaBeninNiger
MauritiusMaliTogo
Burkina FasoGambia, The
NigeriaKenya
Cote d'IvoireUgandaSenegal
Tanzania

52
Table A 1: Sub-Regional Breakdown.
Central Africa Eastern Africa Northern Africa Southern Africa Western
Africa
Angola Burundi Algeria Botswana Benin
Central African Republic Comoros Egypt, Arab Rep. Lesotho Burkina
Faso
Chad Kenya Libya Madagascar Cape Verde
Congo, Dem. Rep. Rwanda Mauritania Malawi Cote d'Ivoire
Sao Tome and Principe Sudan Morocco Mauritius Gambia, The
Tanzania Tunisia Mozambique Ghana
Uganda Namibia Guinea
Seychelles Guinea-
Bissau
South Africa Liberia
Swaziland Mali
Zambia Niger
Zimbabwe Nigeria
Senegal
Sierra Leone
Togo

53
Table A 2: Other Country Groupings*.
Low-Income Countries (LICs) Fragile States Middle-Income Countries
(MICs)
Benin Burundi Algeria
Burkina Faso Central African Republic Angola
Burundi Chad Botswana
Central African Republic Comoros Cape Verde
Chad Congo, Dem. Rep. Cote d'Ivoire
Comoros Cote d'Ivoire Egypt
Congo, Dem. Rep. Guinea Ghana
Gambia, The Guinea-Bissau Lesotho
Guinea Liberia Libya
Guinea-Bissau Sao Tome and Principe Mauritania
Kenya Sierra Leone Mauritius
Liberia Sudan Morocco
Madagascar Togo Namibia
Malawi Zimbabwe Nigeria
Mali Sao Tome and Principe
Mozambique Senegal
Niger Seychelles
Rwanda South Africa
Sierra Leone Sudan
Tanzania Swaziland
Togo Tunisia
Uganda Zambia
Zimbabwe
*We use the World Bank country classification. Countries that do not appear in the table are not included
in our sample.