trade in intermediate inputs and trade facilitation in ... · siope v. ‘ofa and stephen karingi*...
TRANSCRIPT

1
Trade in Intermediate Inputs and Trade Facilitation in Africa’s Regional
Integration
Selected Paper for Presentation in the African Economic Conference, 28-30 October 2013,
Johannesburg, South Africa.
Siope V. ‘Ofa and Stephen Karingi*
28 October 2013
Abstract:
Despite concerted efforts, Africa’s regional integration process has encountered delays. Since the
third stage of the Abuja Treaty in 2008, piece meal progress has been observed. It therefore begs a
difficult but relevant question: why is the regional integration process stalling? The conventional
answer lies in challenges such as inadequate financial resources and infrastructure for trade among
others. However, this paper proposes an approach to regional integration refocused on resource-based
industrialisation. A recent UNECA survey found that several Member states believed that regional
integration does not contribute significantly to job creation and regional value chains. Resource-based
industrialisation could contribute to job creation and inclusive growth if properly managed. We
examine the industrialisation level in Africa using Balassa’s Revealed Comparative Advantage
Indexes based on the BACI dataset. Further, we evaluate Kenya’s trade in intermediate inputs vital for
industrialisation, using an input-output table analysis on production, based on GTAP 8 dataset.
Regional analyses of five African Regions triangulated the Kenya results. The analysis finds that
while the level of industrialisation is heterogeneous among African economies, the overall level is
low. Also, in the case of Kenya, the manufacturing sector spends significant amounts on imported
intermediate inputs from the manufacturing sector critical to all four major industry categories (57 per
cent for food, 79 per cent for agriculture, 15 per cent for energy and mining, 83 per cent for
manufacturing and 57 per cent for services), demonstrating the importance of trade facilitation
measures to ensure timely and cost-effective sourcing. Moreover, results from five African regions
triangulate this finding by suggesting that manufacture, energy and mining imported intermediate
inputs together make out 76 per cent of total imported intermediate inputs for production in Africa.
* Mr. Stephen Karingi is the Director, of the Regional Integration and Trade Division, UNECA. At the time this
paper was written, Mr. Siope V. ‘Ofa was Associate Economic Affairs Officer, African Trade Policy Centre,
Regional Integration and Trade Division, UNECA. Mr. Siope V. ‘Ofa is now working for UNESCAP. The
views expressed in this paper are the authors’ own and may not necessarily reflect the position of the United
Nations Economic Commission for Africa. Any mistakes or omissions are the sole responsibility of the authors.
Maja Reinholdsson and William Davis of the Regional Integration and Trade Division, UNECA is gratefully
acknowledged for the analyses on African Regions section and useful comments on an earlier draft.

2
1. Introduction
Against the backdrop of the global economic and financial crisis in many industrialised
countries and the failure to reach a comprehensive agreement in the WTO Doha round
negotiations, Africa’s regional trade integration has emerged as a crucial instrument for
sustaining economic growth in Africa. Increased intra-African trade and development of
African markets are necessary to serve as a launch pad for enhancing African
competitiveness and its integration with the world economy (ECA et al., 2012).
2. Africa’s Transformative Regional Integration: need for a paradigm shift?
A lot of concerted efforts have been made towards Africa’s regional integration by
African countries, Regional Economic Communities (RECs) and Development partners.
Deeper integration would allow the continent not only to achieve sustained and robust
economic growth but it will also ensure poverty alleviation, enhanced movement of goods
and services, infrastructure development and promotion of peace and security within and
between the regions (ECA et al., 2010)
Despite concerted efforts, Africa’s integration process has encountered delays. Since the
beginning of the third stage of the Abuja Treaty in 2008—creation of free trade areas and
custom unions in each REC with a deadline of 2017—piecemeal progress has been observed.
While the political commitment at the continental level is undeniable, implementation at the
country level is noticeably lacking. In January 2012, the AU Summit of Heads of
Governments and States endorsed both fast -tracking of the establishment of an African
Continental Free Trade Area by the indicative date of 2017 and boosting of intra-African
trade through the implementation of a comprehensive action plan1 towards encouraging
member states to fast-tracking and boosting intra-African trade. With the deadline for this
third stage looming in four years time, and extremely limited progress on the ground, one
needs to ask why Africa’s regional integration process is stalling.
The conventional answer lies in the challenges that member states and RECs encounter in
their efforts towards negotiating free trade areas (FTAs) and custom unions. ECA et al.,
(2010 and 2012) provide a comprehensive account of the specific challenges for each REC
that are hindering the regional integration process within their respective regions. The
1 Visit African Union ‘Action Plan for Boosting Intra-African Trade’ for further information,
http://www.au.int/en/sites/default/files/Action%20Plan%20for%20boosting%20intra-African%20trade%20F-
English.pdf

3
challenges range from inadequate financial resources, inadequate infrastructure for trade,
high non-tariff barriers, lack of harmonisation of rules of origin among member countries,
and conflict and political instability (see ECA et al., 2010 and 2012 for detail discussions of
these challenges). UNECA recently conducted a regional survey (UNECA, 2012) to gauge
the progress in mainstreaming regional integration programs, protocols, decisions and
activities into national development strategies of member states. Based on the 5 geographic
regions in Africa—North, West, Central, East and South—32 African economies were
selected of which 69 Government Ministries responsible for regional integration were
interviewed or given structured questionnaires. The general findings of the survey noted that
“one of the main challenges underpinning the acceleration of Africa’s continental integration
is the limited or lack of progress in mainstreaming regional integration agreements into
national development plans and strategies” (UNECA, 2012).
In particular, the survey noted that although the AU Assembly requested member states to
establish a focal point—Government Ministry—in charge of Regional Integration, only 8
member states have established such a dedicated Government body. The survey report also
highlighted three other gaps worth noting. First, dissemination of information on regional
integration decisions to national stakeholders was lacking and this contributed to the lack of
implementation and ownership. Second, a noticeable number (43 per cent) of respondents
indicated that the level of consultation between the coordinating ministry or entity and the
private sector and civil society was weak. Third, the financial costs in terms of multiple
memberships2 in the RECs increases in proportion to number of memberships. Further,
multiple memberships stretch financial and human resources in term of the need for
representation to different negotiation meetings, and thus coordination and dissemination of
information become real challenges.
However, one of the findings in the regional survey prompted us to look beyond the
conventional answers into the question of why Africa’s regional integration stalling. In
particular, respondents were asked about the significance of regional integration to different
sectors of the economy. The majority of respondents indicated that regional integration does
not significantly contribute to job creation and creation of regional value chains 58 per cent
and 54 per cent respectively (UNECA, 2012). Although anecdotal, these figures do provide
2 The report gave an example of the projected financial costs for Swaziland in 2012 which amounted to around
USD3.5 million on annual contribution, contribution to COMESA Court of Justice and COMESA Fund.
Swaziland was also expected to pay similar costs to SADC, as a member of that grouping (UNECA, 2012).

4
first-hand evidence of the perspectives of selected Government officials directly involved
with implementing regional integration in these member states. Specifically, although
renewed political commitments and concerted efforts at the continental level have been made
towards the regional integration process, doubts remains in several member states about the
impact of regional trade integration on job creation. Indeed, there are good grounds for their
reservations.
Even the literature on the link between trade and unemployment is undecided. Felbermayr
et al (2011) empirically tested the relationship between rate of unemployment and openness
over two groups of countries—20 OECD countries and 63 countries—over the period 1970 to
2000. They concluded that over time, higher trade openness decreases unemployment3 for
both groups. Also, Mashayekhi et al (2012) using the Global Trade Analysis Project (GTAP)
model analysed the effects of regional integration in the Southern African Development
Community (SADC) and employment. Their findings indicate that regional trade
liberalisation among developing countries can lead to increasing or decreasing demand for
labour intensive goods and hence the demand for labour can increase or decrease. Hence, a
flexible scenario— where surplus unskilled labour is available and there is no change in the
level of skilled labour4 would result in greater welfare gains since real wages are fixed and an
increase in demand for labour is assumed to be totally accommodated by changes in
employment rather than in real wages.
In contrast, Chinembiri (2010) found that the derived labour demand in the primary sector
(agriculture, fishery forestry and mining activities) and the secondary (manufacturing,
utilities and construction) industries have been impacted negatively by increased imports—
implying trade liberalisation. Another country-study by Rattso and Torvik (1998) of
Zimbabwe found that the drastic trade liberalization implemented in the early 1990s resulted
in a contraction in output and employment that was accompanied by a sharp increase in
imports and a rising trade deficit. Furthermore, study on Morocco by Currie and Harrison
(1997) found that the substantial trade liberalization implemented during 1984-1990 did not
have very strong employment effects.
Here lies a conceptual proposition for a paradigm shift. While we continue to support
Africa’s regional integration agenda, we should ask ourselves the difficult but relevant
3 Reduction in aggregate unemployment is primarily due to reduction in high-skilled workers unemployment.
4 Real wages of unskilled labour is exogenous.

5
question of why the regional integration process (despite concerted efforts) is stalling in
several countries. We have discussed one key potential reason above which is the linkages
between regional integration (including trade liberalisation) and employment. However, we
propose a transformative approach to regional integration that would focus on the key role of
trade facilitation for trade in intermediate inputs that are crucial for industrialisation in Africa.
A transformative industrialisation will not only contribute to create jobs but it could also
contribute to inclusive growth if properly managed. Hence, perhaps Africa’s regional
integration agenda needs to be recalibrated to incorporate a transformative dimension thereby
ensuring that any activities planned incorporate inclusive growth and most importantly job
creation.
The argument for a paradigm shift towards prioritising industrial transformation in
Africa’s regional integration agenda will continue in the next section of this paper, which will
be a discussion on the links between the identification of key industry sectors
competitiveness (measured by revealed comparative advantage index) and regional
integration.
3. Transformative regional trade integration and industrialisation in Africa
Africa is increasingly focusing on regional integration as a strategy for achieving
sustainable economic growth as there is consensus that by merging its economies—to create
one big market—and pooling its capacities—thereby sharing costs on public infrastructures
crucial for development—the continent can overcome its daunting development challenges
(ECA et al., 2010)5. This agenda as mentioned earlier has intensified in the last couple of
years with several continental agreements on boosting intra-African trade made. The
importance of the regional integration agenda is more relevant today than ever, particularly in
the context of current global economic difficulties. Building resilience through regional
integration and trade provides a buffer for most small fragmented African economies.
To examine in which industry sectors African countries have comparative advantage, we
compute a normalised revealed comparative advantage index (NRCA)6 of each African
country to the world. Using trade statistics, this computation allows us to identify potential
industry sectors of comparative advantage when African economies trade with each other by
5 Please refer to ECA et al., (2010) for detailed discussions on the links between regional integration (and trade)
and sustainable economic growth in Africa. 6 Please refer to Balassa (1965) for details on calculating the RCA index, and also to Laursen (2000) for
developing a simple normalisation process of RCA.

6
comparing the ratio of a particular product (or sector) in a country’s exports, to its share in
total intra-African trade, as follows:
Where,
- country i’s exports of product or sector s,
- country i’s total exports,
- African total exports of product or sector s,
- African total exports,
(1)
(2)
We use the BACI dataset developed by CEPII, provides bilateral values and quantities of
exports at the HS6-digit product disaggregation, for more than 200 countries over 5,000
products based on input data from the United Nations Statistical Division (COMTRADE
database). Four African economies were included with Southern African Customs Union
(SACU)7 as one economy. Two years (2000 and 2011) were merged to allow for comparison
over time.
Intuitively, if the share of a particular commodity in a particular country’s exports is high
relative to the commodity’s share in total intra-African trade, then the country has a revealed
comparative advantage in the commodity in question. Hence, when interpreting an NRCA,
the index ranges from -1 to 1 with the value of 0 as the ideal index (NRCA). Indexes
between 0 and 1 are considered revealed comparative advantages and vice versa. Looking at
the overall picture of revealed comparative advantage (normalised) in Africa for 2000 and
2011, five important trends stands out. First, we find 27 African economies—the biggest
group by Broad Economic Categories (BEC) in 2011—have NRCA in BEC8 1 (agriculture
and food). BEC 1 is the only category that African economies showed an average positive
NRCA index to world with (0.014) in 2011. This implies that the agriculture and food
industry is quite competitive in most African countries.
7 Members include Namibia, Lesotho, Botswana, South Africa and Swaziland.
8 1 - Food and beverages (11 – Primary & 12 – Processed); BEC 2 - Industrial supplies not elsewhere specified
(21 – Primary & 22 – Processed); BEC 3 - Fuels and lubricants (31 – Primary & 32 – Processed); BEC 4 Capital
goods (except transport equipment), and parts and accessories thereof (41 - Capital goods (except transport
equipment) & 42 - Parts and accessories); BEC 5 - Transport equipment and parts and accessories thereof (51 -
Passenger motor cars, 52 – Other & 53 - Parts and accessories); BEC 6 - Consumer goods not elsewhere
specified (61 – Durable, 62 - Semi-durable & 63 - Non-durable); and BEC 7 - Goods not elsewhere specified
(includes, among other commodities, a range of military equipment, postal packages and special transactions
and commodities not classified according to kind).

7
Second, the NRCA index for 2011 indicates that a substantial number9 of African
economies—27 African economies in 2000— had a positive NRCA index, with indices for
the said countries ranging from (0.006) to (0.448), while in 2011 19 African economies had a
positive NRCA index for BEC 2 (industrial supplies not supplied elsewhere), with indices for
these countries ranging from (0.116) to (0.458). BEC 2 economies were the second highest
group with positive NRCA index among the 7 BEC categories. While it reflects
competitiveness in trading in industrial supplies among African countries, it also provides
further support towards African economies trading in more sophisticated goods compared to
trading with external partners. For example, it is estimated that intra-African exports in 2011
totalled around USD 69 million, 36 per cent of this amount—the highest of all product
categories—was export in industrial supplies (BEC 2) (see Table 1).
Table 1
Third, our estimation shows that Somalia held the ideal10
NRCA index for BEC 1
(0.030) and BEC 6 (0.049) in 2011 (see Figure 1). In the case of BEC 1, Somalia has shown a
significant improvement from an NRCA index of 0.649 in 2000 to 0.030 in 2011, and
similarly for BEC 6, an index of -0.510 in 2000 compared to 0.049 in 2011. For the other
BECs, in 2011 Senegal hold the ideal NRCA index for BEC 2 (0.116), Cote d’Ivoire for BEC
3 (0.072), Madagascar for BEC 4 (0.065) and Tunisia for BEC 5 (0.005).
9 27 African economies in 2000 had positive NRCA index (ranges from 0.006 to 0.448) while 19 African
economies had a positive NRCA index in 2011 with NRCA index ranging from 0.116 to 0.458. BEC 2
economies were the second highest group with positive NRCA index among the 7 BEC categories. 10
Closest index value to zero.
BEC USD (000) % Share
1 9,134,432.00 13.1
2 25,101,208.00 36.0
3 21,932,458.00 31.4
4 5,396,058.50 7.7
5 3,564,832.75 5.1
6 4,620,937.00 6.6
7 32,800.38 0.0
Total 69,782,726.63 100
Source: Author's estimation based on BACI Dataset (CEPII), 2013.
Intra-African Exports by BEC, 2011

8
Figure 1
Fourth, our estimation identifies the potential for African economies in each of the
broad economic categories to improve revealed comparative advantages. These are African
economies that showed revealed comparative disadvantages in each BEC, but approaching
the ideal NRCA index of zero. The top 5 potential African countries for each BEC are listed
in Table 2. Cetris paribus, these identified African economies are expected to progress next
to the revealed comparative advantages in the respective broad economic categories.
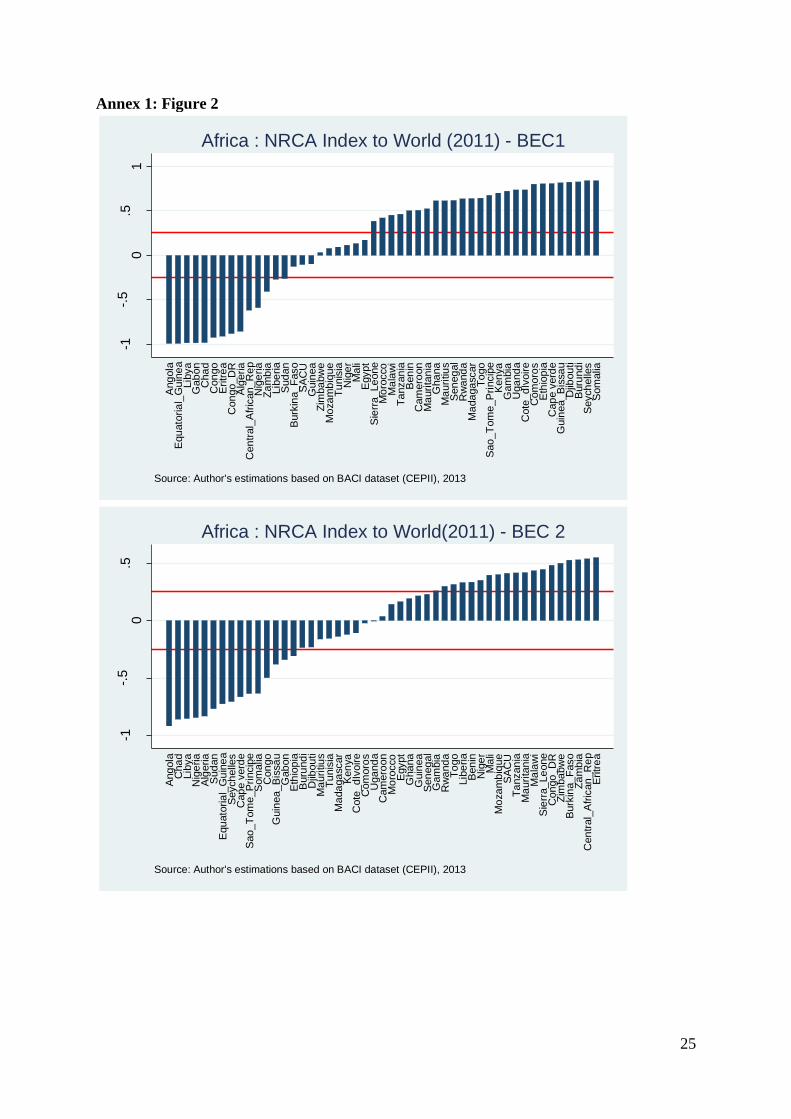
Fifth, when computing African countries’ NRCA indexes to the world, we find a
different set of countries holding the top spots (see Figure 2, Annex 1). For example, for BEC
1, we find Zimbabwe (0.033), Mozambique (0.077) and Tunisia (0.094) ranking closest to the
ideal NRCA index in 2011, with 32 African counties holding a positive NRCA index. In the
case of BEC2, we find that Cameroon (0.037), Morocco (0.141) and Egypt (0.164) ranked the
highest with 16 countries holding positive NRCA indexes, while Gabon (0.208), Republic of
Congo (0.245) and (0.255) ranked the highest among African countries in BEC 3 with only 9
countries holding a positive NRCA.
4
5
1
6
2
-1
-.5
0
.5
1
NR
CA
200
0
-1 -.5 0 .5 1NRCA 2011
Somalia : BEC1 & 6
34
5
21
6
-1
-.5
0
.5
1
NR
CA
200
0
-1 -.5 0 .5 1NRCA 2011
Senegal : BEC 2
54
2
31
6
-1
-.5
0
.5
1
NR
CA
200
0
-1 -.5 0 .5 1NRCA 2011
Cote d'Ivoire:BEC 3 & 7
23
4
5
1
6
-1
-.5
0
.5
1
NR
CA
200
0
-1 -.5 0 .5 1NRCA 2011
Madagascar : BEC 4
3
2546
1
-1
-.5
0
.5
1
NR
CA
200
0
-1 -.5 0 .5 1NRCA 2011
Tunisia : BEC 5
Source:Author's estimations based on BACI dataset (CEPII), 2013
Top 5 African Economies - NRCA Index by BEC (2011)

9
Table 2
For BEC 4, Djibouti (0.001), Mali (0.008) and Mauritius (0.028) ranked closest to the ideal
NRCA index, with 15 countries holding positive NRCA indexes while Sierra Leone (0.002),
Gabon (0.003) and Uganda (0.005) ranked closest to ideal NRCA index in BEC 5 (with only
11 countries holding positive NRCA index). For BEC 6, Rwanda (0.066), Tanzania (0.112)
and Uganda (0.143) ranked closest to the ideal NRCA index with 14 countries holding
positive NRCA indexes, while Guinea (0.297), Burundi (0.416), and Cote d’Ivoire (0.451) on
BEC 7 with only 8 countries with positive NRCA indexes. It is worthy to note that Africa
hold an average positive NRCA index (0.139) in BEC 1 to the world (agriculture and food)—
although slightly lower than its average NRCA index in BEC 1 for intra-African trade at
(0.014). The difference in the composition of countries with NRCA indexes when comparing
intra-African trade and trade with the world reflects the nature of trading in Africa with most
African countries trading more in natural resources with the world while another set of
countries focuses on trading in more sophisticated goods among African countries.
Overall, the use of a simple estimation of revealed comparative advantage index allowed
us not only gauge industry sectors’ competitiveness in African economies, but also to identify
future African economies and potential industry sectors deemed useful for policymakers in
prioritising sectors for industrial development. Through this process, we have provided and
-0.028 Zambia -0.115 Eritrea -0.048 SACU
-0.034 SACU -0.124 Uganda -0.441 Seychelles
-0.037 Burkina Faso -0.148 Chad -0.539 Tanzania
-0.080 Togo -0.165 Tanzania -0.559 Kenya
-0.116 Tanzania -0.169 Mali -0.696 Zambia
-0.009 Tunisia -0.036 Kenya
-0.015 SACU -0.051 Morocco
-0.020 Kenya -0.073 Equatorial Guinea
-0.030 Uganda -0.081 Malawi
-0.043 Cameroon -0.094 Congo
-0.234 Libya -0.054 Eritrea
-0.434 Madagascar -0.256 Gambia
-0.451 Niger -0.373 Benin
-0.476 Senegal -0.378 Zimbabwe
-0.488 Kenya -0.380 Malawi
Top 5 African Countries with Potential Industry Development (by BEC), 2011
Source: Author's estimations based on BACI Dataset (CEPII), 2013.
Note: * - Normalised Revealed Comparative Disadvantage in 2011.
NRCD* Index-BEC 1 NRCD* Index-BEC 4 NRCD* Index-BEC 7
NRCD* Index-BEC 2
NRCD* Index-BEC 3
NRCD* Index-BEC 5
NRCD* Index-BEC 6

10
additional justification for a shift in paradigm towards a ‘transformative’ regional integration
agenda for Africa. Industrialisation for transforming each African economy should be at the
heart of a transformative regional integration with a particular focus on the potential for each
industrial cluster identified earlier.
4. Industrialisation, Intermediate Inputs and Trade Facilitation in Africa’s
Transformative Regional Integration
Industrialisation and Intermediate Inputs
Africa’s industrialization has been weak and inconsistent as shown by the share of
manufacturing value added to GDP (1980-2009) which increased marginally in North Africa
(12.6 per cent to 13.6 per cent) but fell from 16.6 per cent to 12.7 per cent in the rest of
Africa (ECA et al., 2013). Africa’s low export diversification and intra-industry trade in
recent years also highlight this weakness. In 2009, Africa lagged behind other major
regions—Europe, the Americas, Asia and the Pacific—in terms of export diversification with
a weighted average of 0.4 in 2009 compared to 0.2 in 199811
, while intra-industry trade was
found to be low at around 10 per cent (average) for Africa, with 32 African economies in a
sample of 49 were below the average with another 8 African economies below 2 per cent
(‘Ofa et al., 2012).
Africa’s dependence on primary commodities provides opportunities and risks for
industrialisation. On the one hand, Africa should capitalise on the abundant resource
endowments and the current commodity price boom to fund its industrialisation efforts;
however, focusing on primary commodities carries the risk of further deindustrialisation (see
ECA et al., 2013 for detailed discussion on this point). A recent report released by ECA et al.,
(2013) advocates that a resource-based industrialisation will yield employment, income and
dynamic benefits provided that the resource processing industries—which should move up
the value chain and develop backward and forward linkages to the commodity sector—are
internationally competitive and well integrated into global value chains. Resource-based
industrialisation via linkage development creates an opportunity to maximise positive
externalities derived from clusters due to agglomeration effects12
of supplier (and therefore
11
Export Diversification using a normalised Hirschman-Herfindahl Index gives values between 1 (export
concentration) and 0 (export diversification). Most industrialised economies have indexes very close to zero. 12
Through knowledge and information flows allowing for firms to adopt new technology. It facilitates
specialisation and clustering lowers entry barriers for small and medium enterprises (ECA et al., 2013).

11
extraction) location and resource-processing industries’ geographical closeness to each other
(ECA et al., 2013).
The resource-based industrialisation path is critical but not sufficient for structural
adjustment from the extraction of primary commodities to a manufacturing-based economy in
Africa. Production activities require two types of inputs. One is primary factor inputs (land13
,
labour and capital) and the second key input is intermediate inputs (different components to
make one product) (Burfisher, 2011). The primary factor-based industrialisation relies more
on Africa’s natural resources for industrialisation and economic transformation. While we are
content with this industrialisation path, we propose that the role of intermediate inputs in the
resource-based industrialisation process should be given equal attention. While some
intermediate inputs may be sourced from within the continent, some may need to be sourced
from outside Africa.
Africa’s trade in the intermediate goods that are required for higher value production has
been limited and this reflects the continent’s lack of industrial transformation and growth
over time. In fact, Africa’s imports of intermediate goods from within Africa have remained
low when comparing 2000 (at 11 per cent share of total imports of intermediate goods from
Africa) and 2011 (12 per cent) (see Table 3). A majority (more than 80 per cent for both
periods) of the intermediate inputs for Africa are imported from outside Africa. These figures
reflect the reality that some of the intermediate inputs crucial for Africa’s industrialization
may not necessarily be available from within the continent, and must therefore be sourced
from outside Africa.
Table 3
To examine the need for intermediate inputs (imported) at the country level, we take the case
of Kenya. In the earlier section, using revealed comparative advantage index, we identified
that Kenya has the potential to further industrialise in BEC 2, 3, 5 and 7. Hence, using an
Specialisation and clustering however is expected at the middle to higher end of the value chain to avoid
specialisation in primary commodities (implying no progress towards industrialisation). 13
Natural resources included.
Africa % Share Africa % Share
Africa 2,083,328.97 11 12,060,903.96 12
Rest of the World 16,118,412.63 89 87,106,994.39 88
World 18,201,741.60 100.0 99,167,898.35 100.0
20112000
Source: Author's estimation based on WITS Database, 2013.
Africa's Intermediate Goods Import (2000 and 2011), USD (000).

12
input output table on production for Kenya based on GTAP 8 dataset, we to analyse the use
of imported intermediate inputs for industries’ production processes14
(see Table 4).
Table 4
Kenya Production Inputs, 2007, (USD millions).
Activities (incl.CGDS)
Sam entry Agri Food NRGM Manuf Services
Commodities total 4742.1 7955.7 2240.5 5179.9 14822.5
Agri Imports 106.7 111.1 0 6.1 1.3
Food Imports 39.3 308.1 4.2 38.1 225.8
NRGM Imports 100.7 59.4 1175.7 182.2 588.4
Manuf Imports 1016.1 710.3 210 1625.1 1756.1
Services Imports 16.8 52.3 24 102 478
1279.6 1241.2 1413.9 1953.5 3049.6
Agri Domestic 886.7 456.4 0 0 0
Food Domestic 614.5 4763 77.3 587.4 3772.8
NRGM Domestic 274.9 110.8 422.1 422.8 691.6
Manuf Domestic 831.3 317.7 95.5 1330.7 1186
Services Domestic 855.1 1066.6 231.7 885.5 6122.5
3462.5 6714.5 826.6 3226.4 11772.9
Factors -total 5702.6 7250.1 638.3 2304.2 11526.66
1 Land 684.2 0 0 0 0
2 UnskLab 4073 1718.9 224.3 1008.5 3406.06
3 SkLab 32.9 331.9 70.3 133.2 2357.3
4 Capital 912.5 5199.3 337.3 1030.4 5763.3
5 NatlRes 0 0 6.4 132.1 0
Factors use taxes- total 91.2 45.6 58.9 89.3 73.2
1 Land 22.8 0 0 0 1
2 UnskLab 22.8 15.2 17.1 28.5 24.7
3 SkLab 22.8 15.2 17.1 28.5 22.8
4 Capital 22.8 15.2 17.1 28.5 24.7
5 NatlRes 0 0 7.6 3.8 0
Sales Tax 0 0 168.3 10.9 -12.1
Total 10535.9 15251.4 2937.7 7573.4 26422.36
(Gross Value of output)
Source: GTAP 8 Note: Sales Tax: Is the sum of private domestic consumption tax and firms domestic purchase
tax
14
The industry activity column accounts of the SAM describe the inputs used in industries’ production
processes while the activity rows accounts show the use of inputs.

13
Each column in the table shows the expenditure by a particular industry—in this case,
agriculture, food, energy and mining (NRGM), manufacturing and services—on intermediate
inputs, factors inputs and taxes. The Kenyan economy (in 2007) utilised the highest inputs for
production on services industries (42 per cent of total intermediate input expenditure)
followed by food (23 per cent) and manufacturing (15 per cent). Service providers spend
around USD 14,823 million on intermediate inputs, followed by food producers with around
USD 7,956 million and manufacturers at USD 5,180 million.
In terms of industries’ spending on imported and domestic intermediate inputs, we find
that the food sector spends 84 per cent on domestic and 16 per cent on imported intermediate
inputs, the agricultural sector spends 73 per cent on domestic intermediate inputs, energy and
mining spends 63 per cent on imported and 37 per cent on domestic, manufacturing spends
38 per cent on imported and 62 per cent on domestic, and services industries spend 21 per
cent on imported and 79 per cent on domestic. From these percentage shares, we find that
imported intermediate inputs are critical in the energy and mining and the manufacturing
sectors. In addition, we find that expenditure on imported intermediate inputs from the
manufacturing sector is critical to all five major industry categories (57 per cent for food, 79
per cent for agriculture, 15 per cent for energy and mining, 83 per cent for manufacturing and
57 per cent for services).
The services industry spends USD14,823 million on production inputs which comprise
USD6,601 worth of service inputs (USD478 million imported and USD 6,122 million
produced domestically), USD 2942 million of manufacturing inputs (USD 1756 million
imported and USD 1186 million domestically produced), and USD 3999 million on food
(USD 225 million imported and USD 3773 million domestic) and USD 1.3 million of
agricultural inputs (USD1.3 million imported). It is worth noting that the services industry
used more imported manufactured inputs (12 per cent of total inputs to the services industry
by value) than domestically produced manufactured inputs (8 per cent)15
. It is also interesting
to note that Kenyan service providers used USD11,527 million of factor inputs (USD3,406
for unskilled labour, USD2,357 for skilled labour and USD5,763 for capital), while paying a
total of USD73 million in taxes on use of factors. However, service providers received
USD12.1 million in subsidies (negative sales tax) to purchase additional intermediate inputs.
15
This ratio of higher imported intermediate inputs in manufacturing compared to domestic is also reflected in
the other major categories of food, agriculture, energy and mining and manufacturing.

14
Moving one step further, we compute an input-output coefficient table (based on Table 4)
for Kenya to evaluate the ratio16
of the respective quantities of intermediate inputs and factor
inputs per unit of output. In other words, the input-output coefficient table allows us to
explain the intermediate input intensity of a production activity. A sector is considered
intensive (using more input—intermediate or factor—than output) when the coefficient is the
highest (see Table 5).
Table 5
Hence, the Kenyan agricultural sector is intensive in imported manufacturing inputs (0.096).
The food sector is intensive in domestic intermediate inputs (0.312), while the energy sector
is intensive in imported intermediate inputs (0.400). The manufacturing sector is intensive in
imported manufacturing inputs (0.215) relative to domestic inputs (0.176), while the services
sector is intensive in domestic services inputs (0.232) compared to imported services inputs
(0.018).
Overall, the discussion so far has shown that Africa imports more than 80 per cent of
its intermediate goods crucial for value creation in the manufacturing sector from outside
Africa. Furthermore, using the input-output table to analyse the use of imported (and
domestic) production inputs in Kenya (identified to be a country with potential revealed
comparative advantage (world) in BEC 2, 3, 5 and 7), we find that imported intermediate
16
Calculated by dividing each spending value by total input.
Agri Food NRGM Manuf Services
Intermediate Inputs
Agric. Imports 0.010 0.007 - 0.001 0.000
Food Imports 0.004 0.020 0.001 0.005 0.009
NRGM Imports 0.010 0.004 0.400 0.024 0.022
Manuf Imports 0.096 0.047 0.071 0.215 0.066
Services Imports 0.002 0.003 0.008 0.013 0.018
Agric. Domestic 0.084 0.030 - - -
Food Domestic 0.058 0.312 0.026 0.078 0.143
NRGM Domestic 0.026 0.007 0.144 0.056 0.026
Manuf Domestic 0.079 0.021 0.033 0.176 0.045
Services Domestic 0.081 0.070 0.079 0.117 0.232
Factors Inputs
Land 0.065 - - - -
Unskilled Labour 0.387 0.113 0.076 0.133 0.129
Skilled Labour 0.003 0.022 0.024 0.018 0.089
Capital 0.087 0.341 0.115 0.136 0.218
Natural Resources 0 0 0.00218 0.01744 0
Source: Author's estimation based on GTAP v.8.0, 2013.
Kenya Input-Output Coefficients, 2007, (USD millions).
Activities
15
inputs comprise a substantial share of the inputs used in the energy and mining sector (63 per
cent imported) and manufacturing (38 per cent imported).
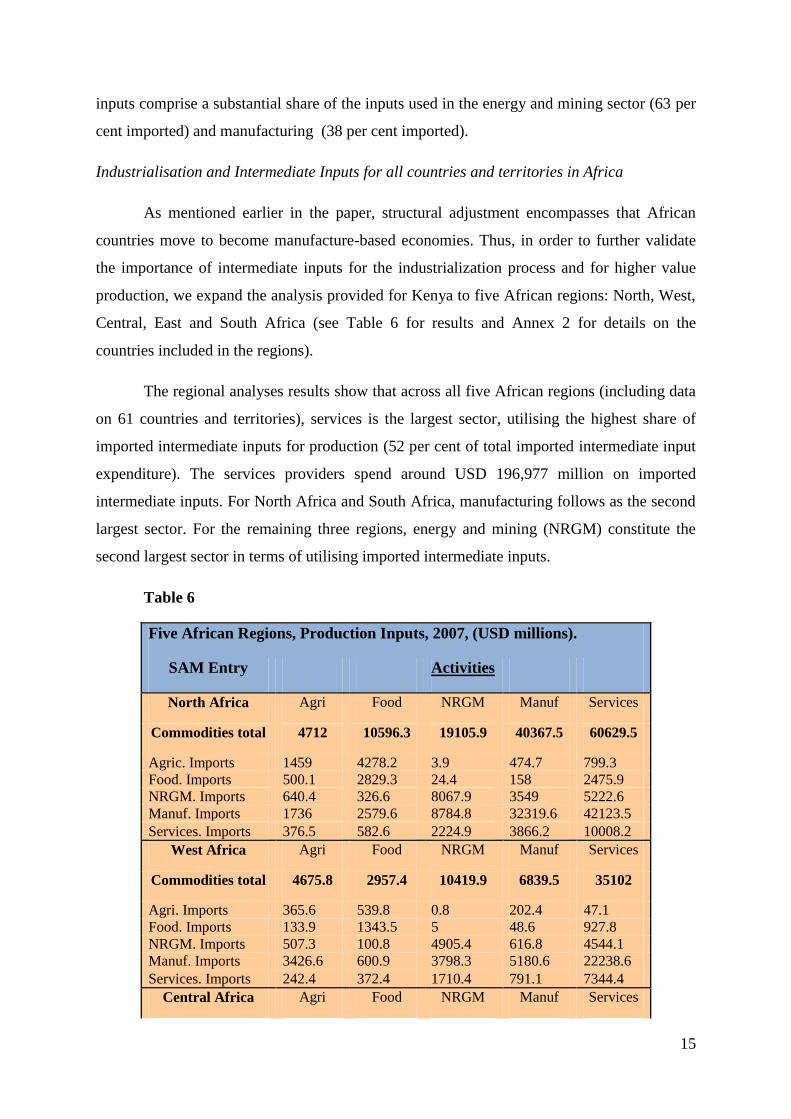
Industrialisation and Intermediate Inputs for all countries and territories in Africa
As mentioned earlier in the paper, structural adjustment encompasses that African
countries move to become manufacture-based economies. Thus, in order to further validate
the importance of intermediate inputs for the industrialization process and for higher value
production, we expand the analysis provided for Kenya to five African regions: North, West,
Central, East and South Africa (see Table 6 for results and Annex 2 for details on the
countries included in the regions).
The regional analyses results show that across all five African regions (including data
on 61 countries and territories), services is the largest sector, utilising the highest share of
imported intermediate inputs for production (52 per cent of total imported intermediate input
expenditure). The services providers spend around USD 196,977 million on imported
intermediate inputs. For North Africa and South Africa, manufacturing follows as the second
largest sector. For the remaining three regions, energy and mining (NRGM) constitute the
second largest sector in terms of utilising imported intermediate inputs.
Table 6
Five African Regions, Production Inputs, 2007, (USD millions).
SAM Entry Activities
North Africa Agri Food NRGM Manuf Services
Commodities total 4712 10596.3 19105.9 40367.5 60629.5
Agric. Imports 1459 4278.2 3.9 474.7 799.3
Food. Imports 500.1 2829.3 24.4 158 2475.9
NRGM. Imports 640.4 326.6 8067.9 3549 5222.6
Manuf. Imports 1736 2579.6 8784.8 32319.6 42123.5
Services. Imports 376.5 582.6 2224.9 3866.2 10008.2
West Africa Agri Food NRGM Manuf Services
Commodities total 4675.8 2957.4 10419.9 6839.5 35102
Agri. Imports 365.6 539.8 0.8 202.4 47.1
Food. Imports 133.9 1343.5 5 48.6 927.8
NRGM. Imports 507.3 100.8 4905.4 616.8 4544.1
Manuf. Imports 3426.6 600.9 3798.3 5180.6 22238.6
Services. Imports 242.4 372.4 1710.4 791.1 7344.4
Central Africa Agri Food NRGM Manuf Services

16
Commodities total 451.91 998.6 6488.16 2684.65 24064.82
Agri. Imports 14.43 67.07 1.74 17.7 31.22
Food. Imports 50 242.17 20.07 151.59 645.49
NRGM. Imports 6.72 26.77 292.14 166.26 1532.93
Manuf. Imports 314.24 319.34 3192.22 1593.09 10773.57
Services. Imports 66.52 343.25 2981.99 756.01 11081.61
East Africa Agri Food NRGM Manuf Services
Commodities total 2967.46 3462.34 10099.72 7415.12 39596.6
Agri. Imports 227.02 491.17 2.85 133.69 69.55
Food. Imports 146.64 889.42 32.35 138.64 1013.75
NRGM. Imports 233.89 125.07 3075.21 803.16 5107.22
Manuf. Imports 2092.66 1445.39 4350.1 5216.78 21357.02
Services. Imports 267.25 511.29 2639.21 1122.85 12049.06
South Africa Agri Food NRGM Manuf Services
Commodities total 1248.2 3119.72 16809.77 25255.31 37584.42
Agri. Imports 58.06 966.32 0.84 54.1 63.34
Food. Imports 72.64 828.51 6.59 171.23 268.26
NRGM. Imports 179.87 88.09 14149.96 3402.04 4244.91
Manuf. Imports 755.05 838.86 2000.74 20046.69 29103.22
Services. Imports 182.58 397.94 651.64 1581.25 3904.69
Total 14055.37 21134.36 62923.45 82562.08 196977.3
Source: GTAP 8 and 8.1 (2013)
Furthermore, across all regions, manufacturing imported intermediate inputs constitutes the
largest share (60 per cent) of total imported intermediate inputs, USD 226,187 million. For
the three regions—North, South and West Africa—energy and mining follows as the second
largest commodity group. In Central and East Africa services make out the second largest
group of imported intermediate inputs.
The results from the regional data suggest that imported intermediate inputs are
critical in the manufacturing and energy and mining sectors. Moreover, manufacture and
energy and mining imported intermediate inputs together make out 76 per cent of total
imported intermediate inputs.
Trade Facilitation
In light of the preliminary findings that imported intermediate inputs are crucial for
manufacturing production, the timely and cost-effective sourcing of intermediate inputs

17
between African countries (and also African countries with the rest of the world) are of
utmost importance. Trade facilitation is therefore important and relevant in this context.
Trade facilitation is understood as the simplification of the trade relationship between
partners.17
In the WTO, it has a more elaborate scope which focuses ‘“on the simplification
and harmonisation of international trade procedures” 18
(ECA et al., 2010). Table 7 illustrates
the key components.
Table 7
Trade Facilitation (with Financing) Trade Facilitation Doha Negotiating Text
(without Financing)
Broad Scope of Coverage Compliance to government rules by traders;
authorities’ enforcement of these rules (including
taxes); exchange of information; financing; insurance;
ICT and legal services; transport; handling;
measurement and storage.
Article 1: Publication And Availability Of
Information, Article 2: Prior Publication And
Consultation , Article 3: Advance Rulings, Article 4:
Appeal Procedures, Article 5: Other Measures To
Enhance Impartiality, Non-Discrimination And
Transparency, Article 6: Fees And Charges
Connected With Importation And Exportation, Article
7: Release And Clearance Of Goods, Article 8:
Consularization, Article 9: Border Agency
Cooperation, Article 10: Formalities Connected With
Importation And Exportation , Article 11: Freedom Of
Transit, Article 12: Transitional Provisions For
Developing Country Members And Least Developed
Country Members, Article 13: [Customs] Cooperation
[Mechanism For [Trade Facilitation And]
[[Customs][Trade]] Compliance], Article
14: Institutional Arrangements, Article 15: National
Committee On Trade Facilitation, Article 16:
Preamble/Cross-Cutting Matters.
Responsibility REC’s based/Continental based. Individual Member
Funding of Trade Facilitation Measures Mostly REC’s based/Continental based/Donor
based
Mostly individual Members
Source: Extracted from ECA et al., (2010) and World Trade Organization (2009)
While the main objectives of both trade facilitation pathways are to simplify trading between
partners, the means to achieving the specific activities differs. In particular, there is no
specific reference in the Trade Facilitation negotiating text of the WTO to financial assistance
towards members taking up these new additional commitments. This is probably one reason
17
This includes compliance to government rules by traders, authorities’ enforcement of these rules (including
taxes), the exchanges of information, financing, insurance, ICT and legal services, transport, handling,
measurement and storage (ECA et al., 2010). 18
This includes activities, practices and formalities involved in collecting, presenting, communicating and
processing data required for the movement of goods in international trade.

18
why some developing countries (including African WTO members) are less supportive of the
current negotiating text since any new trade facilitation commitments will imply
disproportional financial costs to most African economies.
Recognising the importance of trade facilitation towards Africa’s access to intermediate
inputs for production in higher value commodities, it is worthy to note that trade facilitation
measures are costly. Hence, domestic (and international) resource mobilization is therefore
important towards funding trade facilitation measures in Africa. One of the untapped
domestic resources that Africa is yet to harness is international financial loss due to illicit
financial flows (IFF). Mevel et al., (2013) estimated that Africa lost a cumulated total of
USD409 billion through illicit financial flows from trade mispricing in the period 2001 to
2010. About 92.5 per cent of this cumulative total IFF was due to export under-invoicing
while 7.5 per cent was import- over-invoicing. The study showed that while IFF has
increased over the decade studied, the last five years witnessed a significant increase in IFF—
totalling USD280 billion between 2006 to 2010—compared to USD129 billion between 2001
and 2005, attributable to the recent global increase in the values of primary commodities of
which Africa exports the most and in which Africa has revealed comparative advantage19
.
To put this amount of loss due to IFF (USD409 billion) into perspective, we compare this
amount against the amounts on Official Development Aid (ODA) and Foreign Direct
Investment (FDI) to Africa during this period (see Figure 3). Comparing years with available
data (2002-2010) on IFF, ODA and FDI flows, two key issues stands out. First, the estimated
value for combined IFF, ODA and FDI flows in Africa is around USD1,151.8 billion
between 2002-2010. Although the value of ODA commitment over the period dominated
with 38 per cent of total, IFF followed second with 32 per cent and FDI flows at 30 per cent.
Second, in the later years (2007, 2008 and 2009), the share of IFF is higher compared to
ODA and FDI flows respectively.
Therefore, two policy implications emerge from these trends. First, Africa needs to put in
place practical policy measures to curb IFF, in order to tap into this substantial domestic
financial resource loss. Second, the amount of IFF loss is so substantial, that if it was curbed,
it could potentially replace ODA or FDI respectively, which is required for the
transformational growth of Africa.
19
Please refer to Mevel, ‘Ofa & Karingi (2013) for details on methodology on estimating IFF and sectoral
results.

19
Figure 3
To sum up this section, based on the continental trade in intermediate goods and the case
of Kenya and other countries and territories in Africa, we find that imported intermediate
inputs are crucial for manufacturing production. Therefore, the access of African countries to
imported intermediate inputs is crucial and the trade facilitation measures have an important
role to play to ensure timely and cost-effective access. However, trade facilitation measures
are costly in the context of Africa and therefore requires concerted efforts (domestic and
international) to ensure ample financial resources is available. One potential source of
funding—if appropriate policy measures are implemented to curb it—is financial resource
losses from Africa due to illicit financial flows, which is estimated to a cumulative total of
USD409 billion between 2001 and 2010.
5. The role of Regional Economic Communities (RECs) in fostering a transformative
regional integration and trade in Africa
The RECs20
play a crucial role in Africa’s regional integration effort, despite challenges.
The challenges to Africa’s regional integration are well documented (see ECA et al., 2010 &
2012). These challenges range from energy access to security, and from infrastructure to
multiple memberships in RECs. These challenges are best tackled by strengthening
coordination among the RECs—individual countries cannot overcome these challenges alone
20
Refers to the eight RECs recognised by the Africa Union; CEN-SAD, COMESA, EAC, ECCAS, ECOWAS,
IGAD, SADC and UMA. Please refer to ECA et al., (2012) for composition of membership.
38
44
18
30
48
22
32
47
21
28
44
28
22
47
29
41
29
30
41
29
30
30
38
32
37
36
27
0
20
40
60
80
100
Perc
enta
ge S
hare
2002 2003 2004 2005 2006 2007 2008 2009 2010
(Author's estimation based on OECD, UNCTADstat, UN COMTRADE & CEPII-BACI, 2013)
Africa: IFF, ODA and FDI Flows, 2002-2010
IFF ODA Commitment
FDI Inflows
20
(ECA et al., 2012). While the African Union is coordinating progress among the RECs, the
actual implementation remains the responsibility of each REC. The regional integration
process is anchored on initiatives (Minimum Integration Programme—MIP) that the RECs
have selected21
. The key sectors that RECs have accepted as priority sectors include free
movement of persons, goods, services and capital; peace and security; infrastructure and
energy; agriculture; trade; industry; investment; and statistics. Nevertheless, a key challenge
in relation to the implementation of the MIP is one of access to finance and funding of these
initiatives by each individual REC and its respective members.
In the area of investment and capital, there are specific regional agreements on investment
including the COMESA Common Investment agreement (CCIA) and the SADC Investment
and Finance Protocol (SIFP), while ECOWAS has no explicit agreement except for
investment in energy. At the country level, several governments (18 African countries in
2009), introduced national investment-specific policy measures to attract foreign investment
in air transport or banking. The progress has been hampered by countries’ lack of compliance
with their commitments due to duplication of agreements (from multiple members).
Weakness in compliance also stems partly from RECs’ failure to fully integrate investment
provisions, treating them as add-ons (ECA et al., 2012).
In the area of free movement of people, significant progress has been made by several
RECs, in particular the adoption of protocols on the free movement of people, labour,
services, right to establishment and right to residence. Yet the process of transition to full
mobility of workers among African countries remains one of the most contentious issues
among African countries for reasons including security and unemployment (ECA et al.,
2012). For example, the freedom of movement in ECOWAS region is more advanced than in
any other sub-region22
. Many other African countries still demand visas from neighbours. For
example, members of COMESA and SADC impose visa requirements. One of the key
challenges for free movement of labour is the fact that unemployment rates in Africa are
generally high ranging from 12 to 45 per cent and in some cases as high as 70 per cent (ECA
et al., 2012). Therefore, some African countries are reluctant to allow in temporary unskilled
labour, particularly if their own nationals are uncompetitive against temporary unskilled
labourers from another country.
21
See ECA et al., (2012) for detail of the initiatives for the MIP first phase (2009-2012). 22
But only the first of three phases of the relevant protocol (visa free entry for up to 90 days) have been
completely implemented in all ECOWAS countries (ECA et al., 2012).

21
In terms of trade in goods and services, infrastructure is the main challenge towards
facilitating intra-African trade. The AUC Heads of States and Government in Kampala
launched the Programme for Infrastructure Development in Africa (PIDA) in July 2010,
which focuses on infrastructure projects in the areas of energy, transport, and ICT. The PIDA
strategic framework was adopted by the Heads of States and Governments in Addis Ababa in
January 2012 outlining a priority action plan.23
All RECs have infrastructure policy
frameworks and in some cases these are implemented jointly with other RECs. For example,
the COMESA, EAC and SADC are jointly implementing the ‘North-South Corridor’, which
is a transport infrastructure and trade-facilitation initiative with the objective of harmonising
regulations and transport service among the three RECs members. The major challenge for
infrastructure projects of this nature is that it cuts across several countries with different rules
and requirements. Also, multiple memberships create duplication in projects delaying
implementation. In addition, some of these infrastructure projects require huge financial
funding that most African countries and communities do not have.
To sum up this section, concerted efforts have been implemented by the RECs towards a
transformative regional integration and trade in Africa. However, there are challenges that
hamper RECs ability to effectively play their important role in regional integration. These
challenges include lack of access to finance for infrastructure projects, high costs of
implementing new agreements due to multiple membership, different levels of labour skills
and qualifications across the continent, thereby discouraging free movement of labourers.
These challenges therefore need to be addressed thereby allowing the RECs to be effective.
6. Conclusions
In this paper, we have argued that Africa’s regional integration agenda needs to be
‘transformative’ in order to gain buy-in and support for fast-tracking implementation at all
levels. In particular, transformative regional integration should address the concerns
regarding employment creation and also, promote and support resource-based
industrialisation for African countries with the potential comparative advantage in each
industry sector.
Further, we argued that resource-based industrialisation requires both primary inputs—
with which Africa is naturally endowed—and also intermediate inputs. However, Africa
23
Refer to ECA et al., (2012) for list of priority infrastructure projects 2010-2015.

22
imports more than 80 per cent of its intermediate goods crucial for value creation in the
manufacturing sector from outside Africa. Furthermore, using the input-output table to trace
the use of imported (and domestic) production inputs in Kenya (identified to be a country
with potential revealed comparative advantage (world) in BEC 2,3,5 and 7), we find that
imported intermediate inputs comprise a substantial share of energy and mining (63 per cent
imported) and manufacturing production (38 per cent imported). In addition, manufacturing
inputs are found to be the biggest intermediate input for the services industry—which was
Kenya’s largest sector in 2007. In addition, across all African countries and territories,
manufactured imported intermediate inputs constitute the largest share (60 per cent) of total
imported intermediate inputs. Therefore, the results from the regional analyses suggest that
imported intermediate inputs are critical in the manufacturing and energy and mining sectors.
Moreover, manufacture and energy and mining imported intermediate inputs together make
out 76 per cent of total imported intermediate inputs.
As a result, the access of African countries to imported intermediate inputs is crucial and
therefore trade facilitation measures have an important role to play to ensure timely and cost-
effective access. However, trade facilitation measures are costly in the context of Africa and
therefore require concerted efforts—both from domestic and international sources—to ensure
ample financial resources are available. One potential source of funding—if appropriate
policy measures are implemented to curb it—is financial resource losses from Africa due to
illicit financial flows, which is estimated to a cumulative total of USD409 billion between
2001 and 2010.
Further, RECs do have an important role to play towards a transformative regional
integration and trade in Africa. However, there are challenges that hamper RECs’ ability to
effectively play their important role in regional integration. These challenges include a lack
of access to finance on infrastructure projects, high costs of implementing new agreements
due to multiple membership, different levels of labour skills and qualifications across the
continent, thereby discouraging free movement of labourers. These challenges therefore need
to be addressed thereby allowing the RECs to be effective.
23
References:
African Union, 2012, ‘Action Plan for Boosting Intra-African Trade’, accessed for further information,
http://www.au.int/en/sites/default/files/Action%20Plan%20for%20boosting%20intra-African%20trade%20F-
English.pdf
Balassa B, 1965, ‘Trade liberalisation and ‘revealed’ comparative advantage’, The Manchester School’, Vol. 33,
pp. 99-123.
Burfisher ME, 2011, ‘Introduction to General Equilibrium Models’, Cambridge University Press, New York.
CEPII, 2013, ‘BACI Database’, accessed 1 May 2013,
http://www.cepii.fr/CEPII/en/welcome.asp
Chinembiri E, 2010, ‘An Empirical Assessment of the Impact of Trade Liberalization on Employment in South
Africa’, Trade & Industrial Policy Strategies, accessed 7 May 2013,
http://www.tips.org.za/files/Evans_Assessment_of_the_Impact_of_Trade_Liberalization_on_EmploymentFINA
L.pdf
Currie, J & A. Harrison, 1997, ‘Sharing the costs: The impact of trade reform on capital and labour in Morocco’,
Journal of Labour Economics, Vol. 15 (3ii), July: S44-S72
ECA, AU & AfDB, 2010, ‘Assessing Regional Integration in Africa IV’, United Nations Economic
Commission for Africa UNECA, Addis Ababa.
ECA, AU & AfDB, 2012, ‘Assessing Regional Integration in Africa V’, United Nations Economic Commission
for Africa UNECA, Addis Ababa.
ECA & AU, 2013, ‘Economic Report on Africa 2013’, UNECA, Addis Ababa.
GTAP, 2013, ‘GTAP Database 8’, accessed 30 May 2013,
https://www.gtap.agecon.purdue.edu/#4
Laursen K, 2000, ‘Trade Specialisation, Technology and Economic Growth: Theory and Evidence from
Advanced Countries’, Cheltenham, Edward Elgar.
Mashayekhi M, Peters R and Vanizetti D, 2012, ‘Regional Integration and Employment Effects in SADC’,
Policy Priorities for International Trade and Jobs, OECD.
Mevel S, SV ‘Ofa & S Karingi, 2013, ‘Quantifying illicit financial flows from Africa through trade mis-pricing
and assessing their incidence on African economies’, Selected paper for Presentation at the 16th GTAP
Conference, Shanghai.
OECD, 2013, ‘Aid Statistics’, accessed 30 May 2013,
http://www.oecd.org/dac/stats/
‘Ofa SV, M Spence, S Mevel & S Karingi, 2012, ‘Export Diversification and Intra-Industry Trade in Africa’,
Selected Paper for Presentation in the African Economic Conference 2012, Kigali, Rwanda, 30 October – 2
November 2012, accessed 15 May 2013,
http://www.africaneconomicconference.org/2012/Documents/Papers/AEC2012-379.pdf
Rattso, J., and R. Torvik, 1998, ‘Zimbabwean trade liberalization: Ex post evaluation’, Cambridge Journal of
Economics, Vol. 22: 325-346.
UNCTADstat, 2013, accessed 30 May 2013,
http://unctadstat.unctad.org/ReportFolders/reportFolders.aspx
UN COMTRADE, 2013, accessed 30 May 2013,
http://comtrade.un.org/

24
UNECA, 2012, ‘Study Report on Mainstreaming Regional Integration into National Development Strategies
and Plans’, UNECA, Addis Ababa.
WITS Online Database, 2013, accessed 30 May 2013,
http://wits.worldbank.org/wits/
World Trade Organization, 2009, ‘Draft Consolidated Negotiating Text’, Negotiating Group on Trade
Facilitation, TN/TF/W/165, WTO, Geneva.
25
Annex 1: Figure 2
-1-.
50
.51
No
rmaliz
ed
Reve
ale
d C
om
pa
rative
Ad
van
tag
e
Ang
ola
Equ
ato
ria
l_G
uin
ea
Lib
ya
Gab
on
Cha
dC
on
go
Eritr
ea
Con
go
_D
RA
lgeria
Cen
tral_
Afr
ican
_R
ep
Nig
eria
Za
mb
iaLib
eria
Sud
an
Burk
ina_
Faso
SA
CU
Guin
ea
Zim
ba
bw
eM
oza
mb
ique
Tu
nis
iaN
ige
rM
ali
Egypt
Sie
rra_
Le
one
Mo
rocco
Ma
law
iT
anzan
iaB
en
inC
am
ero
on
Ma
uri
tan
iaG
ha
na
Ma
uri
tiu
sS
en
eg
al
Rw
and
aM
ada
ga
scar
To
go
Sao
_T
om
e_P
rincip
eK
en
ya
Gam
bia
Uga
nd
aC
ote
_d
Ivoire
Com
oro
sE
thio
pia
Cap
e v
erd
eG
uin
ea
_B
issa
uD
jibou
tiB
uru
nd
iS
eych
elle
sS
om
alia
Source: Author's estimations based on BACI dataset (CEPII), 2013
Africa : NRCA Index to World (2011) - BEC1-1
-.5
0.5
No
rmaliz
ed
Reve
ale
d C
om
pa
rative
Ad
van
tag
e
Ang
ola
Cha
dLib
ya
Nig
eria
Alg
eria
Sud
an
Equ
ato
ria
l_G
uin
ea
Seych
elle
sC
ap
e v
erd
eS
ao
_T
om
e_P
rincip
eS
om
alia
Con
go
Guin
ea
_B
issa
uG
ab
on
Eth
iop
iaB
uru
nd
iD
jibou
tiM
auri
tiu
sT
unis
iaM
ada
ga
scar
Ken
ya
Cote
_d
Ivoire
Com
oro
sU
ga
nd
aC
am
ero
on
Mo
rocco
Egypt
Gha
na
Guin
ea
Sen
eg
al
Gam
bia
Rw
and
aT
ogo
Lib
eria
Ben
inN
ige
rM
ali
Mo
za
mb
ique
SA
CU
Ta
nzan
iaM
auri
tan
iaM
ala
wi
Sie
rra_
Le
one
Con
go
_D
RZ
imba
bw
eB
urk
ina_
Faso
Za
mb
iaC
en
tral_
Afr
ican
_R
ep
Eritr
ea
Source: Author's estimations based on BACI dataset (CEPII), 2013
Africa : NRCA Index to World(2011) - BEC 2

26
-1-.
50
.5
No
rmaliz
ed
Reve
ale
d C
om
pa
rative
Ad
van
tag
e
Buru
nd
iB
urk
ina_
Faso
Com
oro
sS
ierr
a_
Le
one
Djib
ou
tiS
eych
elle
sE
thio
pia
Ma
law
iZ
am
bia
Cen
tral_
Afr
ican
_R
ep
Gam
bia
Ma
uri
tiu
sT
ogo
Ta
nzan
iaZ
imba
bw
eM
oro
cco
Rw
and
aK
en
ya
Uga
nd
aM
ada
ga
scar
Ma
uri
tan
iaS
om
alia
SA
CU
Tu
nis
iaG
uin
ea
_B
issa
uS
en
eg
al
Ma
liC
on
go
_D
RLib
eria
Ben
inM
oza
mb
ique
Cote
_d
Ivoire
Gha
na
Nig
er
Guin
ea
Egypt
Cam
ero
on
Gab
on
Con
go
Sud
an
Nig
eria
Equ
ato
ria
l_G
uin
ea
Alg
eria
Lib
ya
Cha
dA
ng
ola
Source: Author's estimations based on BACI dataset (CEPII), 2013
Africa : NRCA Index to World (2011) - BEC3-1
-.5
0.5
1
No
rmaliz
ed
Reve
ale
d C
om
pa
rative
Ad
van
tag
e
Cha
dS
om
alia
Sud
an
Eritr
ea
Equ
ato
ria
l_G
uin
ea
Ang
ola
Alg
eria
Gab
on
Con
go
_D
RLib
ya
Ma
uri
tan
iaC
on
go
Ben
inG
uin
ea
_B
issa
uB
urk
ina_
Faso
Gam
bia
Zim
ba
bw
eE
thio
pia
Gha
na
Nig
eria
Buru
nd
iM
ala
wi
Rw
and
aM
oza
mb
ique
Cote
_d
Ivoire
Lib
eria
To
go
Egypt
Cen
tral_
Afr
ican
_R
ep
Sen
eg
al
Za
mb
iaT
anzan
iaC
om
oro
sK
en
ya
Djib
ou
tiM
ali
Ma
uri
tiu
sN
ige
rS
ierr
a_
Le
one
Ma
da
ga
scar
Cam
ero
on
Cap
e v
erd
eS
eych
elle
sS
AC
UM
oro
cco
Uga
nd
aS
ao
_T
om
e_P
rincip
eT
unis
iaG
uin
ea
Source: Author's estimations based on BACI dataset (CEPII), 2013
Africa : NRCA Index to World (2011) - BEC4

27
-1-.
50
.51
No
rmaliz
ed
Reve
ale
d C
om
pa
rative
Ad
van
tag
e
Som
alia
Ma
uri
tan
iaA
ng
ola
Guin
ea
_B
issa
uLib
ya
Sud
an
Con
go
Equ
ato
ria
l_G
uin
ea
Ben
inC
ha
dE
ritr
ea
Alg
eria
Gha
na
Nig
eria
Con
go
_D
RC
am
ero
on
Burk
ina_
Faso
Za
mb
iaZ
imba
bw
eG
am
bia
Buru
nd
iD
jibou
tiS
eych
elle
sM
auri
tiu
sC
ote
_d
Ivoire
Cen
tral_
Afr
ican
_R
ep
Ta
nzan
iaC
om
oro
sE
gypt
Nig
er
Sen
eg
al
Eth
iop
iaC
ap
e v
erd
eM
oza
mb
ique
Ma
law
iS
ao
_T
om
e_P
rincip
eT
ogo
Ken
ya
Sie
rra_
Le
one
Gab
on
Uga
nd
aR
wa
nd
aG
uin
ea
Ma
da
ga
scar
Ma
liS
AC
UM
oro
cco
Tu
nis
iaLib
eria
Source: Author's estimations based on BACI dataset (CEPII), 2013
Africa : NRCA Index to World (2011) - BEC5-1
-.5
0.5
1
No
rmaliz
ed
Reve
ale
d C
om
pa
rative
Ad
van
tag
e
Equ
ato
ria
l_G
uin
ea
Ang
ola
Alg
eria
Lib
ya
Sud
an
Con
go
Cha
dS
om
alia
Gab
on
Ma
uri
tan
iaC
on
go
_D
RG
uin
ea
_B
issa
uN
ige
ria
Com
oro
sC
en
tral_
Afr
ican
_R
ep
Burk
ina_
Faso
Mo
za
mb
ique
Za
mb
iaB
en
inD
jibou
tiE
ritr
ea
Nig
er
Buru
nd
iS
eych
elle
sM
ali
Cam
ero
on
Lib
eria
Guin
ea
Gam
bia
SA
CU
Sie
rra_
Le
one
Zim
ba
bw
eC
ote
_d
Ivoire
Ma
law
iG
ha
na
Rw
and
aT
anzan
iaU
ga
nd
aT
ogo
Sen
eg
al
Eth
iop
iaE
gypt
Cap
e v
erd
eM
oro
cco
Ken
ya
Ma
da
ga
scar
Tu
nis
iaM
auri
tiu
sS
ao
_T
om
e_P
rincip
e
Author's estimation based on BACI Dataset (CEPII) 2013
Africa : NRCA Index to World (2011) - BEC6

28
-1-.
50
.51
No
rmaliz
ed
Reve
ale
d C
om
pa
rative
Ad
van
tag
e
Alg
eria
Con
go
Equ
ato
ria
l_G
uin
ea
Mo
rocco
Gha
na
Burk
ina_
Faso
Nig
eria
Eritr
ea
Seych
elle
sZ
imba
bw
eZ
am
bia
Som
alia
Gam
bia
Sie
rra_
Le
one
To
go
Tu
nis
iaT
anzan
iaM
auri
tan
iaN
ige
rC
ap
e v
erd
eS
en
eg
al
Ken
ya
Ma
da
ga
scar
Ma
uri
tiu
sC
am
ero
on
Egypt
Ma
liU
ga
nd
aG
uin
ea
Buru
nd
iC
ote
_d
Ivoire
SA
CU
Lib
eria
Rw
and
aM
oza
mb
ique
Ma
law
i
Author's estimation based on BACI Dataset (CEPII) 2013
Africa : NRCA Index to World (2011) - BEC7

29
Annex 2
Regions (all territories and countries)
North Africa
Egypt
Morocco
Tunisia
Algeria
Libyan Arab Jamahiriya
Western Sahara
West Africa
Benin
Burkina Faso
Cameroon
Cote d'Ivoire
Ghana
Guinea
Nigeria
Senegal
Togo
Cap Verde
Gambia
Guinea Bissau
Liberia
Mali
Mauritania
Niger
Saint Helena, Ascension and Tristan de Cunha
Sierra Leone
Central Africa
Central African Republic
Chad
Congo
Equatorial Guinea
Gabon
Sao Tome and Principe
Angola
Democratic Republic of Congo
East Africa
Ethiopia
Kenya
Madagascar
Malawi
Mauritius
Mozambique
Rwanda
Tanzania
Uganda
Zambia
Zimbabwe
Burundi
Comoros
Djibouti
Eritrea
Mayotte
Seychelles
Somalia
Sudan
South Africa
Botswana
Namibia
South Africa
Lesotho
Swaziland