trade relations between new zealand and china: an ... of economics & finance ~ 77 ~ outcomes of...
TRANSCRIPT

Review of Economics & Finance
Submitted on 03/03/2014
Article ID: 1923-7529-2014-04-75-18 Sayeeda Bano
~ 75 ~
Trade Relations between New Zealand and China:
An Empirical Analysis in the Context of a Free Trade Agreement
Dr. Sayeeda Bano
Department of Economics, University of Waikato,
Private Bag 3015, Hamilton, NEW ZEALAND, 3240
Tel: + 64-7-838-4931, Fax: +64-7-838-4331, E-mail: [email protected]
Abstract: This study examines the bilateral trade relations between New Zealand and China from
1980 to 2012. It examines the strength of the trade relationship using export and import intensity
indices; identifies the degree of trade reciprocity using a 'trade reciprocity index'; estimates the
magnitude of intra-industry trade using the Grubel-Lloyd and Aquino indices; and analyses these
indices to consider how trade patterns and relations have changed between 1980 and 2012.
Significant growth in trade between New Zealand and China has been achieved since the signing of
a free trade agreement in 2008.The intensity of trade has strengthened; and there has been growth in
reciprocal trade and intra-industry trade for a number of industries and product groups. The results
foreshadow future bilateral trade, investment, technology transfer and economic relations between
New Zealand and China.
JEL Classifications: F10, F02, F13, F14, F15
Keywords: International trade; New Zealand; China; Trade-intensity; Trade reciprocity; Intra-
industry trade; Economic integration; FTA; CER
1. Introduction
Free trade agreements (FTAs) have come to dominate the agenda of trade negotiators in recent
years. Asia is a relative latecomer in the negotiation of FTAs, but the region has been catching up
rapidly over the past decade. As at September 2012, there were 103 FTAs, most of them bilateral,
involving one or more countries from the region. There are another 26 FTAs already signed, 64
under negotiation and 60 more proposed. Most of the global action on FTAs involves an Asian
country (Asia Forum 2013). It is in light of this development that the FTA, signed by China and
New Zealand, gains significance.
In signing the FTA in Beijing in April 2008, New Zealand became the first developed nation
to negotiate and subsequently sign such an agreement with China. From the outset this
comprehensive agreement covered goods, services and investment as a ‘single undertaking’. This
study analyses the consequences of FTA agreement between the two countries in terms of the
volume and pattern of trade between New Zealand and China. The paper incorporates the
application of trade intensity, trade reciprocity and intra-industry trade indices. An innovation in
this paper is the application of a modified Index of Trade Reciprocity to measure the level of
reciprocity in the overall balance of trade between New Zealand and China. This study also used the
Grubel-Lloyd and Aquino intra-industry trade indices. These alternative methodologies have not
been used in such a detailed research framework, with a long term time series data set, previously.

ISSNs: 1923-7529; 1923-8401 © 2014 Academic Research Centre of Canada
~ 76 ~
This paper is organized into four sections as follows. Section 2 provides an overview of
context and a brief literature review. Section 3 discusses the methodology and data used. Section 4
presents and analyses the results and Section 5 concludes.
2. Context and Previous Literature
The New Zealand-China FTA thus provides an interesting case study of the effects of the
union or integration of two contrasting economies. New Zealand is a relatively small open economy,
with a small population but high per capita income. China, on the other hand, is a large country with
a huge population with a relatively low per capita income. Partly because of their different sizes and
hence contrasting factor endowments, New Zealand is a labour-short, and China is a labour-
abundant, economy. Both countries do not share a common language or similar culture and they are
not close to each other geographically. Both New Zealand and China are members of the World
Trade Organization (WTO) and the Asia Pacific Economic Cooperation (APEC) and have a close
association with ASEAN.
New Zealand exports to China were US$161 million in 1980, while imports were US$ 44
million, leading to a bilateral trade surplus of US$117 million. This turned into a deficit of
US$23.8 million in 1990 and subsequent years, with the highest deficit of US$2,743 million being
posted in 2008. Positive outcomes emerged in the year following the signing of the FTA. In 2011,
New Zealand’s trade deficit with China decreased to US$1,204 million, which is 44 percent lower
than that in the year 2008.This is the result of the significant increase in New Zealand exports to
China from US$1,787 million in 2008 to US$4,701 million in 2011 and US$5,591 million in 2012.
China’s exports to New Zealand were only US $30 million and imports US$157 million in
1980, with a bilateral trade deficit. This turned into a trade surplus of US$27 million in 2005 and
subsequent years, with the highest surplus of US$613 million achieved in 2008, which was,
however, reduced after the signing of the FTA. A salient feature of China’s trade with New Zealand
is that the value of exports increased from US$2,764 million in 2009 to US$3,876 million in 2012,
while imports increased from US$ 2,476 million in 2009 to US$ 5,806 million in 2012. China’s
bilateral trade balance (deficit) increased from US$390 million in 2009 to US$1,930 million in
2012. This outcome is the result of the significant increase in China’s imports from New Zealand
after the FTA. The evidence suggests that a free trade agreement between New Zealand and China
would have trade creation and thus welfare-enhancing effects.
Figure 1 shows the trends in total bilateral trade, the trade balance between New Zealand and
China, New Zealand’s exports to China, and China’s imports into New Zealand. Aside from a slight
jump in 1988, New Zealand’s exports to China have exhibited a relatively smooth and steady
upward trend between 1980 and 2012. The value of exports remained comparatively low at less
than US$0.5 billion until 2000. But this increased sharply from 2001-2012, which may be attributed
to China’s economic reforms as well as to the various economic agreements between New Zealand
and China in the early 2000’s (e.g., the meat access protocols and other trade agreements). The
rapid increase in the export index after 2009 and until 2012 may, of course, be attributed to the FTA
between the two countries.
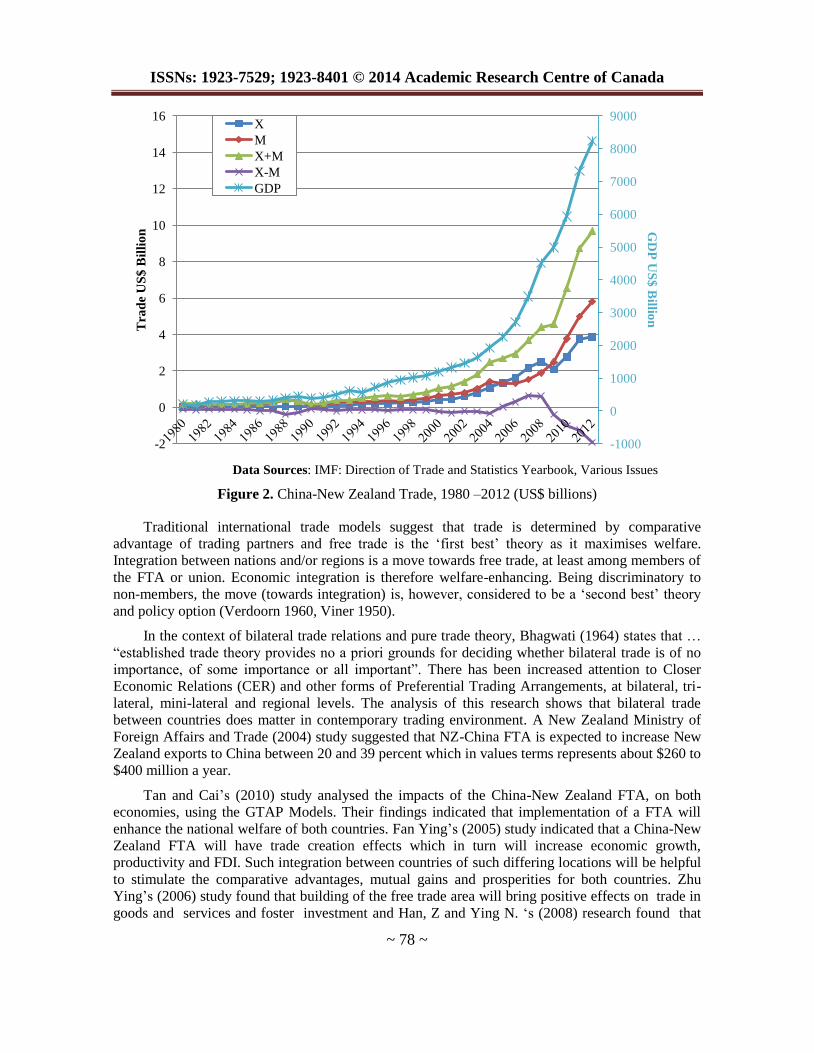
Figure 2 shows the growth of Chinese imports into New Zealand forming a relatively smooth
curve rising over time. New Zealand’s exports to China as a proportion of its total exports increased
from one percent in 1980 to about 13 percent in 2012, but the proportion of imports coming from
China showed a sharper increase from 0.8 percent in 1980 to over 16 percent in 2012. Tariff
removal on New Zealand’s logs, sawn timber and agricultural products was among the key

Review of Economics & Finance
~ 77 ~
outcomes of the FTA. As a result of the FTA, New Zealand’s agricultural exports to China surged
to $3.5 billion in June 2011, representing an increase of 50 percent over the previous year. China's
middle class, estimated to number more than 100 million people and growing, is a substantial
potential market for New Zealand's agricultural products.
From 1981 to 1991 there was an upward trend in the bilateral trade (X+M) between the two
countries, although the rate of increase was low. There was a slight deviation from the trend around
1988, when the value of exports to China was higher than would have been expected from the
existing trend. This was around the time when China and New Zealand signed a bilateral
Investment Promotion and Protection Agreement, which may have had some impact, but to what
extent, we don’t know.
Data Sources: IMF: Direction of Trade and Statistics Yearbook, Various Issues
Figure 1. New Zealand-China Trade, 1980 – 2012 (in US$ billions)
A study by New Zealand’s Ministry of Foreign Affairs and Trade (MFAT 2004) suggested that
an FTA between New Zealand and China would have a positive impact on the former’s economy.
Gains were expected to result from the removal of tariff and non-tariff measures (NTMs) across all
areas, including agriculture and the non-durable manufacturing sectors, as well as services exports
such as education services, investment and trade facilitation. Comprehensive and reciprocal
elimination of trade barriers would also allow citizens of both countries to benefit from increased
efficiency and competition, and hence lower prices and a greater variety of goods and services.
By way of contrast New Zealand’s agriculture sector, in particular stood to benefit from an
FTA with China. However, not everyone agreed that the impact of the FTA would be positive. New
Zealand’s clothing unions, for instance, claimed that the arrangement would bring in a flood of
cheap Chinese imports. Analysts also warned against China’s practice of dumping cheap goods on
foreign markets.
-45
-25
-5
15
35
55
75
95
115
135
155
175
-4
-2
0
2
4
6
8
10
12
14
16
GD
P U
S$
Billio
n T
rad
e U
S$
Bil
lio
n
X
M
X+M
X-M
GDP
ISSNs: 1923-7529; 1923-8401 © 2014 Academic Research Centre of Canada
~ 78 ~
Data Sources: IMF: Direction of Trade and Statistics Yearbook, Various Issues
Figure 2. China-New Zealand Trade, 1980 –2012 (US$ billions)
Traditional international trade models suggest that trade is determined by comparative
advantage of trading partners and free trade is the ‘first best’ theory as it maximises welfare.
Integration between nations and/or regions is a move towards free trade, at least among members of
the FTA or union. Economic integration is therefore welfare-enhancing. Being discriminatory to
non-members, the move (towards integration) is, however, considered to be a ‘second best’ theory
and policy option (Verdoorn 1960, Viner 1950).
In the context of bilateral trade relations and pure trade theory, Bhagwati (1964) states that …
“established trade theory provides no a priori grounds for deciding whether bilateral trade is of no
importance, of some importance or all important”. There has been increased attention to Closer
Economic Relations (CER) and other forms of Preferential Trading Arrangements, at bilateral, tri-
lateral, mini-lateral and regional levels. The analysis of this research shows that bilateral trade
between countries does matter in contemporary trading environment. A New Zealand Ministry of
Foreign Affairs and Trade (2004) study suggested that NZ-China FTA is expected to increase New
Zealand exports to China between 20 and 39 percent which in values terms represents about $260 to
$400 million a year.
Tan and Cai’s (2010) study analysed the impacts of the China-New Zealand FTA, on both
economies, using the GTAP Models. Their findings indicated that implementation of a FTA will
enhance the national welfare of both countries. Fan Ying’s (2005) study indicated that a China-New
Zealand FTA will have trade creation effects which in turn will increase economic growth,
productivity and FDI. Such integration between countries of such differing locations will be helpful
to stimulate the comparative advantages, mutual gains and prosperities for both countries. Zhu
Ying’s (2006) study found that building of the free trade area will bring positive effects on trade in
goods and services and foster investment and Han, Z and Ying N. ‘s (2008) research found that
-1000
0
1000
2000
3000
4000
5000
6000
7000
8000
9000
-2
0
2
4
6
8
10
12
14
16
GD
P U
S$
Billio
n T
rad
e U
S$
Bil
lio
n
X
M
X+M
X-M
GDP

Review of Economics & Finance
~ 79 ~
the agricultural products from New Zealand are important to China and China’s manufacturing
industry plays a significant role in New Zealand’s imports. They also found that the trade between
China and New Zealand is very complementary. Sandrey and Grinsted’s (2008) study found
considerable welfare gain to New Zealand of $478 million and the welfare gains to China was
about $323- Indicating that a small economy can stand to gain from an FTA with a larger one.
3. Data and Methodology
Annual statistics covering the sample period 1980-2012 were obtained from the IMF’s
Direction of Trade Statistics Yearbook, World Economic Outlook database, and the UN
Commodity Trade database. We chose 1980 as the starting point because China started its economic
policy reforms in 1979. New Zealand adopted more or less similar reforms in 1985. Data is
available only up to 2012, and hence this provides the endpoint. Intra-industry trade is estimated
from 1990 to 2012 due to data availability.
Trade intensity, trade reciprocity and intra-industry trade indices are the three most appropriate
methodologies for this study; each is explained below.
3.1 Trade Intensity
Pioneered by Brown (1947) and later developed and popularised by Kojima (1964), the
intensity of trade index explains variations in trade over time and across bilateral trading
relationships by analysing the nature and importance of resistance factors. Trade between a country
and its trading partners is more intense than with the rest of the world when the resistance between
them is lower. Trade intensity provides a way of measuring trading relations without the bias
resulting from the comparative size of the trading partners. Trade intensity analysis allows us, for
instance, to infer that New Zealand’s exports to China are high, not because these countries are
economically large (or small) but because the resistances between them are relatively low.
The indices also show in a rather simple way whether New Zealand’s trade with China is
greater or less than might have been expected given the importance of the trading partner’s share in
total world trade. If New Zealand is home country i and China is country j, then the intensity of
trade index (TIIij,) for both exports and imports is calculated using the formulas:
(1a, 1b)
where:
Xij = country i exports to country j Mij = country i imports to country j
Xi = total exports of country i Mi = total imports of country i
Mj = total imports of country j Xj = total exports of country j
Mw = total world imports Xw = total world exports
XIIij = export intensity index MIIij = import intensity index
Xij/Xi, is the proportion of exports that are sent to the trading partner as a percentage of total
domestic exports. This indicates how significant the trading partner is to the home country for its
exports. Mj/(Mw-Mi) is the trade partner’s total imports as a proportion of total world imports less
the import of the domestic economy. Countries that import at proportionally high levels from the
same country to which they send most of their exports have a higher trade intensity (XIIij)
Conversely, a country with diverse markets that is not reliant on any one country for its imports has

ISSNs: 1923-7529; 1923-8401 © 2014 Academic Research Centre of Canada
~ 80 ~
a lower trade intensity (XIIij). A trade-intensity index greater than one indicates that a country is
exporting more to its partner than would be expected by its share in world trade, while an index of
less than one indicates the opposite.
Garnaut and Drysdale (1994), however, regard the intensity of trade index as only a rough
index of relative resistances because it does not allow for the varying commodity composition of
countries’ foreign trade. When commodities are not substitutable, opportunities for bilateral trade
are limited by the degree to which one country’s exports complement another country’s imports.
3.2 Trade Reciprocity Index
Trade reciprocity refers to the mutual changes in trade policy which bring about changes in the
volume of each country’s imports that are of equal value to changes in the volume of its exports. It
enables the levels of reciprocity in the overall balance of trade between two countries to be
identified. It was developed by Wadhva and Asher (1985) with index measured using the following
formula:
1 1
1 1
( )1
( 1)
n nij ji
ij
j iij ji
n n
ij
i j
a aa
a a
n a
(2)
where: aij = exports of country i (NZ) to partner j (China)
aji = exports of country j (China) to partner i (NZ)
n = total number of countries involved in the context of the bilateral or regional groups
θ = the trade reciprocity index (TRI).
This formula results in an index that will always lie between 0 and 1. When every pair of
countries in a group tends to have a perfectly balanced two-way trade, the value of θ reaches its
maximum, which is unity. On the other hand, when there exists only one-way flow of trade between
a pair of trading partners (say, complete dependence of country A on country B for its imports or
exports), the value of θ is at its minimum, which is zero. The index thus measures the degree of
trade reciprocity. It is however difficult to apply Wadhva and Asher’s equation for measuring trade
reciprocity, so we modify the index by re-writing the equation, with the first part of the numerator
inside the summation mark.
Since a country cannot export to itself, Equ. (2) has a specific case of n=2:
0012
00
12112
21
1221
1221
12
2112
2112
aa
aaa
aaa
aa
aa
(3)
Ratnayaka (2004) used this method to measure the extent of trade between Sri-Lanka and
Japan from 1951 to 2000. The results show trade reciprocity values of less than one, suggesting that
bilateral trade between Sri-Lanka and Japan is non-reciprocal or far from balanced. This modified

Review of Economics & Finance
~ 81 ~
formula has been used in this study. A more detailed explanation and an example are available from
the author.1
3.3 Intra-Industry Trade
Intra-industry trade is the simultaneous export and import of goods within the same industry.
Intra-industry trade provides a case for economic integration between nations which are similar in
terms of factor endowments, human capital, technologies, cultures and levels of development. Intra-
industry trade analysis suggests that the greater the similarity between countries in terms of income
levels, factor endowments and levels of development, the higher will be the trade intensities
between them (Linder 1961).
A comprehensive survey of the various ways of measuring intra-industry trade (IIT) can be
found in Tharakan (1983), Aquino (1978), Bano (1991), Lloyd and Lee (2002), and Lloyd and
Grubel (2003). Among these measures, the Grubel and Lloyd (1975) indices have been the most
popular and widely used. This study uses the Grubel-Lloyd single industry index (IITBi), the
Grubel-Lloyd weighted mean index (IITB), the Grubel-Lloyd trade imbalance adjusted index (IITC)
and the Aquino adjusted index (IITQ). We first look at the Grubel and Lloyd Index (1975), and then
briefly the Aquino adjusted Measure (Aquino,1978).
a. Grubel and Lloyd IIT Measure
Grubel and Lloyd (1975) define IIT as the value of exports in an industry which is exactly
matched by imports in the same industry, and is measured by:
(4)
Where Xi and Mi are exports and imports of industry i, respectively. This measure varies from
0 to 100, with higher values representing higher levels of intra-industry trade. Grubel and Lloyd
devised a summary measure to calculate IIT trade across industries (or countries) at a given SITC
(United Nations Standard International Trade Classification) product group level of aggregation.
The summary measure is a weighted average of IITBi, the weight being the share of each industry in
the country's total trade. The Grubel-Lloyd summary measure is:
1 1
1
( )
100
( )
n n
i i i i
i ii
n
i i
i
X M X M
IITB IITB
X M
(5)
Where IITB is the weighted average of the value of IITBi across industries i = 1,2, ... n, where
n is the number of industries in the sample. IITBi is an accurate measure if there is balanced bilateral
trade, but if total trade (or the trade of the subset of industries being measured) is unbalanced, then
1 My attention was drawn by Piyadasa Ratnayaka from Saga University, Japan, regarding the Trade
Reciprocity Index (TRI) developed by Wadhva and Asher (1985) and, in particular, the measurement
difficulties in its original form. We therefore modified the Wadhva trade reciprocity index. It was then
first used by Piyadasa Ratnayaka in his book Lost Opportunities: Sri Lanka’s Economic Relationship
with Japan (2004). His acknowledgement of my contribution is appreciated. Full derivation of equation (2) is available from the author on request.

ISSNs: 1923-7529; 1923-8401 © 2014 Academic Research Centre of Canada
~ 82 ~
the index is downward biased because the denominator is overstated. In such a situation, the IITBi
measure cannot attain its maximum value of 100. In order to avoid any bias introduced by
unbalanced trade, the mean must be adjusted by removing this trade imbalance effects. Accordingly,
Grubel and Lloyd devised the adjusted measure shown as follows:
1 1
1 1 1
( )
100
( )
n n
i i i i
i i
n n n
i i i i
i i i
X M X M
IITC
X M X M
(6)
b. Aquino Adjusted IIT Measure
To avoid bias, introduced by unbalanced trade, Aquino (1978) suggested adjustments at each
industry level rather than at the aggregate level. Aquino simulates balanced trade by calculating
'theoretical values' of exports and imports at the industry level:
1
1
( )1
2
n
i ie ii i n
i
i
X M
X X
X
1
1
( )1
2
n
i ie ii i n
i
i
X M
M M
M
(7)
The derived values for exports (Xie) and imports (Mi
e) are applied to the Grubel-Lloyd
measures to arrive at the corresponding measures of IITQi at the industry level and IITQ for total
trade. The Aquino measure is represented by the following equation:
1 1
1
( )
100
( )
n ne e e e
i i i i
i i
ne e
i i
i
X M X M
IITQ
X M
(8)
These IIT methods have been applied to calculate the magnitude of intra-industry trade
between New Zealand and China. IIT was calculated for each industry as well as across industries at
3-digit SITC levels for selected years.
4. Results and Analysis
4.1 Trade Intensity
In 1980 the export intensity index was 2.9, indicating strong New Zealand representation in
China’s markets. In subsequent years trade intensity decreased, with some minor increases later, but
not to any great extent. After the signing of the FTA, the index increased from 0.8 in 2008 to 1.2 in
2009, 1.3 in 2010 and 1.5 in 2012.
Figure 3 shows the movements in the export (XII) and import intensity (MII) indices for the
period 1980 to 2012; three stages can be discerned.From1980 to 1990 the MII fluctuated at a low
level, which is not surprising, as the level of bilateral trade during that period was low. During the
second stage, 1990-2007, the MII increased and showed stability. In the third stage, after 2008, the
MII tended to decrease while the XII increased slightly but at a very low level.

Review of Economics & Finance
~ 83 ~
Data Sources: IMF: Direction of Trade and Statistics Yearbook, Various Issues; Author’s Calculations
Figure 3. Export and Import Intensity Indexes of New Zealand to China, 1980-2012
At first glance, these movements and tendencies of both MII and XII are surprising. First, the
XII stayed stable at a low level almost the whole time except after the signing of the FTA. Before
that, the XII seems not to have responded to any of the economic integration efforts. The increase in
XII after the FTA has also not been significant. On the other hand, the MII increased with bilateral
trade during 1990- 2007 period, although two integration efforts - the first when China joined the
WTO and the second when New Zealand recognized China as a market economy –seems to have
had no influence on the MII. Moreover, the MII seems to have decreased in response to the FTA.
Secondly, because the trade intensity index shows the percentage of bilateral trade in a
country’s total trade, any trade increase can only be a small part of China’s trade. It is thus not
surprising to see a steadily low level of XII in the New Zealand-China bilateral trade. The small size
of New Zealand meanwhile tends to amplify the increase/decrease in MII, but it cannot explain the
drop in the MII after the FTA, since imports actually increased significantly. A possible reason for
this seemingly aberrant behaviour is the increase in New Zealand’s trade diversification after 2008
4.2 Trade Reciprocity
At first glance, there is no clear pattern in the movement of trade reciprocity and bilateral trade
between New Zealand and China. The trade reciprocity index (TRI), which was initially quite low
at 0.32in 1980, has been going up and by 2012 has reached 0.89, as shown in Figure 4. The TRI
increased with bilateral trade until 2000, with imports increasing faster than exports. The TRI
peaked at 0.99 in 2003, and then decreased until 2007. Thereafter, there was an upward move until
2009, after which there was again a decrease as Chinese imports became dominant over New
Zealand’ exports. TRI shows a value of less than unity after 2008, indicating that bilateral trade
between the two is not yet balanced. Trade data suggests a tendency towards reciprocal bilateral
trade between NZ and China, however, a bilateral balanced trade is yet to be achieved
0
2
4
6
8
10
12
14
Ind
ex
XII
MII

ISSNs: 1923-7529; 1923-8401 © 2014 Academic Research Centre of Canada
~ 84 ~
Data Sources: IMF: Direction of Trade and Statistics Yearbooks, Various Issues; Author’s Calculations.
Figure 4. Trade Reciprocity of New Zealand and China, 1980-2012 (TRI Values)
4.3 Intra-industry Trade
This section examines the extent of New Zealand’s intra-industry trade with China for the
years 1990-2012. IIT was computed using the UN Standard International Trade Classification at the
3-digit level (SITC Rev.3) for all industries from SITC 0 to SITC 9. The 3-digit summary values
were also computed for SITC across all industries for the years 1990-2012. The trade data used in
the analysis are from the UN Statistical Department, Commodity Trade Division database. All
export and import values are in US dollars for each calendar year.
Table 1 reports high and low levels of IIT between New Zealand and China. The results show
high IIT in SITC 0 (‘Food and Live Animals’). Only two products out of thirteen industries in this
section (Sugars, Molasses, Honey SITC 061 and Coffee, Coffee substitutes SITC 071) show high
levels of IIT ranging from 46 percent to about 98 percent in 2012. It is noticeable that ‘Sugars,
Molasses, Honey, Fish dried, Salted, Smoked, and Crustaceans, Molluscs, etc. had high IIT ranging
from 59 to 76percent in 1990. The remaining product in this group, ’Fruit’ (SITC 058), shows
expectedly low levels of IIT but high inter-industry trade, with a trade deficit with China in this
category. Given the differences in factor endowments of the two countries, trade in this sector
seems to be consistent with the predictions of traditional trade theory. The gains from inter-industry
trade are explained by the well-known Heckscher-Ohlin-Samuelson (HOS) comparative advantage
trade theory. Intra-industry trade, on the other hand, is explained by theories of economies of scale,
product differentiation, technological gap and product life cycle.
The highest IIT in 2012(99 percent) belongs to ‘Crude Vegetable Materials’ (SITC
292).Within SITC 5 (‘Chemicals and related products’), a wide variation in the distribution of inter
and intra-industry trade is observed. For example, ‘Medicaments’ (SITC 542), ‘Dying, Tanning
Extracts, Synthetic Tanning Materials’ (SITC 532), and ‘Plastics, N.E.S.’ (SITC 575) show high IIT
intensity, while the remaining products also have high values of inter-industry trade in 2012. In
1990, ‘Starches’ (SITC 592) and ‘Inorganic Chemical, Elements’ (SITC 522) showed high IIT. By
0.0
0.1
0.2
0.3
0.4
0.5
0.6
0.7
0.8
0.9
1.0 T
rad
e R
ecip
roci
ty

Review of Economics & Finance
~ 85 ~
2011 average IIT across industries was 12 percent compared to 23 percent in 1990. A possible
explanation is that a large proportion of China’s trade in this category is with the US, Japan and
other OECD countries. In addition, new products have emerged in this category. It is also observed
that there have been trade-widening effects in this category; for example, new products that are
traded both ways have also emerged in this category.
‘Perfumery, Cosmetics, Toilet Preparations, Excluding Soaps’ (SITC 553) are at the lower end
of the IIT index in both 1990, and 2012. All other goods’ classifications which appeared at the high
and low ends of each industry in 2012 are different from those in 1990, indicating a broad and ever-
changing industry classification. There is high IIT in SITC 6, which covers ‘Manufactured Goods
Classified by Materials’, in 2012. This is particularly true in SITC 641:‘Paper, Paperboard’ (72
percent IIT), SITC 655:‘knitted or crocheted fabrics’ (57 percent IIT) and SITC 634, ‘veneers,
plywood, particle board, and other wood’. Other industries however show relatively low levels of
IIT, but overall the results show that specialization is concentrated on a wide range of products
where intra-industry trade has potential for growth.
SITC 7 covering ‘Machinery and Transport Equipment’, Textile and leather machines (724),
Electric power machinery (771), were at the high end of IIT in 1990 at 95 and 85 percent,
respectively. IIT values in 'Thermionic, Cold Cathode, or Photocathode Valve’ (776) and ‘Machine
Tools for Working Metal’ (733) are significantly high at 99 and 86 percent, respectively, in 2012.
Machinery and equipment specialised for particular industries (728), and power generating
machinery and parts (718) show IIT values ranging from 51 to 57 percent in 2012. There was very
little IIT in SITC 8, which covers ‘miscellaneous manufactured articles’.
In each industry except one, a greater number of goods can be classified as being in the ‘high’
end of the IIT index in 2012 compared to 1990. This makes sense, considering the general trend,
which is one of increasing IIT between New Zealand and China during this period. But perhaps the
most striking finding is the high level of IIT in non-manufactured goods such as SITC 0-2. In a
sense, this indicates a harmonization of ‘old' and ‘new' trade. China and New Zealand continue to
concentrate on their respective areas of comparative advantage in labour-intensive and land-
intensive agricultural products such as food and food preparations, but have also developed specific
differentiation in a few products, processing them further to satisfy consumer demand. China
appears to have comparative advantage in (SITC 0-4) ‘processed food, crude materials’ (SITC 2)
and ‘finished manufactured products’ (SITC 8), sectors which show low IIT (and high inter-
industry trade) with China.
Tables 2-4 show summary values of IIT across product groups at the SITC 3- digit for selected
years. The results show that in 1990, the first year of the study period, IIT as a proportion of New
Zealand’s trade with China was high under the Grubel-Lloyd weighted mean index and the Grubel-
Lloyd and Aquino adjusted indexes, but was slightly lower during the period 1991-1995. From
1998 to 2001, New Zealand’s IIT with China increased significantly on all the three indexes. From
2001 to 2002 the indices were relatively constant at just above the 2000 level. IIT values for 2005
and 2006 were slightly higher than those of 2004, but IIT values were so much higher in 2007 than
in previous years.
The entry of China into the WTO also saw a fall in average tariffs from 25 to 10 percent,
making New Zealand’s products increasingly attractive to Chinese consumers. Thus, following the
expansion of IIT up to 2006, the comparative advantages of each country were reflected in their
increasing inter-industry trade. It is very clear that since the FTA went into effect in 2008, the IITC
index has decreased to about 10percent in 2009. IITB and IITQ indices also decreased in 2009,
2010 and 2011, but IITB marginally increased in 2012.

ISSNs: 1923-7529; 1923-8401 © 2014 Academic Research Centre of Canada
~ 86 ~
Data Source: UN Comtrade Database, and Author’s calculations
Figure 5. Intra-Industry Trade of New Zealand with China, 1990 – 2012
At this point, three observations concerning the use of the three IIT indices may be made,
namely, that: (a) they move in the same direction; (b) their values vary during different years and
the variations are substantial during some years; and (c) the Aquino adjusted measure is higher than
the Grubel-Lloyd average measure in most of the cases.
As discussed earlier, together with the increase in bilateral trade between the two countries,
intra-industry trade also increased, especially in the industries mentioned above. However, the IIT
indices tell a different story. Figure 5 shows that before 2000 all three IIT indices kept increasing;
but after China joined the WTO in 2001, the IIT began to increase moderately until 2007, but then
started decreasing, with the decrease even intensifying after the signing of the New Zealand-China
FTA in 2008.
Does the foregoing result lead to the conclusion that economic integration between New
Zealand and China is actually negatively related to intra-industry trade? Not necessarily. The
relation between economic integration and intra-industry trade remains, in our view, positive. The
observed negative relation may be explained by the fact that with the economic integration between
New Zealand and China, the number of tradable categories also expanded rapidly. As a result, along
with the rapid increase of intra-industry trade, new tradable industries arose which made inter-
industry trade grow even faster than previously. This has the effect of reducing the IIT indices,
since intra-industry trade and inter-industry trade move in opposite directions. For example, the list
of traded goods at the 3-digit SITC level in 2012 is five time longer than the 1990 list. The other
evidence is that there are new products and industries that have been classified under the category
'others', SITC 9. (This is not included in our tables, but data and results are available on request
from the author.)
0.0
2.0
4.0
6.0
8.0
10.0
12.0
14.0
16.0
18.0
20.0
1990
1991
1992
1993
1994
1995
1996
1997
1998
1999
2000
2001
2002
2003
2004
2005
2006
2007
2008
2009
2010
2011
2012
IIT
In
dex
IITB
IITC
IITQ

Review of Economics & Finance
~ 87 ~
5. Conclusion
We examined the strength of New Zealand’s trade relations with China by estimating trade
reciprocity indices, intra-industry trade indices, and trade-intensity indices in the context of an FTA.
The results show that New Zealand’s trading relations with China has strengthened and intensified
since 2008.Trade reciprocity between New Zealand with China, which started relatively low, has
also increased after integration in 2008, indicating positive effects from the integration. Trade
reciprocity indicates that bilateral trade is not yet balanced, suggesting room for further
improvement. Intra-industry trade has developed in selected industries, with about 20 industries
across SITC product groups showing high degrees of IIT, with tendencies for further increase.
Three observations concerning the three intra-industry indices are that: (a) they move in the
same direction; (b) their values vary during different years and the variations are substantial during
some years; and (c) the Aquino adjusted measure is higher than the Grubel-Lloyd average measure
in most of the cases. Whereas trade intensity and intra-industry trade indices move in opposite
directions, trade-reciprocity and trade intensity seem to move in the same direction.
An interesting observation is that before 2000 all three IIT indices kept increasing; but after
China joined the WTO in 2001, the IIT began to increase moderately until 2007, but then started
decreasing, with the decrease even intensifying after the signing of the NZ-China FTA in 2008.
This however, may not lead to the conclusion that economic integration between New Zealand and
China is actually negatively related to intra-industry trade. The relation between economic
integration and intra-industry trade remains, in our view, positive. The observed negative relation
may be explained by the fact that the number of tradable categories also expanded rapidly after
integration. As a result, along with the rapid increase of intra-industry trade, new tradable industries
arose which made inter-industry trade grow even faster than previously. This has the effect of
reducing the IIT indices, since intra-industry trade and inter-industry trade move in opposite
directions.
One concern expressed during the FTA negotiations was that the larger partner would
dominate the smaller one. This analysis suggests that has not been the case and that, moreover,
there is a possible way out, which is for the smaller country (in this case, New Zealand) to adopt as
an industrial strategy, a narrower type of specialization. Thus, economies of scale in production can
still be realized. Intra-industry trade is likely to play an important role in strengthening trade
relations between integrated countries.
Acknowledgments: I express my gratitude to the Department of Economics, University
of Waikato, and to Farhad Ali, Professor Frank Scrimgeour and Professor Jose
Tabbada for their valuable comments and other contributions. My thanks and
appreciation go to Suhail Farhad and Zhigang Dong for their research assistance
and to Brian Silverstone for his valuable editorial contribution. My sincere thanks
go to anonymous referees for their valuable comments. Any remaining errors and
omissions are entirely my own.

ISSNs: 1923-7529; 1923-8401 © 2014 Academic Research Centre of Canada
~ 88 ~
References
[1] Aquino, A. (1978). “Intra-industry trade and inter-industry specialization as concurrent sources
of international trade in manufactures”, Weltwirtschaftliches Archiv, 114: 275-296.
[2] Bano, S. (1991). Intra-industry international trade: The Canadian experience. Avebury
Academic Publishing Company U.K.
[3] Bhagwati, J. (1964). “The pure theory of international trade: a survey”, The Economic Journal,
74(293): 1-84.
[4] Brown, A. J. (1947). Applied Economics: Aspects of the World Economy in War and Peace.
London: George Allen and Urwin.
[5] Fan Ying (2005). “On the Prospect of the China-New Zealand Free Trade Areas”, China
Foreign Affairs Review, 83(5): 84-91.
[6] Garnaut, R. and Drysdale, P. (1994). “Trade intensities and the analysis of bilateral trade flows
in a many-country world: A survey in Asia-Pacific regionalism”, Readings in International
Economic Relation.
[7] Grubel, H.G. and Lloyd, P. J. (1975). Intra Industry Trade: The theory and Measurement of Inter-
national Trade in Differentiated Products. London: Macmillan.
[8] International Monetary Fund (2013a). Economic Outlook Database. Washington D.C.:
International Monetary Fund.
[9] International Monetary Fund (2013b). Direction of Trade Statistics Yearbook. Washington, DC:
International Monetary Fund. Various Issues.
[10] Kojima, K. (1964). “The pattern of international trade among advanced countries”, Hitotsuboshi
Journal of Economics, 5 (1): 16-36.
[11] Krugman, P. R. (1980). “Scale economies, product differentiation, and the patterns of trade”,
American Economic Review, 70(5): 950-959.
[12] Linder, S.B. (1961). An essay on trade and transformation. New York: Wiley.
[13] Lloyd, P. J. and Grubel, H.G. (Eds) (2003). Intra-industry Trade. Cheltenham: Edward Elgar
Publishing Limited.
[14] Lloyd, P.J and Lee, H.H. (Eds) (2002). Frontiers of Research in Intra-industry Trade. London:
Palgrave Macmillan.
[15] New Zealand Institute of Economic Research (2005). “A quantitative description of the
Chinese economy, 1960-2004”, NZIER Working Paper 2005/03.
[16] New Zealand Ministry of Foreign Affairs and Trade (MFAT) (2004). “A joint study report on a
free trade agreement between China and New Zealand”, [Online] Available at: www.mfat.
govt.nz.
[17] New Zealand Ministry of Foreign Affairs and Trade. (MFAT) (2010). “Frequently asked
questions about the NZ-China FTA’, [Online] Available at: http://www.chinafta.govt.nz/5-
FAQ/index.php 74.
[18] Ratnayaka, P. (2004). “Lost Opportunities: Sri Lanka’s Economic Relationship with Japan”,
Karunaratne & Sons Ltd. Sri Lanka.
[19] Sandrey, R. and Grinsted, H. (2008). “China and New Zealand: an assessment of the recent
FTA agreement”. Tralac Working Paper No 5. [Online] Available at: www.tralac.co.za.

Review of Economics & Finance
~ 89 ~
[20] Tan, H. and Cai L. (2010). “Quantitative analysis on the impact of China-New Zealand FTA on
both sides’ economies”, International Review of Business Research Papers, 6(6): 132 –140.
[21] Tharakan, K.P.M. (1983). “The economics of intra-industry trade: A survey”, In: P.K.M. Tharakan
(Eds.), Intra-Industry Trade: Empirical and Methodological Aspects. North Holland.
[22] UN Comtrade (2012). “United Nations Commodity Trade Statistics database”, [Online]
Available at: http://comtrade.un.org/db/default.aspx.
[23] UN Comtrade (2013). “United Nations Commodity Trade Statistics database”, [Online]
Available at: http://comtrade.un.org/db/default.aspx.
[24] United Nations Economic and Social Commission for Asia and the Pacific. (2010). “Trade
Intensity Index”, [Online] Available at: http://www.unescap.org/tid/aptiad/index_trdi1_
fm.aspx (September 5, 2010).
[25] Verdoorn, P.J. (1960). “The Intra-Block Trade of Benelux”, In: Lloyd, P.J. and Grubel, H.G
(Eds.), (2003), Intra-Industry Trade. Cheltenham: Edward Elgar Publishing Limited.
[26] Viner, J. (1950). The Customs Union Issues, New York: Carnegie Endowment for International
Peace.
[27] Wadhva, C.D. and Asher, M.G. (1985). ASEAN-South Asia economic relations. Singapore:
Institute of Southeast Asian Studies.
[28] World Bank Group (2009). “International economics and trade – Data and Statistics”, [Online]
Available at: http://go.worldbank.org/99WXGD6KJ0 (September 2, 2010).
[29] World Bank (2012). “World Development Indicators”, [Online] Available at: http://data.wrold
bank.org/data-catalog/world-development-indicators.
[30] World Trade Organization (Various years). Annual reports and press releases: 1999-2013.
[31] Zhang, H and Ying, N. (2008). “Goods trade between China and New Zealand: Development
and prospect”, Journal of International Trade, 9(9): 52-57.
[32] Zhu, Y. (2006). “Discussion on the economic effects of the free trade area between China and
New Zealand”, Journal of International Business, 3(3): 49-53.

ISSNs: 1923-7529; 1923-8401 © 2014 Academic Research Centre of Canada
~ 90 ~
Table 1. New Zealand Intra-Industry Trade (IIT) with China by Industry,
High and Low IIT Side by Side, 1990 and 2012
1990 2012
SITC Description IITBi SITC Description IITBi
High IITBi High IITBi
061 sugars, molasses, and honey 75.6 061 sugars, molasses, and honey 98.5
Low IITBi Low IITBi
058 fruit preserved, and fruit
preparations
1.0 024 cheese and curd 0.0
Low IITBi Low IITBi
112 alcoholic beverages 22.8 111 Non-alcoholic beverages, n.e.s. 39.3
112 alcoholic beverages 7.6
High IITBi High IITBi
278 crude minerals, n.e.s. 60.3 292 crude vegetable materials, n.e.s. 98.9
Low IITBi Low IITBi
211 hides and skins (except furskins),
raw
5.0 287 ores and concentrates of base metals,
n.e.s.
15.3
268 wool and other animal hair
(including wool tops)
2.9 248 wood, simply worked and railway
sleepers of wood
4.5
High IITBi High IITBi
592 starches, inulin and wheat gluten;
albuminoidal substances; glues
51.3 542 medicaments (including veterinary
medicaments)
63.6
Low IITBi Low IITBi
541 medicinal and pharmaceutical
products, other than medicaments
(of group 542)
17.9 554 soap, cleansing and polishing
preparations
3.4
554 soap, cleansing and polishing
preparations
6.1 581 tubes, pipes and hoses of plastics 1.9
593 explosives and pyrotechnic
products
4.1 531 synthetic organic coloring matter and
color lakes and preparations based
thereon
1.7
575 plastics, n.e.s., in primary forms 3.2 551 essential oils, perfume and flavor
materials
1.5
553 perfumery, cosmetics, or toilet
preparations, excluding soaps
2.3 553 perfumery, cosmetics, or toilet
preparations, excluding soaps
1.3
High IITBi High IITBi
693 wire products (excluding
insulated electrical wiring) and
fencing grills
85.3 613 furskins, tanned or dressed 44.2
Low IITBi Low IITBi
611 leather 8.3 658 made-up articles, wholly or chiefly of
textile materials, n.e.s.
0.7
651 textile yarn 7.5 662 clay construction materials and
refractory construction materials
0.4
641
699
paper and paperboard
manufactures of base metal, n.e.s.
4.7
3.6
665
679
glassware
iron and steel tubes, pipes and hollow
0.4
0.3

Review of Economics & Finance
~ 91 ~
profiles, fittings for tubes and pipes
High IITBi High IITBi
724 textile and leather machinery, and
parts thereof, n.e.s.
94.9 776 thermionic, cold cathode or
photocathode valve
99.4
771 electric power machinery 85.0 733 machine tools for working metal,
sintered metal carbides or cermets
86.0
742 pumps for liquids 76.3 728 machinery and equipment specialized
for particular industries
56.7
741 heating and cooling equipment 63.1 718 power generating machinery and parts
thereof, n.e.s.
51.0
Low IITBi Low IITBi
745 nonelectrical machinery, tools
and mechanical apparatus
30.2 764 telecommunications equipment 1.1
751 office machines 14.4 785 motorcycles 0.5
759 parts and accessories 8.9 752 automatic data processing machines
and units thereof
0.4
728 machinery and equipment
specialized for particular
industries
7.3 761 tv receivers 0.2
778 electrical machinery and
apparatus, n.e.s.
3.6 775 household type electrical and
nonelectrical equipment, n.e.s.
0.2
752 automatic data processing
machines and units thereof
1.4 751 office machines 0.2
High IITBi High IITBi
872 instruments and appliances 94.6
896 works of art, collectors' pieces and
antiques
90.1
Low IITBi
Low IITBi
874 Measuring, Checking, Analysing
and Controlling Instruments and
Apparatus, N.E.S.
35.8 874 Measuring, Checking, Analysing And
Controlling Instruments And Apparatus,
N.E.S.
25.0
873
Meters And Counters, N.E.S.
26.7 896 Works Of Art, Collectors' Pieces And
Antiques
24.0
898 Musical Instruments 5.4 873 Meters And Counters, N.E.S. 19.0
844 Women’s Or Girls' Coats, Capes,
Jackets, Suits, Trousers, Dresses,
Underwear, Etc.
3.7 891
Arms And Ammunition
14.0
892 Printed Matter 0.9 893 Articles, N.E.S. Of Plastics 4.0
841 Men’s Or Boys' Coats, Jackets,
Suits, Trousers, Shirts, Underwear
Etc.
0.8 848
Articles Of Apparel And Clothing
Accessories
2.0
842 Women’s Or Girls' Coats, Capes,
Jackets, Suits, Trousers, Dresses,
Skirts, Underwear, Etc.
0.6 899 Miscellaneous Manufactured Articles,
N.E.S.
2.0

ISSNs: 1923-7529; 1923-8401 © 2014 Academic Research Centre of Canada
~ 92 ~
Table 2. NZ-China IIT by Industry 3-Digit Summary Values in 2012
Industry Av-IITB Av-IITC Av-
IITQ
0 Food and Live Animals 3.8 43.1 18.4
1 Beverage and Tobacco 11.5 38.6 25.9
2 Crude materials inedible except fuels 1.8 32.6 13.2
3 Mineral Fuels Lubricants and related materials 0.0 0.0 0.0
4 Animal and Vegetable Oils and fats 2.8 22.3 12.2
5 Chemicals 8.0 15.0 12.4
6 Manufactured Goods Classified chiefly by materials 10.2 67.8 23.8
7 Machinery and Transport equipment 6.8 99.9 26.7
8 Miscellaneous Manufactured Articles 2.3 100.0 29.4
9 Commodities and Transactions not classified 63.2 100.0 100.0
Table 3. NZ-China IIT by Industry 3-Digit Summary Values 2000
Industry Av-IITB Av-IITC Av-
IITQ
0 Food and Live Animals 20.15 50.67 23.52
1 Beverage and Tobacco 85.27 100.00 93.91
2 Crude materials inedible except fuels 6.68 24.87 11.44
5 Chemicals 7.69 7.84 7.73
6 Manufactured Goods Classified chiefly by materials 6.58 9.92 6.39
7 Machinery and Transport equipment 13.31 94.71 37.90
8 Miscellaneous Manufactured Articles 0.48 98.52 28.96
Table 4. NZ-China IIT by Industry 3-Digit Summary Values 1990
Industry Av-IITB Av-IITC Av-
IITQ
0 Food and Live Animals 15.66 77.65 16.99
1 Beverage and Tobacco 23.73 100.00 100.00
2 Crude materials inedible except fuels 5.78 62.36 28.94
5 Chemicals 31.24 40.13 37.78
6 Manufactured Goods Classified chiefly by materials 15.93 25.00 15.63
7 Machinery and Transport equipment 42.48 46.42 40.16
8 Miscellaneous Manufactured Articles 1.08 50.00 22.89
Data Sources: UN ComTrade Database; Author’s Calculations