trader's organizer v4 manual b01 - alexander elder€™s organizer v3 6 cash balance...
TRANSCRIPT

TheTrader’sOrganizerv4Standard Version 4.0-030
A record-keeping tool fordisciplined traders
Thank you for purchasing this Trader’s Organizer v4. It was developed in 2004 by Dr. AlexanderElder, the author of COME INTO MY TRADING ROOM, and Mike McMahon, a programmer.
This disk is designed for use with Excel. You must have Microsoft Excel2000 or newer.
This Manual and CD are Copyright © 2004, 2005, 2006 Financial TradingInc. and Mike McMahon. All rights reserved. Violators will be prosecuted.
This manual is provided in Microsoft WORD® and HTML formats, showing screen samplesexactly as you will see them on your computer. To view an HTML file, you need to use your webbrowser. You can work with this manual displayed on your screen or print it out.
For Technical Support E-mail [email protected] the Trader’s Organizer version number, your operating system & Excelversion, problem description and your name and contact information. SeeAppendix C for details.

Trader’s Organizer v3 2 www.elder.com
Table of Contents
1. Welcome.................................................................................................................................................. 5
1.1. What’s New in Version 4.0.......................................................................................................... 5
2. Organizer Setup and Initialization....................................................................................................... 7
2.1. Installing TO and Organizing Folders ......................................................................................... 7
2.2. Getting Excel Ready for the Trader’s Organizer v4.................................................................... 7
2.2.1. Enabling Macros in Excel ........................................................................................................... 7
2.2.2. Excel Add-Ins.............................................................................................................................. 7
2.3. How to Initialize, Upgrade, and Rollover Organizer Files........................................................... 8
2.3.1. How to Initialize a New TO v4 Account File................................................................................ 8
2.3.2. Upgrading Version 3 to Version 4............................................................................................. 11
2.3.3. Rolling Over to the New Year ................................................................................................... 12
2.4. BACKUPS! BACKUPS! BACKUPS! ..................................................................................... 13
3. Record Keeping and Money Management......................................................................................15
3.1. Record Keeping ........................................................................................................................ 15
3.2. Money Management Rules....................................................................................................... 15
3.3. Stops - Theoretical and Real Risks .......................................................................................... 16
4. Important TO v4 Topics for You to Understand.............................................................................17
4.1. Cash Balance vs. Account Value.............................................................................................. 17
4.2. Cash Balance and Trade Costs ................................................................................................ 17
4.3. Risk Alert Changes for TO v4................................................................................................... 17
4.4. A Word about Colors and Making Changes ............................................................................. 17
5. The Trader’s Organizer v4 – A Bird’s Eye View .............................................................................19
5.1. The Trader’s Organizer v4 Sheets & Charts ............................................................................ 19
5.2. Starting Up the Trader’s Organizer v4 ...................................................................................... 20
6. The “Trades” Sheet .............................................................................................................................21
6.1. Trades Spreadsheet Layout ..................................................................................................... 21

Trader’s Organizer v3 www.elder.com3
6.1.1. Trades Sheet Header ............................................................................................................... 22
6.1.2. Trades Sheet Monthly Data Blocks .......................................................................................... 22
6.2. The Trades Sheet Header Tables ............................................................................................ 23
6.3. Trades Sheet Monthly Data Block (MDB)................................................................................. 24
6.3.1. The MDB Header Tables .......................................................................................................... 24
6.3.2. MDB Trade Records ................................................................................................................. 25
6.3.3. The MDB Footer Tables ........................................................................................................... 27
7. Trading Functions ...............................................................................................................................29
7.1. Entering a New Trade (Control-Shift-N).................................................................................... 30
7.2. Exiting a Trade (Control-Shift-X)............................................................................................... 32
7.3. Partial Exit from a Trade (Control-Shift -P) ................................................................................ 33
7.4. Delete Trade (Control-Shift-D).................................................................................................. 34
7.5. Changing Stops ........................................................................................................................ 34
7.6. End of Month Price Updates..................................................................................................... 34
7.7. Utility Functions......................................................................................................................... 34
7.7.1. Trader’s Organizer v4 Data EXPORT (Control-Shift-E) ........................................................... 34
7.7.2. Trader’s Organizer v4 Data IMPORT (Control-Shift-I).............................................................. 35
7.7.3. Display Version (Control-Shift-V) .............................................................................................. 35
8. The Expenses and Account Transactions Sheet – Version 4 .....................................................36
8.1. A Tour of the Expenses and Transactions Sheet..................................................................... 36
8.2. How to Enter Transactions and Update the Cash Balance ...................................................... 38
8.2.1. Entering the Account Transactions........................................................................................... 39
8.2.2. Computing the Totals................................................................................................................ 40
8.2.3. Correcting Errors....................................................................................................................... 41
9. The “Trade History” Sheet .................................................................................................................42
9.1. User-Supplied Trade Data ........................................................................................................ 42
9.2. Trade Performance................................................................................................................... 43
9.3. Rebuilding the Trade History Data............................................................................................ 44
10. The Equity Sheet and Financial Charts ...........................................................................................46

Trader’s Organizer v3 4 www.elder.com
10.1. Equity Sheet – Net Profits View ................................................................................................ 47
10.2. Portfolio Summary – Account Value View ................................................................................ 48
10.3. Portfolio Summary – Cash Balance View................................................................................. 49
10.4. Portfolio Summary – Cash Flow View ...................................................................................... 50
10.5. The Net Income Chart .............................................................................................................. 51
10.6. The Account Value Chart.......................................................................................................... 51
10.7. The Cash Flow Chart................................................................................................................ 52
11. The Trader’s Diary Builder.................................................................................................................54
11.1. Diary Formats ........................................................................................................................... 55
11.2. The Diary Builder Methods ....................................................................................................... 57
11.3. A Detailed Look At The Diary Builder ....................................................................................... 59
12. The Web Input Sheet – Updating Prices from the Internet...........................................................62
12.1. Step One – The Web Input Macro ............................................................................................ 63
12.2. Step Two – The Trade Update Macro ...................................................................................... 65
12.3. Web Query Initialization Problems............................................................................................ 67
13. The “SetUp” Sheet...............................................................................................................................68
Appendix A – Table of Figures..............................................................................................................................71
Appendix B – Reporting Problems and Making Suggestions.........................................................................74

Trader’s Organizer v3 www.elder.com5
TheTrader’sOrganizerVersion4.0
A record-keeping tool for disciplined traders
1. Welcome
Welcome to the Trader’s Organizer v4. It is an Excelworkbook with multiple pre-built, formatted spreadsheetsand charts. The Organizer keeps records of open and closed trades, tracks your trading performance, as well asyour account equity, and helps enforce money management rules.
The first function of the Organizer is to keep accurate records of your trading. This includes recording newlyopened trades, while ensuring that your risks do not exceed pre-set limits for any single trade or for the month.The TO continually monitors your risk levels while a trade is open, tracking any adjustments of stops. It updatesaccount balances with net profits and losses from closed trades, allowing you to monitor changes in your accountequity on a daily basis.
The Organizer calculates and displays several measures of the quality of each closed trade, helping you reviewyour performance. It maintains year-to-date averages for your performance indicators, providing summaries thatenable you to evaluate your consistency and improvement.
The Trader’s Organizer v4 tracks changes in your account equity as a result of net profits and losses as well ascash deposits and withdrawals. It shows the account cash balance and the account value (cash balance plus thevalue of open positions) on any given day. It helps you evaluate your profitability, cash flow and consistencyover time.
1.1. What’s New in Version 4.0There are new features in TO Version 3.0 that, in conjunction with The Trader’s Governor, take the recordkeeping and trade performance monitoring to a higher level of flexibility and control. These are highlighted hereand described in detail later in this Manual:
Open Positions now in the Current Month Data Block – TO v4 has changed the way theopen and closed trades are maintained in the monthly data blocks. Closed trades are stillentered in the appropriate monthly block based on the EXIT month so that the profit/loss isaccrued in that month. However, all OPEN trades, regardless of their entry month, will alwaysbe located in the CURRENT month block.
As before, when TO v4 loads into Excel, the current month block will be displayed by default –only now all open trades will be included there, in one place. When a new month is detectedfrom the date, all open trades will automatically relocate to the new current month block. Whentrades are closed, they will still be stored based on the EXIT month.
Trader’s Organizer v3 6 www.elder.com
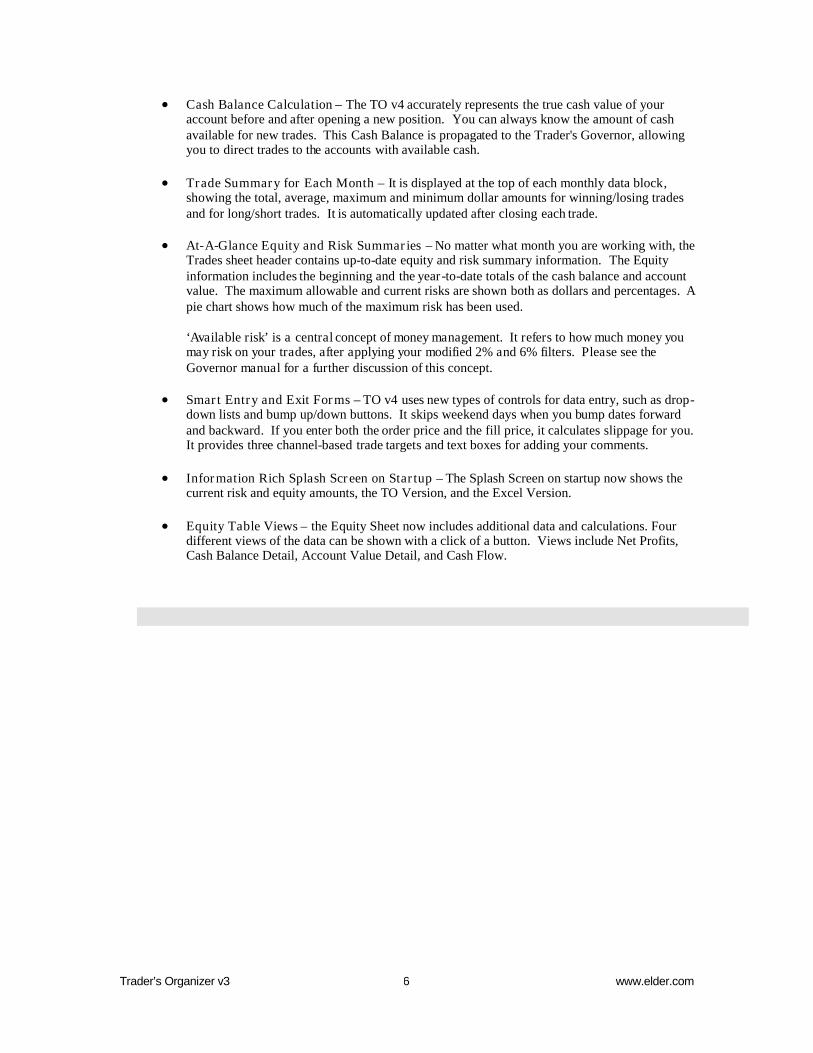
Cash Balance Calculation – The TO v4 accurately represents the true cash value of youraccount before and after opening a new position. You can always know the amount of cashavailable for new trades. This Cash Balance is propagated to the Trader's Governor, allowingyou to direct trades to the accounts with available cash.
Trade Summary for Each Month – It is displayed at the top of each monthly data block,showing the total, average, maximum and minimum dollar amounts for winning/losing tradesand for long/short trades. It is automatically updated after closing each trade.
At-A-Glance Equity and Risk Summaries – No matter what month you are working with, theTrades sheet header contains up-to-date equity and risk summary information. The Equityinformation includes the beginning and the year-to-date totals of the cash balance and accountvalue. The maximum allowable and current risks are shown both as dollars and percentages. Apie chart shows how much of the maximum risk has been used.
‘Available risk’ is a central concept of money management. It refers to how much money youmay risk on your trades, after applying your modified 2% and 6% filters. Please see theGovernor manual for a further discussion of this concept.
Smart Entry and Exit Forms – TO v4 uses new types of controls for data entry, such as drop-down lists and bump up/down buttons. It skips weekend days when you bump dates forwardand backward. If you enter both the order price and the fill price, it calculates slippage for you.It provides three channel-based trade targets and text boxes for adding your comments.
Information Rich Splash Screen on Startup – The Splash Screen on startup now shows thecurrent risk and equity amounts, the TO Version, and the Excel Version.
Equity Table Views – the Equity Sheet now includes additional data and calculations. Fourdifferent views of the data can be shown with a click of a button. Views include Net Profits,Cash Balance Detail, Account Value Detail, and Cash Flow.

Trader’s Organizer v3 www.elder.com7
2. Organizer Setup and Initialization
This section explains how to set up, initialize, and backup files for the Trader’s Organizer v4.
2.1. Installing TO and Organizing FoldersThe setup for the TO v4 is now a part of the Trader's Governor installation and setup. Please see theGetting Started Guide. You may need to initialize multiple Organizer files for several trading accounts to bemanaged by one Trader's Governor. This section explains how to initialize each individual TO v4 file.
2.2. Getting Excel Ready for the Trader’s Organizer v4You need to allow the use of Excel Macros and load one of the Excel Add-Ins, as follows:
NOTE: The Trader’s Organizer v4 is not compatible with Excel 97. If you are using Excel 97, youmust upgrade to Excel 2000, Excel 2002/XP, or Excel 2003.
2.2.1. Enabling Macros in ExcelTo use TO v4 make sure that the security level of Excel is set properly. Follow these steps:
Run Excel by clicking on the program icon, usually found in the My Programs list. You’ll seean Excel window with an empty workbook.
In Excel, click on the Tools menu and select Macro from the menu list. When the Macrosublist pops up to the right, select Security.
From the Security window, click on the Security Level tab, and you will see the choices ofHigh, Medium or Low security levels.
Select the Medium security level. This means that you will be asked to enable macros each timeyou load the Trader’s Organizer v4. The Organizer will work with either a “Medium” or“Low” setting but will not work with a “High” security setting.
Choose Medium and click OK to close the Security window and exit the Excel application.
NOTE: The TO v4 uses Excel macros, and they should be enabled. The Medium Security Levelalerts you that macros are present and allows you to disable them before loading anotherspreadsheet.
2.2.2. Excel Add-InsTO v4 uses an Excel function called “NetWorkdays” to count the number of workdays between the trade entryand exit. The Add-In file must be loaded into Excel for use by the TO v4. If you see “#NAME” displayed inthe “# Days in Trade” column on the Trade History sheet, then NetWorkdays function has not beenloaded. To load, you’ll need your original Microsoft Office or Excel CD. Follow these steps:
Run Excel by clicking on the program icon, usually found in the My Programs list. You’ll seean Excel window with an empty workbook.
Click on the Tools menu and select Add-Ins…
Check the box labeled Analysis Toolpak (Note: do not check the entry labeled “AnalysisToolpak VBA” – use the one without “VBA”).
Click OK and follow the instructions. You may be asked to load the Excel software CD fromwhich Excel will get the needed Add-In files.

Trader’s Organizer v3 8 www.elder.com
2.2.2.1. Special instructions for GERMAN-language Excel softwareThere is one function which you must replace manually because Excel does not do it automatically. Theinstructions that follow are in German. English language users please skip this chapter and go to the next one.
Klicken Sie in der Menüleiste auf "Bearbeiten" und auf "Ersetzen".
In dem Fenster "Suchen und Ersetzen" ist folgendes auszufüllen:
Suchen nach: NETWORKDAYS
Ersetzen durch: NETTOARBEITSTAGE
Suchen: Arbeitsmappe (nicht "Blatt")
Klicken Sie auf den Knopf "Alle ersetzen".
Es werden 360 Ersetzungen vorgenommen.
2.3. How to Initialize, Upgrade, and Rollover Organizer FilesDepending on whether you install TO for the first time or upgrade from the previous version (TO v3), you mayneed to perform some or all of the tasks below. If you still use the original v1, please remember, you may NOTupgrade from it directly – you must first upgrade to v3, and only then go to v4.
2.3.1. How to Initialize a New TO v4 Account FilePlease follow this procedure:

Trader’s Organizer v3 www.elder.com9
1. Run TO v4. You can either copy the file to your hard drive or run it directly from the CD.
2. When the Excel Security Warning message appears, notifying you about the presence ofmacros, click the button “Enable Macros”.
Figure 2-1 - Excel alert that the workbook being loaded contains macros.
3. TO v4 will display the Splash Screen for about 5 seconds. This is a ‘clean’ version of theSplash Screen since the account name and balances have not yet been established.
Figure 2-2 TO v4 Splash Screen during First Time Initialization
4. It will display the First Time Initialization form. Select the “New Account File” and click“OK”.

Trader’s Organizer v3 10 www.elder.com
Figure 2-3 First Time Initialization form
5. The New Account Initialization form will be displayed. Enter the following information foryour account:
a) Account Name
b) Default Commission Rate
c) Trade Year (defaults to current year)
d) Beginning Cash Balance
e) Starting Month (you can select from the drop down box or type the 2-digit month number)
f) Answer whether you have open positions
g) If you answered “Yes” to the open positions question, you will be requested to enter the totalcost of the open positions. The form will then calculate your actual beginning account value.

Trader’s Organizer v3 www.elder.com11
Figure 2-4 New Account Initialization Form
6. When the “Query Refresh” message appears, click on the “Enable Automatic Refresh” button.
Figure 2-5 Excel Query Refresh Message
7. Under the “File” menu, select the “SAVE” option to save your file.
NOTE: The TO v4 file names are ASSIGNED by the GOVERNOR when they are linked to it. YouMUST not change the assigned file name or the Governor will not be able to find the account file.
Congratulations, you are now ready to begin using Trader's Organizer v4!
2.3.2. Upgrading Version 3 to Version 4Follow these steps:

Trader’s Organizer v3 12 www.elder.com
NOTE: Version 4 does not support upgrades from Trader’s Organizer versions prior to 3.0. If youare using a version earlier than v3, you must first upgrade to v3 and then upgrade to v4.
1. Open your current account file (e.g. “TOv3 myaccount” V3.0), as you normally do in Excel.
2. Run the Export macro (Control-Shift-E) to export your data to an Organizer-formatted text file.Note the directory you specified for the export file.
3. Exit/Close your current account file in Excel.
4. Follow the procedure in the previous section 2.3.1 How to Initialize a New TO v4 Account
a) Account Name – enter the name you’ll be using for the account.
b) The Year and Starting Month should match your current file.
c) Beginning Account Balance – estimate if you don’t know your beginning balance. You’llhave the opportunity to get the exact value from the import file later.
d) Default Commission Rate, Risk per Trade, and Risk per Month – use the default values andyou will have an opportunity to update them from the import file later.
5. While your newly initialized file is loaded, execute the Import macro (Control-Shift-I) andspecify the export file from step 2 above as the import file.
6. After the import process is complete, click on the “SAVE” option under the “File” menu to saveyour file.
You have successfully completed the conversion! You can now continue to keep records using the v4 features.
2.3.3. Rolling Over to the New YearThis feature, first introduced in the TO version 2.0, helps automate the process of setting up new files for a newcalendar year.
You can reduce the amount of work and simplify this process by making sure your account balances and traderecords are up-to-date. Follow these steps to create a rollover file that the program will use to set up your accountfor the New Year:
1. Load your current year file (such as TOv3_myaccount 2004) into Excel.
2. Make any year-end updates to ensure a correct balance.
3. Create a “Rollover Export” file by executing the Rollover Export macro (Control-Shift-O [letter“oh”]). Note the directory specified for the file. Also note that the current time/date will beused as part of the filename.
4. Run an uninitialized copy of the TO v4, either from your hard drive or from the CD.
5. After you enable macros and see the splash screen you’ll see the First Time Initializationform. Select “New Year Rollover” and click “OK” to continue.

Trader’s Organizer v3 www.elder.com13
Figure 2-6 First Time Initialization Form with Rollover Selected
6. You will be prompted to select the rollover export file – select the file you created in Step 3.
7. After the rollover import is completed, click on the “SAVE” option under the “File” menu.
2.4. BACKUPS! BACKUPS! BACKUPS!Using TO v4 calls for a big investment of time and effort. You could quickly lose all your work due to acomputer crash or a disk failure – unless you have a backup. We urge you to make backups on aregularly scheduled basis and more frequently after periods of significant data entry.
There are many ways to preserve your data. Making frequent copies of your file helps overcome such problemsas hard drive errors, data corruption, and accidental erasures. The following suggestions provide adequateprotection against computer, software, and media failures.
1. Make Frequent Copies of Working Files
Whenever you use the TO v4 and enter changes, you should save a separate copy of the file onyour hard drive. This can be done by doing a “SAVE AS” from the file menu in Excel. It is agood idea to include today’s date in the file name and store all backups in a Backups folder.
Should you save a copy every time you use the Trader’s Organizer v4? Not necessarily, but askyourself – If my current file was damaged or corrupted and I had to go back to the previouscopy, would I be able to reenter the changes that I made since then? Based on the frequencyand number of changes, some people may need to make a copy only once a week, whileothers might need more than one copy a day.
2. Store Multiple Removable Copies of Working files
Copies of the working file should be stored on removable media, such as floppy disks, CDs (ifyou have a CD burner or writer), or on newer devices such as a USB storage key or “jumpdrive.” Remove copies of your files to a different location, away from the computer. Imagineliving through a fire or a major theft – you would want to have a copy at a different location. It

Trader’s Organizer v3 14 www.elder.com
is a good idea to have multiple removable copies and rotate them, using the oldest copy for thecurrent backup.
3. Store Archived and “Zipped” Copies of Export Files
Using the Export function, you can create text files containing all your user-entered data. Thesetext files can be renamed to designate the account and date and then compressed into Ziparchives for backup.
NOTE: If there is data or program corruption due to a programming error, we will repairit at no charge and, if requested, will make every effort to recover your data. If the datacorruption is caused by the user, we will make data recovery services available at a chargeto the user.
Trader’s Organizer v3 www.elder.com15
3. Record Keeping and Money Management
Keeping good records allows you to learn from your experiences, while money management helps achieve twogoals – survival and prosperity. The first priority is to survive, then to grind out steady gains, finally to makespectacular gains. Serious traders are always learning from their experiences, minimizing losses and growingequity.
3.1. Record KeepingGood records are essential for your success. Even the best trading systems are bound to have some flaws, butgood records allow you to find and correct them. With money management ensuring your survival during thelearning process, you are on your way towards becoming a successful trader. A trader who keeps detailed recordsmakes a huge leap in his or her development.
3.2. Money Management RulesA market can destroy a trader with a ‘shark bite,’ a single disastrous loss that effectively takes one out of thegame. It can also kill like a pack of piranhas, with a series of bites – none of which is lethal alone but togetherthey strip an account to the bone. Two money management rules are designed to protect you from the sharks andthe piranhas.
The 2% Rule - Limit your loss on any trade to 2% of the equity in your trading account.
Suppose you’re trading a $50,000 account. You want to buy XYZ stock, currently trading at $20. Your profittarget is $26, with a stop at $18. How many shares of XYZ you are allowed to buy?
2% of $50,000 is $1,000 – that is the maximum risk you may accept. Buying at $20 and putting a stop at $18means you’ll risk $2 per share. Dividing $1,000, the maximum acceptable risk, by the $2, your risk per share,gives you 500 shares. This is the maximum number in theory. In practice, it has to be lower because you mustpay commissions and be prepared for slippage. So, 400 rather than 500 shares represent the upper limit for thistrade.
The 6% Rule - whenever the value of your account dips 6% below its closing value at the end ofthe previous month, stop trading for the rest of this month.
When the piranhas start biting, get out of the water; do not let them nibble you to death. Do not put on any newpositions when the risk on all your open trades adds up to 6% of your account value. Stop trading when yourcumulative loss for the month reaches 6% of your account. For example, if you risk 2% per trade, you may nothave more than three positions at once. If you risk only 1% of your account equity, you may open 6 positionsbefore maxing out at the 6% limit.
In the beginning of each month recalibrate your permitted risks, so that no more than 2% of your new total equitylevel is exposed in any given trade and no more than 6% in all trades combined. Whenever you do well and thevalue of your account rises by the end of the month, the 2% and the 6% Rules allow you to trade a bigger size thefollowing month. If you do poorly and the size of your account shrinks, these rules will have you reduce yourtrading size the next month.

Trader’s Organizer v3 16 www.elder.com
TO v4 performs all the necessary risk calculations. It also rates your performance on several scales. Inconjunction with the Governor TO v4 allows you to manage risks in a portfolio, across multiple accounts. Youcan lower the 2% and 6% limits as your account grows or to reduce risks during uncertain market periods.
3.3. Stops - Theoretical and Real RisksMost risk calculations are based on measuring the distance from your entry point or current price to your stoplevel. How valid is this measurement of risk? Experienced traders know that a stock can gap across a stop level,exposing a trader to a larger loss than planned.
Such gaps are unlikely to occur in normal, quiet markets, but they can occur when the crowd panics. Panicscannot be predicted, but there are several lines of defense against the damage. First, good technical analysis helpsyou trade in the right direction. Second, you may want to risk less than 2% per trade, an easy option chosen withTO v4 and Governor. Nothing offers total certainty in trading, but stops still offer the best protection.
Trader’s Organizer v3 www.elder.com17
4. Important TO v4 Topics for You to Understand
Please read this section to help you get the maximum value from your software.
4.1. Cash Balance vs. Account ValueHow the two are calculated and how they relate to reconciling your brokerage statements.
Cash Balance and Account Values are the key numbers used by the Governor to manage equity across multipleaccounts. Cash Balance is the cash equity or purchasing power of your account – important for determining howmuch money is available in your account for new trades. Account Value includes Cash Balance plus the presentvalue of any securities held in the account – it is used to calculate risk limits per the 2% and 6% Rules.
Some transactions affect both the Cash Balance and the Account Value, while others affect only one of them.The following transactions affect both:
A closed trade with a net profit or loss
A withdrawal or deposit to the account
Service charges or expenses paid from the account
Interest income to the account
The Account Value is updated whenever the prices of open positions are changed, automatically recalculated toreflect the size, last price, and commissions/fees of any open position.
The Cash Balance is also impacted by the “trade costs” of open or closed trades (see Section 4.2 Cash Balanceand Trade Costs). The cost of an open position is deducted from the Cash Balance and the proceeds of a positionyou exited are credited to the Cash Balance.
4.2. Cash Balance and Trade CostsSince the goal of TO v4 is risk and money management and not accounting, there are some simplifications thatdiffer from standard brokerage accounting practices.
The first one is that the TO does not account for settlement dates (usually three days after the trade date) on whichfunds may actually get credited to your account. If this is critical for your accounting, then, as a workaround, youcan use the settlement date as the exit date instead of the actual exit date.
Second, the TO treats SHORT trades the same way as LONG trades – i.e. a short trade will deduct from the cashbalance on entry and credit on the exit. This allows us to avoid the complicated short/margin accounting whilestill providing an accurate number of your cash available for other trades.
4.3. Risk Alert Changes for TO v4If you’re upgrading from an earlier version, you’ll notice that this version does not have all the stoplights and riskalerts as previous versions—those are now managed in the Governor, included on the same CD.
4.4. A Word about Colors and Making ChangesTO v4 has been built with several thousand lines of macro programming to simplify data entry and to validateyour data. It was designed for maximum ease of use by both beginners and advanced users while preserving theintegrity of the data.
Excel’s ability to automatically calculate results when data is changed has been put to use so that bottom lineresults, such as account balances, risk levels, etc., are always accurate after you make any changes. The constantvalidation and ease of use, however, is a “double edged sword” – you pay for the simplicity and the ease of dataentry by giving up much of the flexibility to make your own changes in program.

Trader’s Organizer v3 18 www.elder.com
Some changes seem safe, while others appear risky. To help you stay clear of trouble we have used colors on thedata entry sheets (Trades, Trade History, and SetUp) to show you which cells you may change and whichshould be left alone. These colors are as follows:
Figure 4-1 - Colors denote which cells can or cannot be changed.
You should never change cells with light blue background. They either contain formulas, custom function calls,or are calculated by macros. There are no exceptions to this rule. Do not change any light blue cells!
Changes to the light yellow cells are allowed, but be careful because there is no error checking on those changes.Bad entries could lead to calculation errors, throwing your records into disarray – please be extra careful.
Trader’s Organizer v3 www.elder.com19
5. The Trader’s Organizer v4 – A Bird’s Eye View
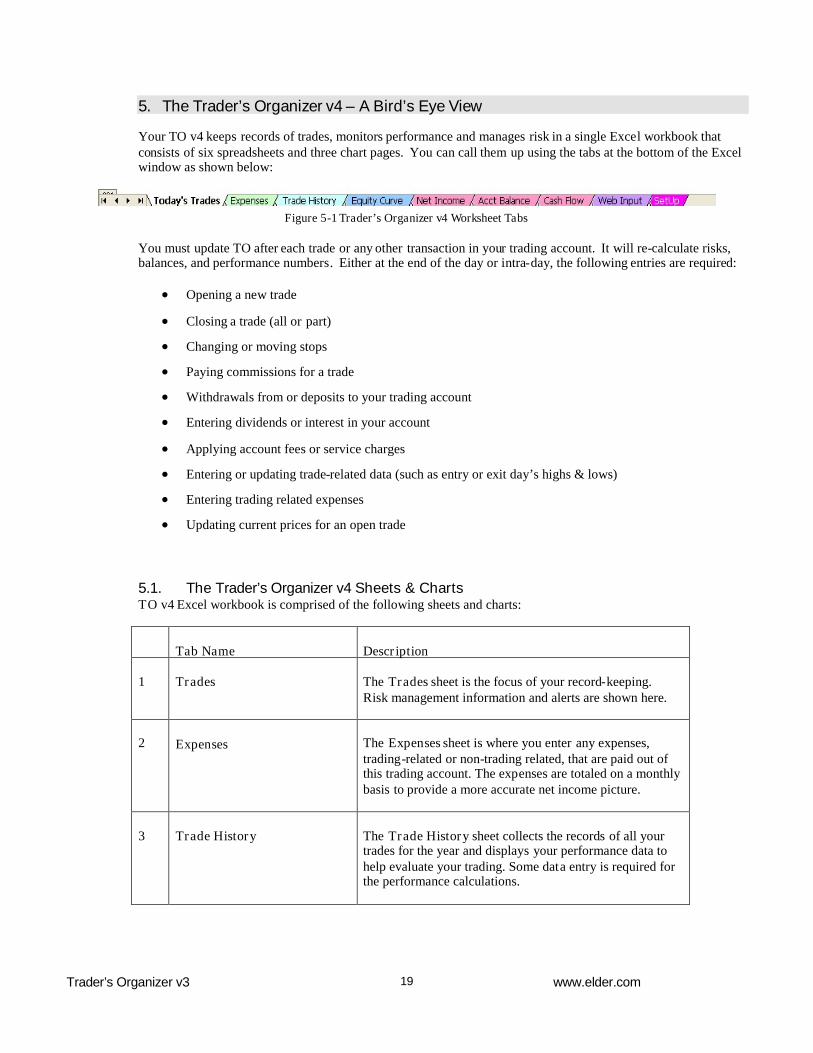
Your TO v4 keeps records of trades, monitors performance and manages risk in a single Excel workbook thatconsists of six spreadsheets and three chart pages. You can call them up using the tabs at the bottom of the Excelwindow as shown below:
Figure 5-1 Trader’s Organizer v4 Worksheet Tabs
You must update TO after each trade or any other transaction in your trading account. It will re-calculate risks,balances, and performance numbers. Either at the end of the day or intra-day, the following entries are required:
Opening a new trade
Closing a trade (all or part)
Changing or moving stops
Paying commissions for a trade
Withdrawals from or deposits to your trading account
Entering dividends or interest in your account
Applying account fees or service charges
Entering or updating trade-related data (such as entry or exit day’s highs & lows)
Entering trading related expenses
Updating current prices for an open trade
5.1. The Trader’s Organizer v4 Sheets & ChartsTO v4 Excel workbook is comprised of the following sheets and charts:
Tab Name Description
1 Trades The Trades sheet is the focus of your record-keeping.Risk management information and alerts are shown here.
2 Expenses The Expenses sheet is where you enter any expenses,trading-related or non-trading related, that are paid out ofthis trading account. The expenses are totaled on a monthlybasis to provide a more accurate net income picture.
3 Trade History The Trade History sheet collects the records of all yourtrades for the year and displays your performance data tohelp evaluate your trading. Some data entry is required forthe performance calculations.

Trader’s Organizer v3 20 www.elder.com
4 Equity Curve The Equity Curve extracts its summary from the Tradesand Expenses sheets and does not require any data entry.It has one comprehensive table which can be viewed viamacro buttons.
5 Net Income This is a pre-built chart from the Equity Curve net incometable, showing profits, expenses and net trading income. Itis automatically updated each month.
6 Account Balance This is a pre-built chart from the Equity Curve accountbalance table that shows the beginning and ending accountbalances for each month. It is automatically updated eachmonth.
7 Cash Flow This is a pre-built chart from the Equity Curve cash flowtable that shows credits, debits, and net cash flow for eachmonth. It is automatically updated each month.
8 Web Input The Web Input Sheet is used for the two-step process ofupdating prices of open positions from the Internet.
9 SetUp SetUp is primarily for internal use by the TO v4. You canuse this page to correct the beginning balance and tochange the default commission rate, but otherwise youshould not touch it.
5.2. Starting Up the Trader’s Organizer v4
Once you have set up and initialized your Trader’s Organizer v4, you will see a series of pop up windows eachtime you start it up. These windows are described in detail in the Getting Started Guide.
After TO v4 has loaded and you’ve seen all the startup screens, you should be positioned in the current month onthe Trades sheet. Now you are ready to begin record-keeping!
Trader’s Organizer v3 www.elder.com21
6. The “Trades” Sheet
The Trades sheet is at the center of your record-keeping activity. Almost all your data entry takes place here –only expenses go elsewhere. In addition to record keeping, this sheet monitors your risk and flashes alerts. Hereyou record your day-to-day activities, such as opening new trades, closing trades, adjusting stops, updatingcurrent prices, as well as cash withdrawals from and deposits to the account. The spreadsheet automaticallyrecalculates after every change, keeping account balances as well as equity and risk levels up to date. Whenevera change leads to a violation of a risk limit, it flashes an alert, prompting you to take specific defensive action.
To get the most value out of your Trader’s Organizer v4 you should update the Trades spreadsheet immediatelyafter any changes in your account, in the same order in which they occur. This ensures that your information isalways up to date, allowing you to respond immediately to risk alerts as they occur, rather than discovering afterthe fact that risk limits were violated!
The following section provides an overview of the Trades sheet and a detailed description of its layout. It alsoexplains how to enter changes and use the Trades sheet for managing risks.
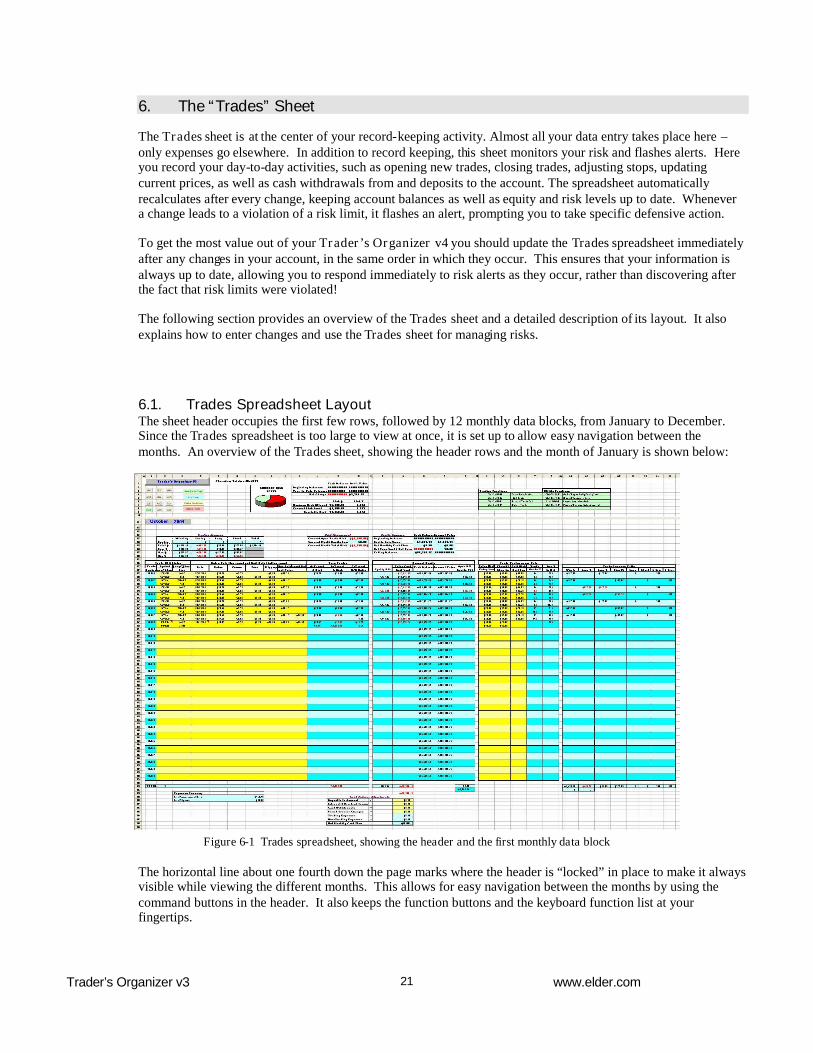
6.1. Trades Spreadsheet LayoutThe sheet header occupies the first few rows, followed by 12 monthly data blocks, from January to December.Since the Trades spreadsheet is too large to view at once, it is set up to allow easy navigation between themonths. An overview of the Trades sheet, showing the header rows and the month of January is shown below:
Figure 6-1 Trades spreadsheet, showing the header and the first monthly data block
The horizontal line about one fourth down the page marks where the header is “locked” in place to make it alwaysvisible while viewing the different months. This allows for easy navigation between the months by using thecommand buttons in the header. It also keeps the function buttons and the keyboard function list at yourfingertips.

Trader’s Organizer v3 22 www.elder.com
6.1.1. Trades Sheet HeaderThe header uses the top ten rows of the spreadsheet. It contains the sheet title, the navigation buttons, the macrobuttons, and the trading summary table and chart.
The Trades header rows are always visible when scrolling and navigating through the different months. Alongwith the monthly navigation buttons (JAN – DEC), the four most often used buttons are “New Trade Entry”,“Exit Trade”, “Partial Trade Exit”, and “Delete Trade”.
6.1.2. Trades Sheet Monthly Data BlocksBelow the header are the 12 monthly data blocks – January through December – for the current trade year. Abird’s eye view of the layout of the first 2-3 monthly data blocks is shown below. All monthly data blocks arelinked, so that the ending values for any month automatically become the beginning values for the next month.Changes made to any previous month are propagated through all successive months and reflected in the currentmonth. This allows risk calculations and account balances to carry over to successive months.
Figure 6-2 A bird's eye view of the Trades Sheet
Each monthly data block consists of the following (to be described in detail in the subsequent sections):

Trader’s Organizer v3 www.elder.com23
1. Monthly Data Block Header Section
This includes the Month Title, the Trading Summary Table, the Risk Management, and EquitySummary Table. They will be discussed in detail in the following sections.
2. Monthly Data Block Trades Section
This is the large main section featuring the trade rows. The TO v4 has two spreadsheet rows forevery trade. Alternate records are separated using two different shades of yellow and blue.
3. The Monthly Data Block Footer Section.
This section includes the “totals” row, the Expenses Summary, and the Cash BalanceAdjustments tables.
6.2. The Trades Sheet Header TablesThe header section of the Trades sheet contains the navigation buttons which allow you to go to any month with asingle click. It also contains the most frequently used macro buttons. The Account summary shows an up-to-datestatus of the equity and risk, while the risk level chart shows the level of risk.
Part 1 of the Trades Sheet Header is shown below:
Figure 6-3 Trades Spreadsheet Header Part 1
The first part of the Trades header shows the 12 monthly buttons for jumping to any Monthly Data Block with asingle click. Next to them are the 4 most commonly used trading macros for New Trade Entry, Exit Trade,Partial Exit Trade, and Delete Trade.
To the right of the buttons is the Trades Summary Table and Graph. It shows the year-to-date numbers for thecash balance and the account value and the current risk levels – both as dollars and percentages. The table showsup-to-date key information about your account equity and risk, while the graph offers an instant visual reading ofavailable risk.
Part 2 of the Trades Sheet Header shows the keystroke commands for the trading and utility functions, as follows:
Figure 6-4 Trades Sheet Header Part 2
Trader’s Organizer v3 24 www.elder.com
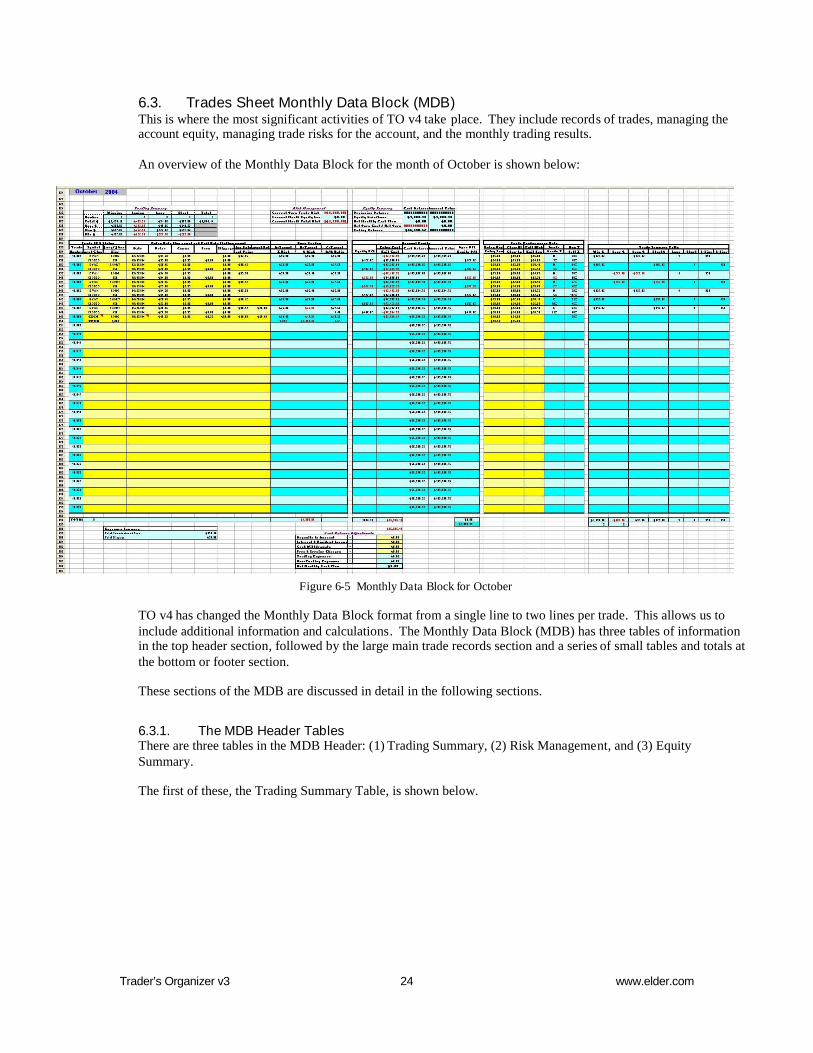
6.3. Trades Sheet Monthly Data Block (MDB)This is where the most significant activities of TO v4 take place. They include records of trades, managing theaccount equity, managing trade risks for the account, and the monthly trading results.
An overview of the Monthly Data Block for the month of October is shown below:
Figure 6-5 Monthly Data Block for October
TO v4 has changed the Monthly Data Block format from a single line to two lines per trade. This allows us toinclude additional information and calculations. The Monthly Data Block (MDB) has three tables of informationin the top header section, followed by the large main trade records section and a series of small tables and totals atthe bottom or footer section.
These sections of the MDB are discussed in detail in the following sections.
6.3.1. The MDB Header TablesThere are three tables in the MDB Header: (1) Trading Summary, (2) Risk Management, and (3) EquitySummary.
The first of these, the Trading Summary Table, is shown below.

Trader’s Organizer v3 www.elder.com25
Figure 6-6 Trading Summary Table in the Header of Each Monthly Data Block
This table provides a comprehensive summary of the trades for the month, both in terms of winning/losing andlong/short trades.
The second and third tables are shown below:
Figure 6-7 Risk Management & Equity Summary Tables in each MDB Header
The Risk Management Table shows Open Trade Risk based on entry and stop prices for open positions. Any netloss for the month is shown along with the total risk.
NOTE: Risk for all accounts is now managed by the Trader's Governor. Because of that, availablerisk is not reported by TO v4 for the account; it is only reported for the portfolio as a whole in theGovernor.
The third and last table in the MDB Header is the Equity Summary. It has two data columns – one for CashBalance and another for Account Value. The table shows the beginning and ending values and the items whichaffect the final calculation.
6.3.2. MDB Trade RecordsThe record for each trade in TO v4 uses two spreadsheet rows. The rows are divided into 4 sections: Trade data,Equity data, Performance Data, and Trade Summary Tally.
The Trade Data section is shown below:
Figure 6-8 Trade Data Section of the Trade Row
You can see in the example above that all trade numbers begin with “10” (meaning they are from the 10th monthor October). There are five trades, two of which are closed and three open.

Trader’s Organizer v3 26 www.elder.com
The TO color convention was explained in 4.4 A Word about Colors and Making Changes. The cells with ayellow background can be modified. The blue cells perform calculations and should not be touched.
The top row of each two-line record contains entry data, while the bottom row has the exit data. The onlyexception is that in the blue “Open Trades” area both top and bottom rows refer to open positions. They show theA-B-C Target values, the trade risk in both percentages and dollars, and the Reward-to-Risk ratio for that trade.If any of these values are blank, it is usually due to missing data required for the calculation. For example, theR/R Ratio is calculated by the difference between the entry price and the target price divided by the differencebetween the entry price and stop price. Thus, if the Target Price, which is optional, is not entered, then the R/RRatio cannot be calculated.
Open trades have a Ticker Symbol and the Trade status (“OPEN”) in bold for an easy identification .
There is a small red triangle in the upper right corner of the Ticker Symbol cell and the Entry Date cell for theCSCO trade. This is a standard Excel feature that tells you a comment about the trade has been entered into thatcell. There are three different comment fields used by TO v4 in the trade record as follows:
1. Ticker Symbol – this comment is the “Trade” comment used to describe the overall reasons forthe trade.
2. Entry Date – this comment is the “Entry” comment which describes entry conditions andobservations.
3. Exit Date – this comment is the “Exit” comment and highlights the reason for exiting the trade.
The next section of the Trade row (shown below) is the Account Equity section which maintains the CashBalance and the Account Value. See Section 4.1 Cash Balance vs. Account Value for explanation of how thesevalues are calculated.
The first column calculates the change in equity or the Equity P/L (profit/loss) only for closed trades. The nexttwo columns show the entry cost and exit cost for the trade and use them to adjust the account balance. Note thatthe buy side is always a negative number and the sell side a positive number and that these correlate to theEntry/Exit costs depending on whether the trade is long or short. The entry cost is always deducted from the cashbalance regardless of whether it is a positive or negative number (Also see Section 4.1 Cash Balance vs. AccountValue). Thus, every open position will reduce the cash balance by the amount of the entry trade cost.
The last two columns calculate the Account Value for each trade. The Account Value changes when there iseither an open position with an Open profit/loss or a closed position with a net gain/loss (Equity P/L). The toprow of the last column displays the OPEN P/L for the trade if the trade is OPEN, and the bottom row displays theactual Equity P/L for a CLOSED trade. The Account Equity section is shown below:
Figure 6-9 Account Equity section of the Trade Row

Trader’s Organizer v3 www.elder.com27
The next section allows you to enter the data necessary for rating your trading performance data. It calculates theTrade Grade (both the percentage value and the grade letter) and grades the quality of entries and exits. Theseperformance measures are based on the grading methods described on Page 237 of Come Into My Trading Roomby Dr. Alexander Elder.
The Entry High/Low and Exit High/Low are the High and Low prices on the Entry day and the Exit day for thattrade. The Channel High/Low values are the channel high and low on the Entry day. These values areautomatically stored if you entered them on the New Trade Entry form. If you haven’t done so, you can enterthem or edit them here at any time.
The last two columns with blue background calculate the performance numbers, if the required performance datahas been entered. The Grade column shows the “A-B-C-D” letter grade in the top row of the record and thepercentage grade in the bottom row. The Buy %/Sell % column shows the Buy % for the buy side of the trade inthe top row and the Sell % in the bottom row. The Trade Performance section is shown below:
The final section of the Trade row is the Trade Summary Tally. It is of little use to the user, but critical forcollecting the data on each trade for the Trade Summary Table in the MDB Header. The Trade Summary Tally isshown below:
Figure 6-10 Trade Summary Tally section at the end of the Trade Rows
6.3.3. The MDB Footer TablesThere are several small tables in the MDB footer area, most of which are used to calculate the data which is thendisplayed in the MDB Header tables and therefore, not significant to the user. There is, however, one table ofimportance to you in the footer – the Cash Balance Adjustments table. This table, shown below, has four lines tobe manually entered by the user, two lines automatically entered by the Expenses Sheet, and the Net MonthlyCash Flow that totals all of the above. Each line has a plus (+) or minus (-) sign, showing whether it is a credit or

Trader’s Organizer v3 28 www.elder.com
debit to the account balance. The user-entered data should be entered as a total and not as a transaction. In thefirst line for example, if you had 3 deposits during the month, you would enter the total of all deposits.
The Net Monthly Cash Flow number can be positive or negative and is added to both the Cash Balance and theAccount Value as part of their end of month calculation.
Figure 6-11 Cash Balance Adjustments Table in the MDB Footer

Trader’s Organizer v3 www.elder.com29
7. Trading Functions
This section highlights the routine activities, such as entering and exiting trades, along with the forms and macros.The TO v4 Trading forms are designed to be:
comprehensive, providing a wide range of data fields.
flexible, allowing several ways to input the data values.
simple, automatically calculating results.
visual, changing background colors to mark entry errors.
logical, grouping related data fields together.

Trader’s Organizer v3 30 www.elder.com
7.1. Entering a New Trade (Control-Shift-N)The New Trade Entry form is used to enter data for a new position after your order had been filled. It can becalled up by clicking on the “New Trade Entry” button or by the keystrokes [Control-Shift-N].
The New Trade Data Entry form appears as follows:
Figure 7-1 - Data Entry Form for Entering New Trade Data
This form is divided into two major sections – small for required data entry and large for optional data entry. Thefirst, at the top of the form, has the six required fields for an open position: Symbol, Size, Trade Type(Long/Short), Entry Price (Fill Price), Stop Price, and Entry Date. Afterwards, the trade risk in dollars andpercentages is automatically calculated and displayed in the bottom area of the Required Trade Entry box.
The ‘required’ section is followed by the Optional Trade Details section, further sub-divided into groups forcommissions/fees, price targets, trade entry rating, and comments. The first group includes the commissions,exchange fees, and slippage. If the order price is entered, then slippage will automatically be calculated from theorder price and the entry or fill price. The next group automatically calculates the “A”, “B”, and “C” price targetsafter you enter the values for Channel High and Channel Low. Double-clicking on one of the ABC targets willload that target value as the Target Price for the trade. The Trade Entry Rating is calculated in the next group,

Trader’s Organizer v3 www.elder.com31
after you enter the Entry Day’s High and Low. The final section includes two large blocks for entering text. Thefirst block is for overall comments on the trade and becomes attached as an Excel comment to the Ticker Symbolcell for the trade record. The last block is for comments relating to the trade entry.
After completing data entry click the OK button. The spreadsheet will make several validation checks and if itfinds any errors will display alert messages, asking you to correct the problems. Once the data is validated, thetrade is entered into the first blank row of the current month’s data block.
If you decide to abort the New Trade Data Entry, click on the ‘Cancel’ button and no changes will be made in thespreadsheet.

Trader’s Organizer v3 32 www.elder.com
7.2. Exiting a Trade (Control-Shift-X)You may exit at the market, by placing a limit order, or when a protective stop is hit. You can input the exit dataduring market hours or after the close. If you make several trades during the day, keying in each trade’s exit dataimmediately provides up-to-the-minute information, useful for managing subsequent trades.
To close a trade in TO v4, mark that trade by clicking on its symbol on the Trades spreadsheet. With the symbolselected, type (Control-Shift-X) [i.e. hold the Control and Shift keys down while pressing the “x” key]. This willbring up the Trade Exit Data Entry form. Alternatively, you may select the trade and then click on the Exit Tradebutton in the Trades header.
The Trade Exit Data Entry form is displayed below.
Figure 7-2 - Trade Exit Data Entry Form for exiting (closing) trades
The first section of the Exit Trade form displays the entry data for that trade, for viewing only. It is followed bythe Required Exit Data to close the trade, which includes the Date Out or Exit Date, and the Exit Price. Once therequired data has been entered, the form automatically displays the Net Gain/Loss (in dollars) for the trade andthe Trade Grade letter and Grade percentage.
The optional data is similar to the Optional Data for the Trade Entry form. The first group is the commissions,exchange fees, and slippage, followed by the Trade Exit Rating group and the Exit Comments entry box.
Trader’s Organizer v3 www.elder.com33
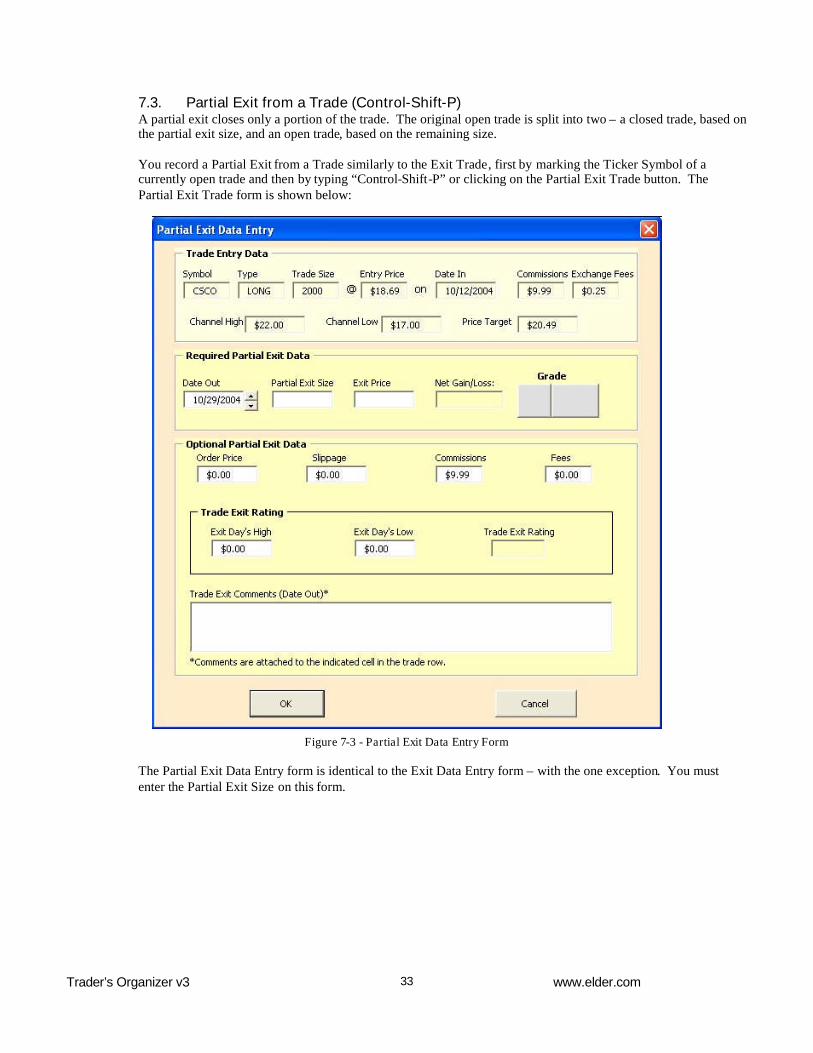
7.3. Partial Exit from a Trade (Control-Shift-P)A partial exit closes only a portion of the trade. The original open trade is split into two – a closed trade, based onthe partial exit size, and an open trade, based on the remaining size.
You record a Partial Exit from a Trade similarly to the Exit Trade, first by marking the Ticker Symbol of acurrently open trade and then by typing “Control-Shift-P” or clicking on the Partial Exit Trade button. ThePartial Exit Trade form is shown below:
Figure 7-3 - Partial Exit Data Entry Form
The Partial Exit Data Entry form is identical to the Exit Data Entry form – with the one exception. You mustenter the Partial Exit Size on this form.
Trader’s Organizer v3 34 www.elder.com
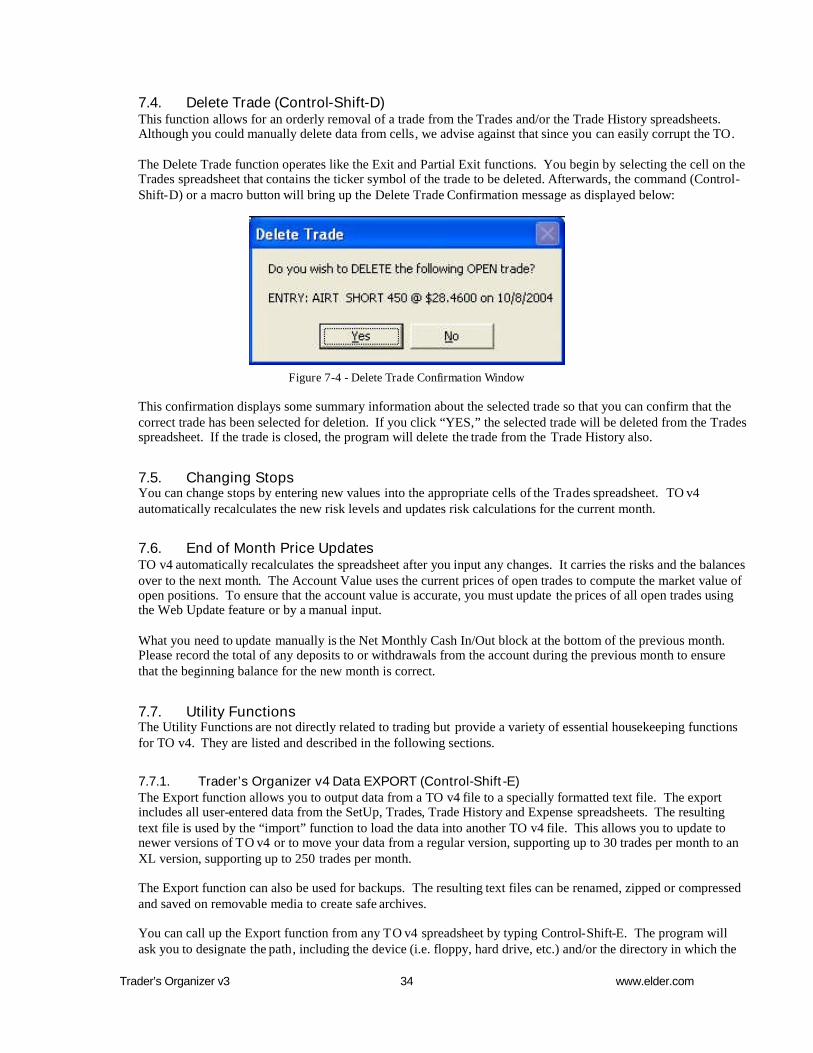
7.4. Delete Trade (Control-Shift-D)This function allows for an orderly removal of a trade from the Trades and/or the Trade History spreadsheets.Although you could manually delete data from cells, we advise against that since you can easily corrupt the TO.
The Delete Trade function operates like the Exit and Partial Exit functions. You begin by selecting the cell on theTrades spreadsheet that contains the ticker symbol of the trade to be deleted. Afterwards, the command (Control-Shift-D) or a macro button will bring up the Delete Trade Confirmation message as displayed below:
Figure 7-4 - Delete Trade Confirmation Window
This confirmation displays some summary information about the selected trade so that you can confirm that thecorrect trade has been selected for deletion. If you click “YES,” the selected trade will be deleted from the Tradesspreadsheet. If the trade is closed, the program will delete the trade from the Trade History also.
7.5. Changing StopsYou can change stops by entering new values into the appropriate cells of the Trades spreadsheet. TO v4automatically recalculates the new risk levels and updates risk calculations for the current month.
7.6. End of Month Price UpdatesTO v4 automatically recalculates the spreadsheet after you input any changes. It carries the risks and the balancesover to the next month. The Account Value uses the current prices of open trades to compute the market value ofopen positions. To ensure that the account value is accurate, you must update the prices of all open trades usingthe Web Update feature or by a manual input.
What you need to update manually is the Net Monthly Cash In/Out block at the bottom of the previous month.Please record the total of any deposits to or withdrawals from the account during the previous month to ensurethat the beginning balance for the new month is correct.
7.7. Utility FunctionsThe Utility Functions are not directly related to trading but provide a variety of essential housekeeping functionsfor TO v4. They are listed and described in the following sections.
7.7.1. Trader’s Organizer v4 Data EXPORT (Control-Shift-E)The Export function allows you to output data from a TO v4 file to a specially formatted text file. The exportincludes all user-entered data from the SetUp, Trades, Trade History and Expense spreadsheets. The resultingtext file is used by the “import” function to load the data into another TO v4 file. This allows you to update tonewer versions of TO v4 or to move your data from a regular version, supporting up to 30 trades per month to anXL version, supporting up to 250 trades per month.
The Export function can also be used for backups. The resulting text files can be renamed, zipped or compressedand saved on removable media to create safe archives.
You can call up the Export function from any TO v4 spreadsheet by typing Control-Shift-E. The program willask you to designate the path, including the device (i.e. floppy, hard drive, etc.) and/or the directory in which the
Trader’s Organizer v3 www.elder.com35
export file will be saved. The export function will create an export file in the specified directory called“TOExport30_YYYYMMDD_HHMM.txt” with the current date and time in the filename.
NOTE: TO v4 only supports Export versions 3.0 and 4.0. Previous versions are not supported. Ifyou are using a TO version prior to v3.0, you must first upgrade to version 3.0 before upgrading toversion 4.0. Please contact the office for information before upgrading to v4.
7.7.2. Trader’s Organizer v4 Data IMPORT (Control-Shift-I)The Import function reads data from TO v4 or v3 Export file and puts it into your current TO v4 file. It includesthe information on the SetUp sheet, trade data on the Trades sheet, and trade history data on the Trade Historysheet.
NOTE: You should always import data only to a new, clean or empty TO v4 file and never to yourcurrent working version. The import function will overwrite and clear the data areas – the currentfile could be left partially overwritten. You should always import to a fresh, newly initialized file.
When you type the Import Command (Control-Shift-I), a standard directory dialog box appears, allowing you todesignate the import file to be used. After selecting the file, please wait until a completion message is displayed,telling you that the import process has been completed. If there are any problems or errors, an error message willbe displayed and the import function aborted. In some cases, if there is a conflict in the data, you will be giventhe option of selecting which version of the data to use.
7.7.3. Display Version (Control-Shift-V)The Display Version command will display the same splash screen that appears whenever you load TO v4. Thissplash screen is a static display and will be visible until closed. It will show the following information:
Account Name
Current Risk level (in dollars)
Current Equity (Account Value)
Trader's Organizer Version
Current Excel Version

Trader’s Organizer v3 36 www.elder.com
8. The Expenses and Account Transactions Sheet – Version 4
A very important part of record-keeping, in addition to tracking trading performance and risk, is maintainingaccurate account balances, tracking trading-related expenses, and equity growth. The new Expenses sheet inVersion 4 allows you to do all of these.
Previous versions of the Organizer Expenses sheet allowed you to designate expenses paid from the tradingaccount as either trading-related or non-trading-related. Tracking trading-related expenses provided a moreaccurate picture of profitability in that account. Still, such transactions such as deposits, cash withdrawals,service charges, etc. had to be manually totaled and entered by category in the Cash Balance Adjustments block atthe bottom of each monthly data block on the Trades sheet. Thus, if you had multiple deposits or multiple servicecharges during the month, you had to keep track of each total separately and remember to update each entry in theCash Balance table. The new version 4 has solved that problem.
8.1. A Tour of the Expenses and Transactions SheetThe Expenses sheet has two major sections. The left side contains the title, summary table showing transactiontotals for each month, and a summary table showing the number of valid, blank, and erroneous entries. TheExpense Details on the right allows you to enter up to 400 trading account transactions per year.
An overview of the new Expenses sheet is below:
Figure 8-1 - Expense Sheet Overview
The following Figure is an example of the previous Cash Balance block. It shows four user entries and twoentries calculated by the Trader’s Organizer. (NOTE: a yellow background identifies where you must enter thedata, while the program automatically enters the data in blue areas.)

Trader’s Organizer v3 www.elder.com37
Figure 8-2 Previous Cash Balance Adjustments Block
Version 4 of the Organizer has been expanded to allow you free form entry of 6 types of account transactions onthe Expenses sheet which are automatically totaled for each month. Now you can enter account transactions asthey occur and have them immediately applied to the account balance for that month. An example below coversthe month of June. There are 8 ledger entries on the Expenses sheet for the various transactions during the month,including multiple deposits and service charges:
Figure 8-3 Sample Expenses Entry Ledger
As each transaction is entered during the month, a click on the “Compute Totals” button (located in the upper leftarea of the Expenses sheet) will (1) calculated the total of each transaction type for each month, (2) place theresults in the transaction summary table on the Expenses sheet, and (3) enter the totals for each month into theCash Balance Adjustments blocks on the Trades Sheet. The cash balance for the account will immediately reflectthe newly entered transaction. Shown below is the new Cash Balance Adjustments block (Note the blue colorindicating that there are no user entries required to this table!):
Figure 8-4 Current Cash Balance Adjustments Block
The new version 4 Expenses sheet also simplifies the reconciliation process with your brokerage statement. Youcan now more easily match all the transactions you had entered with your brokerage statement to reconcile yourbalance at the end of each month.
The figure below shows the summary tables on the left side of the Expenses sheet. At the top left corner is theTitle Block which identifies the program (“The Trader’s Organizer”) and the sheet (“Trading AccountTransactions”). The current date is shown to the right of the Title Block.
Below the Title Block is the “Compute Totals” button and the time and date on which the transaction details werelast totaled. Below the “Compute Totals” area is the Transaction Summary Table. It shows, for each month of theyear, the totals for the six transaction types and the net change per month. The Deposits and the

Trader’s Organizer v3 38 www.elder.com
Interest/Dividends are credited (added) to the cash balance of the account and all other transaction types aredebited (deducted).
Below the Transaction Summary Table is the Compute Totals Summary table. It counts the number of validatedtransactions, the number of blank entries, and the number of entries in error. The maximum number of entries isset to 400 at this time.
Figure 8-5 Expenses Summary Tables
8.2. How to Enter Transactions and Update the Cash BalanceThis procedure involves two steps. First you must enter the transaction(s) into the Expense Item Details. Next,you click the “Compute Totals” button on the Expenses sheet to complete the process by calculating the totals andstoring the results in both the Expenses and the Trades Sheets.
If you enter your account transactions, such as deposits, service charges, cash withdrawals, etc., when they occurand compute the totals, your cash balance will be up-to-date. This will greatly facilitate the reconciliation processwhen the monthly statement arrives from your brokerage house.
Trader’s Organizer v3 www.elder.com39
8.2.1.Entering the Account TransactionsYou enter transactions into the Transactions Details table on the Expenses sheet. Enter them for each tradingaccount to order to maintain the correct cash balance. You can enter transactions in any date order – it is notnecessary to enter them in the sequence in which they occured. Transactions can be entered for any month of theyear including future months; however, the transaction date must be within the trading year established for thefile. Transactions can be sorted either by the date or the amount. A valid transaction includes four items: date,description, transaction type, and amount. Those four fields are described below:
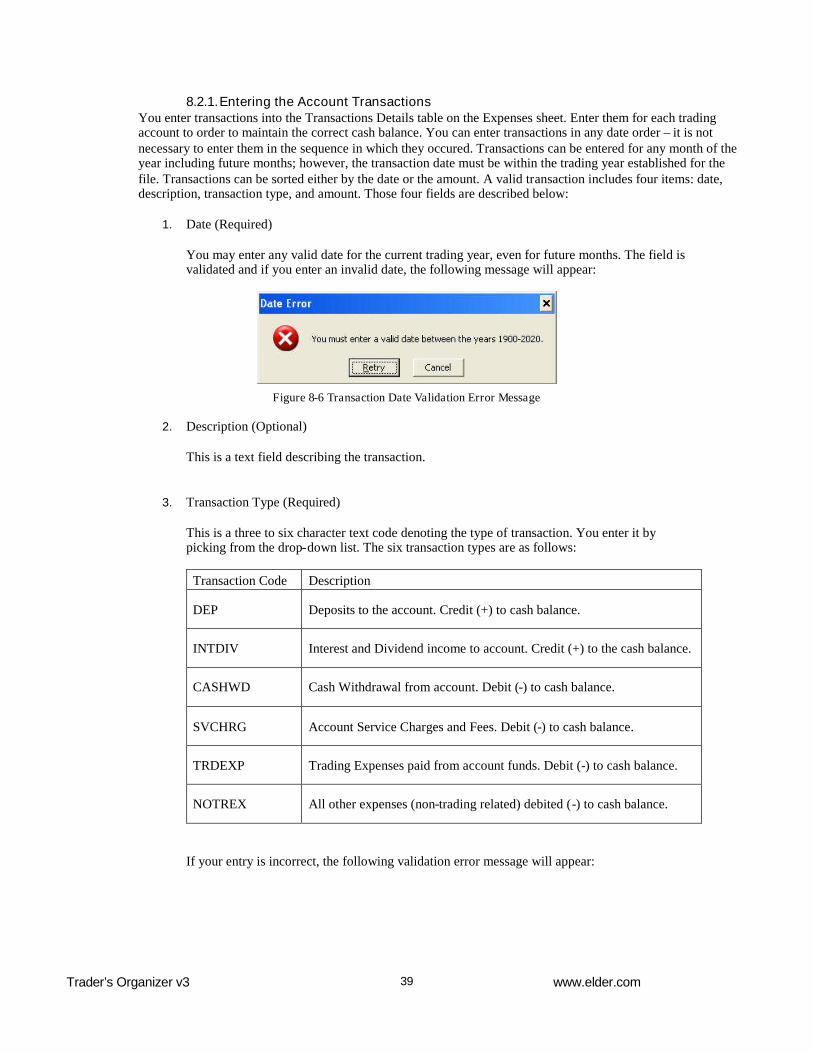
1. Date (Required)
You may enter any valid date for the current trading year, even for future months. The field isvalidated and if you enter an invalid date, the following message will appear:
Figure 8-6 Transaction Date Validation Error Message
2. Description (Optional)
This is a text field describing the transaction.
3. Transaction Type (Required)
This is a three to six character text code denoting the type of transaction. You enter it bypicking from the drop-down list. The six transaction types are as follows:
Transaction Code Description
DEP Deposits to the account. Credit (+) to cash balance.
INTDIV Interest and Dividend income to account. Credit (+) to the cash balance.
CASHWD Cash Withdrawal from account. Debit (-) to cash balance.
SVCHRG Account Service Charges and Fees. Debit (-) to cash balance.
TRDEXP Trading Expenses paid from account funds. Debit (-) to cash balance.
NOTREX All other expenses (non-trading related) debited (-) to cash balance.
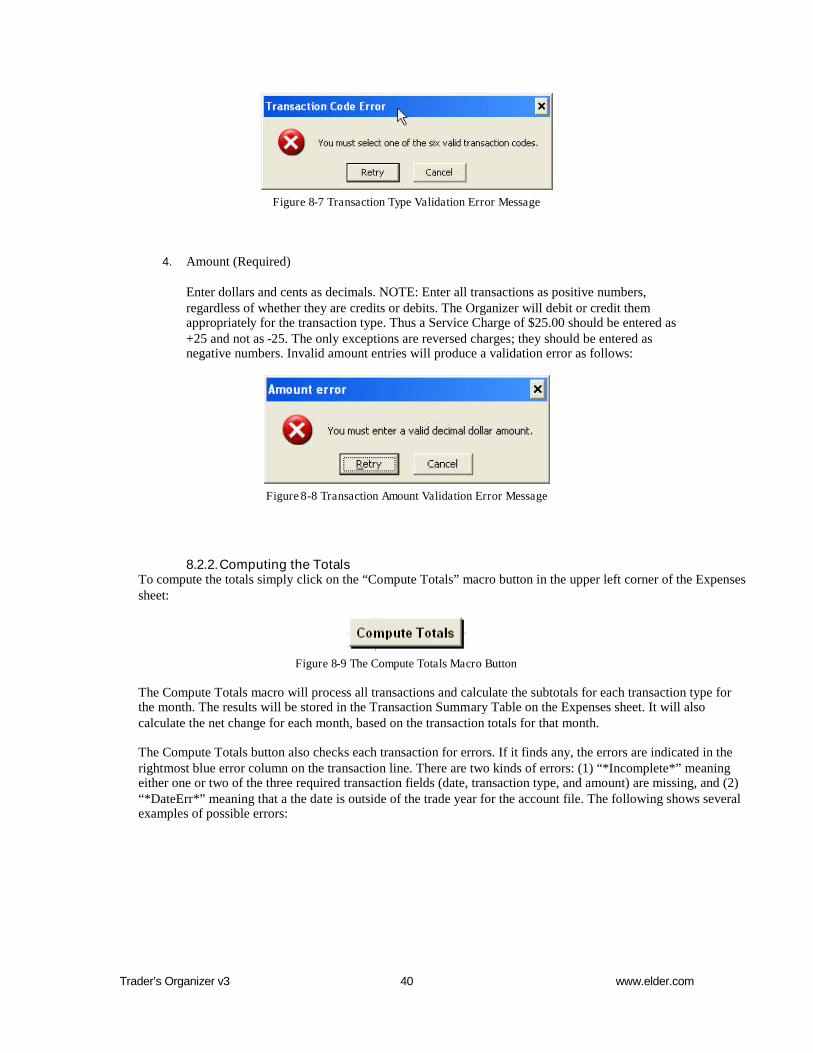
If your entry is incorrect, the following validation error message will appear:
Trader’s Organizer v3 40 www.elder.com
Figure 8-7 Transaction Type Validation Error Message
4. Amount (Required)
Enter dollars and cents as decimals. NOTE: Enter all transactions as positive numbers,regardless of whether they are credits or debits. The Organizer will debit or credit themappropriately for the transaction type. Thus a Service Charge of $25.00 should be entered as+25 and not as -25. The only exceptions are reversed charges; they should be entered asnegative numbers. Invalid amount entries will produce a validation error as follows:
Figure 8-8 Transaction Amount Validation Error Message
8.2.2.Computing the TotalsTo compute the totals simply click on the “Compute Totals” macro button in the upper left corner of the Expensessheet:
Figure 8-9 The Compute Totals Macro Button
The Compute Totals macro will process all transactions and calculate the subtotals for each transaction type forthe month. The results will be stored in the Transaction Summary Table on the Expenses sheet. It will alsocalculate the net change for each month, based on the transaction totals for that month.
The Compute Totals button also checks each transaction for errors. If it finds any, the errors are indicated in therightmost blue error column on the transaction line. There are two kinds of errors: (1) “*Incomplete*” meaningeither one or two of the three required transaction fields (date, transaction type, and amount) are missing, and (2)“*DateErr*” meaning that a the date is outside of the trade year for the account file. The following shows severalexamples of possible errors:

Trader’s Organizer v3 www.elder.com41
Figure 8-10 Examples of the types of errors from the Compute Totals macro
Line 127 is an example of a valid transaction with no errors.Lines 128, 130-131, and 133-135 are examples of “incomplete” transactions in which one or two of the requiredthree fields are empty. Since the Description field is optional, Line 129 is not marked as incomplete.Line 132 is considered a “blank” transaction entry since all three required fields are empty.Finally, note that Line 138 is considered valid even though the December 31 date is in the future – it is up to youto decide whether to take advantage of this feature.
The Compute Totals macro also stores the six transaction type subtotals for each month in the Cash BalanceAdjustments block at the bottom of each Monthly Data Block on the Trades sheet. The Net Change for the monthis applied to the month-end cash balance.
The final action of the Compute Totals macro is to store the date and time stamp in the Expenses sheet. Those areshown to the right of the Compute Totals button in the box labeled, “Totals Last Calculated on:” An example isshown below:
Figure 8-11 The Date-Time stamp for the last Compute Totals
8.2.3.Correcting ErrorsIf no transaction errors are flagged in the Error column of the Transaction Details table after the Compute Totalsmacro was run, then you are done with updating your account transactions and cash balance!
If there are any errors, please correct them. For “incomplete” errors, enter the missing information and for dateerrors, enter a date within the trade year for the account file. After correcting the errors, click once again on the“Compute Totals” button and verify that all errors have been corrected.

Trader’s Organizer v3 42 www.elder.com
9. The “Trade History” Sheet
The Trade History spreadsheet maintains the records of closed trades for the entire year. It helps you review yourperformance, using several measurements to evaluate the quality of your trades.
The Trade History spreadsheet consists of a title, the Trade History data rows, and a totals row. The figure belowshows an overview of the first several rows of this sheet:
Figure 9-1 - Overview of the Trade History Spreadsheet
The Trade History data rows contain the data from completed trades. There are 360 rows that hold a maximumof 360 trades per year (30 trades maximum per month for 12 months). These data rows are subdivided into twosections as described below:
9.1. User-Supplied Trade DataThe first group in the Trade History data row holds user-supplied data from each entry and exit. The data for thissection is yellow, indicating that the information is entered by the user and is alterable.
Note: Since the History Rebuild function builds the History from the Trades Sheet data, you shouldALWAYS make changes on the Trades Sheet rather than the History Sheet. Otherwise, data entereddirectly on the History Sheet will be lost and overwritten by the History Rebuild function.
The column headings for this group are shown below:

Trader’s Organizer v3 www.elder.com43
Figure 9-2 - User Supplied Trade Data Columns on Trade History Sheet
This is similar to the Trades spreadsheet, but since all Trade History entries are closed trades, the Trade Status,Stop Price, and Current Price columns do not apply.
9.2. Trade PerformanceThe other section of the Trade History data row has five columns of performance measurements, followed by sixcolumns of user-supplied performance data and some miscellaneous calculated and tally columns.
The column headings for the Trade Performance group are shown below:
Figure 9-3 – Calculated Trade Performance Data on Trade History Sheet
First, there is a Profit/Loss column, showing the net profit or loss on each trade after commissions and fees. Thetrade history can be sorted by clicking on the “Sort” button above the Profit/Loss column. The next threeperformance indicators –Trade Performance, Buy Performance, and Sell Performance – help review the quality ofeach trade. The Trade Performance value is calculated only if the trade is profitable. It equals the number ofpoints of net profit divided by the number of points of channel width, expressed as a percentage. For example, ifyou take two points of profit from an eight-point channel, your profit is 2 / 8 or 25% before commissions andfees. Since the calculated Trade Performance uses net profits, your final Trade Performance will be slightlylower than 25%, after deducting commissions and fees.
The Buy and Sell Performance ratings indicate the quality of your entries and exits by measuring how low youbought or how high you sold within the trade day. These calculations are automatically adjusted for longs andshorts and expressed as percentages of each trading day’s range, from 0% to 100%. Since the objective is to buylow and sell high, a score of 100% means that you bought at the low or sold at the high.
A “blank” result in any of the three performance columns means that either (1) the symbol field is blank,indicating a blank data row, or that (2) one or more data fields required for the calculation are either missing orinvalid. You must provide the data on the high and the low in order to see your performance calculations.
The Data Check column indicates any errors in the six data fields used by the performance calculations. It helpsyou fill in the missing data and to correct erroneous entries. The column displays a six-digit number, with eachdigit diagnosing an error in its associated data column. If all digits are zeroes (000000) then all data fields are OKand a blank is displayed for the data check.

Trader’s Organizer v3 44 www.elder.com
-----------Entry Day’s High Value|| ---------Entry Day’s Low Value| || | -------Exit Day’s High Value| | || | | -----Exit Day’s Low Value| | | || | | | ---Channel High Value| | | | || | | | | -Channel Low Value| | | | | |X X X X X X
This diagnostic device allows you to find errors. Each digit of the Data Check is a number from 0 to 5, meaning:
0 = Value is Good
1 = Value is Zero (error)
2 = Value is Negative (error)
3 = The High of the High/Low pair is lower than the Low Value (error)
4 = The High and Low values of the High/Low pair are equal (error)
5 = The Price is not in the range between the High and Low values (error)
Some examples...
DATA CHECK Meaning============ ===========================================001100 Exit day's High and Low values are zero020000 Entry day's Low is negative330000 Entry Day's High < Entry Day's Low000044 Channel High = Channel Low, width = 0005500 Exit Price not between Exit day's Low & High
The next seven columns of the trade performance group hold the six columns of user-supplied data for calculatingperformance ratings and the final channel-width column calculated from channel high and low on the entry day.
The final group in the Trade History data row is the Statistical Data Collection group. Its five columns collectstatistics on each trade that can be totaled and/or averaged, providing useful summary information.
The first column in this group is the Serial Number column that stamps a unique serial number for each trade.The second column computes the number of weekdays in each trade, from the entry and exit dates [Note: Failureto load the Excel Add-in for the Networkdays function will cause an invalid result to appear in this column. Seethe Installation section for instructions on loading this Add-in]. The final two columns are used for counting thetotal number of long and short trades respectively.
9.3. Rebuilding the Trade History DataThis feature allows you to rebuild the Trade History data from data records on the Trades Sheet. This isnecessary to make sure any changes made on the Trades sheet are reflected in the Trade History sheet. Be sure tomake changes on the Trades sheet (the master copy) rather than the Trade History Sheet. Execute the

Trader’s Organizer v3 www.elder.com45
Rebuild History macro, which will first clear the Trade History block and then copy all closed trades from theTrades sheet to the Trade History sheet.
This simplifies record-keeping since all corrections are done on the Trades Sheet.
When you execute the Rebuild History macro (Control-Shift-B), the following messages will confirm youractions:
Figure 9-4 - User Confirmation Message on Trade History Rebuild
The following message just alerts you that this process may take some time and requests that you not interrupt theprocess. Most computers complete the rebuild in about 30-45 seconds.
Figure 9-5 - Trade History Rebuild Wait Message
The following message confirms that the history rebuild is complete.
Figure 9-6 - Rebuild of Trade History Completed Message

Trader’s Organizer v3 46 www.elder.com
10. The Equity Sheet and Financial Charts
The TO v4 Equity Sheet consists of a long table of equity information. It holds the account equity numbers foreach month of the year.
The format of this table is similar to the Summary Sheet in the Trader's Governor. The principal difference is thatthe Gov Summary Sheet lists the data by account and the TO Equity Sheet lists the data by month.
Along the top left side of the sheet are five macro buttons. They provide different views of the Equity table byhiding/unhiding columns. The buttons have different colors and are labeled. They are as follows:
1. Unhide ALL Show all available data columns on the Equity Sheet
2. Net Profits Show trading profits, expenses, and net profits after expenses
3. Acct Value Show the beginning/ending account values with changes for each month
4. Cash Balance Show the beginning/ending cash balances for each month
5. Cash Flow Show the income/expense items relating to cash flow
Below is an overview of the TO v4 Equity Sheet.
Figure 10-1 Equity Sheet Overview
The Equity sheet table is divided into two major sections. The first part, on the left, starts with the BeginningAccount Values and Beginning Cash Balances, followed by the associated debits and credits and the subsequentEnding Cash Balances in the right-hand columns. The first part of the table is shown below:

Trader’s Organizer v3 www.elder.com47
Figure 10-2 Part 1 of the Equity Sheet
The second part of the Equity Sheet Table contains calculated values for Net Change and Percentage Change asrelated to Cash Balance, Account Value, Profits, etc.
The second part of the table appears as follows:
Figure 10-3 Part 2 of the Equity Sheet
10.1. Equity Sheet – Net Profits ViewClick on the yellow “Net Profits” button on the Summary Sheet to see trading profits, expenses and net tradingprofits for the month. This view also shows profits as a percentage of equity and expenses as a percentage ofprofits.
The Net Profits View is shown below:

Trader’s Organizer v3 48 www.elder.com
Figure 10-4 "Net Profits" View of the Equity Data
10.2. Portfolio Summary – Account Value ViewClick on the next (green) button to see the Account Value display. It shows the beginning account value, thedebits and credits, the P/L on open positions, and the ending account value. The net change is shown in dollarsand percentages.
The account value view is shown below:

Trader’s Organizer v3 www.elder.com49
Figure 10-5 "Account Value" View of the Equity Data
10.3. Portfolio Summary – Cash Balance ViewClick the blue “Cash Balance” button to see the Cash Balance view. It is similar to the Account Value view, butfocuses on cash balance rather than account value.
The Cash Balance View is shown below:
Figure 10-6 "Cash Balance" View of the Equity Data

Trader’s Organizer v3 50 www.elder.com
10.4. Portfolio Summary – Cash Flow ViewThe last of the Summary Sheet buttons brings up the Cash Flow View. It shows the details of all the credits anddebits impacting the cash flow.
The Cash Flow View is shown below:
Figure 10-7 "Cash Flow" View of the Summary Data
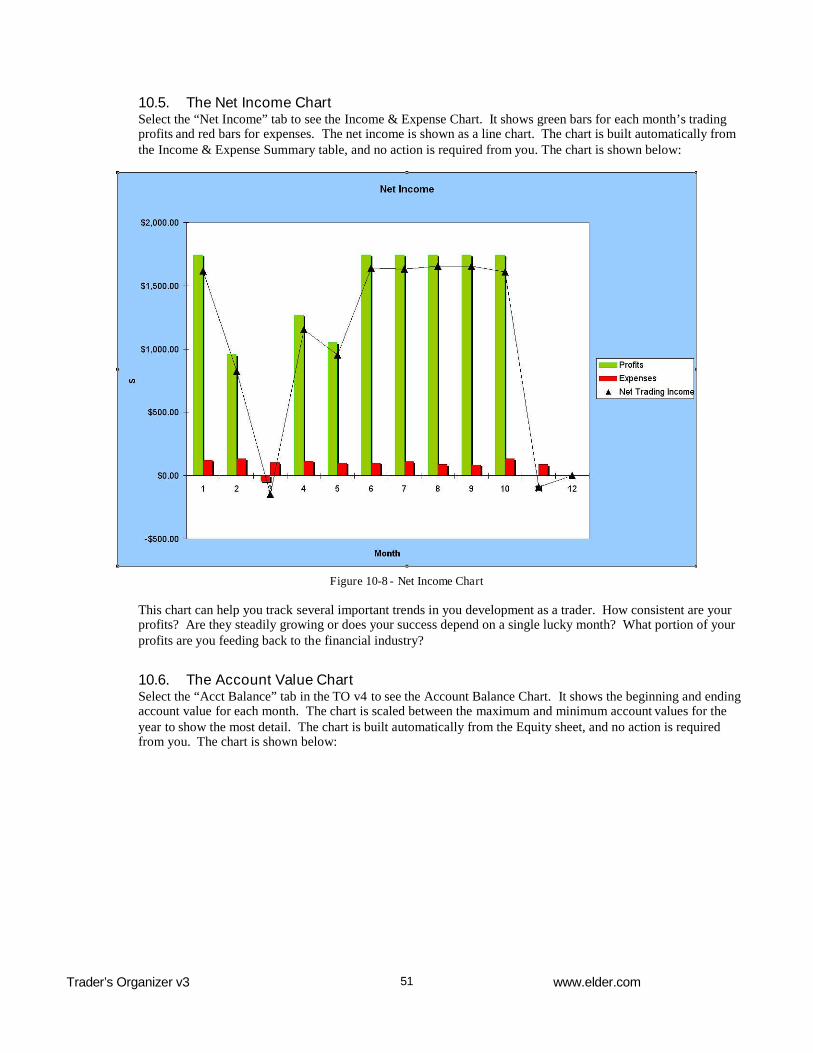
Trader’s Organizer v3 www.elder.com51
10.5. The Net Income ChartSelect the “Net Income” tab to see the Income & Expense Chart. It shows green bars for each month’s tradingprofits and red bars for expenses. The net income is shown as a line chart. The chart is built automatically fromthe Income & Expense Summary table, and no action is required from you. The chart is shown below:
Figure 10-8 - Net Income Chart
This chart can help you track several important trends in you development as a trader. How consistent are yourprofits? Are they steadily growing or does your success depend on a single lucky month? What portion of yourprofits are you feeding back to the financial industry?
10.6. The Account Value ChartSelect the “Acct Balance” tab in the TO v4 to see the Account Balance Chart. It shows the beginning and endingaccount value for each month. The chart is scaled between the maximum and minimum account values for theyear to show the most detail. The chart is built automatically from the Equity sheet, and no action is requiredfrom you. The chart is shown below:

Trader’s Organizer v3 52 www.elder.com
Figure 10-9 - Detailed Account Balance Chart
You can see at a glance whether your account balance increases, decreases, or stays about the same. The idealtrend for this chart is a steady movement from the lower left to the upper right corner.
10.7. The Cash Flow ChartSelect the “Cash Flow” tab in TO v4 to see the Cash Flow Summary Chart. It plots green bars for Credits and redbars for Debits. The Net Cash Flow is superimposed as a line chart. The chart is built automatically from theEquity sheet, and no action is required from you. The chart is shown below:

Trader’s Organizer v3 www.elder.com53
Figure 10-10 - Cash Flow Equity chart
This chart helps you keep an eye on your cash, one of the most important parameters of your long-term safety andsuccess. If your cash level is growing, you’re on the right track, otherwise you have to stop and think where youare bleeding that cash and what to do to staunch the flow.
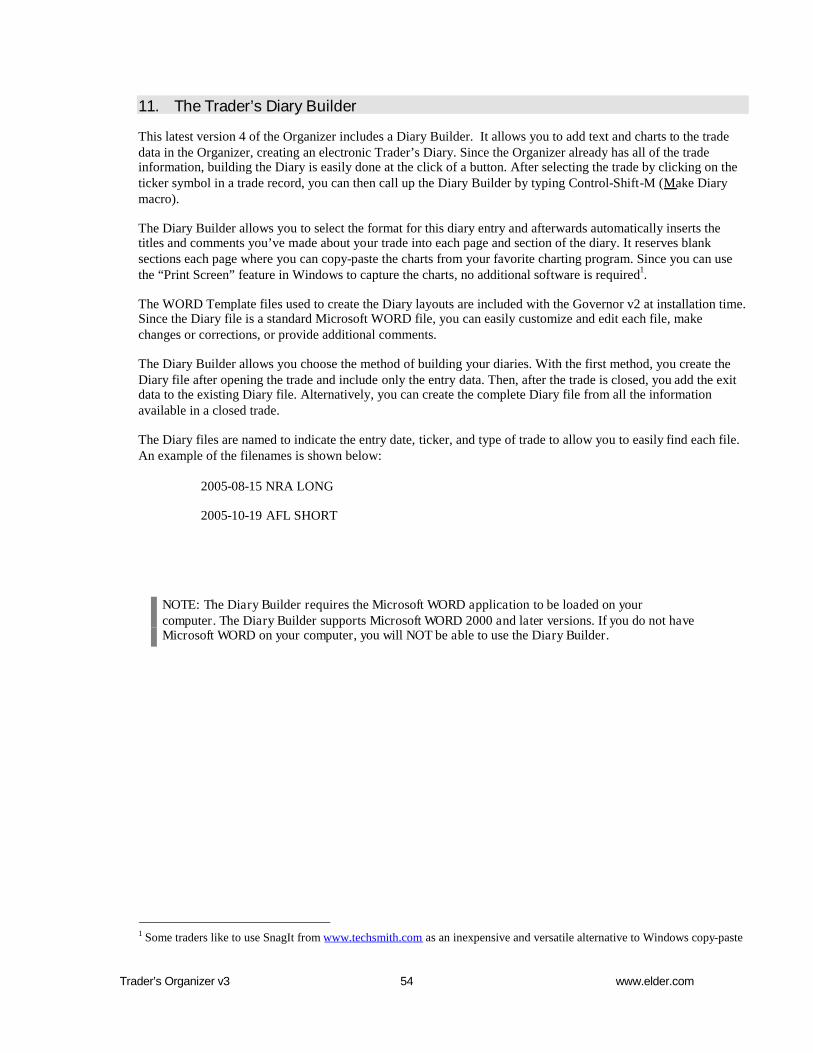
Trader’s Organizer v3 54 www.elder.com
11. The Trader’s Diary Builder
This latest version 4 of the Organizer includes a Diary Builder. It allows you to add text and charts to the tradedata in the Organizer, creating an electronic Trader’s Diary. Since the Organizer already has all of the tradeinformation, building the Diary is easily done at the click of a button. After selecting the trade by clicking on theticker symbol in a trade record, you can then call up the Diary Builder by typing Control-Shift-M (Make Diarymacro).
The Diary Builder allows you to select the format for this diary entry and afterwards automatically inserts thetitles and comments you’ve made about your trade into each page and section of the diary. It reserves blanksections each page where you can copy-paste the charts from your favorite charting program. Since you can usethe “Print Screen” feature in Windows to capture the charts, no additional software is required1.
The WORD Template files used to create the Diary layouts are included with the Governor v2 at installation time.Since the Diary file is a standard Microsoft WORD file, you can easily customize and edit each file, makechanges or corrections, or provide additional comments.
The Diary Builder allows you choose the method of building your diaries. With the first method, you create theDiary file after opening the trade and include only the entry data. Then, after the trade is closed, you add the exitdata to the existing Diary file. Alternatively, you can create the complete Diary file from all the informationavailable in a closed trade.
The Diary files are named to indicate the entry date, ticker, and type of trade to allow you to easily find each file.An example of the filenames is shown below:
2005-08-15 NRA LONG
2005-10-19 AFL SHORT
NOTE: The Diary Builder requires the Microsoft WORD application to be loaded on yourcomputer. The Diary Builder supports Microsoft WORD 2000 and later versions. If you do not haveMicrosoft WORD on your computer, you will NOT be able to use the Diary Builder.
1 Some traders like to use SnagIt from www.techsmith.com as an inexpensive and versatile alternative to Windows copy-paste
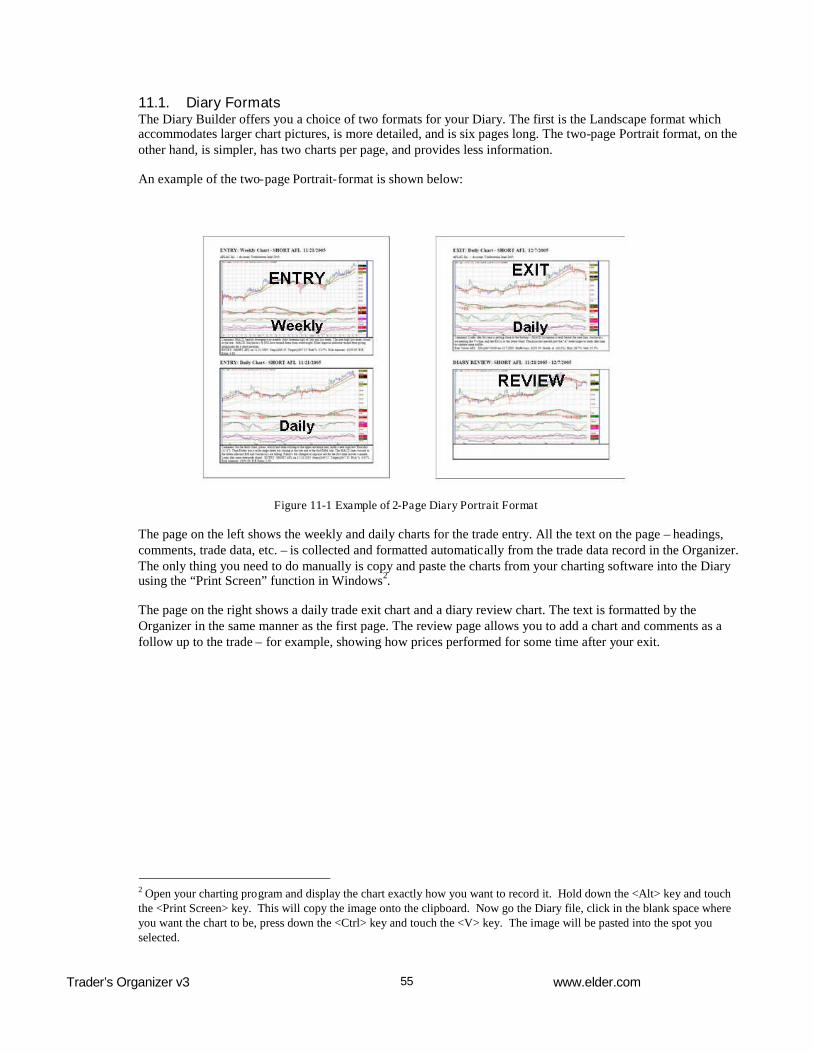
Trader’s Organizer v3 www.elder.com55
11.1. Diary FormatsThe Diary Builder offers you a choice of two formats for your Diary. The first is the Landscape format whichaccommodates larger chart pictures, is more detailed, and is six pages long. The two-page Portrait format, on theother hand, is simpler, has two charts per page, and provides less information.
An example of the two-page Portrait-format is shown below:
Figure 11-1 Example of 2-Page Diary Portrait Format
The page on the left shows the weekly and daily charts for the trade entry. All the text on the page – headings,comments, trade data, etc. – is collected and formatted automatically from the trade data record in the Organizer.The only thing you need to do manually is copy and paste the charts from your charting software into the Diaryusing the “Print Screen” function in Windows2.
The page on the right shows a daily trade exit chart and a diary review chart. The text is formatted by theOrganizer in the same manner as the first page. The review page allows you to add a chart and comments as afollow up to the trade – for example, showing how prices performed for some time after your exit.
2 Open your charting program and display the chart exactly how you want to record it. Hold down the <Alt> key and touchthe <Print Screen> key. This will copy the image onto the clipboard. Now go the Diary file, click in the blank space whereyou want the chart to be, press down the <Ctrl> key and touch the <V> key. The image will be pasted into the spot youselected.

Trader’s Organizer v3 56 www.elder.com
The following picture shows the layout of the Landscape format:
Figure 11-2 Example of the 6-Page Diary Landscape Format
Each chart takes up one page, allowing you to record more information. There are three pages for the ENTRYdata, including a weekly page, a daily page and an intraday page. There are two EXIT pages showing the dailyand intraday charts. The final page is the REVIEW page which can be filled in at a later time using an updatedchart and adding your comments and your observations about the trade..
Trader’s Organizer v3 www.elder.com57
11.2. The Diary Builder MethodsBegin by selecting a valid OPEN or CLOSED trade by clicking on a cell in the “Trades” sheet that has a tickersymbol. Type Control-Shift-M to bring up the Diary Builder form. Most of the data on that form is automaticallyfilled in from the trade data. You will need to (1) select the format (Landscape or Portrait) for the Diary file and(2) Select the build option (either the single-step process or the two-step method).
The following illustrates the two-step method:
Figure 11-3 Two Step Method for Building A Diary
To create a Diary File using the two-step method, select the “New File Entry Only Option” in the Diary Builderfor an open trade. Then, after the trade is CLOSED, run the Diary Builder again, after selecting the closed tickersymbol. This time select the “Add Exit Option” to add the Exit pages to the file. You will need to select the samefile as in the first step. The two-step method can have either the Landscape or the Portrait format.
After each step, you can go to your favorite chart program and copy its charts into the Diary File. First you openyour Diary file and click inside the blank chart window space. Then you go to the charting program and use the“ALT-Print Screen” to copy the chart. Switch back to the Diary file and paste the chart graphic. Repeat this foreach weekly, daily, or intraday page as necessary.

Trader’s Organizer v3 58 www.elder.com
The Single Step method for creating the Diary file is shown below:
Figure 11-4 One Step Process for Building A Diary
The Single Step method creates a Diary file from a closed trade by entering both the entry and the exit data intothe file. The “Create New file – Build Entry & Exit Data” option is used to complete the Diary file in a singlestep. The charts can then be added to the file to complete the Diary file, as explained above.

Trader’s Organizer v3 www.elder.com59
11.3. A Detailed Look At The Diary BuilderThe Diary Builder Form is called up by the macro keystroke Control-Shift-M (for Make Diary) appears asfollows:
Figure 11-5 - Trader's Diary Builder Form
The Diary Builder form consists of three data sections and a Diary format selector. The data sections are display-only sections of the form that show you the information that will be used in building the Diary.
The first data section displays basic trade data as follows:
Figure 11-6 - Trade Data Block on the Diary Builder Form
The Trade Data Block contains basic information about the trade, such as Ticker, Open/Closed Status,Short/Long, trade size, and account name. This information is placed on the header of each page of the Diary fileand is also used in the naming of the Diary file itself. The Trade Comment field is included at the bottomcomments section on the Entry – Weekly page. Note that the Description for the given Ticker symbol is notgrayed out and you may use it to enter the Description of the stock.

Trader’s Organizer v3 60 www.elder.com
The second data block is the Entry Data Block shown below:
Figure 11-7 - Entry Data Block on the Diary Builder Form
The entry, stop, and target prices along with the entry date and risk information are displayed in the Entry Datablock. The Trade Entry comment is also displayed. This information is put in the bottom comments section of allthree Entry pages (i.e. Weekly/Daily/Intraday).
The third data block is the Exit Data Block, shown below:
Figure 11-8 - Exit Data Block on the Diary Builder Form
The Exit Data Block contains the trade exit information and the trade performance information.
If you selected an OPEN trade, the following Diary Format Selector box will appear on the Form:
Figure 11-9 - OPEN Trade Diary Format Selection on the Diary Builder Form
For an OPEN trade, there is only one possible Diary action, which is to create the Diary file and build the EntryData on the Entry pages. For this reason, the other options are grayed out to prohibit their selection.
However, if you select a CLOSED trade, then the following Diary Format Selector box will appear:
Figure 11-10 – CLOSED Trade Diary Format Selection on the Diary Builder Form
There are two possible actions for a CLOSED trade. The first option (New File Entry/Exit: Weekly-Daily-Intraday) indicates that you want to create a new file with both Entry and Exit data for the trade. The secondoption (Add Exit to Existing File: Weekly-Daily-Intraday) indicates that a Diary file has already been created andthe Entry data included. Now you want to open the existing file and complete it with the Exit data from theCLOSED trade.

Trader’s Organizer v3 www.elder.com61
After you click the “OK” button the program checks to see whether the Stock Description field is blank (i.e. noentry). If it is blank, you will see the following query, asking whether you would like to enter the Descriptionbefore proceeding:
Figure 11-11 - Ticker Symbol Description Query
The Diary Builder will complete the building of the file and will save the file in the “Diaries” folder within yourGovernor Portfolio folder. You can load the file into Microsoft WORD and complete the diary by pasting in yourcharts as explained previously.

Trader’s Organizer v3 62 www.elder.com
12. The Web Input Sheet – Updating Prices from the Internet
TO v4 can automatically update prices of your open trades. It does that in two steps, requiring you to run twomacros using a pre-built web query from Microsoft. This feature works only for US stock market symbols andonly for the current year.
This is the procedure for updating prices from the Internet:
1. Make sure that your Trades sheet is completely up to date. If you have changed any stops orclosed any trades, make all your entries in the Trades sheet before starting the web update.
2. Run the first macro – the Web Data Input macro (Control-Shift-W).
The first macro, called “Web Data Input” (Control-Shift-W), scans the Trades sheet and creates a list ofticker symbols for all currently open trades. It uses that list to build its own Web Input List and storesthat list in the Microsoft Web Query “trigger cell,” prompting it to import the data from the Internet.
NOTE: Microsoft Web Query requires an active Internet connection. If you use a dial-upInternet connection, you must sign on before initiating the Web Input Macro. If you use ahigh-speed broadband connection, such as cable or DSL, or a network connection that isalways on, you can initiate the Web Data Input Macro at any time.
3. The Web Data Input macro will return the Web Input List – look it over to see whether there areany unrecognized ticker symbols, correct any mistakes and enter any trades you may havemissed. If you make any changes, go back and repeat Step 2 above. Otherwise, continue toStep 4 below.
4. Run the second macro – the Web Trade Update macro (Control-Shift-U).
This macro, called “Trade Data Update” (Control-Shift-U), takes the freshly obtained data from the WebInput List, validates it, and puts it into the “Current Price” cell for each open trade. Validation errors areshown in the “Trade Update Errors” column of the Web Input List.
5. Look over the Trade Update Error list to see whether you need to make any corrections. If youhave to make any, go back to Step 2 above and repeat the process. Otherwise, your update iscomplete!
An overview of the Web Input sheet is shown below:

Trader’s Organizer v3 www.elder.com63
Figure 12-1 - Overview of the Web Input Sheet
The Web Input sheet helps you manage the two-step process for updating prices from the Internet. The sheetconsists of the title and date header, the Web Input Results summary, the Web Input List, and the Trade UpdateErrors list.
12.1. Step One – The Web Input MacroOnce you have updated your Trades sheet, run the Web Data Input macro. Type “Control-Shift-W” or click onthe “Web Input” button next to the “Step 1” message. The Web Input macro verifies the trade year, since the webquery process only works for a current year file. The Web Input macro then begins scanning for open trades fromthe first month through the current month.
The Web Input List stores the ticker symbol and location code for each open trade on the Web Input sheet. Theticker symbol is also added to the ticker list for the Microsoft Web Query function. Once the Web Input macro iscomplete, a message similar to the one below will appear:

Trader’s Organizer v3 64 www.elder.com
Figure 12-2 - Step 1 Web Input Macro Scan Completion Message
This message tells you how many open trades have been found. Then, if you have an active Internet connection,you can proceed to initiate the Web Query and proceed to Step Two. If you do not have an active Internetconnection, click “Cancel” and activate your Internet connection before returning to Step One.
If no open trades are found, the following message is displayed and the Web Input Macro will not perform theWeb Query:
Figure 12-3 - "No Open Trades" message by Web Input
The Web Input List, shown below, displays the results after the Web Data Input macro has been run. Its WebInput Results summary at the top shows the count of open trades and the date/time of the last web query. TheWeb Input List stores the ticker symbol and location code for each open trade. The Trade Update Errors sectiongets cleared by Step One and filled in during Step Two.
Figure 12-4 - Web Input List Block Following Step 1 Completion
This Web Input List shows that a total of 3 open trades were found. Each location code consists of the monthnumber followed by a three-digit line number. Thus a location code of “10.003” means a trade is located in theOctober data block (“10”) on line number 3 (“.003).

Trader’s Organizer v3 www.elder.com65
TO v4 uses only the “Last” value from the table to update prices. If the query is run after market hours, the“Last” value represents the close for the day. If the query is run during market hours then the “Last” valuerepresents current prices with a 20 minute delay.
Before proceeding to Step Two, take the opportunity to make any corrections. The following corrections may beneeded at this point:
1. Open Trade Not Recognized
An open trade may not be recognized by the Web Data Input macro if any one of the followingconditions is not met:a) a valid ticker symbol with 1 to 6 characters.b) a valid Status of “OPEN”
Go to the trade line and correct any ticker/status entries that are missing or corrupted.
2. Web Query invalid symbol
When the web query returns an invalid symbol indication and/or shows “???” for the values, itmeans that the ticker symbol was not recognized. Go to the trade line on the Trades sheet,correct the ticker symbol and then re-run the Web Data Input macro.
If you make corrections in the Trades sheet for any of these reasons, you should run the Web Data Input macroagain before proceeding to Step Two.
12.2. Step Two – The Trade Update MacroStep 2 involves initiating the Trade Update macro to complete the Internet price update. This macro checks theresults from Step One and displays the following message:
Figure 12-5 - Trade Update Response Message
This message informs you of the number of open trades and the time and date of Step One. Normally Step Twois performed immediately after Step One, so you would click on the “Yes” button to proceed. If for some reasonthere was a delay between Steps One and Two, consider clicking “No” and start from Step One again.
The Trade Data Update macro validates the Web Input List line by line. If there are no errors, the macro stores an“OK” message in the Error Description column and updates the current price. If there are errors, the errormessage is stored in the Error Description column and the price is not updated.

Trader’s Organizer v3 66 www.elder.com
Trade Update Errors are described in the following table:
Message Explanation Action Cause
1 “OK – dd/mm/yy” No errors detected Internet Price saved inCurrent Price for thetrade.
n/a
2 ”Bad TickerSymbol”
The ticker symbolwas not recognizedby the web queryfunction.
No action – price notupdated.
(1) Ticker is blank(2) Ticker notrecognized byQuery(3) Ticker no longertraded
3 ”Location Error” Month and/or LineNumber problem.
No action – price notupdated.
(1) month not 1-12(2) Line number outof range for yourversion of TO
4 ”Stop violated byprice??”
The updated pricefrom the internet hasviolated the stop setfor the trade.
Internet Price saved inCurrent Price for thetrade (NOTE: youshould record an exitafter the stop was hit!)
You forgot toupdate stop price ordidn’t place stoporders as indicated.
5 ”Trade not open” The trade status nolonger shows anopen trade.
No action – price notupdated.
Trade was closedbetween executionof Step One andStep Two
Below is a sample of how the Web Input sheet might appear after completing the Trade Data Update.
Figure 12-6 - Sample Trade Data Update Results

Trader’s Organizer v3 www.elder.com67
12.3. Web Query Initialization ProblemsMicrosoft Web Query is an external feature and sometimes does not initialize correctly when Steps One and Twoare executed for the first time after loading TO v4. If this occurs, re-run Steps One and Two to clear the problem.The following note on the Web Input page alerts you to this issue:
Figure 12-7 - Note regarding intermittent web query initialization problem

Trader’s Organizer v3 68 www.elder.com
13. The “SetUp” Sheet
The SetUp sheet is primarily for internal use by TO v4. The only reason to go to this page is to correct thebeginning balance, change the default commission rate, or as a quick reference to TO v4 macros. Otherwise, donot touch it!
The SetUp sheet contains the “Preferences and Initialization Table,” the “Month Index Table,” and the “TO v4Macro List.” The following overview shows the three components of the SetUp Sheet:
Figure 13-1 - SetUp Sheet Overview
The Preferences and Initialization Table is only for internal use by TO v4. With the exception of (1) theBeginning Account Balance, and (2) the Default Commission/Fees Rate, you should never touch this table.
Changing the Beginning Account Balance on the SetUp sheet is only valid if the starting month is January.Otherwise, the beginning balance value must be changed in the “Total Cash Deposits to Account” for the monthprevious to the starting month. For example, if you wanted the balance of $100,000 to start in June, then theTrader's Organizer will set up a deposit of $100,000 in the May so that the starting June balance will be correct.
Changing the Default Commission/Fees will only apply to new trades entered after the change. Previous tradeswill not be affected.
The following Figure shows the Preferences and Initialization block of the SetUp sheet:

Trader’s Organizer v3 www.elder.com69
Figure 13-2 - SetUp Sheet Preferences and Initialization Table

Trader’s Organizer v3 70 www.elder.com
The second component of the SetUp Sheet is the Month Index Table shown below:
Figure 13-3 - Month Index Table
The Month Index Table is used internally by TO v4.
The third component of the SetUp Sheet is the TO v4 Macro List shown below:
Figure 13-4 - Trader’s Organizer v4 Macro List on the SetUp Sheet

Trader’s Organizer v3 www.elder.com71
AppendixA–Table of Figures
Figure 2-1 - Excel alert that the workbook being loaded contains macros. .............................. 9
Figure 2-2 TO v4 Splash Screen during First Time Initialization............................................... 9
Figure 2-3 First Time Initialization form ................................................................................... 10
Figure 2-4 New Account Initialization Form ............................................................................ 11
Figure 2-5 Excel Query Refresh Message.............................................................................. 11
Figure 2-6 First Time Initialization Form with Rollover Selected............................................. 13
Figure 4-1 - Colors denote which cells can or cannot be changed. ........................................ 18
Figure 5-1 Trader’s Organizer v4 Worksheet Tabs................................................................. 19
Figure 6-1 Trades spreadsheet, showing the header and the first monthly data block ......... 21
Figure 6-2 A bird's eye view of the Trades Sheet .................................................................. 22
Figure 6-3 Trades Spreadsheet Header Part 1...................................................................... 23
Figure 6-4 Trades Sheet Header Part 2.................................................................................. 23
Figure 6-5 Monthly Data Block for October............................................................................ 24
Figure 6-6 Trading Summary Table in the Header of Each Monthly Data Block ................... 25
Figure 6-7 Risk Management & Equity Summary Tables in each MDB Header ................... 25
Figure 6-8 Trade Data Section of the Trade Row.................................................................. 25
Figure 6-9 Account Equity section of the Trade Row............................................................. 26
Figure 6-10 Trade Summary Tally section at the end of the Trade Rows ............................. 27
Figure 6-11 Cash Balance Adjustments Table in the MDB Footer ........................................ 28
Figure 7-1 - Data Entry Form for Entering New Trade Data ................................................... 30
Figure 7-2 - Trade Exit Data Entry Form for exiting (closing) trades ...................................... 32
Figure 7-3 - Partial Exit Data Entry Form ................................................................................ 33
Figure 7-4 - Delete Trade Confirmation Window..................................................................... 34
Figure 8-1 - Expense Sheet Overview .................................................................................... 36
Figure 8-2 Previous Cash Balance Adjustments Block........................................................... 37
Figure 8-3 Sample Expenses Entry Ledger ............................................................................ 37
Figure 8-4 Current Cash Balance Adjustments Block............................................................. 37

Trader’s Organizer v3 72 www.elder.com
Figure 8-5 Expenses Summary Tables ................................................................................... 38
Figure 8-6 Transaction Date Validation Error Message .......................................................... 39
Figure 8-7 Transaction Type Validation Error Message.......................................................... 40
Figure 8-8 Transaction Amount Validation Error Message..................................................... 40
Figure 8-9 The Compute Totals Macro Button........................................................................ 40
Figure 8-10 Examples of the types of errors from the Compute Totals macro ....................... 41
Figure 8-11 The Date-Time stamp for the last Compute Totals.............................................. 41
Figure 9-1 - Overview of the Trade History Spreadsheet ....................................................... 42
Figure 9-2 - User Supplied Trade Data Columns on Trade History Sheet ............................. 43
Figure 9-3 – Calculated Trade Performance Data on Trade History Sheet............................ 43
Figure 9-4 - User Confirmation Message on Trade History Rebuild ....................................... 45
Figure 9-5 - Trade History Rebuild Wait Message.................................................................. 45
Figure 9-6 - Rebuild of Trade History Completed Message.................................................... 45
Figure 10-1 Equity Sheet Overview......................................................................................... 46
Figure 10-2 Part 1 of the Equity Sheet .................................................................................... 47
Figure 10-3 Part 2 of the Equity Sheet .................................................................................... 47
Figure 10-4 "Net Profits" View of the Equity Data ................................................................... 48
Figure 10-5 "Account Value" View of the Equity Data............................................................. 49
Figure 10-6 "Cash Balance" View of the Equity Data ............................................................. 49
Figure 10-7 "Cash Flow" View of the Summary Data ............................................................. 50
Figure 10-8 - Net Income Chart............................................................................................... 51
Figure 10-9 - Detailed Account Balance Chart........................................................................ 52
Figure 10-10 - Cash Flow Equity chart .................................................................................... 53
Figure 11-1 Example of 2-Page Diary Portrait Format............................................................ 55
Figure 11-2 Example of the 6-Page Diary Landscape Format................................................ 56
Figure 11-3 Two Step Method for Building A Diary................................................................. 57
Figure 11-4 One Step Process for Building A Diary................................................................ 58
Figure 11-5 - Trader's Diary Builder Form............................................................................... 59
Figure 11-6 - Trade Data Block on the Diary Builder Form..................................................... 59

Trader’s Organizer v3 www.elder.com73
Figure 11-7 - Entry Data Block on the Diary Builder Form...................................................... 60
Figure 11-8 - Exit Data Block on the Diary Builder Form ........................................................ 60
Figure 11-9 - OPEN Trade Diary Format Selection on the Diary Builder Form ...................... 60
Figure 11-10 – CLOSED Trade Diary Format Selection on the Diary Builder Form............... 60
Figure 11-11 - Ticker Symbol Description Query .................................................................... 61
Figure 12-1 - Overview of the Web Input Sheet...................................................................... 63
Figure 12-2 - Step 1 Web Input Macro Scan Completion Message........................................ 64
Figure 12-3 - "No Open Trades" message by Web Input........................................................ 64
Figure 12-4 - Web Input List Block Following Step 1 Completion........................................... 64
Figure 12-5 - Trade Update Response Message.................................................................... 65
Figure 12-6 - Sample Trade Data Update Results.................................................................. 66
Figure 12-7 - Note regarding intermittent web query initialization problem ............................ 67
Figure 13-1 - SetUp Sheet Overview ...................................................................................... 68
Figure 13-2 - SetUp Sheet Preferences and Initialization Table............................................. 69
Figure 13-3 - Month Index Table ............................................................................................. 70
Figure 13-4 - Trader’s Organizer v4 Macro List on the SetUp Sheet ................................... 70

Trader’s Organizer v3 74 www.elder.com
Appendix B– Reporting Problems and Making Suggestions
If you encounter errors in the Trader’s Organizer v4, if you think that the program functions incorrectly, or if youwish to suggest an improvement, please follow this procedure:
NOTE: Please supply ALL INFORMATION REQUESTED – otherwise, your request may bedelayed.
1. Please provide the following information:
The version number and the release date of your Trader’s Organizer v4. This isshown on the Splash screen [Control-Shift-V].
Description of the problem/suggestion. If you are reporting a problem, include any errormessages and the actions taken at the time of the problem.
Operating System (Windows 98/NT/2000/XP) and Excel version (Excel 2000, 2002/XP,2003).
Your name and contact information.
2. Submit your problem report by one of the following methods:
E-MAIL: [email protected]
FAX: (240) 331-0538
NOTE: this information is only for technical support for the Trader’s Organizer v4.For ordering or any other business issues, please contact Financial Trading Inc. at [email protected]