traffic crash facts annual report 2012 · create date: 10/7/2013 important information please read...
TRANSCRIPT

Traffic Crash Facts Annual Report
2012
10/7/2013Create Date:
1Page

10/7/2013Create Date:
Important Information Please Read
Please note while reviewing the 2012 Crash Facts Annual Report, effective 7/1/2012 Florida Statute 316.066was amended by the Florida Legislature to require all law enforcement agencies to report additional crashes tothe Department of Highway Safety and Motor Vehicles which the agencies were not previously required tosubmit. This statutory change has resulted in more crash reports being received at the state level for inclusionin this publication. These changes include the following additional requirements:
· Any complaint of pain or discomfort experience by any persons involved· All commercial motor vehicle crashes without regard to any other statutory requirement· A vehicle was rendered inoperable to a degree that required a wrecker to remove it from the scene of the
crash
While the 2012 crash data may appear to reflect an increase in crashes, the statutory change resulted in morecrash reports being received for inclusion in this publication. These changes have resulted in an increase in thenumber of reported crashes, vehicles involved and persons involved and should not be taken as an indicator of asignificant increase in crashes statewide compared to previous years.
The information contained herein represents data from crash reports (HSMV 90010S) as filed by lawenforcement agencies in the state of Florida. This information is provided to the public through a partnershipwith the Florida Department of Highway Safety and Motor Vehicles and Appriss, Inc., Division of PublicInformation Management. Please refer all inquiries to [email protected] or call 866-495-4206.
The Summary page immediately following is a snapshot of the crashes contained in the database as of closeouton 8/1/2013. All of the reports thereafter included crashes that have been received since that date prior topublishing on the Create Date listed on each table.
2Page

10/7/2013Create Date:
Florida Traffic Crash Statistics Summary
Summary Category PercentChange
3 YearAverage
2010 2011 2012
Traffic crashes 23.40% 248,266235,461 227,998 281,340
Drivers involved 39.92% 380,463338,112 334,809 468,470
Average crashes per day 23.40% 680645 625 770
Mileage Death Rate (per 100million VMT)
1.57% 1.251.25 1.25 1.27
Fatal crashes 1.85% 2,2432,261 2,214 2,255
Fatalities 1.25% 2,4242,444 2,400 2,430
Injury crashes 11.03% 124,550124,847 117,903 130,902
Injuries 9.02% 191,596195,104 181,654 198,032
Property damage only crashes 38.15% 121,760108,353 107,883 149,044
Alcohol Related/Suspectedcrashes
1.12% 17,35717,748 17,067 17,258
Alcohol Related/Suspected fatalcrashes
-2.78% 793746 828 805
Alcohol Related/Suspectedfatalities
-4.67% 863794 920 877
Alcohol Related/Suspected injurycrashes
-4.26% 7,9997,825 8,262 7,910
Alcohol Related/Suspectedinjuries
2.12% 12,01612,168 11,816 12,066
Alcohol Confirmed Crashes -1.41% 6,625N/A 10,008 9,867
Alcohol Suspected Crashes 4.70% 4,816N/A 7,059 7,391
Drug-related/Suspected crashes -9.87% 1,6761,236 1,995 1,798
Drug-related/Suspected fatalities 5.26% 165106 190 200
Drug-related/Suspected injuries -7.78% 1,316957 1,556 1,435
Pedestrian crashes 17.32% 7,1677,290 7,039 8,258
Pedestrians killed -4.83% 490499 497 473
Pedestrians injured 19.68% 7,1677,894 6,194 7,413
Bicycle crashes 28.17% 5,4544,925 5,013 6,425
Bicycle riders killed -3.33% 10476 120 116
3Page
10/7/2013Create Date:
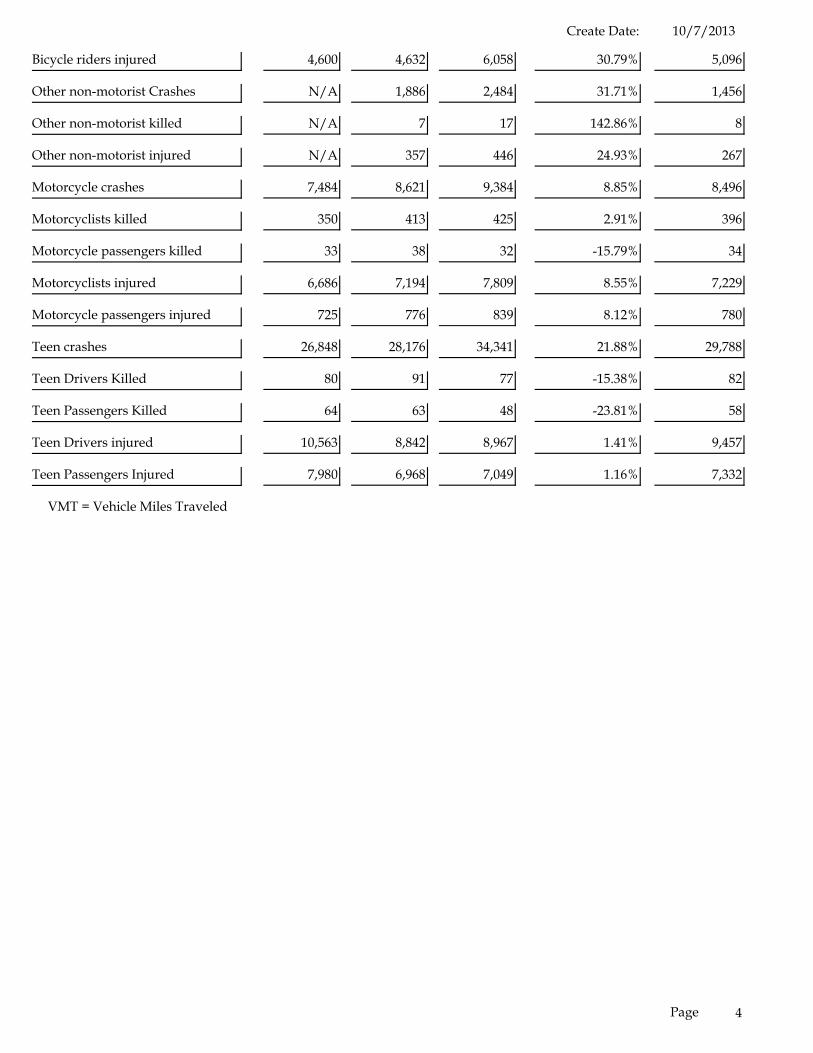
Bicycle riders injured 30.79% 5,0964,600 4,632 6,058
Other non-motorist Crashes 31.71% 1,456N/A 1,886 2,484
Other non-motorist killed 142.86% 8N/A 7 17
Other non-motorist injured 24.93% 267N/A 357 446
Motorcycle crashes 8.85% 8,4967,484 8,621 9,384
Motorcyclists killed 2.91% 396350 413 425
Motorcycle passengers killed -15.79% 3433 38 32
Motorcyclists injured 8.55% 7,2296,686 7,194 7,809
Motorcycle passengers injured 8.12% 780725 776 839
Teen crashes 21.88% 29,78826,848 28,176 34,341
Teen Drivers Killed -15.38% 8280 91 77
Teen Passengers Killed -23.81% 5864 63 48
Teen Drivers injured 1.41% 9,45710,563 8,842 8,967
Teen Passengers Injured 1.16% 7,3327,980 6,968 7,049
VMT = Vehicle Miles Traveled
4Page
10/7/2013Create Date:
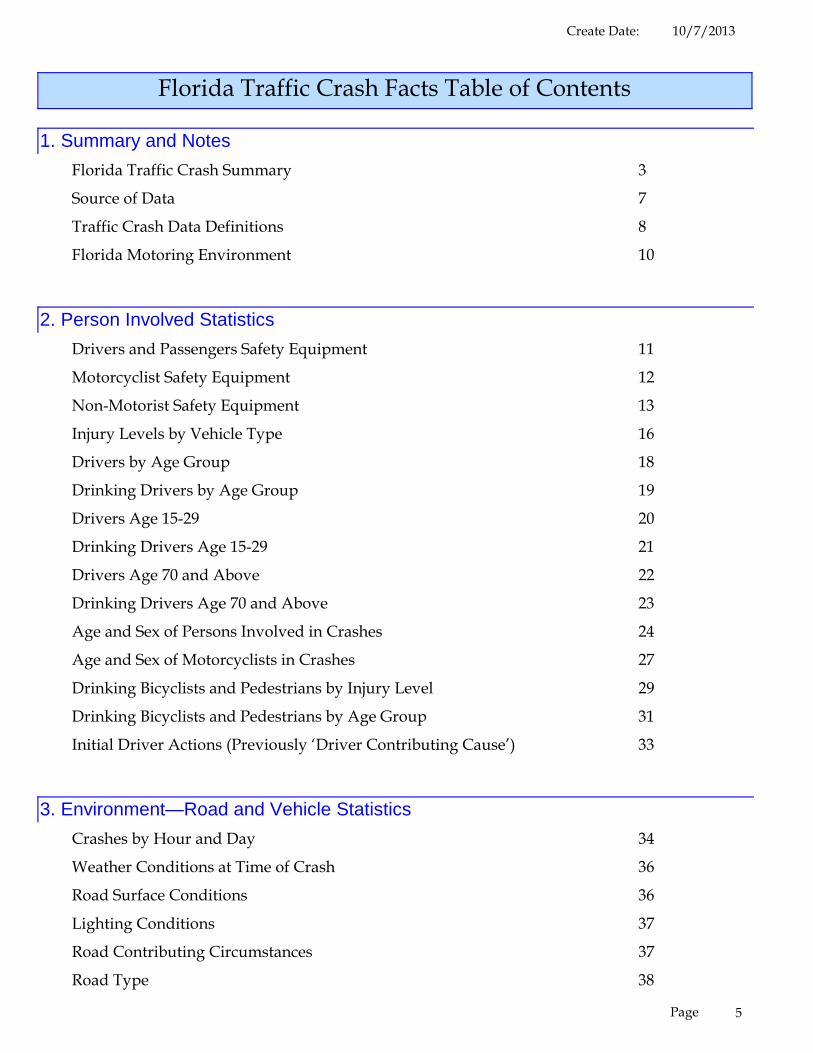
Florida Traffic Crash Facts Table of Contents
1. Summary and NotesFlorida Traffic Crash Summary 3
Source of Data 7
Traffic Crash Data Definitions 8
Florida Motoring Environment 10
2. Person Involved StatisticsDrivers and Passengers Safety Equipment 11
Motorcyclist Safety Equipment 12
Non-Motorist Safety Equipment 13
Injury Levels by Vehicle Type 16
Drivers by Age Group 18
Drinking Drivers by Age Group 19
Drivers Age 15-29 20
Drinking Drivers Age 15-29 21
Drivers Age 70 and Above 22
Drinking Drivers Age 70 and Above 23
Age and Sex of Persons Involved in Crashes 24
Age and Sex of Motorcyclists in Crashes 27
Drinking Bicyclists and Pedestrians by Injury Level 29
Drinking Bicyclists and Pedestrians by Age Group 31
Initial Driver Actions (Previously ‘Driver Contributing Cause’) 33
3. Environment—Road and Vehicle StatisticsCrashes by Hour and Day 34
Weather Conditions at Time of Crash 36
Road Surface Conditions 36
Lighting Conditions 37
Road Contributing Circumstances 37
Road Type 38
5Page
10/7/2013Create Date:
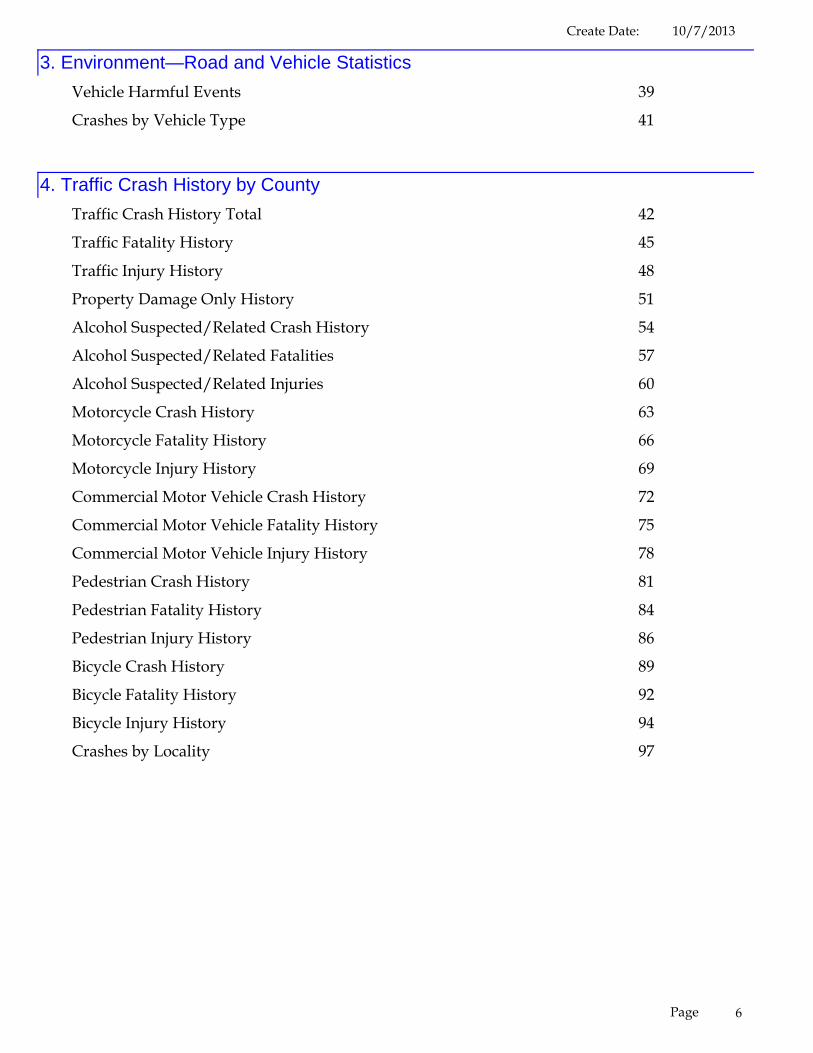
3. Environment—Road and Vehicle StatisticsVehicle Harmful Events 39
Crashes by Vehicle Type 41
4. Traffic Crash History by CountyTraffic Crash History Total 42
Traffic Fatality History 45
Traffic Injury History 48
Property Damage Only History 51
Alcohol Suspected/Related Crash History 54
Alcohol Suspected/Related Fatalities 57
Alcohol Suspected/Related Injuries 60
Motorcycle Crash History 63
Motorcycle Fatality History 66
Motorcycle Injury History 69
Commercial Motor Vehicle Crash History 72
Commercial Motor Vehicle Fatality History 75
Commercial Motor Vehicle Injury History 78
Pedestrian Crash History 81
Pedestrian Fatality History 84
Pedestrian Injury History 86
Bicycle Crash History 89
Bicycle Fatality History 92
Bicycle Injury History 94
Crashes by Locality 97
6Page

10/7/2013Create Date:
Source of Florida Traffic Crash Data
The information contained in this Traffic Crash Statistics booklet is extracted from law enforcement agencyreports (HSMV 90010S) of traffic crashes in which a motor vehicle is involved and which meets the followingcriteria:
· Motor vehicle crashes resulting in death or personal injury; or· Motor vehicle crashes in which one or more of the following conditions occur:
o Leaving the scene involving damage to an attended vehicle or property (Section316.061 (1), F.S.), or
o Driving while under the influence of alcoholic beverages, chemical substances, or controlledsubstances or with an unlawful blood alcohol level (Section 316.193, F.S.); or
o A vehicle was rendered inoperable to a degree that required a wrecker to remove it from thescene of the crash (Effective 7/1/2012); or
o Involved a commercial motor vehicle (Effective 7/1/2012).§ Please note that while the effective date of the changes above are in July, the figures in
this document utilize the above logic for the entire year beginning January 1, 2012 inorder to provide a more accurate view towards the future.
An investigating officer may report any other traffic crashes on the long-form crash report. However, onlythose crashes that meet the criteria above are included in this report.
The information contained in this report was produced by Appriss, Inc., Division of Public InformationManagement in partnership with the Florida Department of Highway Safety and Motor Vehicles and waspulled from the FIRES database. For further information or custom inquiries please contact us [email protected] or call 866-495-4206, M-F, 8am - 5pm EST.
7Page
10/7/2013Create Date:
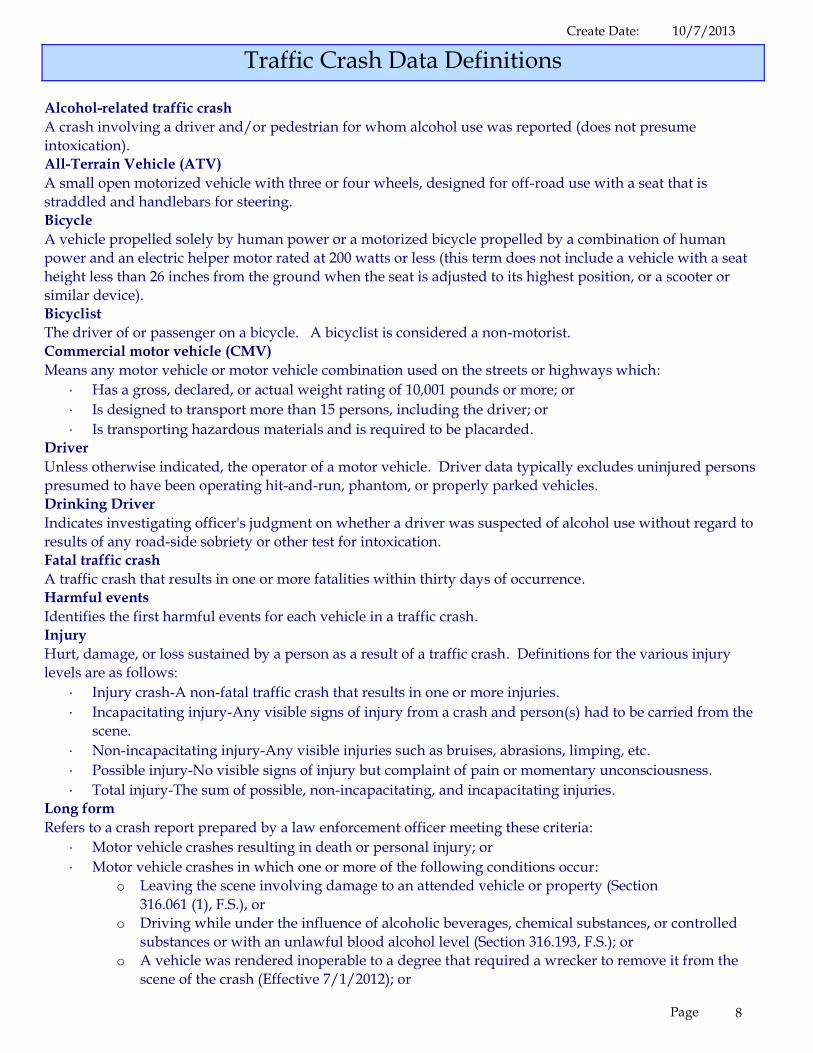
Traffic Crash Data Definitions
Alcohol-related traffic crashA crash involving a driver and/or pedestrian for whom alcohol use was reported (does not presumeintoxication).All-Terrain Vehicle (ATV)A small open motorized vehicle with three or four wheels, designed for off-road use with a seat that isstraddled and handlebars for steering.BicycleA vehicle propelled solely by human power or a motorized bicycle propelled by a combination of humanpower and an electric helper motor rated at 200 watts or less (this term does not include a vehicle with a seatheight less than 26 inches from the ground when the seat is adjusted to its highest position, or a scooter orsimilar device).BicyclistThe driver of or passenger on a bicycle. A bicyclist is considered a non-motorist.Commercial motor vehicle (CMV)Means any motor vehicle or motor vehicle combination used on the streets or highways which:
· Has a gross, declared, or actual weight rating of 10,001 pounds or more; or· Is designed to transport more than 15 persons, including the driver; or· Is transporting hazardous materials and is required to be placarded.
DriverUnless otherwise indicated, the operator of a motor vehicle. Driver data typically excludes uninjured personspresumed to have been operating hit-and-run, phantom, or properly parked vehicles.Drinking DriverIndicates investigating officer's judgment on whether a driver was suspected of alcohol use without regard toresults of any road-side sobriety or other test for intoxication.Fatal traffic crashA traffic crash that results in one or more fatalities within thirty days of occurrence.Harmful eventsIdentifies the first harmful events for each vehicle in a traffic crash.InjuryHurt, damage, or loss sustained by a person as a result of a traffic crash. Definitions for the various injurylevels are as follows:
· Injury crash-A non-fatal traffic crash that results in one or more injuries.· Incapacitating injury-Any visible signs of injury from a crash and person(s) had to be carried from the
scene.· Non-incapacitating injury-Any visible injuries such as bruises, abrasions, limping, etc.· Possible injury-No visible signs of injury but complaint of pain or momentary unconsciousness.· Total injury-The sum of possible, non-incapacitating, and incapacitating injuries.
Long formRefers to a crash report prepared by a law enforcement officer meeting these criteria:
· Motor vehicle crashes resulting in death or personal injury; or· Motor vehicle crashes in which one or more of the following conditions occur:
o Leaving the scene involving damage to an attended vehicle or property (Section316.061 (1), F.S.), or
o Driving while under the influence of alcoholic beverages, chemical substances, or controlledsubstances or with an unlawful blood alcohol level (Section 316.193, F.S.); or
o A vehicle was rendered inoperable to a degree that required a wrecker to remove it from thescene of the crash (Effective 7/1/2012); or
8Page
10/7/2013Create Date:o Involved a commercial motor vehicle (Effective 7/1/2012).
Please note that while the effective date of the changes above are in July, the figures inthis document utilize the above logic for the entire year beginning January 1, 2012 inorder to provide a more accurate view towards the future.
Low Speed VehicleA low speed vehicle is any 4-wheel electric vehicle that has a top speed greater than 20 miles per hour but notgreater than 25 miles per hour. A low speed vehicle can be operated on streets under certain conditions, mustbe licensed for use on the highway, and its operator must have a valid driver license. A golf cart is notconsidered a low speed vehicle.MopedA motor-powered cycle with a pedal-activated motor and a maximum of two brake horsepower.Motor vehicleAny motorized vehicle not operating on rails.MotorcycleA motor vehicle, with a seat or saddle for the driver's use, traveling with no more than three wheels in contactwith the ground, excluding a tractor or a moped.MotorcyclistThe driver of a motorcycle. A passenger on a motorcycle is considered a vehicle passenger except wherenoted.Short formRefers to a crash report in which the threshold of the long form does not apply. Therefore, a long form reportis not prepared. In crashes where apparent damage is less than $500, the law enforcement officer shallprovide each party involved in the crash a driver exchange form prescribed by the state, to be completed byeach party of the parties.Traffic crashA crash involving at least one motor vehicle on a roadway that is open to the public.Traffic fatalityThe death of a person as a direct result of a traffic crash within thirty days of the crash occurrence.Property Damage OnlyLoss of all or part of an individual's vehicle and/or property damage only crash resulting from a traffic crashnot involving injury to a person.
9Page

10/7/2013Create Date:
Florida Motoring Environment
MileageDeath Rate
DeathsNon-FatalInjuries
CrashesVehicleMiles
RegisteredVehicles
LicensedDrivers
CrashYear
1991 12,170,821 11,184,146 113,484 195,312 195,122 2,523 2.22
1992 11,550,126 11,205,298 114,000 196,174 205,432 2,480 2.18
1993 11,767,409 11,159,938 119,768 199,039 212,497 2,719 2.27
1994 11,992,578 11,393,982 120,929 206,183 223,458 2,722 2.25
1995 12,019,156 11,557,811 127,800 228,589 233,900 2,847 2.23
1996 12,343,598 12,003,930 129,637 241,377 243,320 2,806 2.16
1997 12,691,835 12,170,375 133,276 240,639 240,001 2,811 2.11
1998 13,012,132 11,277,808 136,680 245,440 241,863 2,889 2.11
1999 13,398,895 11,611,993 140,868 243,409 232,225 2,920 2.07
2000 14,041,846 11,948,485 149,857 246,541 231,588 2,999 2.00
2001 14,346,373 13,448,202 171,029 256,169 234,600 3,013 1.76
2002 14,604,720 12,989,278 178,680 250,470 229,611 3,143 1.76
2003 14,847,416 14,080,886 185,642 243,294 221,639 3,179 1.71
2004 15,007,005 14,512,264 196,722 252,902 227,192 3,257 1.66
2005 15,272,680 15,062,993 200,974 268,605 233,930 3,533 1.76
2006 15,491,878 15,612,161 203,783 256,200 214,914 3,365 1.65
2007 15,579,603 14,858,332 205,421 256,206 212,149 3,221 1.57
2008 15,556,658 15,966,287 198,494 243,342 199,657 2,983 1.50
2009 15,553,387 14,983,437 196,402 235,778 197,214 2,563 1.30
2010 15,507,284 14,845,603 195,755 235,461 195,104 2,444 1.25
2011 15,374,230 14,795,836 191,854 227,998 181,701 2,403 1.25
2012 15,378,206 14,727,755 190,850 281,321 198,029 2,430 1.27
Vehicle Miles column is expressed in MillionsMileage Death Rate is determined Per 100 Million Vehicle Miles of Travel AnnuallyRegistered Vehicles beginning in Year 1998, does not include count of trailers with tagsRegistered Vehicles beginning in year 2010 utilized a more accurate accounting method
10Page
10/7/2013Create Date:
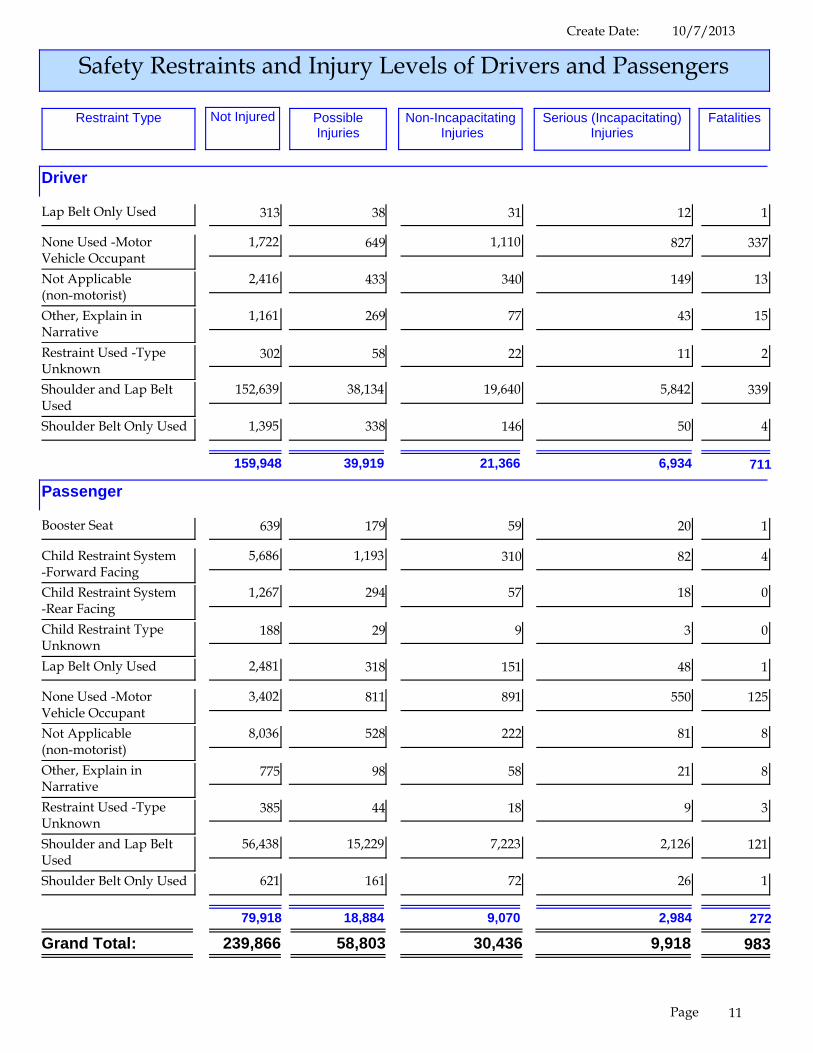
Safety Restraints and Injury Levels of Drivers and Passengers
Serious (Incapacitating)Injuries
FatalitiesRestraint Type Non-Incapacitating Injuries
PossibleInjuries
Not Injured
Driver
313 38 12 131Lap Belt Only Used
1,722 649 827 3371,110None Used -MotorVehicle Occupant
2,416 433 149 13340Not Applicable(non-motorist)
1,161 269 43 1577Other, Explain inNarrative
302 58 11 222Restraint Used -TypeUnknown
152,639 38,134 5,842 33919,640Shoulder and Lap BeltUsed
1,395 338 50 4146Shoulder Belt Only Used
159,948 39,919 21,366 6,934 711
Passenger
639 179 20 159Booster Seat
5,686 1,193 82 4310Child Restraint System-Forward Facing
1,267 294 18 057Child Restraint System-Rear Facing
188 29 3 09Child Restraint TypeUnknown
2,481 318 48 1151Lap Belt Only Used
3,402 811 550 125891None Used -MotorVehicle Occupant
8,036 528 81 8222Not Applicable(non-motorist)
775 98 21 858Other, Explain inNarrative
385 44 9 318Restraint Used -TypeUnknown
56,438 15,229 2,126 1217,223Shoulder and Lap BeltUsed
621 161 26 172Shoulder Belt Only Used
79,918 18,884 9,070 2,984 272
239,866 58,803 30,436 9,918 983Grand Total:
11Page
10/7/2013Create Date:
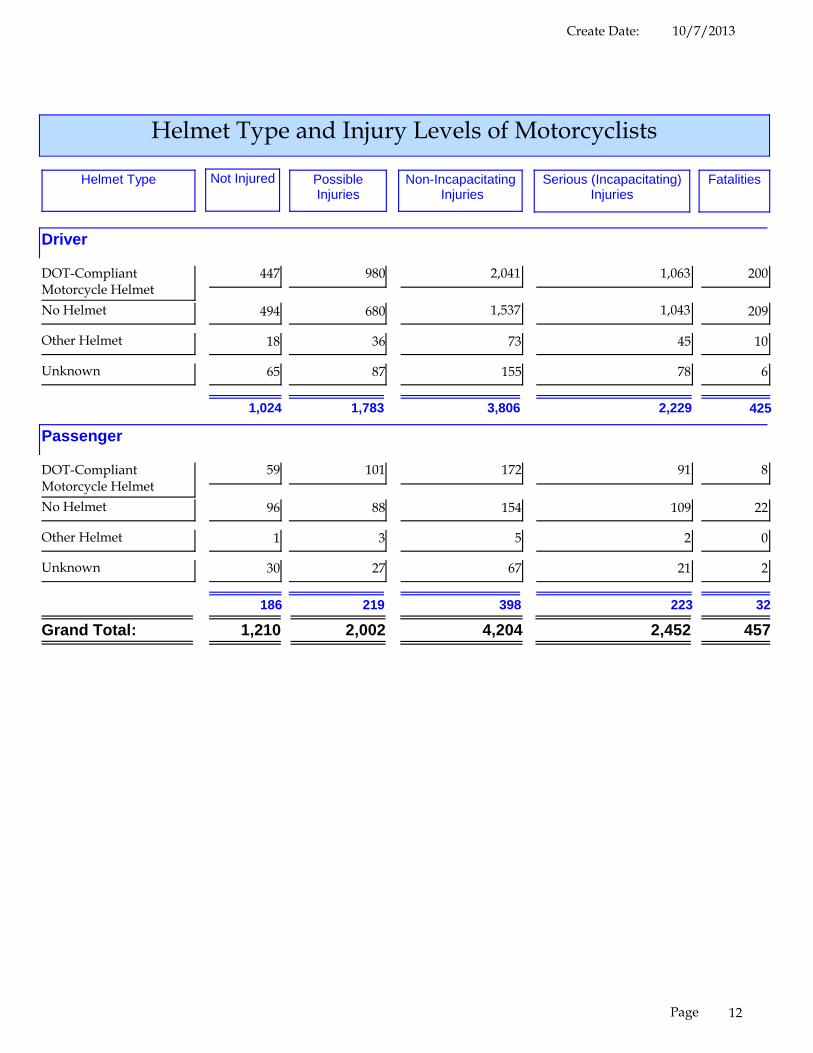
Helmet Type and Injury Levels of Motorcyclists
Serious (Incapacitating)Injuries
FatalitiesHelmet Type Non-Incapacitating Injuries
PossibleInjuries
Not Injured
Driver
447 980 1,063 2002,041DOT-CompliantMotorcycle Helmet
494 680 1,043 2091,537No Helmet
18 36 45 1073Other Helmet
65 87 78 6155Unknown
1,024 1,783 3,806 2,229 425
Passenger
59 101 91 8172DOT-CompliantMotorcycle Helmet
96 88 109 22154No Helmet
1 3 2 05Other Helmet
30 27 21 267Unknown
186 219 398 223 32
1,210 2,002 4,204 2,452 457Grand Total:
12Page

10/7/2013Create Date:
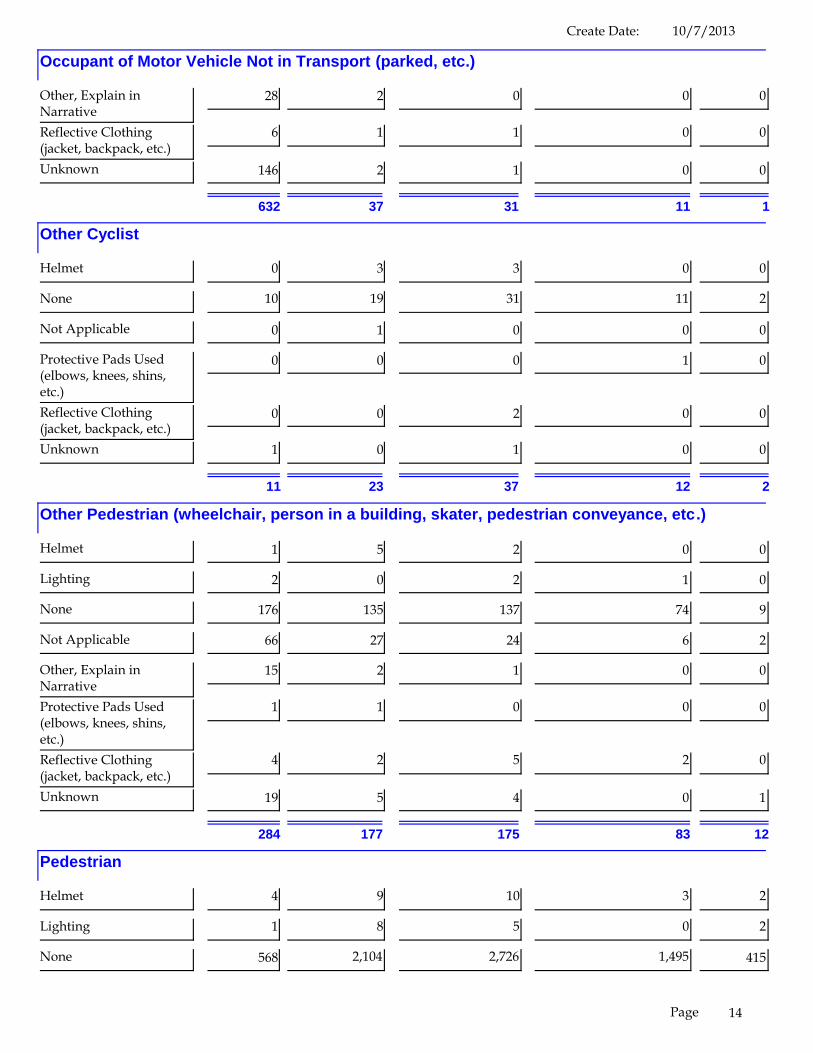
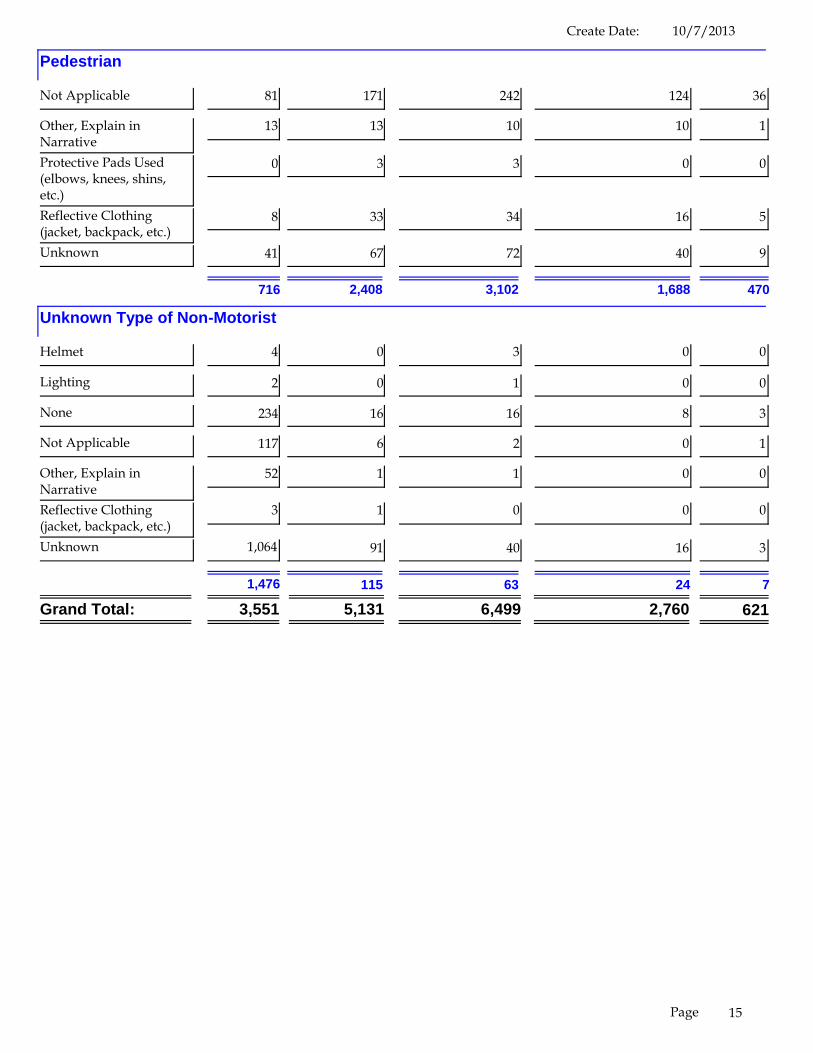
Safety Equipment and Injury Levels of Non-Motorists
Serious (Incapacitating)Injuries
FatalitiesSafety Equipment Type Non-Incapacitating Injuries
PossibleInjuries
Not Injured
Bicyclist
27 241 104 14391Helmet
5 40 30 1291Lighting
288 1,897 734 912,402None
1 10 4 09Not Applicable
3 11 0 021Other, Explain inNarrative
0 13 7 18Protective Pads Used(elbows, knees, shins,etc.)
2 25 12 030Reflective Clothing(jacket, backpack, etc.)
30 65 19 367Unknown
356 2,302 3,019 910 121
Occupant of a Non-Motor Vehicle Transportation Device
2 4 2 01Helmet
0 2 0 00Lighting
56 50 27 758None
6 5 2 19Not Applicable
6 2 1 01Other, Explain inNarrative
0 0 0 01Protective Pads Used(elbows, knees, shins,etc.)
6 6 0 02Unknown
76 69 72 32 8
Occupant of Motor Vehicle Not in Transport (parked, etc.)
2 1 0 00Helmet
3 0 0 00Lighting
333 27 10 128None
114 4 1 01Not Applicable
13Page
10/7/2013Create Date:
Occupant of Motor Vehicle Not in Transport (parked, etc.)
28 2 0 00Other, Explain inNarrative
6 1 0 01Reflective Clothing(jacket, backpack, etc.)
146 2 0 01Unknown
632 37 31 11 1
Other Cyclist
0 3 0 03Helmet
10 19 11 231None
0 1 0 00Not Applicable
0 0 1 00Protective Pads Used(elbows, knees, shins,etc.)
0 0 0 02Reflective Clothing(jacket, backpack, etc.)
1 0 0 01Unknown
11 23 37 12 2
Other Pedestrian (wheelchair, person in a building, skater, pedestrian conveyance, etc.)
1 5 0 02Helmet
2 0 1 02Lighting
176 135 74 9137None
66 27 6 224Not Applicable
15 2 0 01Other, Explain inNarrative
1 1 0 00Protective Pads Used(elbows, knees, shins,etc.)
4 2 2 05Reflective Clothing(jacket, backpack, etc.)
19 5 0 14Unknown
284 177 175 83 12
Pedestrian
4 9 3 210Helmet
1 8 0 25Lighting
568 2,104 1,495 4152,726None
14Page
10/7/2013Create Date:
Pedestrian
81 171 124 36242Not Applicable
13 13 10 110Other, Explain inNarrative
0 3 0 03Protective Pads Used(elbows, knees, shins,etc.)
8 33 16 534Reflective Clothing(jacket, backpack, etc.)
41 67 40 972Unknown
716 2,408 3,102 1,688 470
Unknown Type of Non-Motorist
4 0 0 03Helmet
2 0 0 01Lighting
234 16 8 316None
117 6 0 12Not Applicable
52 1 0 01Other, Explain inNarrative
3 1 0 00Reflective Clothing(jacket, backpack, etc.)
1,064 91 16 340Unknown
1,476 115 63 24 7
3,551 5,131 6,499 2,760 621Grand Total:
15Page
10/7/2013Create Date:
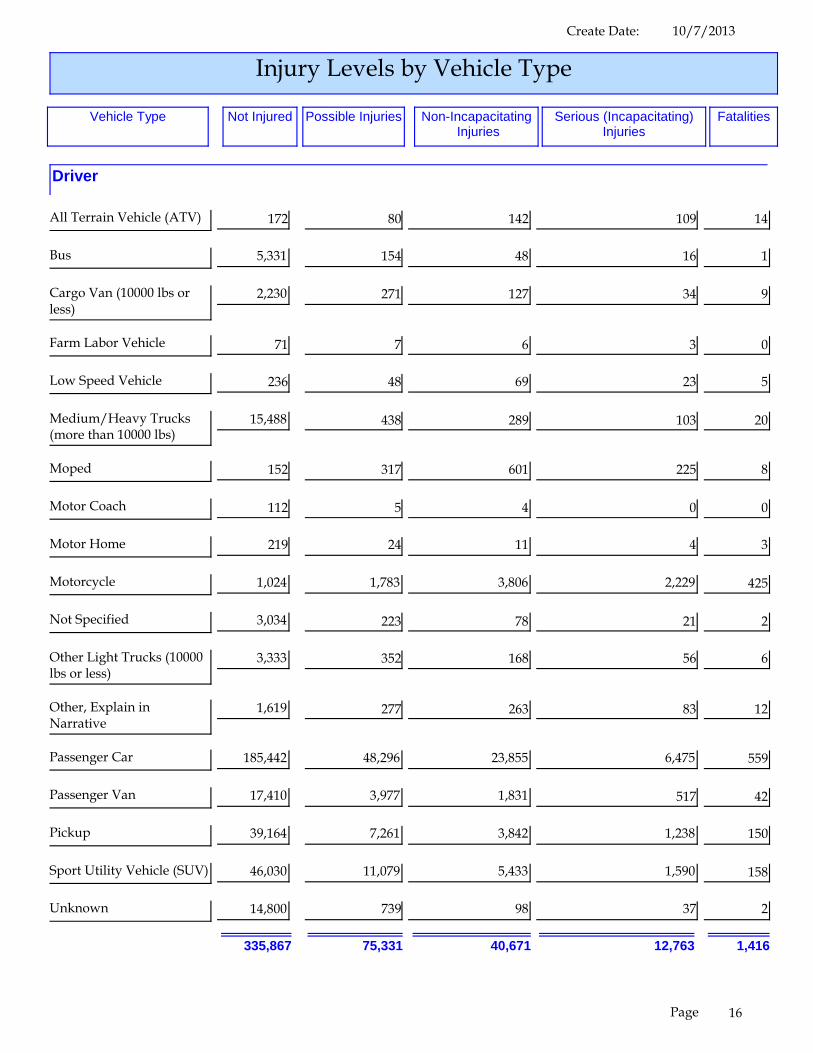
Injury Levels by Vehicle Type
Vehicle Type FatalitiesSerious (Incapacitating)Injuries
Non-Incapacitating Injuries
Possible InjuriesNot Injured
Driver
All Terrain Vehicle (ATV) 172 80 109 14142
Bus 5,331 154 16 148
Cargo Van (10000 lbs orless)
2,230 271 34 9127
Farm Labor Vehicle 71 7 3 06
Low Speed Vehicle 236 48 23 569
Medium/Heavy Trucks(more than 10000 lbs)
15,488 438 103 20289
Moped 152 317 225 8601
Motor Coach 112 5 0 04
Motor Home 219 24 4 311
Motorcycle 1,024 1,783 2,229 4253,806
Not Specified 3,034 223 21 278
Other Light Trucks (10000lbs or less)
3,333 352 56 6168
Other, Explain inNarrative
1,619 277 83 12263
Passenger Car 185,442 48,296 6,475 55923,855
Passenger Van 17,410 3,977 517 421,831
Pickup 39,164 7,261 1,238 1503,842
Sport Utility Vehicle (SUV) 46,030 11,079 1,590 1585,433
Unknown 14,800 739 37 298
335,867 75,331 40,671 12,763 1,416
16Page
10/7/2013Create Date:
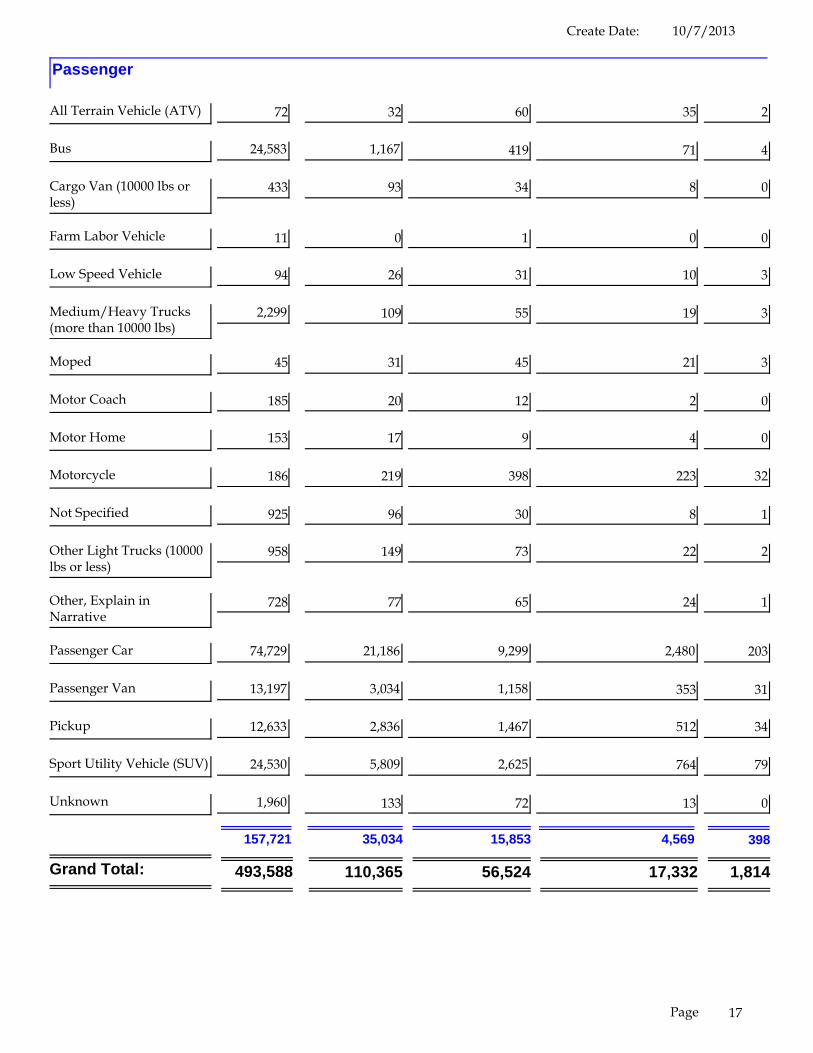
Passenger
All Terrain Vehicle (ATV) 72 32 35 260
Bus 24,583 1,167 71 4419
Cargo Van (10000 lbs orless)
433 93 8 034
Farm Labor Vehicle 11 0 0 01
Low Speed Vehicle 94 26 10 331
Medium/Heavy Trucks(more than 10000 lbs)
2,299 109 19 355
Moped 45 31 21 345
Motor Coach 185 20 2 012
Motor Home 153 17 4 09
Motorcycle 186 219 223 32398
Not Specified 925 96 8 130
Other Light Trucks (10000lbs or less)
958 149 22 273
Other, Explain inNarrative
728 77 24 165
Passenger Car 74,729 21,186 2,480 2039,299
Passenger Van 13,197 3,034 353 311,158
Pickup 12,633 2,836 512 341,467
Sport Utility Vehicle (SUV) 24,530 5,809 764 792,625
Unknown 1,960 133 13 072
157,721 35,034 15,853 4,569 398
493,588 110,365 56,524 17,332 1,814Grand Total:
17Page
10/7/2013Create Date:
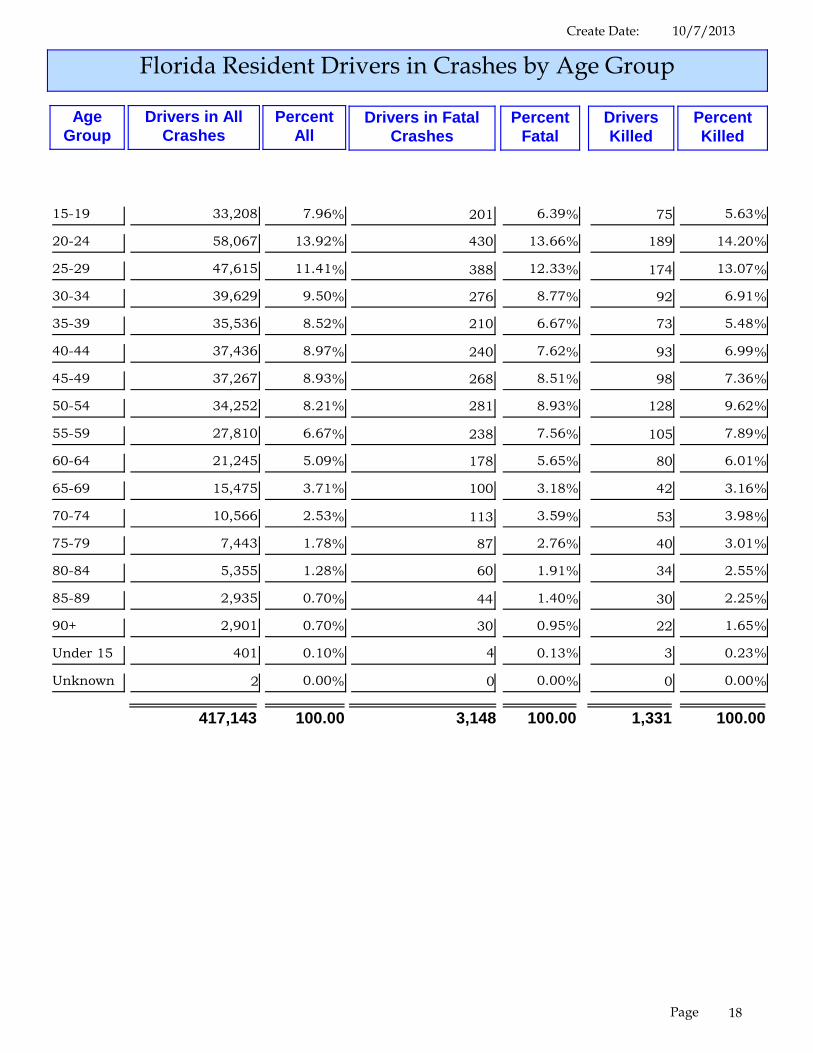
Florida Resident Drivers in Crashes by Age Group
PercentKilled
DriversKilled
PercentFatal
Drivers in FatalCrashes
PercentAll
Drivers in AllCrashes
AgeGroup
15-19 33,208 %7.96 201 %6.39 75 %5.63
20-24 58,067 %13.92 430 %13.66 189 %14.20
25-29 47,615 %11.41 388 %12.33 174 %13.07
30-34 39,629 %9.50 276 %8.77 92 %6.91
35-39 35,536 %8.52 210 %6.67 73 %5.48
40-44 37,436 %8.97 240 %7.62 93 %6.99
45-49 37,267 %8.93 268 %8.51 98 %7.36
50-54 34,252 %8.21 281 %8.93 128 %9.62
55-59 27,810 %6.67 238 %7.56 105 %7.89
60-64 21,245 %5.09 178 %5.65 80 %6.01
65-69 15,475 %3.71 100 %3.18 42 %3.16
70-74 10,566 %2.53 113 %3.59 53 %3.98
75-79 7,443 %1.78 87 %2.76 40 %3.01
80-84 5,355 %1.28 60 %1.91 34 %2.55
85-89 2,935 %0.70 44 %1.40 30 %2.25
90+ 2,901 %0.70 30 %0.95 22 %1.65
Under 15 401 %0.10 4 %0.13 3 %0.23
Unknown 2 %0.00 0 %0.00 0 %0.00
417,143 3,148 1,331100.00 100.00 100.00
18Page
10/7/2013Create Date:
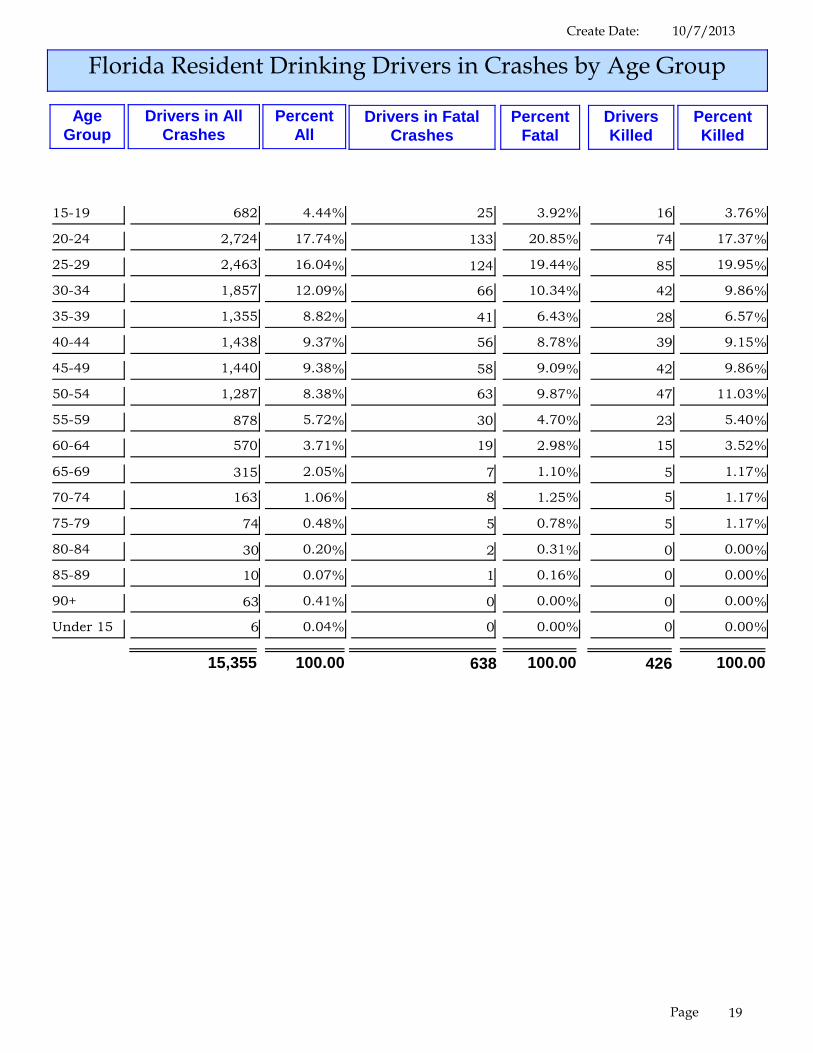
Florida Resident Drinking Drivers in Crashes by Age Group
PercentKilled
DriversKilled
PercentFatal
Drivers in FatalCrashes
PercentAll
Drivers in AllCrashes
AgeGroup
15-19 682 %4.44 25 %3.92 16 %3.76
20-24 2,724 %17.74 133 %20.85 74 %17.37
25-29 2,463 %16.04 124 %19.44 85 %19.95
30-34 1,857 %12.09 66 %10.34 42 %9.86
35-39 1,355 %8.82 41 %6.43 28 %6.57
40-44 1,438 %9.37 56 %8.78 39 %9.15
45-49 1,440 %9.38 58 %9.09 42 %9.86
50-54 1,287 %8.38 63 %9.87 47 %11.03
55-59 878 %5.72 30 %4.70 23 %5.40
60-64 570 %3.71 19 %2.98 15 %3.52
65-69 315 %2.05 7 %1.10 5 %1.17
70-74 163 %1.06 8 %1.25 5 %1.17
75-79 74 %0.48 5 %0.78 5 %1.17
80-84 30 %0.20 2 %0.31 0 %0.00
85-89 10 %0.07 1 %0.16 0 %0.00
90+ 63 %0.41 0 %0.00 0 %0.00
Under 15 6 %0.04 0 %0.00 0 %0.00
15,355 638 426100.00 100.00 100.00
19Page
10/7/2013Create Date:
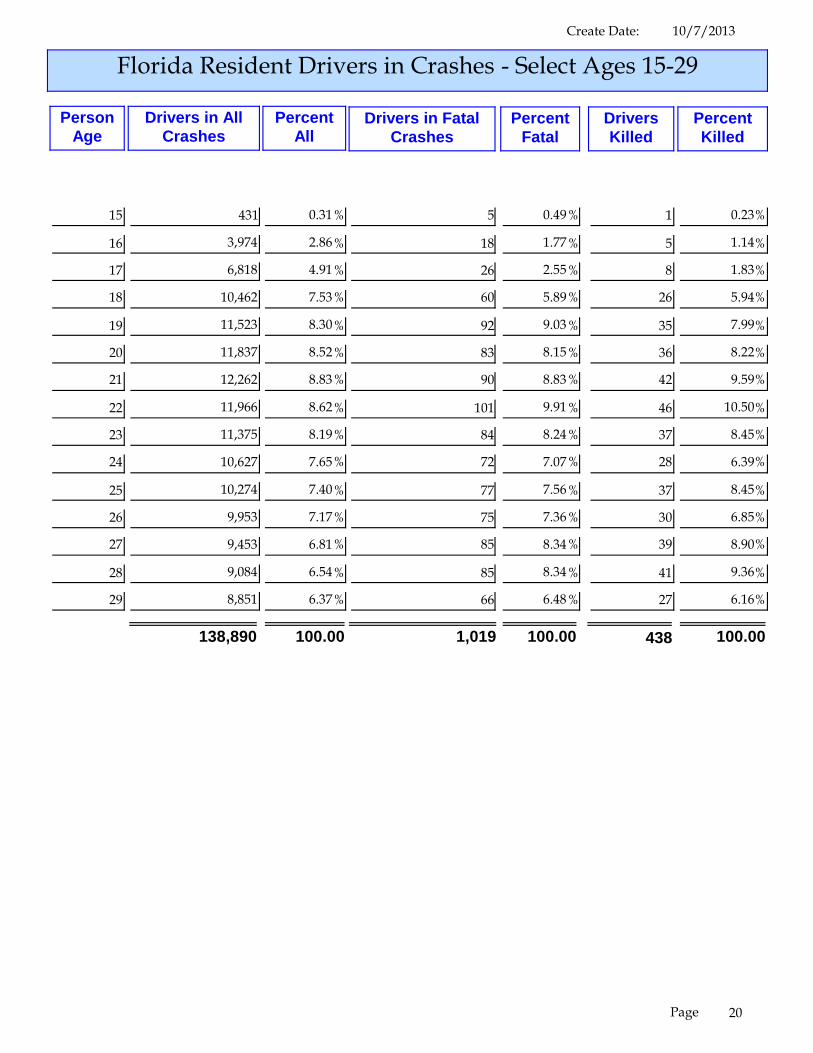
Florida Resident Drivers in Crashes - Select Ages 15-29
PercentKilled
DriversKilled
PercentFatal
Drivers in FatalCrashes
PercentAll
Drivers in AllCrashes
PersonAge
15 431 %0.31 5 %0.49 1 %0.23
16 3,974 %2.86 18 %1.77 5 %1.14
17 6,818 %4.91 26 %2.55 8 %1.83
18 10,462 %7.53 60 %5.89 26 %5.94
19 11,523 %8.30 92 %9.03 35 %7.99
20 11,837 %8.52 83 %8.15 36 %8.22
21 12,262 %8.83 90 %8.83 42 %9.59
22 11,966 %8.62 101 %9.91 46 %10.50
23 11,375 %8.19 84 %8.24 37 %8.45
24 10,627 %7.65 72 %7.07 28 %6.39
25 10,274 %7.40 77 %7.56 37 %8.45
26 9,953 %7.17 75 %7.36 30 %6.85
27 9,453 %6.81 85 %8.34 39 %8.90
28 9,084 %6.54 85 %8.34 41 %9.36
29 8,851 %6.37 66 %6.48 27 %6.16
138,890 1,019 438100.00 100.00 100.00
20Page

10/7/2013Create Date:
Florida Resident Drinking Drivers in Crashes - Select Ages 15-29
PercentKilled
DriversKilled
PercentFatal
Drivers in FatalCrashes
PercentAll
Drivers in AllCrashes
PersonAge
15 9 %0.15 0 %0.00 0 %0.00
16 37 %0.63 1 %0.35 1 %0.57
17 112 %1.91 2 %0.71 1 %0.57
18 215 %3.66 9 %3.19 6 %3.43
19 309 %5.26 13 %4.61 8 %4.57
20 371 %6.32 19 %6.74 12 %6.86
21 595 %10.14 20 %7.09 13 %7.43
22 622 %10.60 34 %12.06 15 %8.57
23 548 %9.34 34 %12.06 19 %10.86
24 588 %10.02 26 %9.22 15 %8.57
25 528 %9.00 28 %9.93 21 %12.00
26 536 %9.13 21 %7.45 12 %6.86
27 516 %8.79 26 %9.22 19 %10.86
28 462 %7.87 26 %9.22 19 %10.86
29 421 %7.17 23 %8.16 14 %8.00
5,869 282 175100.00 100.00 100.00
21Page
10/7/2013Create Date:
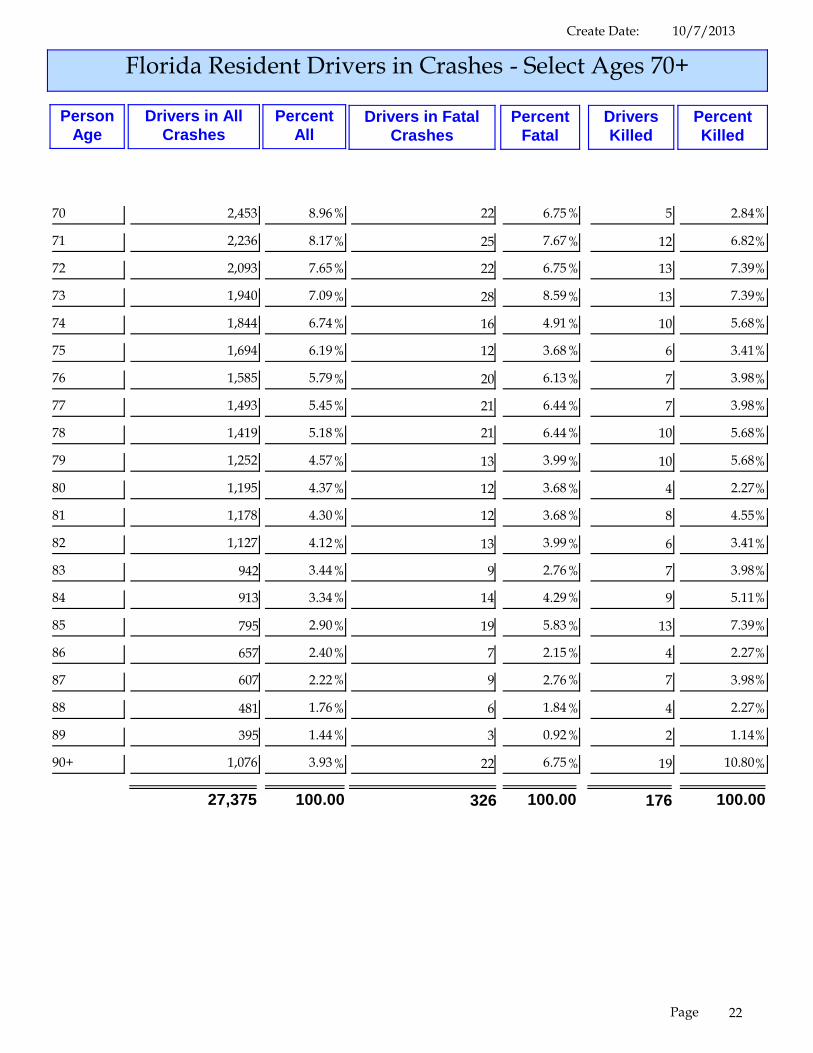
Florida Resident Drivers in Crashes - Select Ages 70+
PercentKilled
DriversKilled
PercentFatal
Drivers in FatalCrashes
PercentAll
Drivers in AllCrashes
PersonAge
70 2,453 %8.96 22 %6.75 5 %2.84
71 2,236 %8.17 25 %7.67 12 %6.82
72 2,093 %7.65 22 %6.75 13 %7.39
73 1,940 %7.09 28 %8.59 13 %7.39
74 1,844 %6.74 16 %4.91 10 %5.68
75 1,694 %6.19 12 %3.68 6 %3.41
76 1,585 %5.79 20 %6.13 7 %3.98
77 1,493 %5.45 21 %6.44 7 %3.98
78 1,419 %5.18 21 %6.44 10 %5.68
79 1,252 %4.57 13 %3.99 10 %5.68
80 1,195 %4.37 12 %3.68 4 %2.27
81 1,178 %4.30 12 %3.68 8 %4.55
82 1,127 %4.12 13 %3.99 6 %3.41
83 942 %3.44 9 %2.76 7 %3.98
84 913 %3.34 14 %4.29 9 %5.11
85 795 %2.90 19 %5.83 13 %7.39
86 657 %2.40 7 %2.15 4 %2.27
87 607 %2.22 9 %2.76 7 %3.98
88 481 %1.76 6 %1.84 4 %2.27
89 395 %1.44 3 %0.92 2 %1.14
90+ 1,076 %3.93 22 %6.75 19 %10.80
27,375 326 176100.00 100.00 100.00
22Page

10/7/2013Create Date:
Florida Resident Drinking Drivers in Crashes - Select Ages 70+
PercentKilled
DriversKilled
PercentFatal
Drivers in FatalCrashes
PercentAll
Drivers in AllCrashes
PersonAge
70 34 %12.14 1 %6.25 1 %10.00
71 40 %14.29 1 %6.25 1 %10.00
72 41 %14.64 1 %6.25 1 %10.00
73 27 %9.64 4 %25.00 1 %10.00
74 21 %7.50 1 %6.25 1 %10.00
75 19 %6.79 0 %0.00 0 %0.00
76 19 %6.79 0 %0.00 0 %0.00
77 15 %5.36 0 %0.00 0 %0.00
78 10 %3.57 2 %12.50 2 %20.00
79 11 %3.93 3 %18.75 3 %30.00
80 6 %2.14 0 %0.00 0 %0.00
81 10 %3.57 2 %12.50 0 %0.00
82 5 %1.79 0 %0.00 0 %0.00
83 7 %2.50 0 %0.00 0 %0.00
84 2 %0.71 0 %0.00 0 %0.00
85 1 %0.36 0 %0.00 0 %0.00
86 1 %0.36 0 %0.00 0 %0.00
87 4 %1.43 1 %6.25 0 %0.00
88 3 %1.07 0 %0.00 0 %0.00
89 1 %0.36 0 %0.00 0 %0.00
90+ 3 %1.07 0 %0.00 0 %0.00
280 16 10100.00 100.00 100.00
23Page
10/7/2013Create Date:
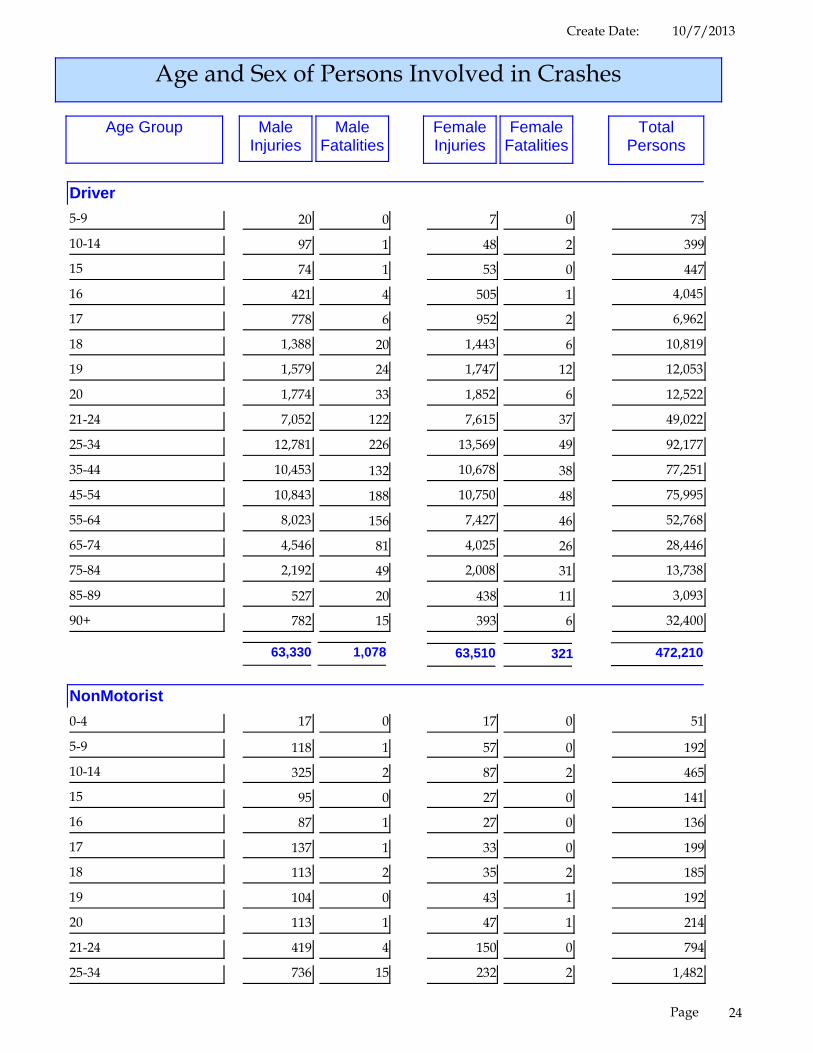
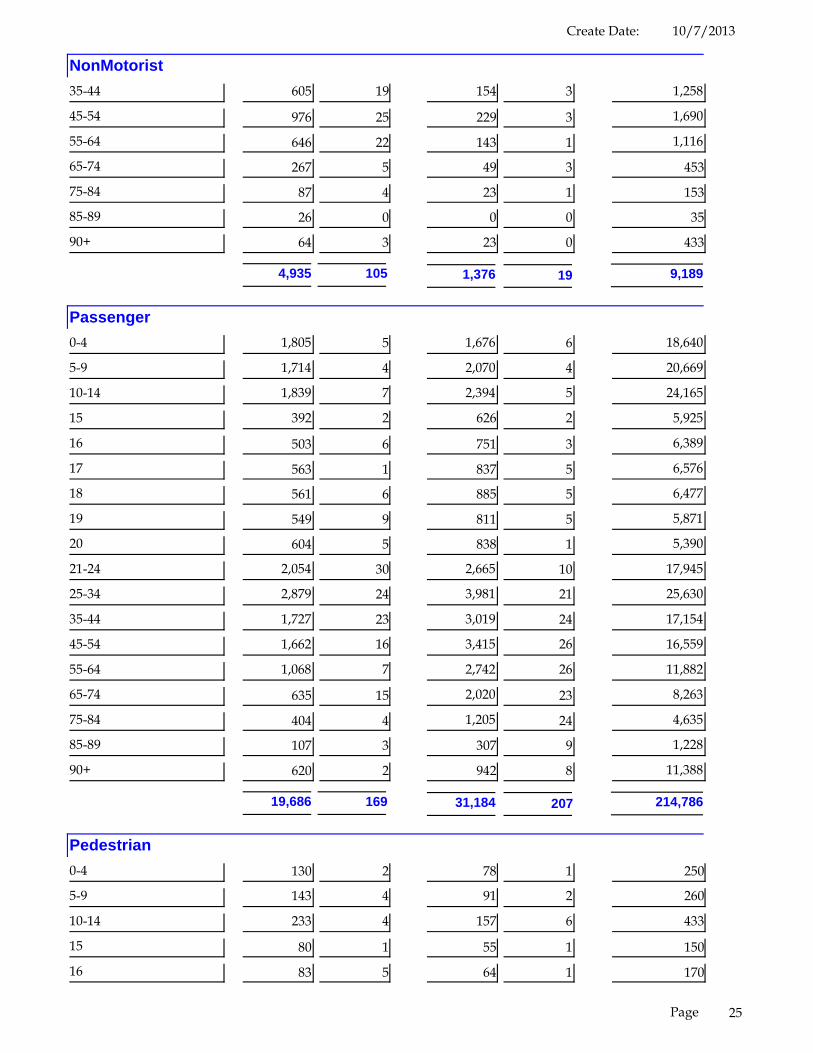
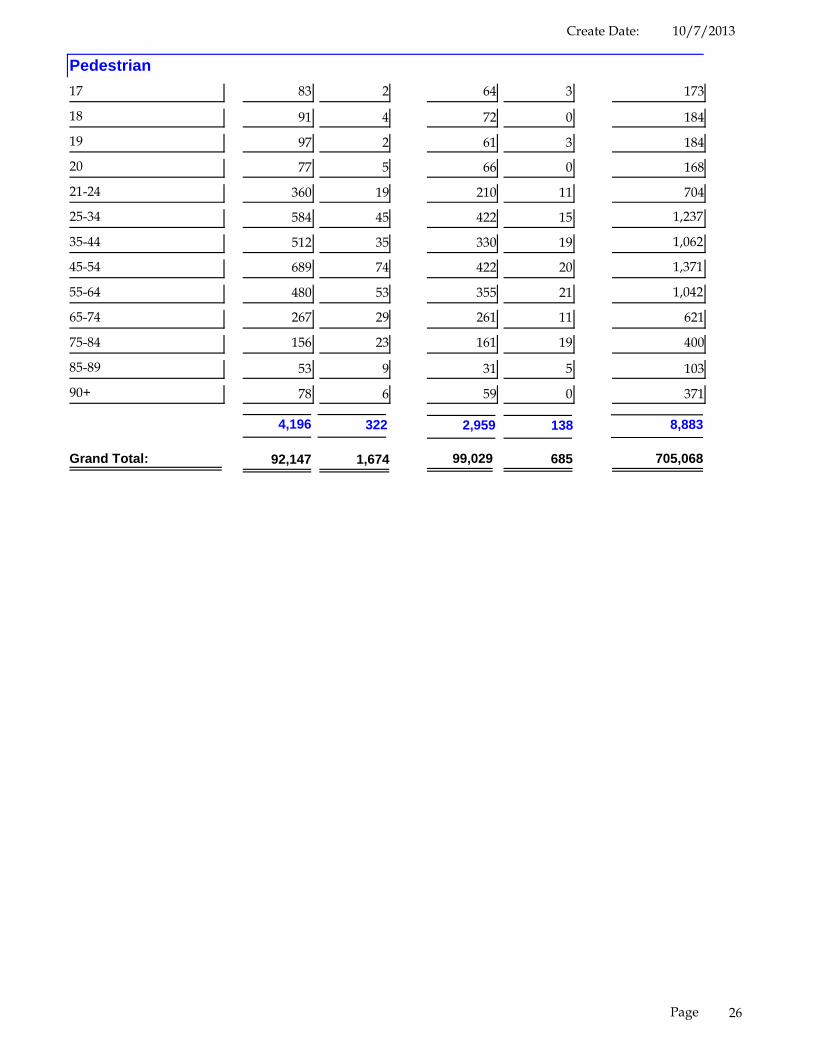
Age and Sex of Persons Involved in Crashes
TotalPersons
FemaleFatalities
FemaleInjuries
MaleFatalities
MaleInjuries
Age Group
Driver5-9 20 0 7 0 73
10-14 97 1 48 2 399
15 74 1 53 0 447
16 421 4 505 1 4,045
17 778 6 952 2 6,962
18 1,388 20 1,443 6 10,819
19 1,579 24 1,747 12 12,053
20 1,774 33 1,852 6 12,522
21-24 7,052 122 7,615 37 49,022
25-34 12,781 226 13,569 49 92,177
35-44 10,453 132 10,678 38 77,251
45-54 10,843 188 10,750 48 75,995
55-64 8,023 156 7,427 46 52,768
65-74 4,546 81 4,025 26 28,446
75-84 2,192 49 2,008 31 13,738
85-89 527 20 438 11 3,093
90+ 782 15 393 6 32,400
63,330 1,078 63,510 321 472,210
NonMotorist0-4 17 0 17 0 51
5-9 118 1 57 0 192
10-14 325 2 87 2 465
15 95 0 27 0 141
16 87 1 27 0 136
17 137 1 33 0 199
18 113 2 35 2 185
19 104 0 43 1 192
20 113 1 47 1 214
21-24 419 4 150 0 794
25-34 736 15 232 2 1,482
24Page
10/7/2013Create Date:
NonMotorist35-44 605 19 154 3 1,258
45-54 976 25 229 3 1,690
55-64 646 22 143 1 1,116
65-74 267 5 49 3 453
75-84 87 4 23 1 153
85-89 26 0 0 0 35
90+ 64 3 23 0 433
4,935 105 1,376 19 9,189
Passenger0-4 1,805 5 1,676 6 18,640
5-9 1,714 4 2,070 4 20,669
10-14 1,839 7 2,394 5 24,165
15 392 2 626 2 5,925
16 503 6 751 3 6,389
17 563 1 837 5 6,576
18 561 6 885 5 6,477
19 549 9 811 5 5,871
20 604 5 838 1 5,390
21-24 2,054 30 2,665 10 17,945
25-34 2,879 24 3,981 21 25,630
35-44 1,727 23 3,019 24 17,154
45-54 1,662 16 3,415 26 16,559
55-64 1,068 7 2,742 26 11,882
65-74 635 15 2,020 23 8,263
75-84 404 4 1,205 24 4,635
85-89 107 3 307 9 1,228
90+ 620 2 942 8 11,388
19,686 169 31,184 207 214,786
Pedestrian0-4 130 2 78 1 250
5-9 143 4 91 2 260
10-14 233 4 157 6 433
15 80 1 55 1 150
16 83 5 64 1 170
25Page
10/7/2013Create Date:
Pedestrian17 83 2 64 3 173
18 91 4 72 0 184
19 97 2 61 3 184
20 77 5 66 0 168
21-24 360 19 210 11 704
25-34 584 45 422 15 1,237
35-44 512 35 330 19 1,062
45-54 689 74 422 20 1,371
55-64 480 53 355 21 1,042
65-74 267 29 261 11 621
75-84 156 23 161 19 400
85-89 53 9 31 5 103
90+ 78 6 59 0 371
4,196 322 2,959 138 8,883
92,147 1,674 99,029 685 705,068Grand Total:
26Page
10/7/2013Create Date:
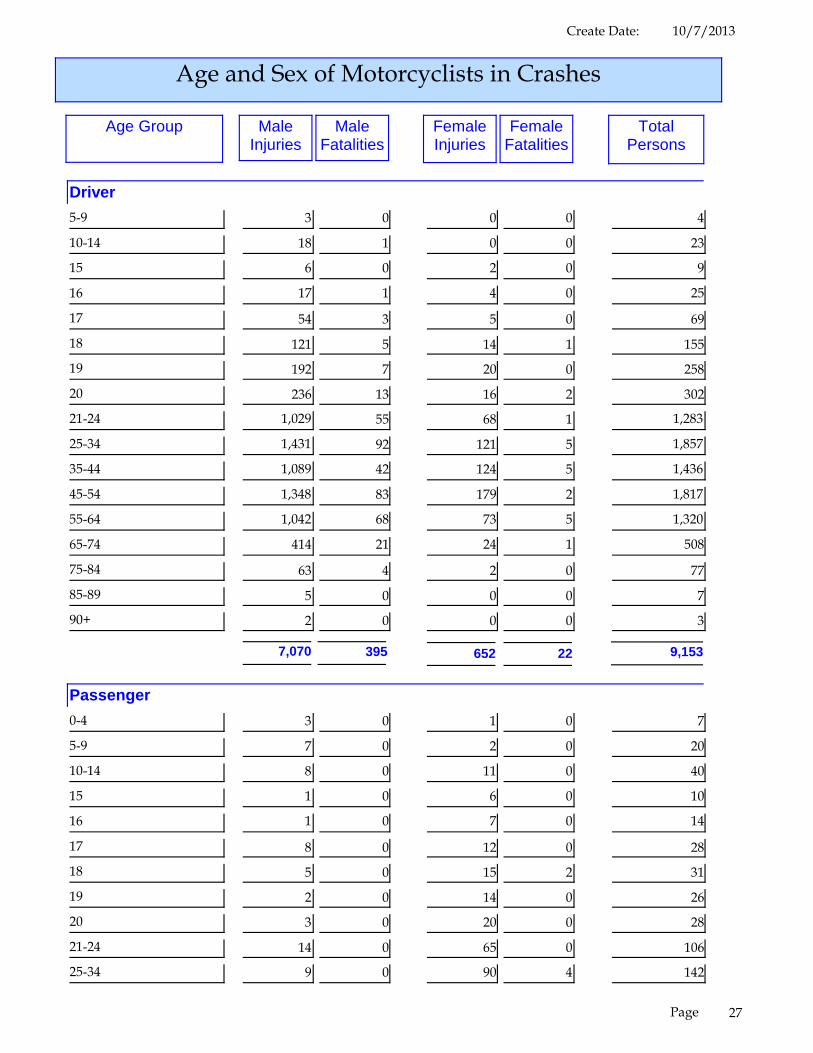
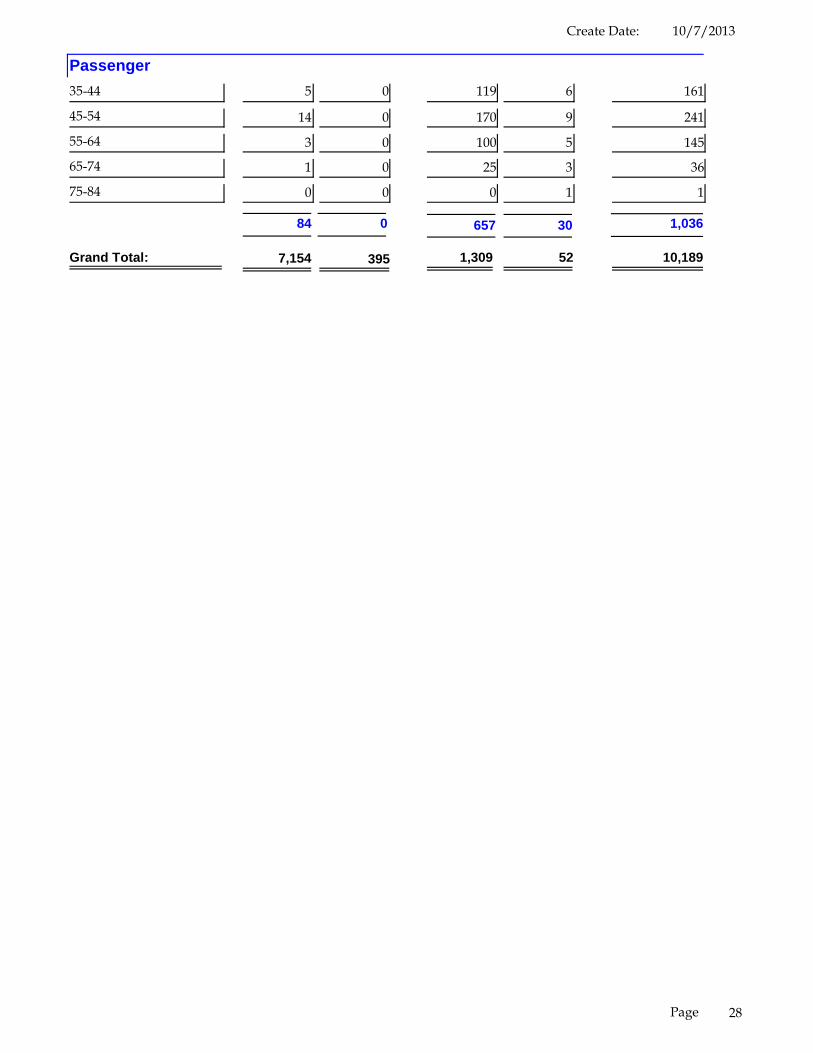
Age and Sex of Motorcyclists in Crashes
TotalPersons
FemaleFatalities
FemaleInjuries
MaleFatalities
MaleInjuries
Age Group
Driver5-9 3 0 0 0 4
10-14 18 1 0 0 23
15 6 0 2 0 9
16 17 1 4 0 25
17 54 3 5 0 69
18 121 5 14 1 155
19 192 7 20 0 258
20 236 13 16 2 302
21-24 1,029 55 68 1 1,283
25-34 1,431 92 121 5 1,857
35-44 1,089 42 124 5 1,436
45-54 1,348 83 179 2 1,817
55-64 1,042 68 73 5 1,320
65-74 414 21 24 1 508
75-84 63 4 2 0 77
85-89 5 0 0 0 7
90+ 2 0 0 0 3
7,070 395 652 22 9,153
Passenger0-4 3 0 1 0 7
5-9 7 0 2 0 20
10-14 8 0 11 0 40
15 1 0 6 0 10
16 1 0 7 0 14
17 8 0 12 0 28
18 5 0 15 2 31
19 2 0 14 0 26
20 3 0 20 0 28
21-24 14 0 65 0 106
25-34 9 0 90 4 142
27Page
10/7/2013Create Date:
Passenger35-44 5 0 119 6 161
45-54 14 0 170 9 241
55-64 3 0 100 5 145
65-74 1 0 25 3 36
75-84 0 0 0 1 1
84 0 657 30 1,036
7,154 395 1,309 52 10,189Grand Total:
28Page
10/7/2013Create Date:
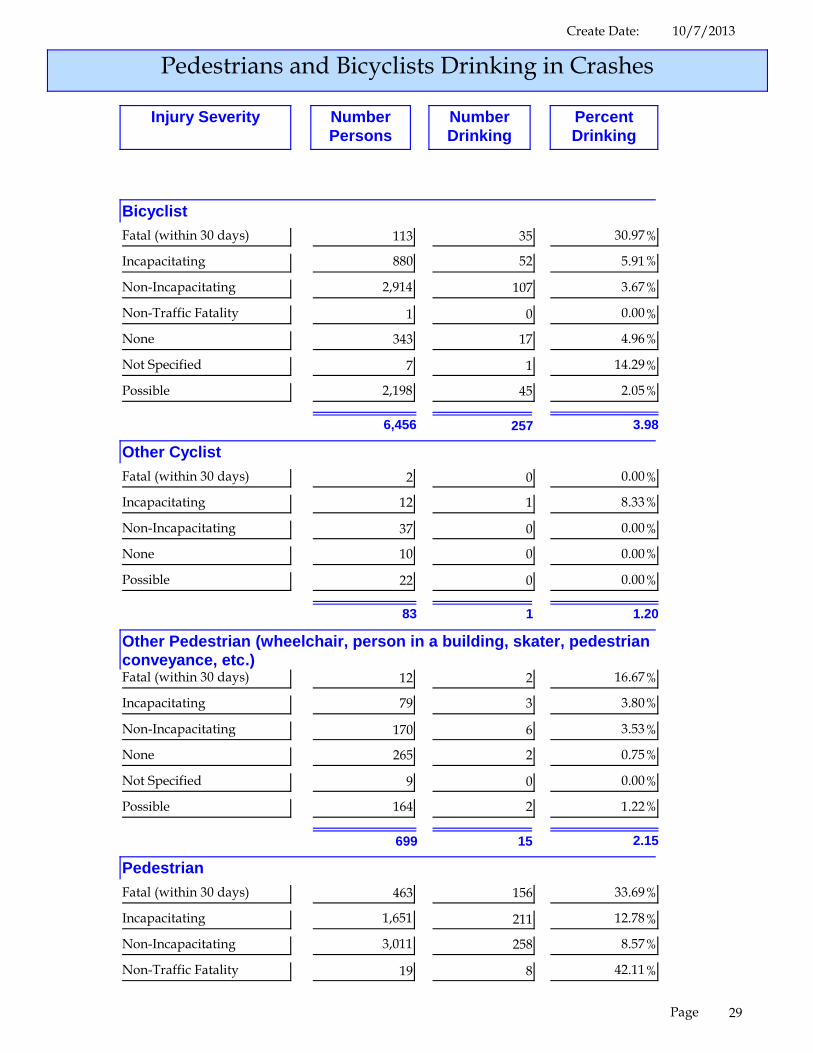
Pedestrians and Bicyclists Drinking in Crashes
Injury Severity NumberPersons
NumberDrinking
PercentDrinking
BicyclistFatal (within 30 days) 113 35 %30.97
Incapacitating 880 52 %5.91
Non-Incapacitating 2,914 107 %3.67
Non-Traffic Fatality 1 0 %0.00
None 343 17 %4.96
Not Specified 7 1 %14.29
Possible 2,198 45 %2.05
6,456 257 3.98
Other CyclistFatal (within 30 days) 2 0 %0.00
Incapacitating 12 1 %8.33
Non-Incapacitating 37 0 %0.00
None 10 0 %0.00
Possible 22 0 %0.00
83 1 1.20
Other Pedestrian (wheelchair, person in a building, skater, pedestrianconveyance, etc.)Fatal (within 30 days) 12 2 %16.67
Incapacitating 79 3 %3.80
Non-Incapacitating 170 6 %3.53
None 265 2 %0.75
Not Specified 9 0 %0.00
Possible 164 2 %1.22
699 15 2.15
PedestrianFatal (within 30 days) 463 156 %33.69
Incapacitating 1,651 211 %12.78
Non-Incapacitating 3,011 258 %8.57
Non-Traffic Fatality 19 8 %42.11
29Page

10/7/2013Create Date:None 685 46 %6.72
Not Specified 18 1 %5.56
Possible 2,339 121 %5.17
8,186 801 9.78
15,424 1,074Grand Total: 6.96
30Page
10/7/2013Create Date:
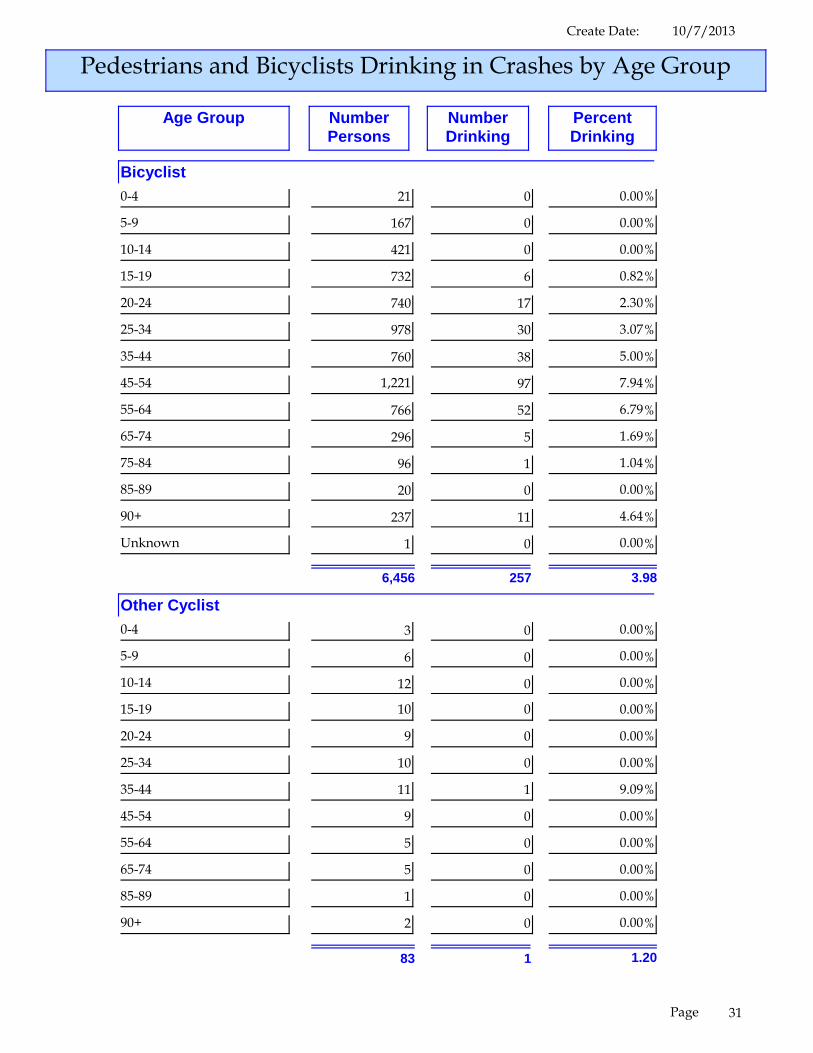
Pedestrians and Bicyclists Drinking in Crashes by Age Group
Age Group NumberPersons
NumberDrinking
PercentDrinking
Bicyclist0-4 21 0 %0.00
5-9 167 0 %0.00
10-14 421 0 %0.00
15-19 732 6 %0.82
20-24 740 17 %2.30
25-34 978 30 %3.07
35-44 760 38 %5.00
45-54 1,221 97 %7.94
55-64 766 52 %6.79
65-74 296 5 %1.69
75-84 96 1 %1.04
85-89 20 0 %0.00
90+ 237 11 %4.64
Unknown 1 0 %0.00
6,456 257 3.98
Other Cyclist0-4 3 0 %0.00
5-9 6 0 %0.00
10-14 12 0 %0.00
15-19 10 0 %0.00
20-24 9 0 %0.00
25-34 10 0 %0.00
35-44 11 1 %9.09
45-54 9 0 %0.00
55-64 5 0 %0.00
65-74 5 0 %0.00
85-89 1 0 %0.00
90+ 2 0 %0.00
83 1 1.20
31Page

10/7/2013Create Date:
Other Pedestrian (wheelchair, person in a building, skater, pedestrianconveyance, etc.)0-4 17 0 %0.00
5-9 15 0 %0.00
10-14 26 0 %0.00
15-19 50 0 %0.00
20-24 59 3 %5.08
25-34 88 2 %2.27
35-44 80 1 %1.25
45-54 99 3 %3.03
55-64 102 3 %2.94
65-74 66 2 %3.03
75-84 40 0 %0.00
85-89 9 0 %0.00
90+ 48 1 %2.08
699 15 2.15
Pedestrian0-4 233 0 %0.00
5-9 245 1 %0.41
10-14 407 1 %0.25
15-19 811 19 %2.34
20-24 813 96 %11.81
25-34 1,149 167 %14.53
35-44 982 142 %14.46
45-54 1,272 214 %16.82
55-64 940 111 %11.81
65-74 555 19 %3.42
75-84 360 4 %1.11
85-89 94 2 %2.13
90+ 323 25 %7.74
Unknown 2 0 %0.00
8,186 801 9.78
15,424 1,074Grand Total: 6.96
32Page

10/7/2013Create Date:
Initial Driver ActionsInitial Driver Action Percent
FatalPercentPropertyDamage
Vehicle orPropertyDamage
PercentInjury
InjuryFatal
Ran off Roadway 125 2,106%5.23 %1.58 2,212 %1.57
Unknown 276 14,987%11.55 %11.21 27,407 %19.49
Operated MV in Erratic, Recklessor Aggressive Manner
59 851%2.47 %0.64 902 %0.64
Operated MV in Careless orNegligent Manner
651 50,088%27.25 %37.46 44,201 %31.43
Wrong Side of Wrong Way 53 541%2.22 %0.40 363 %0.26
Improper Turn 36 2,755%1.51 %2.06 3,014 %2.14
Followed too Closely 12 7,008%0.50 %5.24 5,137 %3.65
Disregarded Other RoadMarkings
1 82%0.04 %0.06 84 %0.06
Improper Passing 12 737%0.50 %0.55 1,181 %0.84
Disregarded Other Traffic Sign 9 182%0.38 %0.14 157 %0.11
Ran Red Light 51 4,803%2.13 %3.59 2,463 %1.75
Swerved or Avoided : Due toWind, Slippery Surface, MV,Object, Non.Motorist inRoadway, etc.
10 1,046%0.42 %0.78 1,002 %0.71
Improper Backing 30 2,268%1.26 %1.70 7,484 %5.32
Exceeded Posted Speed 112 526%4.69 %0.39 267 %0.19
Other Contributing Action 289 13,911%12.10 %10.40 23,328 %16.59
Failed to Yield Right of Way 404 22,974%16.91 %17.18 12,759 %9.07
Drove too Fast for Conditions 86 3,069%3.60 %2.30 2,751 %1.96
Ran Stop Sign 42 2,201%1.76 %1.65 1,424 %1.01
Over Correcting/Over Steering 19 705%0.80 %0.53 661 %0.47
Failed to Keep in Proper Lane 112 2,874%4.69 %2.15 3,823 %2.72
2,389 133,714 140,620
33Page
10/7/2013Create Date:
40,464281
4,14830
514
6
4349
4024
368
14
50312
1,005
15
1,925
10
2,1096
1,766
7
1,808
5
1,903
7
40,478248
4,10519
402
5
3769
3004
273
4
4317
99611
2,158
8
2,31911
1,713
7
1,705
11
1,901
9
40,870250
4,24119
434
6
4386
3644
316
8
4727
1,054
13
1,957
4
2,2738
1,803
5
1,729
7
1,836
5
41,538277
4,28420
526
11
58411
4519
398
8
5028
1,040
17
2,032
7
2,1627
1,732
13
1,757
8
1,896
11
47,098344
4,81831
620
12
72517
55712
512
8
5319
9618
1,809
12
2,00712
1,769
8
1,718
10
2,093
5
38,893439
4,53340
1,152
18
1,269
31
1,07319
846
17
7634
69114
810
7
1,0489
1,236
3
1,488
11
1,875
13
32,208407
3,95732
1,194
29
1,370
33
1,09128
901
19
72911
61013
623
11
7179
87313
1,092
13
1,275
9
281,5492,246
30,086191
4,842
87
5,196
116
4,23880
3,614
78
3,93158
6,357
91
11,314
59
12,63562
10,892
56
11,297
65
12,779
59
Total
Midnight
1
2
3
4
5
6
7
8
9
10
11
TotalSUNDAYSATURDAYFRIDAYTHURSDAYWEDNESDAYTUESDAYMONDAY
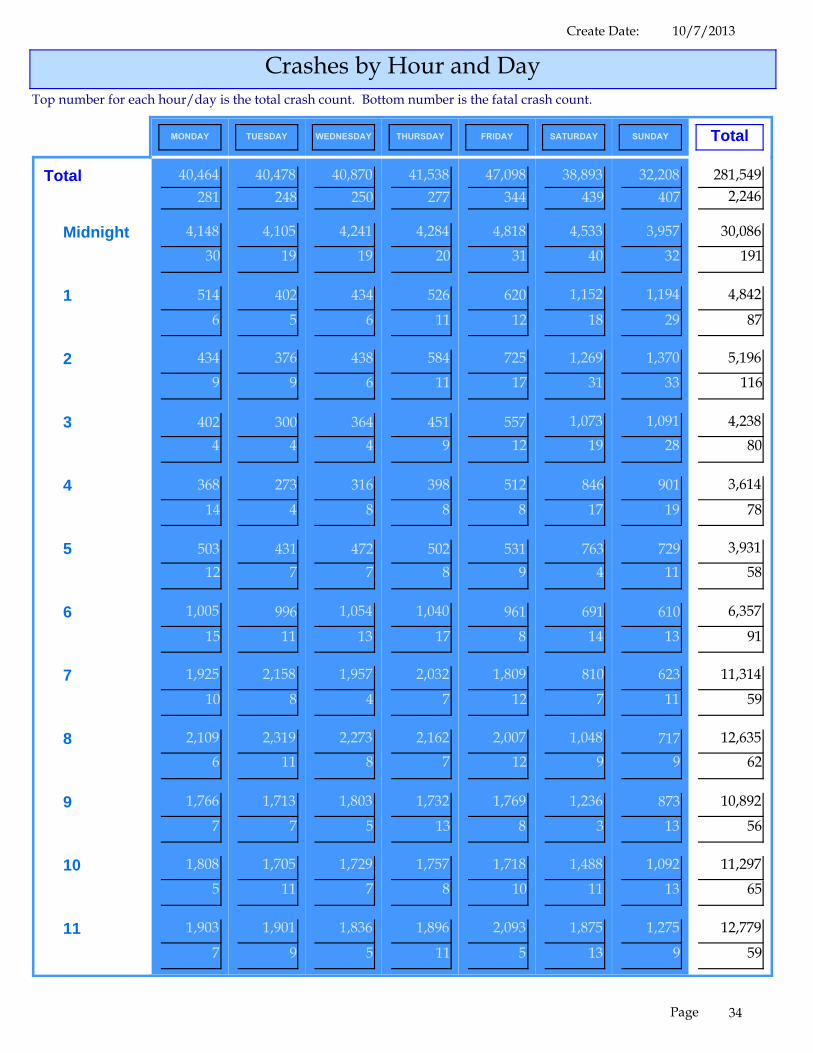
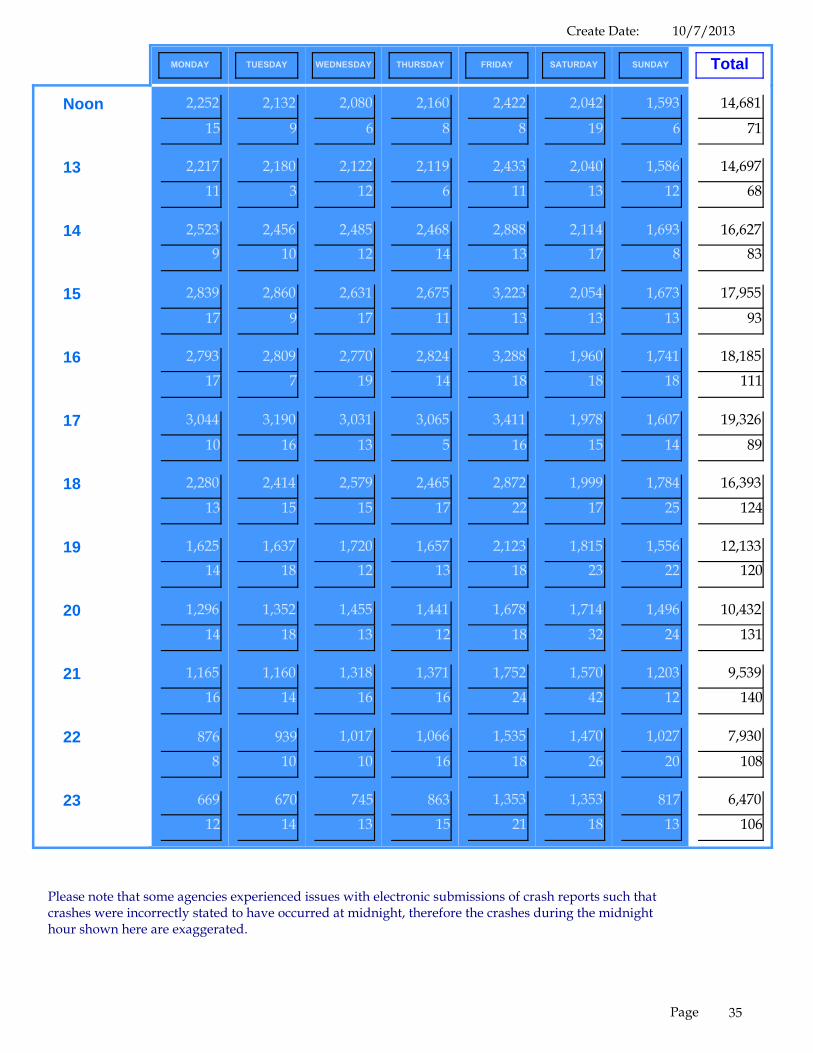
Crashes by Hour and DayTop number for each hour/day is the total crash count. Bottom number is the fatal crash count.
34Page
10/7/2013Create Date:
2,252
15
2,217
11
2,5239
2,839
17
2,79317
3,044
10
2,280
13
1,62514
1,296
14
1,165
16
8768
66912
2,132
9
2,180
3
2,45610
2,860
9
2,8097
3,190
16
2,414
15
1,63718
1,352
18
1,160
14
93910
67014
2,080
6
2,122
12
2,48512
2,631
17
2,77019
3,031
13
2,579
15
1,72012
1,455
13
1,318
16
1,017
10
74513
2,160
8
2,119
6
2,46814
2,675
11
2,82414
3,065
5
2,465
17
1,65713
1,441
12
1,371
16
1,066
16
86315
2,422
8
2,433
11
2,88813
3,223
13
3,28818
3,411
16
2,872
22
2,12318
1,678
18
1,752
24
1,535
18
1,353
21
2,042
19
2,040
13
2,11417
2,054
13
1,96018
1,978
15
1,999
17
1,81523
1,714
32
1,570
42
1,470
26
1,353
18
1,593
6
1,586
12
1,6938
1,673
13
1,74118
1,607
14
1,784
25
1,55622
1,496
24
1,203
12
1,027
20
81713
14,681
71
14,697
68
16,62783
17,955
93
18,185111
19,326
89
16,393
124
12,133120
10,432
131
9,539
140
7,930
108
6,470
106
Noon
13
14
15
16
17
18
19
20
21
22
23
TotalSUNDAYSATURDAYFRIDAYTHURSDAYWEDNESDAYTUESDAYMONDAY
Please note that some agencies experienced issues with electronic submissions of crash reports such thatcrashes were incorrectly stated to have occurred at midnight, therefore the crashes during the midnighthour shown here are exaggerated.
35Page
10/7/2013Create Date:
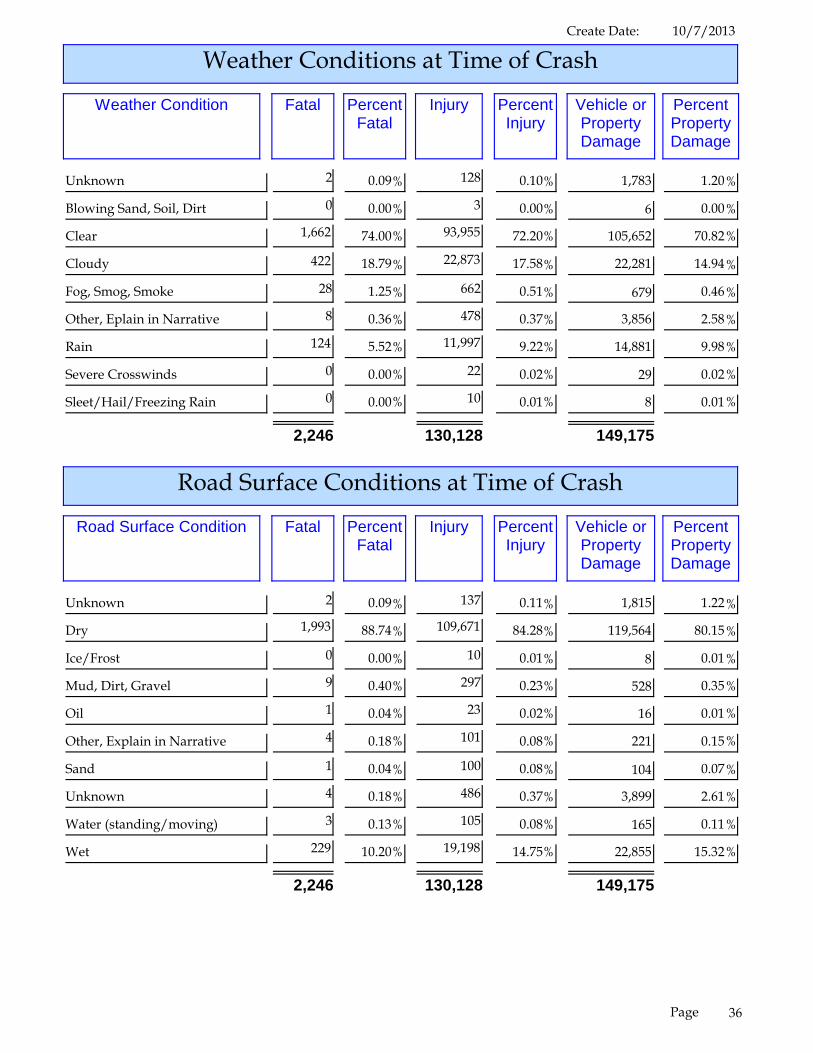
Weather Conditions at Time of Crash
Weather Condition PercentFatal
PercentPropertyDamage
Vehicle orPropertyDamage
PercentInjury
InjuryFatal
Unknown 2 128%0.09 %0.10 1,783 %1.20
Blowing Sand, Soil, Dirt 0 3%0.00 %0.00 6 %0.00
Clear 1,662 93,955%74.00 %72.20 105,652 %70.82
Cloudy 422 22,873%18.79 %17.58 22,281 %14.94
Fog, Smog, Smoke 28 662%1.25 %0.51 679 %0.46
Other, Eplain in Narrative 8 478%0.36 %0.37 3,856 %2.58
Rain 124 11,997%5.52 %9.22 14,881 %9.98
Severe Crosswinds 0 22%0.00 %0.02 29 %0.02
Sleet/Hail/Freezing Rain 0 10%0.00 %0.01 8 %0.01
2,246 130,128 149,175
Road Surface Conditions at Time of Crash
Road Surface Condition PercentFatal
PercentPropertyDamage
Vehicle orPropertyDamage
PercentInjury
InjuryFatal
Unknown 2 137%0.09 %0.11 1,815 %1.22
Dry 1,993 109,671%88.74 %84.28 119,564 %80.15
Ice/Frost 0 10%0.00 %0.01 8 %0.01
Mud, Dirt, Gravel 9 297%0.40 %0.23 528 %0.35
Oil 1 23%0.04 %0.02 16 %0.01
Other, Explain in Narrative 4 101%0.18 %0.08 221 %0.15
Sand 1 100%0.04 %0.08 104 %0.07
Unknown 4 486%0.18 %0.37 3,899 %2.61
Water (standing/moving) 3 105%0.13 %0.08 165 %0.11
Wet 229 19,198%10.20 %14.75 22,855 %15.32
2,246 130,128 149,175
36Page
10/7/2013Create Date:
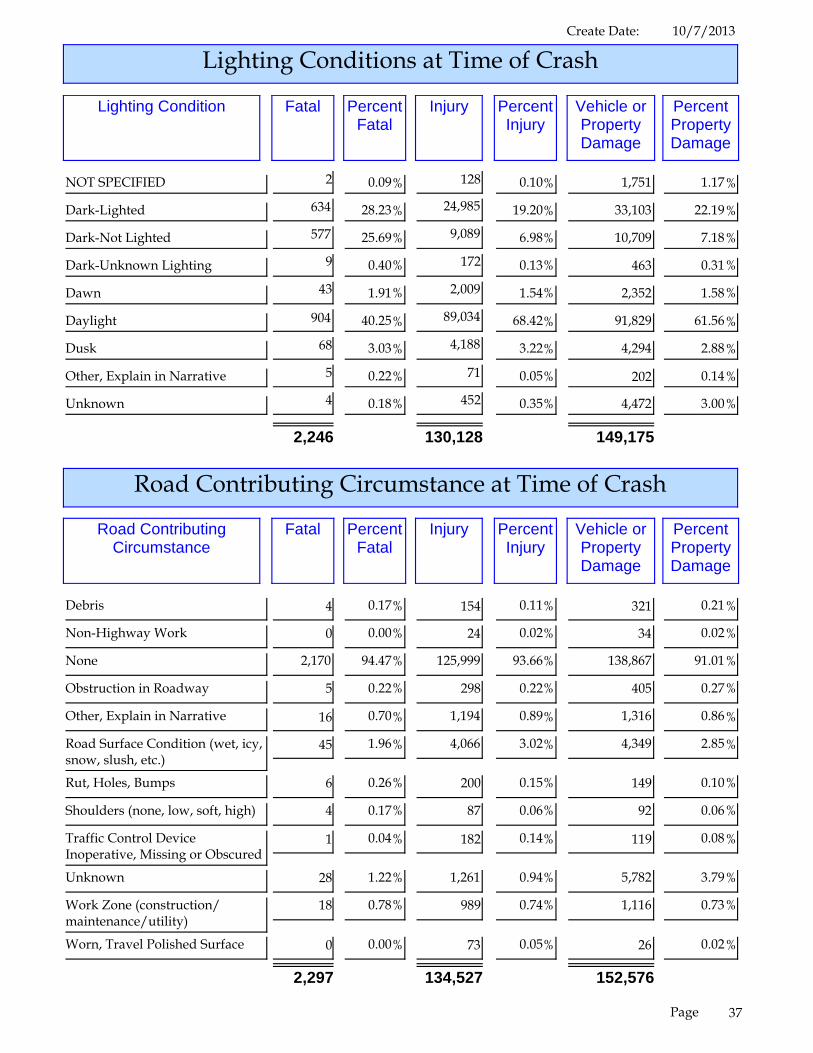
Lighting Conditions at Time of Crash
Lighting Condition PercentFatal
PercentPropertyDamage
Vehicle orPropertyDamage
PercentInjury
InjuryFatal
NOT SPECIFIED 2 128%0.09 %0.10 1,751 %1.17
Dark-Lighted 634 24,985%28.23 %19.20 33,103 %22.19
Dark-Not Lighted 577 9,089%25.69 %6.98 10,709 %7.18
Dark-Unknown Lighting 9 172%0.40 %0.13 463 %0.31
Dawn 43 2,009%1.91 %1.54 2,352 %1.58
Daylight 904 89,034%40.25 %68.42 91,829 %61.56
Dusk 68 4,188%3.03 %3.22 4,294 %2.88
Other, Explain in Narrative 5 71%0.22 %0.05 202 %0.14
Unknown 4 452%0.18 %0.35 4,472 %3.00
2,246 130,128 149,175
Road Contributing Circumstance at Time of Crash
Road ContributingCircumstance
PercentFatal
PercentPropertyDamage
Vehicle orPropertyDamage
PercentInjury
InjuryFatal
Debris 4 154%0.17 %0.11 321 %0.21
Non-Highway Work 0 24%0.00 %0.02 34 %0.02
None 2,170 125,999%94.47 %93.66 138,867 %91.01
Obstruction in Roadway 5 298%0.22 %0.22 405 %0.27
Other, Explain in Narrative 16 1,194%0.70 %0.89 1,316 %0.86
Road Surface Condition (wet, icy,snow, slush, etc.)
45 4,066%1.96 %3.02 4,349 %2.85
Rut, Holes, Bumps 6 200%0.26 %0.15 149 %0.10
Shoulders (none, low, soft, high) 4 87%0.17 %0.06 92 %0.06
Traffic Control DeviceInoperative, Missing or Obscured
1 182%0.04 %0.14 119 %0.08
Unknown 28 1,261%1.22 %0.94 5,782 %3.79
Work Zone (construction/maintenance/utility)
18 989%0.78 %0.74 1,116 %0.73
Worn, Travel Polished Surface 0 73%0.00 %0.05 26 %0.02
2,297 134,527 152,576
37Page

10/7/2013Create Date:
Traffic Crashes by Road Type
Road Type PercentFatal
PercentPropertyDamage
Vehicle orPropertyDamage
PercentInjury
InjuryFatal
NOT SPECIFIED 1 144%0.04 %0.11 1,410 %0.95
County 477 24,360%21.24 %18.72 22,352 %14.98
Forest Road 2 53%0.09 %0.04 49 %0.03
Interstate 263 11,230%11.71 %8.63 14,952 %10.02
Local 446 35,944%19.86 %27.62 41,817 %28.03
Other, Explain in Narrative 7 936%0.31 %0.72 3,476 %2.33
Parking Lot 9 3,975%0.40 %3.05 17,575 %11.78
Private Roadway 17 976%0.76 %0.75 2,246 %1.51
State 648 37,764%28.85 %29.02 32,371 %21.70
Turnpike/Toll 33 1,819%1.47 %1.40 2,956 %1.98
U.S. 343 12,927%15.27 %9.93 9,971 %6.68
2,246 130,128 149,175
38Page
10/7/2013Create Date:
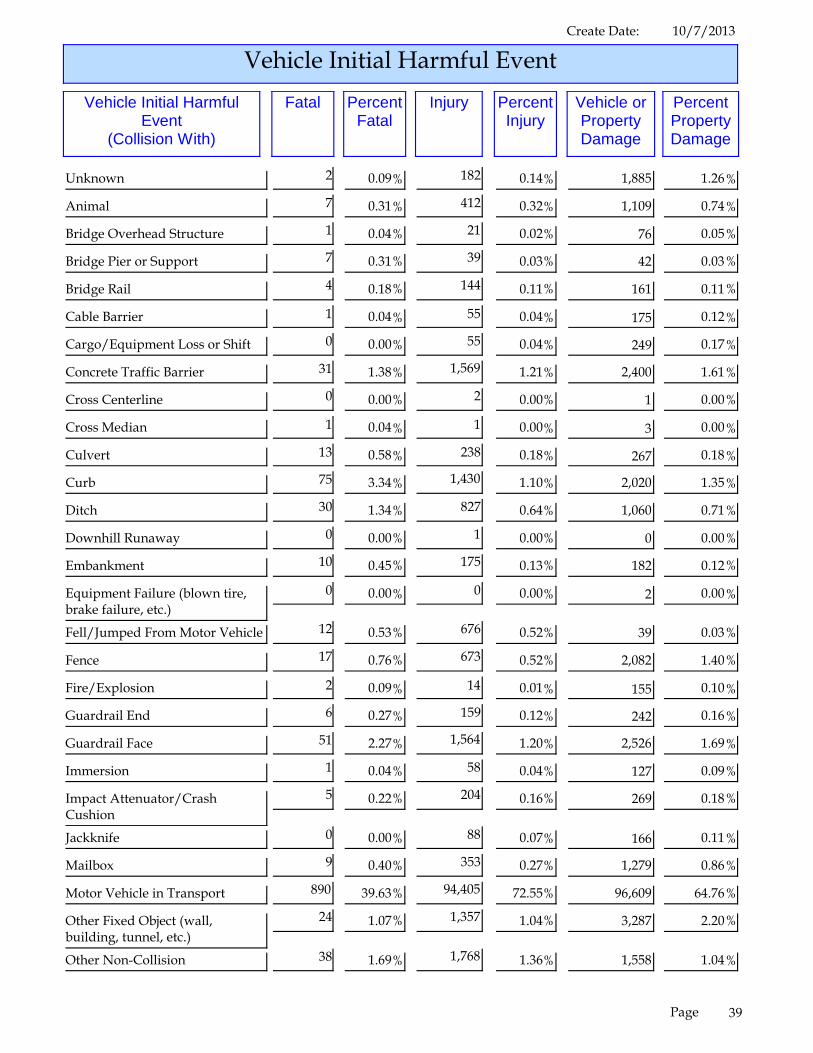
Vehicle Initial Harmful EventVehicle Initial Harmful
Event(Collision With)
PercentFatal
PercentPropertyDamage
Vehicle orPropertyDamage
PercentInjury
InjuryFatal
Unknown 2 182%0.09 %0.14 1,885 %1.26
Animal 7 412%0.31 %0.32 1,109 %0.74
Bridge Overhead Structure 1 21%0.04 %0.02 76 %0.05
Bridge Pier or Support 7 39%0.31 %0.03 42 %0.03
Bridge Rail 4 144%0.18 %0.11 161 %0.11
Cable Barrier 1 55%0.04 %0.04 175 %0.12
Cargo/Equipment Loss or Shift 0 55%0.00 %0.04 249 %0.17
Concrete Traffic Barrier 31 1,569%1.38 %1.21 2,400 %1.61
Cross Centerline 0 2%0.00 %0.00 1 %0.00
Cross Median 1 1%0.04 %0.00 3 %0.00
Culvert 13 238%0.58 %0.18 267 %0.18
Curb 75 1,430%3.34 %1.10 2,020 %1.35
Ditch 30 827%1.34 %0.64 1,060 %0.71
Downhill Runaway 0 1%0.00 %0.00 0 %0.00
Embankment 10 175%0.45 %0.13 182 %0.12
Equipment Failure (blown tire,brake failure, etc.)
0 0%0.00 %0.00 2 %0.00
Fell/Jumped From Motor Vehicle 12 676%0.53 %0.52 39 %0.03
Fence 17 673%0.76 %0.52 2,082 %1.40
Fire/Explosion 2 14%0.09 %0.01 155 %0.10
Guardrail End 6 159%0.27 %0.12 242 %0.16
Guardrail Face 51 1,564%2.27 %1.20 2,526 %1.69
Immersion 1 58%0.04 %0.04 127 %0.09
Impact Attenuator/CrashCushion
5 204%0.22 %0.16 269 %0.18
Jackknife 0 88%0.00 %0.07 166 %0.11
Mailbox 9 353%0.40 %0.27 1,279 %0.86
Motor Vehicle in Transport 890 94,405%39.63 %72.55 96,609 %64.76
Other Fixed Object (wall,building, tunnel, etc.)
24 1,357%1.07 %1.04 3,287 %2.20
Other Non-Collision 38 1,768%1.69 %1.36 1,558 %1.04
39Page
10/7/2013Create Date:
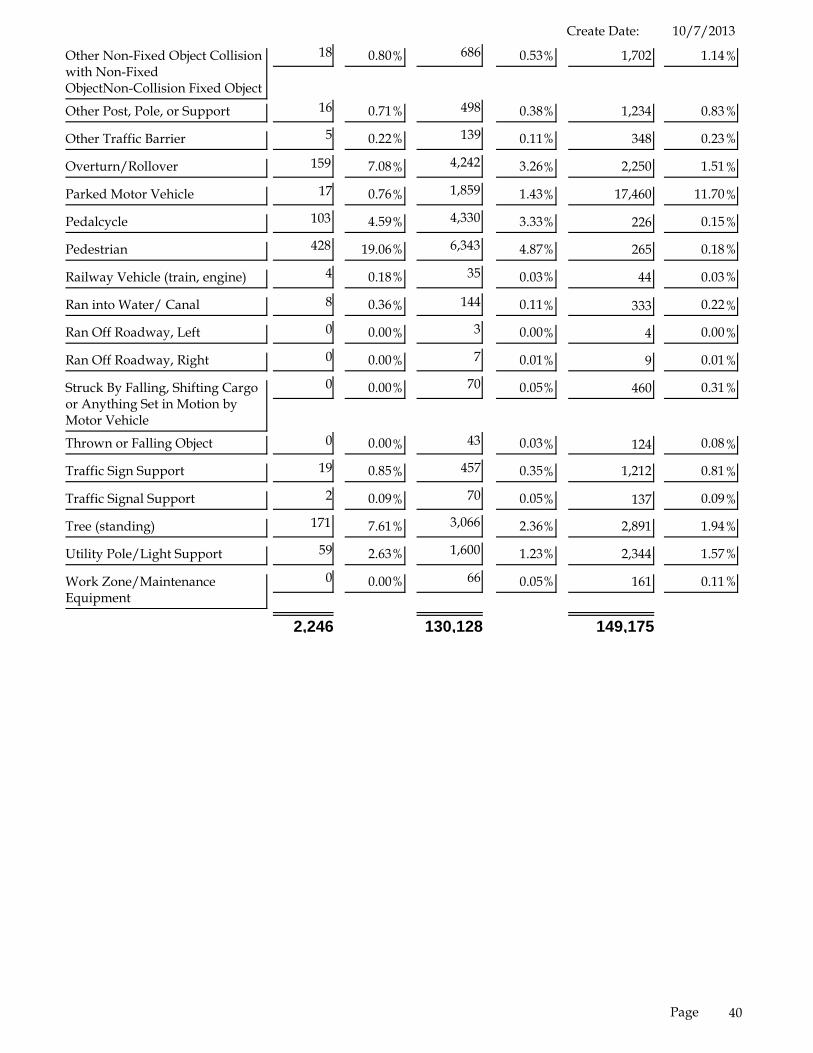
Other Non-Fixed Object Collisionwith Non-FixedObjectNon-Collision Fixed Object
18 686%0.80 %0.53 1,702 %1.14
Other Post, Pole, or Support 16 498%0.71 %0.38 1,234 %0.83
Other Traffic Barrier 5 139%0.22 %0.11 348 %0.23
Overturn/Rollover 159 4,242%7.08 %3.26 2,250 %1.51
Parked Motor Vehicle 17 1,859%0.76 %1.43 17,460 %11.70
Pedalcycle 103 4,330%4.59 %3.33 226 %0.15
Pedestrian 428 6,343%19.06 %4.87 265 %0.18
Railway Vehicle (train, engine) 4 35%0.18 %0.03 44 %0.03
Ran into Water/ Canal 8 144%0.36 %0.11 333 %0.22
Ran Off Roadway, Left 0 3%0.00 %0.00 4 %0.00
Ran Off Roadway, Right 0 7%0.00 %0.01 9 %0.01
Struck By Falling, Shifting Cargoor Anything Set in Motion byMotor Vehicle
0 70%0.00 %0.05 460 %0.31
Thrown or Falling Object 0 43%0.00 %0.03 124 %0.08
Traffic Sign Support 19 457%0.85 %0.35 1,212 %0.81
Traffic Signal Support 2 70%0.09 %0.05 137 %0.09
Tree (standing) 171 3,066%7.61 %2.36 2,891 %1.94
Utility Pole/Light Support 59 1,600%2.63 %1.23 2,344 %1.57
Work Zone/MaintenanceEquipment
0 66%0.00 %0.05 161 %0.11
2,246 130,128 149,175
40Page
10/7/2013Create Date:
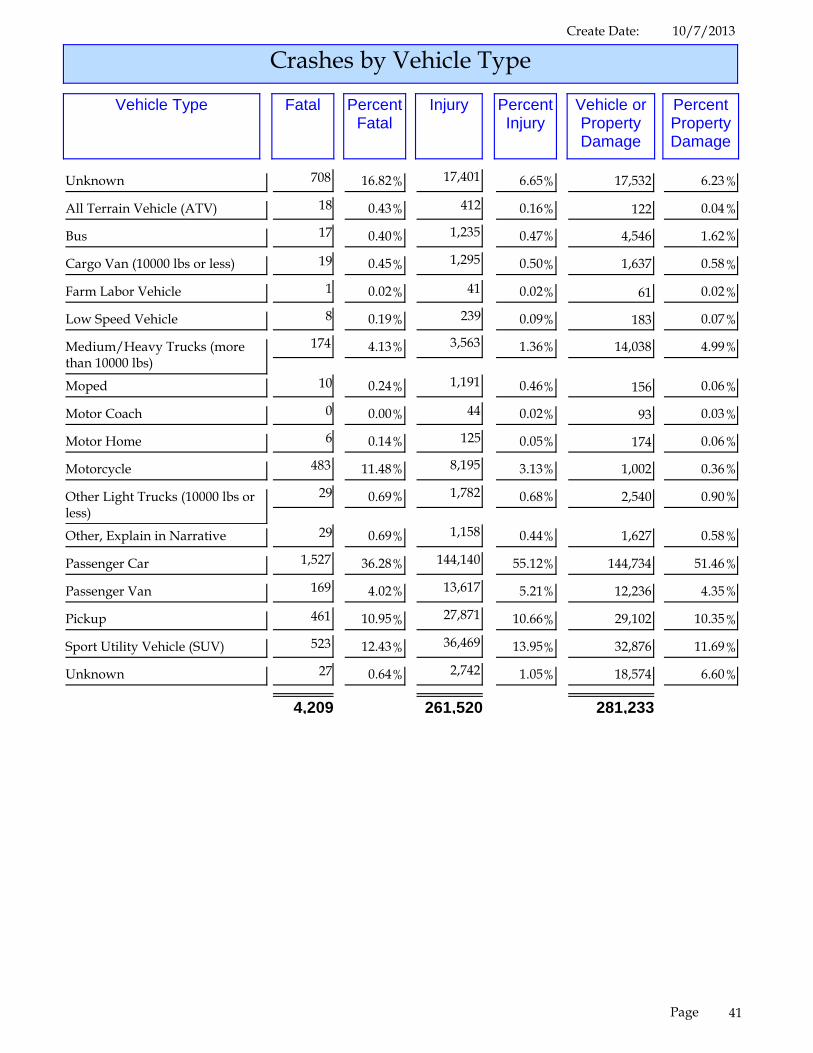
Crashes by Vehicle Type
Vehicle Type PercentFatal
PercentPropertyDamage
Vehicle orPropertyDamage
PercentInjury
InjuryFatal
Unknown 708 17,401%16.82 %6.65 17,532 %6.23
All Terrain Vehicle (ATV) 18 412%0.43 %0.16 122 %0.04
Bus 17 1,235%0.40 %0.47 4,546 %1.62
Cargo Van (10000 lbs or less) 19 1,295%0.45 %0.50 1,637 %0.58
Farm Labor Vehicle 1 41%0.02 %0.02 61 %0.02
Low Speed Vehicle 8 239%0.19 %0.09 183 %0.07
Medium/Heavy Trucks (morethan 10000 lbs)
174 3,563%4.13 %1.36 14,038 %4.99
Moped 10 1,191%0.24 %0.46 156 %0.06
Motor Coach 0 44%0.00 %0.02 93 %0.03
Motor Home 6 125%0.14 %0.05 174 %0.06
Motorcycle 483 8,195%11.48 %3.13 1,002 %0.36
Other Light Trucks (10000 lbs orless)
29 1,782%0.69 %0.68 2,540 %0.90
Other, Explain in Narrative 29 1,158%0.69 %0.44 1,627 %0.58
Passenger Car 1,527 144,140%36.28 %55.12 144,734 %51.46
Passenger Van 169 13,617%4.02 %5.21 12,236 %4.35
Pickup 461 27,871%10.95 %10.66 29,102 %10.35
Sport Utility Vehicle (SUV) 523 36,469%12.43 %13.95 32,876 %11.69
Unknown 27 2,742%0.64 %1.05 18,574 %6.60
4,209 261,520 281,233
41Page
10/7/2013Create Date:
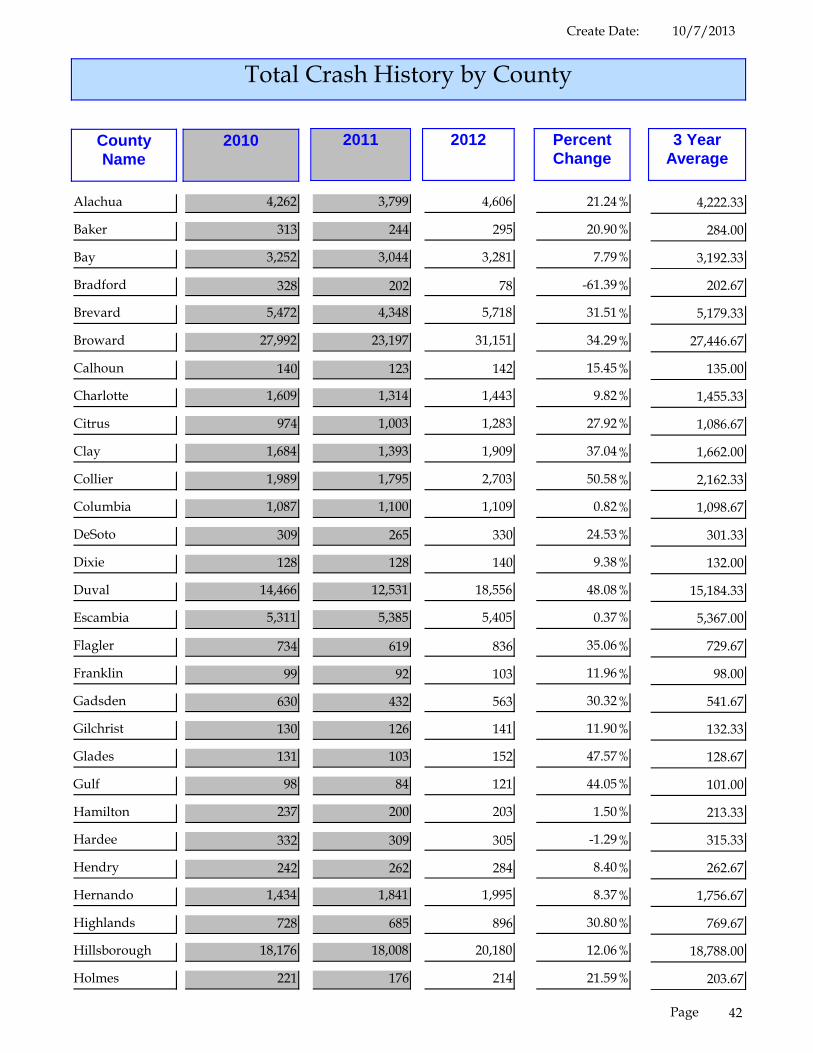
Total Crash History by County
3 YearAverage
PercentChange
201220112010CountyName
Alachua 4,262 3,799 4,606 %21.24 4,222.33
Baker 313 244 295 %20.90 284.00
Bay 3,252 3,044 3,281 %7.79 3,192.33
Bradford 328 202 78 %-61.39 202.67
Brevard 5,472 4,348 5,718 %31.51 5,179.33
Broward 27,992 23,197 31,151 %34.29 27,446.67
Calhoun 140 123 142 %15.45 135.00
Charlotte 1,609 1,314 1,443 %9.82 1,455.33
Citrus 974 1,003 1,283 %27.92 1,086.67
Clay 1,684 1,393 1,909 %37.04 1,662.00
Collier 1,989 1,795 2,703 %50.58 2,162.33
Columbia 1,087 1,100 1,109 %0.82 1,098.67
DeSoto 309 265 330 %24.53 301.33
Dixie 128 128 140 %9.38 132.00
Duval 14,466 12,531 18,556 %48.08 15,184.33
Escambia 5,311 5,385 5,405 %0.37 5,367.00
Flagler 734 619 836 %35.06 729.67
Franklin 99 92 103 %11.96 98.00
Gadsden 630 432 563 %30.32 541.67
Gilchrist 130 126 141 %11.90 132.33
Glades 131 103 152 %47.57 128.67
Gulf 98 84 121 %44.05 101.00
Hamilton 237 200 203 %1.50 213.33
Hardee 332 309 305 %-1.29 315.33
Hendry 242 262 284 %8.40 262.67
Hernando 1,434 1,841 1,995 %8.37 1,756.67
Highlands 728 685 896 %30.80 769.67
Hillsborough 18,176 18,008 20,180 %12.06 18,788.00
Holmes 221 176 214 %21.59 203.67
42Page

10/7/2013Create Date:
Indian River 1,028 800 1,192 %49.00 1,006.67
Jackson 650 515 621 %20.58 595.33
Jefferson 184 179 234 %30.73 199.00
Lafayette 67 37 38 %2.70 47.33
Lake 2,695 2,431 3,012 %23.90 2,712.67
Lee 5,254 4,417 6,084 %37.74 5,251.67
Leon 5,260 4,927 5,533 %12.30 5,240.00
Levy 475 447 439 %-1.79 453.67
Liberty 91 75 69 %-8.00 78.33
Madison 391 282 323 %14.54 332.00
Manatee 4,275 4,060 4,480 %10.34 4,271.67
Marion 3,854 3,790 4,422 %16.68 4,022.00
Martin 1,549 1,202 1,617 %34.53 1,456.00
Miami-Dade 46,100 42,279 50,818 %20.20 46,399.00
Monroe 1,360 1,263 1,671 %32.30 1,431.33
Nassau 635 421 633 %50.36 563.00
Okaloosa 2,195 2,121 2,512 %18.43 2,276.00
Okeechobee 363 311 387 %24.44 353.67
Orange 19,480 19,088 21,460 %12.43 20,009.33
Osceola 3,526 2,952 3,325 %12.64 3,267.67
Palm Beach 13,982 11,542 16,726 %44.91 14,083.33
Pasco 5,929 5,610 6,001 %6.97 5,846.67
Pinellas 13,683 10,878 13,601 %25.03 12,720.67
Polk 5,968 5,133 6,624 %29.05 5,908.33
Putnam 765 740 867 %17.16 790.67
Santa Rosa 1,525 1,499 1,666 %11.14 1,563.33
Sarasota 4,103 3,702 4,425 %19.53 4,076.67
Seminole 2,762 3,190 4,302 %34.86 3,418.00
St. Johns 1,308 1,745 2,390 %36.96 1,814.33
St. Lucie 2,309 2,163 2,563 %18.49 2,345.00
Sumter 782 716 579 %-19.13 692.33
Suwannee 491 441 486 %10.20 472.67
Taylor 259 191 232 %21.47 227.33
Union 125 106 104 %-1.89 111.67
43Page
10/7/2013Create Date:
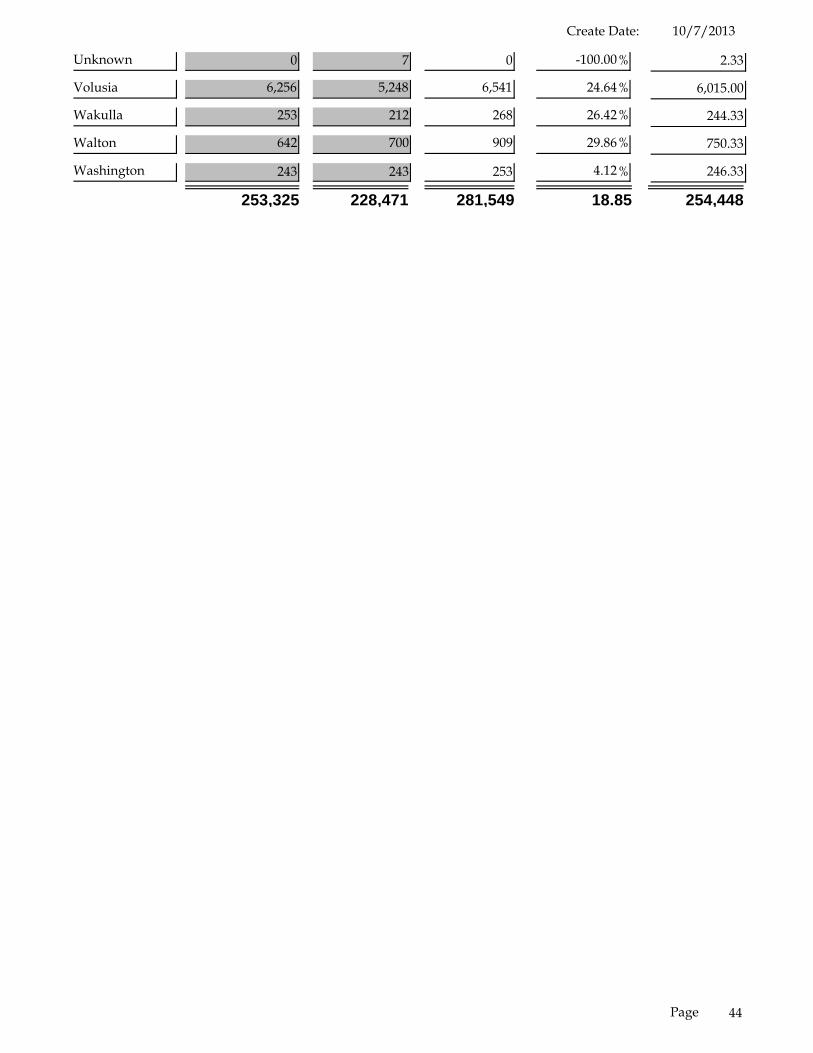
Unknown 0 7 0 %-100.00 2.33
Volusia 6,256 5,248 6,541 %24.64 6,015.00
Wakulla 253 212 268 %26.42 244.33
Walton 642 700 909 %29.86 750.33
Washington 243 243 253 %4.12 246.33
253,325 228,471 281,549 18.85 254,448
44Page

10/7/2013Create Date:
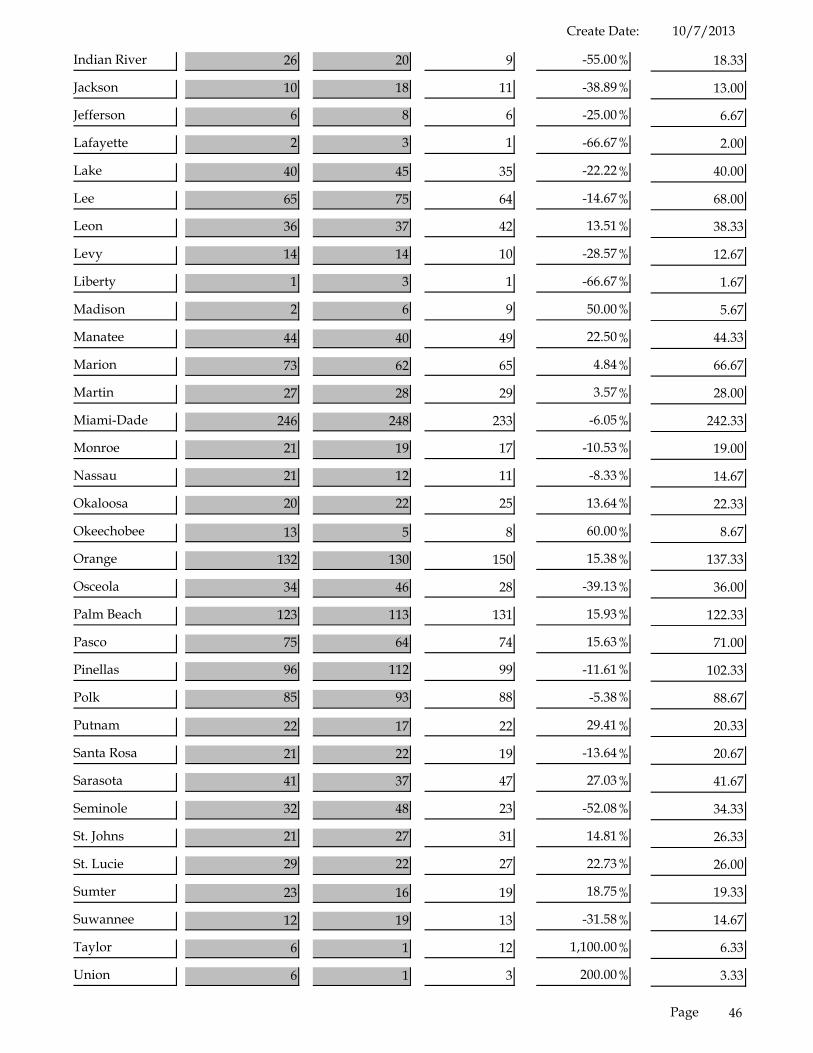
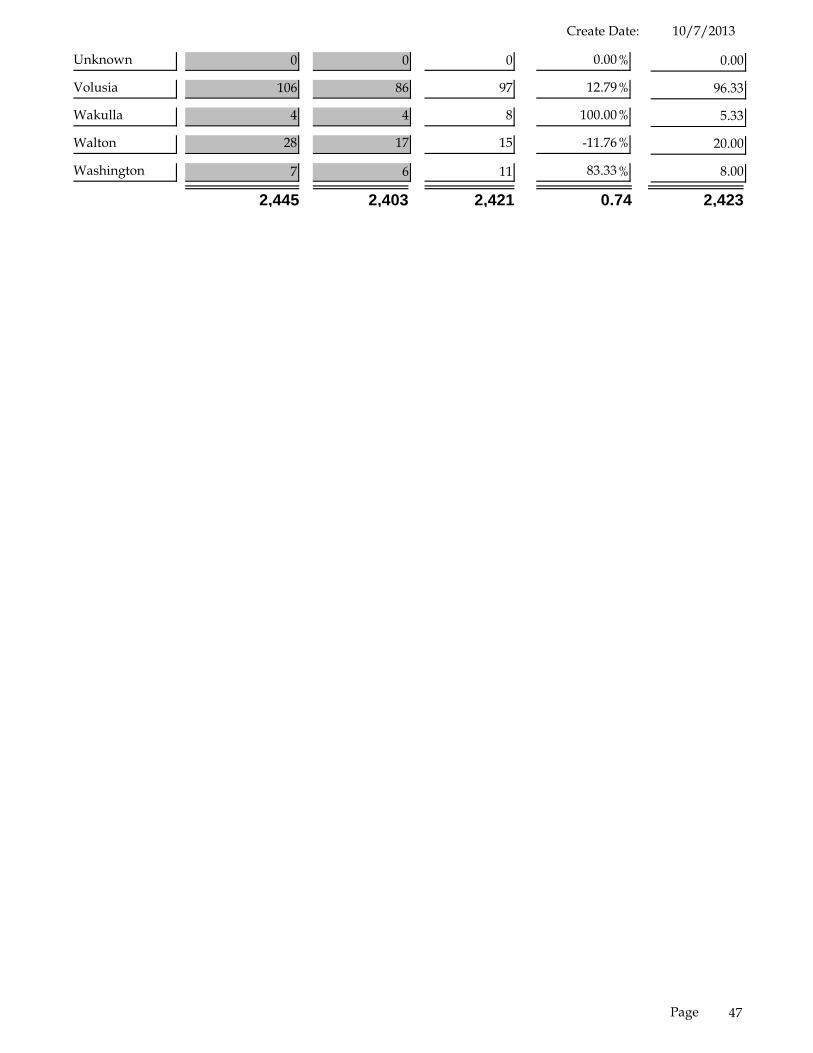
Fatality History by County
3 YearAverage
PercentChange
201220112010CountyName
Alachua 26 27 36 %33.33 29.67
Baker 12 12 8 %-33.33 10.67
Bay 18 24 33 %37.50 25.00
Bradford 7 9 4 %-55.56 6.67
Brevard 64 72 52 %-27.78 62.67
Broward 179 160 182 %13.75 173.67
Calhoun 3 5 4 %-20.00 4.00
Charlotte 21 26 18 %-30.77 21.67
Citrus 25 17 19 %11.76 20.33
Clay 14 15 14 %-6.67 14.33
Collier 43 40 33 %-17.50 38.67
Columbia 25 31 9 %-70.97 21.67
DeSoto 4 8 7 %-12.50 6.33
Dixie 3 5 10 %100.00 6.00
Duval 110 90 119 %32.22 106.33
Escambia 36 45 40 %-11.11 40.33
Flagler 24 22 15 %-31.82 20.33
Franklin 6 2 4 %100.00 4.00
Gadsden 11 9 16 %77.78 12.00
Gilchrist 4 4 2 %-50.00 3.33
Glades 2 5 4 %-20.00 3.67
Gulf 2 3 4 %33.33 3.00
Hamilton 8 8 11 %37.50 9.00
Hardee 14 11 7 %-36.36 10.67
Hendry 10 9 6 %-33.33 8.33
Hernando 28 29 24 %-17.24 27.00
Highlands 19 11 17 %54.55 15.67
Hillsborough 153 151 178 %17.88 160.67
Holmes 4 7 3 %-57.14 4.67
45Page
10/7/2013Create Date:
Indian River 26 20 9 %-55.00 18.33
Jackson 10 18 11 %-38.89 13.00
Jefferson 6 8 6 %-25.00 6.67
Lafayette 2 3 1 %-66.67 2.00
Lake 40 45 35 %-22.22 40.00
Lee 65 75 64 %-14.67 68.00
Leon 36 37 42 %13.51 38.33
Levy 14 14 10 %-28.57 12.67
Liberty 1 3 1 %-66.67 1.67
Madison 2 6 9 %50.00 5.67
Manatee 44 40 49 %22.50 44.33
Marion 73 62 65 %4.84 66.67
Martin 27 28 29 %3.57 28.00
Miami-Dade 246 248 233 %-6.05 242.33
Monroe 21 19 17 %-10.53 19.00
Nassau 21 12 11 %-8.33 14.67
Okaloosa 20 22 25 %13.64 22.33
Okeechobee 13 5 8 %60.00 8.67
Orange 132 130 150 %15.38 137.33
Osceola 34 46 28 %-39.13 36.00
Palm Beach 123 113 131 %15.93 122.33
Pasco 75 64 74 %15.63 71.00
Pinellas 96 112 99 %-11.61 102.33
Polk 85 93 88 %-5.38 88.67
Putnam 22 17 22 %29.41 20.33
Santa Rosa 21 22 19 %-13.64 20.67
Sarasota 41 37 47 %27.03 41.67
Seminole 32 48 23 %-52.08 34.33
St. Johns 21 27 31 %14.81 26.33
St. Lucie 29 22 27 %22.73 26.00
Sumter 23 16 19 %18.75 19.33
Suwannee 12 19 13 %-31.58 14.67
Taylor 6 1 12 %1,100.00 6.33
Union 6 1 3 %200.00 3.33
46Page
10/7/2013Create Date:
Unknown 0 0 0 %0.00 0.00
Volusia 106 86 97 %12.79 96.33
Wakulla 4 4 8 %100.00 5.33
Walton 28 17 15 %-11.76 20.00
Washington 7 6 11 %83.33 8.00
2,445 2,403 2,421 0.74 2,423
47Page
10/7/2013Create Date:
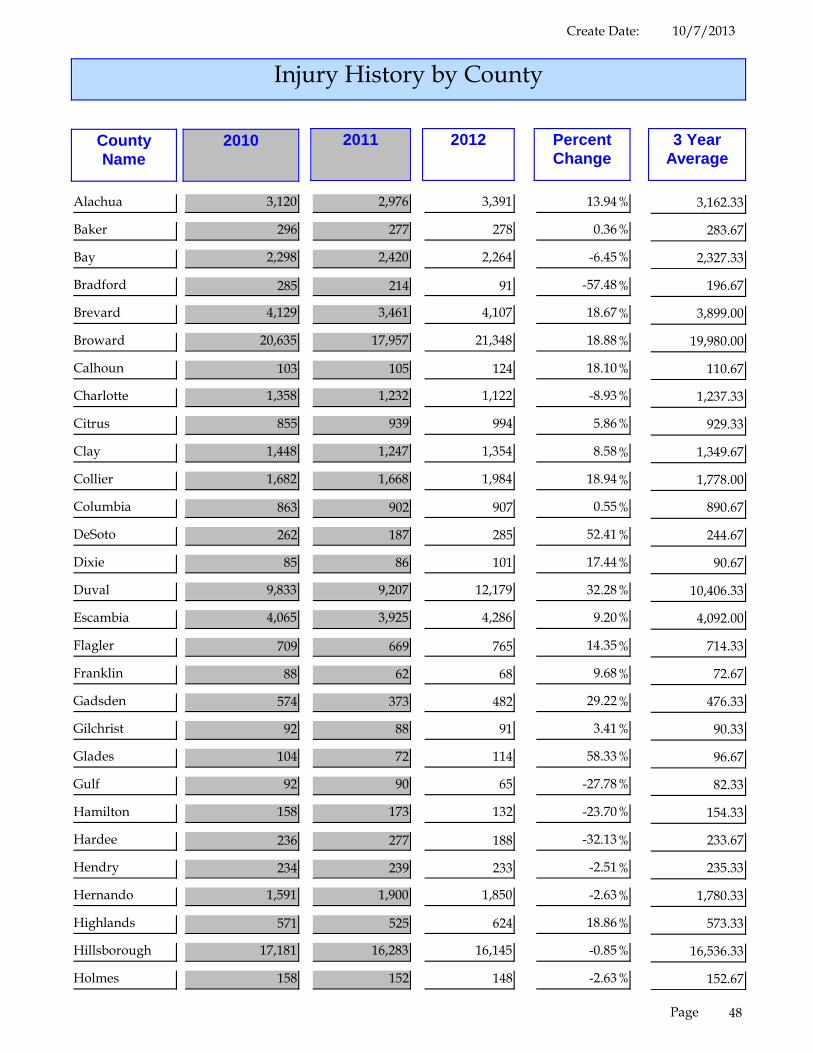
Injury History by County
3 YearAverage
PercentChange
201220112010CountyName
Alachua 3,120 2,976 3,391 %13.94 3,162.33
Baker 296 277 278 %0.36 283.67
Bay 2,298 2,420 2,264 %-6.45 2,327.33
Bradford 285 214 91 %-57.48 196.67
Brevard 4,129 3,461 4,107 %18.67 3,899.00
Broward 20,635 17,957 21,348 %18.88 19,980.00
Calhoun 103 105 124 %18.10 110.67
Charlotte 1,358 1,232 1,122 %-8.93 1,237.33
Citrus 855 939 994 %5.86 929.33
Clay 1,448 1,247 1,354 %8.58 1,349.67
Collier 1,682 1,668 1,984 %18.94 1,778.00
Columbia 863 902 907 %0.55 890.67
DeSoto 262 187 285 %52.41 244.67
Dixie 85 86 101 %17.44 90.67
Duval 9,833 9,207 12,179 %32.28 10,406.33
Escambia 4,065 3,925 4,286 %9.20 4,092.00
Flagler 709 669 765 %14.35 714.33
Franklin 88 62 68 %9.68 72.67
Gadsden 574 373 482 %29.22 476.33
Gilchrist 92 88 91 %3.41 90.33
Glades 104 72 114 %58.33 96.67
Gulf 92 90 65 %-27.78 82.33
Hamilton 158 173 132 %-23.70 154.33
Hardee 236 277 188 %-32.13 233.67
Hendry 234 239 233 %-2.51 235.33
Hernando 1,591 1,900 1,850 %-2.63 1,780.33
Highlands 571 525 624 %18.86 573.33
Hillsborough 17,181 16,283 16,145 %-0.85 16,536.33
Holmes 158 152 148 %-2.63 152.67
48Page
10/7/2013Create Date:
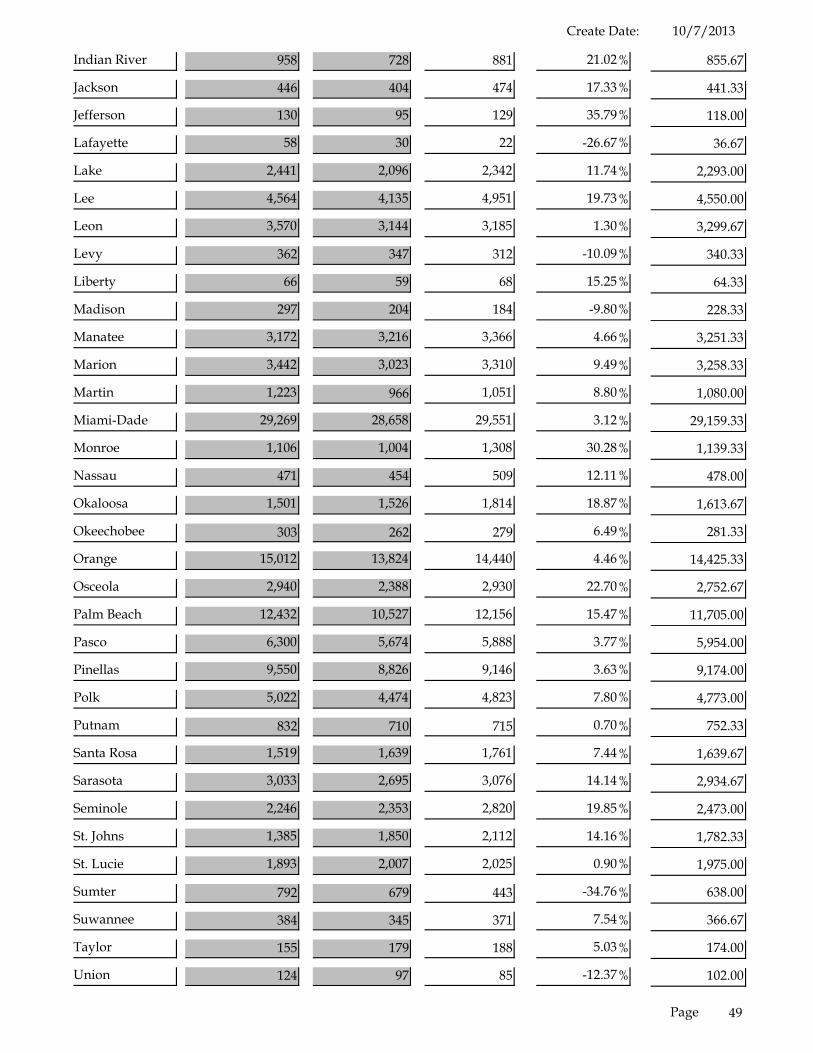
Indian River 958 728 881 %21.02 855.67
Jackson 446 404 474 %17.33 441.33
Jefferson 130 95 129 %35.79 118.00
Lafayette 58 30 22 %-26.67 36.67
Lake 2,441 2,096 2,342 %11.74 2,293.00
Lee 4,564 4,135 4,951 %19.73 4,550.00
Leon 3,570 3,144 3,185 %1.30 3,299.67
Levy 362 347 312 %-10.09 340.33
Liberty 66 59 68 %15.25 64.33
Madison 297 204 184 %-9.80 228.33
Manatee 3,172 3,216 3,366 %4.66 3,251.33
Marion 3,442 3,023 3,310 %9.49 3,258.33
Martin 1,223 966 1,051 %8.80 1,080.00
Miami-Dade 29,269 28,658 29,551 %3.12 29,159.33
Monroe 1,106 1,004 1,308 %30.28 1,139.33
Nassau 471 454 509 %12.11 478.00
Okaloosa 1,501 1,526 1,814 %18.87 1,613.67
Okeechobee 303 262 279 %6.49 281.33
Orange 15,012 13,824 14,440 %4.46 14,425.33
Osceola 2,940 2,388 2,930 %22.70 2,752.67
Palm Beach 12,432 10,527 12,156 %15.47 11,705.00
Pasco 6,300 5,674 5,888 %3.77 5,954.00
Pinellas 9,550 8,826 9,146 %3.63 9,174.00
Polk 5,022 4,474 4,823 %7.80 4,773.00
Putnam 832 710 715 %0.70 752.33
Santa Rosa 1,519 1,639 1,761 %7.44 1,639.67
Sarasota 3,033 2,695 3,076 %14.14 2,934.67
Seminole 2,246 2,353 2,820 %19.85 2,473.00
St. Johns 1,385 1,850 2,112 %14.16 1,782.33
St. Lucie 1,893 2,007 2,025 %0.90 1,975.00
Sumter 792 679 443 %-34.76 638.00
Suwannee 384 345 371 %7.54 366.67
Taylor 155 179 188 %5.03 174.00
Union 124 97 85 %-12.37 102.00
49Page

10/7/2013Create Date:
Unknown 0 4 0 %-100.00 1.33
Volusia 5,005 4,460 4,702 %5.43 4,722.33
Wakulla 215 155 201 %29.68 190.33
Walton 537 582 593 %1.89 570.67
Washington 177 209 222 %6.22 202.67
196,037 181,734 198,153 8.29 191,975
50Page
10/7/2013Create Date:
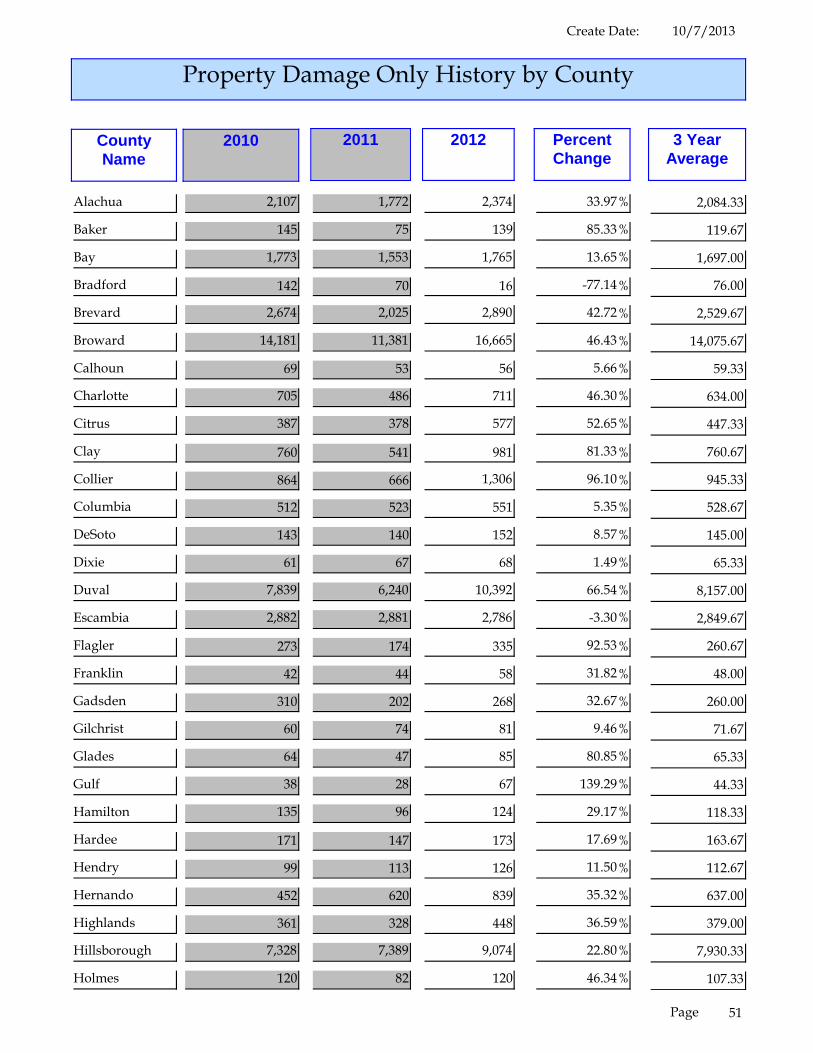
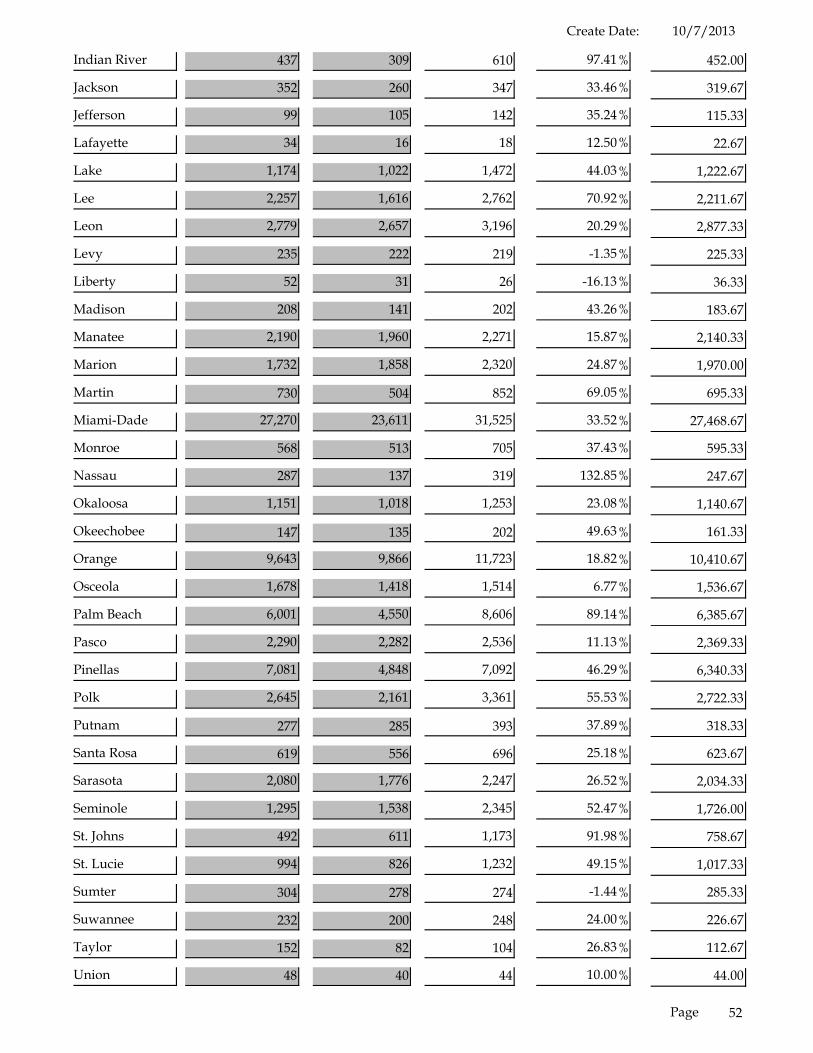
Property Damage Only History by County
3 YearAverage
PercentChange
201220112010CountyName
Alachua 2,107 1,772 2,374 %33.97 2,084.33
Baker 145 75 139 %85.33 119.67
Bay 1,773 1,553 1,765 %13.65 1,697.00
Bradford 142 70 16 %-77.14 76.00
Brevard 2,674 2,025 2,890 %42.72 2,529.67
Broward 14,181 11,381 16,665 %46.43 14,075.67
Calhoun 69 53 56 %5.66 59.33
Charlotte 705 486 711 %46.30 634.00
Citrus 387 378 577 %52.65 447.33
Clay 760 541 981 %81.33 760.67
Collier 864 666 1,306 %96.10 945.33
Columbia 512 523 551 %5.35 528.67
DeSoto 143 140 152 %8.57 145.00
Dixie 61 67 68 %1.49 65.33
Duval 7,839 6,240 10,392 %66.54 8,157.00
Escambia 2,882 2,881 2,786 %-3.30 2,849.67
Flagler 273 174 335 %92.53 260.67
Franklin 42 44 58 %31.82 48.00
Gadsden 310 202 268 %32.67 260.00
Gilchrist 60 74 81 %9.46 71.67
Glades 64 47 85 %80.85 65.33
Gulf 38 28 67 %139.29 44.33
Hamilton 135 96 124 %29.17 118.33
Hardee 171 147 173 %17.69 163.67
Hendry 99 113 126 %11.50 112.67
Hernando 452 620 839 %35.32 637.00
Highlands 361 328 448 %36.59 379.00
Hillsborough 7,328 7,389 9,074 %22.80 7,930.33
Holmes 120 82 120 %46.34 107.33
51Page
10/7/2013Create Date:
Indian River 437 309 610 %97.41 452.00
Jackson 352 260 347 %33.46 319.67
Jefferson 99 105 142 %35.24 115.33
Lafayette 34 16 18 %12.50 22.67
Lake 1,174 1,022 1,472 %44.03 1,222.67
Lee 2,257 1,616 2,762 %70.92 2,211.67
Leon 2,779 2,657 3,196 %20.29 2,877.33
Levy 235 222 219 %-1.35 225.33
Liberty 52 31 26 %-16.13 36.33
Madison 208 141 202 %43.26 183.67
Manatee 2,190 1,960 2,271 %15.87 2,140.33
Marion 1,732 1,858 2,320 %24.87 1,970.00
Martin 730 504 852 %69.05 695.33
Miami-Dade 27,270 23,611 31,525 %33.52 27,468.67
Monroe 568 513 705 %37.43 595.33
Nassau 287 137 319 %132.85 247.67
Okaloosa 1,151 1,018 1,253 %23.08 1,140.67
Okeechobee 147 135 202 %49.63 161.33
Orange 9,643 9,866 11,723 %18.82 10,410.67
Osceola 1,678 1,418 1,514 %6.77 1,536.67
Palm Beach 6,001 4,550 8,606 %89.14 6,385.67
Pasco 2,290 2,282 2,536 %11.13 2,369.33
Pinellas 7,081 4,848 7,092 %46.29 6,340.33
Polk 2,645 2,161 3,361 %55.53 2,722.33
Putnam 277 285 393 %37.89 318.33
Santa Rosa 619 556 696 %25.18 623.67
Sarasota 2,080 1,776 2,247 %26.52 2,034.33
Seminole 1,295 1,538 2,345 %52.47 1,726.00
St. Johns 492 611 1,173 %91.98 758.67
St. Lucie 994 826 1,232 %49.15 1,017.33
Sumter 304 278 274 %-1.44 285.33
Suwannee 232 200 248 %24.00 226.67
Taylor 152 82 104 %26.83 112.67
Union 48 40 44 %10.00 44.00
52Page

10/7/2013Create Date:
Unknown 0 4 0 %-100.00 1.33
Volusia 2,706 2,128 3,178 %49.34 2,670.67
Wakulla 118 100 130 %30.00 116.00
Walton 268 321 493 %53.58 360.67
Washington 136 111 118 %6.31 121.67
125,458 108,291 149,175 27.41 127,641
53Page

10/7/2013Create Date:
Alcohol Suspected-Related History by County
3 YearAverage
PercentChange
201220112010CountyName
Alachua 241 277 256 %-7.58 258.00
Baker 54 41 38 %-7.32 44.33
Bay 388 377 377 %0.00 380.67
Bradford 30 28 12 %-57.14 23.33
Brevard 507 411 472 %14.84 463.33
Broward 1,426 1,189 1,278 %7.49 1,297.67
Calhoun 26 20 17 %-15.00 21.00
Charlotte 131 95 113 %18.95 113.00
Citrus 114 109 101 %-7.34 108.00
Clay 151 121 141 %16.53 137.67
Collier 259 265 294 %10.94 272.67
Columbia 114 96 106 %10.42 105.33
DeSoto 31 37 37 %0.00 35.00
Dixie 20 17 23 %35.29 20.00
Duval 1,056 1,047 1,127 %7.64 1,076.67
Escambia 503 532 473 %-11.09 502.67
Flagler 80 87 102 %17.24 89.67
Franklin 21 20 21 %5.00 20.67
Gadsden 73 50 50 %0.00 57.67
Gilchrist 21 11 11 %0.00 14.33
Glades 14 9 8 %-11.11 10.33
Gulf 13 20 13 %-35.00 15.33
Hamilton 23 14 22 %57.14 19.67
Hardee 37 27 13 %-51.85 25.67
Hendry 35 33 35 %6.06 34.33
Hernando 109 169 143 %-15.38 140.33
Highlands 84 64 84 %31.25 77.33
Hillsborough 1,363 1,424 1,478 %3.79 1,421.67
Holmes 18 18 13 %-27.78 16.33
54Page

10/7/2013Create Date:
Indian River 111 88 113 %28.41 104.00
Jackson 44 51 38 %-25.49 44.33
Jefferson 24 20 22 %10.00 22.00
Lafayette 6 6 1 %-83.33 4.33
Lake 241 193 248 %28.50 227.33
Lee 520 570 620 %8.77 570.00
Leon 304 352 353 %0.28 336.33
Levy 55 54 26 %-51.85 45.00
Liberty 13 11 12 %9.09 12.00
Madison 36 32 27 %-15.63 31.67
Manatee 311 284 304 %7.04 299.67
Marion 232 265 232 %-12.45 243.00
Martin 158 164 199 %21.34 173.67
Miami-Dade 1,629 1,770 1,523 %-13.95 1,640.67
Monroe 196 166 188 %13.25 183.33
Nassau 62 44 73 %65.91 59.67
Okaloosa 272 253 263 %3.95 262.67
Okeechobee 51 28 36 %28.57 38.33
Orange 1,186 937 882 %-5.87 1,001.67
Osceola 216 152 149 %-1.97 172.33
Palm Beach 1,118 1,023 1,102 %7.72 1,081.00
Pasco 431 406 428 %5.42 421.67
Pinellas 1,183 1,114 1,113 %-0.09 1,136.67
Polk 481 419 400 %-4.53 433.33
Putnam 113 85 70 %-17.65 89.33
Santa Rosa 178 151 123 %-18.54 150.67
Sarasota 387 315 342 %8.57 348.00
Seminole 307 278 252 %-9.35 279.00
St. Johns 161 217 250 %15.21 209.33
St. Lucie 182 204 200 %-1.96 195.33
Sumter 59 47 44 %-6.38 50.00
Suwannee 46 53 49 %-7.55 49.33
Taylor 35 43 32 %-25.58 36.67
Union 15 12 10 %-16.67 12.33
55Page

10/7/2013Create Date:
Unknown 0 2 0 %-100.00 0.67
Volusia 662 513 518 %0.97 564.33
Wakulla 32 44 50 %13.64 42.00
Walton 90 99 97 %-2.02 95.33
Washington 18 26 31 %19.23 25.00
18,107 17,099 17,278 1.04 17,495
56Page
10/7/2013Create Date:
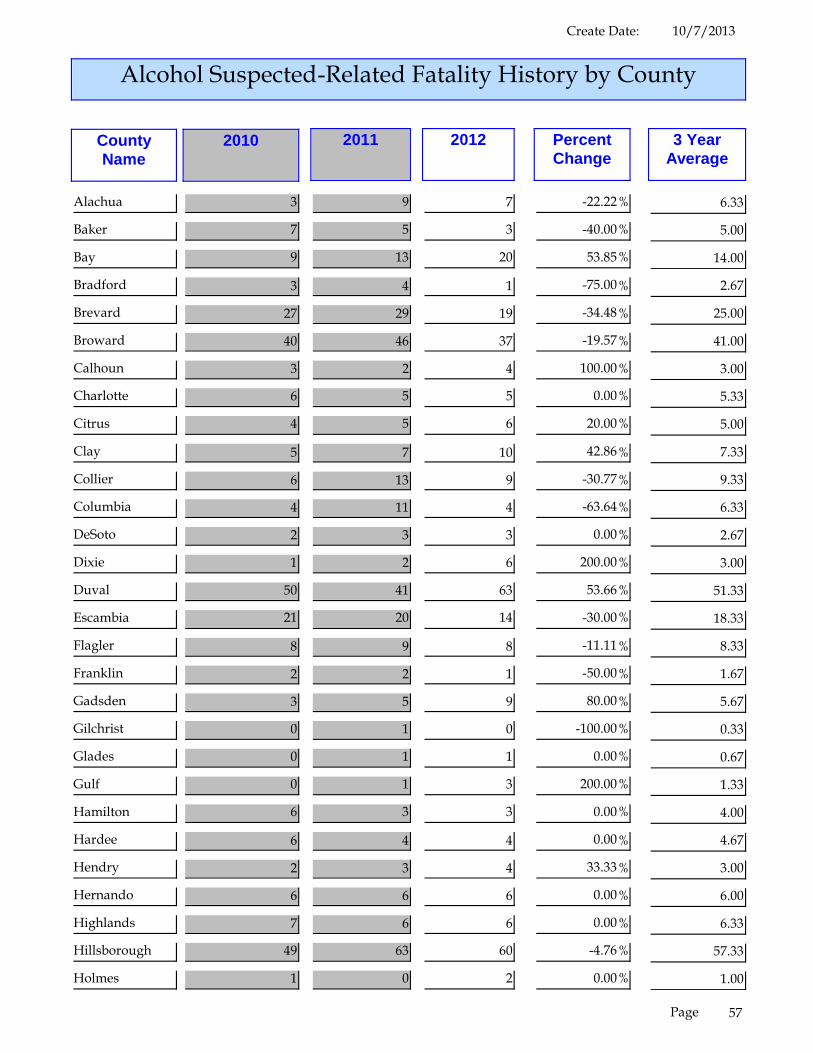
Alcohol Suspected-Related Fatality History by County
3 YearAverage
PercentChange
201220112010CountyName
Alachua 3 9 7 %-22.22 6.33
Baker 7 5 3 %-40.00 5.00
Bay 9 13 20 %53.85 14.00
Bradford 3 4 1 %-75.00 2.67
Brevard 27 29 19 %-34.48 25.00
Broward 40 46 37 %-19.57 41.00
Calhoun 3 2 4 %100.00 3.00
Charlotte 6 5 5 %0.00 5.33
Citrus 4 5 6 %20.00 5.00
Clay 5 7 10 %42.86 7.33
Collier 6 13 9 %-30.77 9.33
Columbia 4 11 4 %-63.64 6.33
DeSoto 2 3 3 %0.00 2.67
Dixie 1 2 6 %200.00 3.00
Duval 50 41 63 %53.66 51.33
Escambia 21 20 14 %-30.00 18.33
Flagler 8 9 8 %-11.11 8.33
Franklin 2 2 1 %-50.00 1.67
Gadsden 3 5 9 %80.00 5.67
Gilchrist 0 1 0 %-100.00 0.33
Glades 0 1 1 %0.00 0.67
Gulf 0 1 3 %200.00 1.33
Hamilton 6 3 3 %0.00 4.00
Hardee 6 4 4 %0.00 4.67
Hendry 2 3 4 %33.33 3.00
Hernando 6 6 6 %0.00 6.00
Highlands 7 6 6 %0.00 6.33
Hillsborough 49 63 60 %-4.76 57.33
Holmes 1 0 2 %0.00 1.00
57Page

10/7/2013Create Date:
Indian River 6 8 2 %-75.00 5.33
Jackson 3 6 2 %-66.67 3.67
Jefferson 2 3 3 %0.00 2.67
Lafayette 0 1 0 %-100.00 0.33
Lake 15 19 13 %-31.58 15.67
Lee 21 22 21 %-4.55 21.33
Leon 7 10 16 %60.00 11.00
Levy 4 5 4 %-20.00 4.33
Liberty 1 1 0 %-100.00 0.67
Madison 0 4 2 %-50.00 2.00
Manatee 19 15 20 %33.33 18.00
Marion 28 17 19 %11.76 21.33
Martin 8 12 12 %0.00 10.67
Miami-Dade 40 49 41 %-16.33 43.33
Monroe 13 3 4 %33.33 6.67
Nassau 4 6 4 %-33.33 4.67
Okaloosa 7 9 7 %-22.22 7.67
Okeechobee 5 3 2 %-33.33 3.33
Orange 60 48 50 %4.17 52.67
Osceola 10 16 6 %-62.50 10.67
Palm Beach 28 44 44 %0.00 38.67
Pasco 27 17 20 %17.65 21.33
Pinellas 40 47 48 %2.13 45.00
Polk 27 30 20 %-33.33 25.67
Putnam 13 10 11 %10.00 11.33
Santa Rosa 11 10 7 %-30.00 9.33
Sarasota 14 10 19 %90.00 14.33
Seminole 12 18 8 %-55.56 12.67
St. Johns 7 12 11 %-8.33 10.00
St. Lucie 4 8 10 %25.00 7.33
Sumter 5 6 4 %-33.33 5.00
Suwannee 5 5 6 %20.00 5.33
Taylor 2 1 6 %500.00 3.00
Union 1 0 0 %0.00 0.33
58Page

10/7/2013Create Date:
Unknown 0 0 0 %0.00 0.00
Volusia 32 29 33 %13.79 31.33
Wakulla 1 3 4 %33.33 2.67
Walton 7 11 5 %-54.55 7.67
Washington 3 1 5 %400.00 3.00
773 838 807 -3.84 806
59Page
10/7/2013Create Date:
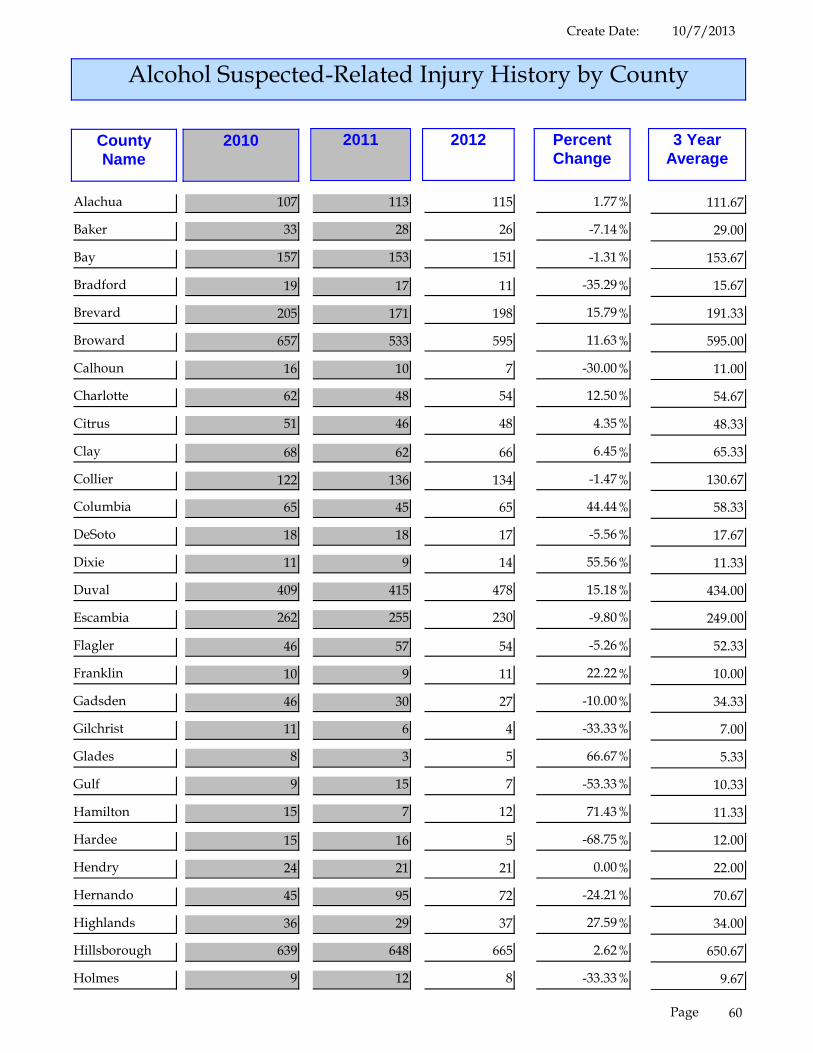
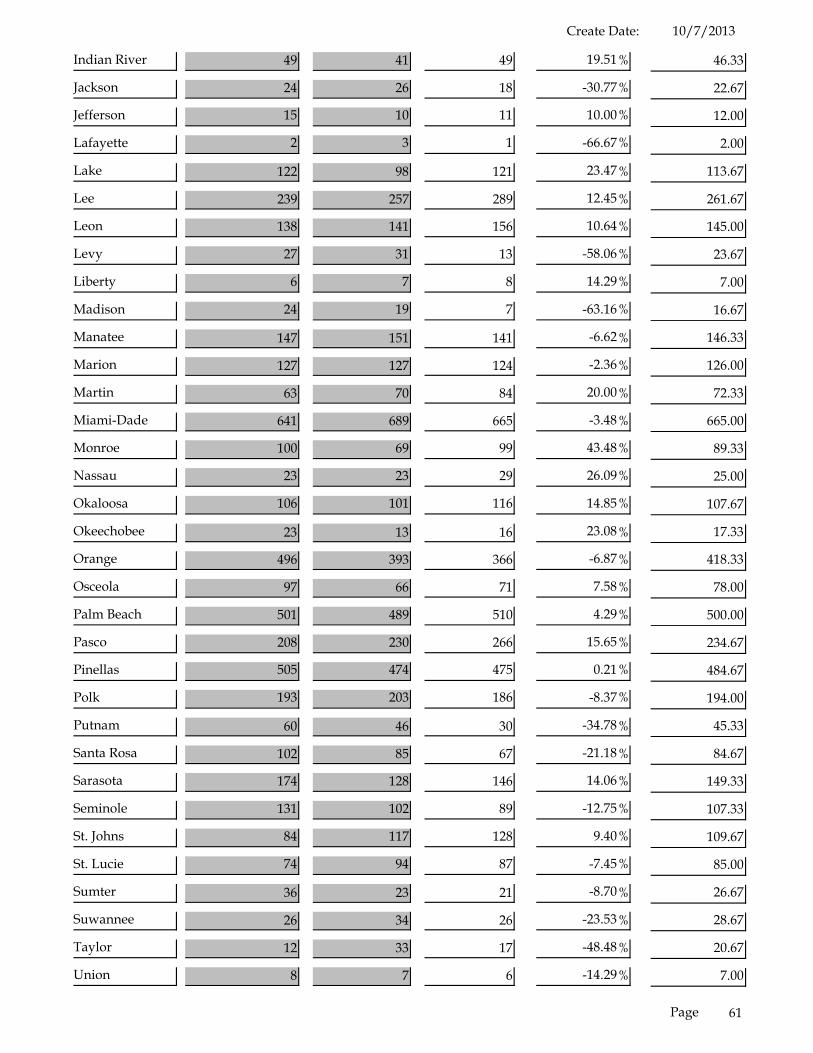
Alcohol Suspected-Related Injury History by County
3 YearAverage
PercentChange
201220112010CountyName
Alachua 107 113 115 %1.77 111.67
Baker 33 28 26 %-7.14 29.00
Bay 157 153 151 %-1.31 153.67
Bradford 19 17 11 %-35.29 15.67
Brevard 205 171 198 %15.79 191.33
Broward 657 533 595 %11.63 595.00
Calhoun 16 10 7 %-30.00 11.00
Charlotte 62 48 54 %12.50 54.67
Citrus 51 46 48 %4.35 48.33
Clay 68 62 66 %6.45 65.33
Collier 122 136 134 %-1.47 130.67
Columbia 65 45 65 %44.44 58.33
DeSoto 18 18 17 %-5.56 17.67
Dixie 11 9 14 %55.56 11.33
Duval 409 415 478 %15.18 434.00
Escambia 262 255 230 %-9.80 249.00
Flagler 46 57 54 %-5.26 52.33
Franklin 10 9 11 %22.22 10.00
Gadsden 46 30 27 %-10.00 34.33
Gilchrist 11 6 4 %-33.33 7.00
Glades 8 3 5 %66.67 5.33
Gulf 9 15 7 %-53.33 10.33
Hamilton 15 7 12 %71.43 11.33
Hardee 15 16 5 %-68.75 12.00
Hendry 24 21 21 %0.00 22.00
Hernando 45 95 72 %-24.21 70.67
Highlands 36 29 37 %27.59 34.00
Hillsborough 639 648 665 %2.62 650.67
Holmes 9 12 8 %-33.33 9.67
60Page
10/7/2013Create Date:
Indian River 49 41 49 %19.51 46.33
Jackson 24 26 18 %-30.77 22.67
Jefferson 15 10 11 %10.00 12.00
Lafayette 2 3 1 %-66.67 2.00
Lake 122 98 121 %23.47 113.67
Lee 239 257 289 %12.45 261.67
Leon 138 141 156 %10.64 145.00
Levy 27 31 13 %-58.06 23.67
Liberty 6 7 8 %14.29 7.00
Madison 24 19 7 %-63.16 16.67
Manatee 147 151 141 %-6.62 146.33
Marion 127 127 124 %-2.36 126.00
Martin 63 70 84 %20.00 72.33
Miami-Dade 641 689 665 %-3.48 665.00
Monroe 100 69 99 %43.48 89.33
Nassau 23 23 29 %26.09 25.00
Okaloosa 106 101 116 %14.85 107.67
Okeechobee 23 13 16 %23.08 17.33
Orange 496 393 366 %-6.87 418.33
Osceola 97 66 71 %7.58 78.00
Palm Beach 501 489 510 %4.29 500.00
Pasco 208 230 266 %15.65 234.67
Pinellas 505 474 475 %0.21 484.67
Polk 193 203 186 %-8.37 194.00
Putnam 60 46 30 %-34.78 45.33
Santa Rosa 102 85 67 %-21.18 84.67
Sarasota 174 128 146 %14.06 149.33
Seminole 131 102 89 %-12.75 107.33
St. Johns 84 117 128 %9.40 109.67
St. Lucie 74 94 87 %-7.45 85.00
Sumter 36 23 21 %-8.70 26.67
Suwannee 26 34 26 %-23.53 28.67
Taylor 12 33 17 %-48.48 20.67
Union 8 7 6 %-14.29 7.00
61Page

10/7/2013Create Date:
Unknown 0 1 0 %-100.00 0.33
Volusia 310 239 253 %5.86 267.33
Wakulla 15 27 25 %-7.41 22.33
Walton 48 46 50 %8.70 48.00
Washington 8 14 19 %35.71 13.67
8,139 7,734 7,922 2.37 7,932
62Page
10/7/2013Create Date:
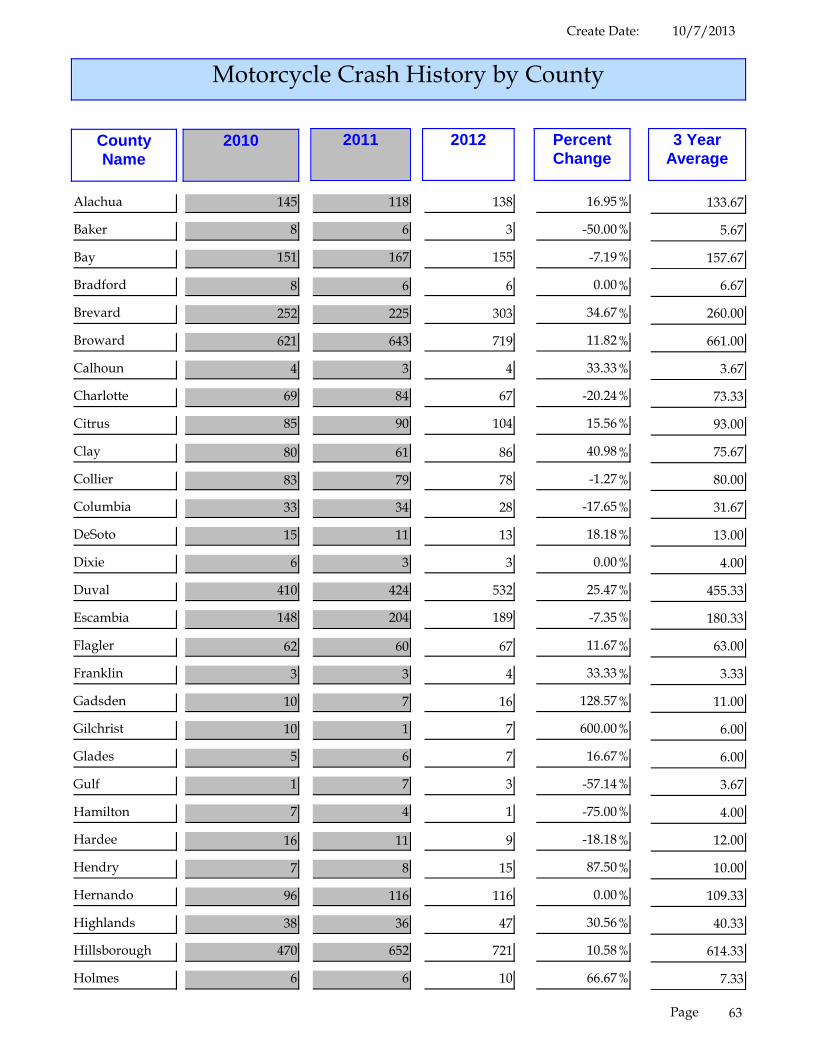
Motorcycle Crash History by County
3 YearAverage
PercentChange
201220112010CountyName
Alachua 145 118 138 %16.95 133.67
Baker 8 6 3 %-50.00 5.67
Bay 151 167 155 %-7.19 157.67
Bradford 8 6 6 %0.00 6.67
Brevard 252 225 303 %34.67 260.00
Broward 621 643 719 %11.82 661.00
Calhoun 4 3 4 %33.33 3.67
Charlotte 69 84 67 %-20.24 73.33
Citrus 85 90 104 %15.56 93.00
Clay 80 61 86 %40.98 75.67
Collier 83 79 78 %-1.27 80.00
Columbia 33 34 28 %-17.65 31.67
DeSoto 15 11 13 %18.18 13.00
Dixie 6 3 3 %0.00 4.00
Duval 410 424 532 %25.47 455.33
Escambia 148 204 189 %-7.35 180.33
Flagler 62 60 67 %11.67 63.00
Franklin 3 3 4 %33.33 3.33
Gadsden 10 7 16 %128.57 11.00
Gilchrist 10 1 7 %600.00 6.00
Glades 5 6 7 %16.67 6.00
Gulf 1 7 3 %-57.14 3.67
Hamilton 7 4 1 %-75.00 4.00
Hardee 16 11 9 %-18.18 12.00
Hendry 7 8 15 %87.50 10.00
Hernando 96 116 116 %0.00 109.33
Highlands 38 36 47 %30.56 40.33
Hillsborough 470 652 721 %10.58 614.33
Holmes 6 6 10 %66.67 7.33
63Page

10/7/2013Create Date:
Indian River 40 47 45 %-4.26 44.00
Jackson 12 16 13 %-18.75 13.67
Jefferson 7 5 5 %0.00 5.67
Lafayette 3 1 2 %100.00 2.00
Lake 116 148 160 %8.11 141.33
Lee 188 229 268 %17.03 228.33
Leon 119 136 112 %-17.65 122.33
Levy 21 19 20 %5.26 20.00
Liberty 3 1 1 %0.00 1.67
Madison 8 6 5 %-16.67 6.33
Manatee 130 159 130 %-18.24 139.67
Marion 156 171 141 %-17.54 156.00
Martin 84 57 56 %-1.75 65.67
Miami-Dade 774 932 987 %5.90 897.67
Monroe 224 187 261 %39.57 224.00
Nassau 24 28 32 %14.29 28.00
Okaloosa 80 105 108 %2.86 97.67
Okeechobee 12 7 10 %42.86 9.67
Orange 485 621 581 %-6.44 562.33
Osceola 103 116 122 %5.17 113.67
Palm Beach 376 369 411 %11.38 385.33
Pasco 246 267 264 %-1.12 259.00
Pinellas 480 513 579 %12.87 524.00
Polk 209 217 265 %22.12 230.33
Putnam 27 41 50 %21.95 39.33
Santa Rosa 61 81 70 %-13.58 70.67
Sarasota 149 157 190 %21.02 165.33
Seminole 108 149 161 %8.05 139.33
St. Johns 58 97 130 %34.02 95.00
St. Lucie 81 105 109 %3.81 98.33
Sumter 32 32 27 %-15.63 30.33
Suwannee 15 14 10 %-28.57 13.00
Taylor 3 6 6 %0.00 5.00
Union 3 5 0 %-100.00 2.67
64Page

10/7/2013Create Date:
Unknown 0 1 0 %-100.00 0.33
Volusia 510 464 551 %18.75 508.33
Wakulla 12 5 16 %220.00 11.00
Walton 32 33 32 %-3.03 32.33
Washington 9 9 13 %44.44 10.33
7,849 8,631 9,394 8.12 8,625
65Page
10/7/2013Create Date:
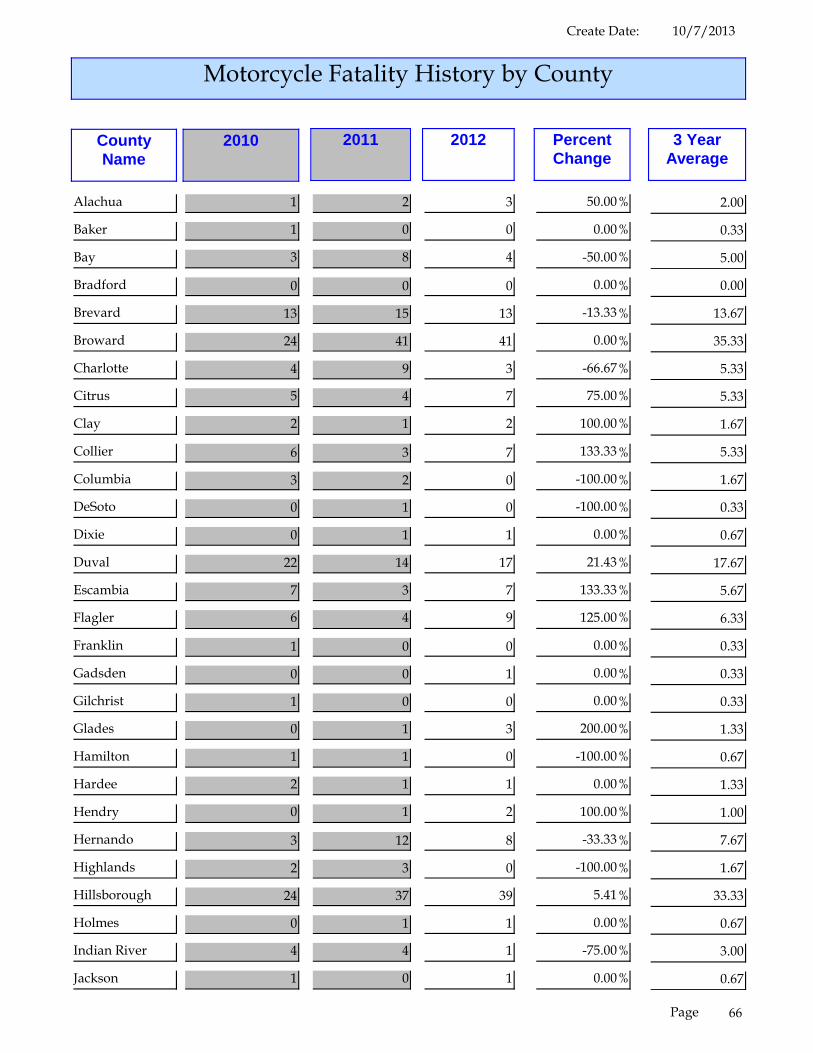
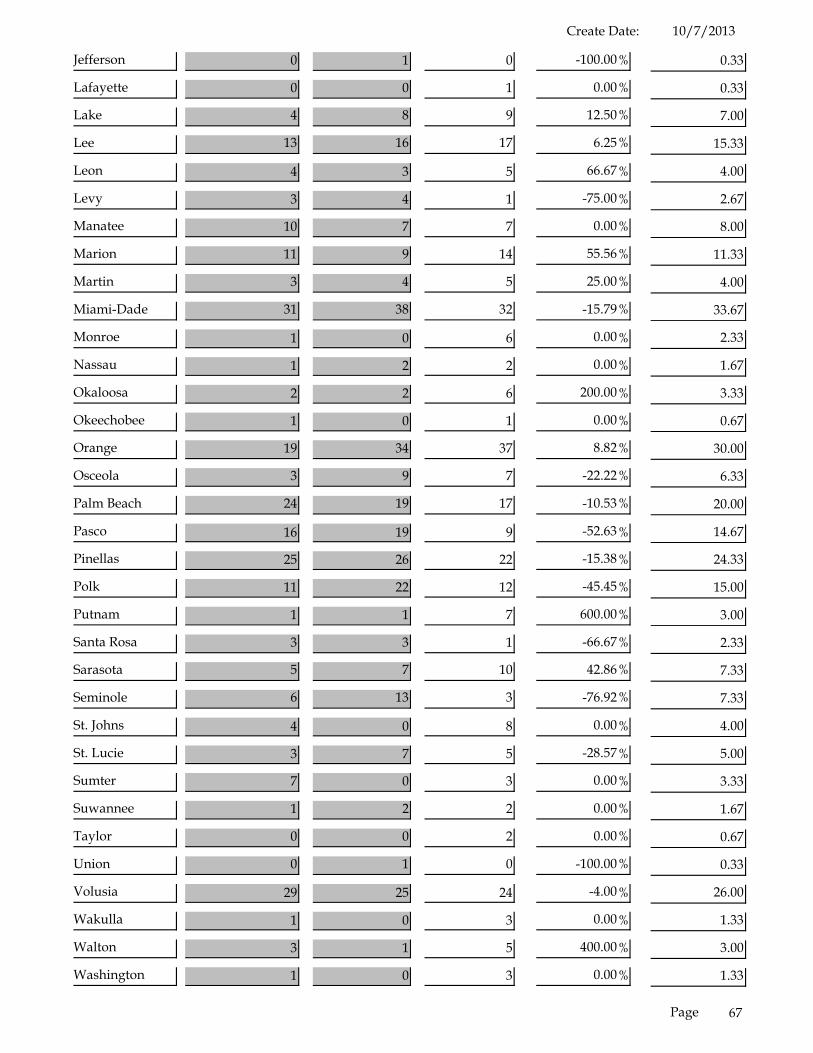
Motorcycle Fatality History by County
3 YearAverage
PercentChange
201220112010CountyName
Alachua 1 2 3 %50.00 2.00
Baker 1 0 0 %0.00 0.33
Bay 3 8 4 %-50.00 5.00
Bradford 0 0 0 %0.00 0.00
Brevard 13 15 13 %-13.33 13.67
Broward 24 41 41 %0.00 35.33
Charlotte 4 9 3 %-66.67 5.33
Citrus 5 4 7 %75.00 5.33
Clay 2 1 2 %100.00 1.67
Collier 6 3 7 %133.33 5.33
Columbia 3 2 0 %-100.00 1.67
DeSoto 0 1 0 %-100.00 0.33
Dixie 0 1 1 %0.00 0.67
Duval 22 14 17 %21.43 17.67
Escambia 7 3 7 %133.33 5.67
Flagler 6 4 9 %125.00 6.33
Franklin 1 0 0 %0.00 0.33
Gadsden 0 0 1 %0.00 0.33
Gilchrist 1 0 0 %0.00 0.33
Glades 0 1 3 %200.00 1.33
Hamilton 1 1 0 %-100.00 0.67
Hardee 2 1 1 %0.00 1.33
Hendry 0 1 2 %100.00 1.00
Hernando 3 12 8 %-33.33 7.67
Highlands 2 3 0 %-100.00 1.67
Hillsborough 24 37 39 %5.41 33.33
Holmes 0 1 1 %0.00 0.67
Indian River 4 4 1 %-75.00 3.00
Jackson 1 0 1 %0.00 0.67
66Page
10/7/2013Create Date:
Jefferson 0 1 0 %-100.00 0.33
Lafayette 0 0 1 %0.00 0.33
Lake 4 8 9 %12.50 7.00
Lee 13 16 17 %6.25 15.33
Leon 4 3 5 %66.67 4.00
Levy 3 4 1 %-75.00 2.67
Manatee 10 7 7 %0.00 8.00
Marion 11 9 14 %55.56 11.33
Martin 3 4 5 %25.00 4.00
Miami-Dade 31 38 32 %-15.79 33.67
Monroe 1 0 6 %0.00 2.33
Nassau 1 2 2 %0.00 1.67
Okaloosa 2 2 6 %200.00 3.33
Okeechobee 1 0 1 %0.00 0.67
Orange 19 34 37 %8.82 30.00
Osceola 3 9 7 %-22.22 6.33
Palm Beach 24 19 17 %-10.53 20.00
Pasco 16 19 9 %-52.63 14.67
Pinellas 25 26 22 %-15.38 24.33
Polk 11 22 12 %-45.45 15.00
Putnam 1 1 7 %600.00 3.00
Santa Rosa 3 3 1 %-66.67 2.33
Sarasota 5 7 10 %42.86 7.33
Seminole 6 13 3 %-76.92 7.33
St. Johns 4 0 8 %0.00 4.00
St. Lucie 3 7 5 %-28.57 5.00
Sumter 7 0 3 %0.00 3.33
Suwannee 1 2 2 %0.00 1.67
Taylor 0 0 2 %0.00 0.67
Union 0 1 0 %-100.00 0.33
Volusia 29 25 24 %-4.00 26.00
Wakulla 1 0 3 %0.00 1.33
Walton 3 1 5 %400.00 3.00
Washington 1 0 3 %0.00 1.33
67Page
10/7/2013Create Date:
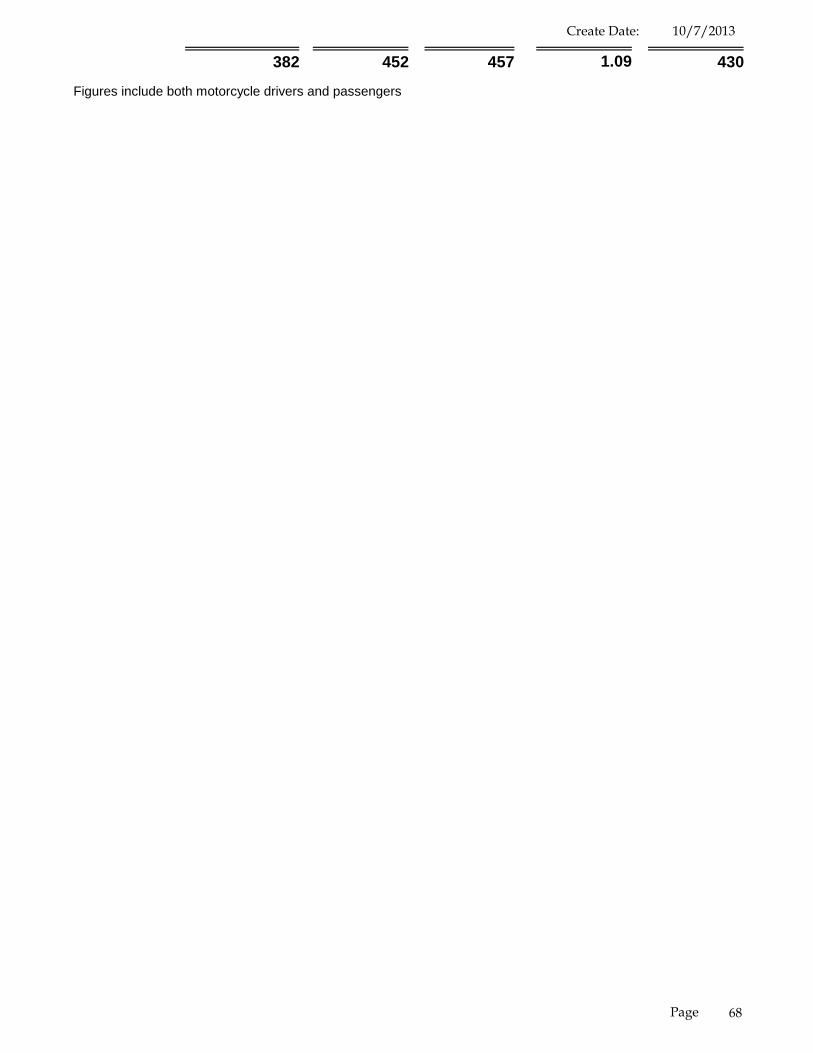
382 452 457 1.09 430
Figures include both motorcycle drivers and passengers
68Page

10/7/2013Create Date:
Motorcycle Injury History by County
3 YearAverage
PercentChange
201220112010CountyName
Alachua 133 109 121 %11.01 121.00
Baker 10 5 4 %-20.00 6.33
Bay 147 146 149 %2.05 147.33
Bradford 10 5 8 %60.00 7.67
Brevard 233 206 283 %37.38 240.67
Broward 571 598 630 %5.35 599.67
Calhoun 4 3 3 %0.00 3.33
Charlotte 66 82 61 %-25.61 69.67
Citrus 80 97 108 %11.34 95.00
Clay 74 56 84 %50.00 71.33
Collier 80 75 72 %-4.00 75.67
Columbia 23 33 27 %-18.18 27.67
DeSoto 19 11 18 %63.64 16.00
Dixie 5 3 2 %-33.33 3.33
Duval 356 387 496 %28.17 413.00
Escambia 136 190 174 %-8.42 166.67
Flagler 65 67 66 %-1.49 66.00
Franklin 1 3 4 %33.33 2.67
Gadsden 10 6 17 %183.33 11.00
Gilchrist 9 1 7 %600.00 5.67
Glades 7 5 6 %20.00 6.00
Gulf 1 7 3 %-57.14 3.67
Hamilton 7 3 2 %-33.33 4.00
Hardee 17 12 10 %-16.67 13.00
Hendry 6 10 15 %50.00 10.33
Hernando 105 110 119 %8.18 111.33
Highlands 38 37 54 %45.95 43.00
Hillsborough 442 605 671 %10.91 572.67
Holmes 7 4 12 %200.00 7.67
69Page
10/7/2013Create Date:
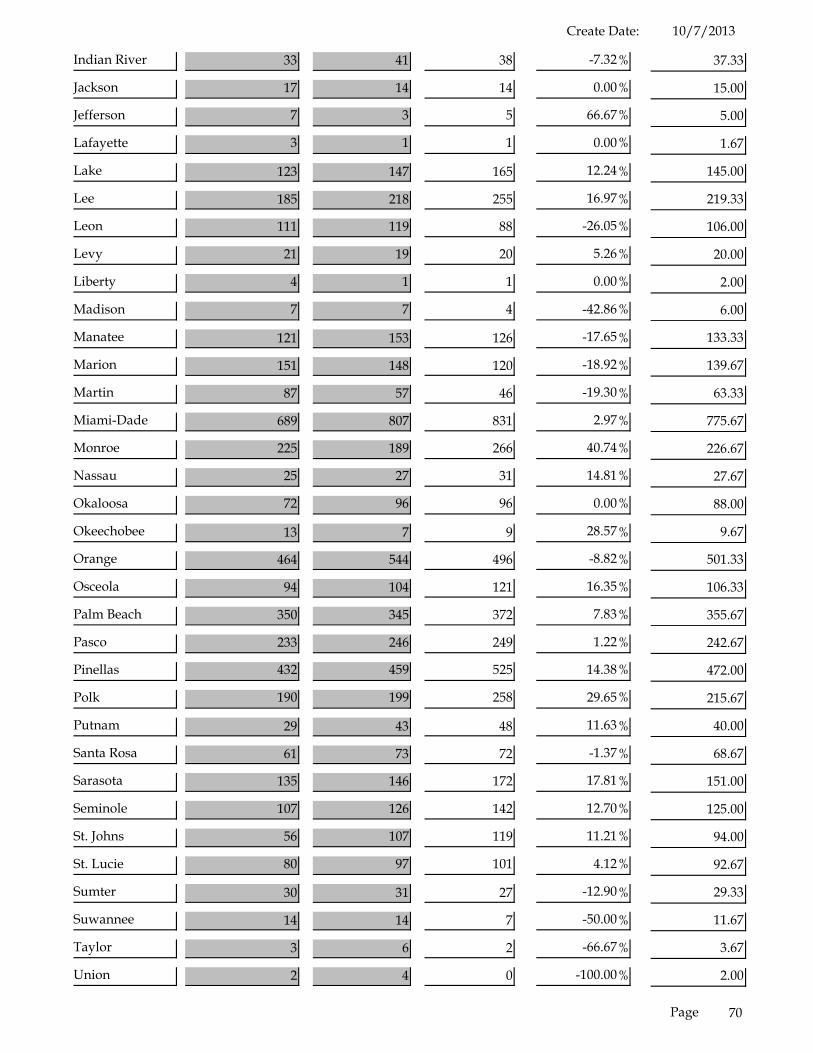
Indian River 33 41 38 %-7.32 37.33
Jackson 17 14 14 %0.00 15.00
Jefferson 7 3 5 %66.67 5.00
Lafayette 3 1 1 %0.00 1.67
Lake 123 147 165 %12.24 145.00
Lee 185 218 255 %16.97 219.33
Leon 111 119 88 %-26.05 106.00
Levy 21 19 20 %5.26 20.00
Liberty 4 1 1 %0.00 2.00
Madison 7 7 4 %-42.86 6.00
Manatee 121 153 126 %-17.65 133.33
Marion 151 148 120 %-18.92 139.67
Martin 87 57 46 %-19.30 63.33
Miami-Dade 689 807 831 %2.97 775.67
Monroe 225 189 266 %40.74 226.67
Nassau 25 27 31 %14.81 27.67
Okaloosa 72 96 96 %0.00 88.00
Okeechobee 13 7 9 %28.57 9.67
Orange 464 544 496 %-8.82 501.33
Osceola 94 104 121 %16.35 106.33
Palm Beach 350 345 372 %7.83 355.67
Pasco 233 246 249 %1.22 242.67
Pinellas 432 459 525 %14.38 472.00
Polk 190 199 258 %29.65 215.67
Putnam 29 43 48 %11.63 40.00
Santa Rosa 61 73 72 %-1.37 68.67
Sarasota 135 146 172 %17.81 151.00
Seminole 107 126 142 %12.70 125.00
St. Johns 56 107 119 %11.21 94.00
St. Lucie 80 97 101 %4.12 92.67
Sumter 30 31 27 %-12.90 29.33
Suwannee 14 14 7 %-50.00 11.67
Taylor 3 6 2 %-66.67 3.67
Union 2 4 0 %-100.00 2.00
70Page
10/7/2013Create Date:
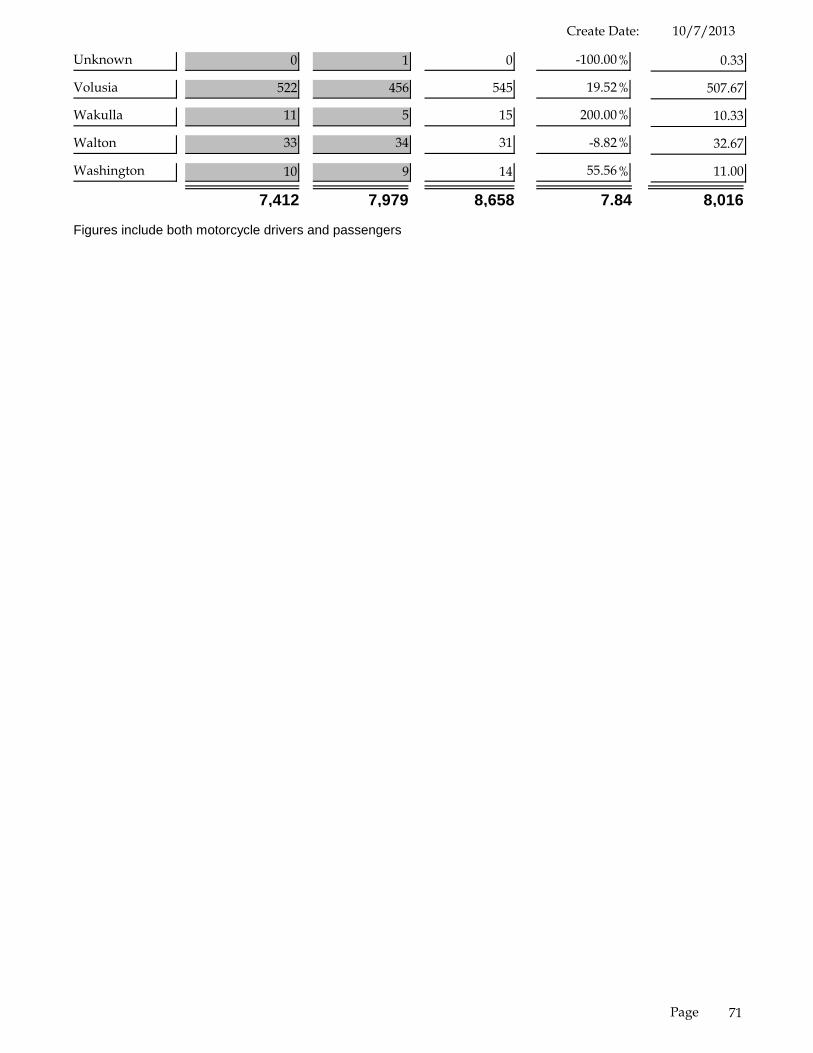
Unknown 0 1 0 %-100.00 0.33
Volusia 522 456 545 %19.52 507.67
Wakulla 11 5 15 %200.00 10.33
Walton 33 34 31 %-8.82 32.67
Washington 10 9 14 %55.56 11.00
7,412 7,979 8,658 7.84 8,016
Figures include both motorcycle drivers and passengers
71Page

10/7/2013Create Date:
Commercial Motor Vehicle Crash History by County
3 YearAverage
PercentChange
201220112010CountyName
Alachua 275 187 372 %98.93 278.00
Baker 48 13 67 %415.38 42.67
Bay 132 127 250 %96.85 169.67
Bradford 30 17 14 %-17.65 20.33
Brevard 315 206 522 %153.40 347.67
Broward 1,510 1,254 3,572 %184.85 2,112.00
Calhoun 11 12 15 %25.00 12.67
Charlotte 105 79 154 %94.94 112.67
Citrus 41 35 90 %157.14 55.33
Clay 115 56 125 %123.21 98.67
Collier 94 92 228 %147.83 138.00
Columbia 104 108 147 %36.11 119.67
DeSoto 23 24 49 %104.17 32.00
Dixie 6 5 11 %120.00 7.33
Duval 1,424 914 2,031 %122.21 1,456.33
Escambia 155 145 279 %92.41 193.00
Flagler 57 46 85 %84.78 62.67
Franklin 5 2 5 %150.00 4.00
Gadsden 88 38 82 %115.79 69.33
Gilchrist 6 5 4 %-20.00 5.00
Glades 22 20 46 %130.00 29.33
Gulf 3 5 8 %60.00 5.33
Hamilton 44 28 61 %117.86 44.33
Hardee 44 42 68 %61.90 51.33
Hendry 32 34 53 %55.88 39.67
Hernando 80 101 136 %34.65 105.67
Highlands 72 48 91 %89.58 70.33
Hillsborough 1,078 870 1,596 %83.45 1,181.33
Holmes 15 9 17 %88.89 13.67
72Page
10/7/2013Create Date:
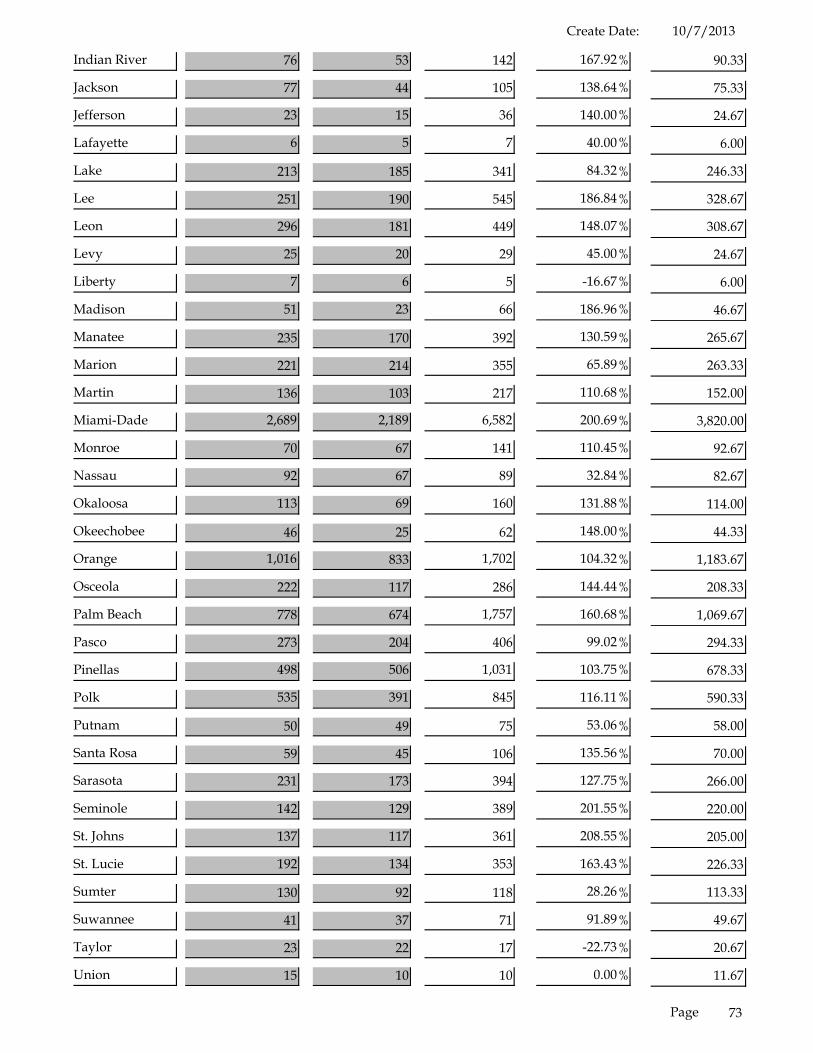
Indian River 76 53 142 %167.92 90.33
Jackson 77 44 105 %138.64 75.33
Jefferson 23 15 36 %140.00 24.67
Lafayette 6 5 7 %40.00 6.00
Lake 213 185 341 %84.32 246.33
Lee 251 190 545 %186.84 328.67
Leon 296 181 449 %148.07 308.67
Levy 25 20 29 %45.00 24.67
Liberty 7 6 5 %-16.67 6.00
Madison 51 23 66 %186.96 46.67
Manatee 235 170 392 %130.59 265.67
Marion 221 214 355 %65.89 263.33
Martin 136 103 217 %110.68 152.00
Miami-Dade 2,689 2,189 6,582 %200.69 3,820.00
Monroe 70 67 141 %110.45 92.67
Nassau 92 67 89 %32.84 82.67
Okaloosa 113 69 160 %131.88 114.00
Okeechobee 46 25 62 %148.00 44.33
Orange 1,016 833 1,702 %104.32 1,183.67
Osceola 222 117 286 %144.44 208.33
Palm Beach 778 674 1,757 %160.68 1,069.67
Pasco 273 204 406 %99.02 294.33
Pinellas 498 506 1,031 %103.75 678.33
Polk 535 391 845 %116.11 590.33
Putnam 50 49 75 %53.06 58.00
Santa Rosa 59 45 106 %135.56 70.00
Sarasota 231 173 394 %127.75 266.00
Seminole 142 129 389 %201.55 220.00
St. Johns 137 117 361 %208.55 205.00
St. Lucie 192 134 353 %163.43 226.33
Sumter 130 92 118 %28.26 113.33
Suwannee 41 37 71 %91.89 49.67
Taylor 23 22 17 %-22.73 20.67
Union 15 10 10 %0.00 11.67
73Page
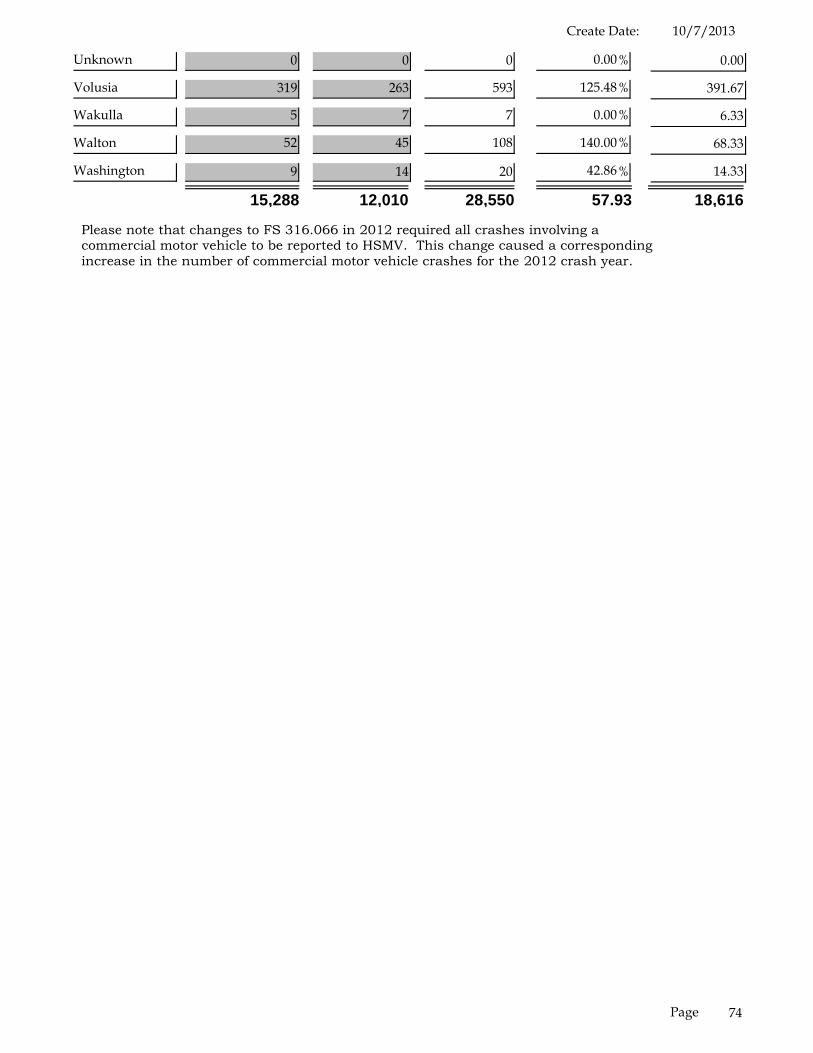
10/7/2013Create Date:
Unknown 0 0 0 %0.00 0.00
Volusia 319 263 593 %125.48 391.67
Wakulla 5 7 7 %0.00 6.33
Walton 52 45 108 %140.00 68.33
Washington 9 14 20 %42.86 14.33
15,288 12,010 28,550 57.93 18,616
Please note that changes to FS 316.066 in 2012 required all crashes involving acommercial motor vehicle to be reported to HSMV. This change caused a correspondingincrease in the number of commercial motor vehicle crashes for the 2012 crash year.
74Page

10/7/2013Create Date:
Commercial Motor Vehicle Fatality History by County
3 YearAverage
PercentChange
201220112010CountyName
Alachua 6 3 27 %800.00 12.00
Baker 1 4 0 %-100.00 1.67
Bay 2 0 4 %0.00 2.00
Bradford 0 2 1 %-50.00 1.00
Brevard 1 12 6 %-50.00 6.33
Broward 15 10 7 %-30.00 10.67
Calhoun 0 0 0 %0.00 0.00
Charlotte 2 2 3 %50.00 2.33
Citrus 1 2 0 %-100.00 1.00
Clay 1 1 0 %-100.00 0.67
Collier 2 2 4 %100.00 2.67
Columbia 3 2 0 %-100.00 1.67
DeSoto 1 2 0 %-100.00 1.00
Dixie 1 0 1 %0.00 0.67
Duval 8 9 16 %77.78 11.00
Escambia 1 5 4 %-20.00 3.33
Flagler 1 2 0 %-100.00 1.00
Franklin 0 0 0 %0.00 0.00
Gadsden 4 0 2 %0.00 2.00
Gilchrist 0 0 0 %0.00 0.00
Glades 0 3 0 %-100.00 1.00
Gulf 0 2 0 %-100.00 0.67
Hamilton 0 2 2 %0.00 1.33
Hardee 2 5 3 %-40.00 3.33
Hendry 1 2 1 %-50.00 1.33
Hernando 1 0 0 %0.00 0.33
Highlands 5 2 2 %0.00 3.00
Hillsborough 12 12 23 %91.67 15.67
Holmes 0 0 0 %0.00 0.00
75Page
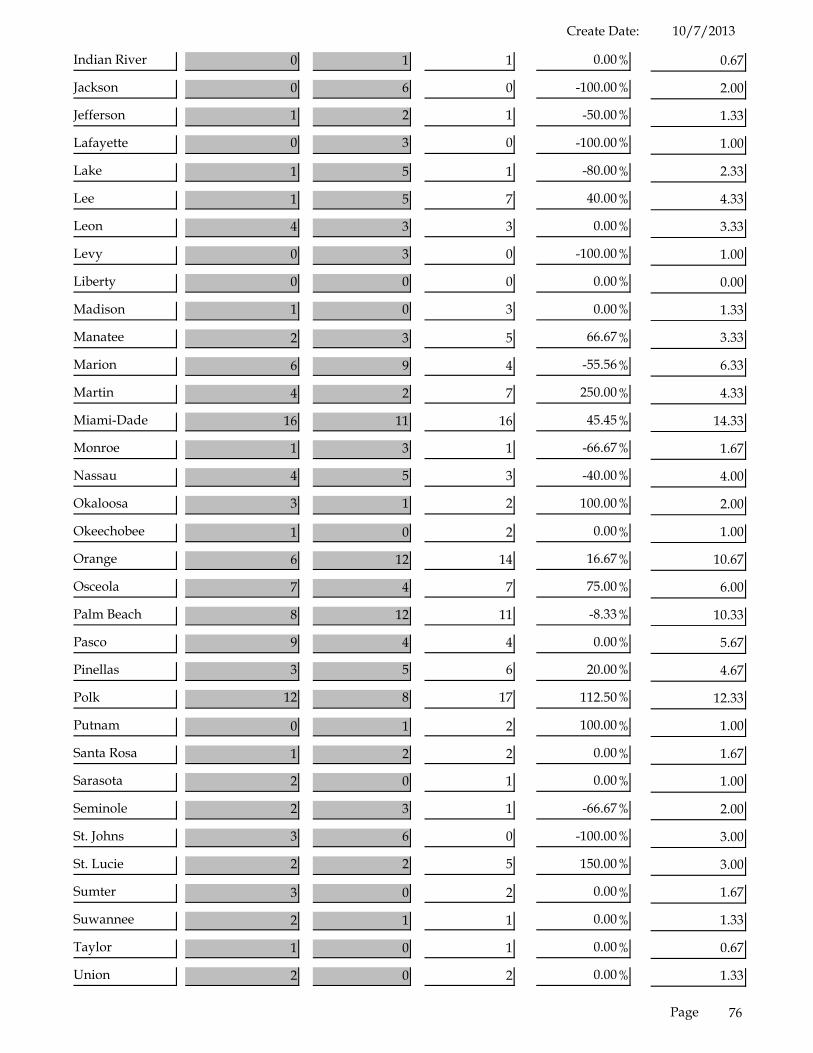
10/7/2013Create Date:
Indian River 0 1 1 %0.00 0.67
Jackson 0 6 0 %-100.00 2.00
Jefferson 1 2 1 %-50.00 1.33
Lafayette 0 3 0 %-100.00 1.00
Lake 1 5 1 %-80.00 2.33
Lee 1 5 7 %40.00 4.33
Leon 4 3 3 %0.00 3.33
Levy 0 3 0 %-100.00 1.00
Liberty 0 0 0 %0.00 0.00
Madison 1 0 3 %0.00 1.33
Manatee 2 3 5 %66.67 3.33
Marion 6 9 4 %-55.56 6.33
Martin 4 2 7 %250.00 4.33
Miami-Dade 16 11 16 %45.45 14.33
Monroe 1 3 1 %-66.67 1.67
Nassau 4 5 3 %-40.00 4.00
Okaloosa 3 1 2 %100.00 2.00
Okeechobee 1 0 2 %0.00 1.00
Orange 6 12 14 %16.67 10.67
Osceola 7 4 7 %75.00 6.00
Palm Beach 8 12 11 %-8.33 10.33
Pasco 9 4 4 %0.00 5.67
Pinellas 3 5 6 %20.00 4.67
Polk 12 8 17 %112.50 12.33
Putnam 0 1 2 %100.00 1.00
Santa Rosa 1 2 2 %0.00 1.67
Sarasota 2 0 1 %0.00 1.00
Seminole 2 3 1 %-66.67 2.00
St. Johns 3 6 0 %-100.00 3.00
St. Lucie 2 2 5 %150.00 3.00
Sumter 3 0 2 %0.00 1.67
Suwannee 2 1 1 %0.00 1.33
Taylor 1 0 1 %0.00 0.67
Union 2 0 2 %0.00 1.33
76Page
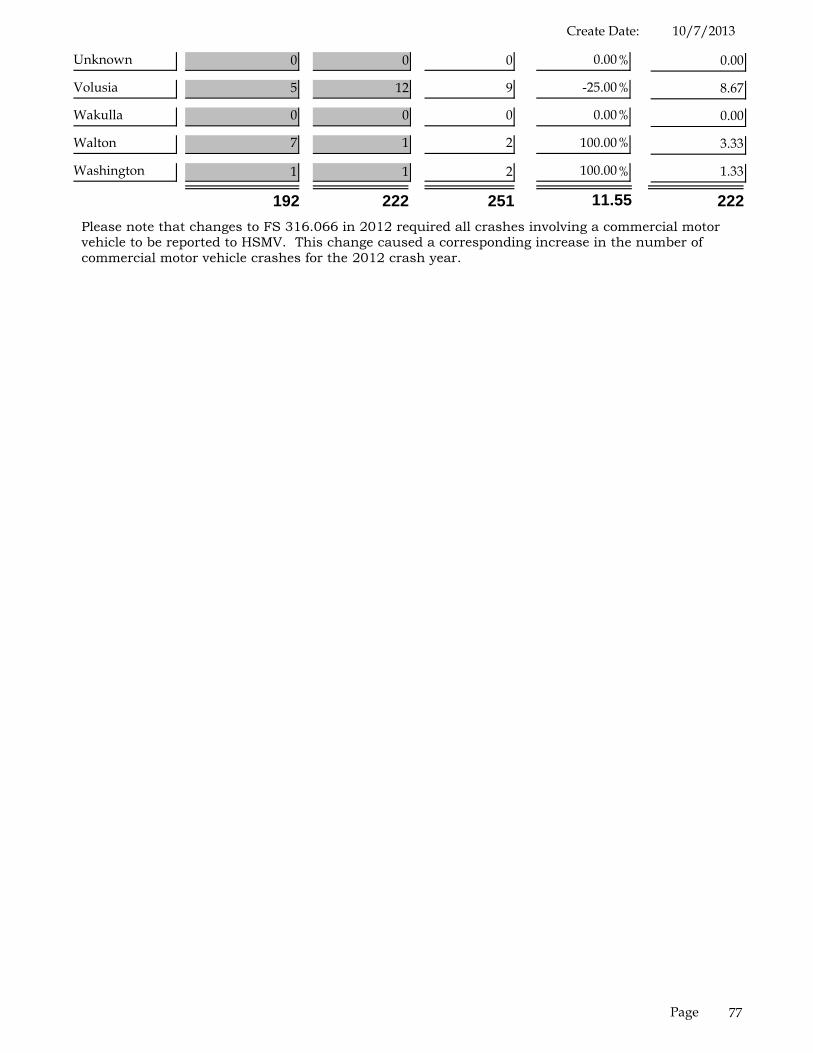
10/7/2013Create Date:
Unknown 0 0 0 %0.00 0.00
Volusia 5 12 9 %-25.00 8.67
Wakulla 0 0 0 %0.00 0.00
Walton 7 1 2 %100.00 3.33
Washington 1 1 2 %100.00 1.33
192 222 251 11.55 222Please note that changes to FS 316.066 in 2012 required all crashes involving a commercial motorvehicle to be reported to HSMV. This change caused a corresponding increase in the number ofcommercial motor vehicle crashes for the 2012 crash year.
77Page
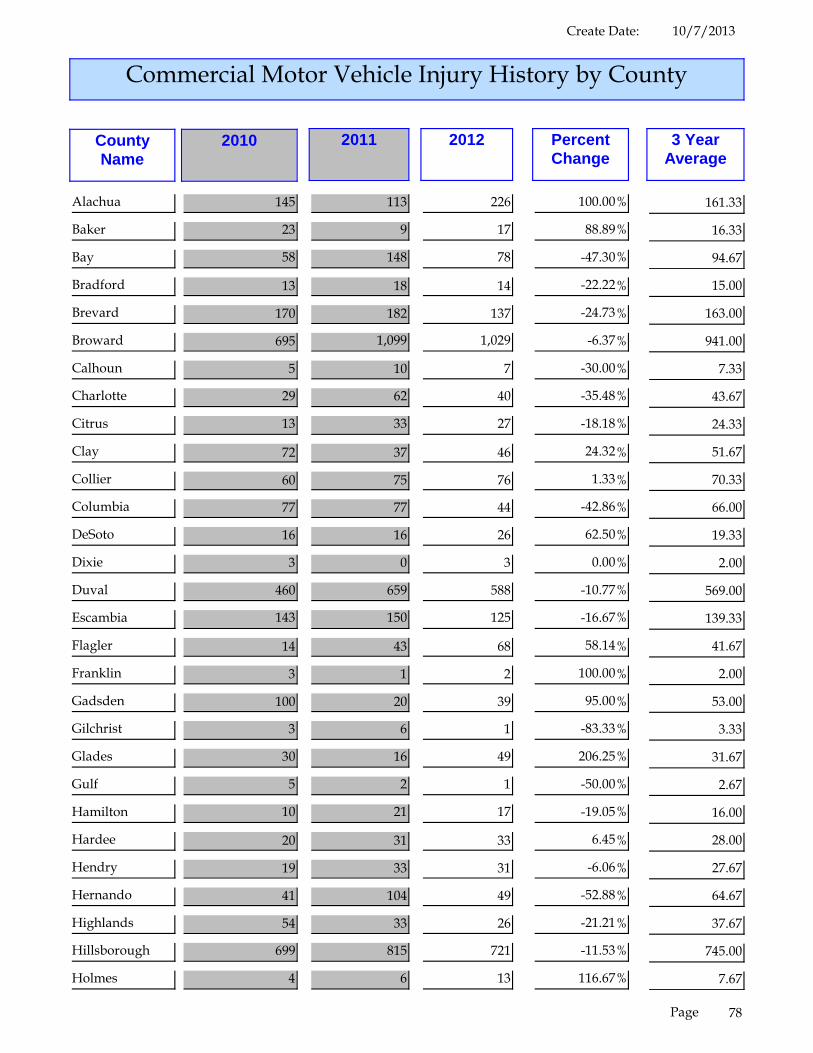
10/7/2013Create Date:
Commercial Motor Vehicle Injury History by County
3 YearAverage
PercentChange
201220112010CountyName
Alachua 145 113 226 %100.00 161.33
Baker 23 9 17 %88.89 16.33
Bay 58 148 78 %-47.30 94.67
Bradford 13 18 14 %-22.22 15.00
Brevard 170 182 137 %-24.73 163.00
Broward 695 1,099 1,029 %-6.37 941.00
Calhoun 5 10 7 %-30.00 7.33
Charlotte 29 62 40 %-35.48 43.67
Citrus 13 33 27 %-18.18 24.33
Clay 72 37 46 %24.32 51.67
Collier 60 75 76 %1.33 70.33
Columbia 77 77 44 %-42.86 66.00
DeSoto 16 16 26 %62.50 19.33
Dixie 3 0 3 %0.00 2.00
Duval 460 659 588 %-10.77 569.00
Escambia 143 150 125 %-16.67 139.33
Flagler 14 43 68 %58.14 41.67
Franklin 3 1 2 %100.00 2.00
Gadsden 100 20 39 %95.00 53.00
Gilchrist 3 6 1 %-83.33 3.33
Glades 30 16 49 %206.25 31.67
Gulf 5 2 1 %-50.00 2.67
Hamilton 10 21 17 %-19.05 16.00
Hardee 20 31 33 %6.45 28.00
Hendry 19 33 31 %-6.06 27.67
Hernando 41 104 49 %-52.88 64.67
Highlands 54 33 26 %-21.21 37.67
Hillsborough 699 815 721 %-11.53 745.00
Holmes 4 6 13 %116.67 7.67
78Page
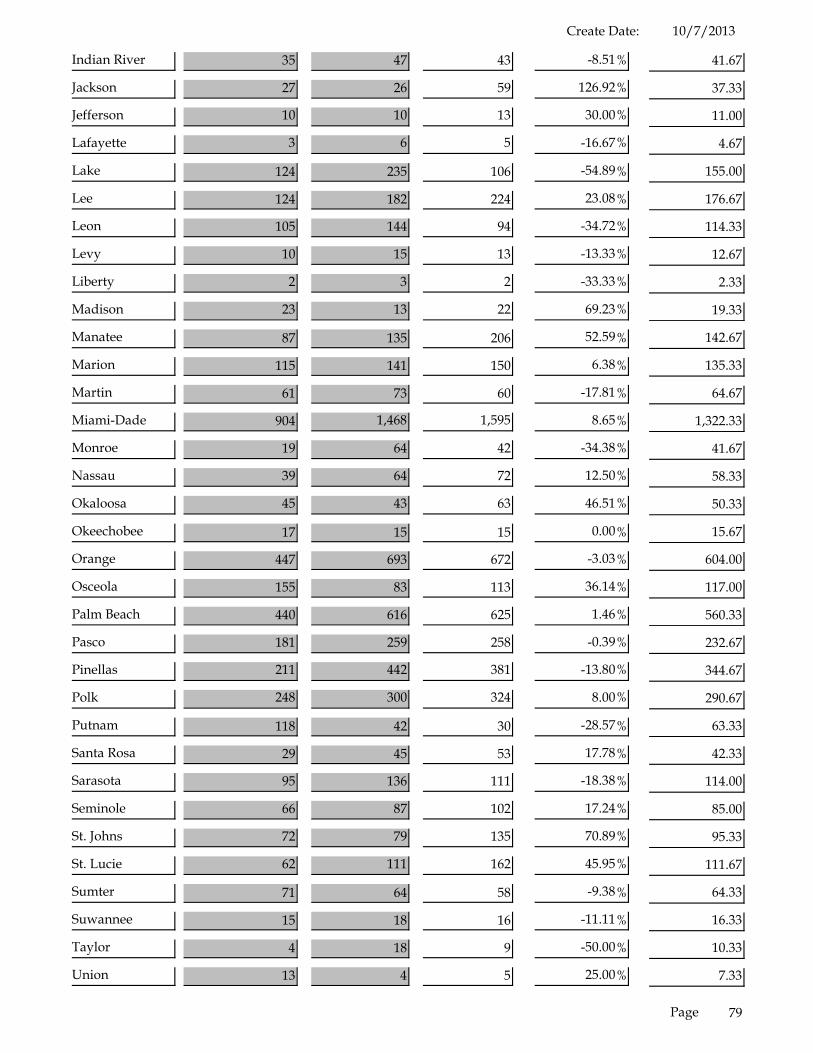
10/7/2013Create Date:
Indian River 35 47 43 %-8.51 41.67
Jackson 27 26 59 %126.92 37.33
Jefferson 10 10 13 %30.00 11.00
Lafayette 3 6 5 %-16.67 4.67
Lake 124 235 106 %-54.89 155.00
Lee 124 182 224 %23.08 176.67
Leon 105 144 94 %-34.72 114.33
Levy 10 15 13 %-13.33 12.67
Liberty 2 3 2 %-33.33 2.33
Madison 23 13 22 %69.23 19.33
Manatee 87 135 206 %52.59 142.67
Marion 115 141 150 %6.38 135.33
Martin 61 73 60 %-17.81 64.67
Miami-Dade 904 1,468 1,595 %8.65 1,322.33
Monroe 19 64 42 %-34.38 41.67
Nassau 39 64 72 %12.50 58.33
Okaloosa 45 43 63 %46.51 50.33
Okeechobee 17 15 15 %0.00 15.67
Orange 447 693 672 %-3.03 604.00
Osceola 155 83 113 %36.14 117.00
Palm Beach 440 616 625 %1.46 560.33
Pasco 181 259 258 %-0.39 232.67
Pinellas 211 442 381 %-13.80 344.67
Polk 248 300 324 %8.00 290.67
Putnam 118 42 30 %-28.57 63.33
Santa Rosa 29 45 53 %17.78 42.33
Sarasota 95 136 111 %-18.38 114.00
Seminole 66 87 102 %17.24 85.00
St. Johns 72 79 135 %70.89 95.33
St. Lucie 62 111 162 %45.95 111.67
Sumter 71 64 58 %-9.38 64.33
Suwannee 15 18 16 %-11.11 16.33
Taylor 4 18 9 %-50.00 10.33
Union 13 4 5 %25.00 7.33
79Page
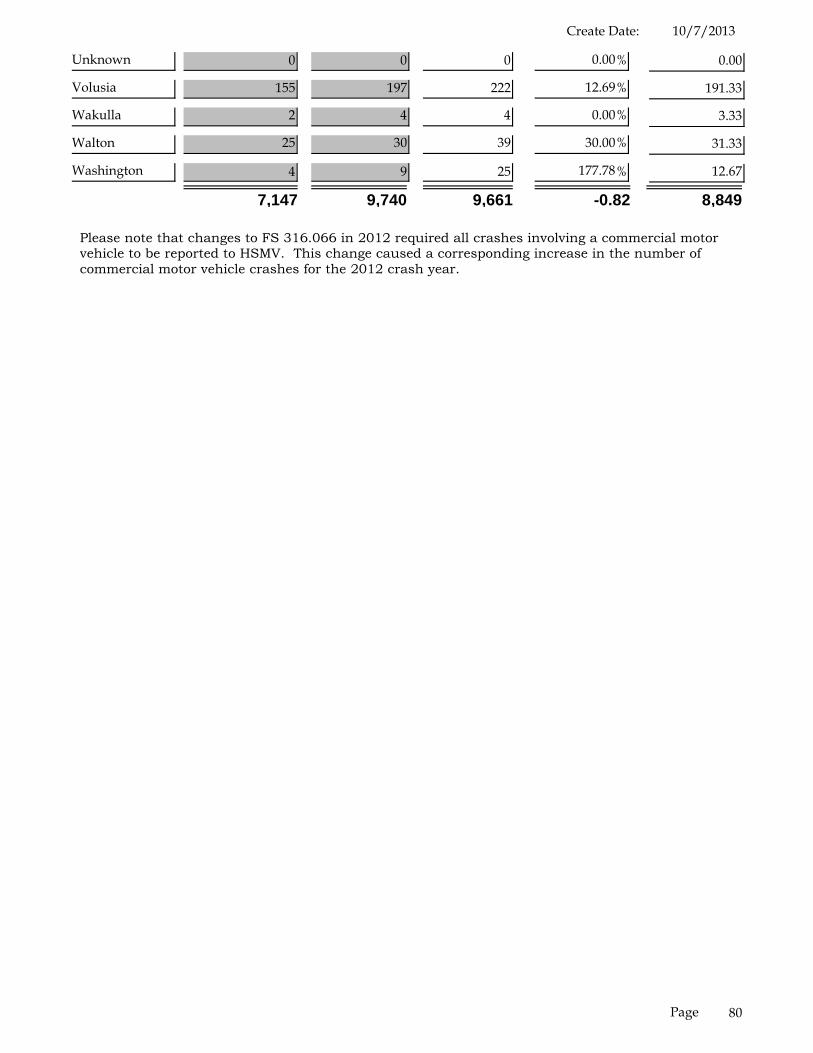
10/7/2013Create Date:
Unknown 0 0 0 %0.00 0.00
Volusia 155 197 222 %12.69 191.33
Wakulla 2 4 4 %0.00 3.33
Walton 25 30 39 %30.00 31.33
Washington 4 9 25 %177.78 12.67
7,147 9,740 9,661 -0.82 8,849
Please note that changes to FS 316.066 in 2012 required all crashes involving a commercial motorvehicle to be reported to HSMV. This change caused a corresponding increase in the number ofcommercial motor vehicle crashes for the 2012 crash year.
80Page

10/7/2013Create Date:
Pedestrian Crash History by County
3 YearAverage
PercentChange
201220112010CountyName
Alachua 114 81 114 %40.74 103.00
Baker 3 8 7 %-12.50 6.00
Bay 87 77 97 %25.97 87.00
Bradford 7 6 3 %-50.00 5.33
Brevard 188 126 201 %59.52 171.67
Broward 1,012 648 1,035 %59.72 898.33
Calhoun 3 2 3 %50.00 2.67
Charlotte 56 56 61 %8.93 57.67
Citrus 29 25 50 %100.00 34.67
Clay 46 50 61 %22.00 52.33
Collier 84 72 85 %18.06 80.33
Columbia 24 21 24 %14.29 23.00
DeSoto 12 15 10 %-33.33 12.33
Dixie 2 1 8 %700.00 3.67
Duval 345 374 425 %13.64 381.33
Escambia 142 143 149 %4.20 144.67
Flagler 22 24 30 %25.00 25.33
Franklin 5 1 7 %600.00 4.33
Gadsden 9 7 7 %0.00 7.67
Gilchrist 0 0 1 %0.00 0.33
Glades 3 2 3 %50.00 2.67
Gulf 5 2 2 %0.00 3.00
Hamilton 4 4 3 %-25.00 3.67
Hardee 6 4 9 %125.00 6.33
Hendry 9 13 14 %7.69 12.00
Hernando 42 60 68 %13.33 56.67
Highlands 21 26 22 %-15.38 23.00
Hillsborough 523 512 591 %15.43 542.00
Holmes 2 3 1 %-66.67 2.00
81Page

10/7/2013Create Date:
Indian River 35 27 37 %37.04 33.00
Jackson 13 7 9 %28.57 9.67
Jefferson 1 2 7 %250.00 3.33
Lafayette 3 2 1 %-50.00 2.00
Lake 80 81 79 %-2.47 80.00
Lee 192 167 205 %22.75 188.00
Leon 143 145 153 %5.52 147.00
Levy 9 10 8 %-20.00 9.00
Liberty 1 0 2 %0.00 1.00
Madison 7 7 5 %-28.57 6.33
Manatee 153 111 158 %42.34 140.67
Marion 100 106 108 %1.89 104.67
Martin 32 37 50 %35.14 39.67
Miami-Dade 1,454 1,357 1,418 %4.50 1,409.67
Monroe 42 48 76 %58.33 55.33
Nassau 21 14 17 %21.43 17.33
Okaloosa 54 69 58 %-15.94 60.33
Okeechobee 18 12 12 %0.00 14.00
Orange 577 517 570 %10.25 554.67
Osceola 117 83 76 %-8.43 92.00
Palm Beach 575 499 575 %15.23 549.67
Pasco 158 155 165 %6.45 159.33
Pinellas 463 375 473 %26.13 437.00
Polk 183 133 192 %44.36 169.33
Putnam 40 29 25 %-13.79 31.33
Santa Rosa 29 29 22 %-24.14 26.67
Sarasota 136 129 140 %8.53 135.00
Seminole 89 117 118 %0.85 108.00
St. Johns 28 52 39 %-25.00 39.67
St. Lucie 84 71 91 %28.17 82.00
Sumter 17 17 9 %-47.06 14.33
Suwannee 10 7 18 %157.14 11.67
Taylor 5 1 2 %100.00 2.67
Union 2 0 2 %0.00 1.33
82Page

10/7/2013Create Date:
Volusia 221 226 223 %-1.33 223.33
Wakulla 4 2 7 %250.00 4.33
Walton 11 12 17 %41.67 13.33
Washington 2 4 4 %0.00 3.33
7,914 7,023 8,262 15.00 7,733
83Page
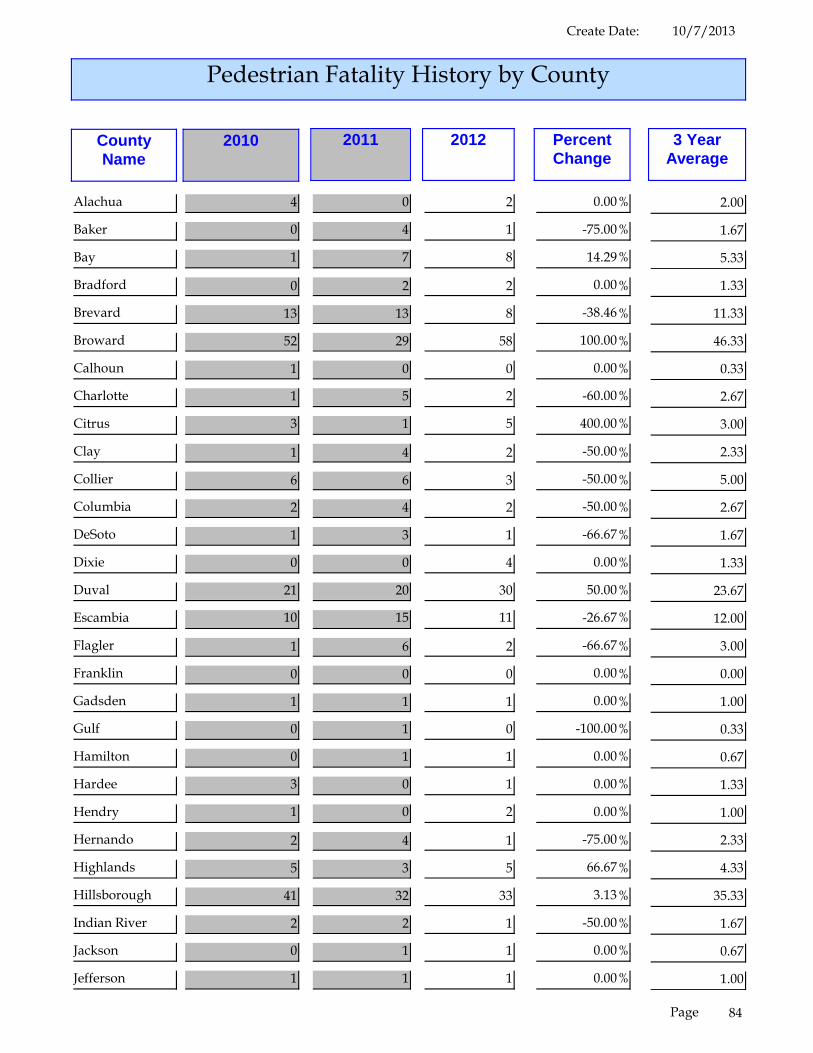
10/7/2013Create Date:
Pedestrian Fatality History by County
3 YearAverage
PercentChange
201220112010CountyName
Alachua 4 0 2 %0.00 2.00
Baker 0 4 1 %-75.00 1.67
Bay 1 7 8 %14.29 5.33
Bradford 0 2 2 %0.00 1.33
Brevard 13 13 8 %-38.46 11.33
Broward 52 29 58 %100.00 46.33
Calhoun 1 0 0 %0.00 0.33
Charlotte 1 5 2 %-60.00 2.67
Citrus 3 1 5 %400.00 3.00
Clay 1 4 2 %-50.00 2.33
Collier 6 6 3 %-50.00 5.00
Columbia 2 4 2 %-50.00 2.67
DeSoto 1 3 1 %-66.67 1.67
Dixie 0 0 4 %0.00 1.33
Duval 21 20 30 %50.00 23.67
Escambia 10 15 11 %-26.67 12.00
Flagler 1 6 2 %-66.67 3.00
Franklin 0 0 0 %0.00 0.00
Gadsden 1 1 1 %0.00 1.00
Gulf 0 1 0 %-100.00 0.33
Hamilton 0 1 1 %0.00 0.67
Hardee 3 0 1 %0.00 1.33
Hendry 1 0 2 %0.00 1.00
Hernando 2 4 1 %-75.00 2.33
Highlands 5 3 5 %66.67 4.33
Hillsborough 41 32 33 %3.13 35.33
Indian River 2 2 1 %-50.00 1.67
Jackson 0 1 1 %0.00 0.67
Jefferson 1 1 1 %0.00 1.00
84Page
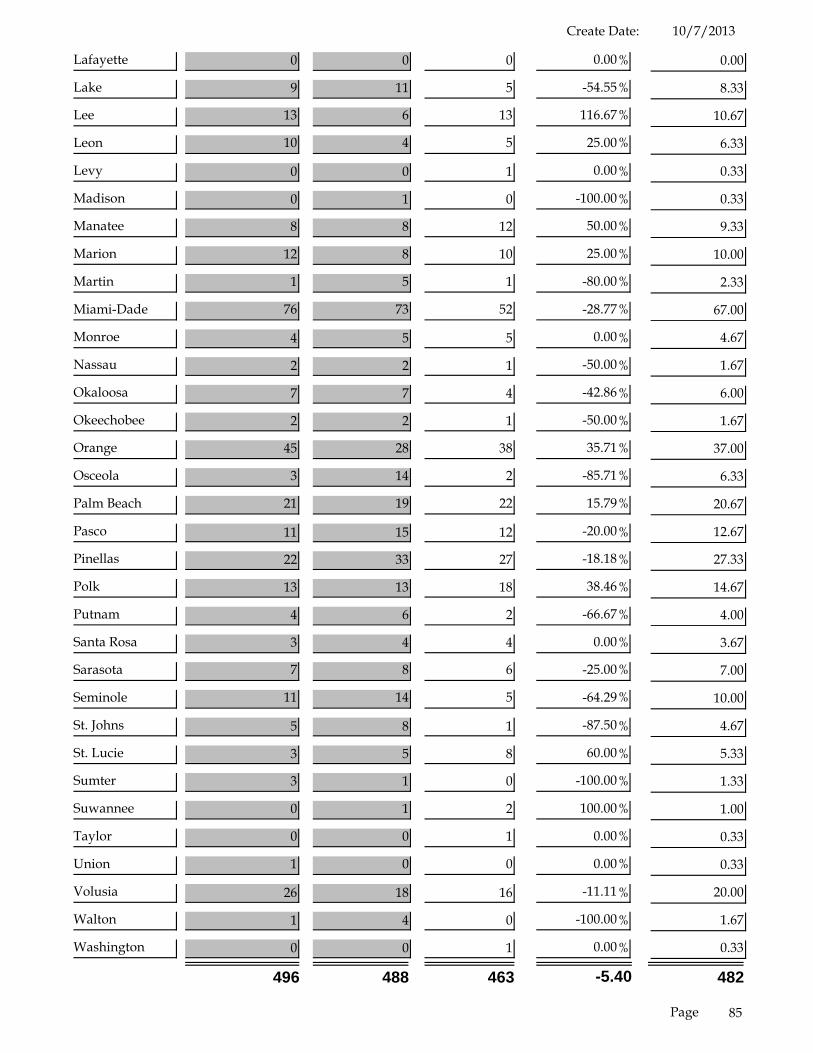
10/7/2013Create Date:
Lafayette 0 0 0 %0.00 0.00
Lake 9 11 5 %-54.55 8.33
Lee 13 6 13 %116.67 10.67
Leon 10 4 5 %25.00 6.33
Levy 0 0 1 %0.00 0.33
Madison 0 1 0 %-100.00 0.33
Manatee 8 8 12 %50.00 9.33
Marion 12 8 10 %25.00 10.00
Martin 1 5 1 %-80.00 2.33
Miami-Dade 76 73 52 %-28.77 67.00
Monroe 4 5 5 %0.00 4.67
Nassau 2 2 1 %-50.00 1.67
Okaloosa 7 7 4 %-42.86 6.00
Okeechobee 2 2 1 %-50.00 1.67
Orange 45 28 38 %35.71 37.00
Osceola 3 14 2 %-85.71 6.33
Palm Beach 21 19 22 %15.79 20.67
Pasco 11 15 12 %-20.00 12.67
Pinellas 22 33 27 %-18.18 27.33
Polk 13 13 18 %38.46 14.67
Putnam 4 6 2 %-66.67 4.00
Santa Rosa 3 4 4 %0.00 3.67
Sarasota 7 8 6 %-25.00 7.00
Seminole 11 14 5 %-64.29 10.00
St. Johns 5 8 1 %-87.50 4.67
St. Lucie 3 5 8 %60.00 5.33
Sumter 3 1 0 %-100.00 1.33
Suwannee 0 1 2 %100.00 1.00
Taylor 0 0 1 %0.00 0.33
Union 1 0 0 %0.00 0.33
Volusia 26 18 16 %-11.11 20.00
Walton 1 4 0 %-100.00 1.67
Washington 0 0 1 %0.00 0.33
496 488 463 -5.40 482
85Page
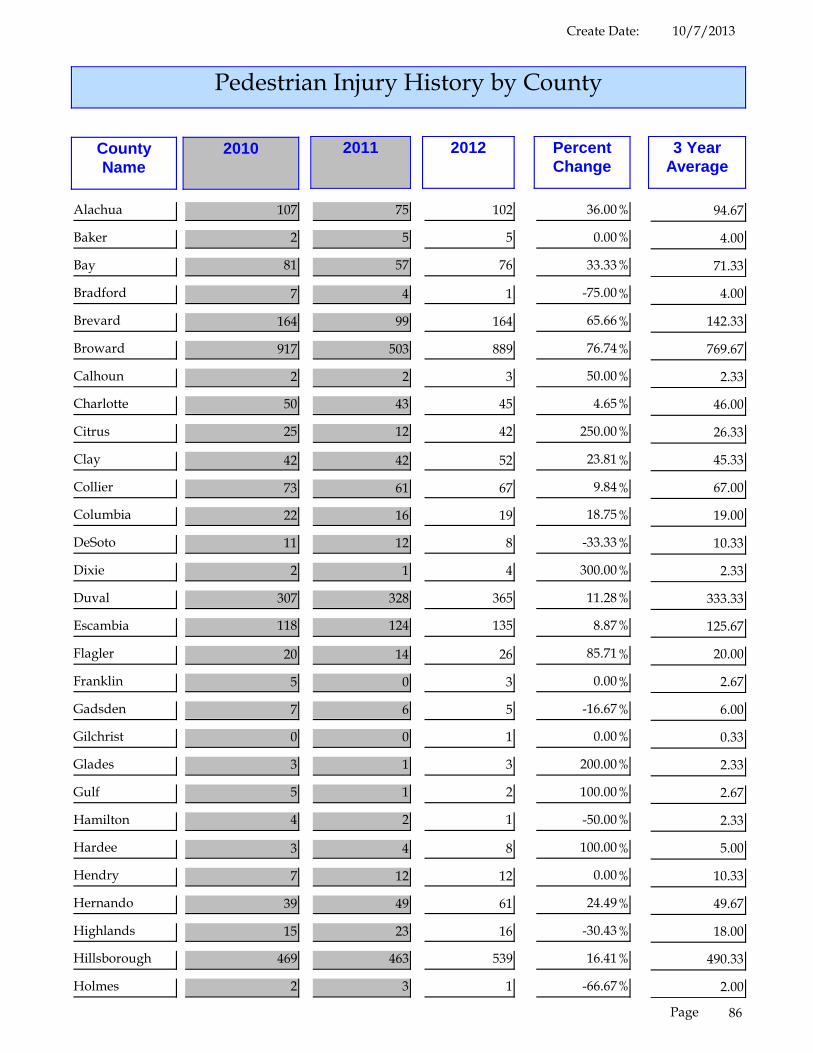
10/7/2013Create Date:
Pedestrian Injury History by County
3 YearAverage
PercentChange
201220112010CountyName
Alachua 107 75 102 %36.00 94.67
Baker 2 5 5 %0.00 4.00
Bay 81 57 76 %33.33 71.33
Bradford 7 4 1 %-75.00 4.00
Brevard 164 99 164 %65.66 142.33
Broward 917 503 889 %76.74 769.67
Calhoun 2 2 3 %50.00 2.33
Charlotte 50 43 45 %4.65 46.00
Citrus 25 12 42 %250.00 26.33
Clay 42 42 52 %23.81 45.33
Collier 73 61 67 %9.84 67.00
Columbia 22 16 19 %18.75 19.00
DeSoto 11 12 8 %-33.33 10.33
Dixie 2 1 4 %300.00 2.33
Duval 307 328 365 %11.28 333.33
Escambia 118 124 135 %8.87 125.67
Flagler 20 14 26 %85.71 20.00
Franklin 5 0 3 %0.00 2.67
Gadsden 7 6 5 %-16.67 6.00
Gilchrist 0 0 1 %0.00 0.33
Glades 3 1 3 %200.00 2.33
Gulf 5 1 2 %100.00 2.67
Hamilton 4 2 1 %-50.00 2.33
Hardee 3 4 8 %100.00 5.00
Hendry 7 12 12 %0.00 10.33
Hernando 39 49 61 %24.49 49.67
Highlands 15 23 16 %-30.43 18.00
Hillsborough 469 463 539 %16.41 490.33
Holmes 2 3 1 %-66.67 2.00
86Page
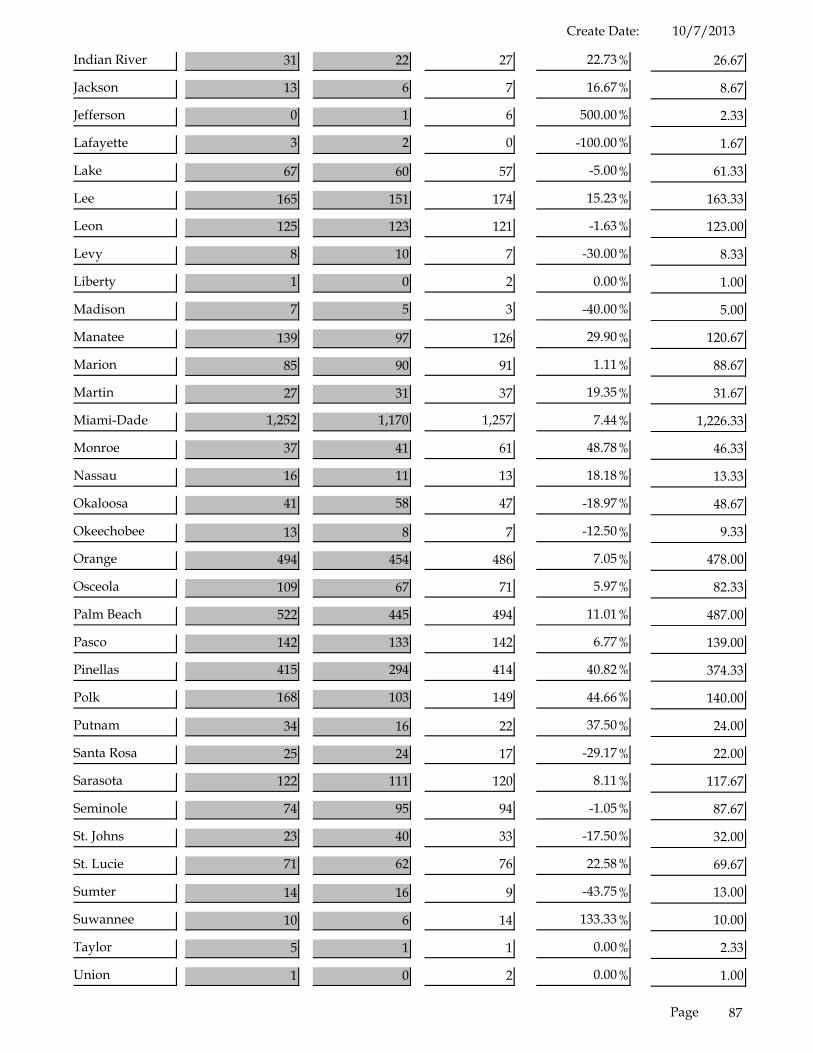
10/7/2013Create Date:
Indian River 31 22 27 %22.73 26.67
Jackson 13 6 7 %16.67 8.67
Jefferson 0 1 6 %500.00 2.33
Lafayette 3 2 0 %-100.00 1.67
Lake 67 60 57 %-5.00 61.33
Lee 165 151 174 %15.23 163.33
Leon 125 123 121 %-1.63 123.00
Levy 8 10 7 %-30.00 8.33
Liberty 1 0 2 %0.00 1.00
Madison 7 5 3 %-40.00 5.00
Manatee 139 97 126 %29.90 120.67
Marion 85 90 91 %1.11 88.67
Martin 27 31 37 %19.35 31.67
Miami-Dade 1,252 1,170 1,257 %7.44 1,226.33
Monroe 37 41 61 %48.78 46.33
Nassau 16 11 13 %18.18 13.33
Okaloosa 41 58 47 %-18.97 48.67
Okeechobee 13 8 7 %-12.50 9.33
Orange 494 454 486 %7.05 478.00
Osceola 109 67 71 %5.97 82.33
Palm Beach 522 445 494 %11.01 487.00
Pasco 142 133 142 %6.77 139.00
Pinellas 415 294 414 %40.82 374.33
Polk 168 103 149 %44.66 140.00
Putnam 34 16 22 %37.50 24.00
Santa Rosa 25 24 17 %-29.17 22.00
Sarasota 122 111 120 %8.11 117.67
Seminole 74 95 94 %-1.05 87.67
St. Johns 23 40 33 %-17.50 32.00
St. Lucie 71 62 76 %22.58 69.67
Sumter 14 16 9 %-43.75 13.00
Suwannee 10 6 14 %133.33 10.00
Taylor 5 1 1 %0.00 2.33
Union 1 0 2 %0.00 1.00
87Page
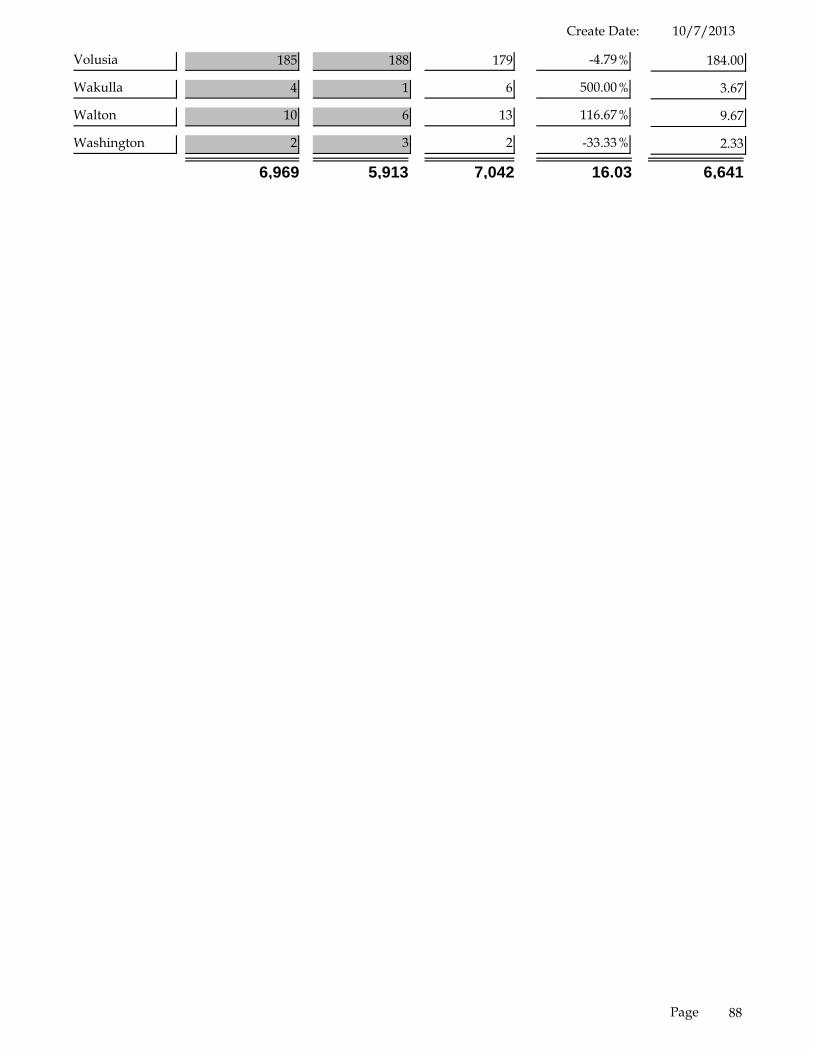
10/7/2013Create Date:
Volusia 185 188 179 %-4.79 184.00
Wakulla 4 1 6 %500.00 3.67
Walton 10 6 13 %116.67 9.67
Washington 2 3 2 %-33.33 2.33
6,969 5,913 7,042 16.03 6,641
88Page
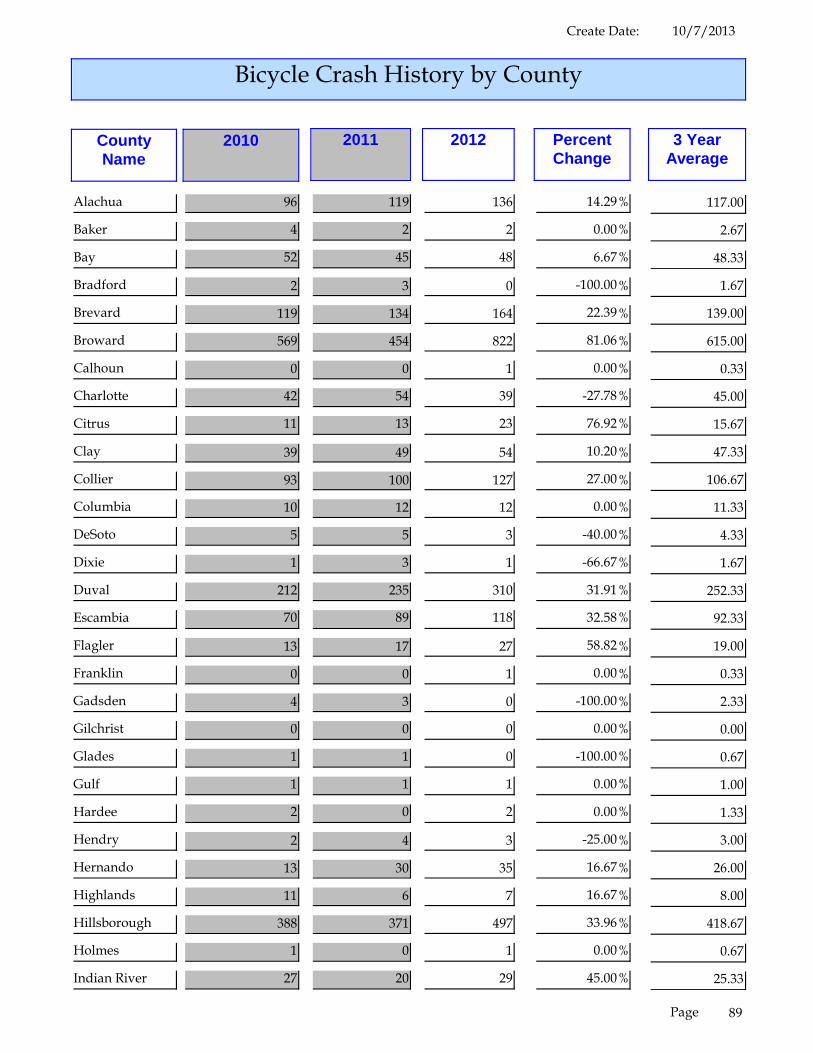
10/7/2013Create Date:
Bicycle Crash History by County
3 YearAverage
PercentChange
201220112010CountyName
Alachua 96 119 136 %14.29 117.00
Baker 4 2 2 %0.00 2.67
Bay 52 45 48 %6.67 48.33
Bradford 2 3 0 %-100.00 1.67
Brevard 119 134 164 %22.39 139.00
Broward 569 454 822 %81.06 615.00
Calhoun 0 0 1 %0.00 0.33
Charlotte 42 54 39 %-27.78 45.00
Citrus 11 13 23 %76.92 15.67
Clay 39 49 54 %10.20 47.33
Collier 93 100 127 %27.00 106.67
Columbia 10 12 12 %0.00 11.33
DeSoto 5 5 3 %-40.00 4.33
Dixie 1 3 1 %-66.67 1.67
Duval 212 235 310 %31.91 252.33
Escambia 70 89 118 %32.58 92.33
Flagler 13 17 27 %58.82 19.00
Franklin 0 0 1 %0.00 0.33
Gadsden 4 3 0 %-100.00 2.33
Gilchrist 0 0 0 %0.00 0.00
Glades 1 1 0 %-100.00 0.67
Gulf 1 1 1 %0.00 1.00
Hardee 2 0 2 %0.00 1.33
Hendry 2 4 3 %-25.00 3.00
Hernando 13 30 35 %16.67 26.00
Highlands 11 6 7 %16.67 8.00
Hillsborough 388 371 497 %33.96 418.67
Holmes 1 0 1 %0.00 0.67
Indian River 27 20 29 %45.00 25.33
89Page

10/7/2013Create Date:
Jackson 1 3 2 %-33.33 2.00
Lake 34 30 51 %70.00 38.33
Lee 132 129 152 %17.83 137.67
Leon 70 57 68 %19.30 65.00
Levy 1 4 4 %0.00 3.00
Liberty 2 1 0 %-100.00 1.00
Madison 1 0 0 %0.00 0.33
Manatee 114 113 128 %13.27 118.33
Marion 37 51 79 %54.90 55.67
Martin 47 34 36 %5.88 39.00
Miami-Dade 573 683 751 %9.96 669.00
Monroe 104 86 141 %63.95 110.33
Nassau 14 8 7 %-12.50 9.67
Okaloosa 37 33 67 %103.03 45.67
Okeechobee 7 3 8 %166.67 6.00
Orange 315 373 462 %23.86 383.33
Osceola 55 40 54 %35.00 49.67
Palm Beach 386 398 477 %19.85 420.33
Pasco 139 127 139 %9.45 135.00
Pinellas 395 412 583 %41.50 463.33
Polk 110 84 121 %44.05 105.00
Putnam 6 4 12 %200.00 7.33
Santa Rosa 14 15 25 %66.67 18.00
Sarasota 116 161 173 %7.45 150.00
Seminole 65 101 104 %2.97 90.00
St. Johns 37 49 47 %-4.08 44.33
St. Lucie 58 59 52 %-11.86 56.33
Sumter 5 6 8 %33.33 6.33
Suwannee 2 2 1 %-50.00 1.67
Taylor 2 3 1 %-66.67 2.00
Union 1 1 0 %-100.00 0.67
Volusia 185 160 194 %21.25 179.67
Wakulla 1 2 5 %150.00 2.67
Walton 9 8 13 %62.50 10.00
90Page

10/7/2013Create Date:
Washington 0 1 1 %0.00 0.67
4,863 5,011 6,429 22.06 5,434
91Page
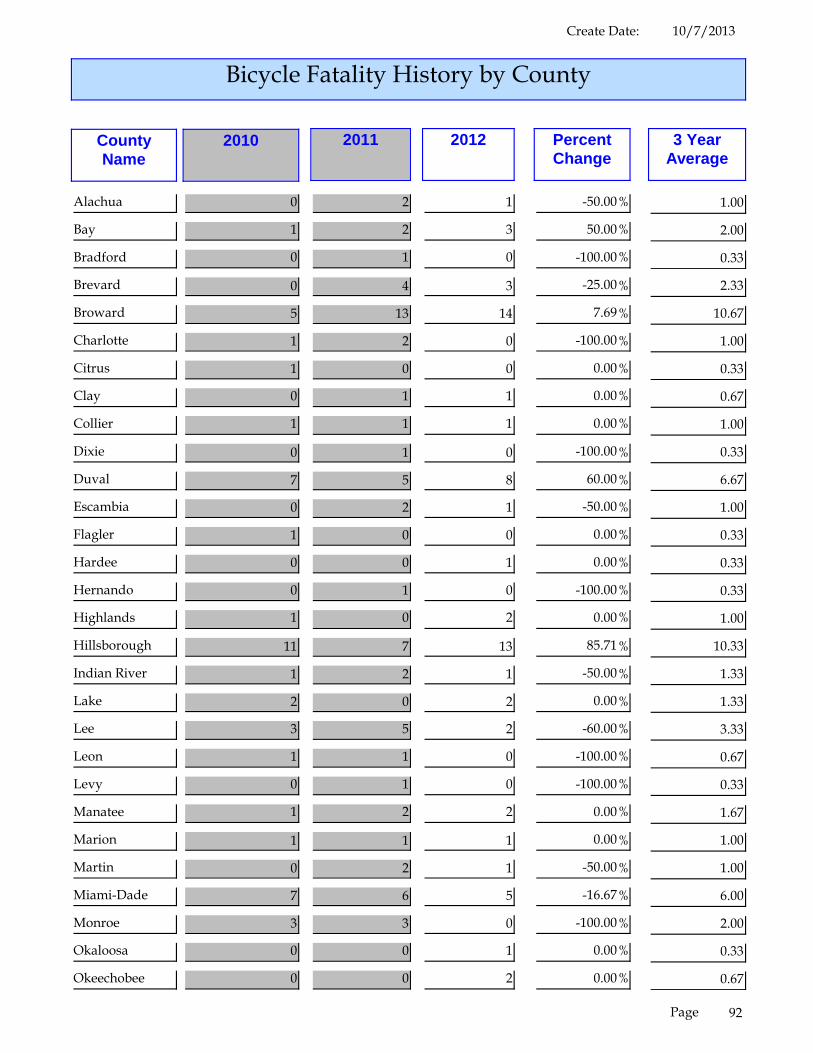
10/7/2013Create Date:
Bicycle Fatality History by County
3 YearAverage
PercentChange
201220112010CountyName
Alachua 0 2 1 %-50.00 1.00
Bay 1 2 3 %50.00 2.00
Bradford 0 1 0 %-100.00 0.33
Brevard 0 4 3 %-25.00 2.33
Broward 5 13 14 %7.69 10.67
Charlotte 1 2 0 %-100.00 1.00
Citrus 1 0 0 %0.00 0.33
Clay 0 1 1 %0.00 0.67
Collier 1 1 1 %0.00 1.00
Dixie 0 1 0 %-100.00 0.33
Duval 7 5 8 %60.00 6.67
Escambia 0 2 1 %-50.00 1.00
Flagler 1 0 0 %0.00 0.33
Hardee 0 0 1 %0.00 0.33
Hernando 0 1 0 %-100.00 0.33
Highlands 1 0 2 %0.00 1.00
Hillsborough 11 7 13 %85.71 10.33
Indian River 1 2 1 %-50.00 1.33
Lake 2 0 2 %0.00 1.33
Lee 3 5 2 %-60.00 3.33
Leon 1 1 0 %-100.00 0.67
Levy 0 1 0 %-100.00 0.33
Manatee 1 2 2 %0.00 1.67
Marion 1 1 1 %0.00 1.00
Martin 0 2 1 %-50.00 1.00
Miami-Dade 7 6 5 %-16.67 6.00
Monroe 3 3 0 %-100.00 2.00
Okaloosa 0 0 1 %0.00 0.33
Okeechobee 0 0 2 %0.00 0.67
92Page
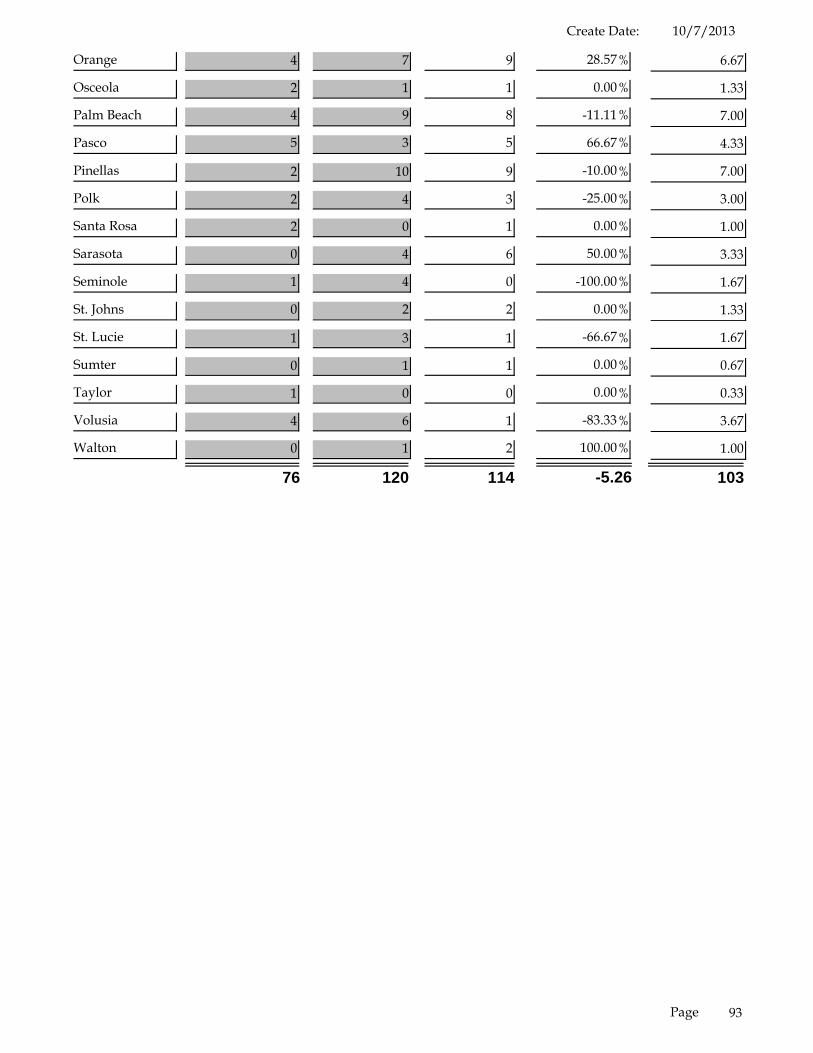
10/7/2013Create Date:
Orange 4 7 9 %28.57 6.67
Osceola 2 1 1 %0.00 1.33
Palm Beach 4 9 8 %-11.11 7.00
Pasco 5 3 5 %66.67 4.33
Pinellas 2 10 9 %-10.00 7.00
Polk 2 4 3 %-25.00 3.00
Santa Rosa 2 0 1 %0.00 1.00
Sarasota 0 4 6 %50.00 3.33
Seminole 1 4 0 %-100.00 1.67
St. Johns 0 2 2 %0.00 1.33
St. Lucie 1 3 1 %-66.67 1.67
Sumter 0 1 1 %0.00 0.67
Taylor 1 0 0 %0.00 0.33
Volusia 4 6 1 %-83.33 3.67
Walton 0 1 2 %100.00 1.00
76 120 114 -5.26 103
93Page

10/7/2013Create Date:
Bicycle Injury History by County
3 YearAverage
PercentChange
201220112010CountyName
Alachua 92 109 133 %22.02 111.33
Baker 4 2 2 %0.00 2.67
Bay 46 35 43 %22.86 41.33
Bradford 2 2 0 %-100.00 1.33
Brevard 111 125 151 %20.80 129.00
Broward 540 377 770 %104.24 562.33
Calhoun 0 0 1 %0.00 0.33
Charlotte 39 51 37 %-27.45 42.33
Citrus 10 10 23 %130.00 14.33
Clay 33 42 48 %14.29 41.00
Collier 88 96 125 %30.21 103.00
Columbia 10 12 11 %-8.33 11.00
DeSoto 4 5 3 %-40.00 4.00
Dixie 1 2 1 %-50.00 1.33
Duval 191 219 287 %31.05 232.33
Escambia 68 81 113 %39.51 87.33
Flagler 11 16 23 %43.75 16.67
Franklin 0 0 1 %0.00 0.33
Gadsden 4 3 0 %-100.00 2.33
Gilchrist 0 0 0 %0.00 0.00
Glades 1 1 0 %-100.00 0.67
Gulf 1 1 1 %0.00 1.00
Hardee 2 0 1 %0.00 1.00
Hendry 2 4 3 %-25.00 3.00
Hernando 13 27 33 %22.22 24.33
Highlands 10 5 5 %0.00 6.67
Hillsborough 371 350 470 %34.29 397.00
Holmes 1 0 1 %0.00 0.67
Indian River 24 19 27 %42.11 23.33
94Page
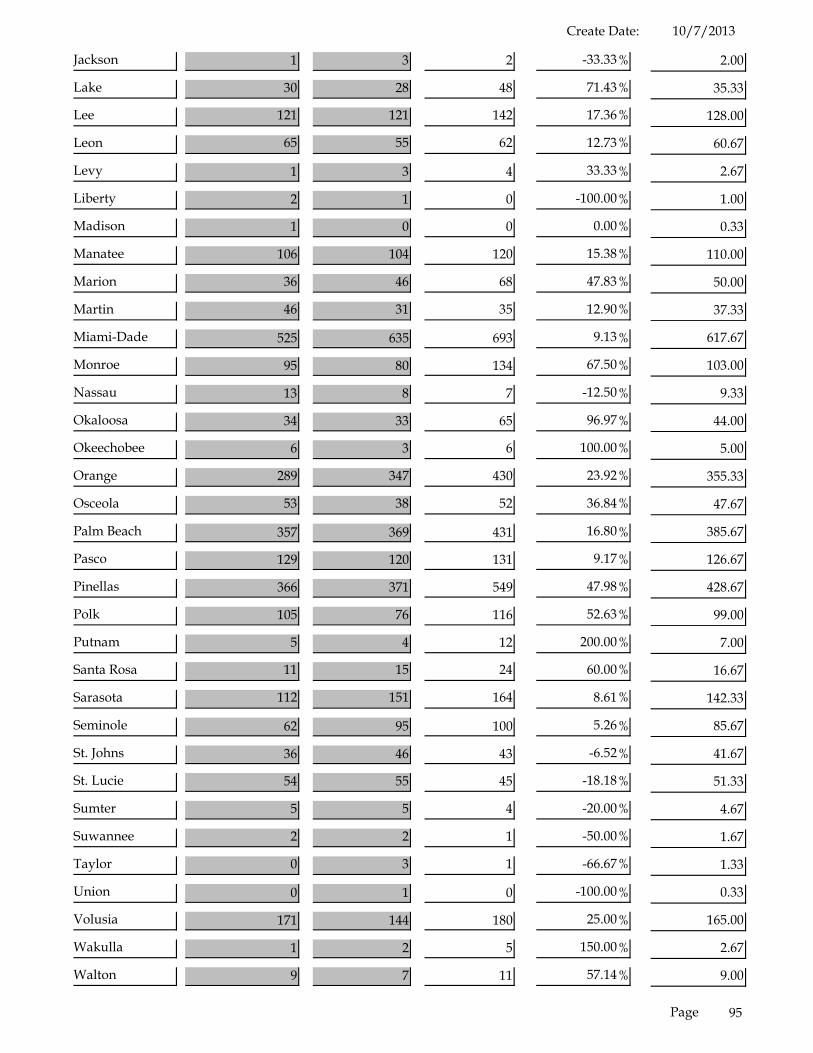
10/7/2013Create Date:
Jackson 1 3 2 %-33.33 2.00
Lake 30 28 48 %71.43 35.33
Lee 121 121 142 %17.36 128.00
Leon 65 55 62 %12.73 60.67
Levy 1 3 4 %33.33 2.67
Liberty 2 1 0 %-100.00 1.00
Madison 1 0 0 %0.00 0.33
Manatee 106 104 120 %15.38 110.00
Marion 36 46 68 %47.83 50.00
Martin 46 31 35 %12.90 37.33
Miami-Dade 525 635 693 %9.13 617.67
Monroe 95 80 134 %67.50 103.00
Nassau 13 8 7 %-12.50 9.33
Okaloosa 34 33 65 %96.97 44.00
Okeechobee 6 3 6 %100.00 5.00
Orange 289 347 430 %23.92 355.33
Osceola 53 38 52 %36.84 47.67
Palm Beach 357 369 431 %16.80 385.67
Pasco 129 120 131 %9.17 126.67
Pinellas 366 371 549 %47.98 428.67
Polk 105 76 116 %52.63 99.00
Putnam 5 4 12 %200.00 7.00
Santa Rosa 11 15 24 %60.00 16.67
Sarasota 112 151 164 %8.61 142.33
Seminole 62 95 100 %5.26 85.67
St. Johns 36 46 43 %-6.52 41.67
St. Lucie 54 55 45 %-18.18 51.33
Sumter 5 5 4 %-20.00 4.67
Suwannee 2 2 1 %-50.00 1.67
Taylor 0 3 1 %-66.67 1.33
Union 0 1 0 %-100.00 0.33
Volusia 171 144 180 %25.00 165.00
Wakulla 1 2 5 %150.00 2.67
Walton 9 7 11 %57.14 9.00
95Page
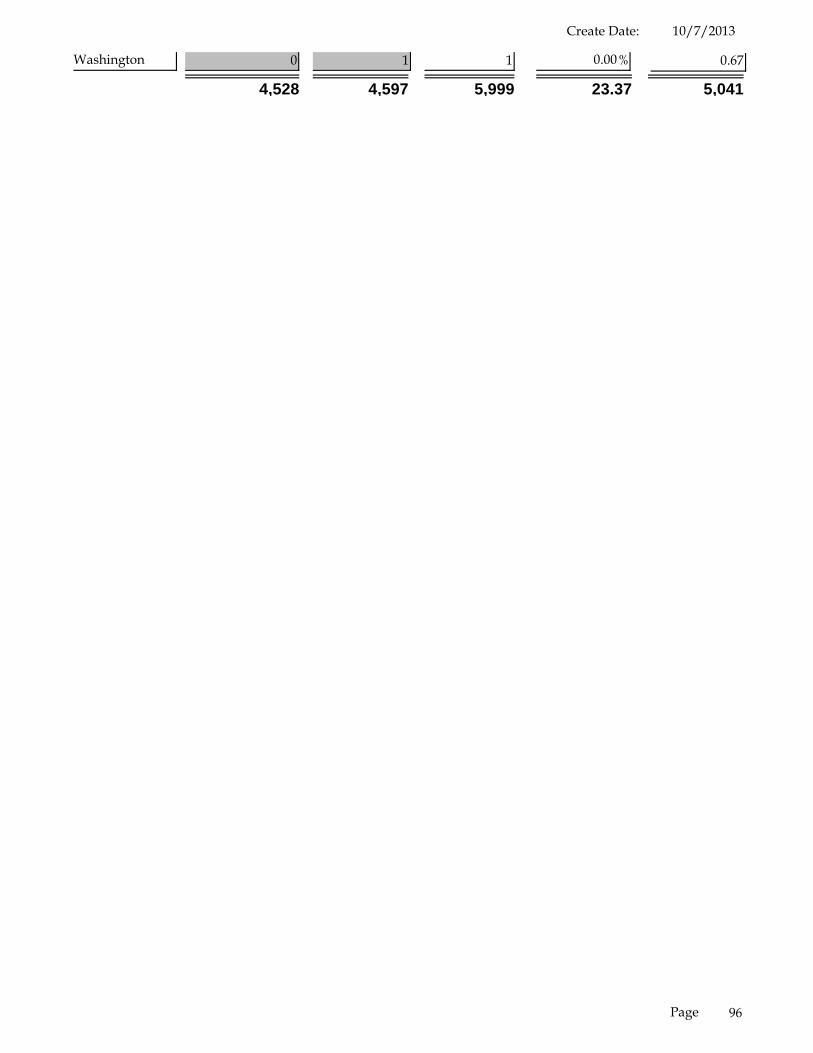
10/7/2013Create Date:
Washington 0 1 1 %0.00 0.67
4,528 4,597 5,999 23.37 5,041
96Page
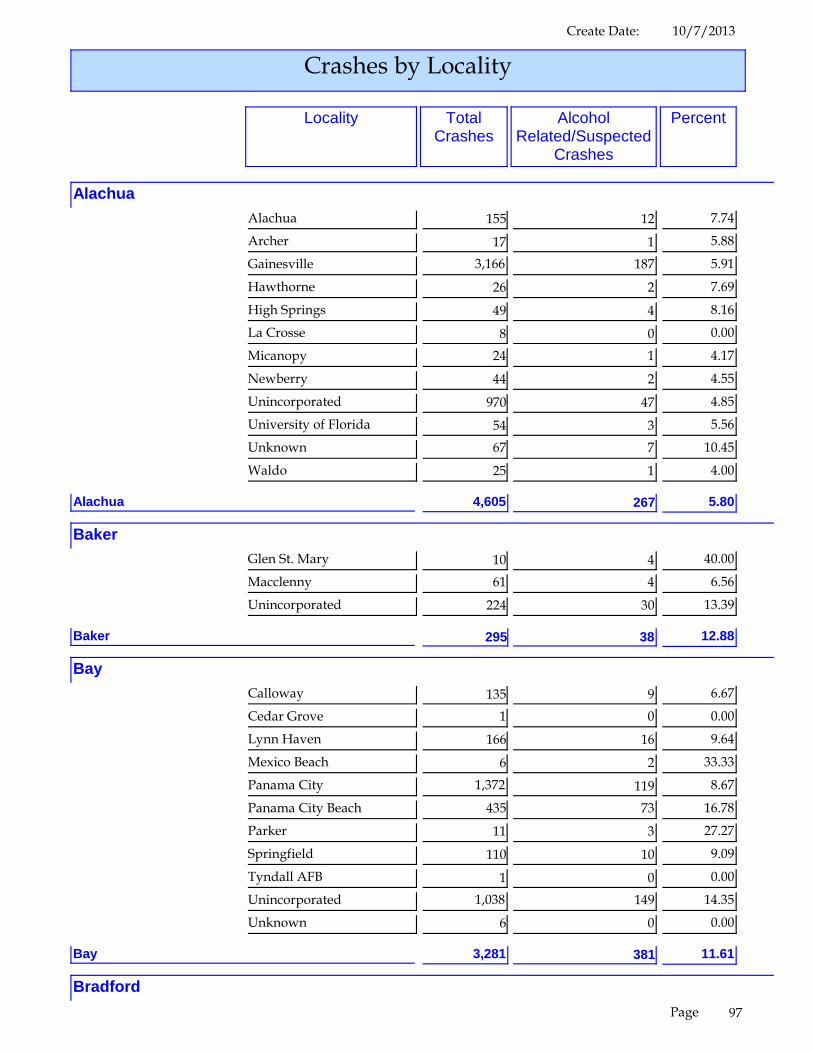
10/7/2013Create Date:
Crashes by Locality
PercentAlcoholRelated/Suspected
Crashes
TotalCrashes
Locality
AlachuaAlachua 155 12 7.74
Archer 17 1 5.88
Gainesville 3,166 187 5.91
Hawthorne 26 2 7.69
High Springs 49 4 8.16
La Crosse 8 0 0.00
Micanopy 24 1 4.17
Newberry 44 2 4.55
Unincorporated 970 47 4.85
University of Florida 54 3 5.56
Unknown 67 7 10.45
Waldo 25 1 4.00
4,605 267Alachua 5.80
BakerGlen St. Mary 10 4 40.00
Macclenny 61 4 6.56
Unincorporated 224 30 13.39
295 38Baker 12.88
BayCalloway 135 9 6.67
Cedar Grove 1 0 0.00
Lynn Haven 166 16 9.64
Mexico Beach 6 2 33.33
Panama City 1,372 119 8.67
Panama City Beach 435 73 16.78
Parker 11 3 27.27
Springfield 110 10 9.09
Tyndall AFB 1 0 0.00
Unincorporated 1,038 149 14.35
Unknown 6 0 0.00
3,281 381Bay 11.61
Bradford97Page

10/7/2013Create Date:
BradfordHampton 1 0 0.00
Lawtey 2 2 100.00
Starke 5 1 20.00
Unincorporated 70 9 12.86
78 12Bradford 15.38
BrevardCanova Beach 2 1 50.00
Cape Canaveral 111 23 20.72
Cocoa 455 40 8.79
Cocoa Beach 211 23 10.90
Eau Gallie 3 0 0.00
Indialantic 57 8 14.04
Indian Harbour Beach 45 4 8.89
June Park 1 0 0.00
Kennedy Space Center 1 0 0.00
Malabar 22 1 4.55
Melbourne 1,093 103 9.42
Melbourne Beach 22 4 18.18
Melbourne Village 1 0 0.00
Merritt Island 271 25 9.23
Mims 43 3 6.98
Palm Bay 556 52 9.35
Palm Shores 3 1 33.33
Patrick AFB 1 0 0.00
Rockledge 126 8 6.35
Satellite Beach 56 5 8.93
South Patrick Shores 8 0 0.00
Titusville 495 32 6.46
Unincorporated 1,918 125 6.52
Unknown 1 0 0.00
West Melbourne 216 20 9.26
5,718 478Brevard 8.36
BrowardCoconut Creek 959 43 4.48
Cooper City 392 13 3.32
Coral Springs 1,648 44 2.67
Dania Beach 677 36 5.32
Davie 3,260 122 3.74
98Page
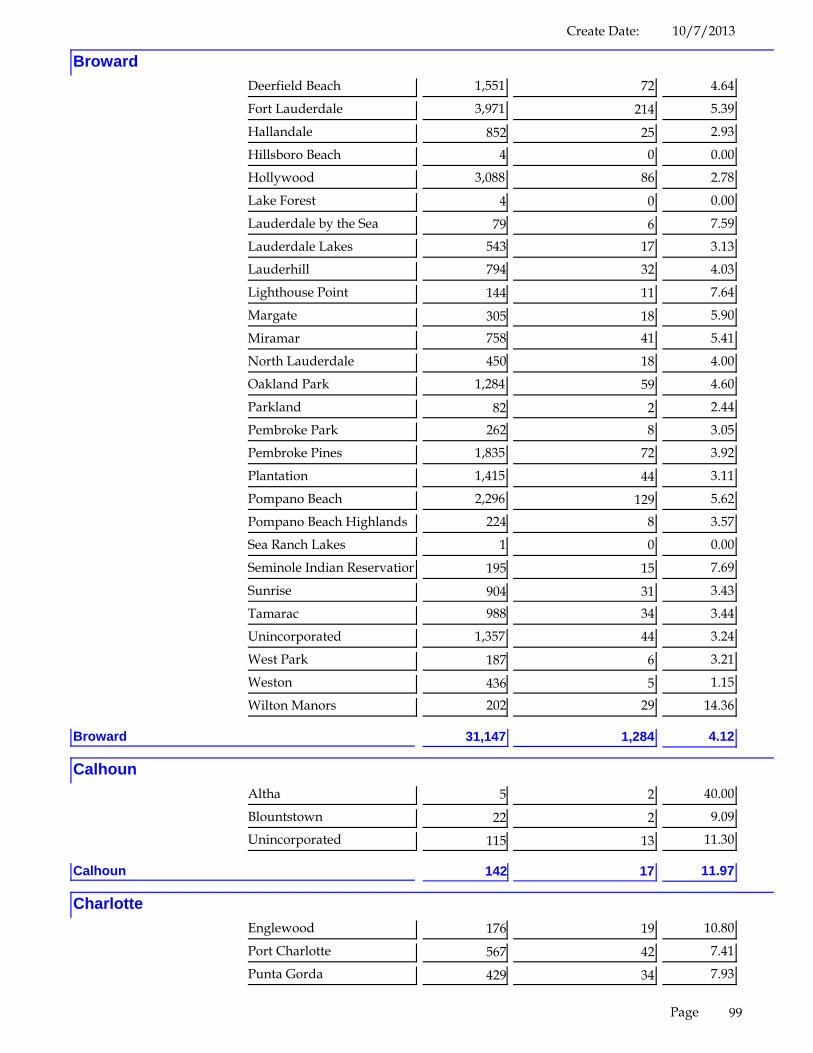
10/7/2013Create Date:
BrowardDeerfield Beach 1,551 72 4.64
Fort Lauderdale 3,971 214 5.39
Hallandale 852 25 2.93
Hillsboro Beach 4 0 0.00
Hollywood 3,088 86 2.78
Lake Forest 4 0 0.00
Lauderdale by the Sea 79 6 7.59
Lauderdale Lakes 543 17 3.13
Lauderhill 794 32 4.03
Lighthouse Point 144 11 7.64
Margate 305 18 5.90
Miramar 758 41 5.41
North Lauderdale 450 18 4.00
Oakland Park 1,284 59 4.60
Parkland 82 2 2.44
Pembroke Park 262 8 3.05
Pembroke Pines 1,835 72 3.92
Plantation 1,415 44 3.11
Pompano Beach 2,296 129 5.62
Pompano Beach Highlands 224 8 3.57
Sea Ranch Lakes 1 0 0.00
Seminole Indian Reservation 195 15 7.69
Sunrise 904 31 3.43
Tamarac 988 34 3.44
Unincorporated 1,357 44 3.24
West Park 187 6 3.21
Weston 436 5 1.15
Wilton Manors 202 29 14.36
31,147 1,284Broward 4.12
CalhounAltha 5 2 40.00
Blountstown 22 2 9.09
Unincorporated 115 13 11.30
142 17Calhoun 11.97
CharlotteEnglewood 176 19 10.80
Port Charlotte 567 42 7.41
Punta Gorda 429 34 7.93
99Page

10/7/2013Create Date:
CharlotteUnincorporated 269 20 7.43
Unknown 1 0 0.00
1,442 115Charlotte 7.98
CitrusCrystal River 115 7 6.09
Homosassa Springs 10 0 0.00
Inverness 184 14 7.61
Unincorporated 974 82 8.42
1,283 103Citrus 8.03
ClayDoctors Inlet 1 0 0.00
Green Cove Springs 98 10 10.20
Keystone Heights 29 2 6.90
Middleburg 38 4 10.53
Orange Park 168 11 6.55
Penny Farms 1 0 0.00
Unincorporated 1,574 117 7.43
1,909 144Clay 7.54
CollierEast Naples 332 38 11.45
Everglades 6 1 16.67
Immolakee 139 17 12.23
Marco Island 114 11 9.65
Naples 346 21 6.07
North Naples 324 39 12.04
Unincorporated 1,442 169 11.72
2,703 296Collier 10.95
ColumbiaFort White 3 0 0.00
Lake City 323 26 8.05
Unincorporated 783 84 10.73
1,109 110Columbia 9.92
DeSotoArcadia 299 35 11.71
Unincorporated 31 3 9.68
100Page

10/7/2013Create Date:
330 38DeSoto 11.52
DixieCross City 8 3 37.50
Horseshoe Beach 2 1 50.00
Unincorporated 130 19 14.62
140 23Dixie 16.43
DuvalAtlantic Beach 117 16 13.68
Baldwin 19 1 5.26
Dinsmore 1 0 0.00
Jacksonville 17,615 1,040 5.90
Jacksonville Beach 549 60 10.93
Jacksonville Duval County School 4 0 0.00
Jacksonville NAS 1 0 0.00
Neptune Beach 65 18 27.69
Unincorporated 137 7 5.11
University of North Florida 42 0 0.00
18,550 1,142Duval 6.16
EscambiaBrent 2 0 0.00
Cantonment 20 1 5.00
Century 9 2 22.22
Myrtle Grove 7 1 14.29
Pensacola 1,324 132 9.97
Unincorporated 3,994 341 8.54
University of West Florida 12 0 0.00
Unknown 7 0 0.00
Warrington 16 0 0.00
West Pensacola 12 0 0.00
5,403 477Escambia 8.83
FlaglerBeverly Beach 3 0 0.00
Bunnell 82 19 23.17
Flagler Beach 40 6 15.00
Palm Coast 564 53 9.40
Unincorporated 147 27 18.37
836 105Flagler 12.56
101Page
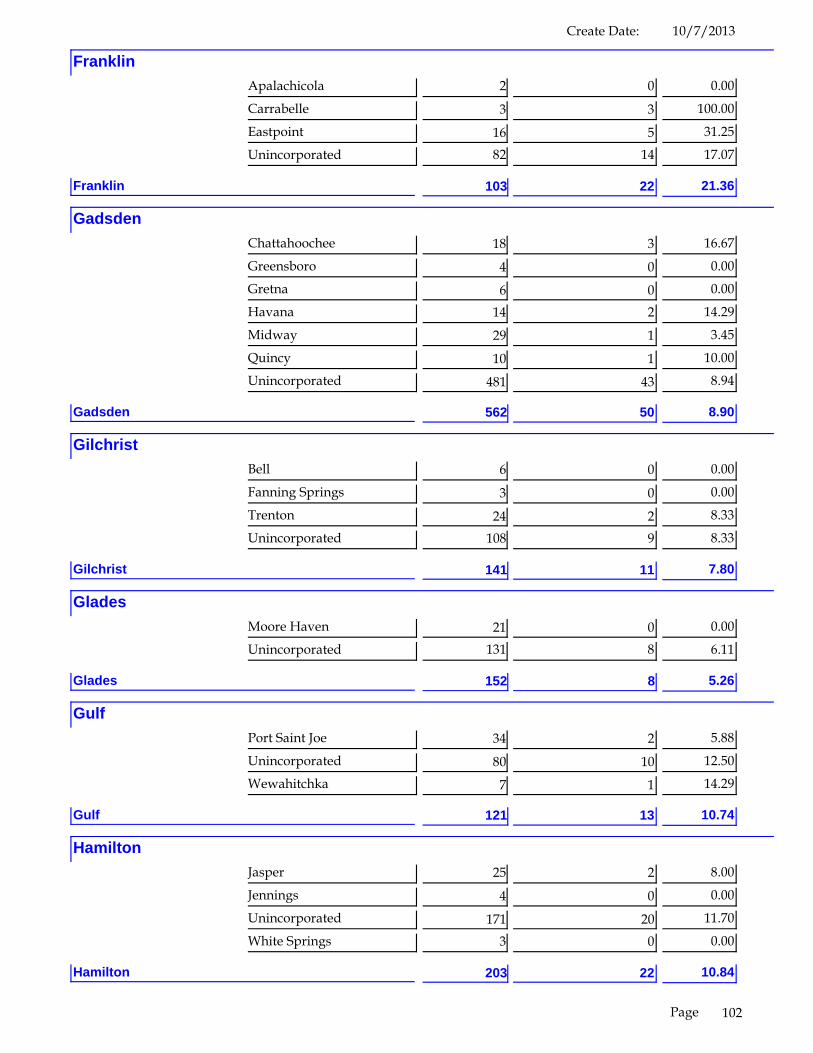
10/7/2013Create Date:
FranklinApalachicola 2 0 0.00
Carrabelle 3 3 100.00
Eastpoint 16 5 31.25
Unincorporated 82 14 17.07
103 22Franklin 21.36
GadsdenChattahoochee 18 3 16.67
Greensboro 4 0 0.00
Gretna 6 0 0.00
Havana 14 2 14.29
Midway 29 1 3.45
Quincy 10 1 10.00
Unincorporated 481 43 8.94
562 50Gadsden 8.90
GilchristBell 6 0 0.00
Fanning Springs 3 0 0.00
Trenton 24 2 8.33
Unincorporated 108 9 8.33
141 11Gilchrist 7.80
GladesMoore Haven 21 0 0.00
Unincorporated 131 8 6.11
152 8Glades 5.26
GulfPort Saint Joe 34 2 5.88
Unincorporated 80 10 12.50
Wewahitchka 7 1 14.29
121 13Gulf 10.74
HamiltonJasper 25 2 8.00
Jennings 4 0 0.00
Unincorporated 171 20 11.70
White Springs 3 0 0.00
203 22Hamilton 10.84
102Page

10/7/2013Create Date:
HardeeBowling Green 46 1 2.17
Unincorporated 34 1 2.94
Wauchula 139 8 5.76
Zolfo Springs 86 3 3.49
305 13Hardee 4.26
HendryClewiston 84 5 5.95
La Belle 46 4 8.70
Unincorporated 154 27 17.53
284 36Hendry 12.68
HernandoBrooksville 167 11 6.59
Unincorporated 1,565 118 7.54
Unknown 256 14 5.47
Weekiwachee 7 1 14.29
1,995 144Hernando 7.22
HighlandsAvon Park 176 9 5.11
Lake Placid 201 23 11.44
Sebring 374 30 8.02
Sebring Airport 1 0 0.00
Unincorporated 144 22 15.28
896 84Highlands 9.38
HillsboroughBrandon 87 1 1.15
Palm River/Clair Mel 2 0 0.00
Plant City 383 20 5.22
Ruskin 9 1 11.11
Tampa 6,457 488 7.56
Tampa International Airport 78 6 7.69
Temple Terrace 204 16 7.84
Unincorporated 12,871 955 7.42
University of South Florida 86 2 2.33
20,177 1,489Hillsborough 7.38
HolmesBonifay 11 0 0.00
103Page
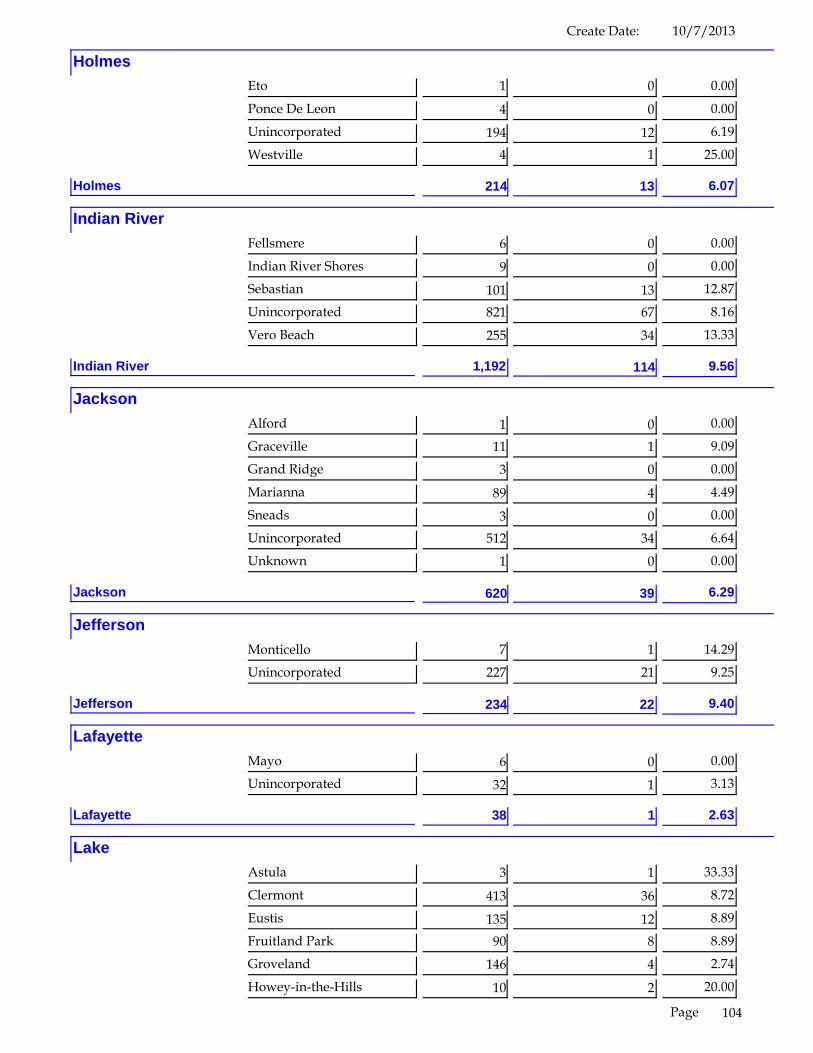
10/7/2013Create Date:
HolmesEto 1 0 0.00
Ponce De Leon 4 0 0.00
Unincorporated 194 12 6.19
Westville 4 1 25.00
214 13Holmes 6.07
Indian RiverFellsmere 6 0 0.00
Indian River Shores 9 0 0.00
Sebastian 101 13 12.87
Unincorporated 821 67 8.16
Vero Beach 255 34 13.33
1,192 114Indian River 9.56
JacksonAlford 1 0 0.00
Graceville 11 1 9.09
Grand Ridge 3 0 0.00
Marianna 89 4 4.49
Sneads 3 0 0.00
Unincorporated 512 34 6.64
Unknown 1 0 0.00
620 39Jackson 6.29
JeffersonMonticello 7 1 14.29
Unincorporated 227 21 9.25
234 22Jefferson 9.40
LafayetteMayo 6 0 0.00
Unincorporated 32 1 3.13
38 1Lafayette 2.63
LakeAstula 3 1 33.33
Clermont 413 36 8.72
Eustis 135 12 8.89
Fruitland Park 90 8 8.89
Groveland 146 4 2.74
Howey-in-the-Hills 10 2 20.00
104Page
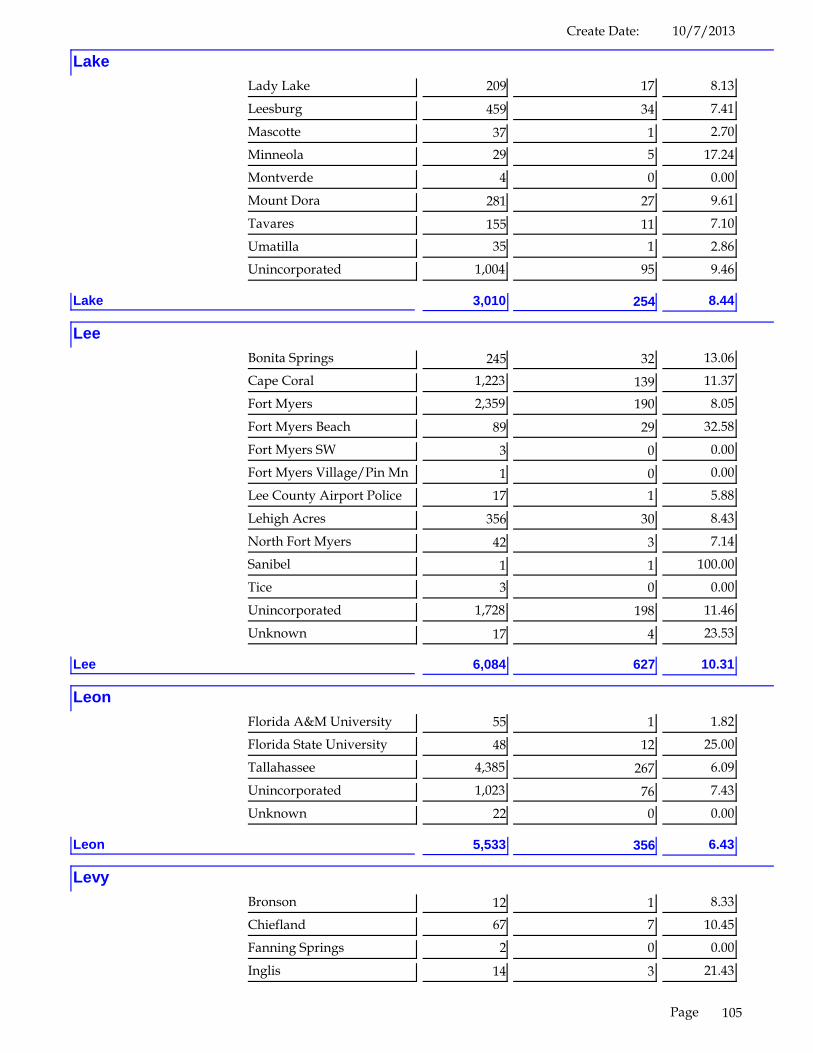
10/7/2013Create Date:
LakeLady Lake 209 17 8.13
Leesburg 459 34 7.41
Mascotte 37 1 2.70
Minneola 29 5 17.24
Montverde 4 0 0.00
Mount Dora 281 27 9.61
Tavares 155 11 7.10
Umatilla 35 1 2.86
Unincorporated 1,004 95 9.46
3,010 254Lake 8.44
LeeBonita Springs 245 32 13.06
Cape Coral 1,223 139 11.37
Fort Myers 2,359 190 8.05
Fort Myers Beach 89 29 32.58
Fort Myers SW 3 0 0.00
Fort Myers Village/Pin Mn 1 0 0.00
Lee County Airport Police 17 1 5.88
Lehigh Acres 356 30 8.43
North Fort Myers 42 3 7.14
Sanibel 1 1 100.00
Tice 3 0 0.00
Unincorporated 1,728 198 11.46
Unknown 17 4 23.53
6,084 627Lee 10.31
LeonFlorida A&M University 55 1 1.82
Florida State University 48 12 25.00
Tallahassee 4,385 267 6.09
Unincorporated 1,023 76 7.43
Unknown 22 0 0.00
5,533 356Leon 6.43
LevyBronson 12 1 8.33
Chiefland 67 7 10.45
Fanning Springs 2 0 0.00
Inglis 14 3 21.43
105Page
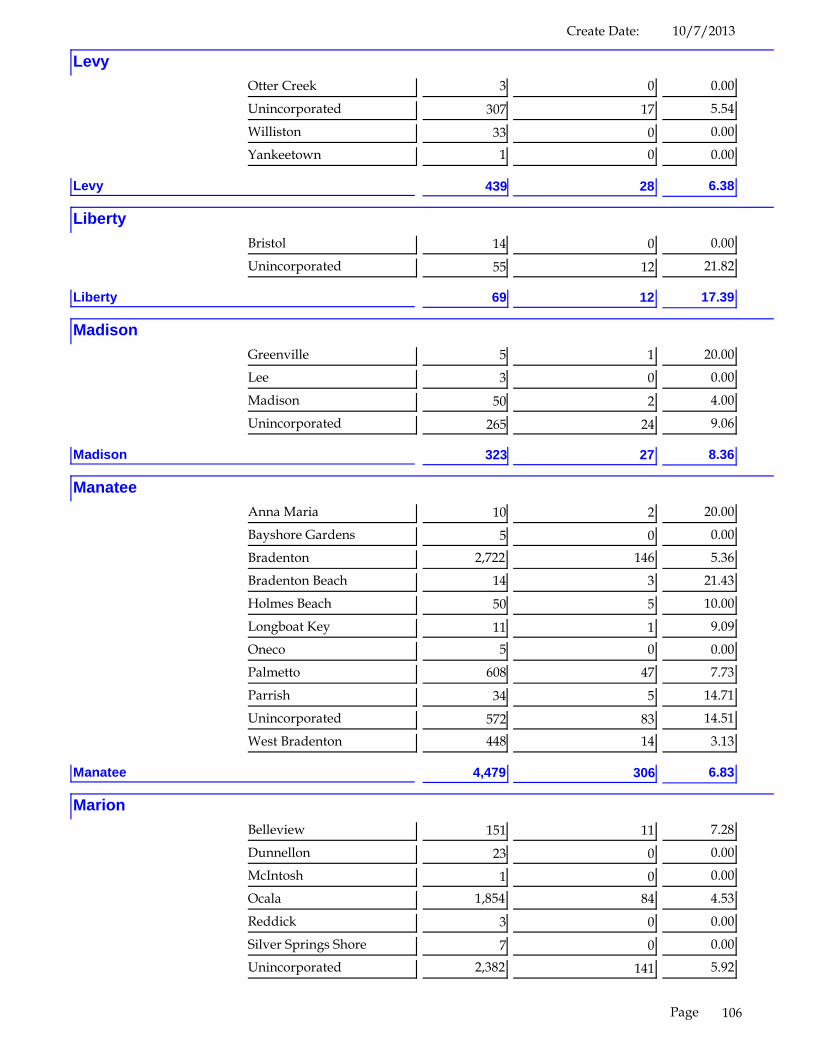
10/7/2013Create Date:
LevyOtter Creek 3 0 0.00
Unincorporated 307 17 5.54
Williston 33 0 0.00
Yankeetown 1 0 0.00
439 28Levy 6.38
LibertyBristol 14 0 0.00
Unincorporated 55 12 21.82
69 12Liberty 17.39
MadisonGreenville 5 1 20.00
Lee 3 0 0.00
Madison 50 2 4.00
Unincorporated 265 24 9.06
323 27Madison 8.36
ManateeAnna Maria 10 2 20.00
Bayshore Gardens 5 0 0.00
Bradenton 2,722 146 5.36
Bradenton Beach 14 3 21.43
Holmes Beach 50 5 10.00
Longboat Key 11 1 9.09
Oneco 5 0 0.00
Palmetto 608 47 7.73
Parrish 34 5 14.71
Unincorporated 572 83 14.51
West Bradenton 448 14 3.13
4,479 306Manatee 6.83
MarionBelleview 151 11 7.28
Dunnellon 23 0 0.00
McIntosh 1 0 0.00
Ocala 1,854 84 4.53
Reddick 3 0 0.00
Silver Springs Shore 7 0 0.00
Unincorporated 2,382 141 5.92
106Page
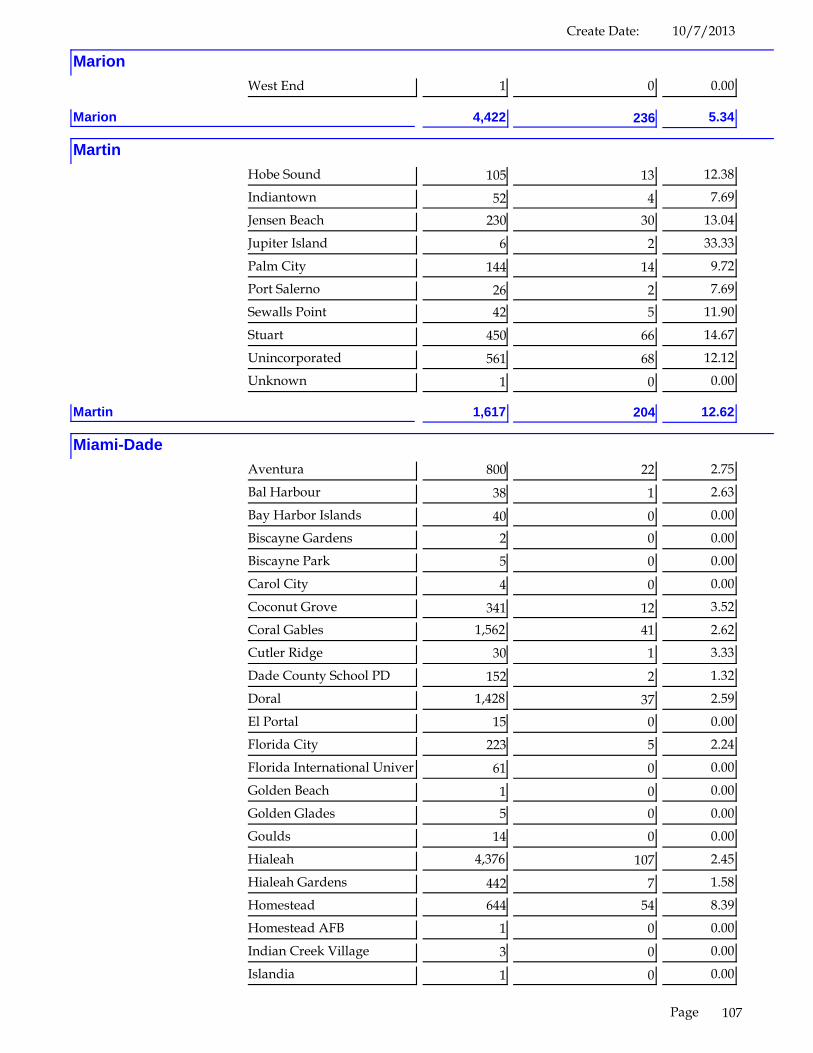
10/7/2013Create Date:
MarionWest End 1 0 0.00
4,422 236Marion 5.34
MartinHobe Sound 105 13 12.38
Indiantown 52 4 7.69
Jensen Beach 230 30 13.04
Jupiter Island 6 2 33.33
Palm City 144 14 9.72
Port Salerno 26 2 7.69
Sewalls Point 42 5 11.90
Stuart 450 66 14.67
Unincorporated 561 68 12.12
Unknown 1 0 0.00
1,617 204Martin 12.62
Miami-DadeAventura 800 22 2.75
Bal Harbour 38 1 2.63
Bay Harbor Islands 40 0 0.00
Biscayne Gardens 2 0 0.00
Biscayne Park 5 0 0.00
Carol City 4 0 0.00
Coconut Grove 341 12 3.52
Coral Gables 1,562 41 2.62
Cutler Ridge 30 1 3.33
Dade County School PD 152 2 1.32
Doral 1,428 37 2.59
El Portal 15 0 0.00
Florida City 223 5 2.24
Florida International University 61 0 0.00
Golden Beach 1 0 0.00
Golden Glades 5 0 0.00
Goulds 14 0 0.00
Hialeah 4,376 107 2.45
Hialeah Gardens 442 7 1.58
Homestead 644 54 8.39
Homestead AFB 1 0 0.00
Indian Creek Village 3 0 0.00
Islandia 1 0 0.00
107Page

10/7/2013Create Date:
Miami-DadeKendall 406 7 1.72
Key Biscayne 63 2 3.17
Leisure City 6 0 0.00
Medley 258 4 1.55
Miami 12,110 337 2.78
Miami Beach 2,369 153 6.46
Miami Gardens 2,147 56 2.61
Miami Lakes 444 14 3.15
Miami Shores 92 4 4.35
Miami Springs 87 4 4.60
Miami TP 1,203 32 2.66
Miccosukee Indian Reservation 25 3 12.00
Naranja 12 0 0.00
North Bay Village 52 3 5.77
North Miami 1,447 42 2.90
North Miami Beach 816 22 2.70
Olympia Heights 1 0 0.00
Opa Locka 93 4 4.30
Palmetto Bay 236 11 4.66
Perrine 5 0 0.00
Pine Crest Village 448 12 2.68
Richmond Heights 28 0 0.00
South Miami 171 5 2.92
South Miami Heights 10 1 10.00
Sunny Isles 282 18 6.38
Surfside 87 2 2.30
Sweetwater 501 12 2.40
Unincorporated 16,929 482 2.85
Unincorporated County 91 9 9.89
University of Miami 20 0 0.00
Unknown 25 2 8.00
Virginia Gardens 35 0 0.00
West Miami 125 5 4.00
Westview 1 0 0.00
50,813 1,535Miami-Dade 3.02
MonroeBoca Chica 2 0 0.00
Islamorada 134 15 11.19
Key Colony Beach 8 0 0.00
108Page

10/7/2013Create Date:
MonroeKey Largo 153 16 10.46
Key West 780 97 12.44
Layton 3 0 0.00
Marathon 151 18 11.92
Plantation 5 0 0.00
Tavernier 48 1 2.08
Unincorporated 387 45 11.63
1,671 192Monroe 11.49
NassauCallahan 28 2 7.14
Fernandina Beach 88 14 15.91
Hilliard 12 0 0.00
Unincorporated 469 53 11.30
Yulee 36 5 13.89
633 74Nassau 11.69
OkaloosaCinco Bayou 1 0 0.00
Crestview 402 23 5.72
Destin 308 59 19.16
Eglin 1 0 0.00
Fort Walton Beach 154 23 14.94
Mary Esther 48 6 12.50
Niceville 161 17 10.56
Ocean City 1 0 0.00
Shalimar 2 0 0.00
Unincorporated 1,419 138 9.73
Unknown 1 0 0.00
Valparaiso 13 1 7.69
2,511 267Okaloosa 10.63
OkeechobeeOkeechobee 101 7 6.93
Unincorporated 286 29 10.14
387 36Okeechobee 9.30
OrangeApopka 466 42 9.01
Azalea Park 1 0 0.00
109Page
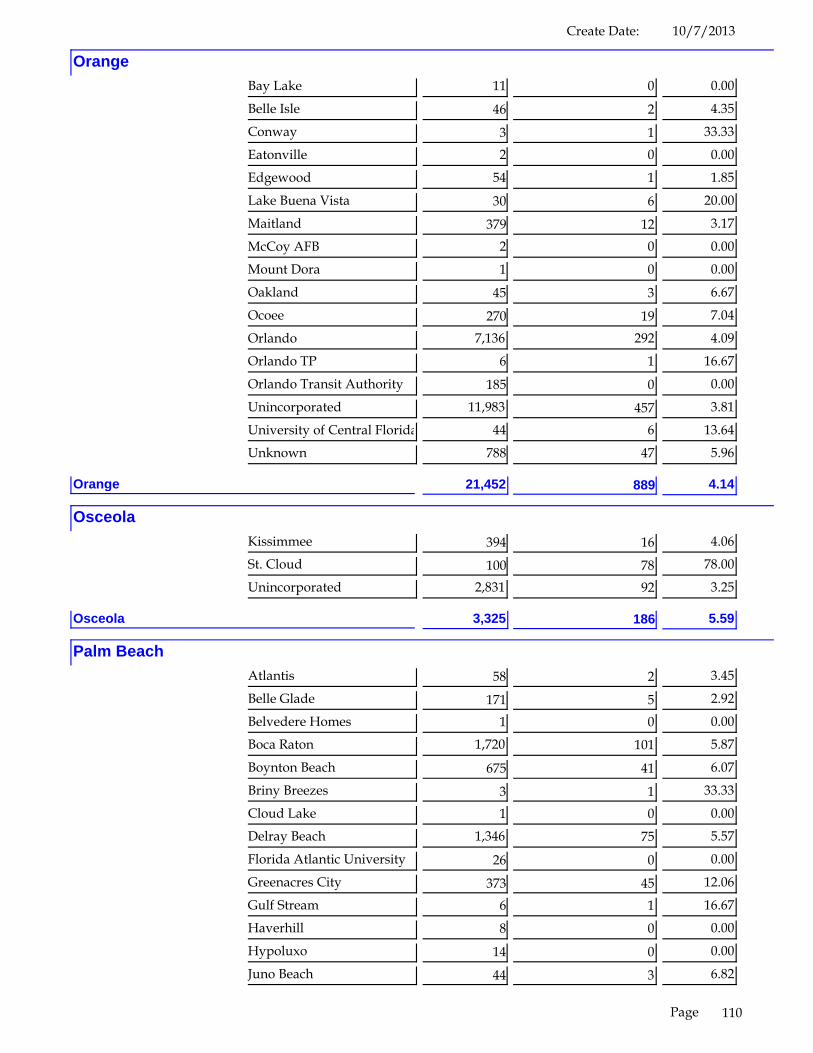
10/7/2013Create Date:
OrangeBay Lake 11 0 0.00
Belle Isle 46 2 4.35
Conway 3 1 33.33
Eatonville 2 0 0.00
Edgewood 54 1 1.85
Lake Buena Vista 30 6 20.00
Maitland 379 12 3.17
McCoy AFB 2 0 0.00
Mount Dora 1 0 0.00
Oakland 45 3 6.67
Ocoee 270 19 7.04
Orlando 7,136 292 4.09
Orlando TP 6 1 16.67
Orlando Transit Authority 185 0 0.00
Unincorporated 11,983 457 3.81
University of Central Florida 44 6 13.64
Unknown 788 47 5.96
21,452 889Orange 4.14
OsceolaKissimmee 394 16 4.06
St. Cloud 100 78 78.00
Unincorporated 2,831 92 3.25
3,325 186Osceola 5.59
Palm BeachAtlantis 58 2 3.45
Belle Glade 171 5 2.92
Belvedere Homes 1 0 0.00
Boca Raton 1,720 101 5.87
Boynton Beach 675 41 6.07
Briny Breezes 3 1 33.33
Cloud Lake 1 0 0.00
Delray Beach 1,346 75 5.57
Florida Atlantic University 26 0 0.00
Greenacres City 373 45 12.06
Gulf Stream 6 1 16.67
Haverhill 8 0 0.00
Hypoluxo 14 0 0.00
Juno Beach 44 3 6.82
110Page
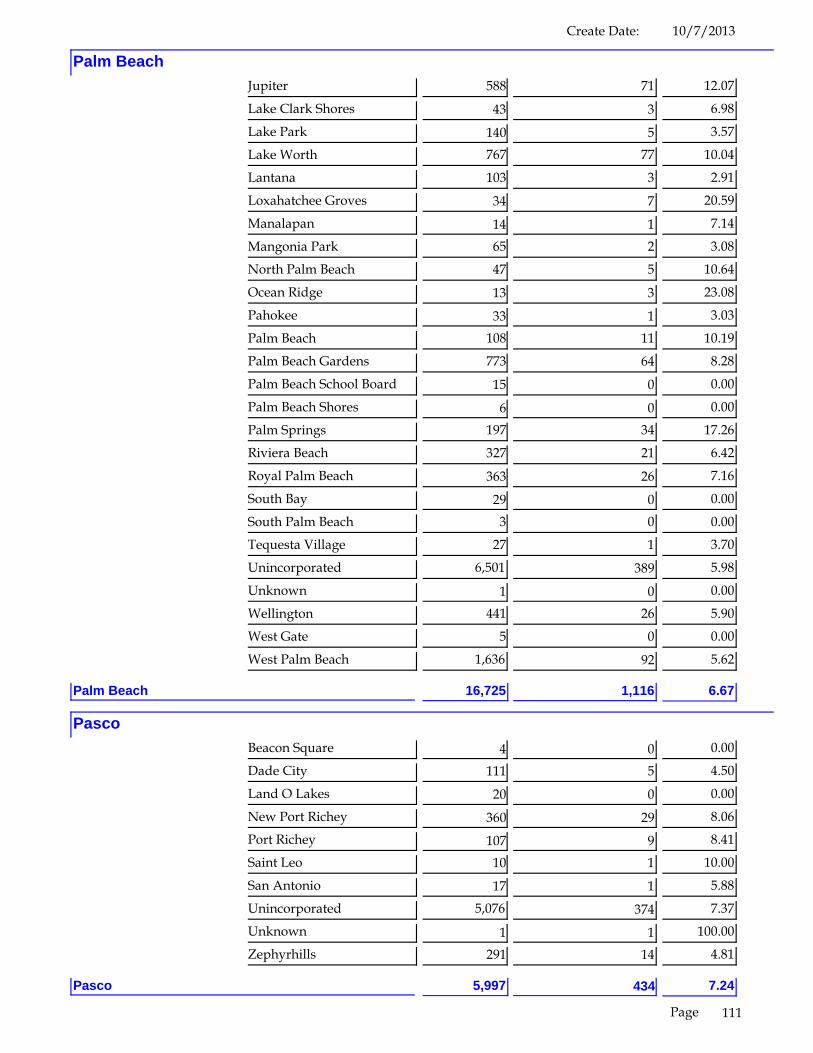
10/7/2013Create Date:
Palm BeachJupiter 588 71 12.07
Lake Clark Shores 43 3 6.98
Lake Park 140 5 3.57
Lake Worth 767 77 10.04
Lantana 103 3 2.91
Loxahatchee Groves 34 7 20.59
Manalapan 14 1 7.14
Mangonia Park 65 2 3.08
North Palm Beach 47 5 10.64
Ocean Ridge 13 3 23.08
Pahokee 33 1 3.03
Palm Beach 108 11 10.19
Palm Beach Gardens 773 64 8.28
Palm Beach School Board 15 0 0.00
Palm Beach Shores 6 0 0.00
Palm Springs 197 34 17.26
Riviera Beach 327 21 6.42
Royal Palm Beach 363 26 7.16
South Bay 29 0 0.00
South Palm Beach 3 0 0.00
Tequesta Village 27 1 3.70
Unincorporated 6,501 389 5.98
Unknown 1 0 0.00
Wellington 441 26 5.90
West Gate 5 0 0.00
West Palm Beach 1,636 92 5.62
16,725 1,116Palm Beach 6.67
PascoBeacon Square 4 0 0.00
Dade City 111 5 4.50
Land O Lakes 20 0 0.00
New Port Richey 360 29 8.06
Port Richey 107 9 8.41
Saint Leo 10 1 10.00
San Antonio 17 1 5.88
Unincorporated 5,076 374 7.37
Unknown 1 1 100.00
Zephyrhills 291 14 4.81
5,997 434Pasco 7.24
111Page
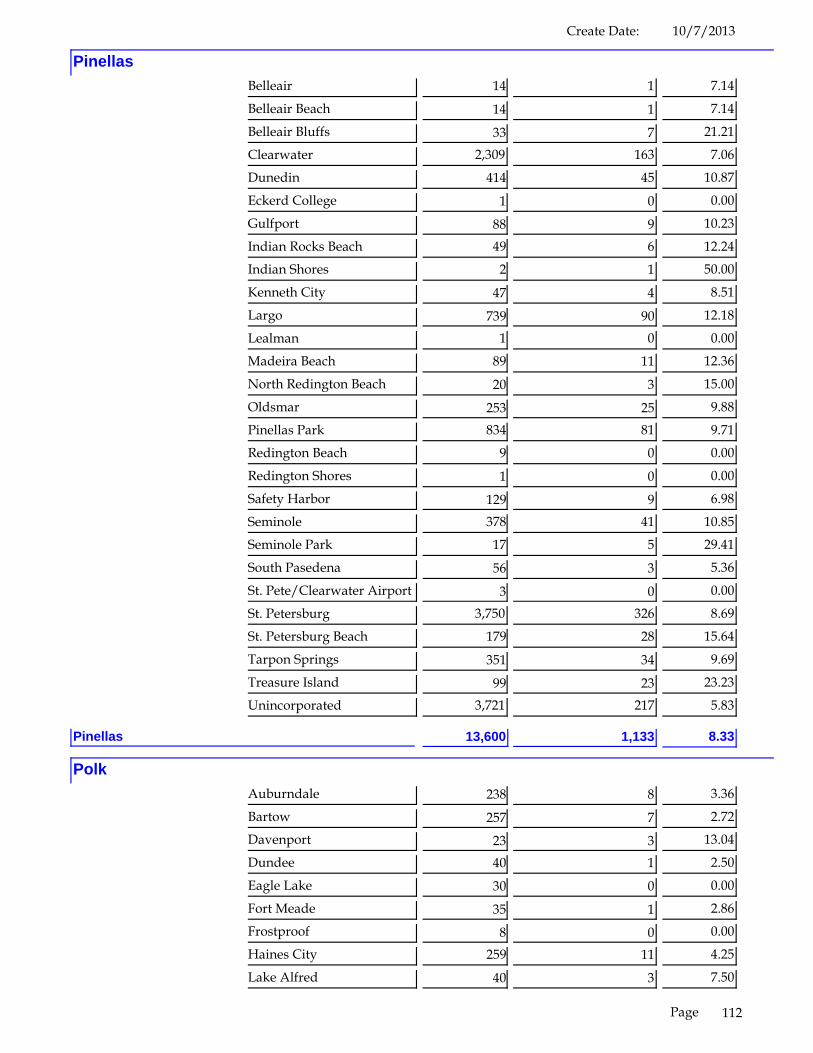
10/7/2013Create Date:
PinellasBelleair 14 1 7.14
Belleair Beach 14 1 7.14
Belleair Bluffs 33 7 21.21
Clearwater 2,309 163 7.06
Dunedin 414 45 10.87
Eckerd College 1 0 0.00
Gulfport 88 9 10.23
Indian Rocks Beach 49 6 12.24
Indian Shores 2 1 50.00
Kenneth City 47 4 8.51
Largo 739 90 12.18
Lealman 1 0 0.00
Madeira Beach 89 11 12.36
North Redington Beach 20 3 15.00
Oldsmar 253 25 9.88
Pinellas Park 834 81 9.71
Redington Beach 9 0 0.00
Redington Shores 1 0 0.00
Safety Harbor 129 9 6.98
Seminole 378 41 10.85
Seminole Park 17 5 29.41
South Pasedena 56 3 5.36
St. Pete/Clearwater Airport 3 0 0.00
St. Petersburg 3,750 326 8.69
St. Petersburg Beach 179 28 15.64
Tarpon Springs 351 34 9.69
Treasure Island 99 23 23.23
Unincorporated 3,721 217 5.83
13,600 1,133Pinellas 8.33
PolkAuburndale 238 8 3.36
Bartow 257 7 2.72
Davenport 23 3 13.04
Dundee 40 1 2.50
Eagle Lake 30 0 0.00
Fort Meade 35 1 2.86
Frostproof 8 0 0.00
Haines City 259 11 4.25
Lake Alfred 40 3 7.50
112Page

10/7/2013Create Date:
PolkLake Hamilton 25 3 12.00
Lake Wales 187 12 6.42
Lakeland 1,357 106 7.81
Mulberry 55 5 9.09
Polk City 15 0 0.00
Unincorporated 3,494 222 6.35
Winter Haven 560 27 4.82
6,623 409Polk 6.18
PutnamCrescent City 23 0 0.00
Interlachen 30 3 10.00
Palatka 312 13 4.17
Unincorporated 498 54 10.84
Unknown 2 0 0.00
Welaka 2 1 50.00
867 71Putnam 8.19
Santa RosaEglin AFB 1 0 0.00
Gulf Breeze 14 0 0.00
Jay 2 0 0.00
Milton 170 4 2.35
Unincorporated 1,478 119 8.05
Whiting Field 1 0 0.00
1,666 123Santa Rosa 7.38
SarasotaEnglewood 42 0 0.00
Gulf Gate Estates 5 0 0.00
Kensington Park 3 1 33.33
Longboat Key 28 2 7.14
Nokomis/Laurel 51 2 3.92
North Port 473 42 8.88
Sarasota 2,142 140 6.54
Sarasota South 1 0 0.00
Sarasota Southeast 2 0 0.00
Sarasota-Manatee Airport 1 0 0.00
Siesta Key 7 2 28.57
Unincorporated 1,284 142 11.06
113Page

10/7/2013Create Date:
SarasotaVenice 381 20 5.25
Venice South 5 0 0.00
4,425 351Sarasota 7.93
SeminoleAltamonte Springs 641 21 3.28
Casselberry 428 42 9.81
Lake Mary 271 18 6.64
Longwood 345 14 4.06
Oviedo 369 26 7.05
Sanford 853 37 4.34
Unincorporated 1,154 83 7.19
Unknown 31 0 0.00
Winter Springs 210 15 7.14
4,302 256Seminole 5.95
St. JohnsFlorida School for Deaf/Blind 3 0 0.00
Hastings 22 2 9.09
Marineland 1 0 0.00
Ponte Vedra 141 19 13.48
St. Augustine 642 71 11.06
St. Augustine Beach 72 19 26.39
Unincorporated 1,508 143 9.48
Unknown 1 0 0.00
2,390 254St. Johns 10.63
St. LucieFort Pierce 775 38 4.90
Fort Pierce NW 1 0 0.00
Port St. Lucie 919 85 9.25
St. Lucie Village 1 1 100.00
Unincorporated 861 77 8.94
Unknown 6 1 16.67
2,563 202St. Lucie 7.88
SumterBushnell 35 5 14.29
Center Hill 3 0 0.00
Coleman 3 2 66.67
114Page

10/7/2013Create Date:
SumterUnincorporated 456 35 7.68
Unknown 1 0 0.00
Webster 3 0 0.00
Wildwood 77 2 2.60
578 44Sumter 7.61
SuwanneeBranford 4 0 0.00
Live Oak 76 2 2.63
Unincorporated 406 48 11.82
486 50Suwannee 10.29
TaylorPerry 60 1 1.67
Steinhatchee 2 2 100.00
Unincorporated 169 28 16.57
Unknown 1 1 100.00
232 32Taylor 13.79
UnionLake Butler 26 2 7.69
Raiford 4 1 25.00
Unincorporated 69 7 10.14
Worthing Springs 5 0 0.00
104 10Union 9.62
VolusiaOrmond Beach 704 49 6.96
Ormond By The Sea 21 6 28.57
Pierson 44 7 15.91
Ponce Inlet 12 1 8.33
Port Orange 587 44 7.50
Seville 8 4 50.00
South Daytona 161 20 12.42
Stetson University 3 1 33.33
Unincorporated 580 41 7.07
Unknown 4,420 351 7.94
6,540 524Volusia 8.01
WakullaCrawfordville 154 27 17.53
115Page

10/7/2013Create Date:
WakullaSopchoppy 1 1 100.00
Unincorporated 111 24 21.62
Wakulla 1 0 0.00
267 52Wakulla 19.48
WaltonDefuniak Springs 135 4 2.96
Freeport 15 1 6.67
Paxton 1 0 0.00
Santa Rosa Beach 31 5 16.13
Unincorporated 727 88 12.10
909 98Walton 10.78
WashingtonCaryville 37 2 5.41
Ebro 2 1 50.00
Unincorporated 209 27 12.92
Vernon 5 1 20.00
253 31Washington 12.25
281,503 17,530Grand Total: 6.23
The information contained herein represents data from the long-form crash report (HSMV 90010S) asfiled by law enforcement agencies in the state of Florida. This information is provided to the public
through a partnership with the Florida Department of Highway Safety and Motor Vehicles and Appriss,Inc., Division of Public Information Management. Please refer all inquiries to [email protected] or call
866-495-4206.
116Page