large truck and bus crash facts 2017 - home | fmcsa...fmcsa analysis division large truck and bus...
TRANSCRIPT
LARGE TRUCK AND BUS CRASH FACTS 2017
Federal Motor Carrier Safety AdministrationAnalysis Division
May 2019

[This page intentionally left blank.]
FMCSA-RRA-18-018
Analysis Division
LARGE TRUCK AND BUS CRASH FACTS
2017
May 2019
Analysis DivisionFederal Motor Carrier Safety Administration
For more information, contact the Analysis Division at (202) 366-4869, or visit our Web sites at www.fmcsa.dot.gov and ai.fmcsa.dot.gov.

[This page intentionally left blank.]
FMCSA Analysis Division Large Truck and Bus Crash Facts 2017
Large Truck and Bus Crash Facts 2017
Page iii
ContentsData Sources.............................................................................................................................1Organization of the Report ......................................................................................................2Trends ........................................................................................................................................3Crashes ...................................................................................................................................45Vehicles ...................................................................................................................................67People ......................................................................................................................................87
Trends Trends Table 1. Large Truck and Bus Fatal Crash Statistics, 1975-2017 ..............................................................4Trends Table 2. Large Truck and Bus Injury Crash Statistics, 1997-2017 .............................................................5Trends Table 3. Large Truck and Bus Property Damage Only (PDO) Crash Statistics, 1997-2017 ....................6Trends Table 4. Large Truck Fatal Crash Statistics, 1975-2017 .............................................................................7Trends Figure 1. Fatal Crashes, Vehicles in Fatal Crashes, and Fatalities in Large Truck Crashes,
1975-2017 ............................................................................................................................................................8Trends Table 5. Passenger Vehicle Fatal Crash Statistics, 1975-2017 ..................................................................9Trends Figure 2. Large Trucks and Passenger Vehicles Involved in Fatal Crashes per 100 Million Vehicle
Miles Traveled by Vehicle Type, 1975-2017 ....................................................................................................10Trends Figure 3. Fatalities in Crashes Involving Large Trucks and Passenger Vehicles per 100 Million
Vehicle Miles Traveled by Vehicle Type, 1975-2017 ....................................................................................... 11Trends Table 6. All Motor Vehicle Fatal Crash Statistics, 1975-2017 ...................................................................12Trends Table 7. Large Truck Injury Crash Statistics, 1997-2017 ..........................................................................13Trends Table 8. Passenger Vehicle Injury Crash Statistics, 1997-2017 ...............................................................14Trends Figure 4. Large Trucks and Passenger Vehicles Involved in Injury Crashes per 100 Million Vehicle
Miles Traveled by Vehicle Type, 1997-2017 ....................................................................................................15Trends Figure 5. Persons Injured in Large Truck and Passenger Vehicle Crashes per 100 Million Vehicle
Miles Traveled by Vehicle Type, 1997-2017 ....................................................................................................16Trends Table 9. All Motor Vehicle Injury Crash Statistics, 1997-2017 ...................................................................17Trends Table 10. Large Truck Property Damage Only (PDO) Crash Statistics, 1997-2017 ...............................18Trends Table 11. Passenger Vehicle Property Damage Only (PDO) Crash Statistics, 1997-2017 ....................19Trends Figure 6. Large Trucks and Passenger Vehicles Involved in Property Damage Only (PDO) Crashes
per 100 Million Vehicle Miles Traveled by Vehicle Type, 1997-2017 .............................................................20Trends Table 12. All Motor Vehicle Property Damage Only (PDO) Crash Statistics, 1997-2017 .......................21Trends Table 13. Vehicle Occupants Killed in Large Truck Crashes by Vehicle Type, 1975-2017.....................22Trends Table 14. Nonmotorists and Vehicle Occupants Killed in Large Truck Crashes, 1975-2017 .................23Trends Table 15. Drivers in Fatal Crashes by Vehicle Type and Blood Alcohol Concentration, 1997-2017 ......24Trends Table 16. Combination Truck Fatal Crash Statistics, 1975-2017 .............................................................25

FMCSA Analysis Division Large Truck and Bus Crash Facts 2017
Large Truck and Bus Crash Facts 2017
Page iv
Trends Table 17. Single-Unit Truck Fatal Crash Statistics, 1975-2017 ............................................................. 26Trends Figure 7. Fatalities in Combination Truck and Single-Unit Truck Crashes per 100 Million Vehicle
Miles Traveled by Vehicle Type, 1975-2017 ................................................................................................. 27Trends Table 18. Combination Truck Injury Crash Statistics, 1997-2017 .......................................................... 28Trends Table 19. Single-Unit Truck Injury Crash Statistics, 1997-2017 ............................................................ 29Trends Figure 8. Persons Injured in Combination Truck and Single-Unit Truck Crashes per 100 Million
Vehicle Miles Traveled by Vehicle Type, 1997-2017 .................................................................................... 30Trends Table 20. Combination Truck Property Damage Only (PDO) Crash Statistics, 1997-2017 ................. 31Trends Table 21. Single-Unit Truck Property Damage Only (PDO) Crash Statistics, 1997-2017 .................... 32Trends Table 22. Bus Fatal Crash Statistics, 1975-2017 ................................................................................... 33Trends Table 23. Bus Injury Crash Statistics, 1997-2017 .................................................................................. 34Trends Table 24. Bus Property Damage Only (PDO) Crash Statistics, 1997-2017 ......................................... 35Trends Table 25. Fatal Crashes Involving Buses by Type of Bus, 1975-2017 .................................................. 36Trends Table 26. Buses in Fatal Crashes by Type of Bus, 1975-2017 ............................................................. 37Trends Table 27. Fatalities in Crashes Involving Buses by Type of Bus, 1975-2017 ....................................... 38Trends Table 28. Bus Occupant Fatalities in Crashes Involving Buses by Type of Bus, 1975-2017............... 39Trends Table 29. Fatalities in Crashes Involving Large Trucks by State, 2007-2017 ....................................... 40Trends Table 30. Fatal Crashes Involving Large Trucks by State, 2007-2017 ................................................. 41Trends Table 31. Large Trucks Involved in Fatal Crashes by State, 2007-2017 .............................................. 42Trends Table 32. Single-Vehicle Fatal Crashes Involving Large Trucks by State, 2007-2017 ......................... 43Trends Table 33. Multiple-Vehicle Fatal Crashes Involving Large Trucks by State, 2007-2017 ...................... 44
CrashesCrashes Table 1. Fatal Crashes Involving Large Trucks by First Harmful Event, 2015-2017 .......................... 46Crashes Table 2. Crashes Involving Large Trucks by First Harmful Event, Number of Vehicles Involved,
and Crash Severity, 2017 .............................................................................................................................. 47Crashes Table 3. Fatal Crashes Involving Large Trucks by Speed Limit, 2015-2017 ...................................... 48Crashes Table 4. Fatal Crashes Involving Large Trucks by Speed Limit and Number of Vehicles
Involved, 2017 ................................................................................................................................................ 48Crashes Table 5. Fatal Crashes Involving Large Trucks by Land Use and Functional System,
2015-2017 ...................................................................................................................................................... 49Crashes Table 6. Fatal Crashes Involving Large Trucks by Land Use, Functional System, and Number of
Vehicles Involved, 2017 ................................................................................................................................. 50Crashes Table 7. Fatal Crashes Involving Large Trucks by Time of Day, 2015-2017 ...................................... 51Crashes Table 8. Crashes Involving Large Trucks by Time of Day and Crash Severity, 2017 ........................ 51Crashes Table 9. Fatal Crashes Involving Large Trucks by Day of Week, 2015-2017 .................................... 52Crashes Table 10. Crashes Involving Large Trucks by Day of Week and Crash Severity, 2017 ..................... 52Crashes Table 11. Fatal Crashes Involving Large Trucks by Trafficway Flow, 2015-2017 .............................. 53Crashes Table 12. Crashes Involving Large Trucks by Trafficway Flow and Crash Severity, 2017 ................ 53Crashes Table 13. Fatal Crashes Involving Large Trucks by Relation to Junction, 2015-2017 ....................... 54
FMCSA Analysis Division Large Truck and Bus Crash Facts 2017
Large Truck and Bus Crash Facts 2017
Page v
Crashes Table 14. Crashes Involving Large Trucks by Relation to Junction and Crash Severity, 2017 ......... 55Crashes Table 15. Fatal Crashes Involving Large Trucks by Relation to Roadway, 2015-2017 ..................... 56Crashes Table 16. Crashes Involving Large Trucks by Relation to Roadway, Number of Vehicles Involved,
and Crash Severity, 2017 .............................................................................................................................. 57Crashes Table 17. Fatal Crashes Involving Large Trucks by Intersection Type, 2015-2017 ........................... 58Crashes Table 18. Crashes Involving Large Trucks by Intersection Type and Crash Severity, 2017 .............. 58Crashes Table 19. Fatal Crashes Involving Large Trucks by Weather Conditions, 2015-2017 ....................... 59Crashes Table 20. Crashes Involving Large Trucks by Weather Conditions and Crash Severity, 2017 ......... 59Crashes Table 21. Fatal Crashes Involving Large Trucks by Road Surface Conditions, 2015-2017 .............. 60Crashes Table 22. Crashes Involving Large Trucks by Road Surface Conditions and Crash
Severity, 2017 ................................................................................................................................................ 60Crashes Table 23. Fatal Crashes Involving Large Trucks by Light Conditions, 2015-2017 ............................. 61Crashes Table 24. Crashes Involving Large Trucks by Light Conditions and Crash Severity, 2017 ............... 61Crashes Table 25. Fatal Crashes by Work Zone, 2015-2017 ............................................................................ 62Crashes Table 26. Crashes by Work Zone and Crash Severity, 2017 .............................................................. 63Crashes Table 27. Fatal Crashes Involving Large Trucks per State Population, 2010 and 2017 .................... 64Crashes Table 28. Fatal Crashes Involving Large Trucks by Number of Vehicles Involved, 2015-2017 ........ 65Crashes Table 29. All Fatal Crashes by Number of Vehicles Involved, 2015-2017 .......................................... 65Crashes Table 30. Fatal Large Truck Crashes by Number of Fatalities, 2015-2017 ........................................ 66Crashes Table 31. All Fatal Crashes by Number of Fatalities, 2015-2017 ........................................................ 66
VehiclesVehicles Table 1. Large Trucks in Fatal Crashes by Vehicle Configuration, 2015-2017 .................................. 68Vehicles Table 2. Large Trucks in Crashes by Vehicle Configuration and Crash Severity, 2017 ..................... 68Vehicles Table 3. Large Trucks in Fatal Crashes by Cargo Body Type, 2015-2017 ......................................... 69Vehicles Table 4. Large Trucks in Crashes by Cargo Body Type and Crash Severity, 2017 ........................... 69Vehicles Table 5. Large Trucks in Fatal Crashes by Gross Vehicle Weight Rating, 2015-2017 ...................... 70Vehicles Table 6. Large Trucks in Crashes by Gross Vehicle Weight Rating and Crash Severity, 2017 ........ 70Vehicles Table 7. Large Trucks in Fatal Crashes by Truck Weight Rating, 2015-2017 .................................... 70Vehicles Table 8. Large Trucks in Fatal Crashes by Hazardous Materials (HM) Cargo, 2015-2017 ............... 71Vehicles Table 9. Large Trucks in Crashes by Hazardous Materials (HM) Cargo and Crash
Severity, 2017 ................................................................................................................................................ 71Vehicles Table 10. Large Trucks in Fatal Crashes by Hazardous Materials (HM) Cargo Type and HM
Released, 2015-2017 .................................................................................................................................... 72Vehicles Table 11. Large Trucks in Crashes by Hazardous Materials (HM) Cargo Type, HM Release, and
Crash Severity, 2017 ..................................................................................................................................... 73Vehicles Table 12. Large Trucks in Fatal Crashes by Initial Point of Impact, 2015-2017 ................................. 74Vehicles Table 13. Large Trucks in Crashes by Initial Point of Impact and Crash Severity, 2017.................... 74Vehicles Table 14. Large Trucks in Fatal Crashes by Most Harmful Event for the Large Truck,
2015-2017 ...................................................................................................................................................... 75
FMCSA Analysis Division Large Truck and Bus Crash Facts 2017
Large Truck and Bus Crash Facts 2017
Page vi
Vehicles Table 15. Large Trucks in Crashes by Most Harmful Event for the Large Truck and Crash Severity, 2017 ................................................................................................................................................ 75
Vehicles Table 16. Large Trucks in Fatal Crashes by Jackknife Occurrence, 2015-2017 ................................ 76Vehicles Table 17. Large Trucks in Crashes by Jackknife Occurrence and Crash Severity, 2017 .................. 76Vehicles Table 18. Large Trucks in Fatal Crashes with Passenger Vehicles by Crash Type, 2015-2017 ....... 76Vehicles Table 19. Large Trucks in Crashes with Passenger Vehicles by Crash Type and Severity, 2017 .... 77Vehicles Table 20. Large Trucks in Fatal Crashes with Passenger Vehicles by Crash Type and
Driver-Related Factors Recorded, 2017 ....................................................................................................... 77Vehicles Table 21. Large Trucks in Fatal Crashes by Vehicle Age, 2015-2017 ................................................ 78Vehicles Table 22. All Vehicles in Fatal Crashes by Vehicle Age, 2015-2017 ................................................... 78Vehicles Table 23. Large Trucks in Fatal Crashes by Issuing Authority and Body Type, 2015-2017 .............. 79Vehicles Table 24. Vehicles in Fatal Large Truck Crashes by Vehicle Type, 2015-2017 ................................. 80Vehicles Table 25. Vehicles in Large Truck Crashes by Vehicle Type and Crash Severity, 2017 .................... 80Vehicles Table 26. Parked and Working Large Truck Fatal Crash Statistics, 2015-2017................................. 81Vehicles Table 27. Large Trucks in Fatal Crashes by Critical Precrash Event, 2015-2017 .............................. 82Vehicles Table 28. Large Trucks in Crashes by Critical Precrash Event and Crash Severity, 2017 ................ 82Vehicles Table 29. Large Trucks in Fatal Crashes by Manner of Collision, 2015-2017 .................................... 83Vehicles Table 30. Large Trucks in Crashes by Manner of Collision and Crash Severity, 2017 ...................... 83Vehicles Table 31. Large Trucks in Fatal Crashes by Vehicle-Related Factors, 2015-2017 ............................ 84Vehicles Table 32. Large Trucks in Fatal Crashes by Number of Vehicles Involved and Vehicle-Related
Factors, 2017 ................................................................................................................................................. 84Vehicles Table 33. Passenger Vehicles in Fatal Crashes by Vehicle-Related Factors, 2015-2017 ................. 85Vehicles Table 34. Passenger Vehicles in Fatal Crashes by Number of Vehicles Involved and
Vehicle-Related Factors, 2017 ...................................................................................................................... 85
PeoplePeople Table 1. Persons Killed in Crashes Involving Large Trucks by Age, 2015-2017 .................................. 88People Table 2. Persons Killed in Crashes Involving Large Trucks by Age and Sex, 2017 ............................. 88People Table 3. Persons Killed in Crashes Involving Passenger Vehicles by Age, 2015-2017 ....................... 89People Table 4. Persons Killed in Crashes Involving Passenger Vehicles by Age and Sex, 2017 .................. 89People Table 5. Persons Injured in Crashes Involving Large Trucks by Age and Sex, 2017 ........................... 90People Table 6. Persons Injured in Crashes Involving Passenger Vehicles by Age and Sex, 2017 ............... 90People Table 7. Drivers of Large Trucks in Fatal Crashes by Age, 2015-2017 ................................................ 91People Table 8. Drivers of Large Trucks in Fatal Crashes by Age and Sex, 2017 ........................................... 91People Table 9. Drivers of Buses in Fatal Crashes by Age, 2015-2017 ............................................................ 92People Table 10. Drivers of Buses in Fatal Crashes by Age and Sex, 2017 .................................................... 92People Table 11. Persons Killed in Crashes Involving Large Trucks by Time of Day, 2015-2017 ................... 93People Table 12. Persons Killed and Injured in Crashes Involving Large Trucks by Time of Day, 2017 ......... 93People Table 13. Persons Killed in Crashes Involving Large Trucks, 2015-2017 ............................................ 94

FMCSA Analysis Division Large Truck and Bus Crash Facts 2017
Large Truck and Bus Crash Facts 2017
Page vii
People Table 14. Persons Killed and Injured in Crashes Involving Large Trucks by Number of Vehicles Involved, 2017 ................................................................................................................................................ 95
People Table 15. Large Truck Occupants Killed by Person Type, 2015-2017 .................................................. 96People Table 16. Large Truck Occupants Killed and Injured by Person Type, 2017 ........................................ 96People Table 17. Vehicles Involved, Persons Involved, and Persons Killed in Fatal Large Truck Crashes,
2017 ................................................................................................................................................................ 96People Table 18. Vehicles Involved, Persons Involved, and Persons Killed in Fatal Bus Crashes, 2017 ....... 97People Table 19. Pedestrians and Bicyclists Killed in Large Truck, Bus, and All Crashes, 2015-2017 ........... 97People Table 20. Drivers of Large Trucks in Fatal Crashes by Restraint Use, 2015-2017 .............................. 98People Table 21. Drivers of Large Trucks in Fatal Crashes by Restraint Use and Ejection from the
Vehicle, 2017 .................................................................................................................................................. 98People Table 22. Large Truck Occupants in Fatal Crashes by Injury Severity and Restraint Use, 2017 ........ 98People Table 23. Drivers of Large Trucks in Fatal Crashes by Commercial Drivers License (CDL) Status,
2015-2017 ...................................................................................................................................................... 99People Table 24. Drivers of Large Trucks in Fatal Crashes by License Compliance, 2015-2017 ................... 99People Table 25. Large Truck Drivers in Fatal Crashes by License Compliance and Commercial Drivers
License (CDL) Status, 2015-2017 .............................................................................................................. 100People Table 26. Large Truck Injury Crash Data by Injury Severity, 2017 ...................................................... 100People Table 27. Drug Test Results for Large Truck Drivers in Fatal Crashes, 2015-2017 ........................... 101People Table 28. Drug Test Results for All Drivers in Fatal Crashes, 2015-2017 ........................................... 101People Table 29. Drivers of Large Trucks in Fatal Crashes by Driver-Related Factors and Violations
Recorded, 2015-2017 .................................................................................................................................. 102People Table 30. Drivers of Large Trucks in Fatal Crashes by Number of Vehicles Involved,
Driver-Related Factors, and Violations Recorded, 2017 ........................................................................... 103People Table 31. Drivers of Large Trucks in Fatal Crashes by Distraction-Related and
Impairment-Related Factors, 2015-2017 .................................................................................................... 104People Table 32. Drivers of Large Trucks in Fatal Crashes by Number of Vehicles Involved and
Distraction-Related and Impairment-Related Factors, 2017 ..................................................................... 105People Table 33. Drivers of Passenger Vehicles in Fatal Crashes by Driver-Related Factors and
Violations Recorded, 2015-2017 ................................................................................................................. 106People Table 34. Drivers of Passenger Vehicles in Fatal Crashes by Number of Vehicles Involved,
Driver-Related Factors, and Violations Recorded, 2017 ........................................................................... 107

[This page intentionally left blank.]
FMCSA Analysis Division Large Truck and Bus Crash Facts 2017 Page 1
IntroductionThis annual edition of Large Truck and Bus Crash Facts contains descriptive statistics about fatal, injury, and property damage only crashes involving large trucks and buses in 2017. Selected crash statistics on passenger vehicles are also presented for comparison purposes.
Data SourcesThe information in this report was compiled by the Analysis Division of the Federal Motor Carrier Safety Administration (FMCSA). The major sources for the data are described below:
Fatality Analysis Reporting System (FARS): FARS, maintained by the National Highway Traffic Safety Administration (NHTSA), is a census of fatal crashes involving motor vehicles traveling on public trafficways. FARS is recognized as the most reliable national crash database, but it contains information only on fatal crashes. A large truck is defined in FARS as a truck with a gross vehicle weight rating (GVWR) greater than 10,000 pounds. A bus is defined in FARS as any motor vehicle designed primarily to transport nine or more persons, including the driver. The 2017 FARS data are considered preliminary for one year. This additional time provides the opportunity for submission of important variable data requiring outside sources, which may lead to changes in the final counts. The updated final counts for 2016 are reflected in this report. Updated final counts for 2017 will be reflected in the 2018 annual report. For more information on FARS, go to https://www.nhtsa.gov/research-data/fatality-analysis-reporting-system-fars.
General Estimates System (GES): GES, also maintained by NHTSA, is a probability-based nationally representative sample of police-reported fatal, injury, and property damage only crashes. The data from GES yield national estimates, calculated using a weighting procedure, but cannot give State-level estimates. Because GES is a sample of motor vehicle crashes, the results generated are estimates rounded to the nearest one thousand; however, associated percentages and rates are based on the unrounded data. The GES definitions of a large truck and a bus are the same as the FARS definitions. In 2017, NHTSA retired GES and replaced it with the Crash Report Sampling System. As a result, comparisons of 2015 (and earlier) GES estimates with newer Crash Report Sampling System estimates should be performed with caution. For more information on GES, go to https://www.nhtsa.gov/research-data/national-automotive-sampling-system-nass.
Crash Report Sampling System (CRSS): NHTSA’s newly established CRSS builds on GES, beginning with data for 2016. Although the two systems are both samples of police-reported crashes involving all types of motor vehicles, CRSS includes a more efficient and flexible sample using updated traffic and demographic information. As a result, comparisons of 2016 (and later) CRSS estimates with older GES estimates should be performed with caution. To learn more about CRSS, visit https://www.nhtsa.gov/national-center-statistics-and-analysis-ncsa/crash-report-sampling-system-crss#crash-report-sampling-system-crss-data-files.
Motor Carrier Management Information System (MCMIS) Crash File: The MCMIS Crash File, maintained by FMCSA, contains data on trucks and buses in crashes that meet the SAFETYNET recommended threshold. A SAFETYNET reportable crash must involve a truck, used for commercial purposes, with a GVWR or gross combination weight rating greater than 10,000 pounds; a commercial bus designed to transport nine or more persons, including the driver; or any vehicle carrying hazardous material that requires placarding, regardless of the vehicle’s weight. The crash must result in at least one fatality, at least one injury involving immediate medical attention away from the crash scene, or at least one vehicle disabled as a result of the crash and transported away from the crash scene. The crashes are reported by the States to FMCSA through the SAFETYNET
FMCSA Analysis Division Large Truck and Bus Crash Facts 2017
Introduction
Page 2
computer software. The MCMIS Crash File is intended to be a census of trucks and buses involved in fatal, injury, and towaway crashes; however, some States do not report all FMCSA-eligible crashes, and some report more than those that are eligible. FMCSA continues to work with the States to improve data quality and reporting of eligible large truck and bus crashes to the MCMIS crash file.
FARS, GES, CRSS, and MCMIS describe the events and details of motor vehicle crashes, but they do not include data on crash causation or fault.
Highway Statistics: Highway Statistics is an annual publication of the Office of Highway Policy Information of the Federal Highway Administration (FHWA). State agencies report the data, ranging from driver licensing to highway finance, and FHWA aggregates them to get national totals. This report takes vehicle miles traveled (VMT) and vehicle registrations from Table VM-1 of Highway Statistics, “Annual Vehicle Distance Traveled in Miles and Related Data.” Readers are warned to be careful of crash rate data based on the VMT numbers from FHWA. Beginning with data for 2007, FHWA implemented an enhanced methodology for estimating registered vehicles and VMT by vehicle type. The new methodology did not change the total VMT, but it did make a large difference in the number of miles traveled attributed to large trucks and buses. As a result, it would be misleading to cite large truck and bus data trends that encompassed both the years before 2007 and the years following. For more information on VMT data, go to http://www.fhwa.dot.gov/policyinformation/statistics/2017.
Organization of the ReportThe report is organized into four chapters: Trends, Crashes, Vehicles, and People. The Trends chapter shows data for 2017 in the context of available historical data for past years. In the other chapters, the 2017 data are shown in different ways, according to what is being counted. Three-year trends in fatal crashes are presented for historical perspective when appropriate. The Crashes chapter counts numbers of crashes; the Vehicles chapter counts vehicles in crashes; and the People chapter counts persons of all types involved in crashes. Four different types of counts are shown:
Crashes: Numbers of crashes involving various vehicle types.
Vehicles in Crashes: Numbers of vehicles involved in crashes. These counts may be larger than the number of crashes (fatal, injury, or property damage only), because more than one vehicle may be involved in a single crash.
People in Crashes: Numbers of people killed or injured in crashes. These counts generally are larger than the number of crashes (fatal or injury), because more than one person may be killed or injured in a single crash. People killed or injured may be occupants of a large truck or bus, occupants of another vehicle, or nonmotorists (pedestrians or pedalcyclists).
Drivers in Crashes: Numbers of vehicle drivers involved in crashes. These counts generally are equal to the numbers of vehicles involved in crashes.
Note: Data RevisionsFHWA implemented an enhanced methodology for estimating registered vehicles and vehicle miles traveled by vehicle type beginning with data from 2007. As a result, involvement rates may differ, and in some cases significantly, from earlier years. Separately, NHTSA retired GES in 2017, replacing it with CRSS. CRSS builds on GES, beginning with data for 2016. Although the two systems are both samples of police-reported crashes involving all types of motor vehicles, CRSS includes a more efficient and flexible sample using updated traffic and demographic information. As a result, comparisons of 2016 (and later) CRSS estimates with older GES estimates should be performed with caution.
FMCSA Analysis Division Large Truck and Bus Crash Facts 2017 Page 3
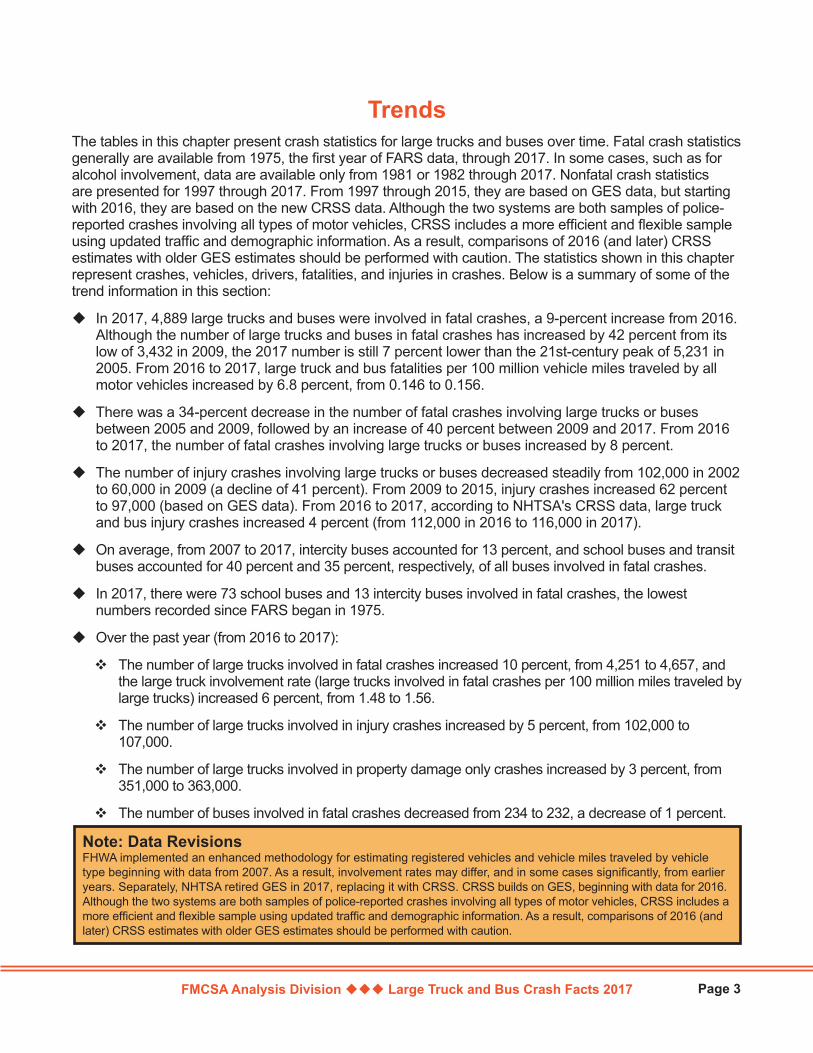
TrendsThe tables in this chapter present crash statistics for large trucks and buses over time. Fatal crash statistics generally are available from 1975, the first year of FARS data, through 2017. In some cases, such as for alcohol involvement, data are available only from 1981 or 1982 through 2017. Nonfatal crash statistics are presented for 1997 through 2017. From 1997 through 2015, they are based on GES data, but starting with 2016, they are based on the new CRSS data. Although the two systems are both samples of police-reported crashes involving all types of motor vehicles, CRSS includes a more efficient and flexible sample using updated traffic and demographic information. As a result, comparisons of 2016 (and later) CRSS estimates with older GES estimates should be performed with caution. The statistics shown in this chapter represent crashes, vehicles, drivers, fatalities, and injuries in crashes. Below is a summary of some of the trend information in this section:
In 2017, 4,889 large trucks and buses were involved in fatal crashes, a 9-percent increase from 2016. Although the number of large trucks and buses in fatal crashes has increased by 42 percent from its low of 3,432 in 2009, the 2017 number is still 7 percent lower than the 21st-century peak of 5,231 in 2005. From 2016 to 2017, large truck and bus fatalities per 100 million vehicle miles traveled by all motor vehicles increased by 6.8 percent, from 0.146 to 0.156.
There was a 34-percent decrease in the number of fatal crashes involving large trucks or buses between 2005 and 2009, followed by an increase of 40 percent between 2009 and 2017. From 2016 to 2017, the number of fatal crashes involving large trucks or buses increased by 8 percent.
The number of injury crashes involving large trucks or buses decreased steadily from 102,000 in 2002 to 60,000 in 2009 (a decline of 41 percent). From 2009 to 2015, injury crashes increased 62 percent to 97,000 (based on GES data). From 2016 to 2017, according to NHTSA's CRSS data, large truck and bus injury crashes increased 4 percent (from 112,000 in 2016 to 116,000 in 2017).
On average, from 2007 to 2017, intercity buses accounted for 13 percent, and school buses and transit buses accounted for 40 percent and 35 percent, respectively, of all buses involved in fatal crashes.
In 2017, there were 73 school buses and 13 intercity buses involved in fatal crashes, the lowest numbers recorded since FARS began in 1975.
Over the past year (from 2016 to 2017):
The number of large trucks involved in fatal crashes increased 10 percent, from 4,251 to 4,657, and the large truck involvement rate (large trucks involved in fatal crashes per 100 million miles traveled by large trucks) increased 6 percent, from 1.48 to 1.56.
The number of large trucks involved in injury crashes increased by 5 percent, from 102,000 to 107,000.
The number of large trucks involved in property damage only crashes increased by 3 percent, from 351,000 to 363,000.
The number of buses involved in fatal crashes decreased from 234 to 232, a decrease of 1 percent.
Note: Data RevisionsFHWA implemented an enhanced methodology for estimating registered vehicles and vehicle miles traveled by vehicle type beginning with data from 2007. As a result, involvement rates may differ, and in some cases significantly, from earlier years. Separately, NHTSA retired GES in 2017, replacing it with CRSS. CRSS builds on GES, beginning with data for 2016. Although the two systems are both samples of police-reported crashes involving all types of motor vehicles, CRSS includes a more efficient and flexible sample using updated traffic and demographic information. As a result, comparisons of 2016 (and later) CRSS estimates with older GES estimates should be performed with caution.
FMCSA Analysis Division Large Truck and Bus Crash Facts 2017
Trends
Page 4
Year
Fatal Crashes Involving
Large Trucks or
Buses
Large Trucks
and Buses
Involved in Fatal Crashes
Large Truck and Bus
Occupant Fatalities
Total Fatalities in Large Truck
and Bus Crashes
Million Vehicle Miles Traveled by
All Motor Vehicles
Rates per 100 Million Vehicle Miles Traveled by All Motor Vehicles
Large Trucks and Buses Registered
Fatal Crashes Involving
Large Trucks or Buses
Large Trucks and Buses Involved in Fatal Crashes
Fatalities in Large Truck
and Bus Crashes
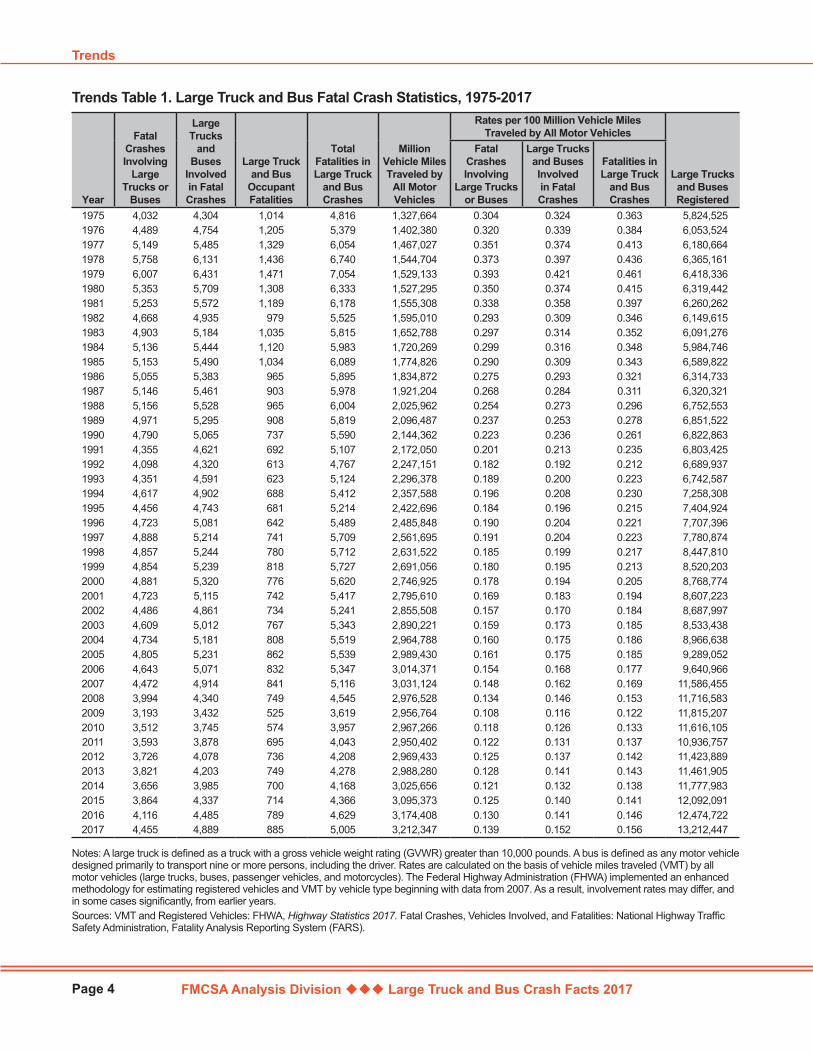
1975 4,032 4,304 1,014 4,816 1,327,664 0.304 0.324 0.363 5,824,5251976 4,489 4,754 1,205 5,379 1,402,380 0.320 0.339 0.384 6,053,5241977 5,149 5,485 1,329 6,054 1,467,027 0.351 0.374 0.413 6,180,6641978 5,758 6,131 1,436 6,740 1,544,704 0.373 0.397 0.436 6,365,1611979 6,007 6,431 1,471 7,054 1,529,133 0.393 0.421 0.461 6,418,3361980 5,353 5,709 1,308 6,333 1,527,295 0.350 0.374 0.415 6,319,4421981 5,253 5,572 1,189 6,178 1,555,308 0.338 0.358 0.397 6,260,2621982 4,668 4,935 979 5,525 1,595,010 0.293 0.309 0.346 6,149,6151983 4,903 5,184 1,035 5,815 1,652,788 0.297 0.314 0.352 6,091,2761984 5,136 5,444 1,120 5,983 1,720,269 0.299 0.316 0.348 5,984,7461985 5,153 5,490 1,034 6,089 1,774,826 0.290 0.309 0.343 6,589,8221986 5,055 5,383 965 5,895 1,834,872 0.275 0.293 0.321 6,314,7331987 5,146 5,461 903 5,978 1,921,204 0.268 0.284 0.311 6,320,3211988 5,156 5,528 965 6,004 2,025,962 0.254 0.273 0.296 6,752,5531989 4,971 5,295 908 5,819 2,096,487 0.237 0.253 0.278 6,851,5221990 4,790 5,065 737 5,590 2,144,362 0.223 0.236 0.261 6,822,8631991 4,355 4,621 692 5,107 2,172,050 0.201 0.213 0.235 6,803,4251992 4,098 4,320 613 4,767 2,247,151 0.182 0.192 0.212 6,689,9371993 4,351 4,591 623 5,124 2,296,378 0.189 0.200 0.223 6,742,5871994 4,617 4,902 688 5,412 2,357,588 0.196 0.208 0.230 7,258,3081995 4,456 4,743 681 5,214 2,422,696 0.184 0.196 0.215 7,404,9241996 4,723 5,081 642 5,489 2,485,848 0.190 0.204 0.221 7,707,3961997 4,888 5,214 741 5,709 2,561,695 0.191 0.204 0.223 7,780,8741998 4,857 5,244 780 5,712 2,631,522 0.185 0.199 0.217 8,447,8101999 4,854 5,239 818 5,727 2,691,056 0.180 0.195 0.213 8,520,2032000 4,881 5,320 776 5,620 2,746,925 0.178 0.194 0.205 8,768,7742001 4,723 5,115 742 5,417 2,795,610 0.169 0.183 0.194 8,607,2232002 4,486 4,861 734 5,241 2,855,508 0.157 0.170 0.184 8,687,9972003 4,609 5,012 767 5,343 2,890,221 0.159 0.173 0.185 8,533,4382004 4,734 5,181 808 5,519 2,964,788 0.160 0.175 0.186 8,966,6382005 4,805 5,231 862 5,539 2,989,430 0.161 0.175 0.185 9,289,0522006 4,643 5,071 832 5,347 3,014,371 0.154 0.168 0.177 9,640,9662007 4,472 4,914 841 5,116 3,031,124 0.148 0.162 0.169 11,586,4552008 3,994 4,340 749 4,545 2,976,528 0.134 0.146 0.153 11,716,5832009 3,193 3,432 525 3,619 2,956,764 0.108 0.116 0.122 11,815,2072010 3,512 3,745 574 3,957 2,967,266 0.118 0.126 0.133 11,616,1052011 3,593 3,878 695 4,043 2,950,402 0.122 0.131 0.137 10,936,7572012 3,726 4,078 736 4,208 2,969,433 0.125 0.137 0.142 11,423,8892013 3,821 4,203 749 4,278 2,988,280 0.128 0.141 0.143 11,461,9052014 3,656 3,985 700 4,168 3,025,656 0.121 0.132 0.138 11,777,9832015 3,864 4,337 714 4,366 3,095,373 0.125 0.140 0.141 12,092,0912016 4,116 4,485 789 4,629 3,174,408 0.130 0.141 0.146 12,474,7222017 4,455 4,889 885 5,005 3,212,347 0.139 0.152 0.156 13,212,447
Trends Table 1. Large Truck and Bus Fatal Crash Statistics, 1975-2017
Notes: A large truck is defined as a truck with a gross vehicle weight rating (GVWR) greater than 10,000 pounds. A bus is defined as any motor vehicle designed primarily to transport nine or more persons, including the driver. Rates are calculated on the basis of vehicle miles traveled (VMT) by all motor vehicles (large trucks, buses, passenger vehicles, and motorcycles). The Federal Highway Administration (FHWA) implemented an enhanced methodology for estimating registered vehicles and VMT by vehicle type beginning with data from 2007. As a result, involvement rates may differ, and in some cases significantly, from earlier years.Sources: VMT and Registered Vehicles: FHWA, Highway Statistics 2017. Fatal Crashes, Vehicles Involved, and Fatalities: National Highway Traffic Safety Administration, Fatality Analysis Reporting System (FARS).

FMCSA Analysis Division Large Truck and Bus Crash Facts 2017
Large Truck and Bus Crash Facts 2017
Page 5
Year
Injury Crashes Involving
Large Trucks or Buses
Large Trucks and Buses Involved in
Injury Crashes
Persons Injured in
Large Truck and Bus Crashes
Million Vehicle Miles Traveled by All Motor
Vehicles
Rates per 100 Million Vehicle Miles Traveled by All Motor Vehicles
Large Trucks and Buses Registered
Injury Crashes Involving
Large Trucks or Buses
Large Trucks and Buses Involved in Injury Crashes
Persons Injured in
Large Truck and Bus Crashes
1997 104,000 108,000 157,000 2,561,695 4.06 4.22 6.12 7,780,8741998 98,000 101,000 156,000 2,631,522 3.71 3.85 5.91 8,447,8101999 109,000 115,000 176,000 2,691,056 4.04 4.28 6.53 8,520,2032000 108,000 114,000 166,000 2,746,925 3.94 4.14 6.04 8,768,7742001 96,000 101,000 153,000 2,795,610 3.45 3.63 5.49 8,607,2232002 102,000 107,000 158,000 2,855,508 3.56 3.74 5.52 8,687,9972003 97,000 103,000 150,000 2,890,221 3.37 3.55 5.21 8,533,4382004 95,000 100,000 145,000 2,964,788 3.22 3.36 4.88 8,966,6382005 89,000 95,000 136,000 2,989,430 2.98 3.17 4.56 9,289,0522006 87,000 91,000 126,000 3,014,371 2.88 3.02 4.17 9,640,9662007 82,000 86,000 124,000 3,031,124 2.72 2.85 4.09 11,586,4552008 74,000 77,000 113,000 2,976,528 2.50 2.59 3.81 11,716,5832009 60,000 63,000 93,000 2,956,764 2.03 2.14 3.15 11,815,2072010 67,000 70,000 106,000 2,967,266 2.25 2.35 3.58 11,616,1052011 73,000 76,000 112,000 2,950,402 2.49 2.58 3.78 10,936,7572012 85,000 89,000 126,000 2,969,433 2.85 3.00 4.25 11,423,8892013 86,000 91,000 133,000 2,988,280 2.89 3.04 4.44 11,461,9052014 93,000 100,000 132,000 3,025,656 3.06 3.29 4.36 11,777,9832015 97,000 102,000 138,000 3,095,373 3.12 3.30 4.47 12,092,091
2016* 112,000 119,000 168,000 3,174,408 3.53 3.74 5.31 12,474,722 2017* 116,000 121,000 170,000 3,212,347 3.60 3.78 5.30 13,212,447
Trends Table 2. Large Truck and Bus Injury Crash Statistics, 1997-2017
*Beginning with data for 2016, the National Highway Traffic Safety Administration (NHTSA) replaced the General Estimates System (GES) with the Crash Report Sampling System (CRSS). Comparisons of 2016 (and later) CRSS estimates with older GES estimates should be performed with caution. Notes: “Persons Injured” includes all nonfatally injured persons in injury and fatal crashes. A large truck is defined as a truck with a gross vehicle weight rating (GVWR) greater than 10,000 pounds. A bus is defined as any motor vehicle designed primarily to transport nine or more persons, including the driver. The Federal Highway Administration (FHWA) implemented an enhanced methodology for estimating registered vehicles and vehicle miles traveled (VMT) by vehicle type beginning with data from 2007. As a result, involvement rates may differ, and in some cases significantly, from earlier years. Rates are calculated on the basis of VMT by all motor vehicles (large trucks, buses, passenger vehicles, and motorcycles) and are based on unrounded GES and CRSS data.Sources: VMT and Registered Vehicles: FHWA, Highway Statistics 2017. Injury Crashes, Vehicles Involved, and Persons Injured: NHTSA, GES (1997-2015) and CRSS (2016-2017).
FMCSA Analysis Division Large Truck and Bus Crash Facts 2017
Trends
Page 6
Year
PDO Crashes Involving Large Trucks or Buses
Large Trucks and Buses Involved in
PDO Crashes
Million Vehicle Miles Traveled by All Motor Vehicles
Rates per 100 Million Vehicle Miles Traveled by All Motor Vehicles
Large Trucks and Buses Registered
PDO Crashes Involving Large Trucks or Buses
Large Trucks and Buses Involved in
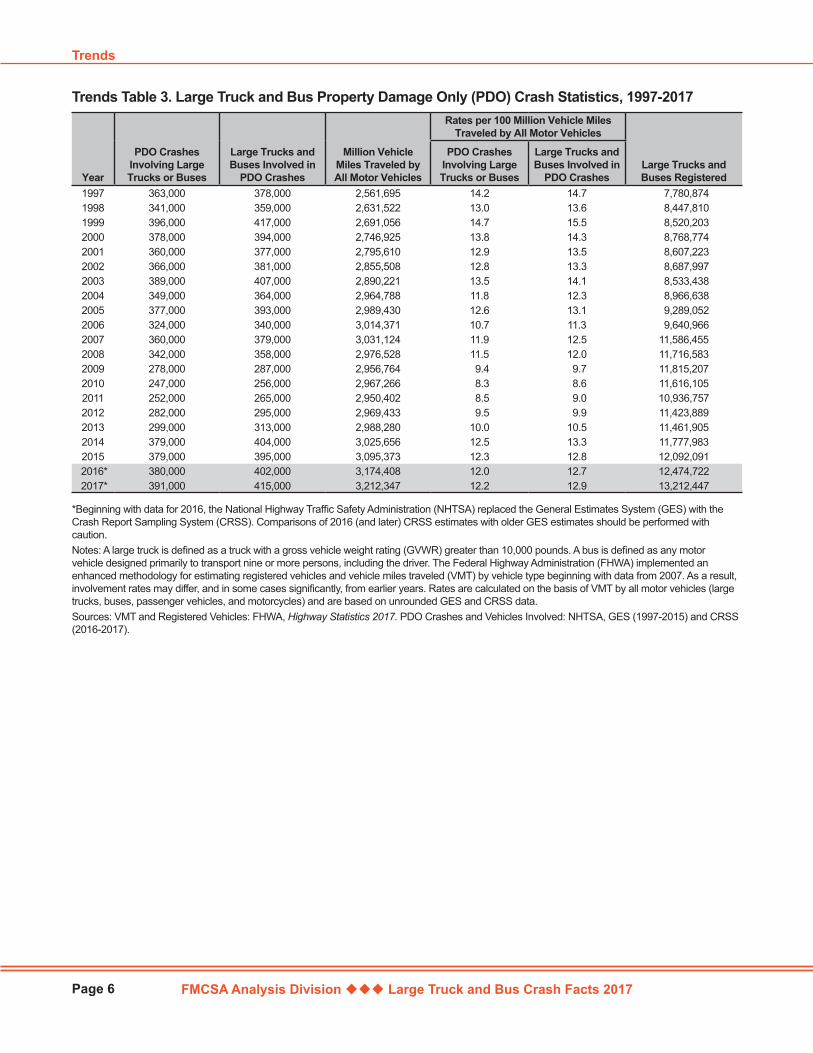
PDO Crashes1997 363,000 378,000 2,561,695 14.2 14.7 7,780,8741998 341,000 359,000 2,631,522 13.0 13.6 8,447,8101999 396,000 417,000 2,691,056 14.7 15.5 8,520,2032000 378,000 394,000 2,746,925 13.8 14.3 8,768,7742001 360,000 377,000 2,795,610 12.9 13.5 8,607,2232002 366,000 381,000 2,855,508 12.8 13.3 8,687,9972003 389,000 407,000 2,890,221 13.5 14.1 8,533,4382004 349,000 364,000 2,964,788 11.8 12.3 8,966,6382005 377,000 393,000 2,989,430 12.6 13.1 9,289,0522006 324,000 340,000 3,014,371 10.7 11.3 9,640,9662007 360,000 379,000 3,031,124 11.9 12.5 11,586,4552008 342,000 358,000 2,976,528 11.5 12.0 11,716,5832009 278,000 287,000 2,956,764 9.4 9.7 11,815,2072010 247,000 256,000 2,967,266 8.3 8.6 11,616,1052011 252,000 265,000 2,950,402 8.5 9.0 10,936,7572012 282,000 295,000 2,969,433 9.5 9.9 11,423,8892013 299,000 313,000 2,988,280 10.0 10.5 11,461,9052014 379,000 404,000 3,025,656 12.5 13.3 11,777,9832015 379,000 395,000 3,095,373 12.3 12.8 12,092,091
2016* 380,000 402,000 3,174,408 12.0 12.7 12,474,722 2017* 391,000 415,000 3,212,347 12.2 12.9 13,212,447
Trends Table 3. Large Truck and Bus Property Damage Only (PDO) Crash Statistics, 1997-2017
*Beginning with data for 2016, the National Highway Traffic Safety Administration (NHTSA) replaced the General Estimates System (GES) with the Crash Report Sampling System (CRSS). Comparisons of 2016 (and later) CRSS estimates with older GES estimates should be performed with caution. Notes: A large truck is defined as a truck with a gross vehicle weight rating (GVWR) greater than 10,000 pounds. A bus is defined as any motor vehicle designed primarily to transport nine or more persons, including the driver. The Federal Highway Administration (FHWA) implemented an enhanced methodology for estimating registered vehicles and vehicle miles traveled (VMT) by vehicle type beginning with data from 2007. As a result, involvement rates may differ, and in some cases significantly, from earlier years. Rates are calculated on the basis of VMT by all motor vehicles (large trucks, buses, passenger vehicles, and motorcycles) and are based on unrounded GES and CRSS data.Sources: VMT and Registered Vehicles: FHWA, Highway Statistics 2017. PDO Crashes and Vehicles Involved: NHTSA, GES (1997-2015) and CRSS (2016-2017).

FMCSA Analysis Division Large Truck and Bus Crash Facts 2017
Large Truck and Bus Crash Facts 2017
Page 7
Year
Fatal Crashes Involving
Large Trucks
Large Trucks
Involved in Fatal Crashes
Large Truck Occupant Fatalities
Total Fatalities in Large Truck
Crashes
Million Vehicle Miles Traveled by
Large Trucks
Rates per 100 Million Vehicle Miles Traveled by Large Trucks
Large Trucks Registered
Fatal Crashes Involving
Large Trucks
Large Trucks Involved in Fatal Crashes
Fatalities in Large Truck
Crashes1975 3,722 3,977 961 4,483 81,330 4.58 4.89 5.51 5,362,3691976 4,184 4,435 1,132 5,008 86,070 4.86 5.15 5.82 5,575,1851977 4,843 5,164 1,287 5,723 95,021 5.10 5.43 6.02 5,689,9031978 5,405 5,759 1,395 6,356 105,739 5.11 5.45 6.01 5,859,8071979 5,684 6,084 1,432 6,702 109,004 5.21 5.58 6.15 5,891,5711980 5,042 5,379 1,262 5,971 108,491 4.65 4.96 5.50 5,790,6531981 4,928 5,230 1,133 5,806 108,702 4.53 4.81 5.34 5,716,2781982 4,396 4,646 944 5,229 111,423 3.95 4.17 4.69 5,590,4151983 4,615 4,877 982 5,491 116,132 3.97 4.20 4.73 5,508,3921984 4,831 5,124 1,074 5,640 121,796 3.97 4.21 4.63 5,401,0751985 4,841 5,153 977 5,734 123,504 3.92 4.17 4.64 5,996,3371986 4,785 5,097 926 5,579 126,675 3.78 4.02 4.40 5,720,8801987 4,813 5,108 852 5,598 133,517 3.60 3.83 4.19 5,718,2661988 4,885 5,241 911 5,679 137,985 3.54 3.80 4.12 6,136,8841989 4,674 4,984 858 5,490 142,749 3.27 3.49 3.85 6,226,4821990 4,518 4,776 705 5,272 146,242 3.09 3.27 3.60 6,195,8761991 4,097 4,347 661 4,821 149,543 2.74 2.91 3.22 6,172,1461992 3,825 4,035 585 4,462 153,384 2.49 2.63 2.91 6,045,2051993 4,101 4,328 605 4,856 159,888 2.56 2.71 3.04 6,088,1551994 4,373 4,644 670 5,144 170,216 2.57 2.73 3.02 6,587,8851995 4,194 4,472 648 4,918 178,156 2.35 2.51 2.76 6,719,4211996 4,413 4,755 621 5,142 182,971 2.41 2.60 2.81 7,012,6151997 4,614 4,917 723 5,398 191,477 2.41 2.57 2.82 7,083,3261998 4,579 4,955 742 5,395 196,380 2.33 2.52 2.75 7,732,2701999 4,560 4,920 759 5,380 202,688 2.25 2.43 2.65 7,791,4262000 4,573 4,995 754 5,282 205,520 2.23 2.43 2.57 8,022,6492001 4,451 4,823 708 5,111 208,928 2.13 2.31 2.45 7,857,6752002 4,224 4,587 689 4,939 214,603 1.97 2.14 2.30 7,927,2802003 4,335 4,721 726 5,036 217,876 1.99 2.17 2.31 7,756,8882004 4,478 4,902 766 5,235 220,811 2.03 2.22 2.37 8,171,3642005 4,551 4,951 804 5,240 222,523 2.05 2.22 2.35 8,481,9992006 4,350 4,766 805 5,027 222,513 1.95 2.14 2.26 8,819,0072007 4,204 4,633 805 4,822 304,178 1.38 1.52 1.59 10,752,0192008 3,754 4,089 682 4,245 310,680 1.21 1.32 1.37 10,873,2752009 2,983 3,211 499 3,380 288,306 1.03 1.11 1.17 10,973,2142010 3,271 3,494 530 3,686 286,527 1.14 1.22 1.29 10,770,0542011 3,365 3,633 640 3,781 267,594 1.26 1.36 1.41 10,270,6932012 3,486 3,825 697 3,944 269,207 1.29 1.42 1.47 10,659,3802013 3,554 3,921 695 3,981 275,017 1.29 1.43 1.45 10,597,3562014 3,429 3,749 656 3,908 279,132 1.23 1.34 1.40 10,905,9562015 3,622 4,074 665 4,094 279,844 1.29 1.46 1.46 11,203,1842016 3,896 4,251 725 4,369 287,895 1.35 1.48 1.52 11,498,5612017 4,237 4,657 841 4,761 297,593 1.42 1.56 1.60 12,229,216
Trends Table 4. Large Truck Fatal Crash Statistics, 1975-2017
Notes: A large truck is defined as a truck with a gross vehicle weight rating (GVWR) greater than 10,000 pounds. The Federal Highway Administration (FHWA) implemented an enhanced methodology for estimating registered vehicles and vehicle miles traveled (VMT) by vehicle type beginning with data from 2007. As a result, involvement rates may differ, and in some cases significantly, from earlier years.Sources: VMT and Registered Vehicles: FHWA, Highway Statistics 2017. Fatal Crashes, Vehicles Involved, and Fatalities: National Highway Traffic Safety Administration, Fatality Analysis Reporting System (FARS).
FMCSA Analysis Division Large Truck and Bus Crash Facts 2017
Trends
Page 8
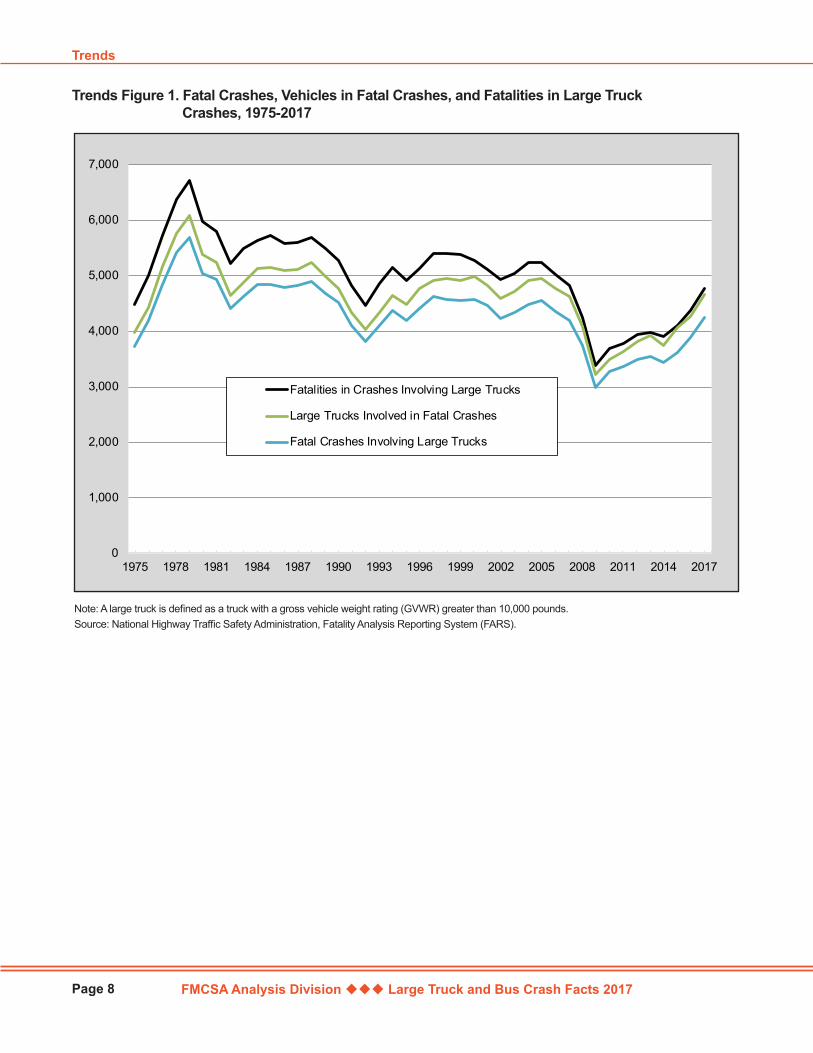
Trends Figure 1. Fatal Crashes, Vehicles in Fatal Crashes, and Fatalities in Large Truck Crashes, 1975-2017
Note: A large truck is defined as a truck with a gross vehicle weight rating (GVWR) greater than 10,000 pounds.Source: National Highway Traffic Safety Administration, Fatality Analysis Reporting System (FARS).
0
1,000
2,000
3,000
4,000
5,000
6,000
7,000
1975 1978 1981 1984 1987 1990 1993 1996 1999 2002 2005 2008 2011 2014 2017
Fatalities in Crashes Involving Large Trucks
Large Trucks Involved in Fatal Crashes
Fatal Crashes Involving Large Trucks
FMCSA Analysis Division Large Truck and Bus Crash Facts 2017
Large Truck and Bus Crash Facts 2017
Page 9
Year
Fatal Crashes Involving
Passenger Vehicles
Passenger Vehicles Involved in Fatal Crashes
Passenger Vehicle
Occupant Fatalities
Total Fatalities in Passenger
Vehicle Crashes
Million Vehicle Miles Traveled by Passenger Vehicles
Rates per 100 Million Vehicle Miles Traveled by Passenger Vehicles
Passenger Vehicles
Registered
Fatal Crashes Involving
Passenger Vehicles
Passenger Vehicles Involved in Fatal Crashes
Fatalities in Passenger
Vehicle Crashes
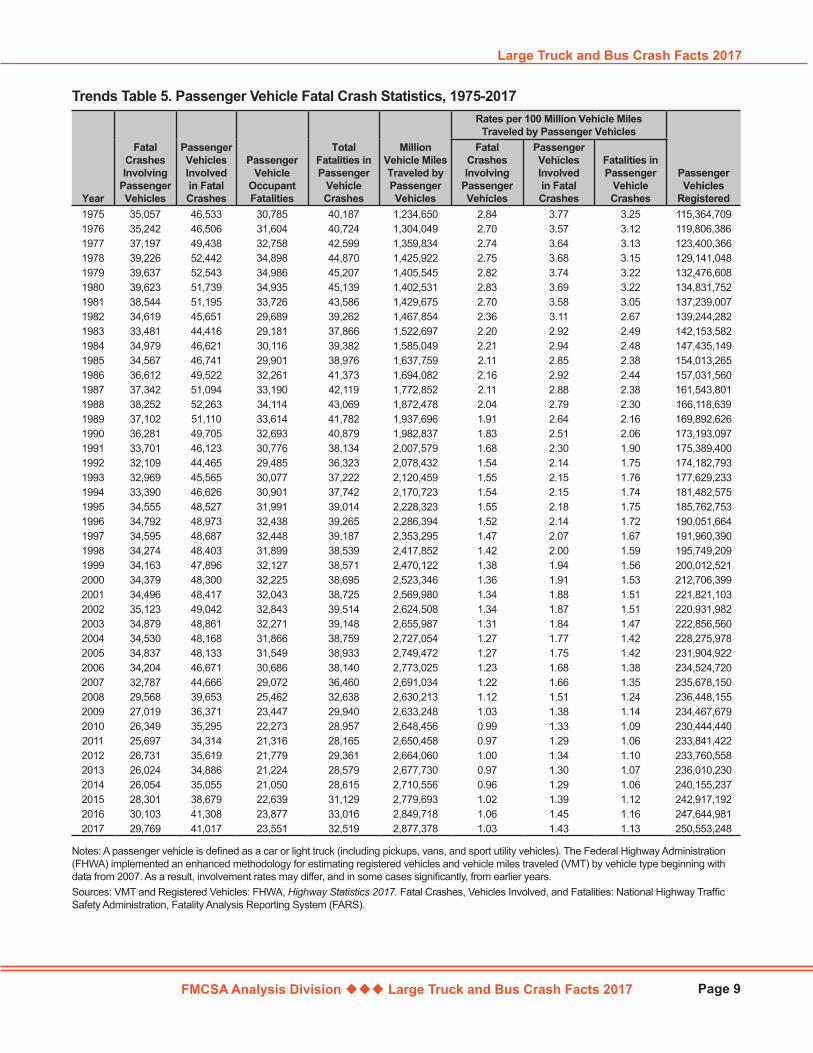
1975 35,057 46,533 30,785 40,187 1,234,650 2.84 3.77 3.25 115,364,7091976 35,242 46,506 31,604 40,724 1,304,049 2.70 3.57 3.12 119,806,3861977 37,197 49,438 32,758 42,599 1,359,834 2.74 3.64 3.13 123,400,3661978 39,226 52,442 34,898 44,870 1,425,922 2.75 3.68 3.15 129,141,0481979 39,637 52,543 34,986 45,207 1,405,545 2.82 3.74 3.22 132,476,6081980 39,623 51,739 34,935 45,139 1,402,531 2.83 3.69 3.22 134,831,7521981 38,544 51,195 33,726 43,586 1,429,675 2.70 3.58 3.05 137,239,0071982 34,619 45,651 29,689 39,262 1,467,854 2.36 3.11 2.67 139,244,2821983 33,481 44,416 29,181 37,866 1,522,697 2.20 2.92 2.49 142,153,5821984 34,979 46,621 30,116 39,382 1,585,049 2.21 2.94 2.48 147,435,1491985 34,567 46,741 29,901 38,976 1,637,759 2.11 2.85 2.38 154,013,2651986 36,612 49,522 32,261 41,373 1,694,082 2.16 2.92 2.44 157,031,5601987 37,342 51,094 33,190 42,119 1,772,852 2.11 2.88 2.38 161,543,8011988 38,252 52,263 34,114 43,069 1,872,478 2.04 2.79 2.30 166,118,6391989 37,102 51,110 33,614 41,782 1,937,696 1.91 2.64 2.16 169,892,6261990 36,281 49,705 32,693 40,879 1,982,837 1.83 2.51 2.06 173,193,0971991 33,701 46,123 30,776 38,134 2,007,579 1.68 2.30 1.90 175,389,4001992 32,109 44,465 29,485 36,323 2,078,432 1.54 2.14 1.75 174,182,7931993 32,969 45,565 30,077 37,222 2,120,459 1.55 2.15 1.76 177,629,2331994 33,390 46,626 30,901 37,742 2,170,723 1.54 2.15 1.74 181,482,5751995 34,555 48,527 31,991 39,014 2,228,323 1.55 2.18 1.75 185,762,7531996 34,792 48,973 32,438 39,265 2,286,394 1.52 2.14 1.72 190,051,6641997 34,595 48,687 32,448 39,187 2,353,295 1.47 2.07 1.67 191,960,3901998 34,274 48,403 31,899 38,539 2,417,852 1.42 2.00 1.59 195,749,2091999 34,163 47,896 32,127 38,571 2,470,122 1.38 1.94 1.56 200,012,5212000 34,379 48,300 32,225 38,695 2,523,346 1.36 1.91 1.53 212,706,3992001 34,496 48,417 32,043 38,725 2,569,980 1.34 1.88 1.51 221,821,1032002 35,123 49,042 32,843 39,514 2,624,508 1.34 1.87 1.51 220,931,9822003 34,879 48,861 32,271 39,148 2,655,987 1.31 1.84 1.47 222,856,5602004 34,530 48,168 31,866 38,759 2,727,054 1.27 1.77 1.42 228,275,9782005 34,837 48,133 31,549 38,933 2,749,472 1.27 1.75 1.42 231,904,9222006 34,204 46,671 30,686 38,140 2,773,025 1.23 1.68 1.38 234,524,7202007 32,787 44,666 29,072 36,460 2,691,034 1.22 1.66 1.35 235,678,1502008 29,568 39,653 25,462 32,638 2,630,213 1.12 1.51 1.24 236,448,1552009 27,019 36,371 23,447 29,940 2,633,248 1.03 1.38 1.14 234,467,6792010 26,349 35,295 22,273 28,957 2,648,456 0.99 1.33 1.09 230,444,4402011 25,697 34,314 21,316 28,165 2,650,458 0.97 1.29 1.06 233,841,4222012 26,731 35,619 21,779 29,361 2,664,060 1.00 1.34 1.10 233,760,5582013 26,024 34,886 21,224 28,579 2,677,730 0.97 1.30 1.07 236,010,2302014 26,054 35,055 21,050 28,615 2,710,556 0.96 1.29 1.06 240,155,2372015 28,301 38,679 22,639 31,129 2,779,693 1.02 1.39 1.12 242,917,1922016 30,103 41,308 23,877 33,016 2,849,718 1.06 1.45 1.16 247,644,9812017 29,769 41,017 23,551 32,519 2,877,378 1.03 1.43 1.13 250,553,248
Trends Table 5. Passenger Vehicle Fatal Crash Statistics, 1975-2017
Notes: A passenger vehicle is defined as a car or light truck (including pickups, vans, and sport utility vehicles). The Federal Highway Administration (FHWA) implemented an enhanced methodology for estimating registered vehicles and vehicle miles traveled (VMT) by vehicle type beginning with data from 2007. As a result, involvement rates may differ, and in some cases significantly, from earlier years. Sources: VMT and Registered Vehicles: FHWA, Highway Statistics 2017. Fatal Crashes, Vehicles Involved, and Fatalities: National Highway Traffic Safety Administration, Fatality Analysis Reporting System (FARS).
FMCSA Analysis Division Large Truck and Bus Crash Facts 2017
Trends
Page 10
0
1
2
3
4
5
6
1975 1978 1981 1984 1987 1990 1993 1996 1999 2002 2005 2008 2011 2014 2017
Large Trucks Passenger Vehicles
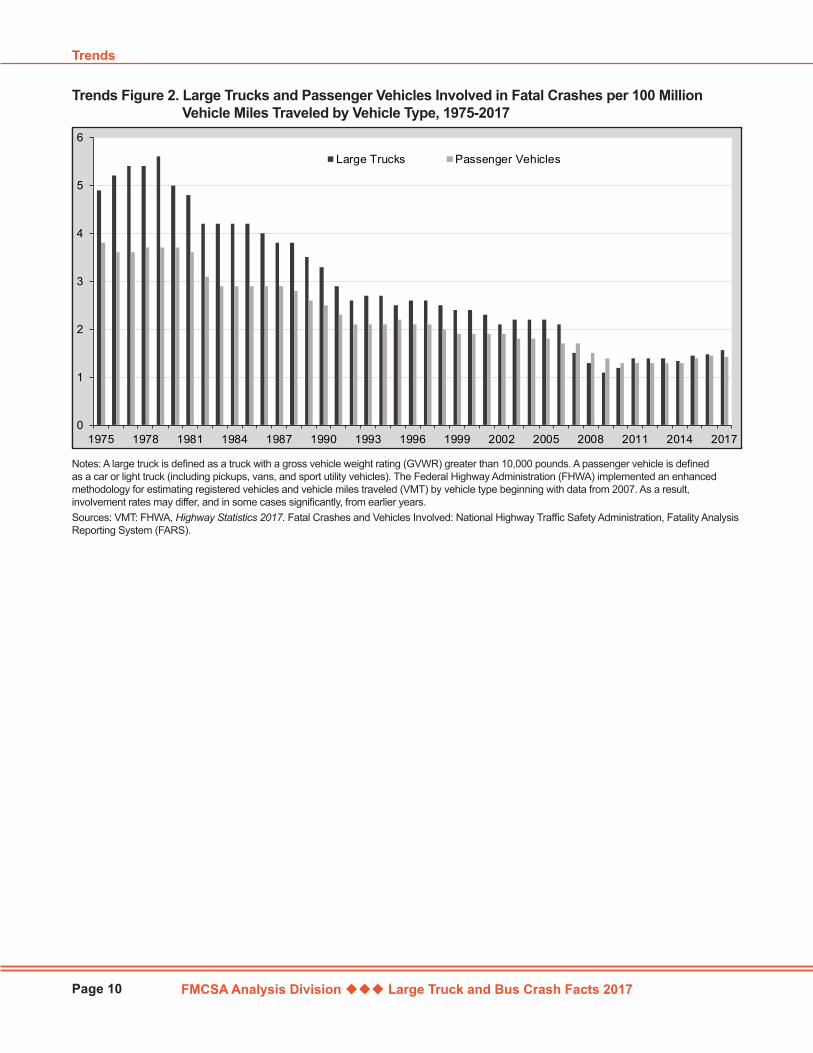
Trends Figure 2. Large Trucks and Passenger Vehicles Involved in Fatal Crashes per 100 Million Vehicle Miles Traveled by Vehicle Type, 1975-2017
Notes: A large truck is defined as a truck with a gross vehicle weight rating (GVWR) greater than 10,000 pounds. A passenger vehicle is defined as a car or light truck (including pickups, vans, and sport utility vehicles). The Federal Highway Administration (FHWA) implemented an enhanced methodology for estimating registered vehicles and vehicle miles traveled (VMT) by vehicle type beginning with data from 2007. As a result, involvement rates may differ, and in some cases significantly, from earlier years.Sources: VMT: FHWA, Highway Statistics 2017. Fatal Crashes and Vehicles Involved: National Highway Traffic Safety Administration, Fatality Analysis Reporting System (FARS).
FMCSA Analysis Division Large Truck and Bus Crash Facts 2017
Large Truck and Bus Crash Facts 2017
Page 11
0
1
2
3
4
5
6
7
1975 1978 1981 1984 1987 1990 1993 1996 1999 2002 2005 2008 2011 2014 2017
Large Trucks Passenger Vehicles
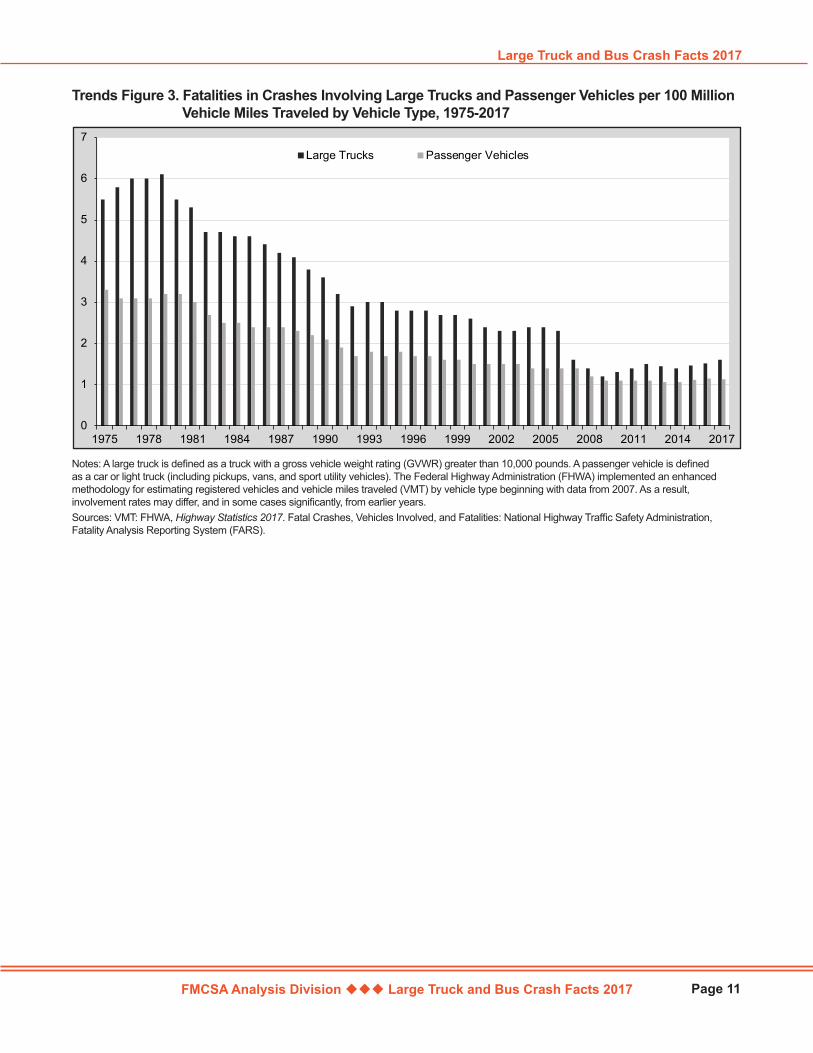
Trends Figure 3. Fatalities in Crashes Involving Large Trucks and Passenger Vehicles per 100 Million Vehicle Miles Traveled by Vehicle Type, 1975-2017
Notes: A large truck is defined as a truck with a gross vehicle weight rating (GVWR) greater than 10,000 pounds. A passenger vehicle is defined as a car or light truck (including pickups, vans, and sport utility vehicles). The Federal Highway Administration (FHWA) implemented an enhanced methodology for estimating registered vehicles and vehicle miles traveled (VMT) by vehicle type beginning with data from 2007. As a result, involvement rates may differ, and in some cases significantly, from earlier years.Sources: VMT: FHWA, Highway Statistics 2017. Fatal Crashes, Vehicles Involved, and Fatalities: National Highway Traffic Safety Administration, Fatality Analysis Reporting System (FARS).
FMCSA Analysis Division Large Truck and Bus Crash Facts 2017
Trends
Page 12
YearAll Fatal Crashes
Vehicles Involved
in All Fatal Crashes
Vehicle Occupant
Fatalities in All Crashes
Total Fatalities in All Crashes
Million Vehicle Miles Traveled by
All Motor Vehicles
Rates per 100 Million Vehicle Miles Traveled by All Motor Vehicles
Motor Vehicles
RegisteredAll Fatal Crashes
Vehicles Involved
in All Fatal Crashes
Fatalities in All Crashes
1975 39,161 55,534 35,925 44,525 1,327,664 2.95 4.18 3.35 126,153,3041976 39,747 56,084 37,102 45,523 1,402,380 2.83 4.00 3.25 130,793,2421977 42,211 60,516 39,150 47,878 1,467,027 2.88 4.13 3.26 134,514,2861978 44,433 64,144 41,533 50,331 1,544,704 2.88 4.15 3.26 140,374,0641979 45,223 64,762 41,930 51,093 1,529,133 2.96 4.24 3.34 144,317,0761980 45,284 63,485 41,927 51,091 1,527,295 2.96 4.16 3.35 146,845,1341981 44,000 62,699 40,424 49,301 1,555,308 2.83 4.03 3.17 149,330,3111982 39,092 56,455 35,646 43,945 1,595,010 2.45 3.54 2.76 151,147,7551983 37,976 55,106 34,843 42,589 1,652,788 2.30 3.33 2.58 153,829,9701984 39,631 57,972 36,284 44,257 1,720,269 2.30 3.37 2.57 158,899,7171985 39,196 58,271 36,043 43,825 1,774,826 2.21 3.28 2.47 166,047,4911986 41,090 60,792 38,234 46,087 1,834,872 2.24 3.31 2.51 168,545,2861987 41,438 61,836 38,565 46,390 1,921,204 2.16 3.22 2.41 172,749,8941988 42,130 62,703 39,170 47,087 2,025,962 2.08 3.09 2.32 177,455,4761989 40,741 60,870 38,087 45,582 2,096,487 1.94 2.90 2.17 181,164,5681990 39,836 59,292 37,134 44,599 2,144,362 1.86 2.77 2.08 184,275,4221991 36,937 54,765 34,740 41,508 2,172,050 1.70 2.52 1.91 186,370,1901992 34,942 52,227 32,880 39,250 2,247,151 1.55 2.32 1.75 184,937,8481993 35,780 53,777 33,574 40,150 2,296,378 1.56 2.34 1.75 188,349,6761994 36,254 54,911 34,318 40,716 2,357,588 1.54 2.33 1.73 192,497,4381995 37,241 56,524 35,291 41,817 2,422,696 1.54 2.33 1.73 197,064,8681996 37,494 57,347 35,695 42,065 2,485,848 1.51 2.31 1.69 201,630,6591997 37,324 57,060 35,725 42,013 2,561,695 1.46 2.23 1.64 203,567,6371998 37,107 56,922 35,382 41,501 2,631,522 1.41 2.16 1.58 208,076,4691999 37,140 56,820 35,875 41,717 2,691,056 1.38 2.11 1.55 212,685,1572000 37,526 57,594 36,348 41,945 2,746,925 1.37 2.10 1.53 225,821,2412001 37,862 57,918 36,440 42,196 2,795,610 1.35 2.07 1.51 235,331,3812002 38,491 58,426 37,375 43,005 2,855,508 1.35 2.05 1.51 234,624,1352003 38,477 58,877 37,341 42,884 2,890,221 1.33 2.04 1.48 236,760,0332004 38,444 58,729 37,304 42,836 2,964,788 1.30 1.98 1.44 243,010,5502005 39,252 59,495 37,646 43,510 2,989,430 1.31 1.99 1.46 247,421,1202006 38,648 58,094 36,956 42,708 3,014,371 1.28 1.93 1.42 250,844,6442007 37,435 56,253 35,701 41,259 3,031,124 1.24 1.86 1.36 254,403,0812008 34,172 50,660 32,103 37,423 2,976,528 1.15 1.70 1.26 255,917,6642009 30,862 45,540 28,995 33,883 2,956,764 1.04 1.54 1.15 254,212,6102010 30,296 44,862 27,889 32,999 2,967,266 1.02 1.51 1.11 250,070,0482011 29,867 44,119 27,140 32,479 2,950,402 1.01 1.50 1.10 253,215,6812012 31,006 45,960 28,003 33,782 2,969,433 1.04 1.55 1.14 253,639,3862013 30,203 45,102 27,176 32,894 2,988,280 1.01 1.51 1.10 255,876,8222014 30,056 44,950 26,901 32,744 3,025,656 0.99 1.49 1.08 260,350,9382015 32,539 49,477 28,926 35,485 3,095,373 1.05 1.60 1.15 263,610,2192016 34,748 52,714 30,613 37,806 3,174,408 1.09 1.66 1.19 268,799,0832017 34,247 52,645 30,145 37,133 3,212,347 1.07 1.64 1.16 272,480,899
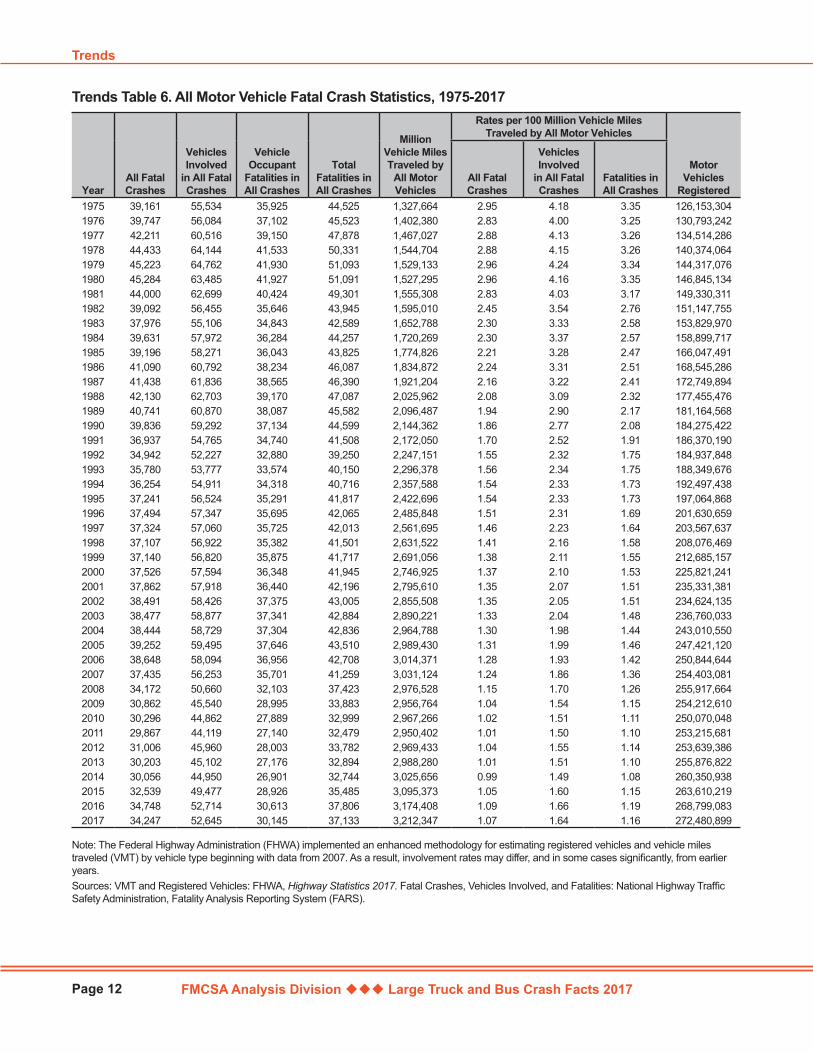
Trends Table 6. All Motor Vehicle Fatal Crash Statistics, 1975-2017
Note: The Federal Highway Administration (FHWA) implemented an enhanced methodology for estimating registered vehicles and vehicle miles traveled (VMT) by vehicle type beginning with data from 2007. As a result, involvement rates may differ, and in some cases significantly, from earlier years. Sources: VMT and Registered Vehicles: FHWA, Highway Statistics 2017. Fatal Crashes, Vehicles Involved, and Fatalities: National Highway Traffic Safety Administration, Fatality Analysis Reporting System (FARS).
FMCSA Analysis Division Large Truck and Bus Crash Facts 2017
Large Truck and Bus Crash Facts 2017
Page 13
Year
Injury Crashes Involving
Large Trucks
Large Trucks Involved in
Injury Crashes
Persons Injured in
Large Truck Crashes
Million Vehicle Miles Traveled
by Large Trucks
Rates per 100 Million Vehicle Miles Traveled by Large Trucks
Large Trucks Registered
Injury Crashes Involving
Large Trucks
Large Trucks Involved in Injury Crashes
Persons Injured in
Large Truck Crashes
1997 92,000 96,000 131,000 191,477 48.0 49.9 68.3 7,083,3261998 85,000 89,000 127,000 196,380 43.3 45.1 64.8 7,732,2701999 95,000 101,000 142,000 202,688 46.9 49.6 69.9 7,791,4262000 96,000 101,000 140,000 205,520 46.9 48.9 68.0 8,022,6492001 86,000 90,000 131,000 208,928 41.0 43.0 62.5 7,857,6752002 90,000 94,000 130,000 214,603 41.9 43.9 60.4 7,927,2802003 85,000 89,000 122,000 217,876 38.8 40.8 56.0 7,756,8882004 83,000 87,000 116,000 220,811 37.5 39.3 52.6 8,171,3642005 78,000 82,000 114,000 222,523 34.8 37.0 51.2 8,481,9992006 77,000 80,000 106,000 222,513 34.5 36.1 47.5 8,819,0072007 72,000 76,000 101,000 304,178 23.8 24.9 33.2 10,752,0192008 64,000 66,000 90,000 310,680 20.5 21.3 28.8 10,873,2752009 51,000 53,000 74,000 288,306 17.8 18.5 25.6 10,973,2142010 56,000 58,000 80,000 286,527 19.5 20.3 27.9 10,770,0542011 60,000 63,000 88,000 267,594 22.5 23.4 32.9 10,270,6932012 73,000 77,000 104,000 269,207 27.1 28.5 38.6 10,659,3802013 69,000 73,000 95,000 275,017 25.1 26.6 34.6 10,597,3562014 82,000 88,000 111,000 279,132 29.4 31.7 39.8 10,905,9562015 83,000 87,000 116,000 279,844 29.5 31.2 41.5 11,203,184
2016* 97,000 102,000 134,000 287,895 33.7 35.5 46.7 11,498,561 2017* 102,000 107,000 148,000 297,593 34.4 35.9 49.7 12,229,216
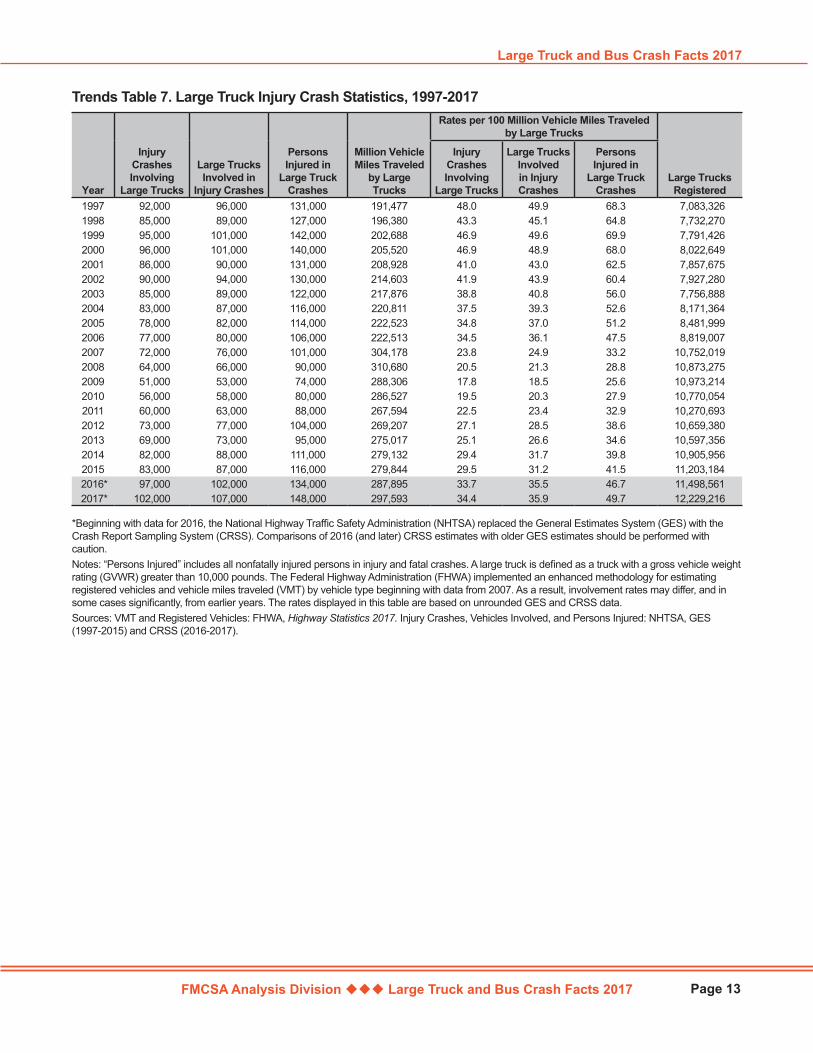
Trends Table 7. Large Truck Injury Crash Statistics, 1997-2017
*Beginning with data for 2016, the National Highway Traffic Safety Administration (NHTSA) replaced the General Estimates System (GES) with the Crash Report Sampling System (CRSS). Comparisons of 2016 (and later) CRSS estimates with older GES estimates should be performed with caution. Notes: “Persons Injured” includes all nonfatally injured persons in injury and fatal crashes. A large truck is defined as a truck with a gross vehicle weight rating (GVWR) greater than 10,000 pounds. The Federal Highway Administration (FHWA) implemented an enhanced methodology for estimating registered vehicles and vehicle miles traveled (VMT) by vehicle type beginning with data from 2007. As a result, involvement rates may differ, and in some cases significantly, from earlier years. The rates displayed in this table are based on unrounded GES and CRSS data.Sources: VMT and Registered Vehicles: FHWA, Highway Statistics 2017. Injury Crashes, Vehicles Involved, and Persons Injured: NHTSA, GES (1997-2015) and CRSS (2016-2017).

FMCSA Analysis Division Large Truck and Bus Crash Facts 2017
Trends
Page 14
Year
Injury Crashes Involving
Passenger Vehicles
Passenger Vehicles
Involved in Injury Crashes
Persons Injured in
Passenger Vehicle Crashes
Million Vehicle Miles Traveled by Passenger
Vehicles
Rates per 100 Million Vehicle Miles Traveled by Passenger Vehicles
Passenger Vehicles
Registered
Injury Crashes Involving
Passenger Vehicles
Passenger Vehicles Involved in Injury Crashes
Persons Injured in
Passenger Vehicle Crashes
1997 2,104,000 3,801,000 3,295,000 2,353,295 89.4 161.5 140.0 191,960,3901998 1,987,000 3,604,000 3,141,000 2,417,852 82.2 149.1 129.9 195,749,2091999 2,005,000 3,603,000 3,175,000 2,470,122 81.2 145.9 128.5 200,012,5212000 2,017,000 3,605,000 3,123,000 2,523,346 79.9 142.9 123.8 212,706,3992001 1,954,000 3,496,000 2,974,000 2,569,980 76.0 136.0 115.7 221,821,1032002 1,877,000 3,346,000 2,863,000 2,624,508 71.5 127.5 109.1 220,931,9822003 1,873,000 3,362,000 2,828,000 2,655,987 70.5 126.6 106.5 222,856,5602004 1,802,000 3,236,000 2,718,000 2,727,054 66.1 118.7 99.7 228,275,9782005 1,754,000 3,102,000 2,625,000 2,749,472 63.8 112.8 95.5 231,904,9222006 1,681,000 2,995,000 2,500,000 2,773,025 60.6 108.0 90.2 234,524,7202007 1,642,000 2,871,000 2,412,000 2,691,034 61.0 106.7 89.6 235,678,1502008 1,561,000 2,719,000 2,266,000 2,630,213 59.3 103.4 86.1 236,448,1552009 1,456,000 2,573,000 2,149,000 2,633,248 55.3 97.7 81.6 234,467,6792010 1,483,000 2,632,000 2,171,000 2,648,456 56.0 99.4 82.0 230,444,4402011 1,476,000 2,597,000 2,155,000 2,650,458 55.7 98.0 81.3 233,841,4222012 1,568,000 2,771,000 2,290,000 2,664,060 58.9 104.0 85.9 233,760,5582013 1,531,000 2,738,000 2,241,000 2,677,730 57.2 102.3 83.7 236,010,2302014 1,585,000 2,823,000 2,266,000 2,710,556 58.5 104.2 83.6 240,155,2372015 1,652,000 2,983,000 2,371,000 2,779,693 59.4 107.3 85.3 242,917,192
2016* 2,047,000 3,656,000 2,977,000 2,849,718 71.8 128.3 104.5 247,644,981 2017* 1,727,000 2,901,000 2,548,000 2,877,378 60.0 100.8 88.6 250,553,248
Trends Table 8. Passenger Vehicle Injury Crash Statistics, 1997-2017
*Beginning with data for 2016, the National Highway Traffic Safety Administration (NHTSA) replaced the General Estimates System (GES) with the Crash Report Sampling System (CRSS). Comparisons of 2016 (and later) CRSS estimates with older GES estimates should be performed with caution. Notes: “Persons Injured” includes all nonfatally injured persons in injury and fatal crashes. A passenger vehicle is defined as a car or light truck (including pickups, vans, and sport utility vehicles). The Federal Highway Administration (FHWA) implemented an enhanced methodology for estimating registered vehicles and vehicle miles traveled (VMT) by vehicle type beginning with data from 2007. As a result, involvement rates may differ, and in some cases significantly, from earlier years. The rates displayed in this table are based on unrounded GES and CRSS data.Sources: VMT and Registered Vehicles: FHWA, Highway Statistics 2017. Injury Crashes, Vehicles Involved, and Persons Injured: NHTSA, GES (1997-2015) and CRSS (2016-2017).

FMCSA Analysis Division Large Truck and Bus Crash Facts 2017
Large Truck and Bus Crash Facts 2017
Page 15
Trends Figure 4. Large Trucks and Passenger Vehicles Involved in Injury Crashes per 100 Million Vehicle Miles Traveled by Vehicle Type, 1997-2017
*Beginning with data for 2016, the National Highway Traffic Safety Administration (NHTSA) replaced the General Estimates System (GES) with the Crash Report Sampling System (CRSS). Comparisons of 2016 (and later) CRSS estimates with older GES estimates should be performed with caution. Notes: A large truck is defined as a truck with a gross vehicle weight rating (GVWR) greater than 10,000 pounds. A passenger vehicle is defined as a car or light truck (including pickups, vans, and sport utility vehicles). The Federal Highway Administration (FHWA) implemented an enhanced methodology for estimating registered vehicles and vehicle miles traveled (VMT) by vehicle type beginning with data from 2007. As a result, involvement rates may differ, and in some cases significantly, from earlier years. The rates depicted in this figure are based on unrounded GES and CRSS data.Sources: VMT: FHWA, Highway Statistics 2017. Injury Crashes and Vehicles Involved: NHTSA, GES (1997-2015) and CRSS (2016-2017).
FMCSA Analysis Division Large Truck and Bus Crash Facts 2017
Trends
Page 16
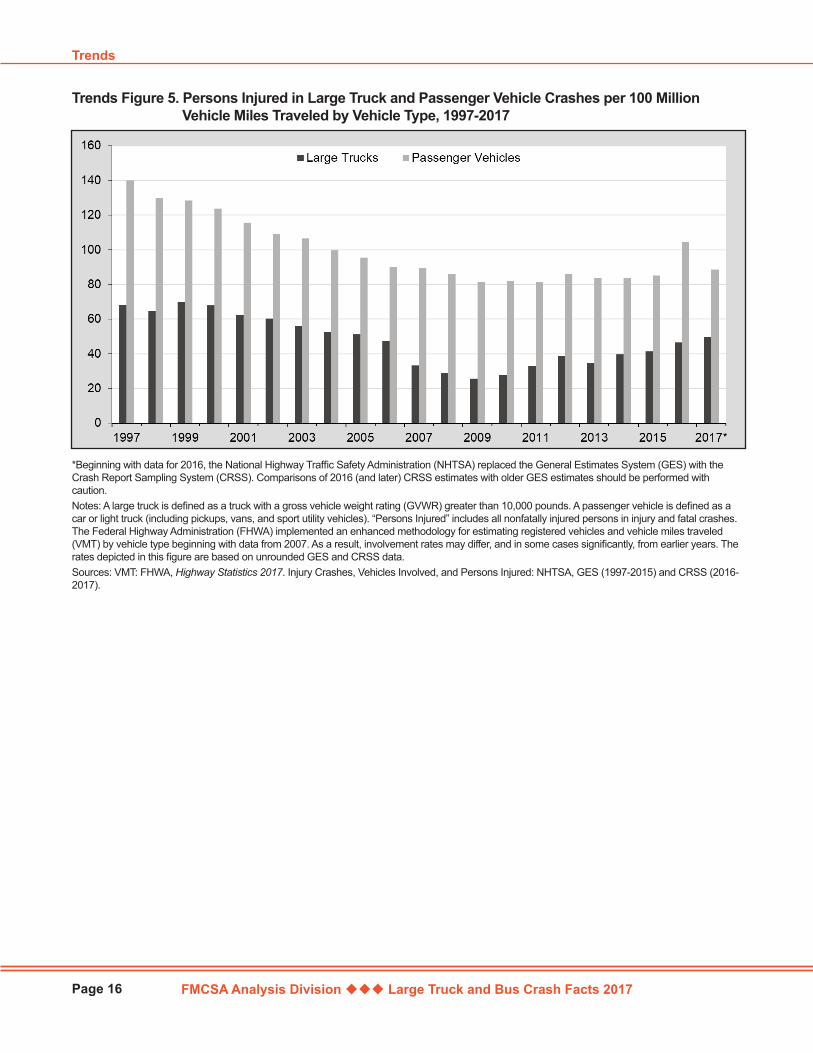
Trends Figure 5. Persons Injured in Large Truck and Passenger Vehicle Crashes per 100 Million Vehicle Miles Traveled by Vehicle Type, 1997-2017
*Beginning with data for 2016, the National Highway Traffic Safety Administration (NHTSA) replaced the General Estimates System (GES) with the Crash Report Sampling System (CRSS). Comparisons of 2016 (and later) CRSS estimates with older GES estimates should be performed with caution. Notes: A large truck is defined as a truck with a gross vehicle weight rating (GVWR) greater than 10,000 pounds. A passenger vehicle is defined as a car or light truck (including pickups, vans, and sport utility vehicles). “Persons Injured” includes all nonfatally injured persons in injury and fatal crashes. The Federal Highway Administration (FHWA) implemented an enhanced methodology for estimating registered vehicles and vehicle miles traveled (VMT) by vehicle type beginning with data from 2007. As a result, involvement rates may differ, and in some cases significantly, from earlier years. The rates depicted in this figure are based on unrounded GES and CRSS data.Sources: VMT: FHWA, Highway Statistics 2017. Injury Crashes, Vehicles Involved, and Persons Injured: NHTSA, GES (1997-2015) and CRSS (2016-2017).
FMCSA Analysis Division Large Truck and Bus Crash Facts 2017
Large Truck and Bus Crash Facts 2017
Page 17
YearAll Injury Crashes
Vehicles Involved in All Injury Crashes
Persons Injured in All
Crashes
Million Vehicle Miles Traveled by All Motor
Vehicles
Rates per 100 Million Vehicle Miles Traveled by All Motor Vehicles
Motor Vehicles Registered
All Injury Crashes
Vehicles Involved in All Injury Crashes
Persons Injured in All
Crashes1997 2,149,000 3,966,000 3,348,000 2,561,695 83.9 154.8 130.7 203,567,6371998 2,029,000 3,757,000 3,192,000 2,631,522 77.1 142.8 121.3 208,076,4691999 2,054,000 3,773,000 3,236,000 2,691,056 76.3 140.2 120.3 212,685,1572000 2,070,000 3,783,000 3,189,000 2,746,925 75.4 137.7 116.1 225,821,2412001 2,003,000 3,663,000 3,033,000 2,795,610 71.6 131.0 108.5 235,331,3822002 1,929,000 3,520,000 2,926,000 2,855,508 67.6 123.3 102.5 234,624,1352003 1,925,000 3,536,000 2,889,000 2,890,221 66.6 122.4 99.9 236,760,0332004 1,862,000 3,415,000 2,788,000 2,964,788 62.8 115.2 94.0 243,010,5502005 1,816,000 3,287,000 2,699,000 2,989,430 60.8 110.0 90.3 247,421,1202006 1,746,000 3,181,000 2,575,000 3,014,371 57.9 105.5 85.4 250,844,6442007 1,711,000 3,064,000 2,491,000 3,031,124 56.5 101.1 82.2 254,403,0812008 1,630,000 2,894,000 2,346,000 2,976,528 54.8 97.2 78.8 255,917,6642009 1,517,000 2,727,000 2,217,000 2,956,764 51.3 92.2 75.0 254,212,6102010 1,542,000 2,785,000 2,239,000 2,967,266 52.0 93.9 75.5 250,070,0482011 1,530,000 2,763,000 2,217,000 2,950,402 51.9 93.7 75.1 253,215,6812012 1,634,000 2,763,000 2,362,000 2,969,433 55.0 99.8 79.5 253,639,3862013 1,591,000 2,927,000 2,313,000 2,988,280 53.2 98.0 77.4 255,876,8222014 1,648,000 3,025,000 2,338,000 3,025,656 54.5 100.0 77.3 260,350,9382015 1,715,000 3,187,000 2,443,000 3,095,373 55.4 103.0 78.9 263,610,219
2016* 2,116,000 3,893,000 3,061,000 3,174,408 66.7 122.6 96.4 268,799,083 2017* 1,889,000 3,514,000 2,746,000 3,212,347 58.8 109.4 85.5 272,480,899
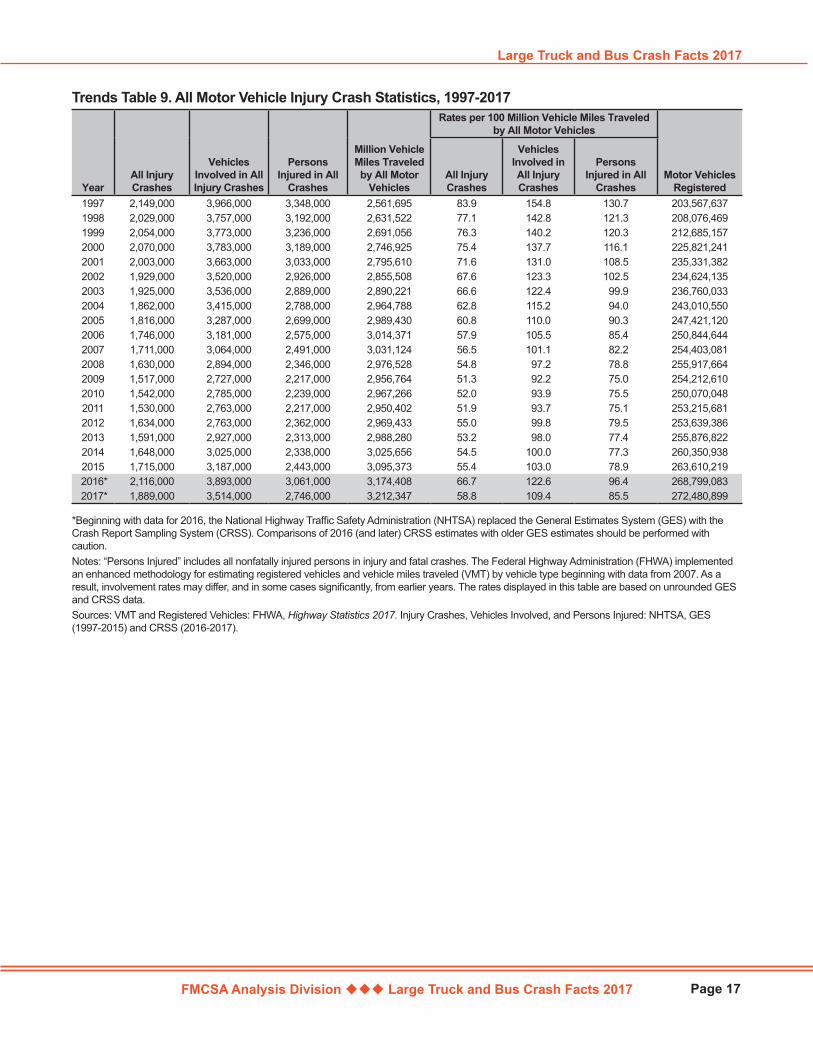
Trends Table 9. All Motor Vehicle Injury Crash Statistics, 1997-2017
*Beginning with data for 2016, the National Highway Traffic Safety Administration (NHTSA) replaced the General Estimates System (GES) with the Crash Report Sampling System (CRSS). Comparisons of 2016 (and later) CRSS estimates with older GES estimates should be performed with caution. Notes: “Persons Injured” includes all nonfatally injured persons in injury and fatal crashes. The Federal Highway Administration (FHWA) implemented an enhanced methodology for estimating registered vehicles and vehicle miles traveled (VMT) by vehicle type beginning with data from 2007. As a result, involvement rates may differ, and in some cases significantly, from earlier years. The rates displayed in this table are based on unrounded GES and CRSS data. Sources: VMT and Registered Vehicles: FHWA, Highway Statistics 2017. Injury Crashes, Vehicles Involved, and Persons Injured: NHTSA, GES (1997-2015) and CRSS (2016-2017).
FMCSA Analysis Division Large Truck and Bus Crash Facts 2017
Trends
Page 18
Year
PDO Crashes Involving Large
Trucks
Large Trucks Involved in PDO
Crashes
Million Vehicle Miles Traveled by
Large Trucks
Rates per 100 Million Vehicle Miles Traveled by Large Trucks
Large Trucks Registered
PDO Crashes Involving Large
Trucks
Large Trucks Involved in PDO
Crashes1997 325,000 337,000 191,477 169.6 176.1 7,083,3261998 302,000 318,000 196,380 153.8 162.0 7,732,2701999 353,000 369,000 202,688 174.1 182.2 7,791,4262000 337,000 351,000 205,520 163.9 170.9 8,022,6492001 319,000 335,000 208,928 152.8 160.3 7,857,6752002 322,000 336,000 214,603 150.2 156.3 7,927,2802003 347,000 363,000 217,876 159.4 166.7 7,756,8882004 312,000 324,000 220,811 141.2 146.9 8,171,3642005 341,000 354,000 222,523 153.2 159.2 8,481,9992006 287,000 300,000 222,513 128.9 134.7 8,819,0072007 317,000 333,000 304,178 104.3 109.5 10,752,0192008 297,000 309,000 310,680 95.7 99.6 10,873,2752009 232,000 239,000 288,306 80.5 83.0 10,973,2142010 207,000 214,000 286,527 72.3 74.7 10,770,0542011 210,000 221,000 267,594 78.5 82.7 10,270,6932012 241,000 253,000 269,207 89.6 93.9 10,659,3802013 254,000 265,000 275,017 92.3 96.3 10,597,3562014 326,000 346,000 279,132 116.6 123.9 10,905,9562015 328,000 342,000 279,844 117.2 122.0 11,203,1842016* 333,000 351,000 287,895 115.6 122.0 11,498,5612017* 344,000 363,000 297,593 115.5 122.1 12,229,216
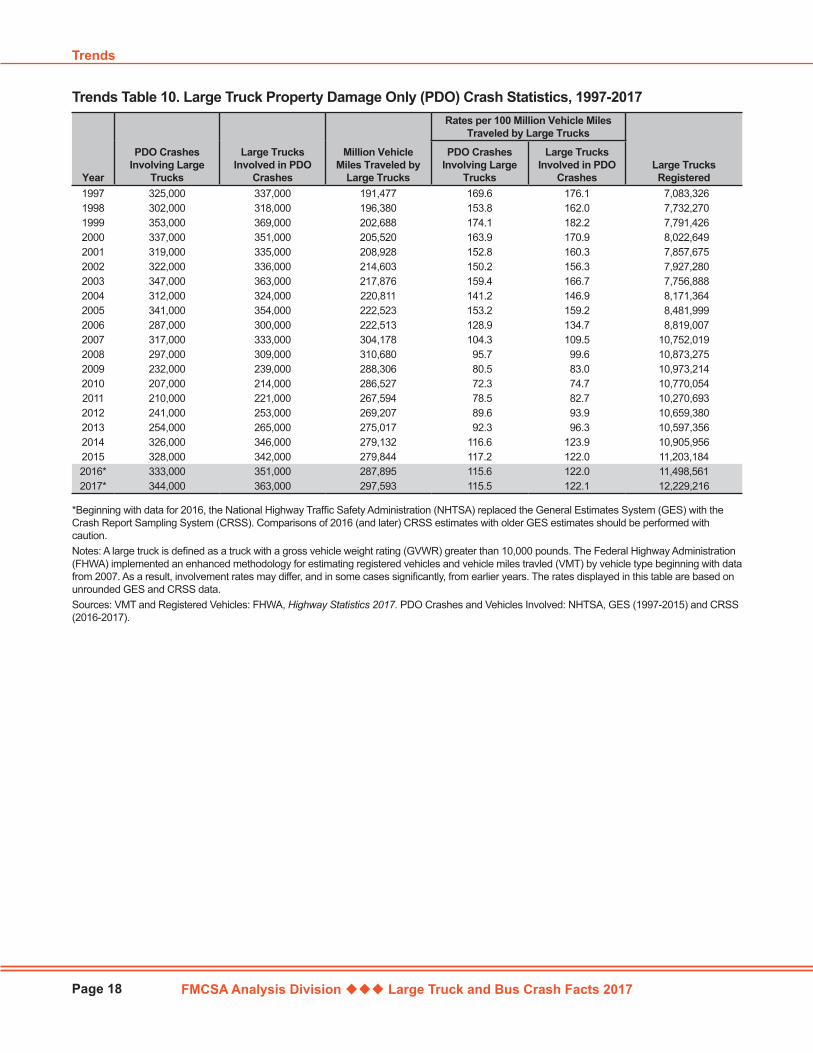
Trends Table 10. Large Truck Property Damage Only (PDO) Crash Statistics, 1997-2017
*Beginning with data for 2016, the National Highway Traffic Safety Administration (NHTSA) replaced the General Estimates System (GES) with the Crash Report Sampling System (CRSS). Comparisons of 2016 (and later) CRSS estimates with older GES estimates should be performed with caution. Notes: A large truck is defined as a truck with a gross vehicle weight rating (GVWR) greater than 10,000 pounds. The Federal Highway Administration (FHWA) implemented an enhanced methodology for estimating registered vehicles and vehicle miles travled (VMT) by vehicle type beginning with data from 2007. As a result, involvement rates may differ, and in some cases significantly, from earlier years. The rates displayed in this table are based on unrounded GES and CRSS data. Sources: VMT and Registered Vehicles: FHWA, Highway Statistics 2017. PDO Crashes and Vehicles Involved: NHTSA, GES (1997-2015) and CRSS (2016-2017).
FMCSA Analysis Division Large Truck and Bus Crash Facts 2017
Large Truck and Bus Crash Facts 2017
Page 19
Year
PDO Crashes Involving
Passenger Vehicles
Passenger Vehicles Involved in PDO
Crashes
Million Vehicle Miles Traveled by
Passenger Vehicles
Rates per 100 Million Vehicle Miles Traveled by Passenger Vehicles
Passenger Vehicles
Registered
PDO Crashes Involving
Passenger Vehicles
Passenger Vehicles Involved in PDO
Crashes1997 4,331,000 7,430,000 2,353,295 184.0 315.7 191,960,3901998 4,168,000 7,211,000 2,417,852 172.4 298.2 195,749,2091999 4,058,000 6,961,000 2,470,122 164.3 281.8 200,012,5212000 4,151,000 7,088,000 2,523,346 164.5 280.9 212,706,3992001 4,168,000 7,079,000 2,569,980 162.2 275.4 221,821,1032002 4,228,000 7,199,000 2,624,508 161.1 274.3 220,931,9822003 4,230,000 7,160,000 2,655,987 159.3 269.6 222,856,5602004 4,170,000 7,102,000 2,727,054 152.9 260.4 228,275,9782005 4,174,000 7,088,000 2,749,472 151.8 257.8 231,904,9222006 4,084,000 6,979,000 2,773,025 147.3 251.7 234,524,7202007 4,141,000 7,022,000 2,691,034 153.9 260.9 235,678,1502008 4,027,000 6,779,000 2,630,213 153.1 257.8 236,448,1552009 3,850,000 6,552,000 2,633,248 146.2 248.8 234,467,6792010 3,776,000 6,458,000 2,648,456 142.6 243.8 230,444,4402011 3,709,000 6,321,000 2,650,458 139.9 238.5 233,841,4222012 3,870,000 6,581,000 2,664,060 145.3 247.0 233,760,5582013 3,978,000 6,765,000 2,677,730 148.6 252.6 236,010,2302014 4,265,000 7,307,000 2,710,556 157.4 269.6 240,155,2372015 4,451,000 7,635,000 2,779,693 160.1 274.7 242,917,192
2016* 4,543,000 7,716,000 2,849,718 159.4 270.8 247,644,981 2017* 4,133,000 6,554,000 2,877,378 143.6 227.8 250,553,248
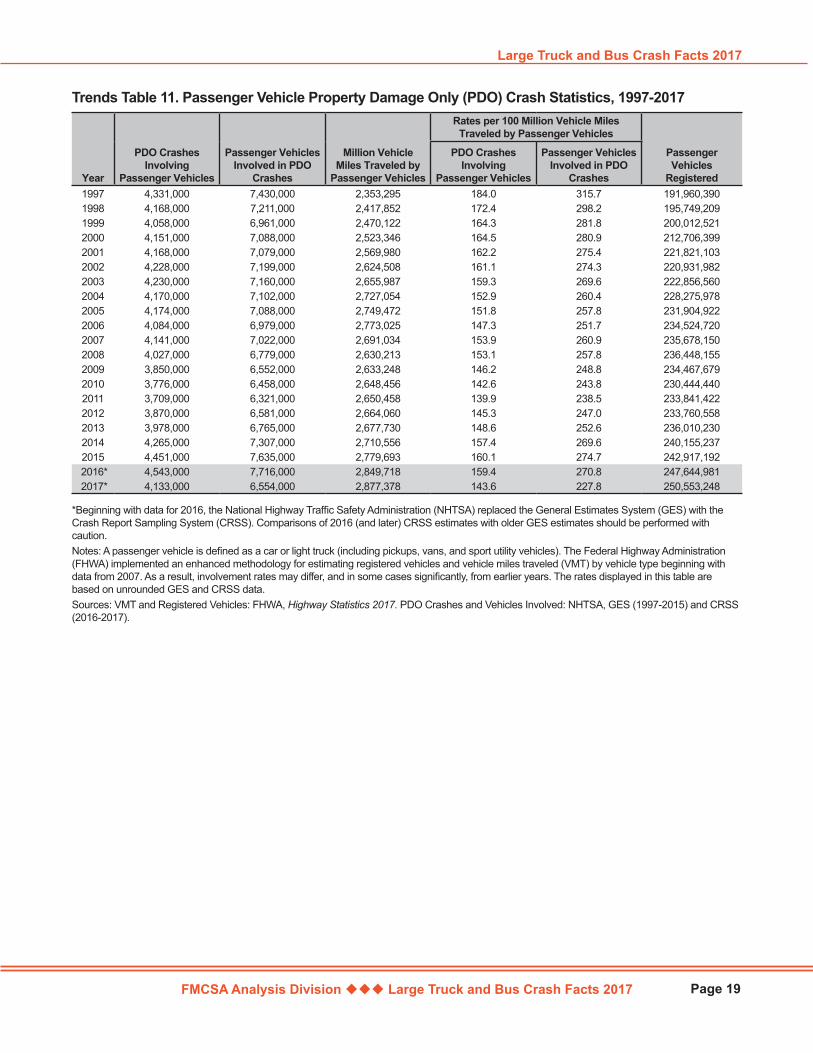
Trends Table 11. Passenger Vehicle Property Damage Only (PDO) Crash Statistics, 1997-2017
*Beginning with data for 2016, the National Highway Traffic Safety Administration (NHTSA) replaced the General Estimates System (GES) with the Crash Report Sampling System (CRSS). Comparisons of 2016 (and later) CRSS estimates with older GES estimates should be performed with caution. Notes: A passenger vehicle is defined as a car or light truck (including pickups, vans, and sport utility vehicles). The Federal Highway Administration (FHWA) implemented an enhanced methodology for estimating registered vehicles and vehicle miles traveled (VMT) by vehicle type beginning with data from 2007. As a result, involvement rates may differ, and in some cases significantly, from earlier years. The rates displayed in this table are based on unrounded GES and CRSS data.Sources: VMT and Registered Vehicles: FHWA, Highway Statistics 2017. PDO Crashes and Vehicles Involved: NHTSA, GES (1997-2015) and CRSS (2016-2017).

FMCSA Analysis Division Large Truck and Bus Crash Facts 2017
Trends
Page 20
Trends Figure 6. Large Trucks and Passenger Vehicles Involved in Property Damage Only (PDO) Crashes per 100 Million Vehicle Miles Traveled by Vehicle Type, 1997-2017
*Beginning with data for 2016, the National Highway Traffic Safety Administration (NHTSA) replaced the General Estimates System (GES) with the Crash Report Sampling System (CRSS). Comparisons of 2016 CRSS estimates with older GES estimates should be performed with caution. Notes: A large truck is defined as a truck with a gross vehicle weight rating (GVWR) greater than 10,000 pounds. A passenger vehicle is defined as a car or light truck (including pickups, vans, and sport utility vehicles). The Federal Highway Administration (FHWA) implemented an enhanced methodology for estimating registered vehicles and vehicle miles traveled (VMT) by vehicle type beginning with data from 2007. As a result, involvement rates may differ, and in some cases significantly, from earlier years. The rates depicted in this figure are based on unrounded GES and CRSS data.Sources: VMT and Registered Vehicles: FHWA, Highway Statistics 2017. PDO Crashes and Vehicles Involved: NHTSA, GES (1997-2015) and CRSS (2016-2017).
FMCSA Analysis Division Large Truck and Bus Crash Facts 2017
Large Truck and Bus Crash Facts 2017
Page 21
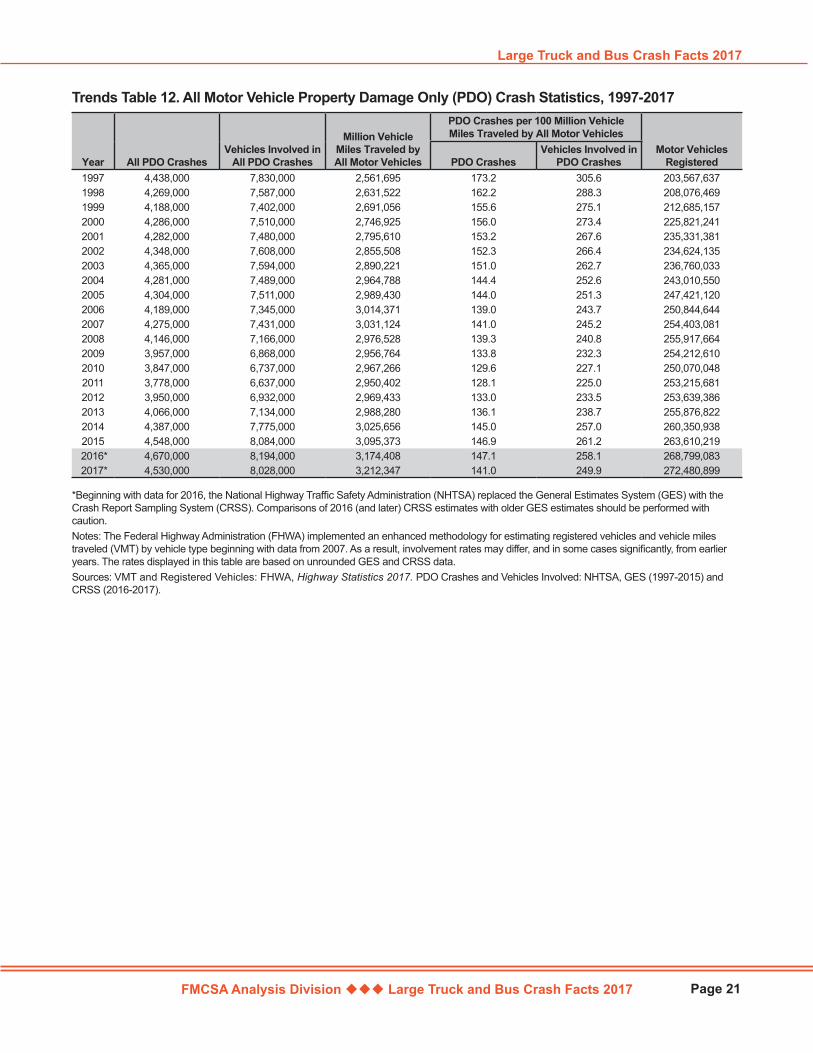
Year All PDO CrashesVehicles Involved in
All PDO Crashes
Million Vehicle Miles Traveled by All Motor Vehicles
PDO Crashes per 100 Million Vehicle Miles Traveled by All Motor Vehicles
Motor Vehicles RegisteredPDO Crashes
Vehicles Involved in PDO Crashes
1997 4,438,000 7,830,000 2,561,695 173.2 305.6 203,567,6371998 4,269,000 7,587,000 2,631,522 162.2 288.3 208,076,4691999 4,188,000 7,402,000 2,691,056 155.6 275.1 212,685,1572000 4,286,000 7,510,000 2,746,925 156.0 273.4 225,821,2412001 4,282,000 7,480,000 2,795,610 153.2 267.6 235,331,3812002 4,348,000 7,608,000 2,855,508 152.3 266.4 234,624,1352003 4,365,000 7,594,000 2,890,221 151.0 262.7 236,760,0332004 4,281,000 7,489,000 2,964,788 144.4 252.6 243,010,5502005 4,304,000 7,511,000 2,989,430 144.0 251.3 247,421,1202006 4,189,000 7,345,000 3,014,371 139.0 243.7 250,844,6442007 4,275,000 7,431,000 3,031,124 141.0 245.2 254,403,0812008 4,146,000 7,166,000 2,976,528 139.3 240.8 255,917,6642009 3,957,000 6,868,000 2,956,764 133.8 232.3 254,212,6102010 3,847,000 6,737,000 2,967,266 129.6 227.1 250,070,0482011 3,778,000 6,637,000 2,950,402 128.1 225.0 253,215,6812012 3,950,000 6,932,000 2,969,433 133.0 233.5 253,639,3862013 4,066,000 7,134,000 2,988,280 136.1 238.7 255,876,8222014 4,387,000 7,775,000 3,025,656 145.0 257.0 260,350,9382015 4,548,000 8,084,000 3,095,373 146.9 261.2 263,610,219
2016* 4,670,000 8,194,000 3,174,408 147.1 258.1 268,799,083 2017* 4,530,000 8,028,000 3,212,347 141.0 249.9 272,480,899
Trends Table 12. All Motor Vehicle Property Damage Only (PDO) Crash Statistics, 1997-2017
*Beginning with data for 2016, the National Highway Traffic Safety Administration (NHTSA) replaced the General Estimates System (GES) with the Crash Report Sampling System (CRSS). Comparisons of 2016 (and later) CRSS estimates with older GES estimates should be performed with caution. Notes: The Federal Highway Administration (FHWA) implemented an enhanced methodology for estimating registered vehicles and vehicle miles traveled (VMT) by vehicle type beginning with data from 2007. As a result, involvement rates may differ, and in some cases significantly, from earlier years. The rates displayed in this table are based on unrounded GES and CRSS data.Sources: VMT and Registered Vehicles: FHWA, Highway Statistics 2017. PDO Crashes and Vehicles Involved: NHTSA, GES (1997-2015) and CRSS (2016-2017).
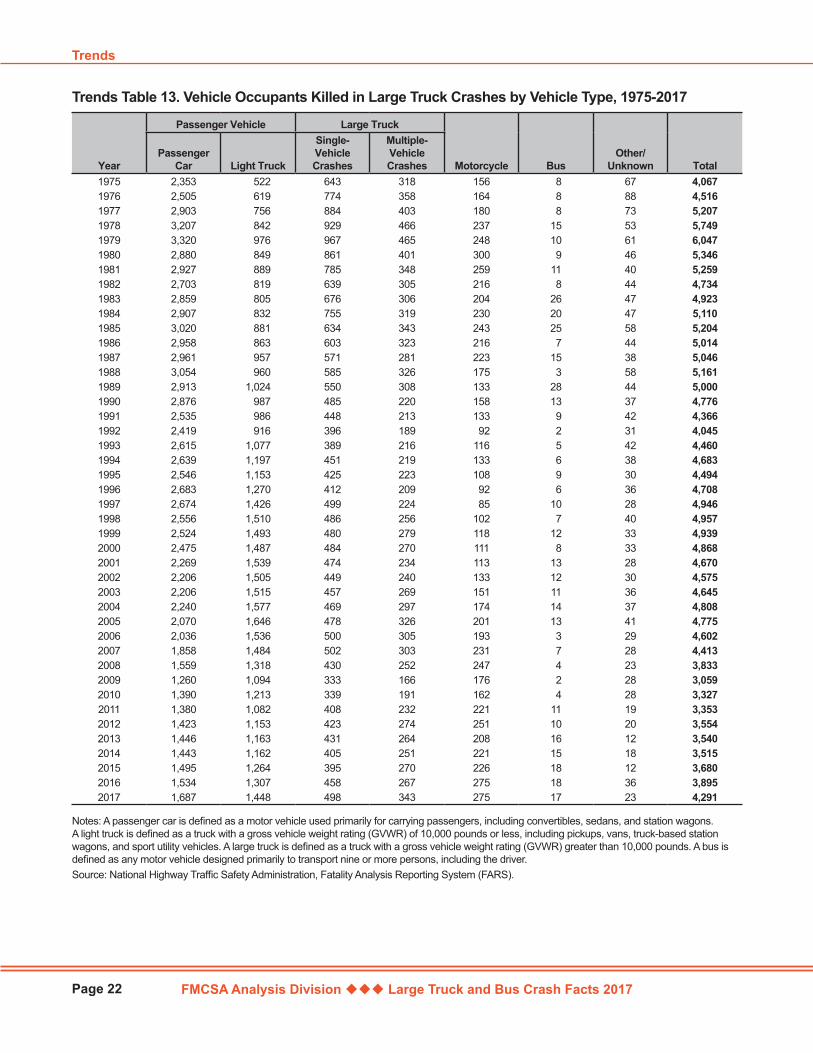
FMCSA Analysis Division Large Truck and Bus Crash Facts 2017
Trends
Page 22
Year
Passenger Vehicle Large Truck
Motorcycle BusOther/
Unknown TotalPassenger
Car Light Truck
Single- Vehicle Crashes
Multiple- Vehicle Crashes
1975 2,353 522 643 318 156 8 67 4,0671976 2,505 619 774 358 164 8 88 4,5161977 2,903 756 884 403 180 8 73 5,2071978 3,207 842 929 466 237 15 53 5,7491979 3,320 976 967 465 248 10 61 6,0471980 2,880 849 861 401 300 9 46 5,3461981 2,927 889 785 348 259 11 40 5,2591982 2,703 819 639 305 216 8 44 4,7341983 2,859 805 676 306 204 26 47 4,9231984 2,907 832 755 319 230 20 47 5,1101985 3,020 881 634 343 243 25 58 5,2041986 2,958 863 603 323 216 7 44 5,0141987 2,961 957 571 281 223 15 38 5,0461988 3,054 960 585 326 175 3 58 5,1611989 2,913 1,024 550 308 133 28 44 5,0001990 2,876 987 485 220 158 13 37 4,7761991 2,535 986 448 213 133 9 42 4,3661992 2,419 916 396 189 92 2 31 4,0451993 2,615 1,077 389 216 116 5 42 4,4601994 2,639 1,197 451 219 133 6 38 4,6831995 2,546 1,153 425 223 108 9 30 4,4941996 2,683 1,270 412 209 92 6 36 4,7081997 2,674 1,426 499 224 85 10 28 4,9461998 2,556 1,510 486 256 102 7 40 4,9571999 2,524 1,493 480 279 118 12 33 4,9392000 2,475 1,487 484 270 111 8 33 4,8682001 2,269 1,539 474 234 113 13 28 4,6702002 2,206 1,505 449 240 133 12 30 4,5752003 2,206 1,515 457 269 151 11 36 4,6452004 2,240 1,577 469 297 174 14 37 4,8082005 2,070 1,646 478 326 201 13 41 4,7752006 2,036 1,536 500 305 193 3 29 4,6022007 1,858 1,484 502 303 231 7 28 4,4132008 1,559 1,318 430 252 247 4 23 3,8332009 1,260 1,094 333 166 176 2 28 3,0592010 1,390 1,213 339 191 162 4 28 3,3272011 1,380 1,082 408 232 221 11 19 3,3532012 1,423 1,153 423 274 251 10 20 3,5542013 1,446 1,163 431 264 208 16 12 3,5402014 1,443 1,162 405 251 221 15 18 3,5152015 1,495 1,264 395 270 226 18 12 3,6802016 1,534 1,307 458 267 275 18 36 3,8952017 1,687 1,448 498 343 275 17 23 4,291
Trends Table 13. Vehicle Occupants Killed in Large Truck Crashes by Vehicle Type, 1975-2017
Notes: A passenger car is defined as a motor vehicle used primarily for carrying passengers, including convertibles, sedans, and station wagons. A light truck is defined as a truck with a gross vehicle weight rating (GVWR) of 10,000 pounds or less, including pickups, vans, truck-based station wagons, and sport utility vehicles. A large truck is defined as a truck with a gross vehicle weight rating (GVWR) greater than 10,000 pounds. A bus is defined as any motor vehicle designed primarily to transport nine or more persons, including the driver.Source: National Highway Traffic Safety Administration, Fatality Analysis Reporting System (FARS).
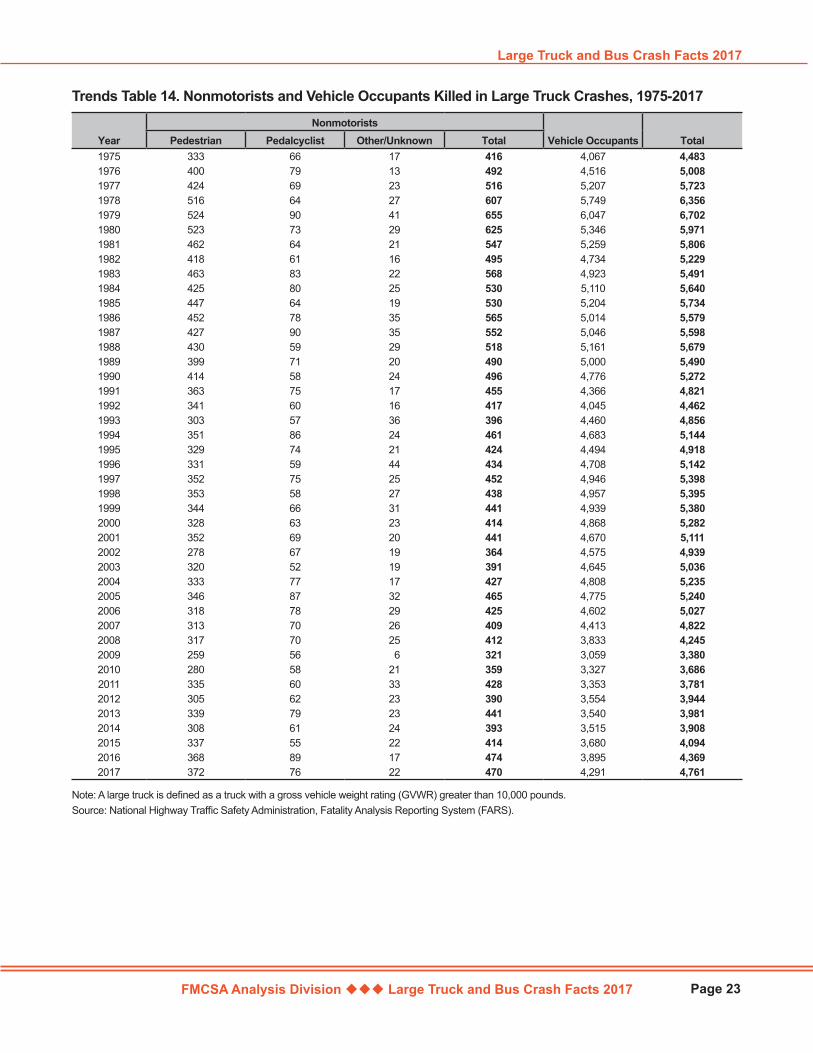
FMCSA Analysis Division Large Truck and Bus Crash Facts 2017
Large Truck and Bus Crash Facts 2017
Page 23
YearNonmotorists
Vehicle Occupants TotalPedestrian Pedalcyclist Other/Unknown Total1975 333 66 17 416 4,067 4,4831976 400 79 13 492 4,516 5,0081977 424 69 23 516 5,207 5,7231978 516 64 27 607 5,749 6,3561979 524 90 41 655 6,047 6,7021980 523 73 29 625 5,346 5,9711981 462 64 21 547 5,259 5,8061982 418 61 16 495 4,734 5,2291983 463 83 22 568 4,923 5,4911984 425 80 25 530 5,110 5,6401985 447 64 19 530 5,204 5,7341986 452 78 35 565 5,014 5,5791987 427 90 35 552 5,046 5,5981988 430 59 29 518 5,161 5,6791989 399 71 20 490 5,000 5,4901990 414 58 24 496 4,776 5,2721991 363 75 17 455 4,366 4,8211992 341 60 16 417 4,045 4,4621993 303 57 36 396 4,460 4,8561994 351 86 24 461 4,683 5,1441995 329 74 21 424 4,494 4,9181996 331 59 44 434 4,708 5,1421997 352 75 25 452 4,946 5,3981998 353 58 27 438 4,957 5,3951999 344 66 31 441 4,939 5,3802000 328 63 23 414 4,868 5,2822001 352 69 20 441 4,670 5,1112002 278 67 19 364 4,575 4,9392003 320 52 19 391 4,645 5,0362004 333 77 17 427 4,808 5,2352005 346 87 32 465 4,775 5,2402006 318 78 29 425 4,602 5,0272007 313 70 26 409 4,413 4,8222008 317 70 25 412 3,833 4,2452009 259 56 6 321 3,059 3,3802010 280 58 21 359 3,327 3,6862011 335 60 33 428 3,353 3,7812012 305 62 23 390 3,554 3,9442013 339 79 23 441 3,540 3,9812014 308 61 24 393 3,515 3,9082015 337 55 22 414 3,680 4,0942016 368 89 17 474 3,895 4,3692017 372 76 22 470 4,291 4,761
Trends Table 14. Nonmotorists and Vehicle Occupants Killed in Large Truck Crashes, 1975-2017
Note: A large truck is defined as a truck with a gross vehicle weight rating (GVWR) greater than 10,000 pounds.Source: National Highway Traffic Safety Administration, Fatality Analysis Reporting System (FARS).
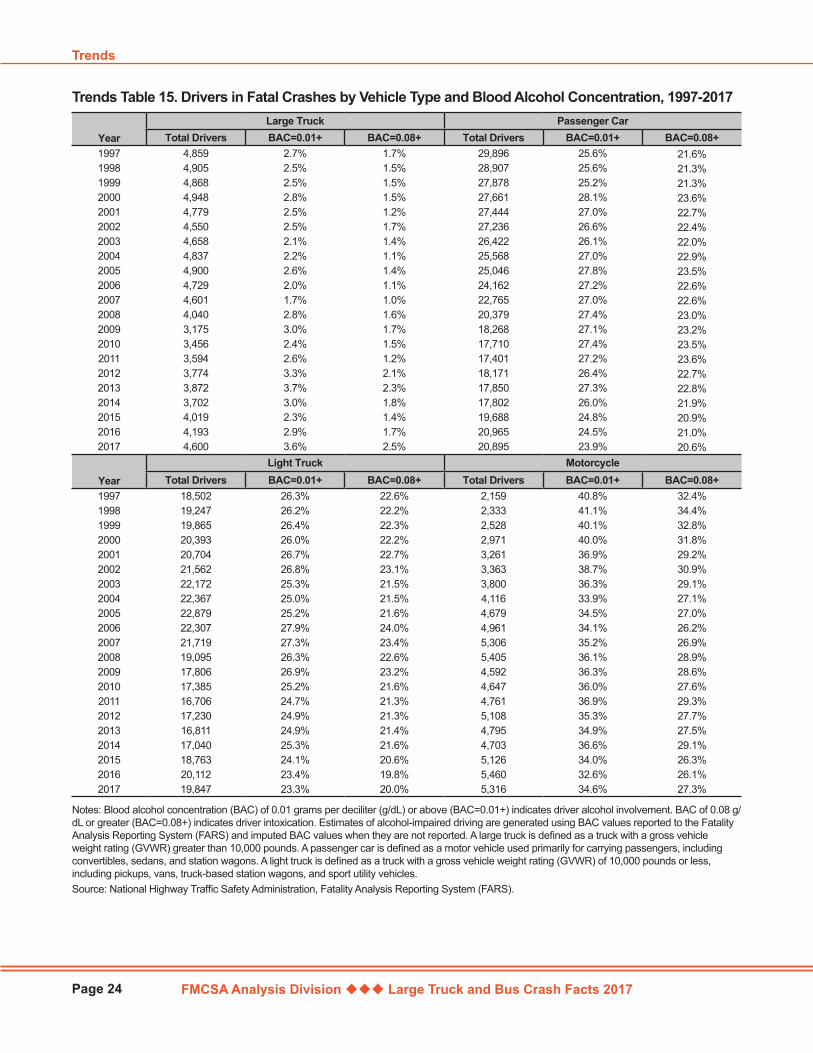
FMCSA Analysis Division Large Truck and Bus Crash Facts 2017
Trends
Page 24
YearLarge Truck Passenger Car
Total Drivers BAC=0.01+ BAC=0.08+ Total Drivers BAC=0.01+ BAC=0.08+1997 4,859 2.7% 1.7% 29,896 25.6% 21.6%1998 4,905 2.5% 1.5% 28,907 25.6% 21.3%1999 4,868 2.5% 1.5% 27,878 25.2% 21.3%2000 4,948 2.8% 1.5% 27,661 28.1% 23.6%2001 4,779 2.5% 1.2% 27,444 27.0% 22.7%2002 4,550 2.5% 1.7% 27,236 26.6% 22.4%2003 4,658 2.1% 1.4% 26,422 26.1% 22.0%2004 4,837 2.2% 1.1% 25,568 27.0% 22.9%2005 4,900 2.6% 1.4% 25,046 27.8% 23.5%2006 4,729 2.0% 1.1% 24,162 27.2% 22.6%2007 4,601 1.7% 1.0% 22,765 27.0% 22.6%2008 4,040 2.8% 1.6% 20,379 27.4% 23.0%2009 3,175 3.0% 1.7% 18,268 27.1% 23.2%2010 3,456 2.4% 1.5% 17,710 27.4% 23.5%2011 3,594 2.6% 1.2% 17,401 27.2% 23.6%2012 3,774 3.3% 2.1% 18,171 26.4% 22.7%2013 3,872 3.7% 2.3% 17,850 27.3% 22.8%2014 3,702 3.0% 1.8% 17,802 26.0% 21.9%2015 4,019 2.3% 1.4% 19,688 24.8% 20.9%2016 4,193 2.9% 1.7% 20,965 24.5% 21.0%2017 4,600 3.6% 2.5% 20,895 23.9% 20.6%
YearLight Truck Motorcycle
Total Drivers BAC=0.01+ BAC=0.08+ Total Drivers BAC=0.01+ BAC=0.08+1997 18,502 26.3% 22.6% 2,159 40.8% 32.4%1998 19,247 26.2% 22.2% 2,333 41.1% 34.4%1999 19,865 26.4% 22.3% 2,528 40.1% 32.8%2000 20,393 26.0% 22.2% 2,971 40.0% 31.8%2001 20,704 26.7% 22.7% 3,261 36.9% 29.2%2002 21,562 26.8% 23.1% 3,363 38.7% 30.9%2003 22,172 25.3% 21.5% 3,800 36.3% 29.1%2004 22,367 25.0% 21.5% 4,116 33.9% 27.1%2005 22,879 25.2% 21.6% 4,679 34.5% 27.0%2006 22,307 27.9% 24.0% 4,961 34.1% 26.2%2007 21,719 27.3% 23.4% 5,306 35.2% 26.9%2008 19,095 26.3% 22.6% 5,405 36.1% 28.9%2009 17,806 26.9% 23.2% 4,592 36.3% 28.6%2010 17,385 25.2% 21.6% 4,647 36.0% 27.6%2011 16,706 24.7% 21.3% 4,761 36.9% 29.3%2012 17,230 24.9% 21.3% 5,108 35.3% 27.7%2013 16,811 24.9% 21.4% 4,795 34.9% 27.5%2014 17,040 25.3% 21.6% 4,703 36.6% 29.1%2015 18,763 24.1% 20.6% 5,126 34.0% 26.3%2016 20,112 23.4% 19.8% 5,460 32.6% 26.1%2017 19,847 23.3% 20.0% 5,316 34.6% 27.3%
Trends Table 15. Drivers in Fatal Crashes by Vehicle Type and Blood Alcohol Concentration, 1997-2017
Notes: Blood alcohol concentration (BAC) of 0.01 grams per deciliter (g/dL) or above (BAC=0.01+) indicates driver alcohol involvement. BAC of 0.08 g/dL or greater (BAC=0.08+) indicates driver intoxication. Estimates of alcohol-impaired driving are generated using BAC values reported to the Fatality Analysis Reporting System (FARS) and imputed BAC values when they are not reported. A large truck is defined as a truck with a gross vehicle weight rating (GVWR) greater than 10,000 pounds. A passenger car is defined as a motor vehicle used primarily for carrying passengers, including convertibles, sedans, and station wagons. A light truck is defined as a truck with a gross vehicle weight rating (GVWR) of 10,000 pounds or less, including pickups, vans, truck-based station wagons, and sport utility vehicles.Source: National Highway Traffic Safety Administration, Fatality Analysis Reporting System (FARS).
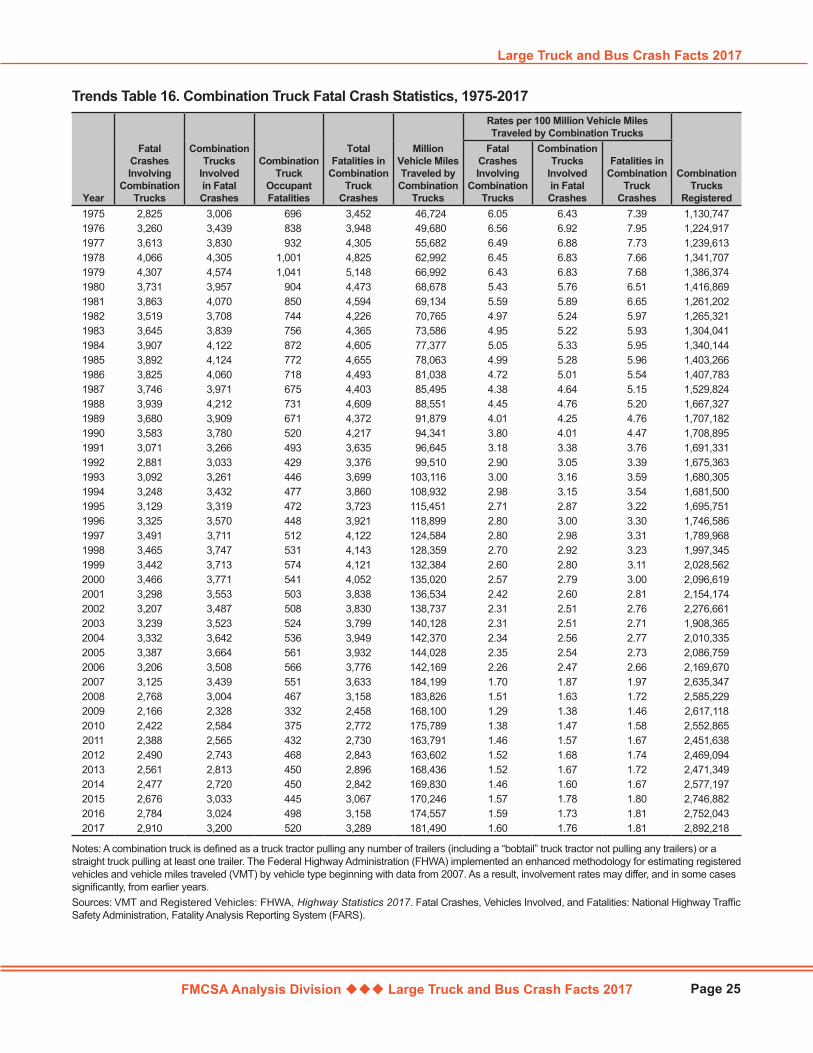
FMCSA Analysis Division Large Truck and Bus Crash Facts 2017
Large Truck and Bus Crash Facts 2017
Page 25
Year
Fatal Crashes Involving
Combination Trucks
Combination Trucks
Involved in Fatal Crashes
Combination Truck
Occupant Fatalities
Total Fatalities in
Combination Truck
Crashes
Million Vehicle Miles Traveled by Combination
Trucks
Rates per 100 Million Vehicle Miles Traveled by Combination Trucks
Combination Trucks
Registered
Fatal Crashes Involving
Combination Trucks
Combination Trucks
Involved in Fatal Crashes
Fatalities in Combination
Truck Crashes
1975 2,825 3,006 696 3,452 46,724 6.05 6.43 7.39 1,130,7471976 3,260 3,439 838 3,948 49,680 6.56 6.92 7.95 1,224,9171977 3,613 3,830 932 4,305 55,682 6.49 6.88 7.73 1,239,6131978 4,066 4,305 1,001 4,825 62,992 6.45 6.83 7.66 1,341,7071979 4,307 4,574 1,041 5,148 66,992 6.43 6.83 7.68 1,386,3741980 3,731 3,957 904 4,473 68,678 5.43 5.76 6.51 1,416,8691981 3,863 4,070 850 4,594 69,134 5.59 5.89 6.65 1,261,2021982 3,519 3,708 744 4,226 70,765 4.97 5.24 5.97 1,265,3211983 3,645 3,839 756 4,365 73,586 4.95 5.22 5.93 1,304,0411984 3,907 4,122 872 4,605 77,377 5.05 5.33 5.95 1,340,1441985 3,892 4,124 772 4,655 78,063 4.99 5.28 5.96 1,403,2661986 3,825 4,060 718 4,493 81,038 4.72 5.01 5.54 1,407,7831987 3,746 3,971 675 4,403 85,495 4.38 4.64 5.15 1,529,8241988 3,939 4,212 731 4,609 88,551 4.45 4.76 5.20 1,667,3271989 3,680 3,909 671 4,372 91,879 4.01 4.25 4.76 1,707,1821990 3,583 3,780 520 4,217 94,341 3.80 4.01 4.47 1,708,8951991 3,071 3,266 493 3,635 96,645 3.18 3.38 3.76 1,691,3311992 2,881 3,033 429 3,376 99,510 2.90 3.05 3.39 1,675,3631993 3,092 3,261 446 3,699 103,116 3.00 3.16 3.59 1,680,3051994 3,248 3,432 477 3,860 108,932 2.98 3.15 3.54 1,681,5001995 3,129 3,319 472 3,723 115,451 2.71 2.87 3.22 1,695,7511996 3,325 3,570 448 3,921 118,899 2.80 3.00 3.30 1,746,5861997 3,491 3,711 512 4,122 124,584 2.80 2.98 3.31 1,789,9681998 3,465 3,747 531 4,143 128,359 2.70 2.92 3.23 1,997,3451999 3,442 3,713 574 4,121 132,384 2.60 2.80 3.11 2,028,5622000 3,466 3,771 541 4,052 135,020 2.57 2.79 3.00 2,096,6192001 3,298 3,553 503 3,838 136,534 2.42 2.60 2.81 2,154,1742002 3,207 3,487 508 3,830 138,737 2.31 2.51 2.76 2,276,6612003 3,239 3,523 524 3,799 140,128 2.31 2.51 2.71 1,908,3652004 3,332 3,642 536 3,949 142,370 2.34 2.56 2.77 2,010,3352005 3,387 3,664 561 3,932 144,028 2.35 2.54 2.73 2,086,7592006 3,206 3,508 566 3,776 142,169 2.26 2.47 2.66 2,169,6702007 3,125 3,439 551 3,633 184,199 1.70 1.87 1.97 2,635,3472008 2,768 3,004 467 3,158 183,826 1.51 1.63 1.72 2,585,2292009 2,166 2,328 332 2,458 168,100 1.29 1.38 1.46 2,617,1182010 2,422 2,584 375 2,772 175,789 1.38 1.47 1.58 2,552,8652011 2,388 2,565 432 2,730 163,791 1.46 1.57 1.67 2,451,6382012 2,490 2,743 468 2,843 163,602 1.52 1.68 1.74 2,469,0942013 2,561 2,813 450 2,896 168,436 1.52 1.67 1.72 2,471,3492014 2,477 2,720 450 2,842 169,830 1.46 1.60 1.67 2,577,1972015 2,676 3,033 445 3,067 170,246 1.57 1.78 1.80 2,746,8822016 2,784 3,024 498 3,158 174,557 1.59 1.73 1.81 2,752,0432017 2,910 3,200 520 3,289 181,490 1.60 1.76 1.81 2,892,218
Trends Table 16. Combination Truck Fatal Crash Statistics, 1975-2017
Notes: A combination truck is defined as a truck tractor pulling any number of trailers (including a “bobtail” truck tractor not pulling any trailers) or a straight truck pulling at least one trailer. The Federal Highway Administration (FHWA) implemented an enhanced methodology for estimating registered vehicles and vehicle miles traveled (VMT) by vehicle type beginning with data from 2007. As a result, involvement rates may differ, and in some cases significantly, from earlier years.Sources: VMT and Registered Vehicles: FHWA, Highway Statistics 2017. Fatal Crashes, Vehicles Involved, and Fatalities: National Highway Traffic Safety Administration, Fatality Analysis Reporting System (FARS).

FMCSA Analysis Division Large Truck and Bus Crash Facts 2017
Trends
Page 26
Year
Fatal Crashes Involving
Single-Unit Trucks
Single-Unit
Trucks Involved in Fatal Crashes
Single-Unit Truck Occupant Fatalities
Total Fatalities in Single-Unit Truck Crashes
Million Vehicle Miles Traveled by Single-Unit
Trucks
Rates per 100 Million Vehicle Miles Traveled by Single-Unit Trucks
Single-Unit Trucks
Registered
Fatal Crashes Involving
Single-Unit Trucks
Single-Unit Trucks
Involved in Fatal Crashes
Fatalities in Single-Unit Truck Crashes
1975 948 971 265 1,094 34,606 2.74 2.81 3.16 4,231,6221976 978 996 294 1,125 36,390 2.69 2.74 3.09 4,350,2681977 1,306 1,334 355 1,502 39,339 3.32 3.39 3.82 4,450,2901978 1,419 1,454 394 1,630 42,747 3.32 3.40 3.81 4,518,1001979 1,472 1,510 391 1,670 42,012 3.50 3.59 3.98 4,505,1971980 1,388 1,422 358 1,590 39,813 3.49 3.57 3.99 4,373,7841981 1,130 1,160 283 1,298 39,568 2.86 2.93 3.28 4,455,0761982 922 938 200 1,056 40,658 2.27 2.31 2.60 4,325,0941983 1,019 1,038 226 1,182 42,546 2.40 2.44 2.78 4,204,3511984 986 1,002 202 1,114 44,419 2.22 2.26 2.51 4,060,9311985 1,016 1,029 205 1,163 45,441 2.24 2.26 2.56 4,593,0711986 1,018 1,037 208 1,158 45,637 2.23 2.27 2.54 4,313,0971987 1,118 1,137 177 1,259 48,022 2.33 2.37 2.62 4,188,4421988 1,014 1,029 180 1,143 49,434 2.05 2.08 2.31 4,469,5571989 1,056 1,075 187 1,192 50,870 2.08 2.11 2.34 4,519,3001990 979 996 185 1,106 51,901 1.89 1.92 2.13 4,486,9811991 1,072 1,081 168 1,251 52,898 2.03 2.04 2.36 4,480,8151992 987 1,002 156 1,137 53,874 1.83 1.86 2.11 4,369,8421993 1,054 1,067 159 1,214 56,772 1.86 1.88 2.14 4,407,8501994 1,188 1,212 193 1,354 61,284 1.94 1.98 2.21 4,906,3851995 1,133 1,153 176 1,275 62,705 1.81 1.84 2.03 5,023,6691996 1,160 1,185 173 1,313 64,072 1.81 1.85 2.05 5,266,0291997 1,194 1,206 211 1,369 66,893 1.78 1.80 2.05 5,293,3581998 1,185 1,208 211 1,331 68,021 1.74 1.78 1.96 5,734,9251999 1,193 1,207 185 1,352 70,304 1.70 1.72 1.92 5,762,8642000 1,199 1,224 213 1,350 70,500 1.70 1.74 1.91 5,926,0302001 1,247 1,270 205 1,382 72,394 1.72 1.75 1.91 5,703,5012002 1,089 1,100 181 1,210 75,866 1.44 1.45 1.59 5,650,6192003 1,174 1,198 202 1,330 77,748 1.51 1.54 1.71 5,848,5232004 1,228 1,258 230 1,390 78,441 1.57 1.60 1.77 6,161,0282005 1,257 1,288 243 1,414 78,496 1.60 1.64 1.80 6,395,2402006 1,224 1,259 239 1,344 80,344 1.52 1.57 1.67 6,649,3372007 1,168 1,194 254 1,308 119,979 0.97 1.00 1.09 8,116,6722008 1,070 1,085 215 1,191 126,855 0.84 0.86 0.94 8,288,0462009 868 883 167 985 120,207 0.72 0.73 0.82 8,356,0972010 894 910 155 975 110,738 0.81 0.82 0.88 8,217,1892011 1,054 1,068 208 1,140 103,803 1.02 1.03 1.10 7,819,0552012 1,061 1,082 229 1,187 105,605 1.00 1.02 1.12 8,190,2862013 1,071 1,108 245 1,181 106,582 1.00 1.04 1.11 8,126,0072014 1,005 1,029 206 1,135 109,301 0.92 0.94 1.04 8,328,7592015 1,026 1,041 220 1,127 109,597 0.94 0.95 1.03 8,456,3022016 1,196 1,227 227 1,312 113,338 1.06 1.08 1.16 8,746,5182017 1,430 1,457 321 1,596 116,102 1.23 1.25 1.37 9,336,998
Trends Table 17. Single-Unit Truck Fatal Crash Statistics, 1975-2017
Notes: A single-unit truck is defined as a medium or heavy truck in which the engine, cab, drive train, and cargo area are all on one chassis. The Federal Highway Administration (FHWA) implemented an enhanced methodology for estimating registered vehicles and vehicle miles traveled (VMT) by vehicle type beginning with data from 2007. As a result, involvement rates may differ, and in some cases significantly, from earlier years.Sources: VMT and Registered Vehicles: FHWA, Highway Statistics 2017. Fatal Crashes, Vehicles Involved, and Fatalities: National Highway Traffic Safety Administration, Fatality Analysis Reporting System (FARS).

FMCSA Analysis Division Large Truck and Bus Crash Facts 2017
Large Truck and Bus Crash Facts 2017
Page 27
0
1
2
3
4
5
6
7
8
9
1975 1978 1981 1984 1987 1990 1993 1996 1999 2002 2005 2008 2011 2014 2017
Combination Trucks Single-Unit Trucks
Trends Figure 7. Fatalities in Combination Truck and Single-Unit Truck Crashes per 100 Million Vehicle Miles Traveled by Vehicle Type, 1975-2017
Notes: A combination truck is defined as a truck tractor pulling any number of trailers (including none) or a straight truck pulling at least one trailer. A single-unit truck is defined as a medium or heavy truck in which the engine, cab, drive train, and cargo area are all on one chassis. The Federal Highway Administration (FHWA) implemented an enhanced methodology for estimating registered vehicles and vehicle miles traveled (VMT) by vehicle type beginning with data from 2007. As a result, involvement rates may differ, and in some cases significantly, from earlier years.Sources: VMT: FHWA, Highway Statistics 2017. Fatal Crashes, Vehicles Involved, and Fatalities: National Highway Traffic Safety Administration, Fatality Analysis Reporting System (FARS).
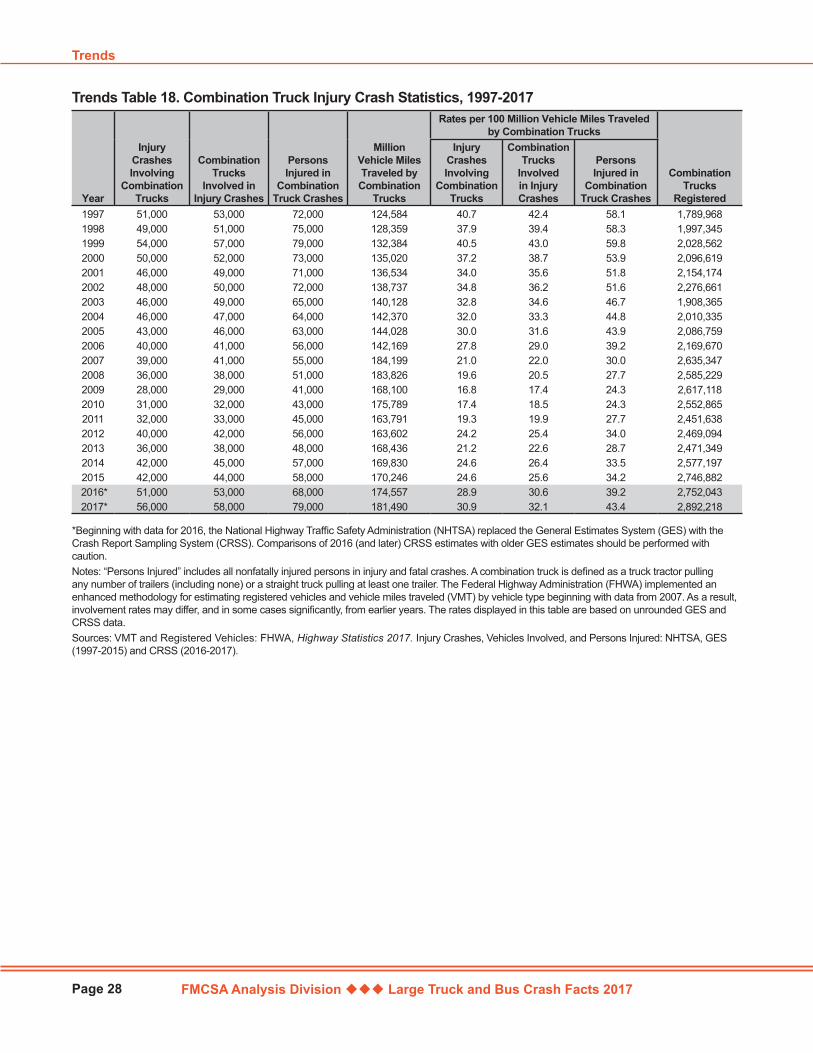
FMCSA Analysis Division Large Truck and Bus Crash Facts 2017
Trends
Page 28
Year
Injury Crashes Involving
Combination Trucks
Combination Trucks
Involved in Injury Crashes
Persons Injured in
Combination Truck Crashes
Million Vehicle Miles Traveled by Combination
Trucks
Rates per 100 Million Vehicle Miles Traveled by Combination Trucks
Combination Trucks
Registered
Injury Crashes Involving
Combination Trucks
Combination Trucks
Involved in Injury Crashes
Persons Injured in
Combination Truck Crashes
1997 51,000 53,000 72,000 124,584 40.7 42.4 58.1 1,789,9681998 49,000 51,000 75,000 128,359 37.9 39.4 58.3 1,997,3451999 54,000 57,000 79,000 132,384 40.5 43.0 59.8 2,028,5622000 50,000 52,000 73,000 135,020 37.2 38.7 53.9 2,096,6192001 46,000 49,000 71,000 136,534 34.0 35.6 51.8 2,154,1742002 48,000 50,000 72,000 138,737 34.8 36.2 51.6 2,276,6612003 46,000 49,000 65,000 140,128 32.8 34.6 46.7 1,908,3652004 46,000 47,000 64,000 142,370 32.0 33.3 44.8 2,010,3352005 43,000 46,000 63,000 144,028 30.0 31.6 43.9 2,086,7592006 40,000 41,000 56,000 142,169 27.8 29.0 39.2 2,169,6702007 39,000 41,000 55,000 184,199 21.0 22.0 30.0 2,635,3472008 36,000 38,000 51,000 183,826 19.6 20.5 27.7 2,585,2292009 28,000 29,000 41,000 168,100 16.8 17.4 24.3 2,617,1182010 31,000 32,000 43,000 175,789 17.4 18.5 24.3 2,552,8652011 32,000 33,000 45,000 163,791 19.3 19.9 27.7 2,451,6382012 40,000 42,000 56,000 163,602 24.2 25.4 34.0 2,469,0942013 36,000 38,000 48,000 168,436 21.2 22.6 28.7 2,471,3492014 42,000 45,000 57,000 169,830 24.6 26.4 33.5 2,577,1972015 42,000 44,000 58,000 170,246 24.6 25.6 34.2 2,746,882
2016* 51,000 53,000 68,000 174,557 28.9 30.6 39.2 2,752,043 2017* 56,000 58,000 79,000 181,490 30.9 32.1 43.4 2,892,218
Trends Table 18. Combination Truck Injury Crash Statistics, 1997-2017
*Beginning with data for 2016, the National Highway Traffic Safety Administration (NHTSA) replaced the General Estimates System (GES) with the Crash Report Sampling System (CRSS). Comparisons of 2016 (and later) CRSS estimates with older GES estimates should be performed with caution. Notes: “Persons Injured” includes all nonfatally injured persons in injury and fatal crashes. A combination truck is defined as a truck tractor pulling any number of trailers (including none) or a straight truck pulling at least one trailer. The Federal Highway Administration (FHWA) implemented an enhanced methodology for estimating registered vehicles and vehicle miles traveled (VMT) by vehicle type beginning with data from 2007. As a result, involvement rates may differ, and in some cases significantly, from earlier years. The rates displayed in this table are based on unrounded GES and CRSS data. Sources: VMT and Registered Vehicles: FHWA, Highway Statistics 2017. Injury Crashes, Vehicles Involved, and Persons Injured: NHTSA, GES (1997-2015) and CRSS (2016-2017).
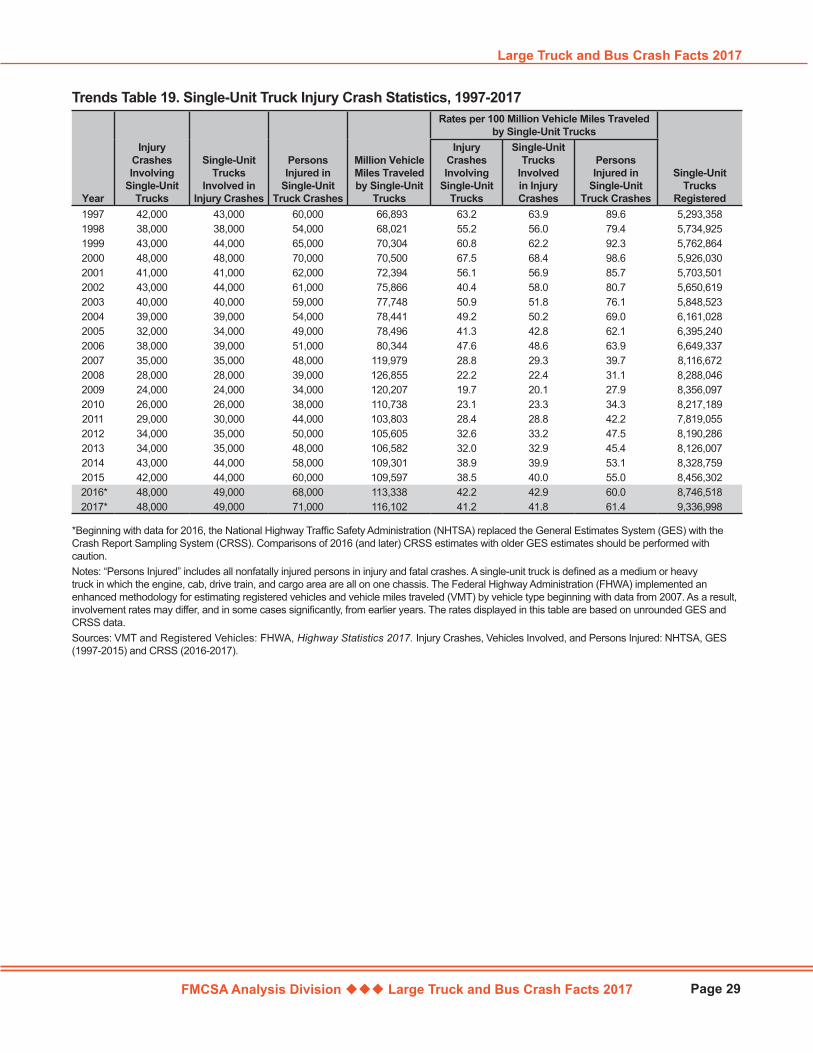
FMCSA Analysis Division Large Truck and Bus Crash Facts 2017
Large Truck and Bus Crash Facts 2017
Page 29
Year
Injury Crashes Involving
Single-Unit Trucks
Single-Unit Trucks
Involved in Injury Crashes
Persons Injured in
Single-Unit Truck Crashes
Million Vehicle Miles Traveled by Single-Unit
Trucks
Rates per 100 Million Vehicle Miles Traveled by Single-Unit Trucks
Single-Unit Trucks
Registered
Injury Crashes Involving
Single-Unit Trucks
Single-Unit Trucks
Involved in Injury Crashes
Persons Injured in
Single-Unit Truck Crashes
1997 42,000 43,000 60,000 66,893 63.2 63.9 89.6 5,293,3581998 38,000 38,000 54,000 68,021 55.2 56.0 79.4 5,734,9251999 43,000 44,000 65,000 70,304 60.8 62.2 92.3 5,762,8642000 48,000 48,000 70,000 70,500 67.5 68.4 98.6 5,926,0302001 41,000 41,000 62,000 72,394 56.1 56.9 85.7 5,703,5012002 43,000 44,000 61,000 75,866 40.4 58.0 80.7 5,650,6192003 40,000 40,000 59,000 77,748 50.9 51.8 76.1 5,848,5232004 39,000 39,000 54,000 78,441 49.2 50.2 69.0 6,161,0282005 32,000 34,000 49,000 78,496 41.3 42.8 62.1 6,395,2402006 38,000 39,000 51,000 80,344 47.6 48.6 63.9 6,649,3372007 35,000 35,000 48,000 119,979 28.8 29.3 39.7 8,116,6722008 28,000 28,000 39,000 126,855 22.2 22.4 31.1 8,288,0462009 24,000 24,000 34,000 120,207 19.7 20.1 27.9 8,356,0972010 26,000 26,000 38,000 110,738 23.1 23.3 34.3 8,217,1892011 29,000 30,000 44,000 103,803 28.4 28.8 42.2 7,819,0552012 34,000 35,000 50,000 105,605 32.6 33.2 47.5 8,190,2862013 34,000 35,000 48,000 106,582 32.0 32.9 45.4 8,126,0072014 43,000 44,000 58,000 109,301 38.9 39.9 53.1 8,328,7592015 42,000 44,000 60,000 109,597 38.5 40.0 55.0 8,456,302
2016* 48,000 49,000 68,000 113,338 42.2 42.9 60.0 8,746,518 2017* 48,000 49,000 71,000 116,102 41.2 41.8 61.4 9,336,998
Trends Table 19. Single-Unit Truck Injury Crash Statistics, 1997-2017
*Beginning with data for 2016, the National Highway Traffic Safety Administration (NHTSA) replaced the General Estimates System (GES) with the Crash Report Sampling System (CRSS). Comparisons of 2016 (and later) CRSS estimates with older GES estimates should be performed with caution. Notes: “Persons Injured” includes all nonfatally injured persons in injury and fatal crashes. A single-unit truck is defined as a medium or heavy truck in which the engine, cab, drive train, and cargo area are all on one chassis. The Federal Highway Administration (FHWA) implemented an enhanced methodology for estimating registered vehicles and vehicle miles traveled (VMT) by vehicle type beginning with data from 2007. As a result, involvement rates may differ, and in some cases significantly, from earlier years. The rates displayed in this table are based on unrounded GES and CRSS data. Sources: VMT and Registered Vehicles: FHWA, Highway Statistics 2017. Injury Crashes, Vehicles Involved, and Persons Injured: NHTSA, GES (1997-2015) and CRSS (2016-2017).
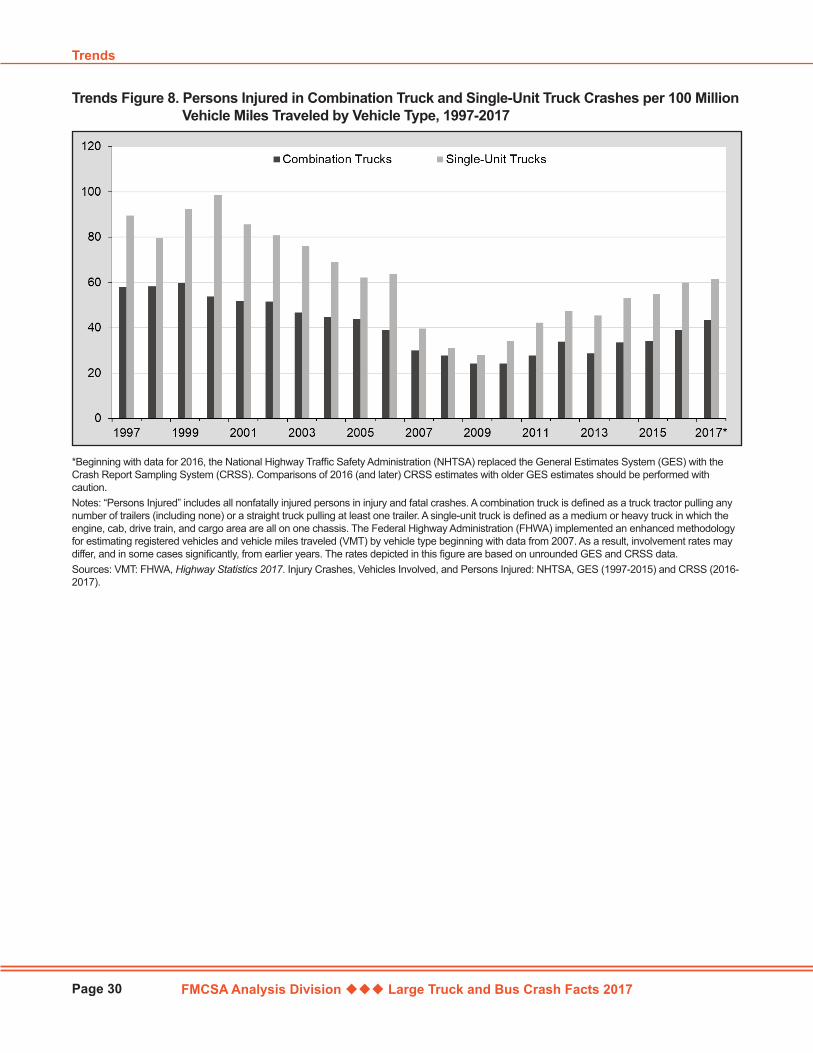
FMCSA Analysis Division Large Truck and Bus Crash Facts 2017
Trends
Page 30
Trends Figure 8. Persons Injured in Combination Truck and Single-Unit Truck Crashes per 100 Million Vehicle Miles Traveled by Vehicle Type, 1997-2017
*Beginning with data for 2016, the National Highway Traffic Safety Administration (NHTSA) replaced the General Estimates System (GES) with the Crash Report Sampling System (CRSS). Comparisons of 2016 (and later) CRSS estimates with older GES estimates should be performed with caution. Notes: “Persons Injured” includes all nonfatally injured persons in injury and fatal crashes. A combination truck is defined as a truck tractor pulling any number of trailers (including none) or a straight truck pulling at least one trailer. A single-unit truck is defined as a medium or heavy truck in which the engine, cab, drive train, and cargo area are all on one chassis. The Federal Highway Administration (FHWA) implemented an enhanced methodology for estimating registered vehicles and vehicle miles traveled (VMT) by vehicle type beginning with data from 2007. As a result, involvement rates may differ, and in some cases significantly, from earlier years. The rates depicted in this figure are based on unrounded GES and CRSS data.Sources: VMT: FHWA, Highway Statistics 2017. Injury Crashes, Vehicles Involved, and Persons Injured: NHTSA, GES (1997-2015) and CRSS (2016-2017).
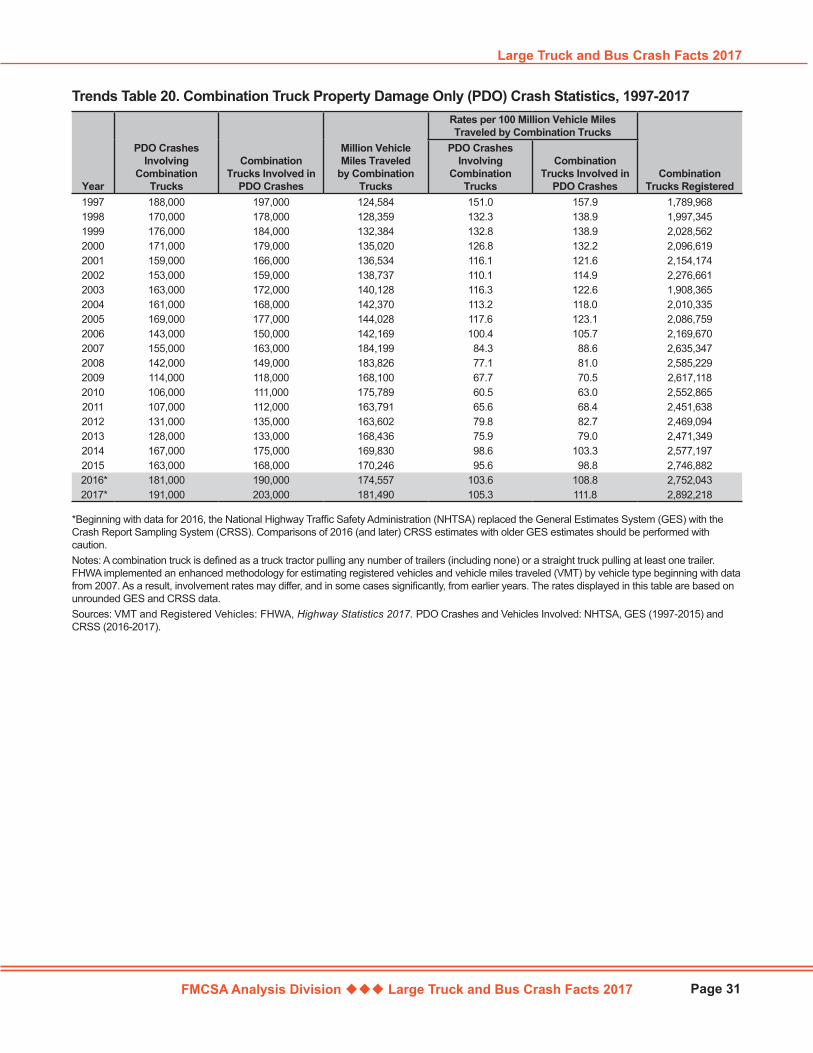
FMCSA Analysis Division Large Truck and Bus Crash Facts 2017
Large Truck and Bus Crash Facts 2017
Page 31
Year
PDO Crashes Involving
Combination Trucks
Combination Trucks Involved in
PDO Crashes
Million Vehicle Miles Traveled
by Combination Trucks
Rates per 100 Million Vehicle Miles Traveled by Combination Trucks
Combination Trucks Registered
PDO Crashes Involving
Combination Trucks
Combination Trucks Involved in
PDO Crashes1997 188,000 197,000 124,584 151.0 157.9 1,789,9681998 170,000 178,000 128,359 132.3 138.9 1,997,3451999 176,000 184,000 132,384 132.8 138.9 2,028,5622000 171,000 179,000 135,020 126.8 132.2 2,096,6192001 159,000 166,000 136,534 116.1 121.6 2,154,1742002 153,000 159,000 138,737 110.1 114.9 2,276,6612003 163,000 172,000 140,128 116.3 122.6 1,908,3652004 161,000 168,000 142,370 113.2 118.0 2,010,3352005 169,000 177,000 144,028 117.6 123.1 2,086,7592006 143,000 150,000 142,169 100.4 105.7 2,169,6702007 155,000 163,000 184,199 84.3 88.6 2,635,3472008 142,000 149,000 183,826 77.1 81.0 2,585,2292009 114,000 118,000 168,100 67.7 70.5 2,617,1182010 106,000 111,000 175,789 60.5 63.0 2,552,8652011 107,000 112,000 163,791 65.6 68.4 2,451,6382012 131,000 135,000 163,602 79.8 82.7 2,469,0942013 128,000 133,000 168,436 75.9 79.0 2,471,3492014 167,000 175,000 169,830 98.6 103.3 2,577,1972015 163,000 168,000 170,246 95.6 98.8 2,746,882
2016* 181,000 190,000 174,557 103.6 108.8 2,752,043 2017* 191,000 203,000 181,490 105.3 111.8 2,892,218
Trends Table 20. Combination Truck Property Damage Only (PDO) Crash Statistics, 1997-2017
*Beginning with data for 2016, the National Highway Traffic Safety Administration (NHTSA) replaced the General Estimates System (GES) with the Crash Report Sampling System (CRSS). Comparisons of 2016 (and later) CRSS estimates with older GES estimates should be performed with caution. Notes: A combination truck is defined as a truck tractor pulling any number of trailers (including none) or a straight truck pulling at least one trailer. FHWA implemented an enhanced methodology for estimating registered vehicles and vehicle miles traveled (VMT) by vehicle type beginning with data from 2007. As a result, involvement rates may differ, and in some cases significantly, from earlier years. The rates displayed in this table are based on unrounded GES and CRSS data.Sources: VMT and Registered Vehicles: FHWA, Highway Statistics 2017. PDO Crashes and Vehicles Involved: NHTSA, GES (1997-2015) and CRSS (2016-2017).
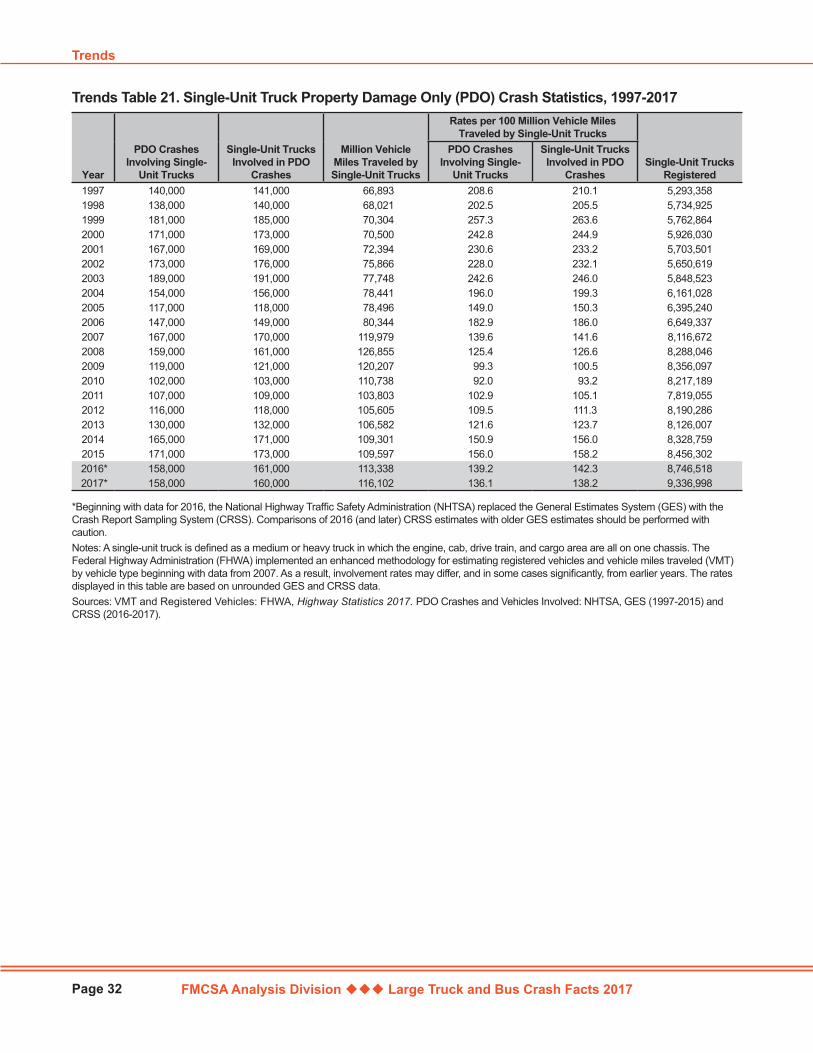
FMCSA Analysis Division Large Truck and Bus Crash Facts 2017
Trends
Page 32
Year
PDO Crashes Involving Single-
Unit Trucks
Single-Unit Trucks Involved in PDO
Crashes
Million Vehicle Miles Traveled by Single-Unit Trucks
Rates per 100 Million Vehicle Miles Traveled by Single-Unit Trucks
Single-Unit Trucks Registered
PDO Crashes Involving Single-
Unit Trucks
Single-Unit Trucks Involved in PDO
Crashes1997 140,000 141,000 66,893 208.6 210.1 5,293,3581998 138,000 140,000 68,021 202.5 205.5 5,734,9251999 181,000 185,000 70,304 257.3 263.6 5,762,8642000 171,000 173,000 70,500 242.8 244.9 5,926,0302001 167,000 169,000 72,394 230.6 233.2 5,703,5012002 173,000 176,000 75,866 228.0 232.1 5,650,6192003 189,000 191,000 77,748 242.6 246.0 5,848,5232004 154,000 156,000 78,441 196.0 199.3 6,161,0282005 117,000 118,000 78,496 149.0 150.3 6,395,2402006 147,000 149,000 80,344 182.9 186.0 6,649,3372007 167,000 170,000 119,979 139.6 141.6 8,116,6722008 159,000 161,000 126,855 125.4 126.6 8,288,0462009 119,000 121,000 120,207 99.3 100.5 8,356,0972010 102,000 103,000 110,738 92.0 93.2 8,217,1892011 107,000 109,000 103,803 102.9 105.1 7,819,0552012 116,000 118,000 105,605 109.5 111.3 8,190,2862013 130,000 132,000 106,582 121.6 123.7 8,126,0072014 165,000 171,000 109,301 150.9 156.0 8,328,7592015 171,000 173,000 109,597 156.0 158.2 8,456,302
2016* 158,000 161,000 113,338 139.2 142.3 8,746,518 2017* 158,000 160,000 116,102 136.1 138.2 9,336,998
Trends Table 21. Single-Unit Truck Property Damage Only (PDO) Crash Statistics, 1997-2017
*Beginning with data for 2016, the National Highway Traffic Safety Administration (NHTSA) replaced the General Estimates System (GES) with the Crash Report Sampling System (CRSS). Comparisons of 2016 (and later) CRSS estimates with older GES estimates should be performed with caution. Notes: A single-unit truck is defined as a medium or heavy truck in which the engine, cab, drive train, and cargo area are all on one chassis. The Federal Highway Administration (FHWA) implemented an enhanced methodology for estimating registered vehicles and vehicle miles traveled (VMT) by vehicle type beginning with data from 2007. As a result, involvement rates may differ, and in some cases significantly, from earlier years. The rates displayed in this table are based on unrounded GES and CRSS data. Sources: VMT and Registered Vehicles: FHWA, Highway Statistics 2017. PDO Crashes and Vehicles Involved: NHTSA, GES (1997-2015) and CRSS (2016-2017).
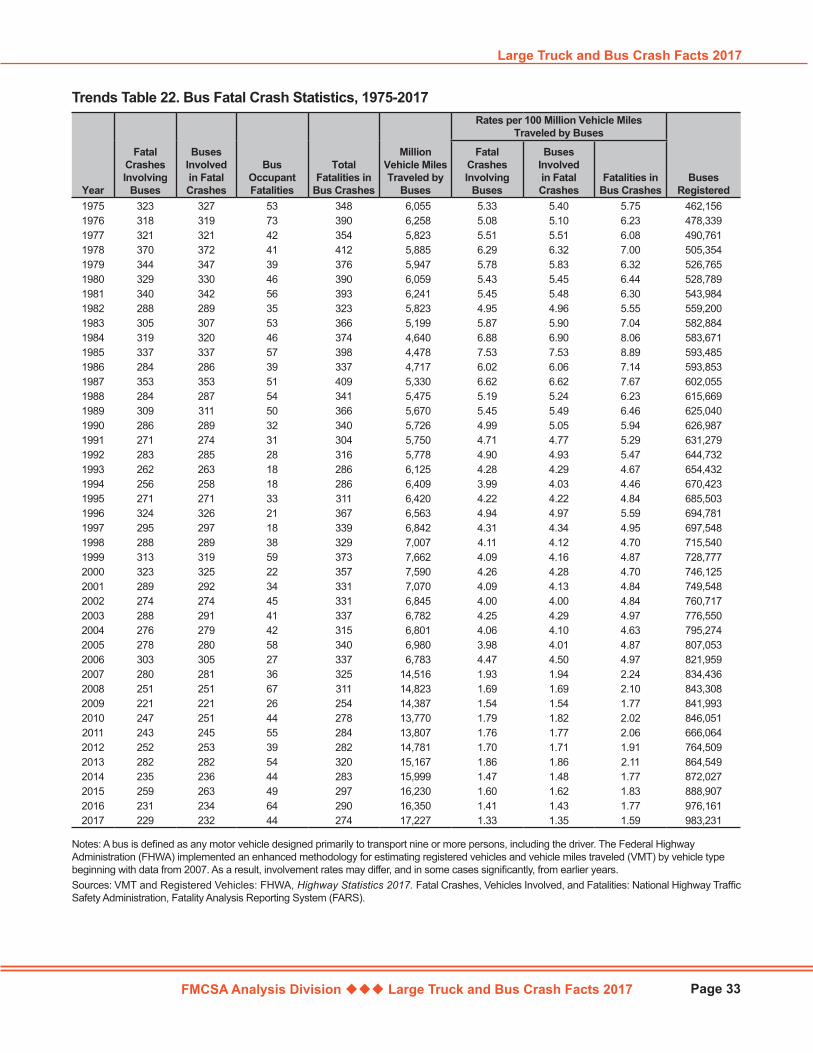
FMCSA Analysis Division Large Truck and Bus Crash Facts 2017
Large Truck and Bus Crash Facts 2017
Page 33
Year
Fatal Crashes Involving
Buses
Buses Involved in Fatal Crashes
Bus Occupant Fatalities
Total Fatalities in
Bus Crashes
Million Vehicle Miles Traveled by
Buses
Rates per 100 Million Vehicle Miles Traveled by Buses
Buses Registered
Fatal Crashes Involving
Buses
Buses Involved in Fatal Crashes
Fatalities in Bus Crashes
1975 323 327 53 348 6,055 5.33 5.40 5.75 462,1561976 318 319 73 390 6,258 5.08 5.10 6.23 478,3391977 321 321 42 354 5,823 5.51 5.51 6.08 490,7611978 370 372 41 412 5,885 6.29 6.32 7.00 505,3541979 344 347 39 376 5,947 5.78 5.83 6.32 526,7651980 329 330 46 390 6,059 5.43 5.45 6.44 528,7891981 340 342 56 393 6,241 5.45 5.48 6.30 543,9841982 288 289 35 323 5,823 4.95 4.96 5.55 559,2001983 305 307 53 366 5,199 5.87 5.90 7.04 582,8841984 319 320 46 374 4,640 6.88 6.90 8.06 583,6711985 337 337 57 398 4,478 7.53 7.53 8.89 593,4851986 284 286 39 337 4,717 6.02 6.06 7.14 593,8531987 353 353 51 409 5,330 6.62 6.62 7.67 602,0551988 284 287 54 341 5,475 5.19 5.24 6.23 615,6691989 309 311 50 366 5,670 5.45 5.49 6.46 625,0401990 286 289 32 340 5,726 4.99 5.05 5.94 626,9871991 271 274 31 304 5,750 4.71 4.77 5.29 631,2791992 283 285 28 316 5,778 4.90 4.93 5.47 644,7321993 262 263 18 286 6,125 4.28 4.29 4.67 654,4321994 256 258 18 286 6,409 3.99 4.03 4.46 670,4231995 271 271 33 311 6,420 4.22 4.22 4.84 685,5031996 324 326 21 367 6,563 4.94 4.97 5.59 694,7811997 295 297 18 339 6,842 4.31 4.34 4.95 697,5481998 288 289 38 329 7,007 4.11 4.12 4.70 715,5401999 313 319 59 373 7,662 4.09 4.16 4.87 728,7772000 323 325 22 357 7,590 4.26 4.28 4.70 746,1252001 289 292 34 331 7,070 4.09 4.13 4.84 749,5482002 274 274 45 331 6,845 4.00 4.00 4.84 760,7172003 288 291 41 337 6,782 4.25 4.29 4.97 776,5502004 276 279 42 315 6,801 4.06 4.10 4.63 795,2742005 278 280 58 340 6,980 3.98 4.01 4.87 807,0532006 303 305 27 337 6,783 4.47 4.50 4.97 821,9592007 280 281 36 325 14,516 1.93 1.94 2.24 834,4362008 251 251 67 311 14,823 1.69 1.69 2.10 843,3082009 221 221 26 254 14,387 1.54 1.54 1.77 841,9932010 247 251 44 278 13,770 1.79 1.82 2.02 846,0512011 243 245 55 284 13,807 1.76 1.77 2.06 666,0642012 252 253 39 282 14,781 1.70 1.71 1.91 764,5092013 282 282 54 320 15,167 1.86 1.86 2.11 864,5492014 235 236 44 283 15,999 1.47 1.48 1.77 872,0272015 259 263 49 297 16,230 1.60 1.62 1.83 888,9072016 231 234 64 290 16,350 1.41 1.43 1.77 976,1612017 229 232 44 274 17,227 1.33 1.35 1.59 983,231
Trends Table 22. Bus Fatal Crash Statistics, 1975-2017
Notes: A bus is defined as any motor vehicle designed primarily to transport nine or more persons, including the driver. The Federal Highway Administration (FHWA) implemented an enhanced methodology for estimating registered vehicles and vehicle miles traveled (VMT) by vehicle type beginning with data from 2007. As a result, involvement rates may differ, and in some cases significantly, from earlier years.Sources: VMT and Registered Vehicles: FHWA, Highway Statistics 2017. Fatal Crashes, Vehicles Involved, and Fatalities: National Highway Traffic Safety Administration, Fatality Analysis Reporting System (FARS).
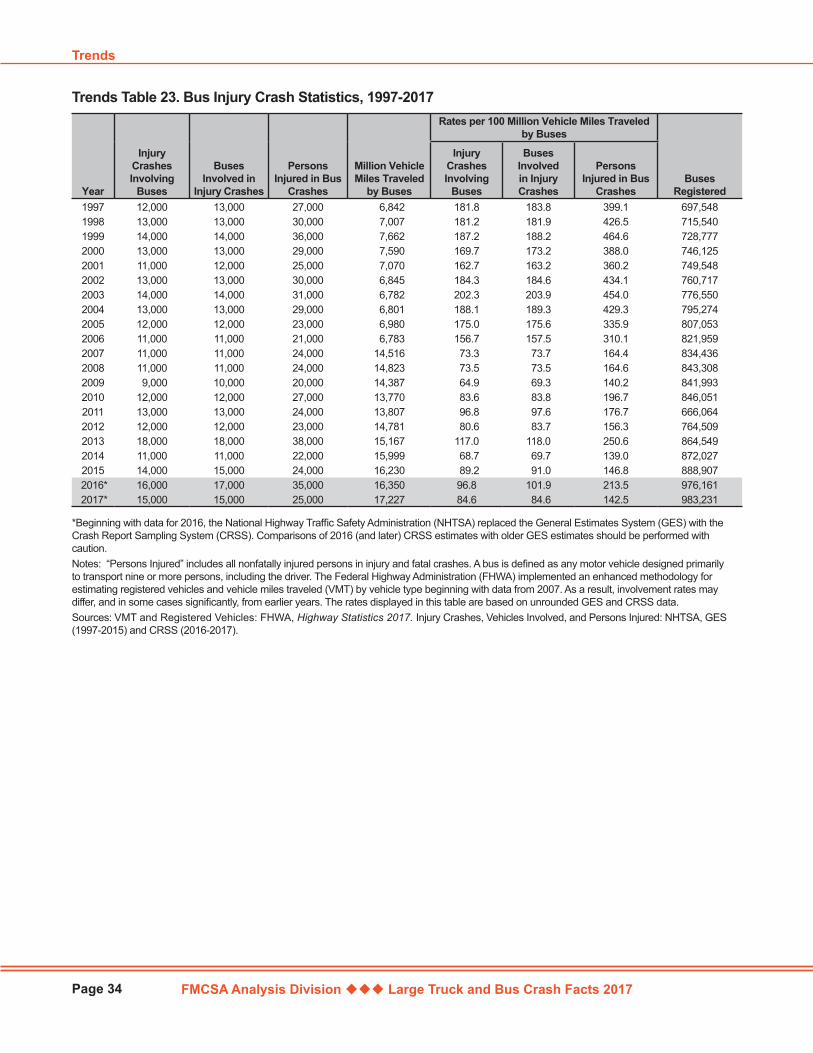
FMCSA Analysis Division Large Truck and Bus Crash Facts 2017
Trends
Page 34
Year
Injury Crashes Involving
Buses
Buses Involved in
Injury Crashes
Persons Injured in Bus
Crashes
Million Vehicle Miles Traveled
by Buses
Rates per 100 Million Vehicle Miles Traveled by Buses
Buses Registered
Injury Crashes Involving
Buses
Buses Involved in Injury Crashes
Persons Injured in Bus
Crashes1997 12,000 13,000 27,000 6,842 181.8 183.8 399.1 697,5481998 13,000 13,000 30,000 7,007 181.2 181.9 426.5 715,5401999 14,000 14,000 36,000 7,662 187.2 188.2 464.6 728,7772000 13,000 13,000 29,000 7,590 169.7 173.2 388.0 746,1252001 11,000 12,000 25,000 7,070 162.7 163.2 360.2 749,5482002 13,000 13,000 30,000 6,845 184.3 184.6 434.1 760,7172003 14,000 14,000 31,000 6,782 202.3 203.9 454.0 776,5502004 13,000 13,000 29,000 6,801 188.1 189.3 429.3 795,2742005 12,000 12,000 23,000 6,980 175.0 175.6 335.9 807,0532006 11,000 11,000 21,000 6,783 156.7 157.5 310.1 821,9592007 11,000 11,000 24,000 14,516 73.3 73.7 164.4 834,4362008 11,000 11,000 24,000 14,823 73.5 73.5 164.6 843,3082009 9,000 10,000 20,000 14,387 64.9 69.3 140.2 841,9932010 12,000 12,000 27,000 13,770 83.6 83.8 196.7 846,0512011 13,000 13,000 24,000 13,807 96.8 97.6 176.7 666,0642012 12,000 12,000 23,000 14,781 80.6 83.7 156.3 764,5092013 18,000 18,000 38,000 15,167 117.0 118.0 250.6 864,5492014 11,000 11,000 22,000 15,999 68.7 69.7 139.0 872,0272015 14,000 15,000 24,000 16,230 89.2 91.0 146.8 888,907
2016* 16,000 17,000 35,000 16,350 96.8 101.9 213.5 976,161 2017* 15,000 15,000 25,000 17,227 84.6 84.6 142.5 983,231
Trends Table 23. Bus Injury Crash Statistics, 1997-2017
*Beginning with data for 2016, the National Highway Traffic Safety Administration (NHTSA) replaced the General Estimates System (GES) with the Crash Report Sampling System (CRSS). Comparisons of 2016 (and later) CRSS estimates with older GES estimates should be performed with caution. Notes: “Persons Injured” includes all nonfatally injured persons in injury and fatal crashes. A bus is defined as any motor vehicle designed primarily to transport nine or more persons, including the driver. The Federal Highway Administration (FHWA) implemented an enhanced methodology for estimating registered vehicles and vehicle miles traveled (VMT) by vehicle type beginning with data from 2007. As a result, involvement rates may differ, and in some cases significantly, from earlier years. The rates displayed in this table are based on unrounded GES and CRSS data. Sources: VMT and Registered Vehicles: FHWA, Highway Statistics 2017. Injury Crashes, Vehicles Involved, and Persons Injured: NHTSA, GES (1997-2015) and CRSS (2016-2017).
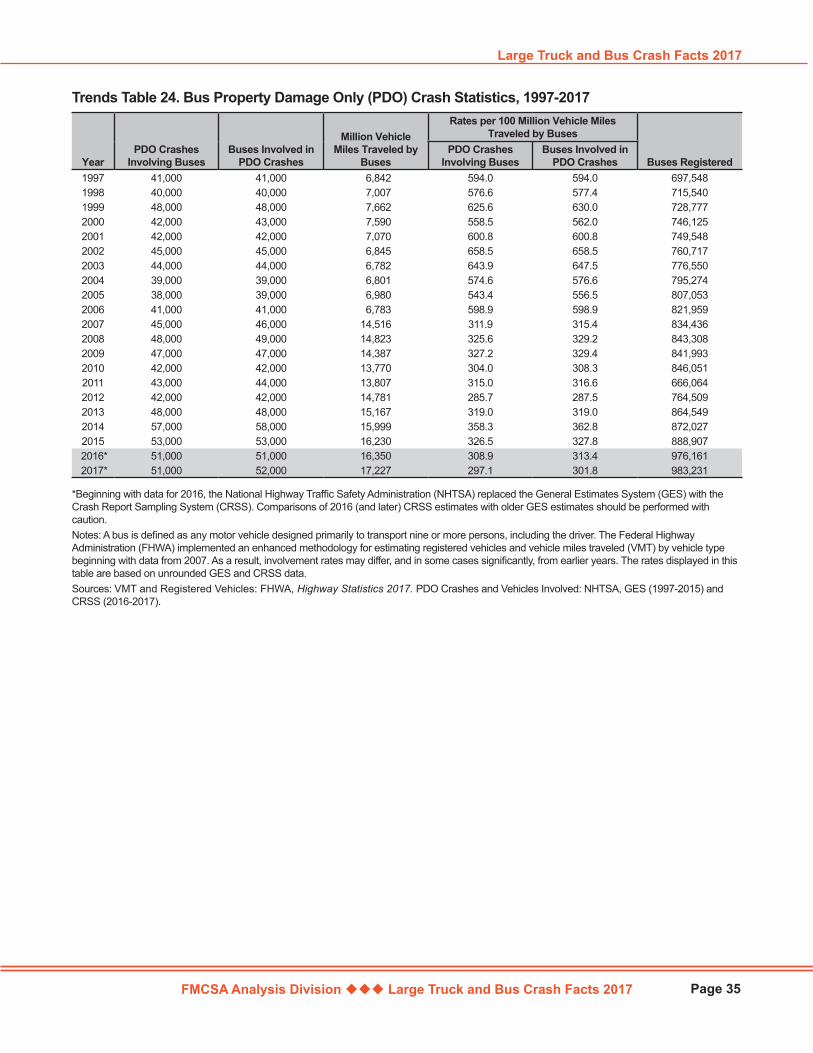
FMCSA Analysis Division Large Truck and Bus Crash Facts 2017
Large Truck and Bus Crash Facts 2017
Page 35
YearPDO Crashes
Involving BusesBuses Involved in
PDO Crashes
Million Vehicle Miles Traveled by
Buses
Rates per 100 Million Vehicle Miles Traveled by Buses
Buses RegisteredPDO Crashes
Involving BusesBuses Involved in
PDO Crashes1997 41,000 41,000 6,842 594.0 594.0 697,5481998 40,000 40,000 7,007 576.6 577.4 715,5401999 48,000 48,000 7,662 625.6 630.0 728,7772000 42,000 43,000 7,590 558.5 562.0 746,1252001 42,000 42,000 7,070 600.8 600.8 749,5482002 45,000 45,000 6,845 658.5 658.5 760,7172003 44,000 44,000 6,782 643.9 647.5 776,5502004 39,000 39,000 6,801 574.6 576.6 795,2742005 38,000 39,000 6,980 543.4 556.5 807,0532006 41,000 41,000 6,783 598.9 598.9 821,9592007 45,000 46,000 14,516 311.9 315.4 834,4362008 48,000 49,000 14,823 325.6 329.2 843,3082009 47,000 47,000 14,387 327.2 329.4 841,9932010 42,000 42,000 13,770 304.0 308.3 846,0512011 43,000 44,000 13,807 315.0 316.6 666,0642012 42,000 42,000 14,781 285.7 287.5 764,5092013 48,000 48,000 15,167 319.0 319.0 864,5492014 57,000 58,000 15,999 358.3 362.8 872,0272015 53,000 53,000 16,230 326.5 327.8 888,907
2016* 51,000 51,000 16,350 308.9 313.4 976,161 2017* 51,000 52,000 17,227 297.1 301.8 983,231
Trends Table 24. Bus Property Damage Only (PDO) Crash Statistics, 1997-2017
*Beginning with data for 2016, the National Highway Traffic Safety Administration (NHTSA) replaced the General Estimates System (GES) with the Crash Report Sampling System (CRSS). Comparisons of 2016 (and later) CRSS estimates with older GES estimates should be performed with caution. Notes: A bus is defined as any motor vehicle designed primarily to transport nine or more persons, including the driver. The Federal Highway Administration (FHWA) implemented an enhanced methodology for estimating registered vehicles and vehicle miles traveled (VMT) by vehicle type beginning with data from 2007. As a result, involvement rates may differ, and in some cases significantly, from earlier years. The rates displayed in this table are based on unrounded GES and CRSS data. Sources: VMT and Registered Vehicles: FHWA, Highway Statistics 2017. PDO Crashes and Vehicles Involved: NHTSA, GES (1997-2015) and CRSS (2016-2017).
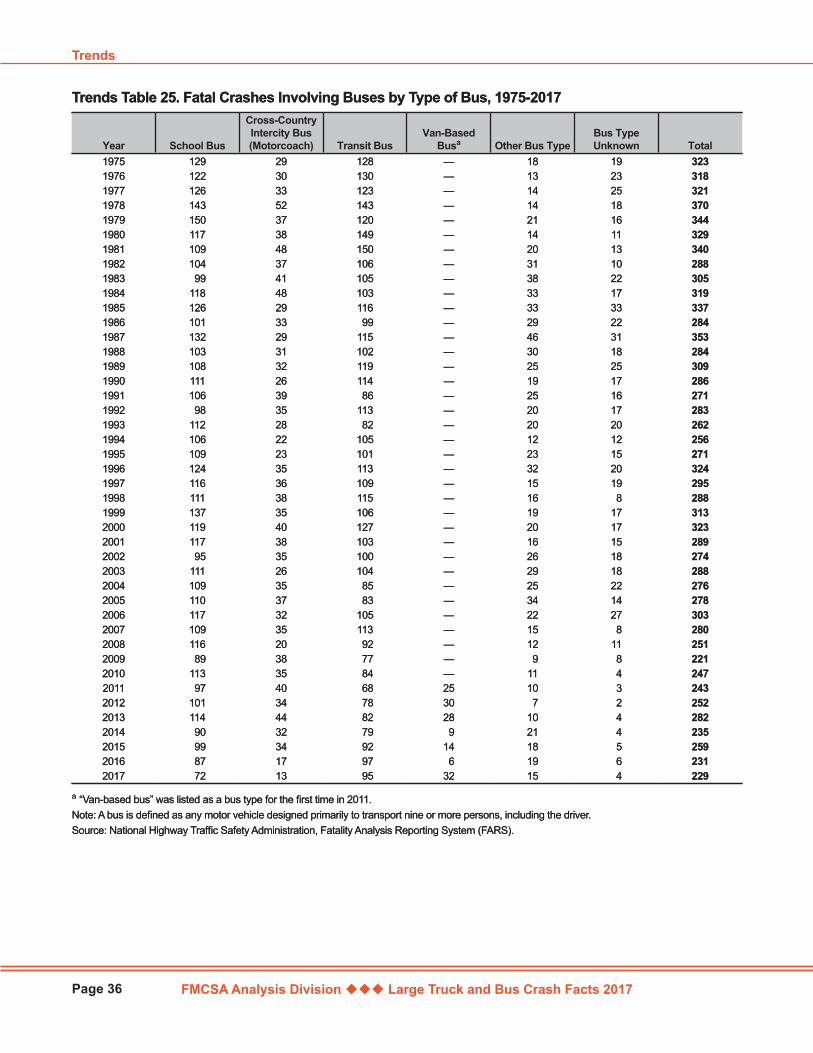
FMCSA Analysis Division Large Truck and Bus Crash Facts 2017
Trends
Page 36
Year School Bus
Cross-Country Intercity Bus (Motorcoach) Transit Bus
Van-Based Busa Other Bus Type
Bus Type Unknown Total
1975 129 29 128 — 18 19 3231976 122 30 130 — 13 23 3181977 126 33 123 — 14 25 3211978 143 52 143 — 14 18 3701979 150 37 120 — 21 16 3441980 117 38 149 — 14 11 3291981 109 48 150 — 20 13 3401982 104 37 106 — 31 10 2881983 99 41 105 — 38 22 3051984 118 48 103 — 33 17 3191985 126 29 116 — 33 33 3371986 101 33 99 — 29 22 2841987 132 29 115 — 46 31 3531988 103 31 102 — 30 18 2841989 108 32 119 — 25 25 3091990 111 26 114 — 19 17 2861991 106 39 86 — 25 16 2711992 98 35 113 — 20 17 2831993 112 28 82 — 20 20 2621994 106 22 105 — 12 12 2561995 109 23 101 — 23 15 2711996 124 35 113 — 32 20 3241997 116 36 109 — 15 19 2951998 111 38 115 — 16 8 2881999 137 35 106 — 19 17 3132000 119 40 127 — 20 17 3232001 117 38 103 — 16 15 2892002 95 35 100 — 26 18 2742003 111 26 104 — 29 18 2882004 109 35 85 — 25 22 2762005 110 37 83 — 34 14 2782006 117 32 105 — 22 27 3032007 109 35 113 — 15 8 2802008 116 20 92 — 12 11 2512009 89 38 77 — 9 8 2212010 113 35 84 — 11 4 2472011 97 40 68 25 10 3 2432012 101 34 78 30 7 2 2522013 114 44 82 28 10 4 2822014 90 32 79 9 21 4 2352015 99 34 92 14 18 5 2592016 87 17 97 6 19 6 2312017 72 13 95 32 15 4 229
Trends Table 25. Fatal Crashes Involving Buses by Type of Bus, 1975-2017
a “Van-based bus” was listed as a bus type for the first time in 2011.Note: A bus is defined as any motor vehicle designed primarily to transport nine or more persons, including the driver.Source: National Highway Traffic Safety Administration, Fatality Analysis Reporting System (FARS).
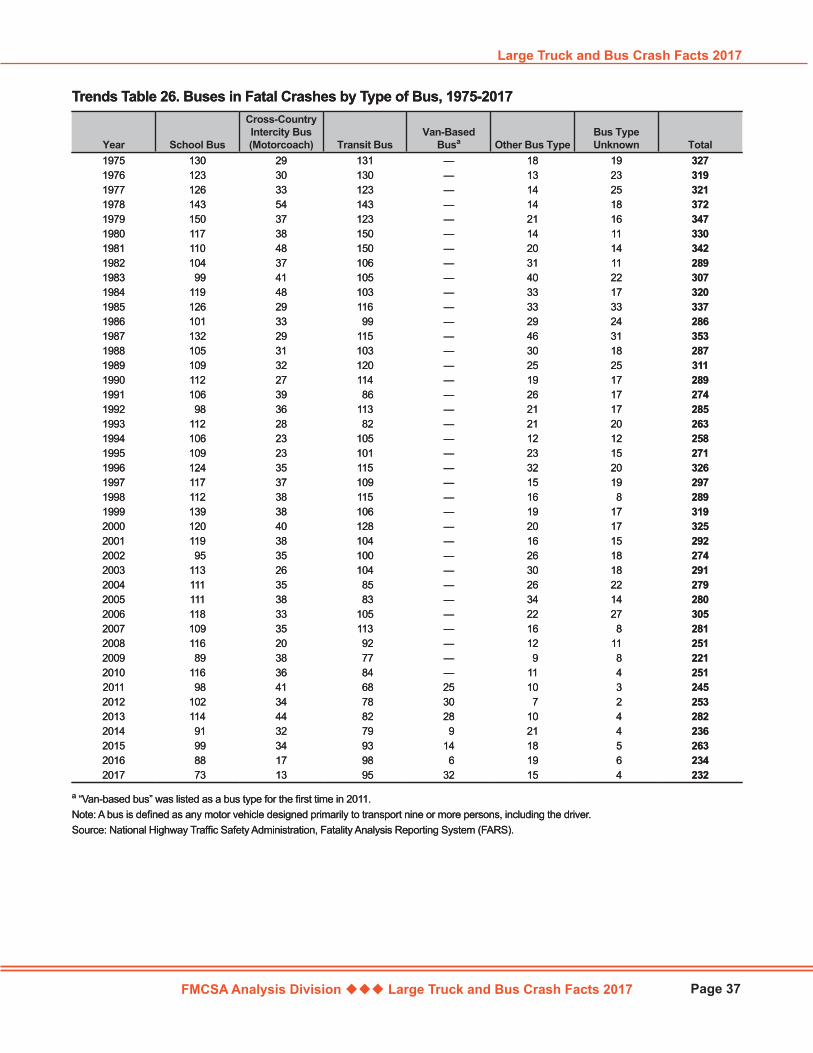
FMCSA Analysis Division Large Truck and Bus Crash Facts 2017
Large Truck and Bus Crash Facts 2017
Page 37
Year School Bus
Cross-Country Intercity Bus (Motorcoach) Transit Bus
Van-Based Busa Other Bus Type
Bus Type Unknown Total
1975 130 29 131 — 18 19 3271976 123 30 130 — 13 23 3191977 126 33 123 — 14 25 3211978 143 54 143 — 14 18 3721979 150 37 123 — 21 16 3471980 117 38 150 — 14 11 3301981 110 48 150 — 20 14 3421982 104 37 106 — 31 11 2891983 99 41 105 — 40 22 3071984 119 48 103 — 33 17 3201985 126 29 116 — 33 33 3371986 101 33 99 — 29 24 2861987 132 29 115 — 46 31 3531988 105 31 103 — 30 18 2871989 109 32 120 — 25 25 3111990 112 27 114 — 19 17 2891991 106 39 86 — 26 17 2741992 98 36 113 — 21 17 2851993 112 28 82 — 21 20 2631994 106 23 105 — 12 12 2581995 109 23 101 — 23 15 2711996 124 35 115 — 32 20 3261997 117 37 109 — 15 19 2971998 112 38 115 — 16 8 2891999 139 38 106 — 19 17 3192000 120 40 128 — 20 17 3252001 119 38 104 — 16 15 2922002 95 35 100 — 26 18 2742003 113 26 104 — 30 18 2912004 111 35 85 — 26 22 2792005 111 38 83 — 34 14 2802006 118 33 105 — 22 27 3052007 109 35 113 — 16 8 2812008 116 20 92 — 12 11 2512009 89 38 77 — 9 8 2212010 116 36 84 — 11 4 2512011 98 41 68 25 10 3 2452012 102 34 78 30 7 2 2532013 114 44 82 28 10 4 2822014 91 32 79 9 21 4 2362015 99 34 93 14 18 5 2632016 88 17 98 6 19 6 2342017 73 13 95 32 15 4 232
Trends Table 26. Buses in Fatal Crashes by Type of Bus, 1975-2017
a “Van-based bus” was listed as a bus type for the first time in 2011.Note: A bus is defined as any motor vehicle designed primarily to transport nine or more persons, including the driver.Source: National Highway Traffic Safety Administration, Fatality Analysis Reporting System (FARS).
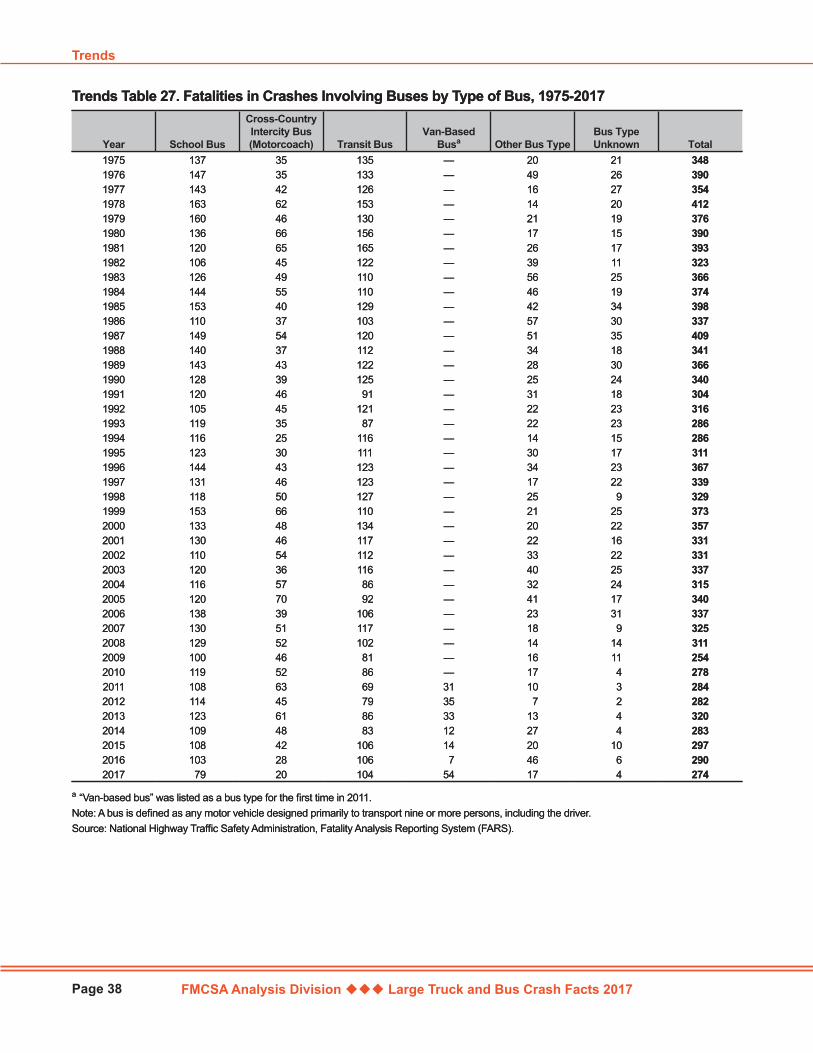
FMCSA Analysis Division Large Truck and Bus Crash Facts 2017
Trends
Page 38
Year School Bus
Cross-Country Intercity Bus (Motorcoach) Transit Bus
Van-Based Busa Other Bus Type
Bus Type Unknown Total
1975 137 35 135 — 20 21 3481976 147 35 133 — 49 26 3901977 143 42 126 — 16 27 3541978 163 62 153 — 14 20 4121979 160 46 130 — 21 19 3761980 136 66 156 — 17 15 3901981 120 65 165 — 26 17 3931982 106 45 122 — 39 11 3231983 126 49 110 — 56 25 3661984 144 55 110 — 46 19 3741985 153 40 129 — 42 34 3981986 110 37 103 — 57 30 3371987 149 54 120 — 51 35 4091988 140 37 112 — 34 18 3411989 143 43 122 — 28 30 3661990 128 39 125 — 25 24 3401991 120 46 91 — 31 18 3041992 105 45 121 — 22 23 3161993 119 35 87 — 22 23 2861994 116 25 116 — 14 15 2861995 123 30 111 — 30 17 3111996 144 43 123 — 34 23 3671997 131 46 123 — 17 22 3391998 118 50 127 — 25 9 3291999 153 66 110 — 21 25 3732000 133 48 134 — 20 22 3572001 130 46 117 — 22 16 3312002 110 54 112 — 33 22 3312003 120 36 116 — 40 25 3372004 116 57 86 — 32 24 3152005 120 70 92 — 41 17 3402006 138 39 106 — 23 31 3372007 130 51 117 — 18 9 3252008 129 52 102 — 14 14 3112009 100 46 81 — 16 11 2542010 119 52 86 — 17 4 2782011 108 63 69 31 10 3 2842012 114 45 79 35 7 2 2822013 123 61 86 33 13 4 3202014 109 48 83 12 27 4 2832015 108 42 106 14 20 10 2972016 103 28 106 7 46 6 2902017 79 20 104 54 17 4 274
Trends Table 27. Fatalities in Crashes Involving Buses by Type of Bus, 1975-2017
a “Van-based bus” was listed as a bus type for the first time in 2011.Note: A bus is defined as any motor vehicle designed primarily to transport nine or more persons, including the driver.Source: National Highway Traffic Safety Administration, Fatality Analysis Reporting System (FARS).
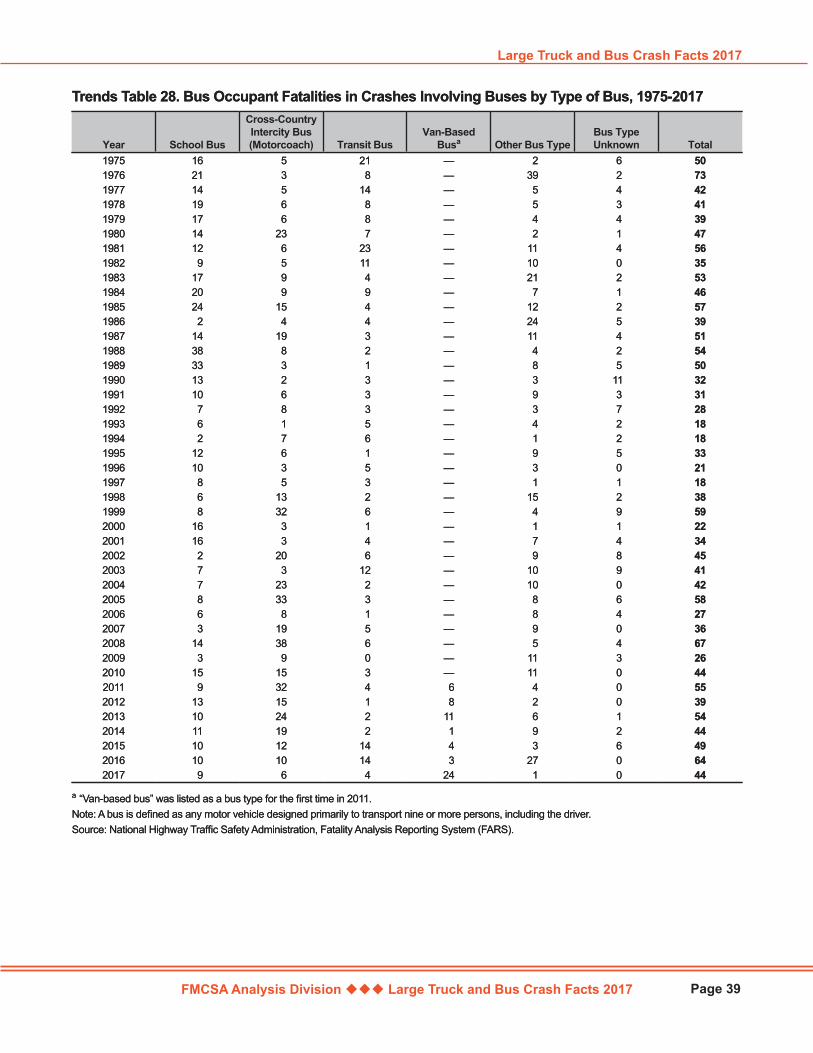
FMCSA Analysis Division Large Truck and Bus Crash Facts 2017
Large Truck and Bus Crash Facts 2017
Page 39
Year School Bus
Cross-Country Intercity Bus (Motorcoach) Transit Bus
Van-Based Busa Other Bus Type
Bus Type Unknown Total
1975 16 5 21 — 2 6 501976 21 3 8 — 39 2 731977 14 5 14 — 5 4 421978 19 6 8 — 5 3 411979 17 6 8 — 4 4 391980 14 23 7 — 2 1 471981 12 6 23 — 11 4 561982 9 5 11 — 10 0 351983 17 9 4 — 21 2 531984 20 9 9 — 7 1 461985 24 15 4 — 12 2 571986 2 4 4 — 24 5 391987 14 19 3 — 11 4 511988 38 8 2 — 4 2 541989 33 3 1 — 8 5 501990 13 2 3 — 3 11 321991 10 6 3 — 9 3 311992 7 8 3 — 3 7 281993 6 1 5 — 4 2 181994 2 7 6 — 1 2 181995 12 6 1 — 9 5 331996 10 3 5 — 3 0 211997 8 5 3 — 1 1 181998 6 13 2 — 15 2 381999 8 32 6 — 4 9 592000 16 3 1 — 1 1 222001 16 3 4 — 7 4 342002 2 20 6 — 9 8 452003 7 3 12 — 10 9 412004 7 23 2 — 10 0 422005 8 33 3 — 8 6 582006 6 8 1 — 8 4 272007 3 19 5 — 9 0 362008 14 38 6 — 5 4 672009 3 9 0 — 11 3 262010 15 15 3 — 11 0 442011 9 32 4 6 4 0 552012 13 15 1 8 2 0 392013 10 24 2 11 6 1 542014 11 19 2 1 9 2 442015 10 12 14 4 3 6 492016 10 10 14 3 27 0 642017 9 6 4 24 1 0 44
Trends Table 28. Bus Occupant Fatalities in Crashes Involving Buses by Type of Bus, 1975-2017
a “Van-based bus” was listed as a bus type for the first time in 2011.Note: A bus is defined as any motor vehicle designed primarily to transport nine or more persons, including the driver.Source: National Highway Traffic Safety Administration, Fatality Analysis Reporting System (FARS).

FMCSA Analysis Division Large Truck and Bus Crash Facts 2017
Trends
Page 40
State 2007 2008 2009 2010 2011 2012 2013 2014 2015 2016 2017Alabama 134 131 80 114 100 107 109 84 101 144 99Alaska 4 5 3 7 0 4 4 5 1 4 5Arizona 98 98 66 65 68 85 63 67 91 83 94Arkansas 114 76 79 83 88 91 83 78 70 69 84California 366 318 275 236 282 261 259 301 305 354 361Colorado 82 68 40 49 51 58 56 63 64 86 87Connecticut 28 24 13 23 14 16 20 21 37 30 23Delaware 6 7 11 9 10 9 10 12 12 9 14District of Columbia 2 1 1 3 2 1 3 5 2 0 0Florida 301 264 181 181 213 213 197 190 225 293 292Georgia 229 180 153 153 174 153 163 155 182 179 214Hawaii 3 6 5 4 3 6 7 4 5 6 9Idaho 27 30 20 15 21 13 34 23 26 34 46Illinois 159 154 146 88 122 122 142 111 103 148 149Indiana 147 137 96 115 136 112 117 128 118 108 138Iowa 71 73 65 88 60 60 61 48 61 70 67Kansas 77 63 59 86 65 64 68 46 65 74 88Kentucky 104 113 112 100 88 82 78 68 81 100 89Louisiana 121 111 83 107 80 108 84 80 79 89 102Maine 21 23 22 14 17 11 18 10 11 20 23Maryland 69 52 50 44 39 66 58 49 58 63 48Massachusetts 28 23 20 19 35 18 31 27 28 27 28Michigan 124 88 67 85 61 73 88 98 75 107 88Minnesota 86 70 59 90 52 60 75 66 64 61 61Mississippi 75 70 61 55 73 51 63 81 72 78 102Missouri 136 124 86 84 101 92 85 100 105 113 111Montana 31 25 24 14 31 11 20 12 20 23 22Nebraska 43 43 43 55 31 44 29 52 40 55 38Nevada 29 22 19 15 35 19 18 17 27 28 37New Hampshire 12 13 8 6 8 6 13 12 6 5 13New Jersey 64 47 69 52 53 60 60 74 50 57 54New Mexico 57 45 36 46 48 42 54 72 46 40 70New York 155 119 107 120 114 100 118 98 126 106 121North Carolina 168 162 128 117 117 127 139 121 129 152 164North Dakota 12 20 31 18 40 48 63 49 47 13 26Ohio 134 143 114 132 117 152 131 130 167 123 164Oklahoma 112 115 94 91 112 124 112 134 106 126 133Oregon 53 37 30 46 50 28 33 32 53 53 54Pennsylvania 194 192 134 164 160 166 155 162 161 165 167Rhode Island 7 2 5 2 1 4 5 2 1 2 8South Carolina 91 85 82 65 89 84 64 63 114 104 90South Dakota 14 14 16 25 12 20 18 21 13 5 21Tennessee 149 95 92 92 108 112 127 110 116 120 136Texas 502 453 318 400 432 573 535 553 567 558 649Utah 39 29 21 35 22 18 20 18 39 20 36Vermont 5 7 6 10 6 5 8 11 8 7 10Virginia 108 81 77 77 76 84 89 90 71 91 98Washington 79 55 31 30 33 45 40 36 40 50 77West Virginia 48 47 34 50 34 45 46 30 22 27 52Wisconsin 85 63 55 56 71 65 83 55 56 69 82Wyoming 24 30 11 27 26 26 25 34 28 21 17Total 4,822 4,245 3,380 3,686 3,781 3,944 3,981 3,908 4,094 4,369 4,761
Trends Table 29. Fatalities in Crashes Involving Large Trucks by State, 2007-2017
Note: A large truck is defined as a truck with a gross vehicle weight rating (GVWR) greater than 10,000 pounds.Source: National Highway Traffic Safety Administration, Fatality Analysis Reporting System (FARS).
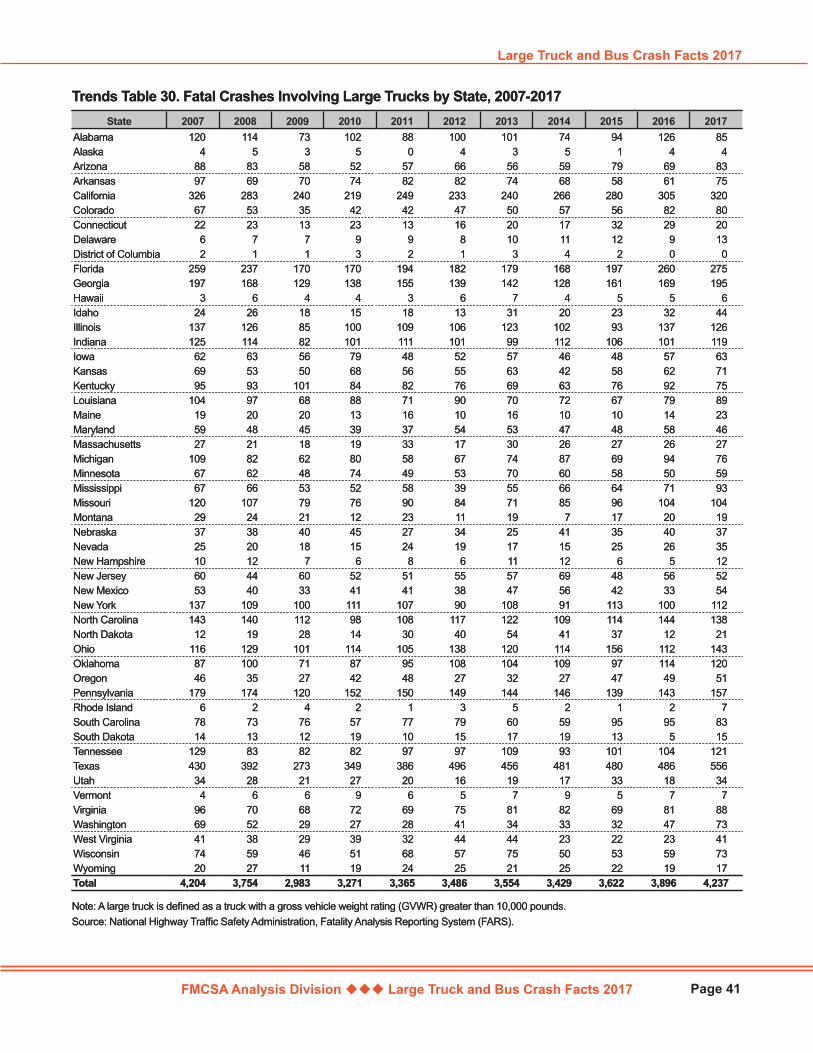
FMCSA Analysis Division Large Truck and Bus Crash Facts 2017
Large Truck and Bus Crash Facts 2017
Page 41
State 2007 2008 2009 2010 2011 2012 2013 2014 2015 2016 2017Alabama 120 114 73 102 88 100 101 74 94 126 85Alaska 4 5 3 5 0 4 3 5 1 4 4Arizona 88 83 58 52 57 66 56 59 79 69 83Arkansas 97 69 70 74 82 82 74 68 58 61 75California 326 283 240 219 249 233 240 266 280 305 320Colorado 67 53 35 42 42 47 50 57 56 82 80Connecticut 22 23 13 23 13 16 20 17 32 29 20Delaware 6 7 7 9 9 8 10 11 12 9 13District of Columbia 2 1 1 3 2 1 3 4 2 0 0Florida 259 237 170 170 194 182 179 168 197 260 275Georgia 197 168 129 138 155 139 142 128 161 169 195Hawaii 3 6 4 4 3 6 7 4 5 5 6Idaho 24 26 18 15 18 13 31 20 23 32 44Illinois 137 126 85 100 109 106 123 102 93 137 126Indiana 125 114 82 101 111 101 99 112 106 101 119Iowa 62 63 56 79 48 52 57 46 48 57 63Kansas 69 53 50 68 56 55 63 42 58 62 71Kentucky 95 93 101 84 82 76 69 63 76 92 75Louisiana 104 97 68 88 71 90 70 72 67 79 89Maine 19 20 20 13 16 10 16 10 10 14 23Maryland 59 48 45 39 37 54 53 47 48 58 46Massachusetts 27 21 18 19 33 17 30 26 27 26 27Michigan 109 82 62 80 58 67 74 87 69 94 76Minnesota 67 62 48 74 49 53 70 60 58 50 59Mississippi 67 66 53 52 58 39 55 66 64 71 93Missouri 120 107 79 76 90 84 71 85 96 104 104Montana 29 24 21 12 23 11 19 7 17 20 19Nebraska 37 38 40 45 27 34 25 41 35 40 37Nevada 25 20 18 15 24 19 17 15 25 26 35New Hampshire 10 12 7 6 8 6 11 12 6 5 12New Jersey 60 44 60 52 51 55 57 69 48 56 52New Mexico 53 40 33 41 41 38 47 56 42 33 54New York 137 109 100 111 107 90 108 91 113 100 112North Carolina 143 140 112 98 108 117 122 109 114 144 138North Dakota 12 19 28 14 30 40 54 41 37 12 21Ohio 116 129 101 114 105 138 120 114 156 112 143Oklahoma 87 100 71 87 95 108 104 109 97 114 120Oregon 46 35 27 42 48 27 32 27 47 49 51Pennsylvania 179 174 120 152 150 149 144 146 139 143 157Rhode Island 6 2 4 2 1 3 5 2 1 2 7South Carolina 78 73 76 57 77 79 60 59 95 95 83South Dakota 14 13 12 19 10 15 17 19 13 5 15Tennessee 129 83 82 82 97 97 109 93 101 104 121Texas 430 392 273 349 386 496 456 481 480 486 556Utah 34 28 21 27 20 16 19 17 33 18 34Vermont 4 6 6 9 6 5 7 9 5 7 7Virginia 96 70 68 72 69 75 81 82 69 81 88Washington 69 52 29 27 28 41 34 33 32 47 73West Virginia 41 38 29 39 32 44 44 23 22 23 41Wisconsin 74 59 46 51 68 57 75 50 53 59 73Wyoming 20 27 11 19 24 25 21 25 22 19 17Total 4,204 3,754 2,983 3,271 3,365 3,486 3,554 3,429 3,622 3,896 4,237
Trends Table 30. Fatal Crashes Involving Large Trucks by State, 2007-2017
Note: A large truck is defined as a truck with a gross vehicle weight rating (GVWR) greater than 10,000 pounds.Source: National Highway Traffic Safety Administration, Fatality Analysis Reporting System (FARS).
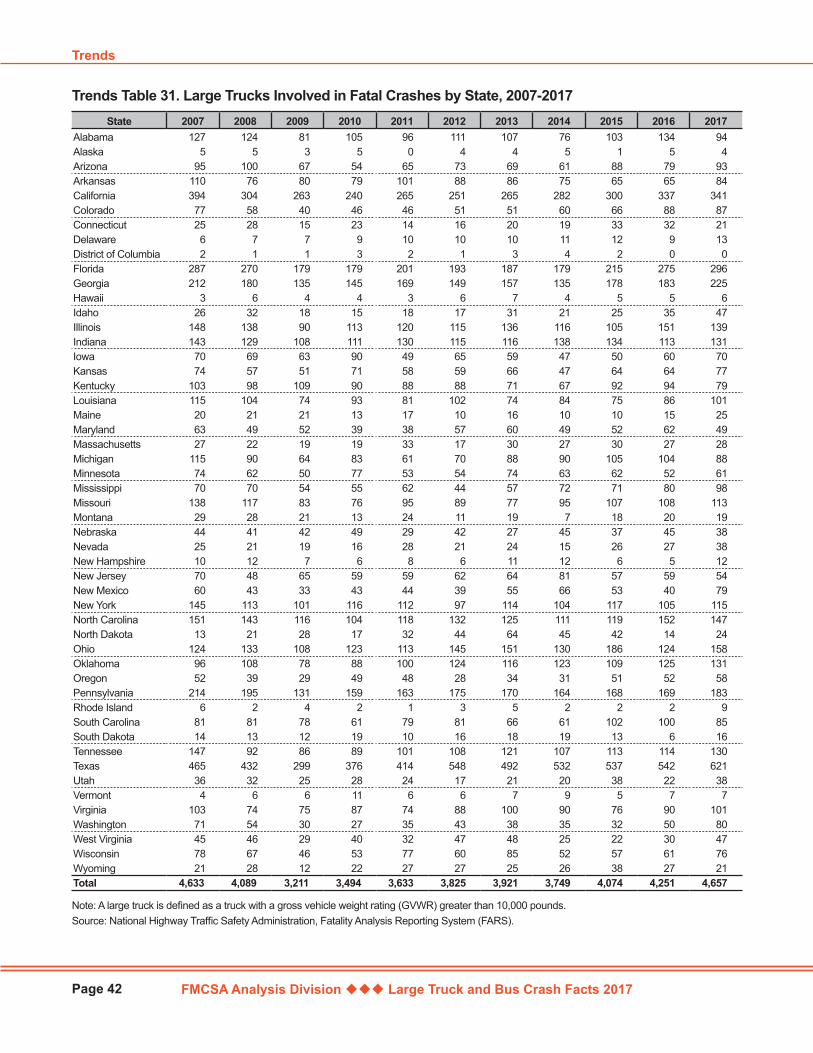
FMCSA Analysis Division Large Truck and Bus Crash Facts 2017
Trends
Page 42
State 2007 2008 2009 2010 2011 2012 2013 2014 2015 2016 2017Alabama 127 124 81 105 96 111 107 76 103 134 94Alaska 5 5 3 5 0 4 4 5 1 5 4Arizona 95 100 67 54 65 73 69 61 88 79 93Arkansas 110 76 80 79 101 88 86 75 65 65 84California 394 304 263 240 265 251 265 282 300 337 341Colorado 77 58 40 46 46 51 51 60 66 88 87Connecticut 25 28 15 23 14 16 20 19 33 32 21Delaware 6 7 7 9 10 10 10 11 12 9 13District of Columbia 2 1 1 3 2 1 3 4 2 0 0Florida 287 270 179 179 201 193 187 179 215 275 296Georgia 212 180 135 145 169 149 157 135 178 183 225Hawaii 3 6 4 4 3 6 7 4 5 5 6Idaho 26 32 18 15 18 17 31 21 25 35 47Illinois 148 138 90 113 120 115 136 116 105 151 139Indiana 143 129 108 111 130 115 116 138 134 113 131Iowa 70 69 63 90 49 65 59 47 50 60 70Kansas 74 57 51 71 58 59 66 47 64 64 77Kentucky 103 98 109 90 88 88 71 67 92 94 79Louisiana 115 104 74 93 81 102 74 84 75 86 101Maine 20 21 21 13 17 10 16 10 10 15 25Maryland 63 49 52 39 38 57 60 49 52 62 49Massachusetts 27 22 19 19 33 17 30 27 30 27 28Michigan 115 90 64 83 61 70 88 90 105 104 88Minnesota 74 62 50 77 53 54 74 63 62 52 61Mississippi 70 70 54 55 62 44 57 72 71 80 98Missouri 138 117 83 76 95 89 77 95 107 108 113Montana 29 28 21 13 24 11 19 7 18 20 19Nebraska 44 41 42 49 29 42 27 45 37 45 38Nevada 25 21 19 16 28 21 24 15 26 27 38New Hampshire 10 12 7 6 8 6 11 12 6 5 12New Jersey 70 48 65 59 59 62 64 81 57 59 54New Mexico 60 43 33 43 44 39 55 66 53 40 79New York 145 113 101 116 112 97 114 104 117 105 115North Carolina 151 143 116 104 118 132 125 111 119 152 147North Dakota 13 21 28 17 32 44 64 45 42 14 24Ohio 124 133 108 123 113 145 151 130 186 124 158Oklahoma 96 108 78 88 100 124 116 123 109 125 131Oregon 52 39 29 49 48 28 34 31 51 52 58Pennsylvania 214 195 131 159 163 175 170 164 168 169 183Rhode Island 6 2 4 2 1 3 5 2 2 2 9South Carolina 81 81 78 61 79 81 66 61 102 100 85South Dakota 14 13 12 19 10 16 18 19 13 6 16Tennessee 147 92 86 89 101 108 121 107 113 114 130Texas 465 432 299 376 414 548 492 532 537 542 621Utah 36 32 25 28 24 17 21 20 38 22 38Vermont 4 6 6 11 6 6 7 9 5 7 7Virginia 103 74 75 87 74 88 100 90 76 90 101Washington 71 54 30 27 35 43 38 35 32 50 80West Virginia 45 46 29 40 32 47 48 25 22 30 47Wisconsin 78 67 46 53 77 60 85 52 57 61 76Wyoming 21 28 12 22 27 27 25 26 38 27 21Total 4,633 4,089 3,211 3,494 3,633 3,825 3,921 3,749 4,074 4,251 4,657
Trends Table 31. Large Trucks Involved in Fatal Crashes by State, 2007-2017
Note: A large truck is defined as a truck with a gross vehicle weight rating (GVWR) greater than 10,000 pounds.Source: National Highway Traffic Safety Administration, Fatality Analysis Reporting System (FARS).

FMCSA Analysis Division Large Truck and Bus Crash Facts 2017
Large Truck and Bus Crash Facts 2017
Page 43
State 2007 2008 2009 2010 2011 2012 2013 2014 2015 2016 2017Alabama 17 18 15 9 11 13 24 15 19 30 20Alaska 2 1 1 0 0 1 0 1 0 2 1Arizona 22 15 18 6 14 19 15 16 17 16 19Arkansas 24 13 15 16 18 20 20 11 15 13 22California 73 56 48 60 63 57 70 64 59 80 87Colorado 18 14 10 6 12 8 17 12 11 22 18Connecticut 5 7 2 8 2 5 4 5 13 7 4Delaware 0 0 3 1 1 3 3 2 4 2 3District of Columbia 2 1 1 3 1 1 1 1 2 0 0Florida 49 43 34 35 54 38 39 34 39 49 56Georgia 33 34 33 19 29 25 32 31 27 37 26Hawaii 0 3 1 0 1 2 6 4 1 1 1Idaho 6 7 4 5 3 1 7 6 4 3 12Illinois 23 21 9 18 26 17 20 20 16 28 21Indiana 19 15 12 9 20 15 17 20 16 17 18Iowa 11 12 8 12 12 7 11 9 7 9 18Kansas 4 7 5 9 9 19 12 4 9 14 11Kentucky 18 20 16 10 19 16 12 11 7 20 13Louisiana 21 24 8 16 11 21 12 13 3 14 25Maine 4 7 0 4 3 2 3 1 1 0 4Maryland 13 7 9 6 9 8 8 8 12 16 14Massachusetts 10 9 6 5 6 7 11 10 10 10 10Michigan 8 10 13 16 7 8 8 12 12 16 7Minnesota 4 13 10 11 10 10 8 8 6 9 12Mississippi 13 13 10 5 9 5 16 14 14 12 14Missouri 26 13 12 15 25 22 20 18 22 26 19Montana 13 7 8 1 2 4 4 1 1 4 3Nebraska 2 3 2 10 2 3 7 5 6 5 4Nevada 6 3 7 3 9 4 4 1 4 10 8New Hampshire 0 0 1 0 2 0 3 5 2 1 4New Jersey 15 9 14 12 13 18 11 13 21 13 16New Mexico 18 15 10 8 12 16 14 19 12 3 14New York 47 40 31 35 40 27 40 29 36 42 43North Carolina 30 33 18 23 20 29 28 27 17 27 20North Dakota 2 4 5 3 4 7 12 5 9 8 5Ohio 14 23 10 14 18 15 18 15 22 15 20Oklahoma 18 17 18 21 23 27 23 26 19 25 19Oregon 8 8 8 14 18 6 9 8 11 7 14Pennsylvania 33 29 22 38 26 16 28 27 34 30 31Rhode Island 2 0 1 0 0 0 2 1 0 2 1South Carolina 15 20 15 9 26 15 10 11 16 22 21South Dakota 4 1 3 6 2 0 1 4 2 1 5Tennessee 31 13 21 18 19 18 17 14 17 16 20Texas 78 77 53 52 75 120 97 101 84 89 103Utah 10 5 7 3 7 2 7 4 10 1 5Vermont 1 0 2 1 2 1 1 1 2 1 2Virginia 15 17 13 20 16 23 17 23 24 28 15Washington 21 15 9 6 6 9 7 8 8 16 9West Virginia 6 7 8 6 4 7 13 5 4 6 9Wisconsin 9 7 2 10 6 9 11 8 7 12 6Wyoming 7 9 5 3 5 7 3 4 5 7 7Total 830 745 596 620 732 733 783 715 719 844 859
Trends Table 32. Single-Vehicle Fatal Crashes Involving Large Trucks by State, 2007-2017
Note: A large truck is defined as a truck with a gross vehicle weight rating (GVWR) greater than 10,000 pounds.Source: National Highway Traffic Safety Administration, Fatality Analysis Reporting System (FARS).
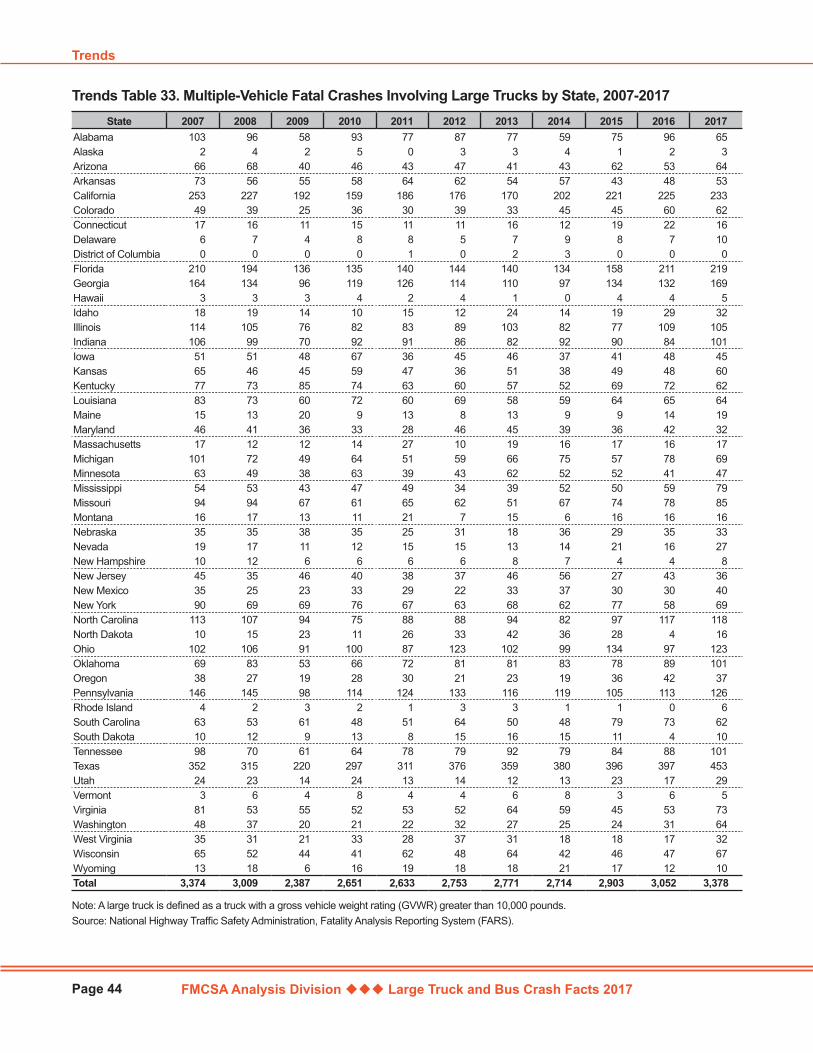
FMCSA Analysis Division Large Truck and Bus Crash Facts 2017
Trends
Page 44
State 2007 2008 2009 2010 2011 2012 2013 2014 2015 2016 2017Alabama 103 96 58 93 77 87 77 59 75 96 65Alaska 2 4 2 5 0 3 3 4 1 2 3Arizona 66 68 40 46 43 47 41 43 62 53 64Arkansas 73 56 55 58 64 62 54 57 43 48 53California 253 227 192 159 186 176 170 202 221 225 233Colorado 49 39 25 36 30 39 33 45 45 60 62Connecticut 17 16 11 15 11 11 16 12 19 22 16Delaware 6 7 4 8 8 5 7 9 8 7 10District of Columbia 0 0 0 0 1 0 2 3 0 0 0Florida 210 194 136 135 140 144 140 134 158 211 219Georgia 164 134 96 119 126 114 110 97 134 132 169Hawaii 3 3 3 4 2 4 1 0 4 4 5Idaho 18 19 14 10 15 12 24 14 19 29 32Illinois 114 105 76 82 83 89 103 82 77 109 105Indiana 106 99 70 92 91 86 82 92 90 84 101Iowa 51 51 48 67 36 45 46 37 41 48 45Kansas 65 46 45 59 47 36 51 38 49 48 60Kentucky 77 73 85 74 63 60 57 52 69 72 62Louisiana 83 73 60 72 60 69 58 59 64 65 64Maine 15 13 20 9 13 8 13 9 9 14 19Maryland 46 41 36 33 28 46 45 39 36 42 32Massachusetts 17 12 12 14 27 10 19 16 17 16 17Michigan 101 72 49 64 51 59 66 75 57 78 69Minnesota 63 49 38 63 39 43 62 52 52 41 47Mississippi 54 53 43 47 49 34 39 52 50 59 79Missouri 94 94 67 61 65 62 51 67 74 78 85Montana 16 17 13 11 21 7 15 6 16 16 16Nebraska 35 35 38 35 25 31 18 36 29 35 33Nevada 19 17 11 12 15 15 13 14 21 16 27New Hampshire 10 12 6 6 6 6 8 7 4 4 8New Jersey 45 35 46 40 38 37 46 56 27 43 36New Mexico 35 25 23 33 29 22 33 37 30 30 40New York 90 69 69 76 67 63 68 62 77 58 69North Carolina 113 107 94 75 88 88 94 82 97 117 118North Dakota 10 15 23 11 26 33 42 36 28 4 16Ohio 102 106 91 100 87 123 102 99 134 97 123Oklahoma 69 83 53 66 72 81 81 83 78 89 101Oregon 38 27 19 28 30 21 23 19 36 42 37Pennsylvania 146 145 98 114 124 133 116 119 105 113 126Rhode Island 4 2 3 2 1 3 3 1 1 0 6South Carolina 63 53 61 48 51 64 50 48 79 73 62South Dakota 10 12 9 13 8 15 16 15 11 4 10Tennessee 98 70 61 64 78 79 92 79 84 88 101Texas 352 315 220 297 311 376 359 380 396 397 453Utah 24 23 14 24 13 14 12 13 23 17 29Vermont 3 6 4 8 4 4 6 8 3 6 5Virginia 81 53 55 52 53 52 64 59 45 53 73Washington 48 37 20 21 22 32 27 25 24 31 64West Virginia 35 31 21 33 28 37 31 18 18 17 32Wisconsin 65 52 44 41 62 48 64 42 46 47 67Wyoming 13 18 6 16 19 18 18 21 17 12 10Total 3,374 3,009 2,387 2,651 2,633 2,753 2,771 2,714 2,903 3,052 3,378
Trends Table 33. Multiple-Vehicle Fatal Crashes Involving Large Trucks by State, 2007-2017
Note: A large truck is defined as a truck with a gross vehicle weight rating (GVWR) greater than 10,000 pounds.Source: National Highway Traffic Safety Administration, Fatality Analysis Reporting System (FARS).
FMCSA Analysis Division Large Truck and Bus Crash Facts 2017 Page 45
CrashesThis chapter contains information on the circumstances of large truck crashes. Below is a summary of some of the information on crashes in 2017 in this section:
Of the approximately 450,000 police-reported crashes involving large trucks in 2017, there were 4,237 (1 percent) fatal crashes and 344,000 (23 percent) injury crashes.
Single-vehicle crashes (including crashes that involved a bicyclist, pedestrian, nonmotorized vehicle, etc.) made up 20 percent of all fatal crashes, 15 percent of all injury crashes, and 23 percent of all property damage only crashes involving large trucks in 2017. The majority (63 percent) of fatal large truck crashes involved two vehicles.
Fatal crashes involving large trucks often occur in rural areas and on Interstate highways. Approximately 57 percent of all fatal crashes involving large trucks occurred in rural areas, 27 percent occurred on Interstate highways, and 13 percent fell into both categories by occurring on rural Interstate highways.
Thirty-five percent of all fatal crashes, 22 percent of all injury crashes, and 20 percent of all property damage only crashes involving large trucks occurred at night (6:00 pm to 6:00 am).
The vast majority of fatal crashes (83 percent) and nonfatal crashes (88 percent) involving large trucks occurred on weekdays (Monday through Friday).
Collision with a vehicle in transport was the first harmful event (the first event during a crash that resulted in injury or property damage) in 74 percent of fatal crashes involving large trucks, 81 percent of injury crashes involving large trucks, and 76 percent of property damage only crashes involving large trucks.
Overturn (rollover) was the first harmful event in 4 percent of all fatal crashes involving large trucks and 3 percent of all nonfatal crashes involving large trucks.
In 2017, 30 percent of work zone fatal crashes and 12 percent of work zone injury crashes involved at least one large truck.
There were 13.0 fatal large truck crashes per million people in the United States in 2017, a 23-percent increase from 10.6 in 2010.
In 2017, on average, there were 1.12 fatalities in fatal crashes involving large trucks. In 91 percent of those crashes, there was only one fatality. The majority, 82 percent, of fatalities were not occupants of the large truck.
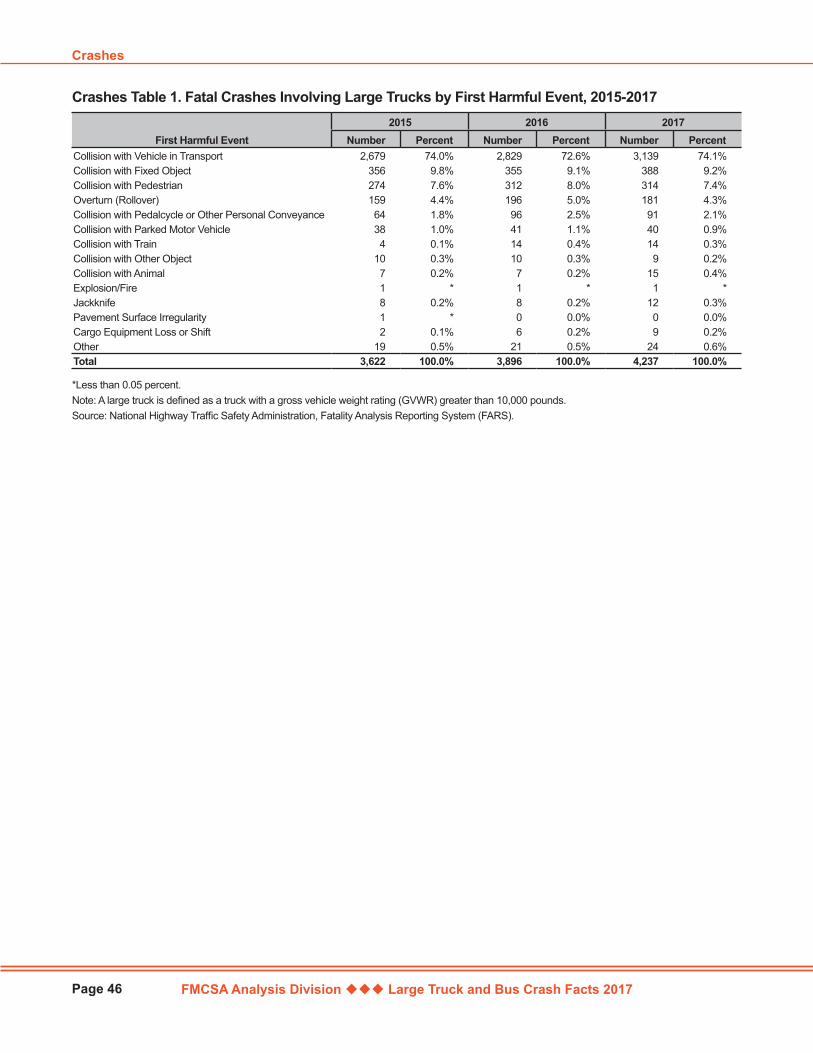
FMCSA Analysis Division Large Truck and Bus Crash Facts 2017
Crashes
Page 46
First Harmful Event2015 2016 2017
Number Percent Number Percent Number PercentCollision with Vehicle in Transport 2,679 74.0% 2,829 72.6% 3,139 74.1%Collision with Fixed Object 356 9.8% 355 9.1% 388 9.2%Collision with Pedestrian 274 7.6% 312 8.0% 314 7.4%Overturn (Rollover) 159 4.4% 196 5.0% 181 4.3%Collision with Pedalcycle or Other Personal Conveyance 64 1.8% 96 2.5% 91 2.1%Collision with Parked Motor Vehicle 38 1.0% 41 1.1% 40 0.9%Collision with Train 4 0.1% 14 0.4% 14 0.3%Collision with Other Object 10 0.3% 10 0.3% 9 0.2%Collision with Animal 7 0.2% 7 0.2% 15 0.4%Explosion/Fire 1 * 1 * 1 *Jackknife 8 0.2% 8 0.2% 12 0.3%Pavement Surface Irregularity 1 * 0 0.0% 0 0.0%Cargo Equipment Loss or Shift 2 0.1% 6 0.2% 9 0.2%Other 19 0.5% 21 0.5% 24 0.6%Total 3,622 100.0% 3,896 100.0% 4,237 100.0%
Crashes Table 1. Fatal Crashes Involving Large Trucks by First Harmful Event, 2015-2017
*Less than 0.05 percent.Note: A large truck is defined as a truck with a gross vehicle weight rating (GVWR) greater than 10,000 pounds.Source: National Highway Traffic Safety Administration, Fatality Analysis Reporting System (FARS).

FMCSA Analysis Division Large Truck and Bus Crash Facts 2017
Large Truck and Bus Crash Facts 2017
Page 47
First Harmful EventSingle-Vehicle Crashes Multiple-Vehicle Crashes TotalNumber Percent Number Percent Number Percent
Fatal CrashesCollision with Vehicle in Transport 0 0.0% 3,139 92.9% 3,139 74.1%Collision with Fixed Object 275 32.0% 113 3.3% 388 9.2%Collision with Pedestrian 266 31.0% 48 1.4% 314 7.4%Overturn (Rollover) 135 15.7% 46 1.4% 181 4.3%Collision with Pedalcycle or Other Personal Conveyance 90 10.5% 1 * 91 2.1%Collision with Parked Motor Vehicle 34 4.0% 6 0.2% 40 0.9%Collision with Train 14 1.6% 0 0.0% 14 0.3%Collision with Other Object 6 0.7% 3 0.1% 9 0.2%Collision with Animal 5 0.6% 10 0.3% 15 0.4%Explosion/Fire 1 0.1% 0 0.0% 1 *Jackknife 6 0.7% 6 0.2% 12 0.3%Pavement Surface Irregularity 0 0.0% 0 0.0% 0 0.0%Cargo Equipment Loss or Shift 8 0.9% 1 * 9 0.2%Other 19 2.2% 5 0.1% 24 0.6%Total Fatal Crashes 859 100.0% 3,378 100.0% 4,237 100.0%
Injury CrashesCollision with Vehicle in Transport * * 83,000 95.8% 83,000 81.4%Collision with Fixed Object 7,000 48.3% 2,000 2.7% 10,000 9.5%Collision with Pedestrian 1,000 4.8% * 0.2% 1,000 0.9%Overturn (Rollover) 4,000 27.5% 1,000 0.7% 5,000 4.7%Collision with Pedalcycle or Other Personal Conveyance 1,000 4.9% * * 1,000 0.7%Collision with Parked Motor Vehicle 1,000 6.8% * * 1,000 1.0%Collision with Train * * * * * *Collision with Other Object * 1.7% * 0.4% 1,000 0.6%Collision with Animal * 2.5% * * * 0.4%Explosion/Fire * 1.0% * * * 0.1%Jackknife * * * 0.1% * 0.1%Pavement Surface Irregularity * * * * * *Cargo Equipment Loss or Shift * * * 0.1% * 0.1%Other * 2.5% * 0.1% * 0.4%Total Injury Crashes 15,000 100.0% 87,000 100.0% 102,000 100.0%
Property Damage Only CrashesCollision with Vehicle in Transport * * 261,000 98.6% 261,000 75.8%Collision with Fixed Object 41,000 51.1% 2,000 0.7% 42,000 12.4%Collision with Pedestrian * * * * * *Overturn (Rollover) 7,000 8.7% * * 7,000 2.0%Collision with Pedalcycle or Other Personal Conveyance * * * * * *Collision with Parked Motor Vehicle 20,000 25.0% * 0.1% 20,000 5.9%Collision with Train * 0.3% * * * 0.1%Collision with Other Object 3,000 4.2% 1,000 0.2% 4,000 1.1%Collision with Animal 6,000 7.2% * * 6,000 1.7%Explosion/Fire 1,000 0.8% * * 1,000 0.2%Jackknife 1,000 1.6% * 0.1% 2,000 0.4%Pavement Surface Irregularity * 0.2% * * * *Cargo Equipment Loss or Shift * 0.5% * * 1,000 0.2%Other * 0.5% * 0.2% 1,000 0.3%Total Property Damage Only Crashes 79,000 100.0% 264,000 100.0% 344,000 100.0%
Crashes Table 2. Crashes Involving Large Trucks by First Harmful Event, Number of Vehicles Involved, and Crash Severity, 2017
*Less than 500 or less than 0.05 percent.Notes: A large truck is defined as a truck with a gross vehicle weight rating (GVWR) greater than 10,000 pounds. Individual numbers may not add up to the totals due to independent rounding. Percentages are based on unrounded numbers.Sources: Fatal Crashes: National Highway Traffic Safety Administration (NHTSA), Fatality Analysis Reporting System (FARS). Injury and Property Damage Only Crashes: NHTSA, Crash Report Sampling System (CRSS).
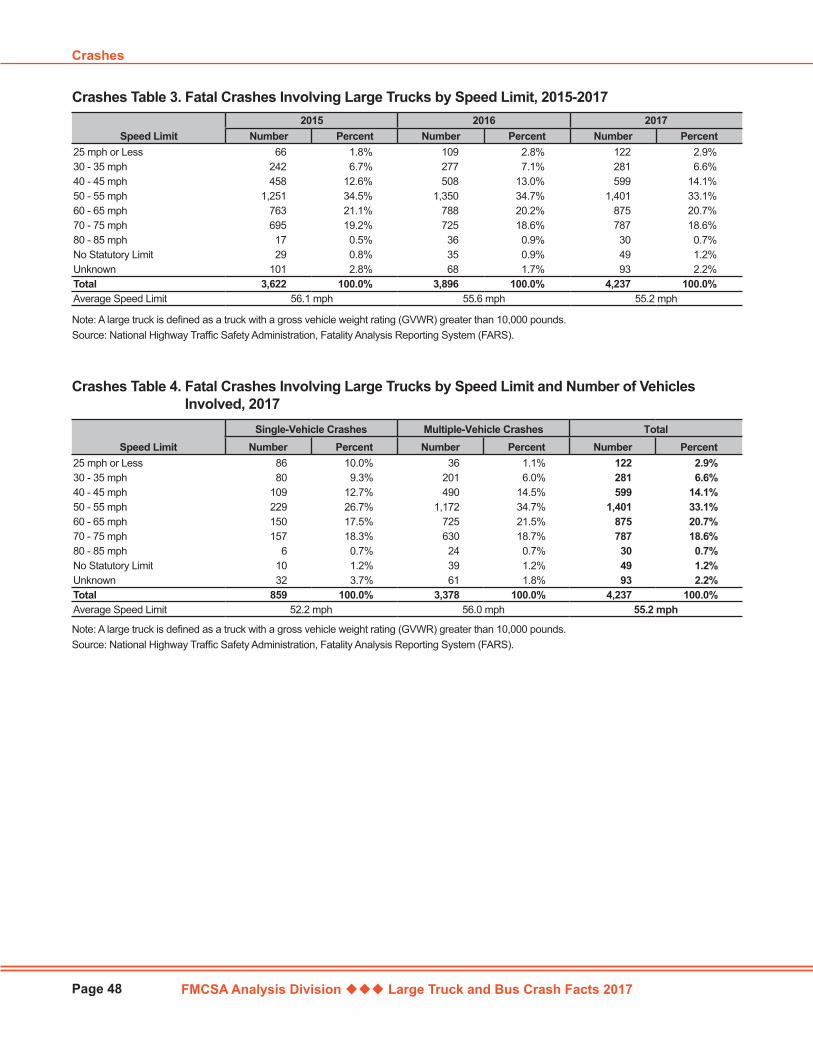
FMCSA Analysis Division Large Truck and Bus Crash Facts 2017
Crashes
Page 48
Speed Limit2015 2016 2017
Number Percent Number Percent Number Percent25 mph or Less 66 1.8% 109 2.8% 122 2.9%30 - 35 mph 242 6.7% 277 7.1% 281 6.6%40 - 45 mph 458 12.6% 508 13.0% 599 14.1%50 - 55 mph 1,251 34.5% 1,350 34.7% 1,401 33.1%60 - 65 mph 763 21.1% 788 20.2% 875 20.7%70 - 75 mph 695 19.2% 725 18.6% 787 18.6%80 - 85 mph 17 0.5% 36 0.9% 30 0.7%No Statutory Limit 29 0.8% 35 0.9% 49 1.2%Unknown 101 2.8% 68 1.7% 93 2.2%Total 3,622 100.0% 3,896 100.0% 4,237 100.0%Average Speed Limit 56.1 mph 55.6 mph 55.2 mph
Crashes Table 3. Fatal Crashes Involving Large Trucks by Speed Limit, 2015-2017
Note: A large truck is defined as a truck with a gross vehicle weight rating (GVWR) greater than 10,000 pounds.Source: National Highway Traffic Safety Administration, Fatality Analysis Reporting System (FARS).
Speed LimitSingle-Vehicle Crashes Multiple-Vehicle Crashes Total
Number Percent Number Percent Number Percent25 mph or Less 86 10.0% 36 1.1% 122 2.9%30 - 35 mph 80 9.3% 201 6.0% 281 6.6%40 - 45 mph 109 12.7% 490 14.5% 599 14.1%50 - 55 mph 229 26.7% 1,172 34.7% 1,401 33.1%60 - 65 mph 150 17.5% 725 21.5% 875 20.7%70 - 75 mph 157 18.3% 630 18.7% 787 18.6%80 - 85 mph 6 0.7% 24 0.7% 30 0.7%No Statutory Limit 10 1.2% 39 1.2% 49 1.2%Unknown 32 3.7% 61 1.8% 93 2.2%Total 859 100.0% 3,378 100.0% 4,237 100.0%Average Speed Limit 52.2 mph 56.0 mph 55.2 mph
Crashes Table 4. Fatal Crashes Involving Large Trucks by Speed Limit and Number of Vehicles Involved, 2017
Note: A large truck is defined as a truck with a gross vehicle weight rating (GVWR) greater than 10,000 pounds.Source: National Highway Traffic Safety Administration, Fatality Analysis Reporting System (FARS).
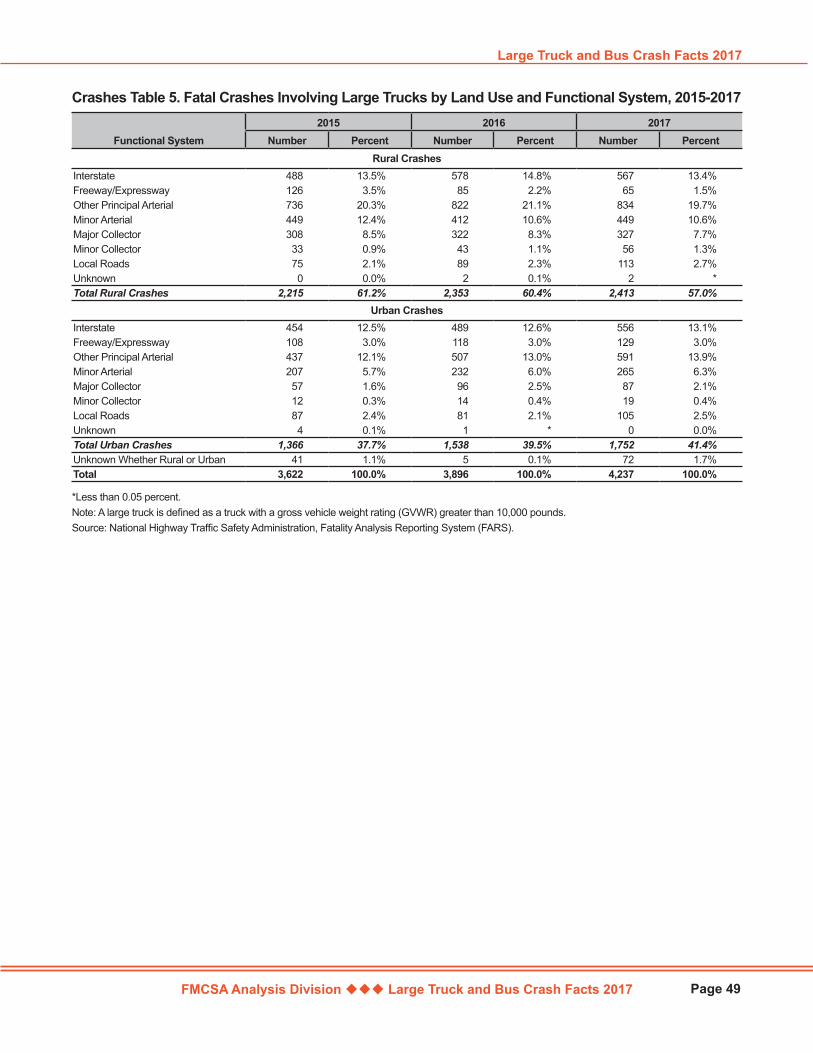
FMCSA Analysis Division Large Truck and Bus Crash Facts 2017
Large Truck and Bus Crash Facts 2017
Page 49
Functional System2015 2016 2017
Number Percent Number Percent Number PercentRural Crashes
Interstate 488 13.5% 578 14.8% 567 13.4%Freeway/Expressway 126 3.5% 85 2.2% 65 1.5%Other Principal Arterial 736 20.3% 822 21.1% 834 19.7%Minor Arterial 449 12.4% 412 10.6% 449 10.6%Major Collector 308 8.5% 322 8.3% 327 7.7%Minor Collector 33 0.9% 43 1.1% 56 1.3%Local Roads 75 2.1% 89 2.3% 113 2.7%Unknown 0 0.0% 2 0.1% 2 *Total Rural Crashes 2,215 61.2% 2,353 60.4% 2,413 57.0%
Urban CrashesInterstate 454 12.5% 489 12.6% 556 13.1%Freeway/Expressway 108 3.0% 118 3.0% 129 3.0%Other Principal Arterial 437 12.1% 507 13.0% 591 13.9%Minor Arterial 207 5.7% 232 6.0% 265 6.3%Major Collector 57 1.6% 96 2.5% 87 2.1%Minor Collector 12 0.3% 14 0.4% 19 0.4%Local Roads 87 2.4% 81 2.1% 105 2.5%Unknown 4 0.1% 1 * 0 0.0%Total Urban Crashes 1,366 37.7% 1,538 39.5% 1,752 41.4%Unknown Whether Rural or Urban 41 1.1% 5 0.1% 72 1.7%Total 3,622 100.0% 3,896 100.0% 4,237 100.0%
Crashes Table 5. Fatal Crashes Involving Large Trucks by Land Use and Functional System, 2015-2017
*Less than 0.05 percent. Note: A large truck is defined as a truck with a gross vehicle weight rating (GVWR) greater than 10,000 pounds.Source: National Highway Traffic Safety Administration, Fatality Analysis Reporting System (FARS).
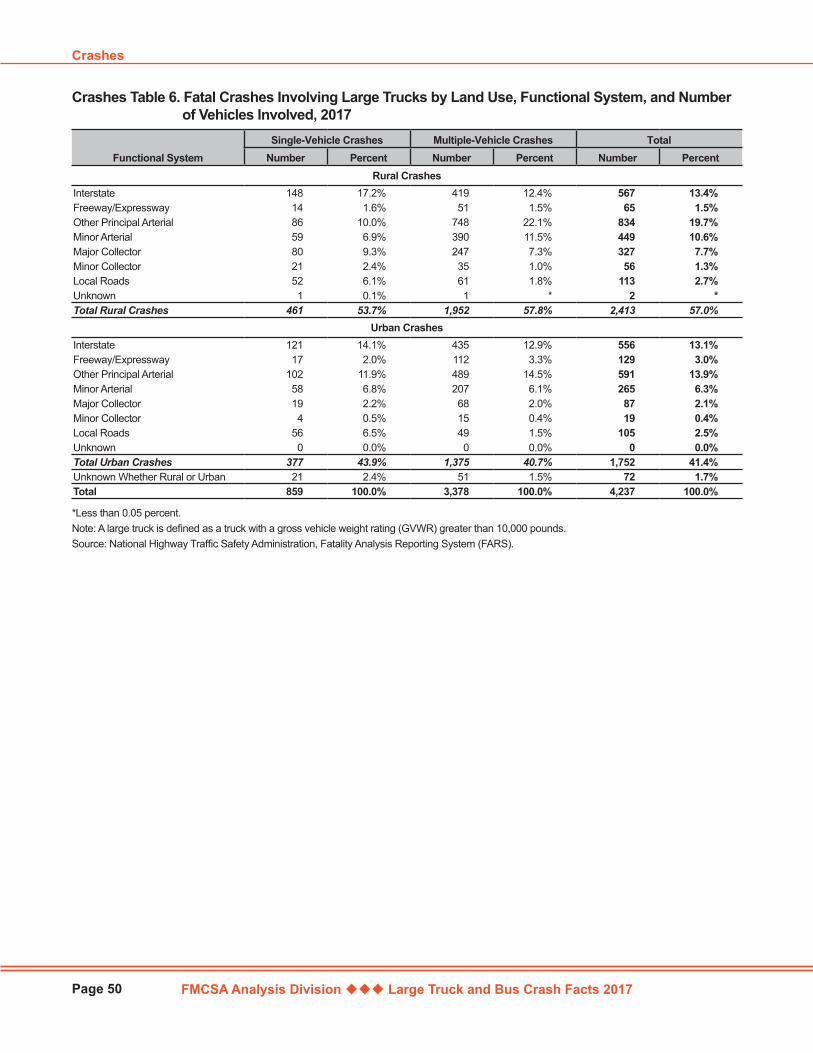
FMCSA Analysis Division Large Truck and Bus Crash Facts 2017
Crashes
Page 50
Functional SystemSingle-Vehicle Crashes Multiple-Vehicle Crashes Total
Number Percent Number Percent Number PercentRural Crashes
Interstate 148 17.2% 419 12.4% 567 13.4%Freeway/Expressway 14 1.6% 51 1.5% 65 1.5%Other Principal Arterial 86 10.0% 748 22.1% 834 19.7%Minor Arterial 59 6.9% 390 11.5% 449 10.6%Major Collector 80 9.3% 247 7.3% 327 7.7%Minor Collector 21 2.4% 35 1.0% 56 1.3%Local Roads 52 6.1% 61 1.8% 113 2.7%Unknown 1 0.1% 1 * 2 *Total Rural Crashes 461 53.7% 1,952 57.8% 2,413 57.0%
Urban CrashesInterstate 121 14.1% 435 12.9% 556 13.1%Freeway/Expressway 17 2.0% 112 3.3% 129 3.0%Other Principal Arterial 102 11.9% 489 14.5% 591 13.9%Minor Arterial 58 6.8% 207 6.1% 265 6.3%Major Collector 19 2.2% 68 2.0% 87 2.1%Minor Collector 4 0.5% 15 0.4% 19 0.4%Local Roads 56 6.5% 49 1.5% 105 2.5%Unknown 0 0.0% 0 0.0% 0 0.0%Total Urban Crashes 377 43.9% 1,375 40.7% 1,752 41.4%Unknown Whether Rural or Urban 21 2.4% 51 1.5% 72 1.7%Total 859 100.0% 3,378 100.0% 4,237 100.0%
Crashes Table 6. Fatal Crashes Involving Large Trucks by Land Use, Functional System, and Number of Vehicles Involved, 2017
*Less than 0.05 percent.Note: A large truck is defined as a truck with a gross vehicle weight rating (GVWR) greater than 10,000 pounds.Source: National Highway Traffic Safety Administration, Fatality Analysis Reporting System (FARS).
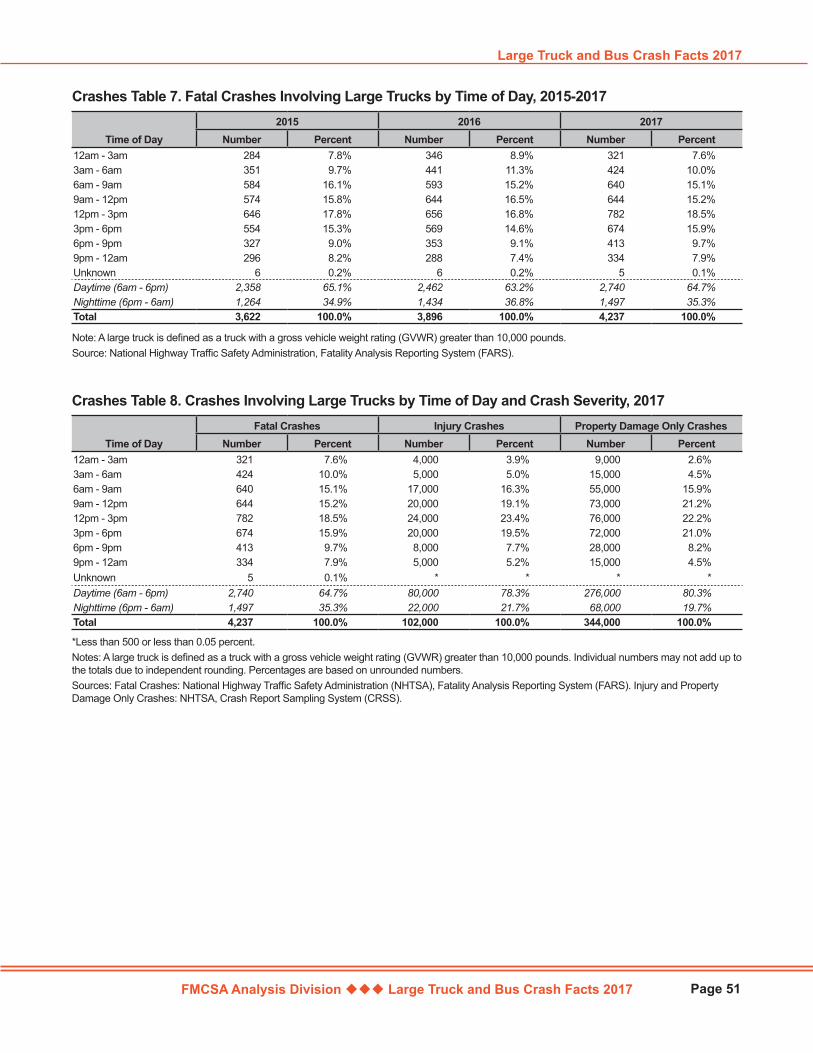
FMCSA Analysis Division Large Truck and Bus Crash Facts 2017
Large Truck and Bus Crash Facts 2017
Page 51
Time of Day2015 2016 2017
Number Percent Number Percent Number Percent12am - 3am 284 7.8% 346 8.9% 321 7.6%3am - 6am 351 9.7% 441 11.3% 424 10.0%6am - 9am 584 16.1% 593 15.2% 640 15.1%9am - 12pm 574 15.8% 644 16.5% 644 15.2%12pm - 3pm 646 17.8% 656 16.8% 782 18.5%3pm - 6pm 554 15.3% 569 14.6% 674 15.9%6pm - 9pm 327 9.0% 353 9.1% 413 9.7%9pm - 12am 296 8.2% 288 7.4% 334 7.9%Unknown 6 0.2% 6 0.2% 5 0.1%Daytime (6am - 6pm) 2,358 65.1% 2,462 63.2% 2,740 64.7%Nighttime (6pm - 6am) 1,264 34.9% 1,434 36.8% 1,497 35.3%Total 3,622 100.0% 3,896 100.0% 4,237 100.0%
Crashes Table 7. Fatal Crashes Involving Large Trucks by Time of Day, 2015-2017
Note: A large truck is defined as a truck with a gross vehicle weight rating (GVWR) greater than 10,000 pounds.Source: National Highway Traffic Safety Administration, Fatality Analysis Reporting System (FARS).
Time of DayFatal Crashes Injury Crashes Property Damage Only Crashes
Number Percent Number Percent Number Percent12am - 3am 321 7.6% 4,000 3.9% 9,000 2.6%3am - 6am 424 10.0% 5,000 5.0% 15,000 4.5%6am - 9am 640 15.1% 17,000 16.3% 55,000 15.9%9am - 12pm 644 15.2% 20,000 19.1% 73,000 21.2%12pm - 3pm 782 18.5% 24,000 23.4% 76,000 22.2%3pm - 6pm 674 15.9% 20,000 19.5% 72,000 21.0%6pm - 9pm 413 9.7% 8,000 7.7% 28,000 8.2%9pm - 12am 334 7.9% 5,000 5.2% 15,000 4.5%Unknown 5 0.1% * * * *Daytime (6am - 6pm) 2,740 64.7% 80,000 78.3% 276,000 80.3%Nighttime (6pm - 6am) 1,497 35.3% 22,000 21.7% 68,000 19.7%Total 4,237 100.0% 102,000 100.0% 344,000 100.0%
Crashes Table 8. Crashes Involving Large Trucks by Time of Day and Crash Severity, 2017
*Less than 500 or less than 0.05 percent. Notes: A large truck is defined as a truck with a gross vehicle weight rating (GVWR) greater than 10,000 pounds. Individual numbers may not add up to the totals due to independent rounding. Percentages are based on unrounded numbers.Sources: Fatal Crashes: National Highway Traffic Safety Administration (NHTSA), Fatality Analysis Reporting System (FARS). Injury and Property Damage Only Crashes: NHTSA, Crash Report Sampling System (CRSS).
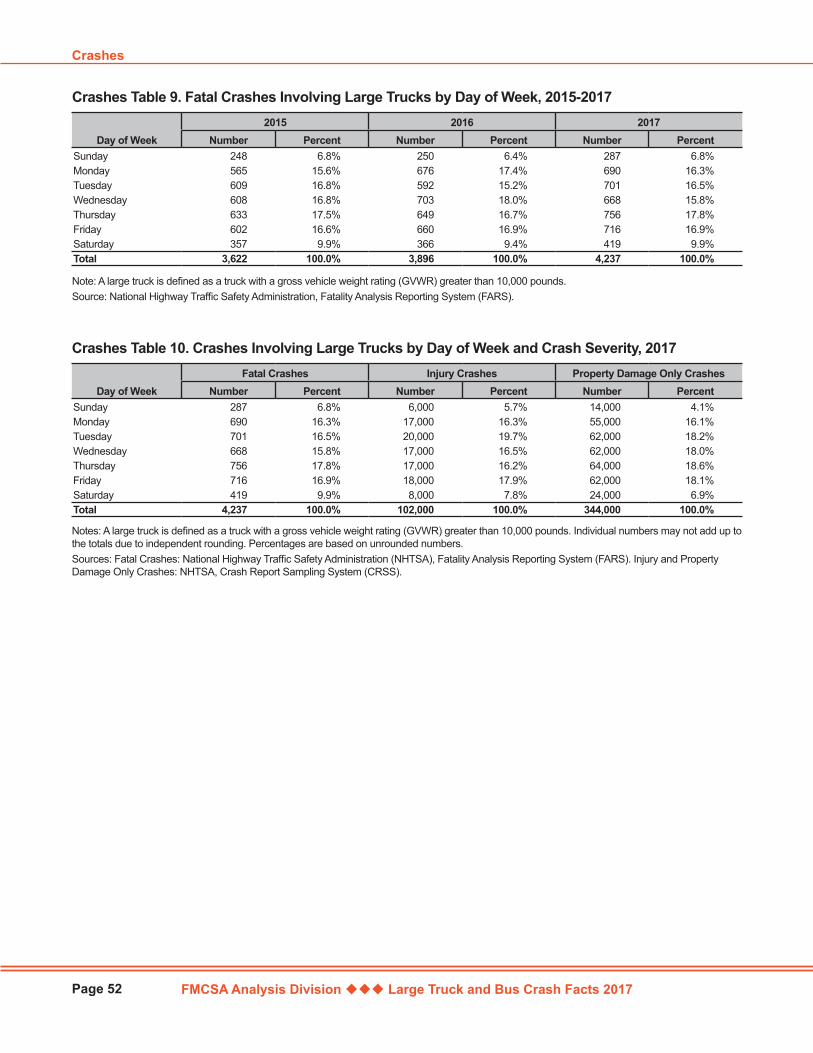
FMCSA Analysis Division Large Truck and Bus Crash Facts 2017
Crashes
Page 52
Day of Week2015 2016 2017
Number Percent Number Percent Number PercentSunday 248 6.8% 250 6.4% 287 6.8%Monday 565 15.6% 676 17.4% 690 16.3%Tuesday 609 16.8% 592 15.2% 701 16.5%Wednesday 608 16.8% 703 18.0% 668 15.8%Thursday 633 17.5% 649 16.7% 756 17.8%Friday 602 16.6% 660 16.9% 716 16.9%Saturday 357 9.9% 366 9.4% 419 9.9%Total 3,622 100.0% 3,896 100.0% 4,237 100.0%
Crashes Table 9. Fatal Crashes Involving Large Trucks by Day of Week, 2015-2017
Note: A large truck is defined as a truck with a gross vehicle weight rating (GVWR) greater than 10,000 pounds.Source: National Highway Traffic Safety Administration, Fatality Analysis Reporting System (FARS).
Day of WeekFatal Crashes Injury Crashes Property Damage Only Crashes
Number Percent Number Percent Number PercentSunday 287 6.8% 6,000 5.7% 14,000 4.1%Monday 690 16.3% 17,000 16.3% 55,000 16.1%Tuesday 701 16.5% 20,000 19.7% 62,000 18.2%Wednesday 668 15.8% 17,000 16.5% 62,000 18.0%Thursday 756 17.8% 17,000 16.2% 64,000 18.6%Friday 716 16.9% 18,000 17.9% 62,000 18.1%Saturday 419 9.9% 8,000 7.8% 24,000 6.9%Total 4,237 100.0% 102,000 100.0% 344,000 100.0%
Crashes Table 10. Crashes Involving Large Trucks by Day of Week and Crash Severity, 2017
Notes: A large truck is defined as a truck with a gross vehicle weight rating (GVWR) greater than 10,000 pounds. Individual numbers may not add up to the totals due to independent rounding. Percentages are based on unrounded numbers.Sources: Fatal Crashes: National Highway Traffic Safety Administration (NHTSA), Fatality Analysis Reporting System (FARS). Injury and Property Damage Only Crashes: NHTSA, Crash Report Sampling System (CRSS).
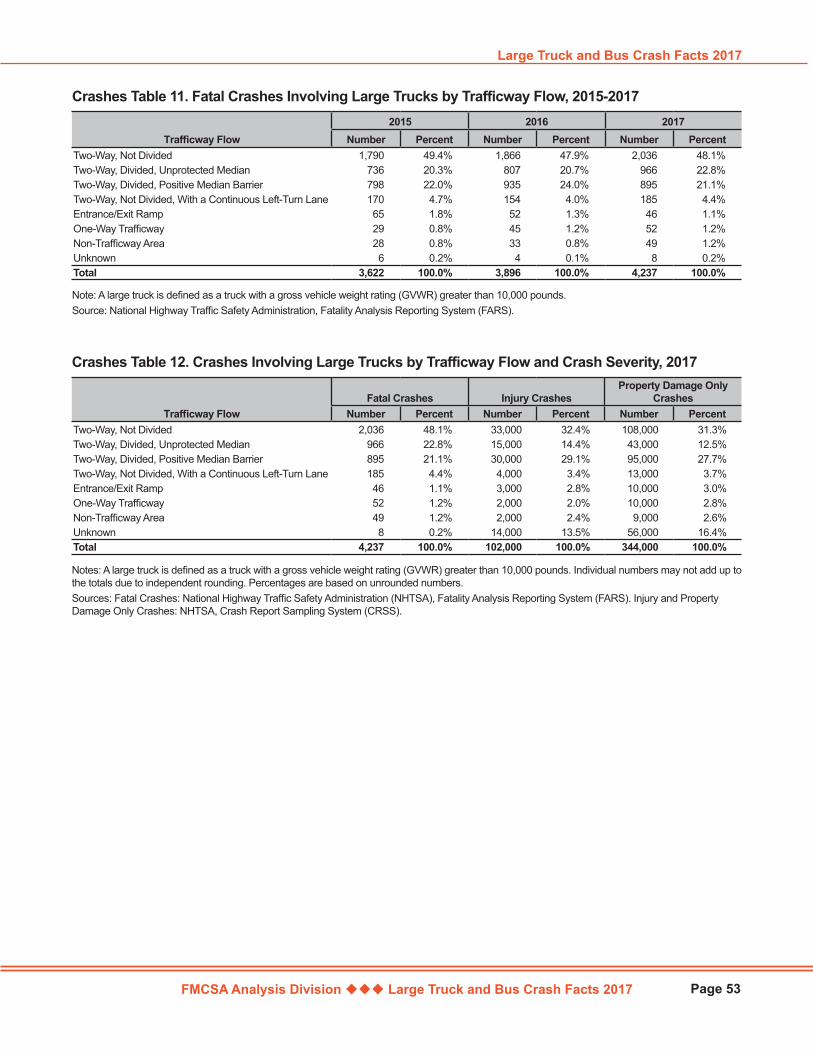
FMCSA Analysis Division Large Truck and Bus Crash Facts 2017
Large Truck and Bus Crash Facts 2017
Page 53
Trafficway Flow2015 2016 2017
Number Percent Number Percent Number PercentTwo-Way, Not Divided 1,790 49.4% 1,866 47.9% 2,036 48.1%Two-Way, Divided, Unprotected Median 736 20.3% 807 20.7% 966 22.8%Two-Way, Divided, Positive Median Barrier 798 22.0% 935 24.0% 895 21.1%Two-Way, Not Divided, With a Continuous Left-Turn Lane 170 4.7% 154 4.0% 185 4.4%Entrance/Exit Ramp 65 1.8% 52 1.3% 46 1.1%One-Way Trafficway 29 0.8% 45 1.2% 52 1.2%Non-Trafficway Area 28 0.8% 33 0.8% 49 1.2%Unknown 6 0.2% 4 0.1% 8 0.2%Total 3,622 100.0% 3,896 100.0% 4,237 100.0%
Crashes Table 11. Fatal Crashes Involving Large Trucks by Trafficway Flow, 2015-2017
Note: A large truck is defined as a truck with a gross vehicle weight rating (GVWR) greater than 10,000 pounds.Source: National Highway Traffic Safety Administration, Fatality Analysis Reporting System (FARS).
Trafficway FlowFatal Crashes Injury Crashes
Property Damage Only Crashes
Number Percent Number Percent Number PercentTwo-Way, Not Divided 2,036 48.1% 33,000 32.4% 108,000 31.3%Two-Way, Divided, Unprotected Median 966 22.8% 15,000 14.4% 43,000 12.5%Two-Way, Divided, Positive Median Barrier 895 21.1% 30,000 29.1% 95,000 27.7%Two-Way, Not Divided, With a Continuous Left-Turn Lane 185 4.4% 4,000 3.4% 13,000 3.7%Entrance/Exit Ramp 46 1.1% 3,000 2.8% 10,000 3.0%One-Way Trafficway 52 1.2% 2,000 2.0% 10,000 2.8%Non-Trafficway Area 49 1.2% 2,000 2.4% 9,000 2.6%Unknown 8 0.2% 14,000 13.5% 56,000 16.4%Total 4,237 100.0% 102,000 100.0% 344,000 100.0%
Crashes Table 12. Crashes Involving Large Trucks by Trafficway Flow and Crash Severity, 2017
Notes: A large truck is defined as a truck with a gross vehicle weight rating (GVWR) greater than 10,000 pounds. Individual numbers may not add up to the totals due to independent rounding. Percentages are based on unrounded numbers.Sources: Fatal Crashes: National Highway Traffic Safety Administration (NHTSA), Fatality Analysis Reporting System (FARS). Injury and Property Damage Only Crashes: NHTSA, Crash Report Sampling System (CRSS).

FMCSA Analysis Division Large Truck and Bus Crash Facts 2017
Crashes
Page 54
Relation to Junction2015 2016 2017
Number Percent Number Percent Number PercentNon-Interchange Area
Non-Junction 2,285 63.1% 2,485 63.8% 2,633 62.1% Intersection 713 19.7% 745 19.1% 893 21.1% Intersection Related 191 5.3% 197 5.1% 191 4.5% Driveway Access 16 0.4% 20 0.5% 18 0.4% Driveway Access Related 156 4.3% 160 4.1% 205 4.8% Entrance/Exit Ramp 7 0.2% 1 * 4 0.1% Entrance/Exit Ramp Related 13 0.4% 11 0.3% 14 0.3% Railway Grade Crossing 4 0.1% 17 0.4% 16 0.4% Acceleration/Deceleration Lane 0 0.0% 0 0.0% 0 0.0% Through Roadway 0 0.0% 0 0.0% 0 0.0% Crossover Related 15 0.4% 24 0.6% 25 0.6% Other 1 * 0 0.0% 0 0.0% Unknown 1 * 1 * 0 0.0% Total Non-Interchange Area 3,402 93.9% 3,661 93.9% 3,999 94.4%
Interchange Area Non-Junction 0 0.0% 0 0.0% 0 0.0% Intersection 43 1.2% 47 1.2% 57 1.3% Intersection Related 8 0.2% 18 0.5% 11 0.3% Driveway Access 0 0.0% 0 0.0% 0 0.0% Driveway Access Related 1 * 0 0.0% 1 * Entrance/Exit Ramp 27 0.7% 10 0.3% 18 0.4% Entrance/Exit Ramp Related 28 0.8% 41 1.1% 32 0.8% Railway Grade Crossing 0 0.0% 0 0.0% 0 0.0% Acceleration/Deceleration Lane 1 * 8 0.2% 6 0.1% Through Roadway 90 2.5% 80 2.1% 90 2.1% Crossover Related 0 0.0% 0 0.0% 0 0.0% Other 21 0.6% 31 0.8% 22 0.5% Unknown 0 0.0% 0 0.0% 1 * Total Interchange Area 219 6.0% 235 6.0% 238 5.6%Unknown Relation to Junction 1 * 0 0.0% 0 0.0%Total 3,622 100.0% 3,896 100.0% 4,237 100.0%
Crashes Table 13. Fatal Crashes Involving Large Trucks by Relation to Junction, 2015-2017
*Less than 0.05 percent.Note: A large truck is defined as a truck with a gross vehicle weight rating (GVWR) greater than 10,000 pounds.Source: National Highway Traffic Safety Administration, Fatality Analysis Reporting System (FARS).
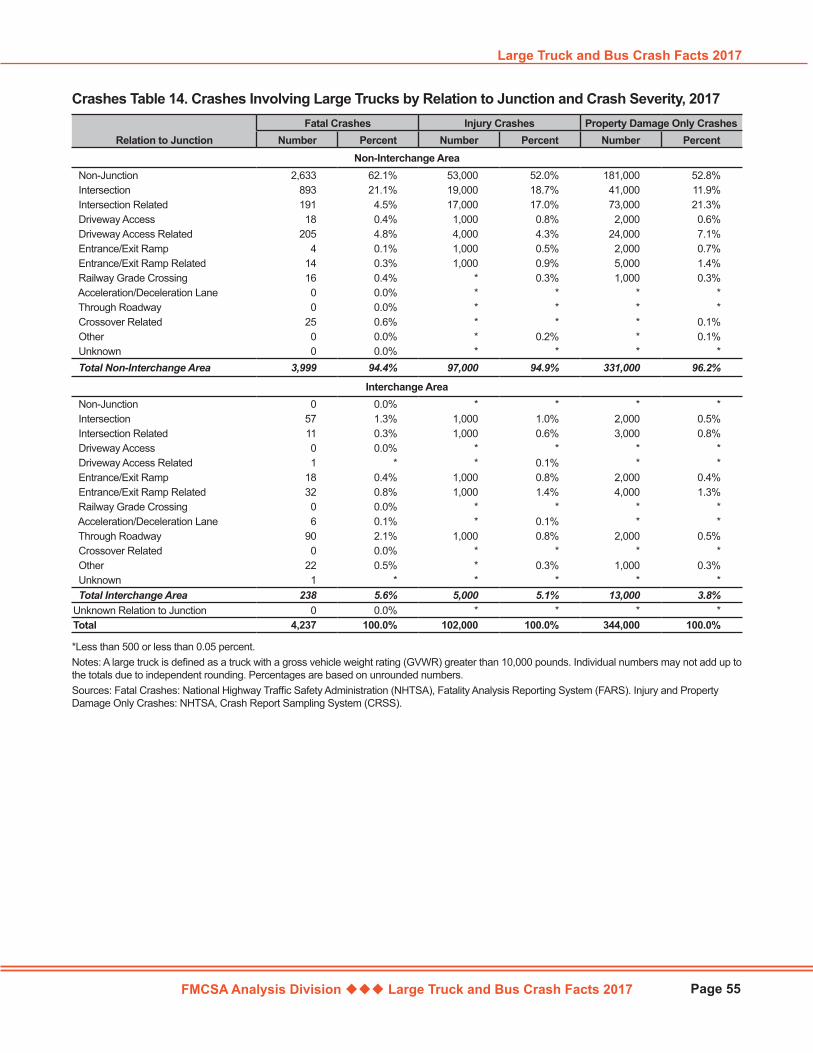
FMCSA Analysis Division Large Truck and Bus Crash Facts 2017
Large Truck and Bus Crash Facts 2017
Page 55
Relation to JunctionFatal Crashes Injury Crashes Property Damage Only Crashes
Number Percent Number Percent Number PercentNon-Interchange Area
Non-Junction 2,633 62.1% 53,000 52.0% 181,000 52.8% Intersection 893 21.1% 19,000 18.7% 41,000 11.9% Intersection Related 191 4.5% 17,000 17.0% 73,000 21.3% Driveway Access 18 0.4% 1,000 0.8% 2,000 0.6% Driveway Access Related 205 4.8% 4,000 4.3% 24,000 7.1% Entrance/Exit Ramp 4 0.1% 1,000 0.5% 2,000 0.7% Entrance/Exit Ramp Related 14 0.3% 1,000 0.9% 5,000 1.4% Railway Grade Crossing 16 0.4% * 0.3% 1,000 0.3% Acceleration/Deceleration Lane 0 0.0% * * * * Through Roadway 0 0.0% * * * * Crossover Related 25 0.6% * * * 0.1% Other 0 0.0% * 0.2% * 0.1% Unknown 0 0.0% * * * * Total Non-Interchange Area 3,999 94.4% 97,000 94.9% 331,000 96.2%
Interchange Area Non-Junction 0 0.0% * * * * Intersection 57 1.3% 1,000 1.0% 2,000 0.5% Intersection Related 11 0.3% 1,000 0.6% 3,000 0.8% Driveway Access 0 0.0% * * * * Driveway Access Related 1 * * 0.1% * * Entrance/Exit Ramp 18 0.4% 1,000 0.8% 2,000 0.4% Entrance/Exit Ramp Related 32 0.8% 1,000 1.4% 4,000 1.3% Railway Grade Crossing 0 0.0% * * * * Acceleration/Deceleration Lane 6 0.1% * 0.1% * * Through Roadway 90 2.1% 1,000 0.8% 2,000 0.5% Crossover Related 0 0.0% * * * * Other 22 0.5% * 0.3% 1,000 0.3% Unknown 1 * * * * * Total Interchange Area 238 5.6% 5,000 5.1% 13,000 3.8%Unknown Relation to Junction 0 0.0% * * * *Total 4,237 100.0% 102,000 100.0% 344,000 100.0%
Crashes Table 14. Crashes Involving Large Trucks by Relation to Junction and Crash Severity, 2017
*Less than 500 or less than 0.05 percent.Notes: A large truck is defined as a truck with a gross vehicle weight rating (GVWR) greater than 10,000 pounds. Individual numbers may not add up to the totals due to independent rounding. Percentages are based on unrounded numbers.Sources: Fatal Crashes: National Highway Traffic Safety Administration (NHTSA), Fatality Analysis Reporting System (FARS). Injury and Property Damage Only Crashes: NHTSA, Crash Report Sampling System (CRSS).
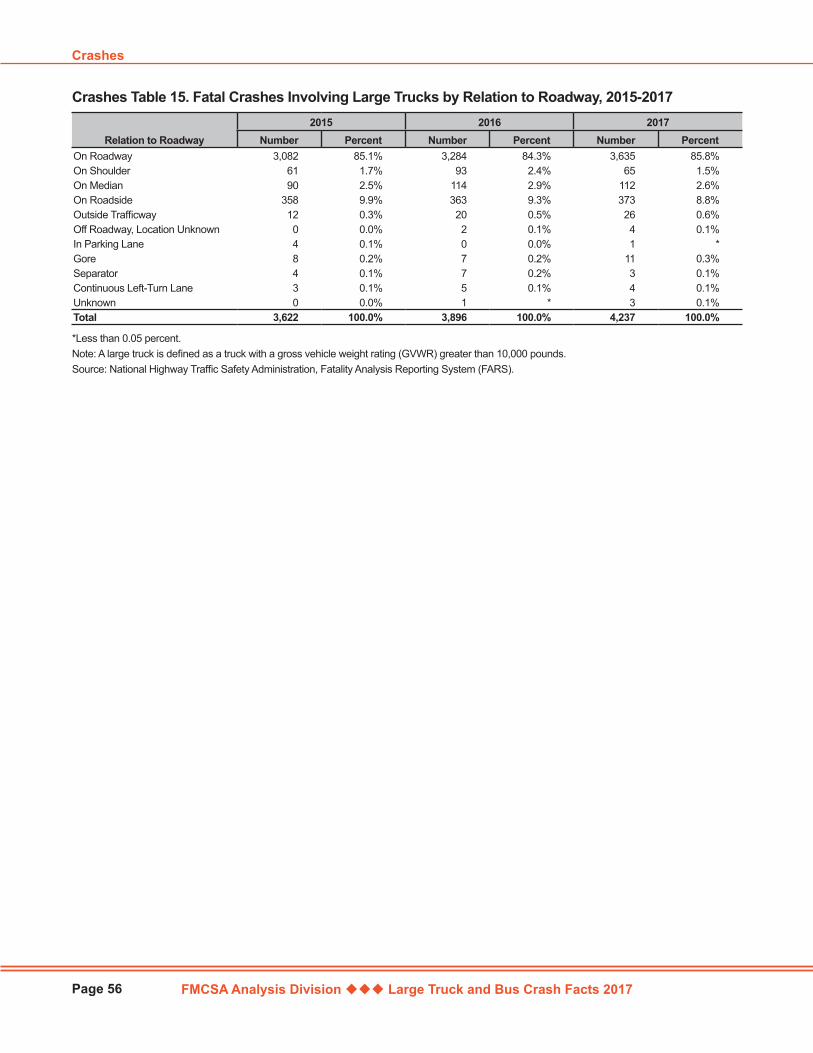
FMCSA Analysis Division Large Truck and Bus Crash Facts 2017
Crashes
Page 56
Relation to Roadway2015 2016 2017
Number Percent Number Percent Number PercentOn Roadway 3,082 85.1% 3,284 84.3% 3,635 85.8%On Shoulder 61 1.7% 93 2.4% 65 1.5%On Median 90 2.5% 114 2.9% 112 2.6%On Roadside 358 9.9% 363 9.3% 373 8.8%Outside Trafficway 12 0.3% 20 0.5% 26 0.6%Off Roadway, Location Unknown 0 0.0% 2 0.1% 4 0.1%In Parking Lane 4 0.1% 0 0.0% 1 *Gore 8 0.2% 7 0.2% 11 0.3%Separator 4 0.1% 7 0.2% 3 0.1%Continuous Left-Turn Lane 3 0.1% 5 0.1% 4 0.1%Unknown 0 0.0% 1 * 3 0.1%Total 3,622 100.0% 3,896 100.0% 4,237 100.0%
Crashes Table 15. Fatal Crashes Involving Large Trucks by Relation to Roadway, 2015-2017
*Less than 0.05 percent.Note: A large truck is defined as a truck with a gross vehicle weight rating (GVWR) greater than 10,000 pounds.Source: National Highway Traffic Safety Administration, Fatality Analysis Reporting System (FARS).
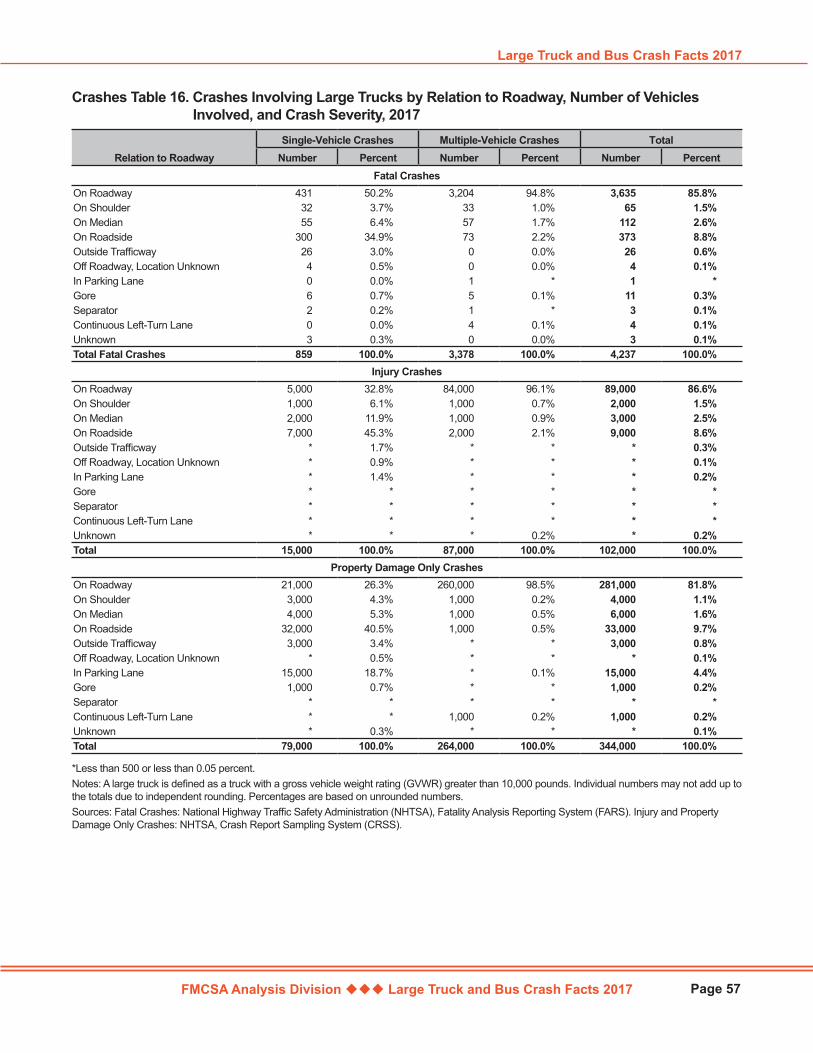
FMCSA Analysis Division Large Truck and Bus Crash Facts 2017
Large Truck and Bus Crash Facts 2017
Page 57
Relation to RoadwaySingle-Vehicle Crashes Multiple-Vehicle Crashes Total
Number Percent Number Percent Number PercentFatal Crashes
On Roadway 431 50.2% 3,204 94.8% 3,635 85.8%On Shoulder 32 3.7% 33 1.0% 65 1.5%On Median 55 6.4% 57 1.7% 112 2.6%On Roadside 300 34.9% 73 2.2% 373 8.8%Outside Trafficway 26 3.0% 0 0.0% 26 0.6%Off Roadway, Location Unknown 4 0.5% 0 0.0% 4 0.1%In Parking Lane 0 0.0% 1 * 1 *Gore 6 0.7% 5 0.1% 11 0.3%Separator 2 0.2% 1 * 3 0.1%Continuous Left-Turn Lane 0 0.0% 4 0.1% 4 0.1%Unknown 3 0.3% 0 0.0% 3 0.1%Total Fatal Crashes 859 100.0% 3,378 100.0% 4,237 100.0%
Injury CrashesOn Roadway 5,000 32.8% 84,000 96.1% 89,000 86.6%On Shoulder 1,000 6.1% 1,000 0.7% 2,000 1.5%On Median 2,000 11.9% 1,000 0.9% 3,000 2.5%On Roadside 7,000 45.3% 2,000 2.1% 9,000 8.6%Outside Trafficway * 1.7% * * * 0.3%Off Roadway, Location Unknown * 0.9% * * * 0.1%In Parking Lane * 1.4% * * * 0.2%Gore * * * * * *Separator * * * * * *Continuous Left-Turn Lane * * * * * *Unknown * * * 0.2% * 0.2%Total 15,000 100.0% 87,000 100.0% 102,000 100.0%
Property Damage Only CrashesOn Roadway 21,000 26.3% 260,000 98.5% 281,000 81.8%On Shoulder 3,000 4.3% 1,000 0.2% 4,000 1.1%On Median 4,000 5.3% 1,000 0.5% 6,000 1.6%On Roadside 32,000 40.5% 1,000 0.5% 33,000 9.7%Outside Trafficway 3,000 3.4% * * 3,000 0.8%Off Roadway, Location Unknown * 0.5% * * * 0.1%In Parking Lane 15,000 18.7% * 0.1% 15,000 4.4%Gore 1,000 0.7% * * 1,000 0.2%Separator * * * * * *Continuous Left-Turn Lane * * 1,000 0.2% 1,000 0.2%Unknown * 0.3% * * * 0.1%Total 79,000 100.0% 264,000 100.0% 344,000 100.0%
Crashes Table 16. Crashes Involving Large Trucks by Relation to Roadway, Number of Vehicles Involved, and Crash Severity, 2017
*Less than 500 or less than 0.05 percent.Notes: A large truck is defined as a truck with a gross vehicle weight rating (GVWR) greater than 10,000 pounds. Individual numbers may not add up to the totals due to independent rounding. Percentages are based on unrounded numbers.Sources: Fatal Crashes: National Highway Traffic Safety Administration (NHTSA), Fatality Analysis Reporting System (FARS). Injury and Property Damage Only Crashes: NHTSA, Crash Report Sampling System (CRSS).
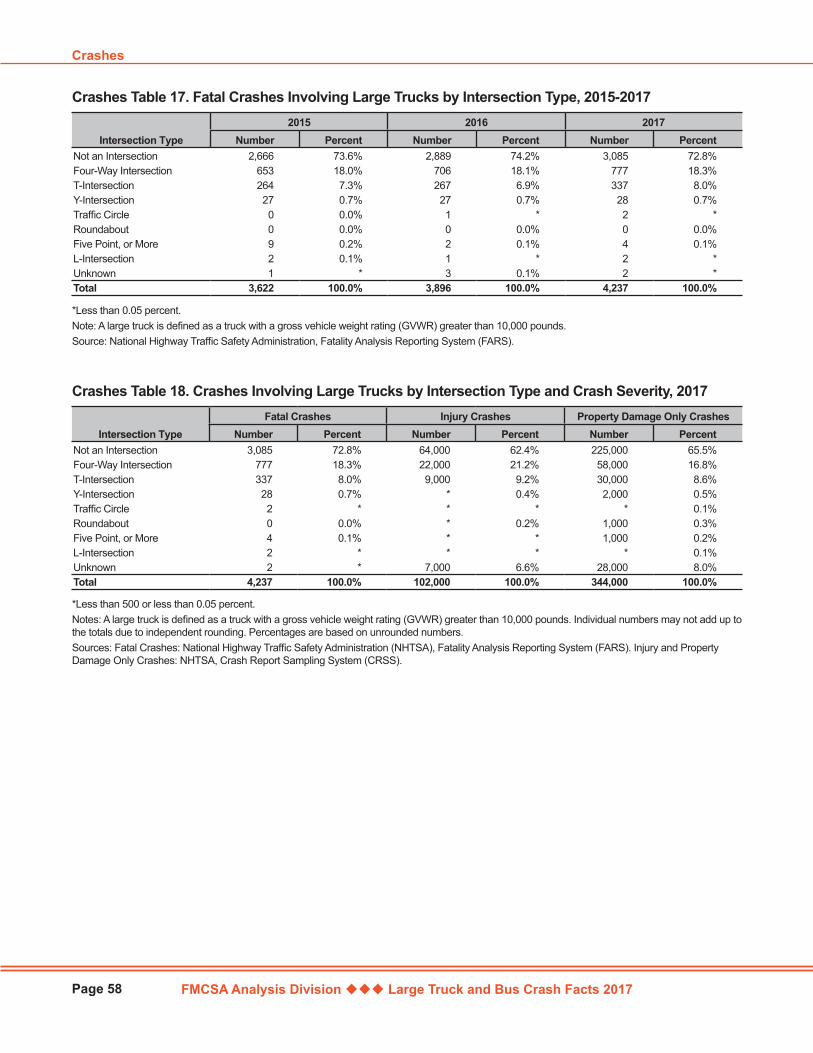
FMCSA Analysis Division Large Truck and Bus Crash Facts 2017
Crashes
Page 58
Intersection Type2015 2016 2017
Number Percent Number Percent Number PercentNot an Intersection 2,666 73.6% 2,889 74.2% 3,085 72.8%Four-Way Intersection 653 18.0% 706 18.1% 777 18.3%T-Intersection 264 7.3% 267 6.9% 337 8.0%Y-Intersection 27 0.7% 27 0.7% 28 0.7%Traffic Circle 0 0.0% 1 * 2 *Roundabout 0 0.0% 0 0.0% 0 0.0%Five Point, or More 9 0.2% 2 0.1% 4 0.1%L-Intersection 2 0.1% 1 * 2 *Unknown 1 * 3 0.1% 2 *Total 3,622 100.0% 3,896 100.0% 4,237 100.0%
Crashes Table 17. Fatal Crashes Involving Large Trucks by Intersection Type, 2015-2017
*Less than 0.05 percent. Note: A large truck is defined as a truck with a gross vehicle weight rating (GVWR) greater than 10,000 pounds.Source: National Highway Traffic Safety Administration, Fatality Analysis Reporting System (FARS).
Intersection TypeFatal Crashes Injury Crashes Property Damage Only Crashes
Number Percent Number Percent Number PercentNot an Intersection 3,085 72.8% 64,000 62.4% 225,000 65.5%Four-Way Intersection 777 18.3% 22,000 21.2% 58,000 16.8%T-Intersection 337 8.0% 9,000 9.2% 30,000 8.6%Y-Intersection 28 0.7% * 0.4% 2,000 0.5%Traffic Circle 2 * * * * 0.1%Roundabout 0 0.0% * 0.2% 1,000 0.3%Five Point, or More 4 0.1% * * 1,000 0.2%L-Intersection 2 * * * * 0.1%Unknown 2 * 7,000 6.6% 28,000 8.0%Total 4,237 100.0% 102,000 100.0% 344,000 100.0%
Crashes Table 18. Crashes Involving Large Trucks by Intersection Type and Crash Severity, 2017
*Less than 500 or less than 0.05 percent.Notes: A large truck is defined as a truck with a gross vehicle weight rating (GVWR) greater than 10,000 pounds. Individual numbers may not add up to the totals due to independent rounding. Percentages are based on unrounded numbers.Sources: Fatal Crashes: National Highway Traffic Safety Administration (NHTSA), Fatality Analysis Reporting System (FARS). Injury and Property Damage Only Crashes: NHTSA, Crash Report Sampling System (CRSS).

FMCSA Analysis Division Large Truck and Bus Crash Facts 2017
Large Truck and Bus Crash Facts 2017
Page 59
Weather Conditions2015 2016 2017
Number Percent Number Percent Number PercentClear 2,510 69.3% 2,761 70.9% 2,799 66.1%Cloudy 631 17.4% 569 14.6% 619 14.6%Rain 276 7.6% 240 6.2% 344 8.1%Sleet, Hail 17 0.5% 12 0.3% 10 0.2%Snow 65 1.8% 58 1.5% 67 1.6%Fog, Smog, Smoke 83 2.3% 54 1.4% 77 1.8%Severe Crosswinds 3 0.1% 8 0.2% 16 0.4%Blowing Sand, Soil, Dirt 8 0.2% 4 0.1% 5 0.1%Blowing Snow 8 0.2% 2 0.1% 6 0.1%Freezing Rain or Drizzle 3 0.1% 2 0.1% 4 0.1%Other 8 0.2% 4 0.1% 4 0.1%Unknown 10 0.3% 182 4.7% 286 6.8%Total 3,622 100.0% 3,896 100.0% 4,237 100.0%
Crashes Table 19. Fatal Crashes Involving Large Trucks by Weather Conditions, 2015-2017
Note: A large truck is defined as a truck with a gross vehicle weight rating (GVWR) greater than 10,000 pounds.Source: National Highway Traffic Safety Administration, Fatality Analysis Reporting System (FARS).
Weather ConditionsFatal Crashes Injury Crashes Property Damage Only Crashes
Number Percent Number Percent Number PercentClear 2,799 66.1% 71,000 68.9% 247,000 71.9%Cloudy 619 14.6% 19,000 18.8% 55,000 16.0%Rain 344 8.1% 10,000 9.5% 29,000 8.5%Sleet, Hail 10 0.2% * * * 0.1%Snow 67 1.6% 1,000 1.3% 7,000 2.1%Fog, Smog, Smoke 77 1.8% 1,000 0.5% 3,000 0.8%Severe Crosswinds 16 0.4% * 0.3% 1,000 0.3%Blowing Sand, Soil, Dirt 5 0.1% * 0.1% * *Blowing Snow 6 0.1% * 0.1% * 0.1%Freezing Rain or Drizzle 4 0.1% * 0.1% 1,000 0.2%Other 4 0.1% * 0.3% * *Unknown 286 6.8% * * * *Total 4,237 100.0% 102,000 100.0% 344,000 100.0%
Crashes Table 20. Crashes Involving Large Trucks by Weather Conditions and Crash Severity, 2017
*Less than 500 or less than 0.05 percent.Notes: A large truck is defined as a truck with a gross vehicle weight rating (GVWR) greater than 10,000 pounds. Individual numbers may not add up to the totals due to independent rounding. Percentages are based on unrounded numbers.Sources: Fatal Crashes: National Highway Traffic Safety Administration (NHTSA), Fatality Analysis Reporting System (FARS). Injury and Property Damage Only Crashes: NHTSA, Crash Report Sampling System (CRSS).
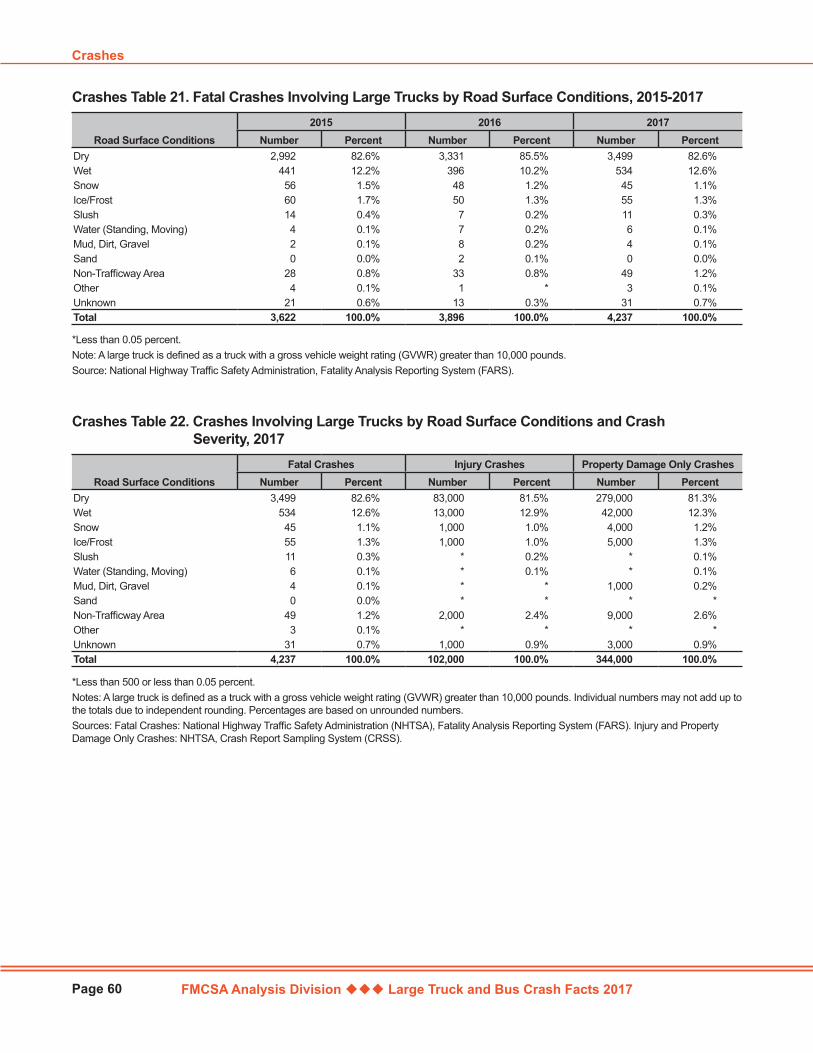
FMCSA Analysis Division Large Truck and Bus Crash Facts 2017
Crashes
Page 60
Road Surface Conditions2015 2016 2017
Number Percent Number Percent Number PercentDry 2,992 82.6% 3,331 85.5% 3,499 82.6%Wet 441 12.2% 396 10.2% 534 12.6%Snow 56 1.5% 48 1.2% 45 1.1%Ice/Frost 60 1.7% 50 1.3% 55 1.3%Slush 14 0.4% 7 0.2% 11 0.3%Water (Standing, Moving) 4 0.1% 7 0.2% 6 0.1%Mud, Dirt, Gravel 2 0.1% 8 0.2% 4 0.1%Sand 0 0.0% 2 0.1% 0 0.0%Non-Trafficway Area 28 0.8% 33 0.8% 49 1.2%Other 4 0.1% 1 * 3 0.1%Unknown 21 0.6% 13 0.3% 31 0.7%Total 3,622 100.0% 3,896 100.0% 4,237 100.0%
Crashes Table 21. Fatal Crashes Involving Large Trucks by Road Surface Conditions, 2015-2017
*Less than 0.05 percent.Note: A large truck is defined as a truck with a gross vehicle weight rating (GVWR) greater than 10,000 pounds.Source: National Highway Traffic Safety Administration, Fatality Analysis Reporting System (FARS).
Road Surface ConditionsFatal Crashes Injury Crashes Property Damage Only Crashes
Number Percent Number Percent Number PercentDry 3,499 82.6% 83,000 81.5% 279,000 81.3%Wet 534 12.6% 13,000 12.9% 42,000 12.3%Snow 45 1.1% 1,000 1.0% 4,000 1.2%Ice/Frost 55 1.3% 1,000 1.0% 5,000 1.3%Slush 11 0.3% * 0.2% * 0.1%Water (Standing, Moving) 6 0.1% * 0.1% * 0.1%Mud, Dirt, Gravel 4 0.1% * * 1,000 0.2%Sand 0 0.0% * * * *Non-Trafficway Area 49 1.2% 2,000 2.4% 9,000 2.6%Other 3 0.1% * * * *Unknown 31 0.7% 1,000 0.9% 3,000 0.9%Total 4,237 100.0% 102,000 100.0% 344,000 100.0%
Crashes Table 22. Crashes Involving Large Trucks by Road Surface Conditions and Crash Severity, 2017
*Less than 500 or less than 0.05 percent. Notes: A large truck is defined as a truck with a gross vehicle weight rating (GVWR) greater than 10,000 pounds. Individual numbers may not add up to the totals due to independent rounding. Percentages are based on unrounded numbers.Sources: Fatal Crashes: National Highway Traffic Safety Administration (NHTSA), Fatality Analysis Reporting System (FARS). Injury and Property Damage Only Crashes: NHTSA, Crash Report Sampling System (CRSS).

FMCSA Analysis Division Large Truck and Bus Crash Facts 2017
Large Truck and Bus Crash Facts 2017
Page 61
Light Conditions2015 2016 2017
Number Percent Number Percent Number PercentDaylight 2,222 61.3% 2,380 61.1% 2,611 61.6%Dark, Not Lighted 858 23.7% 954 24.5% 1,020 24.1%Dark But Lighted 365 10.1% 405 10.4% 406 9.6%Dark, Unknown Lighting 7 0.2% 11 0.3% 5 0.1%Dawn 115 3.2% 93 2.4% 123 2.9%Dusk 52 1.4% 50 1.3% 70 1.7%Unknown 3 0.1% 3 0.1% 2 *Total 3,622 100.0% 3,896 100.0% 4,237 100.0%
Crashes Table 23. Fatal Crashes Involving Large Trucks by Light Conditions, 2015-2017
*Less than 0.05 percent.Note: A large truck is defined as a truck with a gross vehicle weight rating (GVWR) greater than 10,000 pounds.Source: National Highway Traffic Safety Administration, Fatality Analysis Reporting System (FARS).
Light ConditionsFatal Crashes Injury Crashes Property Damage Only Crashes
Number Percent Number Percent Number PercentDaylight 2,611 61.6% 78,000 76.5% 272,000 79.3%Dark, Not Lighted 1,020 24.1% 10,000 9.7% 32,000 9.3%Dark But Lighted 406 9.6% 10,000 10.0% 26,000 7.6%Dark, Unknown Lighting 5 0.1% 1,000 0.5% 2,000 0.6%Dawn 123 2.9% 2,000 2.3% 6,000 1.8%Dusk 70 1.7% 1,000 1.1% 5,000 1.4%Unknown 2 * * * * *Total 4,237 100.0% 102,000 100.0% 344,000 100.0%
Crashes Table 24. Crashes Involving Large Trucks by Light Conditions and Crash Severity, 2017
*Less than 500 or less than 0.05 percent. Notes: A large truck is defined as a truck with a gross vehicle weight rating (GVWR) greater than 10,000 pounds. Individual numbers may not add up to the totals due to independent rounding. Percentages are based on unrounded numbers.Sources: Fatal Crashes: National Highway Traffic Safety Administration (NHTSA), Fatality Analysis Reporting System (FARS). Injury and Property Damage Only Crashes: NHTSA, Crash Report Sampling Syste (CRSS).

FMCSA Analysis Division Large Truck and Bus Crash Facts 2017
Crashes
Page 62
Work Zone2015 2016 2017
Number Percent Number Percent Number PercentFatal Crashes Involving Large Trucks
No 3,447 95.2% 3,709 95.2% 4,021 94.9%Yes 175 4.8% 187 4.8% 216 5.1% Construction Zone 123 3.4% 129 3.3% 148 3.5% Maintenance Zone 22 0.6% 11 0.3% 15 0.4% Utility Work Zone 1 * 8 0.2% 3 0.1% Work Zone, Type Unknown 29 0.8% 39 1.0% 50 1.2%Unknown 0 0.0% 0 0.0% 0 0.0%Total 3,622 100.0% 3,896 100.0% 4,237 100.0%
All Fatal CrashesNo 31,886 98.0% 34,061 98.0% 33,537 97.9%Yes 653 2.0% 687 2.0% 710 2.1% Construction Zone 451 1.4% 451 1.3% 441 1.3% Maintenance Zone 65 0.2% 50 0.1% 47 0.1% Utility Work Zone 8 * 16 * 11 * Work Zone, Type Unknown 129 0.4% 170 0.5% 211 0.6%Unknown 0 0.0% 0 0.0% 0 0.0%Total 32,539 100.0% 34,748 100.0% 34,247 100.0%Percentage of Fatal Work Zone Crashes That Involved at Least One Large Truck 26.8% 27.2% 30.4%
Percentage of All Fatal Crashes That Involved at Least One Large Truck 11.1% 11.2% 12.4%
Crashes Table 25. Fatal Crashes by Work Zone, 2015-2017
*Less than 0.05 percent.Notes: A large truck is defined as a truck with a gross vehicle weight rating (GVWR) greater than 10,000 pounds. A work zone is an area of a trafficway where construction, maintenance, or utility work activities are identified by warning signs/signals/indicators.Source: National Highway Traffic Safety Administration, Fatality Analysis Reporting System (FARS).

FMCSA Analysis Division Large Truck and Bus Crash Facts 2017
Large Truck and Bus Crash Facts 2017
Page 63
Work ZoneFatal Crashes Injury Crashes
Property Damage Only Crashes
Number Percent Number Percent Number PercentCrashes Involving Large Trucks
No 4,021 94.9% 99,000 97.0% 329,000 95.6%Yes 216 5.1% 3,000 3.0% 15,000 4.4% Construction Zone 148 3.5% 2,000 2.2% 10,000 2.9% Maintenance Zone 15 0.4% * 0.2% 1,000 0.2% Utility Work Zone 3 0.1% * * * * Work Zone, Type Unknown 50 1.2% 1,000 0.6% 4,000 1.2%Unknown 0 0.0% * * * *Total 4,237 100.0% 102,000 100.0% 344,000 100.0%
All CrashesNo 33,537 97.9% 1,862,000 98.6% 4,462,000 98.5%Yes 710 2.1% 26,000 1.4% 68,000 1.5% Construction Zone 441 1.3% 17,000 0.9% 40,000 0.9% Maintenance Zone 47 0.1% 1,000 0.1% 3,000 0.1% Utility Work Zone 11 * 1,000 * 1,000 * Work Zone, Type Unknown 211 0.6% 8,000 0.4% 24,000 0.5%Unknown 0 0.0% * * * *Total 34,247 100.0% 1,889,000 100.0% 4,530,000 100.0%Percentage of Fatal Work Zone Crashes That Involved at Least One Large Truck 30.4% 11.7% 22.2%
Percentage of All Fatal Crashes That Involved at Least One Large Truck 12.4% 5.4% 7.6%
Crashes Table 26. Crashes by Work Zone and Crash Severity, 2017
*Less than 500 or less than 0.05 percent.Notes: A large truck is defined as a truck with a gross vehicle weight rating (GVWR) greater than 10,000 pounds. A work zone is an area of a trafficway where construction, maintenance, or utility work activities are identified by warning signs/signals/indicators. Individual numbers may not add up to the totals due to independent rounding. Percentages are based on unrounded numbers.Sources: Fatal Crashes: National Highway Traffic Safety Administration (NHTSA), Fatality Analysis Reporting System (FARS). Injury and Property Damage Only Crashes: NHTSA, Crash Report Sampling System (CRSS).
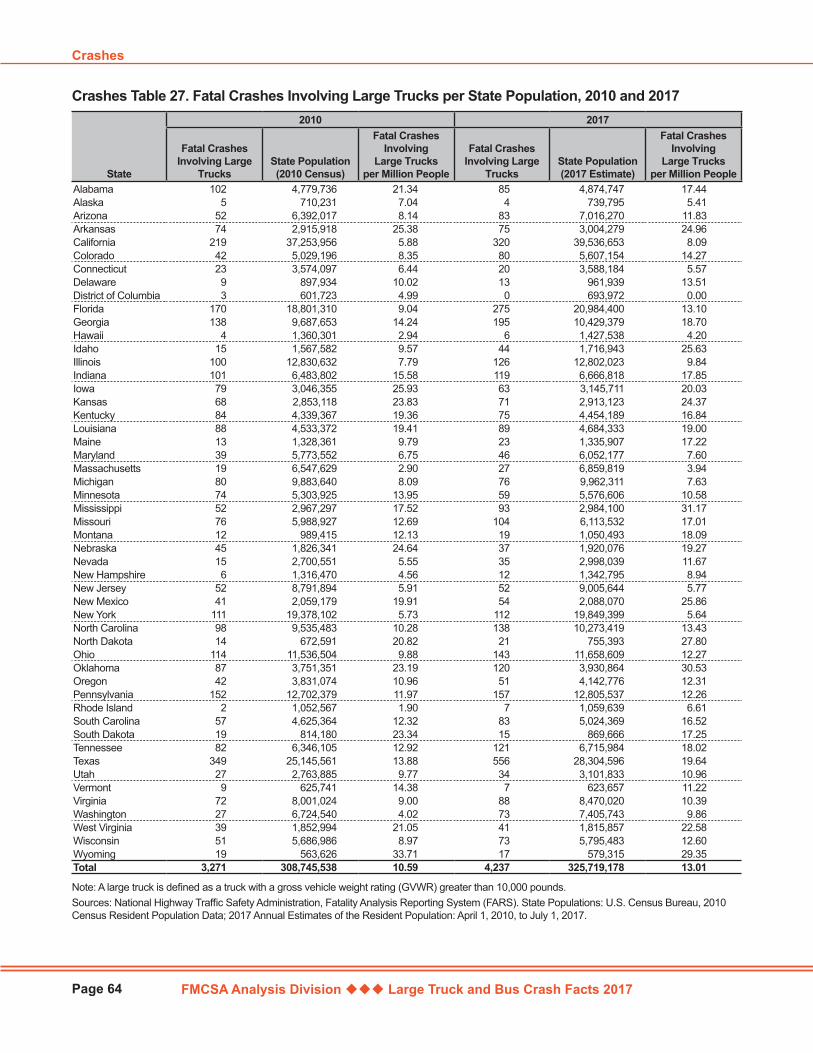
FMCSA Analysis Division Large Truck and Bus Crash Facts 2017
Crashes
Page 64
State
2010 2017
Fatal Crashes Involving Large
TrucksState Population (2010 Census)
Fatal Crashes Involving
Large Trucks per Million People
Fatal Crashes Involving Large
TrucksState Population (2017 Estimate)
Fatal Crashes Involving
Large Trucks per Million People
Alabama 102 4,779,736 21.34 85 4,874,747 17.44Alaska 5 710,231 7.04 4 739,795 5.41Arizona 52 6,392,017 8.14 83 7,016,270 11.83Arkansas 74 2,915,918 25.38 75 3,004,279 24.96California 219 37,253,956 5.88 320 39,536,653 8.09Colorado 42 5,029,196 8.35 80 5,607,154 14.27Connecticut 23 3,574,097 6.44 20 3,588,184 5.57Delaware 9 897,934 10.02 13 961,939 13.51District of Columbia 3 601,723 4.99 0 693,972 0.00Florida 170 18,801,310 9.04 275 20,984,400 13.10Georgia 138 9,687,653 14.24 195 10,429,379 18.70Hawaii 4 1,360,301 2.94 6 1,427,538 4.20Idaho 15 1,567,582 9.57 44 1,716,943 25.63Illinois 100 12,830,632 7.79 126 12,802,023 9.84Indiana 101 6,483,802 15.58 119 6,666,818 17.85Iowa 79 3,046,355 25.93 63 3,145,711 20.03Kansas 68 2,853,118 23.83 71 2,913,123 24.37Kentucky 84 4,339,367 19.36 75 4,454,189 16.84Louisiana 88 4,533,372 19.41 89 4,684,333 19.00Maine 13 1,328,361 9.79 23 1,335,907 17.22Maryland 39 5,773,552 6.75 46 6,052,177 7.60Massachusetts 19 6,547,629 2.90 27 6,859,819 3.94Michigan 80 9,883,640 8.09 76 9,962,311 7.63Minnesota 74 5,303,925 13.95 59 5,576,606 10.58Mississippi 52 2,967,297 17.52 93 2,984,100 31.17Missouri 76 5,988,927 12.69 104 6,113,532 17.01Montana 12 989,415 12.13 19 1,050,493 18.09Nebraska 45 1,826,341 24.64 37 1,920,076 19.27Nevada 15 2,700,551 5.55 35 2,998,039 11.67New Hampshire 6 1,316,470 4.56 12 1,342,795 8.94New Jersey 52 8,791,894 5.91 52 9,005,644 5.77New Mexico 41 2,059,179 19.91 54 2,088,070 25.86New York 111 19,378,102 5.73 112 19,849,399 5.64North Carolina 98 9,535,483 10.28 138 10,273,419 13.43North Dakota 14 672,591 20.82 21 755,393 27.80Ohio 114 11,536,504 9.88 143 11,658,609 12.27Oklahoma 87 3,751,351 23.19 120 3,930,864 30.53Oregon 42 3,831,074 10.96 51 4,142,776 12.31Pennsylvania 152 12,702,379 11.97 157 12,805,537 12.26Rhode Island 2 1,052,567 1.90 7 1,059,639 6.61South Carolina 57 4,625,364 12.32 83 5,024,369 16.52South Dakota 19 814,180 23.34 15 869,666 17.25Tennessee 82 6,346,105 12.92 121 6,715,984 18.02Texas 349 25,145,561 13.88 556 28,304,596 19.64Utah 27 2,763,885 9.77 34 3,101,833 10.96Vermont 9 625,741 14.38 7 623,657 11.22Virginia 72 8,001,024 9.00 88 8,470,020 10.39Washington 27 6,724,540 4.02 73 7,405,743 9.86West Virginia 39 1,852,994 21.05 41 1,815,857 22.58Wisconsin 51 5,686,986 8.97 73 5,795,483 12.60Wyoming 19 563,626 33.71 17 579,315 29.35Total 3,271 308,745,538 10.59 4,237 325,719,178 13.01
Crashes Table 27. Fatal Crashes Involving Large Trucks per State Population, 2010 and 2017
Note: A large truck is defined as a truck with a gross vehicle weight rating (GVWR) greater than 10,000 pounds.Sources: National Highway Traffic Safety Administration, Fatality Analysis Reporting System (FARS). State Populations: U.S. Census Bureau, 2010 Census Resident Population Data; 2017 Annual Estimates of the Resident Population: April 1, 2010, to July 1, 2017.
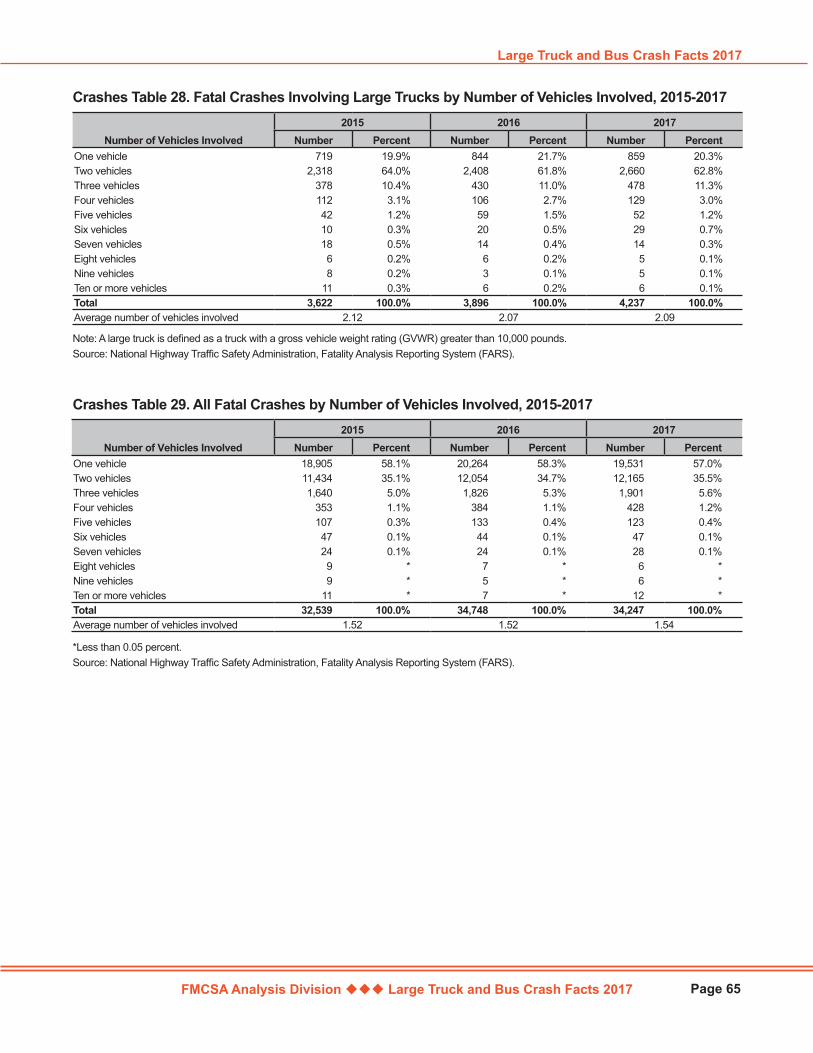
FMCSA Analysis Division Large Truck and Bus Crash Facts 2017
Large Truck and Bus Crash Facts 2017
Page 65
Number of Vehicles Involved2015 2016 2017
Number Percent Number Percent Number PercentOne vehicle 18,905 58.1% 20,264 58.3% 19,531 57.0%Two vehicles 11,434 35.1% 12,054 34.7% 12,165 35.5%Three vehicles 1,640 5.0% 1,826 5.3% 1,901 5.6%Four vehicles 353 1.1% 384 1.1% 428 1.2%Five vehicles 107 0.3% 133 0.4% 123 0.4%Six vehicles 47 0.1% 44 0.1% 47 0.1%Seven vehicles 24 0.1% 24 0.1% 28 0.1%Eight vehicles 9 * 7 * 6 *Nine vehicles 9 * 5 * 6 *Ten or more vehicles 11 * 7 * 12 *Total 32,539 100.0% 34,748 100.0% 34,247 100.0%Average number of vehicles involved 1.52 1.52 1.54
Number of Vehicles Involved2015 2016 2017
Number Percent Number Percent Number PercentOne vehicle 719 19.9% 844 21.7% 859 20.3%Two vehicles 2,318 64.0% 2,408 61.8% 2,660 62.8%Three vehicles 378 10.4% 430 11.0% 478 11.3%Four vehicles 112 3.1% 106 2.7% 129 3.0%Five vehicles 42 1.2% 59 1.5% 52 1.2%Six vehicles 10 0.3% 20 0.5% 29 0.7%Seven vehicles 18 0.5% 14 0.4% 14 0.3%Eight vehicles 6 0.2% 6 0.2% 5 0.1%Nine vehicles 8 0.2% 3 0.1% 5 0.1%Ten or more vehicles 11 0.3% 6 0.2% 6 0.1%Total 3,622 100.0% 3,896 100.0% 4,237 100.0%Average number of vehicles involved 2.12 2.07 2.09
Crashes Table 28. Fatal Crashes Involving Large Trucks by Number of Vehicles Involved, 2015-2017
Note: A large truck is defined as a truck with a gross vehicle weight rating (GVWR) greater than 10,000 pounds.Source: National Highway Traffic Safety Administration, Fatality Analysis Reporting System (FARS).
Crashes Table 29. All Fatal Crashes by Number of Vehicles Involved, 2015-2017
*Less than 0.05 percent.Source: National Highway Traffic Safety Administration, Fatality Analysis Reporting System (FARS).
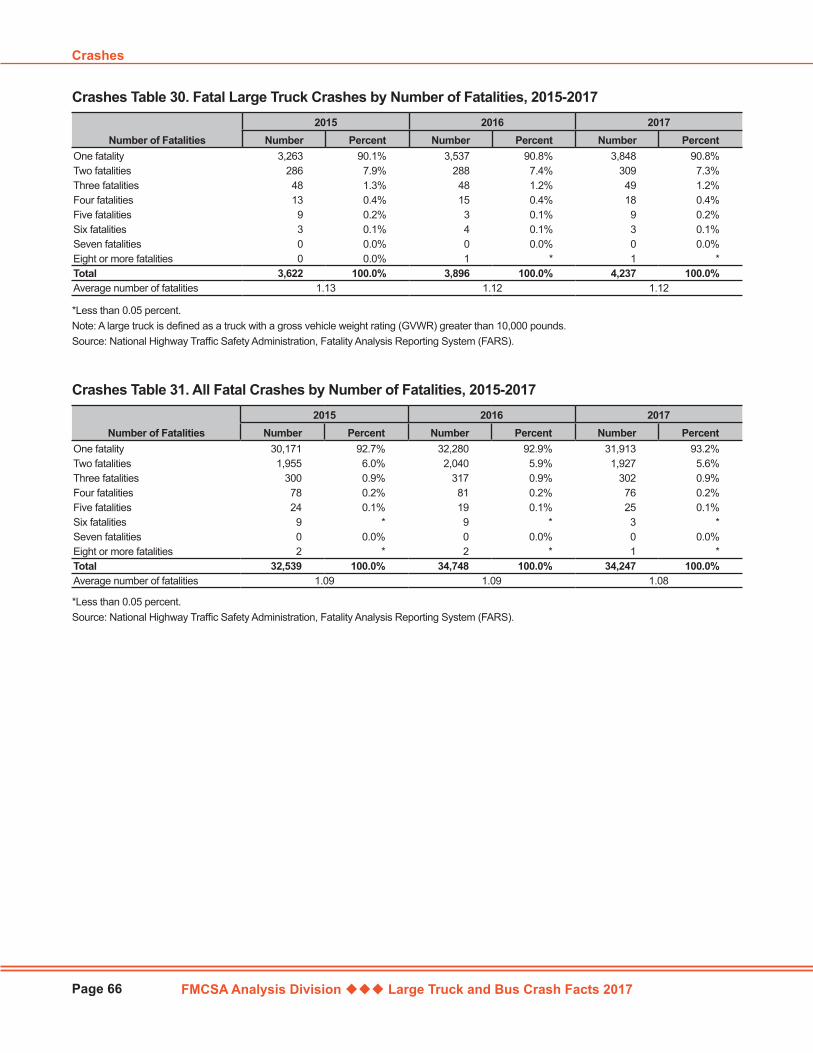
FMCSA Analysis Division Large Truck and Bus Crash Facts 2017
Crashes
Page 66
Number of Fatalities2015 2016 2017
Number Percent Number Percent Number PercentOne fatality 3,263 90.1% 3,537 90.8% 3,848 90.8%Two fatalities 286 7.9% 288 7.4% 309 7.3%Three fatalities 48 1.3% 48 1.2% 49 1.2%Four fatalities 13 0.4% 15 0.4% 18 0.4%Five fatalities 9 0.2% 3 0.1% 9 0.2%Six fatalities 3 0.1% 4 0.1% 3 0.1%Seven fatalities 0 0.0% 0 0.0% 0 0.0%Eight or more fatalities 0 0.0% 1 * 1 *Total 3,622 100.0% 3,896 100.0% 4,237 100.0%Average number of fatalities 1.13 1.12 1.12
Crashes Table 30. Fatal Large Truck Crashes by Number of Fatalities, 2015-2017
*Less than 0.05 percent. Note: A large truck is defined as a truck with a gross vehicle weight rating (GVWR) greater than 10,000 pounds.Source: National Highway Traffic Safety Administration, Fatality Analysis Reporting System (FARS).
Number of Fatalities2015 2016 2017
Number Percent Number Percent Number PercentOne fatality 30,171 92.7% 32,280 92.9% 31,913 93.2%Two fatalities 1,955 6.0% 2,040 5.9% 1,927 5.6%Three fatalities 300 0.9% 317 0.9% 302 0.9%Four fatalities 78 0.2% 81 0.2% 76 0.2%Five fatalities 24 0.1% 19 0.1% 25 0.1%Six fatalities 9 * 9 * 3 *Seven fatalities 0 0.0% 0 0.0% 0 0.0%Eight or more fatalities 2 * 2 * 1 *Total 32,539 100.0% 34,748 100.0% 34,247 100.0%Average number of fatalities 1.09 1.09 1.08
Crashes Table 31. All Fatal Crashes by Number of Fatalities, 2015-2017
*Less than 0.05 percent.Source: National Highway Traffic Safety Administration, Fatality Analysis Reporting System (FARS).
FMCSA Analysis Division Large Truck and Bus Crash Facts 2017 Page 67
VehiclesThis chapter presents information on large trucks involved in fatal, injury, and property damage only crashes. Some of the data in this chapter come from the MCMIS Crash File, which contains data on trucks and buses in crashes that meet the SAFETYNET crash severity thresholds. MCMIS data are used for the tables on crashes by vehicle configuration (Vehicles Table 2), cargo body type (Vehicles Table 4), gross vehicle weight rating (Vehicles Table 6), hazardous materials cargo (Vehicles Table 9), and hazardous materials released (Vehicles Table 11). SAFETYNET nonfatal crashes tend to be more serious than GES and CRSS nonfatal crashes, because the SAFETYNET threshold requires at least one injury involving immediate medical attention away from the crash scene, or at least one vehicle disabled as a result of the crash and transported away from the crash scene. Below is a summary of some of the information on vehicles in crashes in 2017 in this section:
In 2017, 4,657 large trucks were involved in fatal crashes. According to MCMIS, 56,422 large trucks were involved in injury crashes, and 102,973 were involved in towaway crashes.
Hazardous materials (HM) cargo was present on 3 percent of the large trucks involved in fatal crashes and 2 percent of those in nonfatal crashes. HM was released from the cargo compartments of 16 percent of the placarded trucks in fatal and nonfatal crashes. Flammable liquids (gasoline, fuel oil, etc.) accounted for 63 percent of the HM releases from cargo compartments in fatal crashes and 45 percent of the HM releases in nonfatal crashes..
"Collision with vehicle in transport" was recorded as the most harmful event for 75 percent of the large trucks involved in fatal crashes and for 77 percent of the large trucks involved in nonfatal crashes.
The critical precrash event for 73 percent of the large trucks in fatal crashes was another vehicle, person, animal, or object in the large truck’s lane or encroaching into it. Twently-three percent of the large trucks in fatal crashes had critical precrash events of their own movement or loss of control.
Singles (truck tractors pulling a single semi-trailer) accounted for 59 percent of the large trucks involved in fatal crashes in 2017; doubles (tractors pulling two trailers) made up 2 percent of the large trucks involved in fatal crashes; and triples (tractors pulling three trailers) accounted for 0.3 percent of all large trucks involved in fatal crashes.
Vehicle-related factors were coded for 5 percent of the large trucks involved in fatal crashes and 3 percent of the passenger vehicles involved in fatal crashes. "Other Working Vehicle" and "Tires" were the most common vehicle-related factors for large trucks in fatal crashes, at 2 percent and 1 percent, respectively. "Tires" was the most frequently coded vehicle-related factor for passenger vehicles in fatal crashes, at 1 percent.
From 2015 to 2017:
The number of large trucks in fatal crashes weighing 10,001 to 14,000 pounds increased 225 percent, from 144 to 468.
The number of medium/heavy pickup trucks in fatal crashes increased 151 percent, from 133 to 334.
The number of large trucks with no issuing authority in fatal crashes increased 95 percent, from 295 to 574.
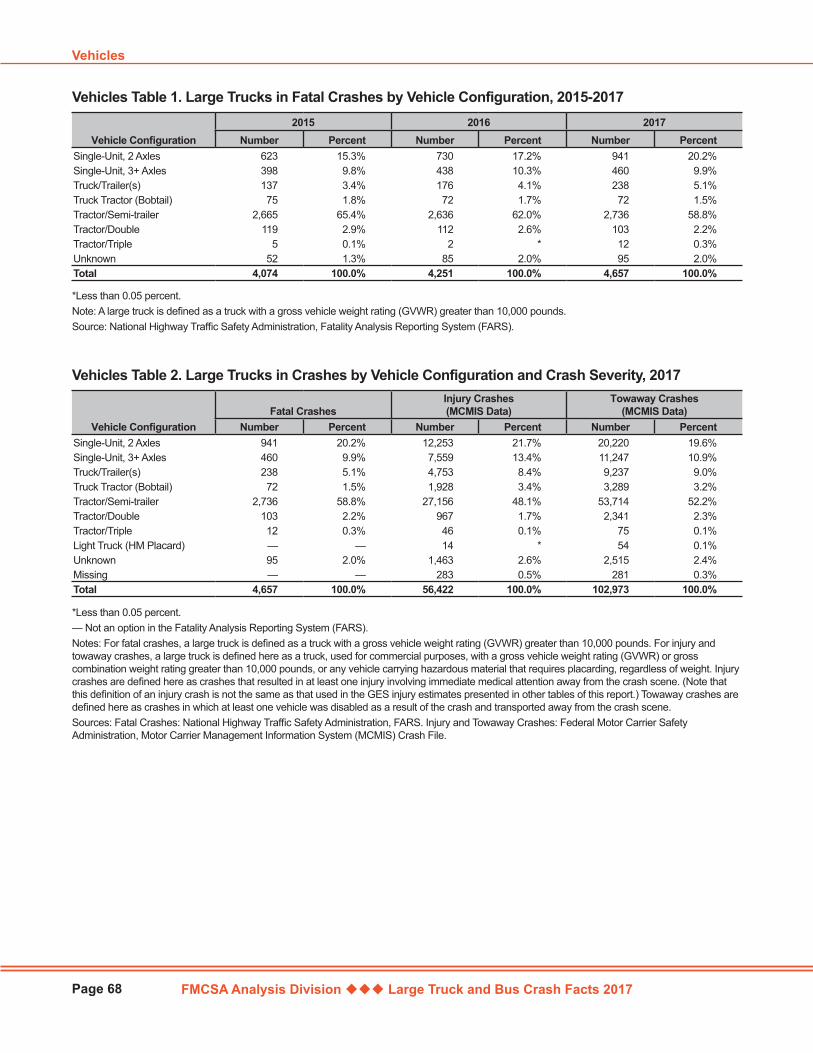
FMCSA Analysis Division Large Truck and Bus Crash Facts 2017
Vehicles
Page 68
Vehicle Configuration2015 2016 2017
Number Percent Number Percent Number PercentSingle-Unit, 2 Axles 623 15.3% 730 17.2% 941 20.2%Single-Unit, 3+ Axles 398 9.8% 438 10.3% 460 9.9%Truck/Trailer(s) 137 3.4% 176 4.1% 238 5.1%Truck Tractor (Bobtail) 75 1.8% 72 1.7% 72 1.5%Tractor/Semi-trailer 2,665 65.4% 2,636 62.0% 2,736 58.8%Tractor/Double 119 2.9% 112 2.6% 103 2.2%Tractor/Triple 5 0.1% 2 * 12 0.3%Unknown 52 1.3% 85 2.0% 95 2.0%Total 4,074 100.0% 4,251 100.0% 4,657 100.0%
Vehicles Table 1. Large Trucks in Fatal Crashes by Vehicle Configuration, 2015-2017
*Less than 0.05 percent. Note: A large truck is defined as a truck with a gross vehicle weight rating (GVWR) greater than 10,000 pounds.Source: National Highway Traffic Safety Administration, Fatality Analysis Reporting System (FARS).
Vehicle ConfigurationFatal Crashes
Injury Crashes (MCMIS Data)
Towaway Crashes (MCMIS Data)
Number Percent Number Percent Number PercentSingle-Unit, 2 Axles 941 20.2% 12,253 21.7% 20,220 19.6%Single-Unit, 3+ Axles 460 9.9% 7,559 13.4% 11,247 10.9%Truck/Trailer(s) 238 5.1% 4,753 8.4% 9,237 9.0%Truck Tractor (Bobtail) 72 1.5% 1,928 3.4% 3,289 3.2%Tractor/Semi-trailer 2,736 58.8% 27,156 48.1% 53,714 52.2%Tractor/Double 103 2.2% 967 1.7% 2,341 2.3%Tractor/Triple 12 0.3% 46 0.1% 75 0.1%Light Truck (HM Placard) — — 14 * 54 0.1%Unknown 95 2.0% 1,463 2.6% 2,515 2.4%Missing — — 283 0.5% 281 0.3%Total 4,657 100.0% 56,422 100.0% 102,973 100.0%
Vehicles Table 2. Large Trucks in Crashes by Vehicle Configuration and Crash Severity, 2017
*Less than 0.05 percent.— Not an option in the Fatality Analysis Reporting System (FARS).Notes: For fatal crashes, a large truck is defined as a truck with a gross vehicle weight rating (GVWR) greater than 10,000 pounds. For injury and towaway crashes, a large truck is defined here as a truck, used for commercial purposes, with a gross vehicle weight rating (GVWR) or gross combination weight rating greater than 10,000 pounds, or any vehicle carrying hazardous material that requires placarding, regardless of weight. Injury crashes are defined here as crashes that resulted in at least one injury involving immediate medical attention away from the crash scene. (Note that this definition of an injury crash is not the same as that used in the GES injury estimates presented in other tables of this report.) Towaway crashes are defined here as crashes in which at least one vehicle was disabled as a result of the crash and transported away from the crash scene.Sources: Fatal Crashes: National Highway Traffic Safety Administration, FARS. Injury and Towaway Crashes: Federal Motor Carrier Safety Administration, Motor Carrier Management Information System (MCMIS) Crash File.
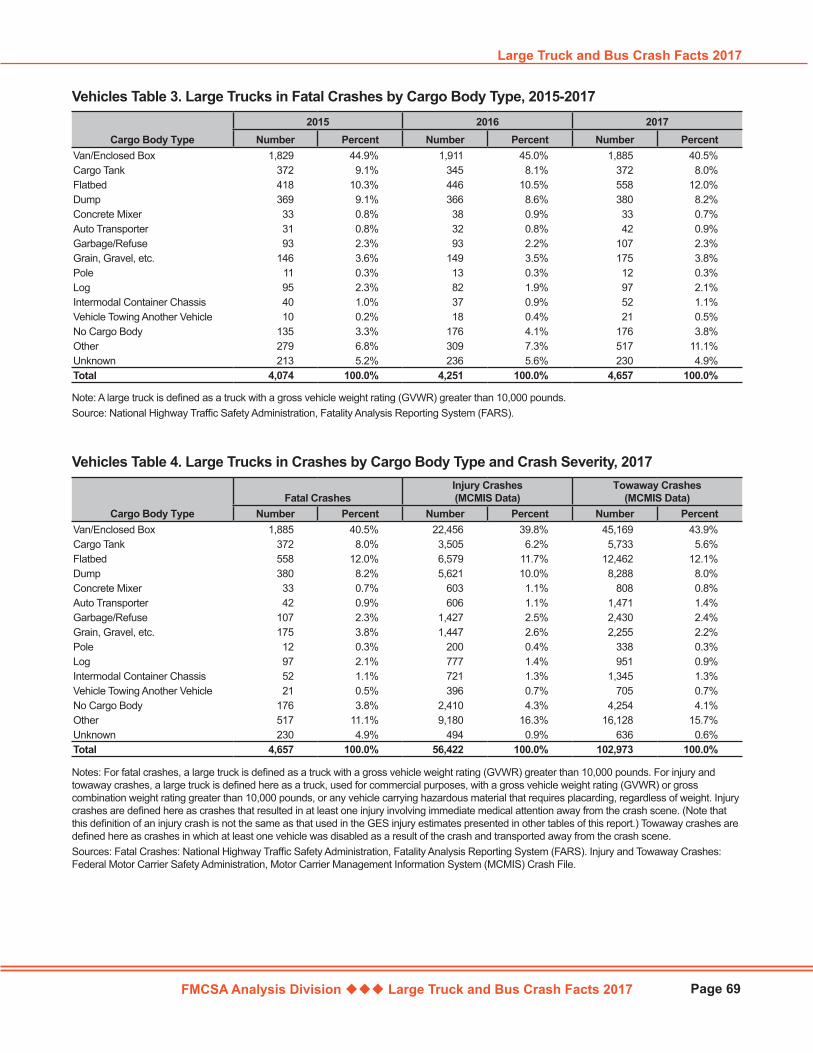
FMCSA Analysis Division Large Truck and Bus Crash Facts 2017
Large Truck and Bus Crash Facts 2017
Page 69
Cargo Body Type2015 2016 2017
Number Percent Number Percent Number PercentVan/Enclosed Box 1,829 44.9% 1,911 45.0% 1,885 40.5%Cargo Tank 372 9.1% 345 8.1% 372 8.0%Flatbed 418 10.3% 446 10.5% 558 12.0%Dump 369 9.1% 366 8.6% 380 8.2%Concrete Mixer 33 0.8% 38 0.9% 33 0.7%Auto Transporter 31 0.8% 32 0.8% 42 0.9%Garbage/Refuse 93 2.3% 93 2.2% 107 2.3%Grain, Gravel, etc. 146 3.6% 149 3.5% 175 3.8%Pole 11 0.3% 13 0.3% 12 0.3%Log 95 2.3% 82 1.9% 97 2.1%Intermodal Container Chassis 40 1.0% 37 0.9% 52 1.1%Vehicle Towing Another Vehicle 10 0.2% 18 0.4% 21 0.5%No Cargo Body 135 3.3% 176 4.1% 176 3.8%Other 279 6.8% 309 7.3% 517 11.1%Unknown 213 5.2% 236 5.6% 230 4.9%Total 4,074 100.0% 4,251 100.0% 4,657 100.0%
Vehicles Table 3. Large Trucks in Fatal Crashes by Cargo Body Type, 2015-2017
Note: A large truck is defined as a truck with a gross vehicle weight rating (GVWR) greater than 10,000 pounds.Source: National Highway Traffic Safety Administration, Fatality Analysis Reporting System (FARS).
Cargo Body TypeFatal Crashes
Injury Crashes (MCMIS Data)
Towaway Crashes (MCMIS Data)
Number Percent Number Percent Number PercentVan/Enclosed Box 1,885 40.5% 22,456 39.8% 45,169 43.9%Cargo Tank 372 8.0% 3,505 6.2% 5,733 5.6%Flatbed 558 12.0% 6,579 11.7% 12,462 12.1%Dump 380 8.2% 5,621 10.0% 8,288 8.0%Concrete Mixer 33 0.7% 603 1.1% 808 0.8%Auto Transporter 42 0.9% 606 1.1% 1,471 1.4%Garbage/Refuse 107 2.3% 1,427 2.5% 2,430 2.4%Grain, Gravel, etc. 175 3.8% 1,447 2.6% 2,255 2.2%Pole 12 0.3% 200 0.4% 338 0.3%Log 97 2.1% 777 1.4% 951 0.9%Intermodal Container Chassis 52 1.1% 721 1.3% 1,345 1.3%Vehicle Towing Another Vehicle 21 0.5% 396 0.7% 705 0.7%No Cargo Body 176 3.8% 2,410 4.3% 4,254 4.1%Other 517 11.1% 9,180 16.3% 16,128 15.7%Unknown 230 4.9% 494 0.9% 636 0.6%Total 4,657 100.0% 56,422 100.0% 102,973 100.0%
Vehicles Table 4. Large Trucks in Crashes by Cargo Body Type and Crash Severity, 2017
Notes: For fatal crashes, a large truck is defined as a truck with a gross vehicle weight rating (GVWR) greater than 10,000 pounds. For injury and towaway crashes, a large truck is defined here as a truck, used for commercial purposes, with a gross vehicle weight rating (GVWR) or gross combination weight rating greater than 10,000 pounds, or any vehicle carrying hazardous material that requires placarding, regardless of weight. Injury crashes are defined here as crashes that resulted in at least one injury involving immediate medical attention away from the crash scene. (Note that this definition of an injury crash is not the same as that used in the GES injury estimates presented in other tables of this report.) Towaway crashes are defined here as crashes in which at least one vehicle was disabled as a result of the crash and transported away from the crash scene.Sources: Fatal Crashes: National Highway Traffic Safety Administration, Fatality Analysis Reporting System (FARS). Injury and Towaway Crashes: Federal Motor Carrier Safety Administration, Motor Carrier Management Information System (MCMIS) Crash File.

FMCSA Analysis Division Large Truck and Bus Crash Facts 2017
Vehicles
Page 70
Gross Vehicle Weight Rating2015 2016 2017
Number Percent Number Percent Number Percent≤10,000 lb 0 0.0% 0 0.0% 0 0.0%10,001 - 26,000 lb 564 13.8% 721 17.0% 957 20.5%≥26,001 lb 3,502 86.0% 3,522 82.9% 3,692 79.3%Unknown 8 0.2% 8 0.2% 8 0.2%Total 4,074 100.0% 4,251 100.0% 4,657 100.0%
Vehicles Table 5. Large Trucks in Fatal Crashes by Gross Vehicle Weight Rating, 2015-2017
Note: A large truck is defined as a truck with a gross vehicle weight rating (GVWR) greater than 10,000 pounds.Source: National Highway Traffic Safety Administration, Fatality Analysis Reporting System (FARS).
Gross Vehicle Weight RatingFatal Crashes
Injury Crashes (MCMIS Data)
Towaway Crashes (MCMIS Data)
Number Percent Number Percent Number Percent≤10,000 lb 0 0.0% 39 0.1% 91 0.1%10,001 - 26,000 lb 957 20.5% 13,080 23.2% 22,065 21.4%≥26,001 lb 3,692 79.3% 43,250 76.7% 80,776 78.4%Unknown 8 0.2% 53 0.1% 41 *Total 4,657 100.0% 56,422 100.0% 102,973 100.0%
Vehicles Table 6. Large Trucks in Crashes by Gross Vehicle Weight Rating and Crash Severity, 2017
*Less than 0.05 percent. Notes: For fatal crashes, a large truck is defined as a truck with a gross vehicle weight rating (GVWR) greater than 10,000 pounds. For injury and towaway crashes, a large truck is defined here as a truck, used for commercial purposes, with a gross vehicle weight rating (GVWR) or gross combination weight rating greater than 10,000 pounds, or any vehicle carrying hazardous material that requires placarding, regardless of weight. Injury crashes are defined here as crashes that resulted in at least one injury involving immediate medical attention away from the crash scene. (Note that this definition of an injury crash is not the same as that used in the GES injury estimates presented in other tables of this report.) Towaway crashes are defined here as crashes in which at least one vehicle was disabled as a result of the crash and transported away from the crash scene.Sources: Fatal Crashes: National Highway Traffic Safety Administration, Fatality Analysis Reporting System (FARS). Injury and Towaway Crashes: Federal Motor Carrier Safety Administration, Motor Carrier Management Information System (MCMIS) Crash File.
Truck Weight Rating2015 2016 2017
Number Percent Number Percent Number PercentClass 1: < 6,000 lb 1 * 0 0.0% 0 0.0%Class 2: 6,001 - 10,000 lb 5 0.1% 4 0.1% 5 0.1%Class 3: 10,001 - 14,000 lb 144 3.5% 238 5.6% 468 10.0%Class 4: 14,001 - 16,000 lb 70 1.7% 101 2.4% 97 2.1%Class 5: 16,001 - 19,500 lb 85 2.1% 105 2.5% 142 3.0%Class 6: 19,501 - 26,000 lb 221 5.4% 258 6.1% 243 5.2%Class 7: 26,001 - 33,000 lb 257 6.3% 234 5.5% 271 5.8%Class 8: > 33,000 lb 3,191 78.3% 3,210 75.5% 3,309 71.1%Unknown 100 2.5% 101 2.4% 122 2.6%Total 4,074 100.0% 4,251 100.0% 4,657 100.0%
Vehicles Table 7. Large Trucks in Fatal Crashes by Truck Weight Rating, 2015-2017
*Less than 0.05 percent. Notes: A large truck is defined as a truck with a gross vehicle weight rating (GVWR) greater than 10,000 pounds. Source: National Highway Traffic Safety Administration, Fatality Analysis Reporting System (FARS).
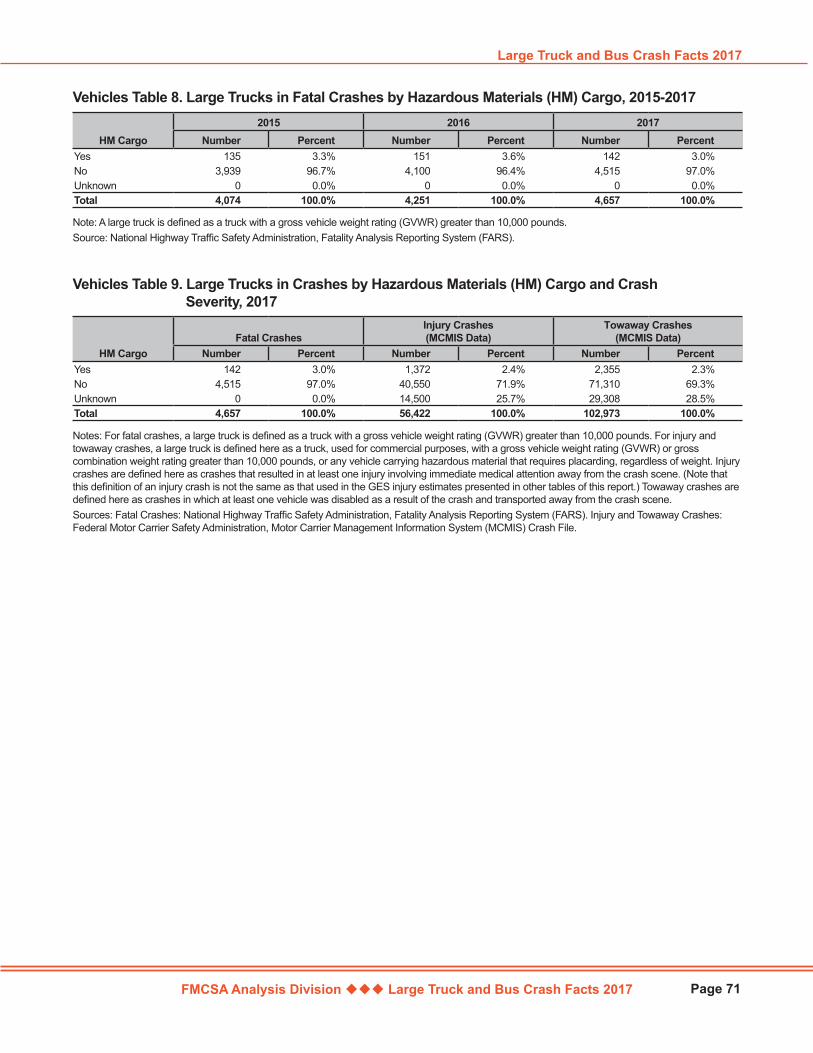
FMCSA Analysis Division Large Truck and Bus Crash Facts 2017
Large Truck and Bus Crash Facts 2017
Page 71
HM Cargo2015 2016 2017
Number Percent Number Percent Number PercentYes 135 3.3% 151 3.6% 142 3.0%No 3,939 96.7% 4,100 96.4% 4,515 97.0%Unknown 0 0.0% 0 0.0% 0 0.0%Total 4,074 100.0% 4,251 100.0% 4,657 100.0%
Vehicles Table 8. Large Trucks in Fatal Crashes by Hazardous Materials (HM) Cargo, 2015-2017
Note: A large truck is defined as a truck with a gross vehicle weight rating (GVWR) greater than 10,000 pounds.Source: National Highway Traffic Safety Administration, Fatality Analysis Reporting System (FARS).
HM CargoFatal Crashes
Injury Crashes (MCMIS Data)
Towaway Crashes (MCMIS Data)
Number Percent Number Percent Number PercentYes 142 3.0% 1,372 2.4% 2,355 2.3%No 4,515 97.0% 40,550 71.9% 71,310 69.3%Unknown 0 0.0% 14,500 25.7% 29,308 28.5%Total 4,657 100.0% 56,422 100.0% 102,973 100.0%
Vehicles Table 9. Large Trucks in Crashes by Hazardous Materials (HM) Cargo and Crash Severity, 2017
Notes: For fatal crashes, a large truck is defined as a truck with a gross vehicle weight rating (GVWR) greater than 10,000 pounds. For injury and towaway crashes, a large truck is defined here as a truck, used for commercial purposes, with a gross vehicle weight rating (GVWR) or gross combination weight rating greater than 10,000 pounds, or any vehicle carrying hazardous material that requires placarding, regardless of weight. Injury crashes are defined here as crashes that resulted in at least one injury involving immediate medical attention away from the crash scene. (Note that this definition of an injury crash is not the same as that used in the GES injury estimates presented in other tables of this report.) Towaway crashes are defined here as crashes in which at least one vehicle was disabled as a result of the crash and transported away from the crash scene.Sources: Fatal Crashes: National Highway Traffic Safety Administration, Fatality Analysis Reporting System (FARS). Injury and Towaway Crashes: Federal Motor Carrier Safety Administration, Motor Carrier Management Information System (MCMIS) Crash File.
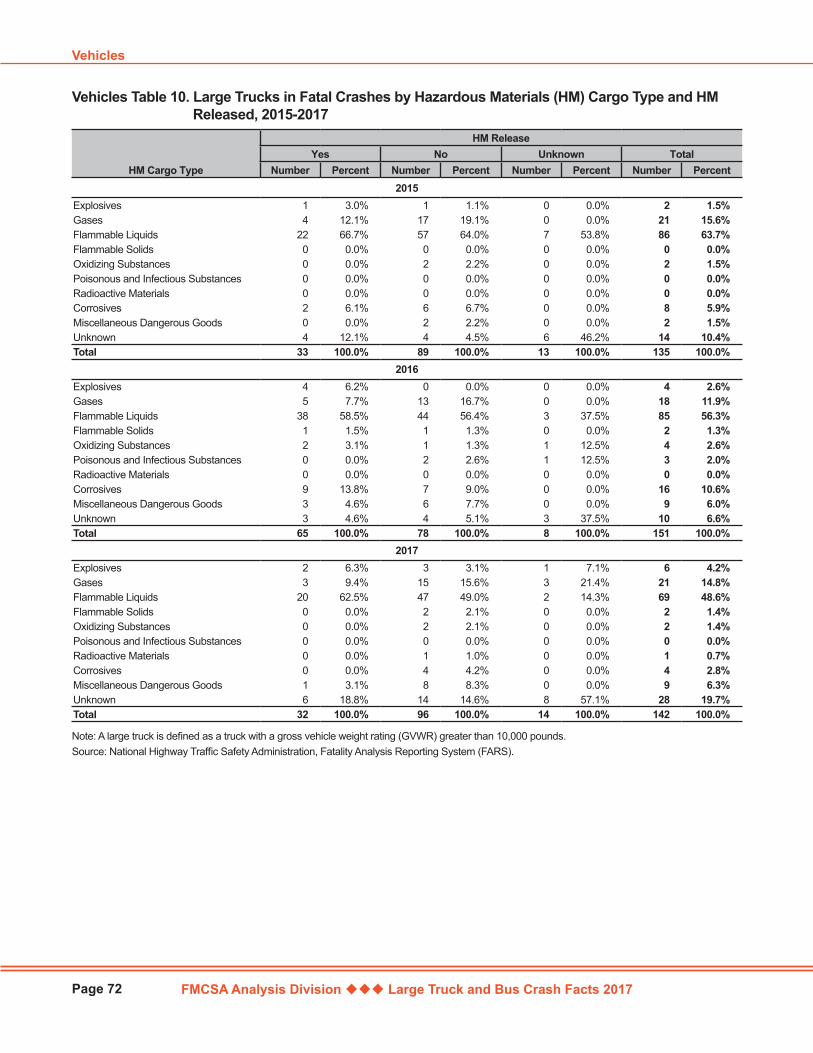
FMCSA Analysis Division Large Truck and Bus Crash Facts 2017
Vehicles
Page 72
HM Cargo Type
HM ReleaseYes No Unknown Total
Number Percent Number Percent Number Percent Number Percent2015
Explosives 1 3.0% 1 1.1% 0 0.0% 2 1.5%Gases 4 12.1% 17 19.1% 0 0.0% 21 15.6%Flammable Liquids 22 66.7% 57 64.0% 7 53.8% 86 63.7%Flammable Solids 0 0.0% 0 0.0% 0 0.0% 0 0.0%Oxidizing Substances 0 0.0% 2 2.2% 0 0.0% 2 1.5%Poisonous and Infectious Substances 0 0.0% 0 0.0% 0 0.0% 0 0.0%Radioactive Materials 0 0.0% 0 0.0% 0 0.0% 0 0.0%Corrosives 2 6.1% 6 6.7% 0 0.0% 8 5.9%Miscellaneous Dangerous Goods 0 0.0% 2 2.2% 0 0.0% 2 1.5%Unknown 4 12.1% 4 4.5% 6 46.2% 14 10.4%Total 33 100.0% 89 100.0% 13 100.0% 135 100.0%
2016Explosives 4 6.2% 0 0.0% 0 0.0% 4 2.6%Gases 5 7.7% 13 16.7% 0 0.0% 18 11.9%Flammable Liquids 38 58.5% 44 56.4% 3 37.5% 85 56.3%Flammable Solids 1 1.5% 1 1.3% 0 0.0% 2 1.3%Oxidizing Substances 2 3.1% 1 1.3% 1 12.5% 4 2.6%Poisonous and Infectious Substances 0 0.0% 2 2.6% 1 12.5% 3 2.0%Radioactive Materials 0 0.0% 0 0.0% 0 0.0% 0 0.0%Corrosives 9 13.8% 7 9.0% 0 0.0% 16 10.6%Miscellaneous Dangerous Goods 3 4.6% 6 7.7% 0 0.0% 9 6.0%Unknown 3 4.6% 4 5.1% 3 37.5% 10 6.6%Total 65 100.0% 78 100.0% 8 100.0% 151 100.0%
2017Explosives 2 6.3% 3 3.1% 1 7.1% 6 4.2%Gases 3 9.4% 15 15.6% 3 21.4% 21 14.8%Flammable Liquids 20 62.5% 47 49.0% 2 14.3% 69 48.6%Flammable Solids 0 0.0% 2 2.1% 0 0.0% 2 1.4%Oxidizing Substances 0 0.0% 2 2.1% 0 0.0% 2 1.4%Poisonous and Infectious Substances 0 0.0% 0 0.0% 0 0.0% 0 0.0%Radioactive Materials 0 0.0% 1 1.0% 0 0.0% 1 0.7%Corrosives 0 0.0% 4 4.2% 0 0.0% 4 2.8%Miscellaneous Dangerous Goods 1 3.1% 8 8.3% 0 0.0% 9 6.3%Unknown 6 18.8% 14 14.6% 8 57.1% 28 19.7%Total 32 100.0% 96 100.0% 14 100.0% 142 100.0%
Vehicles Table 10. Large Trucks in Fatal Crashes by Hazardous Materials (HM) Cargo Type and HM Released, 2015-2017
Note: A large truck is defined as a truck with a gross vehicle weight rating (GVWR) greater than 10,000 pounds.Source: National Highway Traffic Safety Administration, Fatality Analysis Reporting System (FARS).

FMCSA Analysis Division Large Truck and Bus Crash Facts 2017
Large Truck and Bus Crash Facts 2017
Page 73
HM Cargo Type
HM ReleaseYes No Unknown Total
Number Percent Number Percent Number Percent Number PercentLarge Trucks in Fatal Crashes
Explosives 2 6.3% 3 3.1% 1 7.1% 6 4.2%Gases 3 9.4% 15 15.6% 3 21.4% 21 14.8%Flammable Liquids 20 62.5% 47 49.0% 2 14.3% 69 48.6%Flammable Solids 0 0.0% 2 2.1% 0 0.0% 2 1.4%Oxidizing Substances 0 0.0% 2 2.1% 0 0.0% 2 1.4%Poisonous and Infectious Substances 0 0.0% 0 0.0% 0 0.0% 0 0.0%Radioactive Materials 0 0.0% 1 1.0% 0 0.0% 1 0.7%Corrosives 0 0.0% 4 4.2% 0 0.0% 4 2.8%Miscellaneous Dangerous Goods 1 3.1% 8 8.3% 0 0.0% 9 6.3%Unknown 6 18.8% 14 14.6% 8 57.1% 28 19.7%Total 32 100.0% 96 100.0% 14 100.0% 142 100.0%
Large Trucks in Nonfatal Crashes (MCMIS Data)Explosives 10 1.7% 76 2.8% 14 2.9% 100 2.6%Gases 61 10.6% 456 16.8% 61 12.4% 578 15.3%Flammable Liquids 262 45.4% 1,341 49.3% 244 49.8% 1,847 48.8%Flammable Solids 7 1.2% 25 0.9% 9 1.8% 41 1.1%Oxidizing Substances 2 0.3% 29 1.1% 5 1.0% 36 1.0%Poisonous and Infectious Substances 8 1.4% 30 1.1% 3 0.6% 41 1.1%Radioactive Materials 5 0.9% 3 0.1% 2 0.4% 10 0.3%Corrosives 42 7.3% 202 7.4% 35 7.1% 279 7.4%Miscellaneous Dangerous Goods 52 9.0% 274 10.1% 24 4.9% 350 9.2%Unknown 128 22.2% 282 10.4% 93 19.0% 503 13.3%Total 577 100.0% 2,718 100.0% 490 100.0% 3,785 100.0%
Vehicles Table 11. Large Trucks in Crashes by Hazardous Materials (HM) Cargo Type, HM Release, and Crash Severity, 2017
Notes: For fatal crashes, a large truck is defined as a truck with a gross vehicle weight rating (GVWR) greater than 10,000 pounds. For nonfatal crashes, a large truck is defined here as a truck, used for commercial purposes, with a gross vehicle weight rating (GVWR) or gross combination weight rating greater than 10,000 pounds, or any vehicle carrying hazardous material that requires placarding, regardless of weight.Sources: Fatal Crashes: National Highway Traffic Safety Administration, Fatality Analysis Reporting System (FARS). Nonfatal Crashes: Federal Motor Carrier Safety Administration, Motor Carrier Management Information System (MCMIS) Crash File.
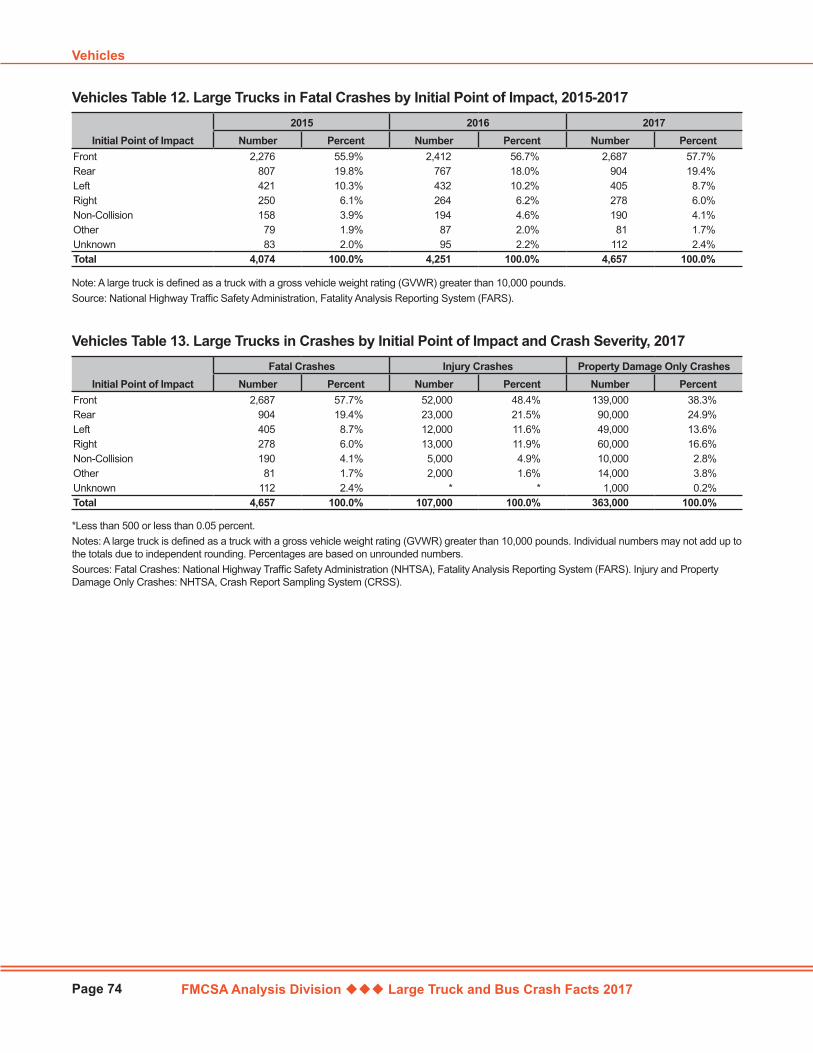
FMCSA Analysis Division Large Truck and Bus Crash Facts 2017
Vehicles
Page 74
Initial Point of Impact2015 2016 2017
Number Percent Number Percent Number PercentFront 2,276 55.9% 2,412 56.7% 2,687 57.7%Rear 807 19.8% 767 18.0% 904 19.4%Left 421 10.3% 432 10.2% 405 8.7%Right 250 6.1% 264 6.2% 278 6.0%Non-Collision 158 3.9% 194 4.6% 190 4.1%Other 79 1.9% 87 2.0% 81 1.7%Unknown 83 2.0% 95 2.2% 112 2.4%Total 4,074 100.0% 4,251 100.0% 4,657 100.0%
Vehicles Table 12. Large Trucks in Fatal Crashes by Initial Point of Impact, 2015-2017
Note: A large truck is defined as a truck with a gross vehicle weight rating (GVWR) greater than 10,000 pounds.Source: National Highway Traffic Safety Administration, Fatality Analysis Reporting System (FARS).
Initial Point of ImpactFatal Crashes Injury Crashes Property Damage Only Crashes
Number Percent Number Percent Number PercentFront 2,687 57.7% 52,000 48.4% 139,000 38.3%Rear 904 19.4% 23,000 21.5% 90,000 24.9%Left 405 8.7% 12,000 11.6% 49,000 13.6%Right 278 6.0% 13,000 11.9% 60,000 16.6%Non-Collision 190 4.1% 5,000 4.9% 10,000 2.8%Other 81 1.7% 2,000 1.6% 14,000 3.8%Unknown 112 2.4% * * 1,000 0.2%Total 4,657 100.0% 107,000 100.0% 363,000 100.0%
Vehicles Table 13. Large Trucks in Crashes by Initial Point of Impact and Crash Severity, 2017
*Less than 500 or less than 0.05 percent.Notes: A large truck is defined as a truck with a gross vehicle weight rating (GVWR) greater than 10,000 pounds. Individual numbers may not add up to the totals due to independent rounding. Percentages are based on unrounded numbers. Sources: Fatal Crashes: National Highway Traffic Safety Administration (NHTSA), Fatality Analysis Reporting System (FARS). Injury and Property Damage Only Crashes: NHTSA, Crash Report Sampling System (CRSS).
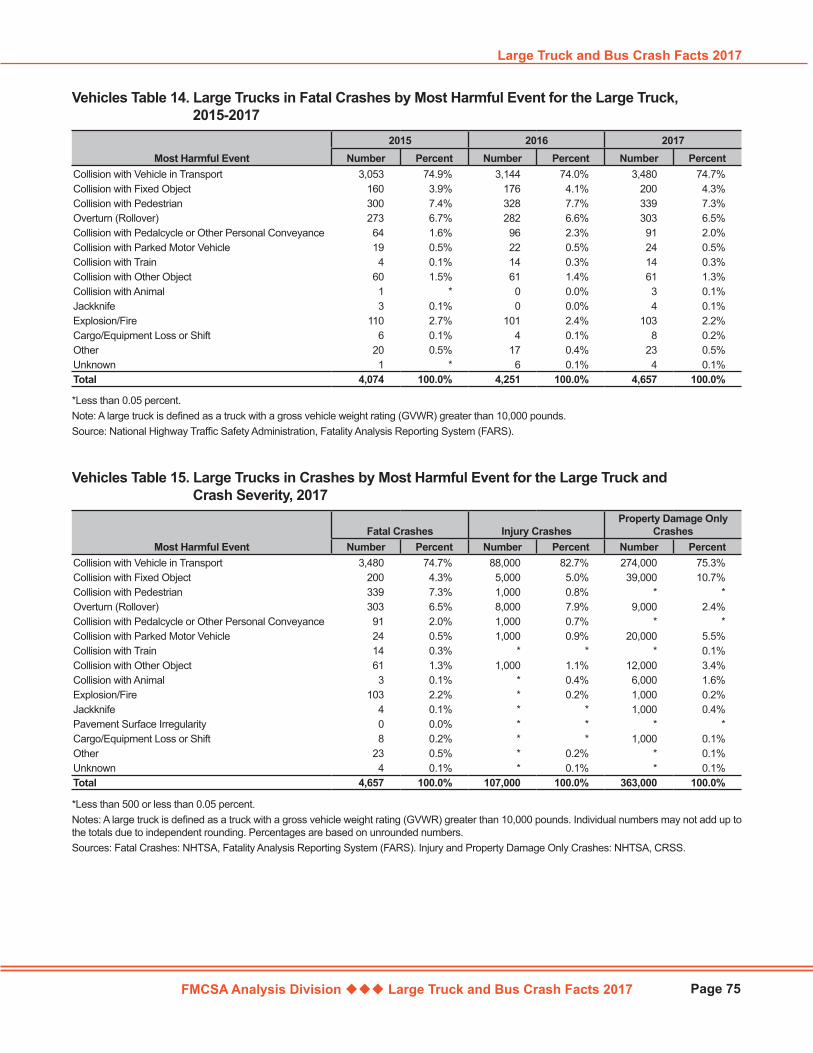
FMCSA Analysis Division Large Truck and Bus Crash Facts 2017
Large Truck and Bus Crash Facts 2017
Page 75
Most Harmful Event2015 2016 2017
Number Percent Number Percent Number PercentCollision with Vehicle in Transport 3,053 74.9% 3,144 74.0% 3,480 74.7%Collision with Fixed Object 160 3.9% 176 4.1% 200 4.3%Collision with Pedestrian 300 7.4% 328 7.7% 339 7.3%Overturn (Rollover) 273 6.7% 282 6.6% 303 6.5%Collision with Pedalcycle or Other Personal Conveyance 64 1.6% 96 2.3% 91 2.0%Collision with Parked Motor Vehicle 19 0.5% 22 0.5% 24 0.5%Collision with Train 4 0.1% 14 0.3% 14 0.3%Collision with Other Object 60 1.5% 61 1.4% 61 1.3%Collision with Animal 1 * 0 0.0% 3 0.1%Jackknife 3 0.1% 0 0.0% 4 0.1%Explosion/Fire 110 2.7% 101 2.4% 103 2.2%Cargo/Equipment Loss or Shift 6 0.1% 4 0.1% 8 0.2%Other 20 0.5% 17 0.4% 23 0.5%Unknown 1 * 6 0.1% 4 0.1%Total 4,074 100.0% 4,251 100.0% 4,657 100.0%
Vehicles Table 14. Large Trucks in Fatal Crashes by Most Harmful Event for the Large Truck, 2015-2017
*Less than 0.05 percent. Note: A large truck is defined as a truck with a gross vehicle weight rating (GVWR) greater than 10,000 pounds.Source: National Highway Traffic Safety Administration, Fatality Analysis Reporting System (FARS).
Most Harmful EventFatal Crashes Injury Crashes
Property Damage Only Crashes
Number Percent Number Percent Number PercentCollision with Vehicle in Transport 3,480 74.7% 88,000 82.7% 274,000 75.3%Collision with Fixed Object 200 4.3% 5,000 5.0% 39,000 10.7%Collision with Pedestrian 339 7.3% 1,000 0.8% * *Overturn (Rollover) 303 6.5% 8,000 7.9% 9,000 2.4%Collision with Pedalcycle or Other Personal Conveyance 91 2.0% 1,000 0.7% * *Collision with Parked Motor Vehicle 24 0.5% 1,000 0.9% 20,000 5.5%Collision with Train 14 0.3% * * * 0.1%Collision with Other Object 61 1.3% 1,000 1.1% 12,000 3.4%Collision with Animal 3 0.1% * 0.4% 6,000 1.6%Explosion/Fire 103 2.2% * 0.2% 1,000 0.2%Jackknife 4 0.1% * * 1,000 0.4%Pavement Surface Irregularity 0 0.0% * * * *Cargo/Equipment Loss or Shift 8 0.2% * * 1,000 0.1%Other 23 0.5% * 0.2% * 0.1%Unknown 4 0.1% * 0.1% * 0.1%Total 4,657 100.0% 107,000 100.0% 363,000 100.0%
Vehicles Table 15. Large Trucks in Crashes by Most Harmful Event for the Large Truck and Crash Severity, 2017
*Less than 500 or less than 0.05 percent. Notes: A large truck is defined as a truck with a gross vehicle weight rating (GVWR) greater than 10,000 pounds. Individual numbers may not add up to the totals due to independent rounding. Percentages are based on unrounded numbers. Sources: Fatal Crashes: NHTSA, Fatality Analysis Reporting System (FARS). Injury and Property Damage Only Crashes: NHTSA, CRSS.
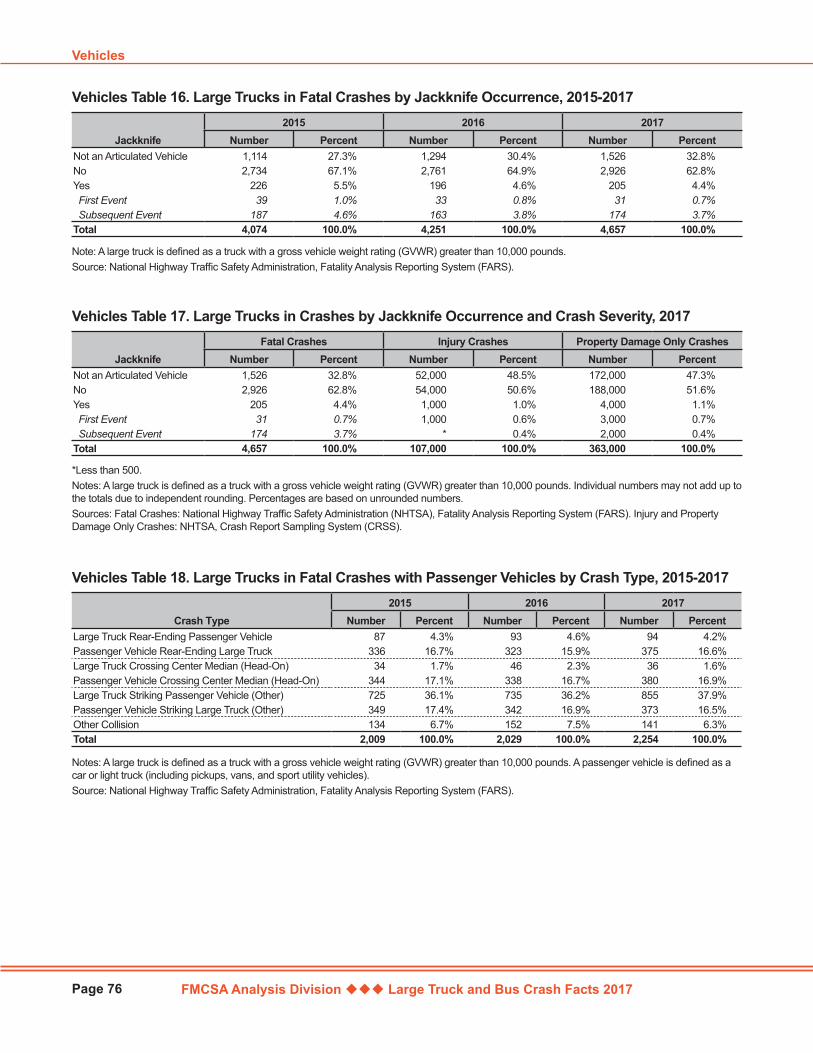
FMCSA Analysis Division Large Truck and Bus Crash Facts 2017
Vehicles
Page 76
Jackknife2015 2016 2017
Number Percent Number Percent Number PercentNot an Articulated Vehicle 1,114 27.3% 1,294 30.4% 1,526 32.8%No 2,734 67.1% 2,761 64.9% 2,926 62.8%Yes 226 5.5% 196 4.6% 205 4.4% First Event 39 1.0% 33 0.8% 31 0.7% Subsequent Event 187 4.6% 163 3.8% 174 3.7%Total 4,074 100.0% 4,251 100.0% 4,657 100.0%
Vehicles Table 16. Large Trucks in Fatal Crashes by Jackknife Occurrence, 2015-2017
Note: A large truck is defined as a truck with a gross vehicle weight rating (GVWR) greater than 10,000 pounds.Source: National Highway Traffic Safety Administration, Fatality Analysis Reporting System (FARS).
JackknifeFatal Crashes Injury Crashes Property Damage Only Crashes
Number Percent Number Percent Number PercentNot an Articulated Vehicle 1,526 32.8% 52,000 48.5% 172,000 47.3%No 2,926 62.8% 54,000 50.6% 188,000 51.6%Yes 205 4.4% 1,000 1.0% 4,000 1.1% First Event 31 0.7% 1,000 0.6% 3,000 0.7% Subsequent Event 174 3.7% * 0.4% 2,000 0.4%Total 4,657 100.0% 107,000 100.0% 363,000 100.0%
Vehicles Table 17. Large Trucks in Crashes by Jackknife Occurrence and Crash Severity, 2017
*Less than 500.Notes: A large truck is defined as a truck with a gross vehicle weight rating (GVWR) greater than 10,000 pounds. Individual numbers may not add up to the totals due to independent rounding. Percentages are based on unrounded numbers. Sources: Fatal Crashes: National Highway Traffic Safety Administration (NHTSA), Fatality Analysis Reporting System (FARS). Injury and Property Damage Only Crashes: NHTSA, Crash Report Sampling System (CRSS).
Crash Type2015 2016 2017
Number Percent Number Percent Number PercentLarge Truck Rear-Ending Passenger Vehicle 87 4.3% 93 4.6% 94 4.2%Passenger Vehicle Rear-Ending Large Truck 336 16.7% 323 15.9% 375 16.6%Large Truck Crossing Center Median (Head-On) 34 1.7% 46 2.3% 36 1.6%Passenger Vehicle Crossing Center Median (Head-On) 344 17.1% 338 16.7% 380 16.9%Large Truck Striking Passenger Vehicle (Other) 725 36.1% 735 36.2% 855 37.9%Passenger Vehicle Striking Large Truck (Other) 349 17.4% 342 16.9% 373 16.5%Other Collision 134 6.7% 152 7.5% 141 6.3%Total 2,009 100.0% 2,029 100.0% 2,254 100.0%
Vehicles Table 18. Large Trucks in Fatal Crashes with Passenger Vehicles by Crash Type, 2015-2017
Notes: A large truck is defined as a truck with a gross vehicle weight rating (GVWR) greater than 10,000 pounds. A passenger vehicle is defined as a car or light truck (including pickups, vans, and sport utility vehicles).Source: National Highway Traffic Safety Administration, Fatality Analysis Reporting System (FARS).
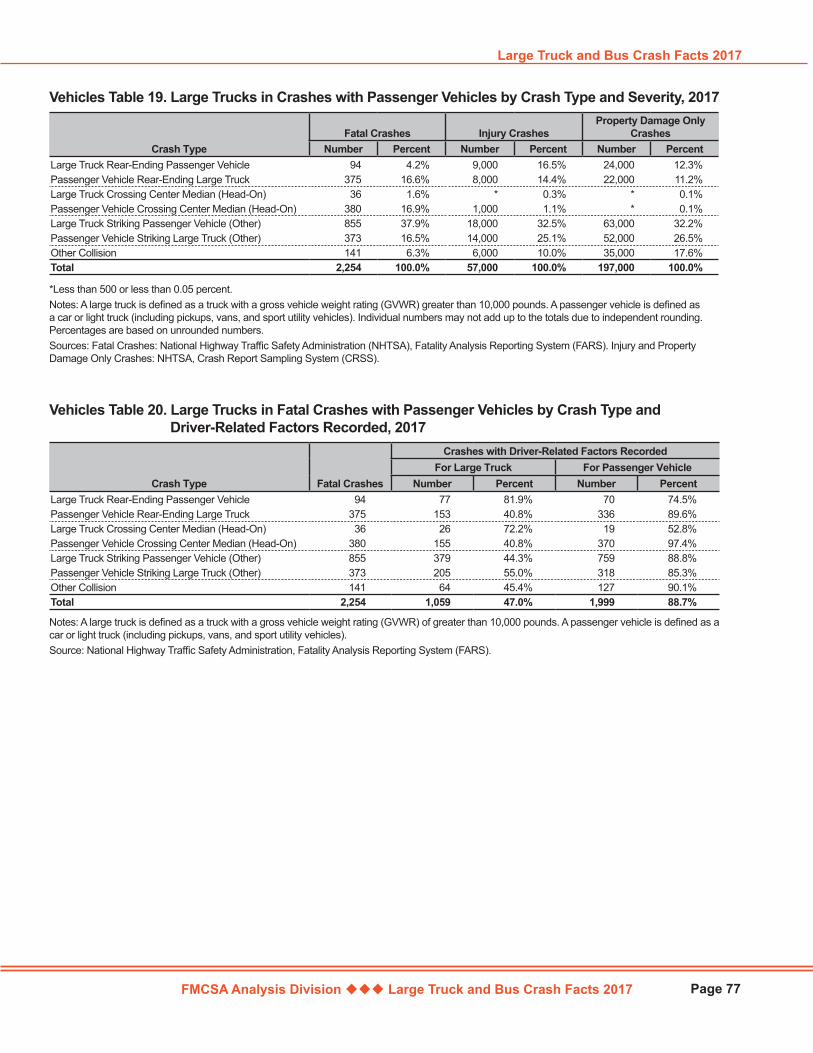
FMCSA Analysis Division Large Truck and Bus Crash Facts 2017
Large Truck and Bus Crash Facts 2017
Page 77
Crash TypeFatal Crashes Injury Crashes
Property Damage Only Crashes
Number Percent Number Percent Number PercentLarge Truck Rear-Ending Passenger Vehicle 94 4.2% 9,000 16.5% 24,000 12.3%Passenger Vehicle Rear-Ending Large Truck 375 16.6% 8,000 14.4% 22,000 11.2%Large Truck Crossing Center Median (Head-On) 36 1.6% * 0.3% * 0.1%Passenger Vehicle Crossing Center Median (Head-On) 380 16.9% 1,000 1.1% * 0.1%Large Truck Striking Passenger Vehicle (Other) 855 37.9% 18,000 32.5% 63,000 32.2%Passenger Vehicle Striking Large Truck (Other) 373 16.5% 14,000 25.1% 52,000 26.5%Other Collision 141 6.3% 6,000 10.0% 35,000 17.6%Total 2,254 100.0% 57,000 100.0% 197,000 100.0%
Vehicles Table 19. Large Trucks in Crashes with Passenger Vehicles by Crash Type and Severity, 2017
*Less than 500 or less than 0.05 percent. Notes: A large truck is defined as a truck with a gross vehicle weight rating (GVWR) greater than 10,000 pounds. A passenger vehicle is defined as a car or light truck (including pickups, vans, and sport utility vehicles). Individual numbers may not add up to the totals due to independent rounding. Percentages are based on unrounded numbers.Sources: Fatal Crashes: National Highway Traffic Safety Administration (NHTSA), Fatality Analysis Reporting System (FARS). Injury and Property Damage Only Crashes: NHTSA, Crash Report Sampling System (CRSS).
Crash Type Fatal Crashes
Crashes with Driver-Related Factors RecordedFor Large Truck For Passenger Vehicle
Number Percent Number PercentLarge Truck Rear-Ending Passenger Vehicle 94 77 81.9% 70 74.5%Passenger Vehicle Rear-Ending Large Truck 375 153 40.8% 336 89.6%Large Truck Crossing Center Median (Head-On) 36 26 72.2% 19 52.8%Passenger Vehicle Crossing Center Median (Head-On) 380 155 40.8% 370 97.4%Large Truck Striking Passenger Vehicle (Other) 855 379 44.3% 759 88.8%Passenger Vehicle Striking Large Truck (Other) 373 205 55.0% 318 85.3%Other Collision 141 64 45.4% 127 90.1%Total 2,254 1,059 47.0% 1,999 88.7%
Vehicles Table 20. Large Trucks in Fatal Crashes with Passenger Vehicles by Crash Type and Driver-Related Factors Recorded, 2017
Notes: A large truck is defined as a truck with a gross vehicle weight rating (GVWR) of greater than 10,000 pounds. A passenger vehicle is defined as a car or light truck (including pickups, vans, and sport utility vehicles).Source: National Highway Traffic Safety Administration, Fatality Analysis Reporting System (FARS).

FMCSA Analysis Division Large Truck and Bus Crash Facts 2017
Vehicles
Page 78
Vehicle Age2015 2016 2017
Number Percent Number Percent Number PercentModel Year More Recent Than Crash Year 120 2.9% 94 2.2% 103 2.2%Model Year Same as Crash Year 396 9.7% 461 10.8% 334 7.2%1 to 5 Years 1,135 27.9% 1,341 31.5% 1,758 37.7%6 to 10 Years 1,161 28.5% 953 22.4% 822 17.7%11 to 15 Years 633 15.5% 629 14.8% 761 16.3%16 to 20 Years 369 9.1% 487 11.5% 567 12.2%21 to 25 Years 117 2.9% 156 3.7% 191 4.1%26 Years or Older 87 2.1% 92 2.2% 90 1.9%Model Year Unknown 56 1.4% 38 0.9% 31 0.7%Total 4,074 100.0% 4,251 100.0% 4,657 100.0%Average Vehicle Age (Years) 8.07 8.08 8.23
Vehicles Table 21. Large Trucks in Fatal Crashes by Vehicle Age, 2015-2017
Notes: Vehicle age is defined as the difference between the vehicle model year and the year of the crash. A large truck is defined as a truck with a gross vehicle weight rating (GVWR) greater than 10,000 pounds.Source: National Highway Traffic Safety Administration, Fatality Analysis Reporting System (FARS).
Vehicle Age2015 2016 2017
Number Percent Number Percent Number PercentModel Year More Recent Than Crash Year 244 0.5% 205 0.4% 195 0.4%Model Year Same as Crash Year 2,049 4.1% 2,172 4.1% 2,011 3.8%1 to 5 Years 10,475 21.2% 11,900 22.6% 12,813 24.3%6 to 10 Years 13,349 27.0% 12,203 23.1% 10,819 20.6%11 to 15 Years 12,732 25.7% 13,931 26.4% 13,983 26.6%16 to 20 Years 6,366 12.9% 7,407 14.1% 7,895 15.0%21 to 25 Years 2,046 4.1% 2,431 4.6% 2,454 4.7%26 Years or Older 1,082 2.2% 1,228 2.3% 1,256 2.4%Model Year Unknown 1,134 2.3% 1,237 2.3% 1,219 2.3%Total 49,477 100.0% 52,714 100.0% 52,645 100.0%Average Vehicle Age (Years) 10.3 10.5 10.5
Vehicles Table 22. All Vehicles in Fatal Crashes by Vehicle Age, 2015-2017
Notes: Vehicle age is defined as the difference between the vehicle model year and the year of the crash.Source: National Highway Traffic Safety Administration, Fatality Analysis Reporting System (FARS).
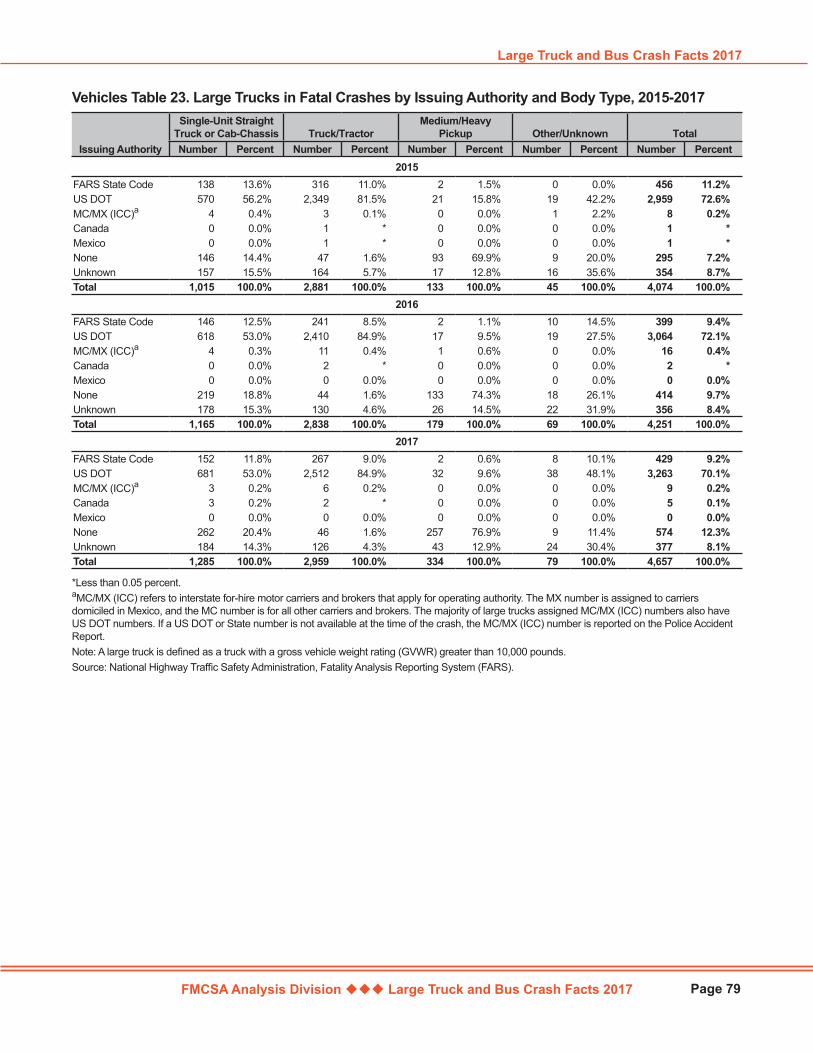
FMCSA Analysis Division Large Truck and Bus Crash Facts 2017
Large Truck and Bus Crash Facts 2017
Page 79
Issuing Authority
Single-Unit Straight Truck or Cab-Chassis Truck/Tractor
Medium/Heavy Pickup Other/Unknown Total
Number Percent Number Percent Number Percent Number Percent Number Percent2015
FARS State Code 138 13.6% 316 11.0% 2 1.5% 0 0.0% 456 11.2%US DOT 570 56.2% 2,349 81.5% 21 15.8% 19 42.2% 2,959 72.6%MC/MX (ICC)a 4 0.4% 3 0.1% 0 0.0% 1 2.2% 8 0.2%Canada 0 0.0% 1 * 0 0.0% 0 0.0% 1 *Mexico 0 0.0% 1 * 0 0.0% 0 0.0% 1 *None 146 14.4% 47 1.6% 93 69.9% 9 20.0% 295 7.2%Unknown 157 15.5% 164 5.7% 17 12.8% 16 35.6% 354 8.7%Total 1,015 100.0% 2,881 100.0% 133 100.0% 45 100.0% 4,074 100.0%
2016FARS State Code 146 12.5% 241 8.5% 2 1.1% 10 14.5% 399 9.4%US DOT 618 53.0% 2,410 84.9% 17 9.5% 19 27.5% 3,064 72.1%MC/MX (ICC)a 4 0.3% 11 0.4% 1 0.6% 0 0.0% 16 0.4%Canada 0 0.0% 2 * 0 0.0% 0 0.0% 2 *Mexico 0 0.0% 0 0.0% 0 0.0% 0 0.0% 0 0.0%None 219 18.8% 44 1.6% 133 74.3% 18 26.1% 414 9.7%Unknown 178 15.3% 130 4.6% 26 14.5% 22 31.9% 356 8.4%Total 1,165 100.0% 2,838 100.0% 179 100.0% 69 100.0% 4,251 100.0%
2017FARS State Code 152 11.8% 267 9.0% 2 0.6% 8 10.1% 429 9.2%US DOT 681 53.0% 2,512 84.9% 32 9.6% 38 48.1% 3,263 70.1%MC/MX (ICC)a 3 0.2% 6 0.2% 0 0.0% 0 0.0% 9 0.2%Canada 3 0.2% 2 * 0 0.0% 0 0.0% 5 0.1%Mexico 0 0.0% 0 0.0% 0 0.0% 0 0.0% 0 0.0%None 262 20.4% 46 1.6% 257 76.9% 9 11.4% 574 12.3%Unknown 184 14.3% 126 4.3% 43 12.9% 24 30.4% 377 8.1%Total 1,285 100.0% 2,959 100.0% 334 100.0% 79 100.0% 4,657 100.0%
Vehicles Table 23. Large Trucks in Fatal Crashes by Issuing Authority and Body Type, 2015-2017
*Less than 0.05 percent.aMC/MX (ICC) refers to interstate for-hire motor carriers and brokers that apply for operating authority. The MX number is assigned to carriers domiciled in Mexico, and the MC number is for all other carriers and brokers. The majority of large trucks assigned MC/MX (ICC) numbers also have US DOT numbers. If a US DOT or State number is not available at the time of the crash, the MC/MX (ICC) number is reported on the Police Accident Report.Note: A large truck is defined as a truck with a gross vehicle weight rating (GVWR) greater than 10,000 pounds.Source: National Highway Traffic Safety Administration, Fatality Analysis Reporting System (FARS).

FMCSA Analysis Division Large Truck and Bus Crash Facts 2017
Vehicles
Page 80
Vehicle Type2015 2016 2017
Number Percent Number Percent Number PercentPassenger Car 1,715 22.3% 1,798 22.2% 2,009 22.7%Light Truck 1,615 21.0% 1,692 20.9% 1,859 21.0%Large Truck 4,074 53.0% 4,251 52.6% 4,657 52.6%Bus 17 0.2% 11 0.1% 11 0.1%Motorcycle 233 3.0% 279 3.5% 280 3.2%Other 33 0.4% 51 0.6% 41 0.5%Total 7,687 100.0% 8,082 100.0% 8,857 100.0%
Vehicles Table 24. Vehicles in Fatal Large Truck Crashes by Vehicle Type, 2015-2017
Notes: A passenger car is defined as a motor vehicle used primarily for carrying passengers, including convertibles, sedans, and station wagons. A light truck is defined as a truck with a gross vehicle weight rating (GVWR) of 10,000 pounds or less, including pickups, vans, truck-based station wagons, and sport utility vehicles. A large truck is defined as a truck with a gross vehicle weight rating (GVWR) greater than 10,000 pounds. A bus is defined as any motor vehicle designed primarily to transport nine or more persons, including the driver. Source: National Highway Traffic Safety Administration, Fatality Analysis Reporting System (FARS).
Vehicle TypeFatal Crashes Injury Crashes Property Damage Only Crashes
Number Percent Number Percent Number PercentPassenger Car 2,009 22.7% 60,000 28.1% 154,000 24.3%Light Truck 1,859 21.0% 29,000 13.6% 70,000 11.1%Large Truck 4,657 52.6% 107,000 50.3% 363,000 57.5%Bus 11 0.1% 1,000 0.6% 3,000 0.5%Motorcycle 280 3.2% 1,000 0.6% 1,000 0.1%Other 41 0.5% 14,000 6.8% 40,000 6.4%Total 8,857 100.0% 212,000 100.0% 632,000 100.0%
Vehicles Table 25. Vehicles in Large Truck Crashes by Vehicle Type and Crash Severity, 2017
Notes: A passenger car is defined as a motor vehicle used primarily for carrying passengers, including convertibles, sedans, and station wagons. A light truck is defined as a truck with a gross vehicle weight rating (GVWR) of 10,000 pounds or less, including pickups, vans, truck-based station wagons, and sport utility vehicles. A large truck is defined as a truck with a gross vehicle weight rating (GVWR) greater than 10,000 pounds. A bus is defined as any motor vehicle designed primarily to transport nine or more persons, including the driver. Individual numbers may not add up to the totals due to independent rounding. Percentages are based on unrounded numbers.Sources: Fatal Crashes: National Highway Traffic Safety Administration (NHTSA), Fatality Analysis Reporting System (FARS). Injury and Property Damage Only Crashes: NHTSA, Crash Report Sampling System (CRSS).
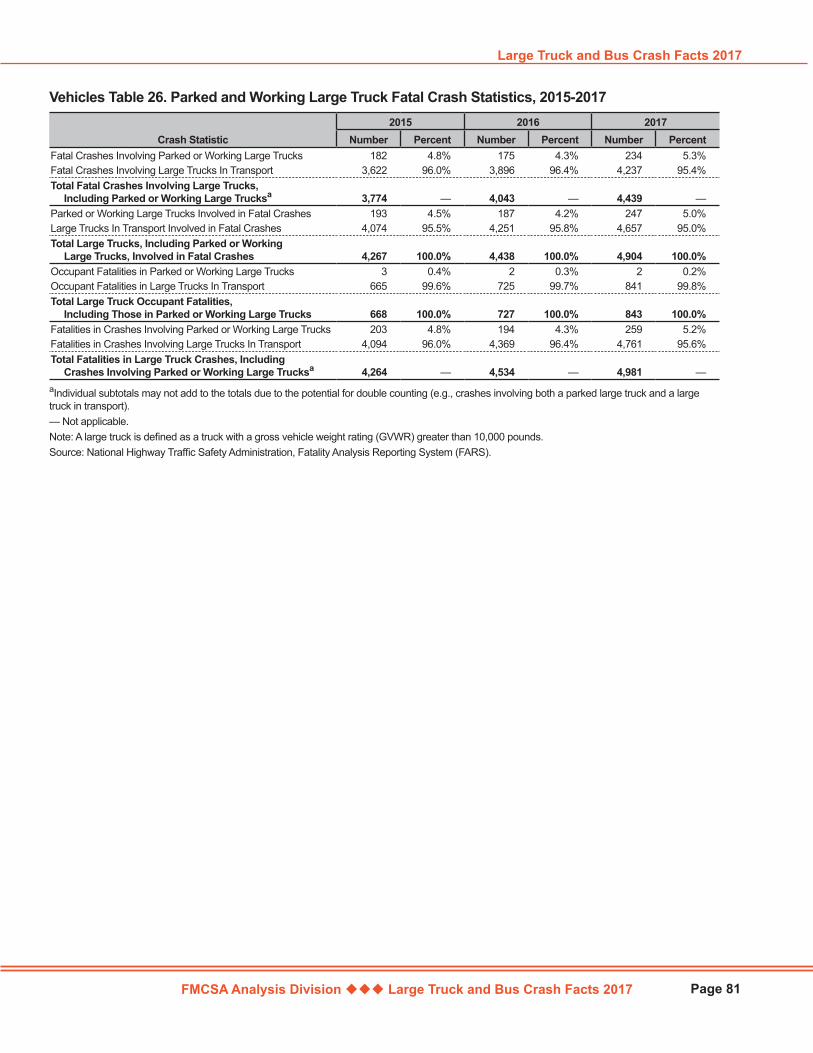
FMCSA Analysis Division Large Truck and Bus Crash Facts 2017
Large Truck and Bus Crash Facts 2017
Page 81
Crash Statistic2015 2016 2017
Number Percent Number Percent Number PercentFatal Crashes Involving Parked or Working Large Trucks 182 4.8% 175 4.3% 234 5.3%Fatal Crashes Involving Large Trucks In Transport 3,622 96.0% 3,896 96.4% 4,237 95.4%Total Fatal Crashes Involving Large Trucks,
Including Parked or Working Large Trucksa 3,774 — 4,043 — 4,439 —Parked or Working Large Trucks Involved in Fatal Crashes 193 4.5% 187 4.2% 247 5.0%Large Trucks In Transport Involved in Fatal Crashes 4,074 95.5% 4,251 95.8% 4,657 95.0%Total Large Trucks, Including Parked or Working
Large Trucks, Involved in Fatal Crashes 4,267 100.0% 4,438 100.0% 4,904 100.0%Occupant Fatalities in Parked or Working Large Trucks 3 0.4% 2 0.3% 2 0.2%Occupant Fatalities in Large Trucks In Transport 665 99.6% 725 99.7% 841 99.8%Total Large Truck Occupant Fatalities,
Including Those in Parked or Working Large Trucks 668 100.0% 727 100.0% 843 100.0%Fatalities in Crashes Involving Parked or Working Large Trucks 203 4.8% 194 4.3% 259 5.2%Fatalities in Crashes Involving Large Trucks In Transport 4,094 96.0% 4,369 96.4% 4,761 95.6%Total Fatalities in Large Truck Crashes, Including
Crashes Involving Parked or Working Large Trucksa 4,264 — 4,534 — 4,981 —
Vehicles Table 26. Parked and Working Large Truck Fatal Crash Statistics, 2015-2017
aIndividual subtotals may not add to the totals due to the potential for double counting (e.g., crashes involving both a parked large truck and a large truck in transport).— Not applicable.Note: A large truck is defined as a truck with a gross vehicle weight rating (GVWR) greater than 10,000 pounds.Source: National Highway Traffic Safety Administration, Fatality Analysis Reporting System (FARS).
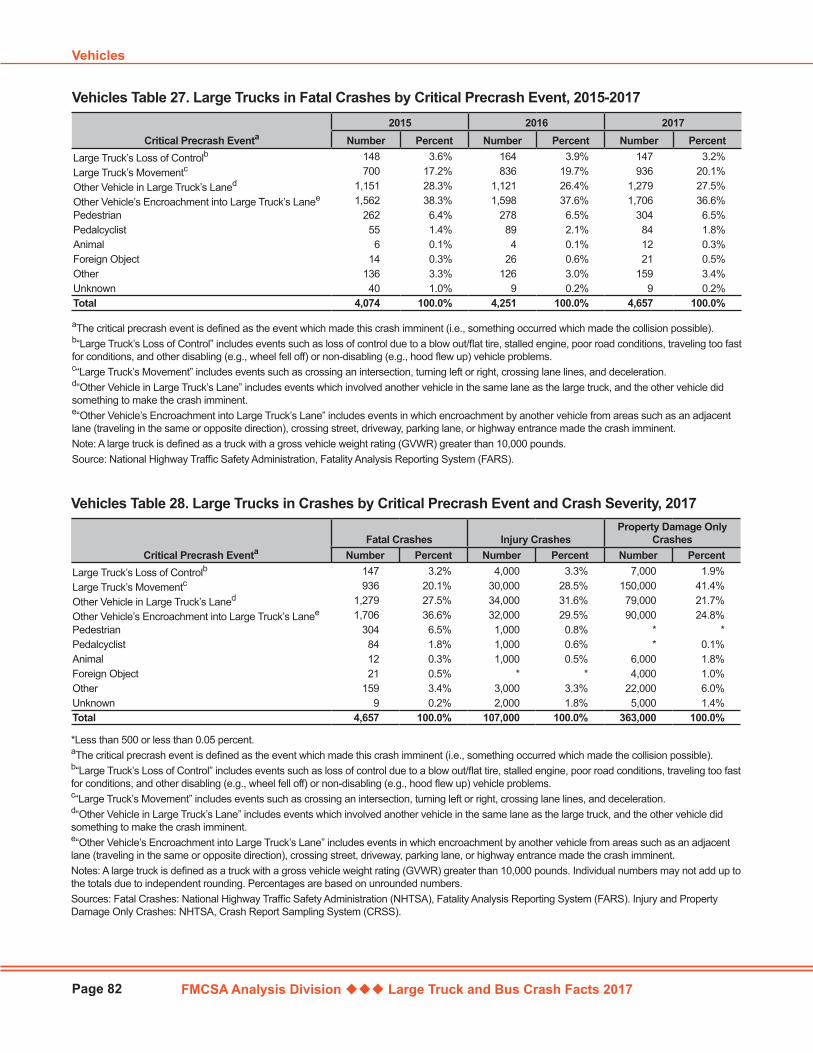
FMCSA Analysis Division Large Truck and Bus Crash Facts 2017
Vehicles
Page 82
Critical Precrash Eventa2015 2016 2017
Number Percent Number Percent Number PercentLarge Truck’s Loss of Controlb 148 3.6% 164 3.9% 147 3.2%Large Truck’s Movementc 700 17.2% 836 19.7% 936 20.1%Other Vehicle in Large Truck’s Laned 1,151 28.3% 1,121 26.4% 1,279 27.5%Other Vehicle’s Encroachment into Large Truck’s Lanee 1,562 38.3% 1,598 37.6% 1,706 36.6%Pedestrian 262 6.4% 278 6.5% 304 6.5%Pedalcyclist 55 1.4% 89 2.1% 84 1.8%Animal 6 0.1% 4 0.1% 12 0.3%Foreign Object 14 0.3% 26 0.6% 21 0.5%Other 136 3.3% 126 3.0% 159 3.4%Unknown 40 1.0% 9 0.2% 9 0.2%Total 4,074 100.0% 4,251 100.0% 4,657 100.0%
Vehicles Table 27. Large Trucks in Fatal Crashes by Critical Precrash Event, 2015-2017
aThe critical precrash event is defined as the event which made this crash imminent (i.e., something occurred which made the collision possible).b“Large Truck’s Loss of Control” includes events such as loss of control due to a blow out/flat tire, stalled engine, poor road conditions, traveling too fast for conditions, and other disabling (e.g., wheel fell off) or non-disabling (e.g., hood flew up) vehicle problems.c“Large Truck’s Movement” includes events such as crossing an intersection, turning left or right, crossing lane lines, and deceleration.d“Other Vehicle in Large Truck’s Lane” includes events which involved another vehicle in the same lane as the large truck, and the other vehicle did something to make the crash imminent.e“Other Vehicle’s Encroachment into Large Truck’s Lane” includes events in which encroachment by another vehicle from areas such as an adjacent lane (traveling in the same or opposite direction), crossing street, driveway, parking lane, or highway entrance made the crash imminent. Note: A large truck is defined as a truck with a gross vehicle weight rating (GVWR) greater than 10,000 pounds. Source: National Highway Traffic Safety Administration, Fatality Analysis Reporting System (FARS).
Critical Precrash EventaFatal Crashes Injury Crashes
Property Damage Only Crashes
Number Percent Number Percent Number PercentLarge Truck’s Loss of Controlb 147 3.2% 4,000 3.3% 7,000 1.9%Large Truck’s Movementc 936 20.1% 30,000 28.5% 150,000 41.4%Other Vehicle in Large Truck’s Laned 1,279 27.5% 34,000 31.6% 79,000 21.7%Other Vehicle’s Encroachment into Large Truck’s Lanee 1,706 36.6% 32,000 29.5% 90,000 24.8%Pedestrian 304 6.5% 1,000 0.8% * *Pedalcyclist 84 1.8% 1,000 0.6% * 0.1%Animal 12 0.3% 1,000 0.5% 6,000 1.8%Foreign Object 21 0.5% * * 4,000 1.0%Other 159 3.4% 3,000 3.3% 22,000 6.0%Unknown 9 0.2% 2,000 1.8% 5,000 1.4%Total 4,657 100.0% 107,000 100.0% 363,000 100.0%
Vehicles Table 28. Large Trucks in Crashes by Critical Precrash Event and Crash Severity, 2017
*Less than 500 or less than 0.05 percent.aThe critical precrash event is defined as the event which made this crash imminent (i.e., something occurred which made the collision possible).b“Large Truck’s Loss of Control” includes events such as loss of control due to a blow out/flat tire, stalled engine, poor road conditions, traveling too fast for conditions, and other disabling (e.g., wheel fell off) or non-disabling (e.g., hood flew up) vehicle problems.c“Large Truck’s Movement” includes events such as crossing an intersection, turning left or right, crossing lane lines, and deceleration.d“Other Vehicle in Large Truck’s Lane” includes events which involved another vehicle in the same lane as the large truck, and the other vehicle did something to make the crash imminent.e“Other Vehicle’s Encroachment into Large Truck’s Lane” includes events in which encroachment by another vehicle from areas such as an adjacent lane (traveling in the same or opposite direction), crossing street, driveway, parking lane, or highway entrance made the crash imminent. Notes: A large truck is defined as a truck with a gross vehicle weight rating (GVWR) greater than 10,000 pounds. Individual numbers may not add up to the totals due to independent rounding. Percentages are based on unrounded numbers. Sources: Fatal Crashes: National Highway Traffic Safety Administration (NHTSA), Fatality Analysis Reporting System (FARS). Injury and Property Damage Only Crashes: NHTSA, Crash Report Sampling System (CRSS).
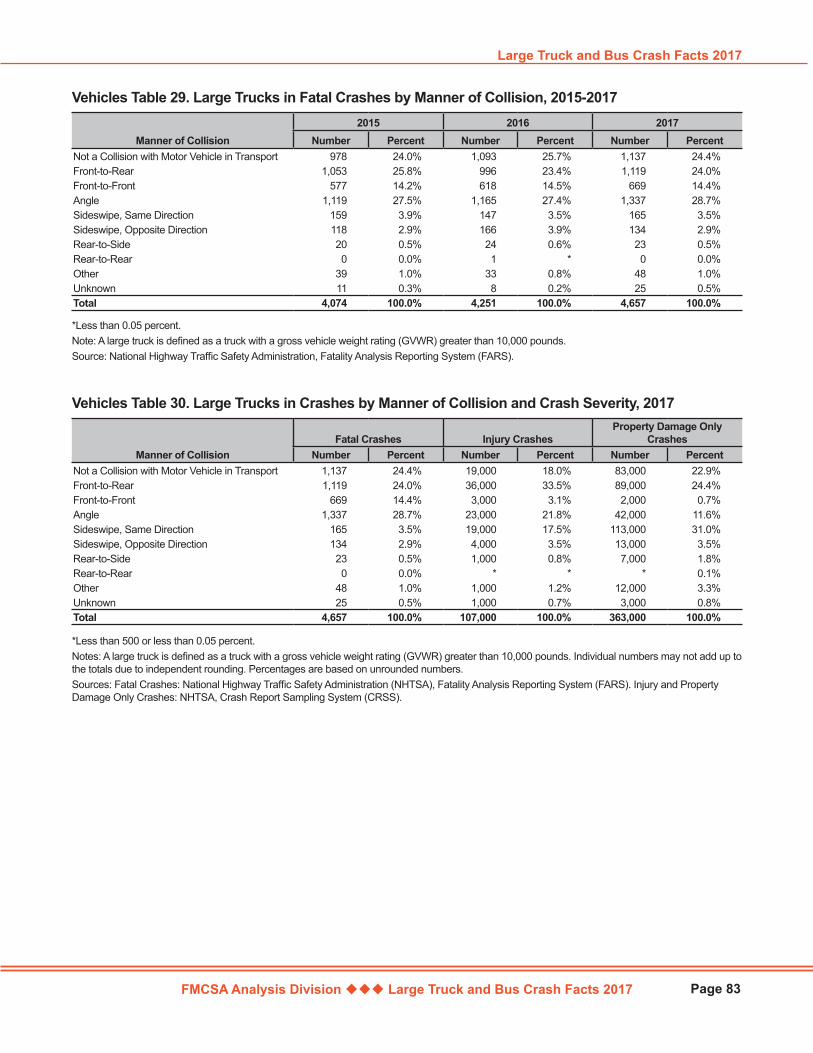
FMCSA Analysis Division Large Truck and Bus Crash Facts 2017
Large Truck and Bus Crash Facts 2017
Page 83
Manner of Collision2015 2016 2017
Number Percent Number Percent Number PercentNot a Collision with Motor Vehicle in Transport 978 24.0% 1,093 25.7% 1,137 24.4%Front-to-Rear 1,053 25.8% 996 23.4% 1,119 24.0%Front-to-Front 577 14.2% 618 14.5% 669 14.4%Angle 1,119 27.5% 1,165 27.4% 1,337 28.7%Sideswipe, Same Direction 159 3.9% 147 3.5% 165 3.5%Sideswipe, Opposite Direction 118 2.9% 166 3.9% 134 2.9%Rear-to-Side 20 0.5% 24 0.6% 23 0.5%Rear-to-Rear 0 0.0% 1 * 0 0.0%Other 39 1.0% 33 0.8% 48 1.0%Unknown 11 0.3% 8 0.2% 25 0.5%Total 4,074 100.0% 4,251 100.0% 4,657 100.0%
Vehicles Table 29. Large Trucks in Fatal Crashes by Manner of Collision, 2015-2017
*Less than 0.05 percent.Note: A large truck is defined as a truck with a gross vehicle weight rating (GVWR) greater than 10,000 pounds.Source: National Highway Traffic Safety Administration, Fatality Analysis Reporting System (FARS).
Manner of CollisionFatal Crashes Injury Crashes
Property Damage Only Crashes
Number Percent Number Percent Number PercentNot a Collision with Motor Vehicle in Transport 1,137 24.4% 19,000 18.0% 83,000 22.9%Front-to-Rear 1,119 24.0% 36,000 33.5% 89,000 24.4%Front-to-Front 669 14.4% 3,000 3.1% 2,000 0.7%Angle 1,337 28.7% 23,000 21.8% 42,000 11.6%Sideswipe, Same Direction 165 3.5% 19,000 17.5% 113,000 31.0%Sideswipe, Opposite Direction 134 2.9% 4,000 3.5% 13,000 3.5%Rear-to-Side 23 0.5% 1,000 0.8% 7,000 1.8%Rear-to-Rear 0 0.0% * * * 0.1%Other 48 1.0% 1,000 1.2% 12,000 3.3%Unknown 25 0.5% 1,000 0.7% 3,000 0.8%Total 4,657 100.0% 107,000 100.0% 363,000 100.0%
Vehicles Table 30. Large Trucks in Crashes by Manner of Collision and Crash Severity, 2017
*Less than 500 or less than 0.05 percent. Notes: A large truck is defined as a truck with a gross vehicle weight rating (GVWR) greater than 10,000 pounds. Individual numbers may not add up to the totals due to independent rounding. Percentages are based on unrounded numbers.Sources: Fatal Crashes: National Highway Traffic Safety Administration (NHTSA), Fatality Analysis Reporting System (FARS). Injury and Property Damage Only Crashes: NHTSA, Crash Report Sampling System (CRSS).
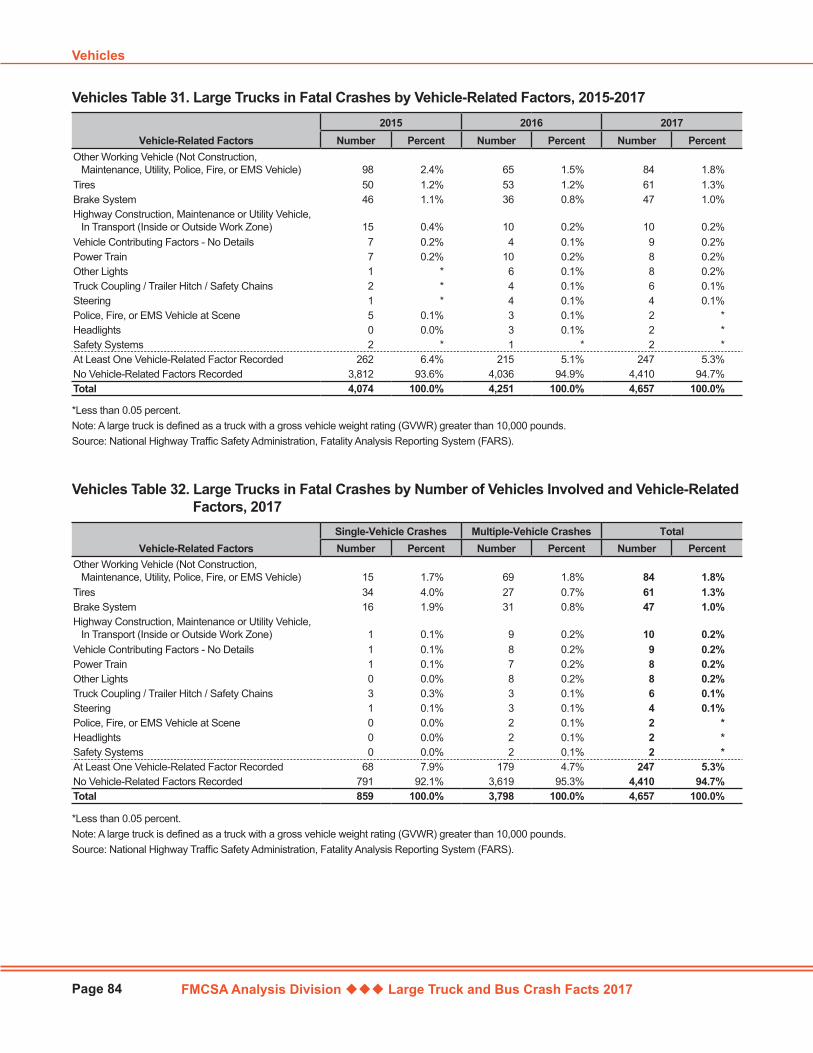
FMCSA Analysis Division Large Truck and Bus Crash Facts 2017
Vehicles
Page 84
Vehicle-Related Factors2015 2016 2017
Number Percent Number Percent Number PercentOther Working Vehicle (Not Construction,
Maintenance, Utility, Police, Fire, or EMS Vehicle) 98 2.4% 65 1.5% 84 1.8%Tires 50 1.2% 53 1.2% 61 1.3%Brake System 46 1.1% 36 0.8% 47 1.0%Highway Construction, Maintenance or Utility Vehicle,
In Transport (Inside or Outside Work Zone) 15 0.4% 10 0.2% 10 0.2%Vehicle Contributing Factors - No Details 7 0.2% 4 0.1% 9 0.2%Power Train 7 0.2% 10 0.2% 8 0.2%Other Lights 1 * 6 0.1% 8 0.2%Truck Coupling / Trailer Hitch / Safety Chains 2 * 4 0.1% 6 0.1%Steering 1 * 4 0.1% 4 0.1%Police, Fire, or EMS Vehicle at Scene 5 0.1% 3 0.1% 2 *Headlights 0 0.0% 3 0.1% 2 *Safety Systems 2 * 1 * 2 *At Least One Vehicle-Related Factor Recorded 262 6.4% 215 5.1% 247 5.3%No Vehicle-Related Factors Recorded 3,812 93.6% 4,036 94.9% 4,410 94.7%Total 4,074 100.0% 4,251 100.0% 4,657 100.0%
Vehicles Table 31. Large Trucks in Fatal Crashes by Vehicle-Related Factors, 2015-2017
*Less than 0.05 percent.Note: A large truck is defined as a truck with a gross vehicle weight rating (GVWR) greater than 10,000 pounds.Source: National Highway Traffic Safety Administration, Fatality Analysis Reporting System (FARS).
Vehicle-Related FactorsSingle-Vehicle Crashes Multiple-Vehicle Crashes TotalNumber Percent Number Percent Number Percent
Other Working Vehicle (Not Construction, Maintenance, Utility, Police, Fire, or EMS Vehicle) 15 1.7% 69 1.8% 84 1.8%
Tires 34 4.0% 27 0.7% 61 1.3%Brake System 16 1.9% 31 0.8% 47 1.0%Highway Construction, Maintenance or Utility Vehicle,
In Transport (Inside or Outside Work Zone) 1 0.1% 9 0.2% 10 0.2%Vehicle Contributing Factors - No Details 1 0.1% 8 0.2% 9 0.2%Power Train 1 0.1% 7 0.2% 8 0.2%Other Lights 0 0.0% 8 0.2% 8 0.2%Truck Coupling / Trailer Hitch / Safety Chains 3 0.3% 3 0.1% 6 0.1%Steering 1 0.1% 3 0.1% 4 0.1%Police, Fire, or EMS Vehicle at Scene 0 0.0% 2 0.1% 2 *Headlights 0 0.0% 2 0.1% 2 *Safety Systems 0 0.0% 2 0.1% 2 *At Least One Vehicle-Related Factor Recorded 68 7.9% 179 4.7% 247 5.3%No Vehicle-Related Factors Recorded 791 92.1% 3,619 95.3% 4,410 94.7%Total 859 100.0% 3,798 100.0% 4,657 100.0%
Vehicles Table 32. Large Trucks in Fatal Crashes by Number of Vehicles Involved and Vehicle-Related Factors, 2017
*Less than 0.05 percent.Note: A large truck is defined as a truck with a gross vehicle weight rating (GVWR) greater than 10,000 pounds.Source: National Highway Traffic Safety Administration, Fatality Analysis Reporting System (FARS).
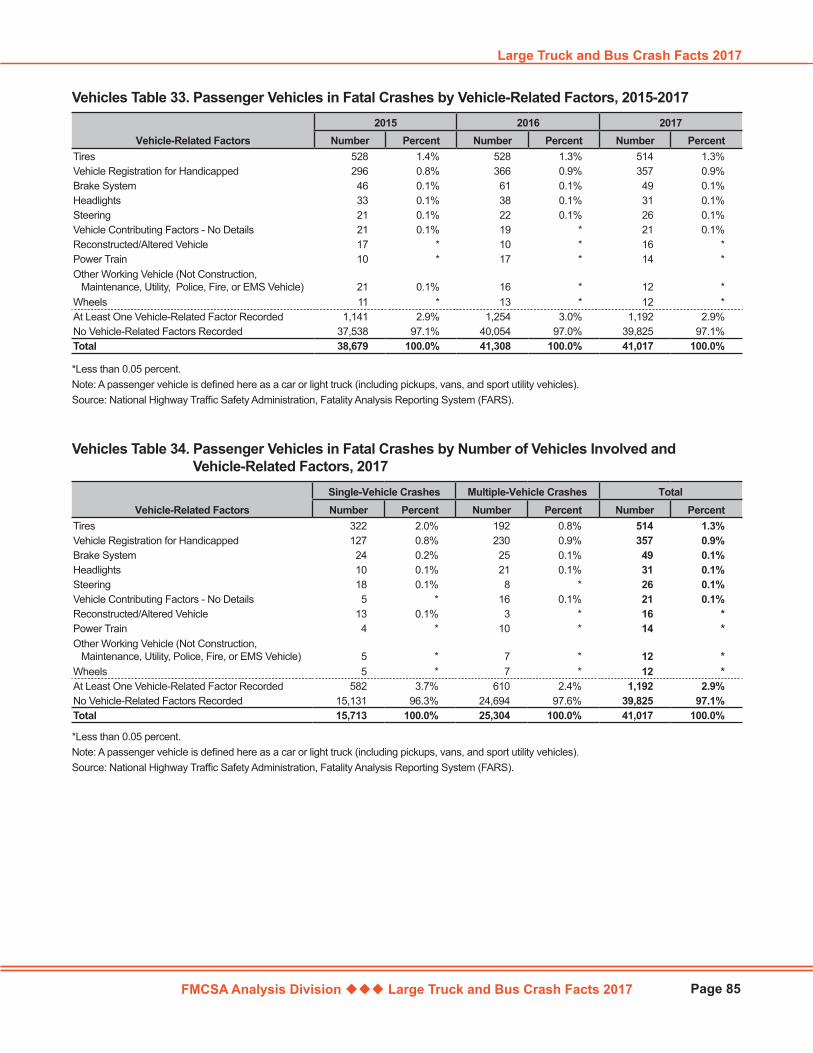
FMCSA Analysis Division Large Truck and Bus Crash Facts 2017
Large Truck and Bus Crash Facts 2017
Page 85
Vehicle-Related Factors2015 2016 2017
Number Percent Number Percent Number PercentTires 528 1.4% 528 1.3% 514 1.3%Vehicle Registration for Handicapped 296 0.8% 366 0.9% 357 0.9%Brake System 46 0.1% 61 0.1% 49 0.1%Headlights 33 0.1% 38 0.1% 31 0.1%Steering 21 0.1% 22 0.1% 26 0.1%Vehicle Contributing Factors - No Details 21 0.1% 19 * 21 0.1%Reconstructed/Altered Vehicle 17 * 10 * 16 *Power Train 10 * 17 * 14 *Other Working Vehicle (Not Construction,
Maintenance, Utility, Police, Fire, or EMS Vehicle) 21 0.1% 16 * 12 *Wheels 11 * 13 * 12 *At Least One Vehicle-Related Factor Recorded 1,141 2.9% 1,254 3.0% 1,192 2.9%No Vehicle-Related Factors Recorded 37,538 97.1% 40,054 97.0% 39,825 97.1%Total 38,679 100.0% 41,308 100.0% 41,017 100.0%
Vehicles Table 33. Passenger Vehicles in Fatal Crashes by Vehicle-Related Factors, 2015-2017
*Less than 0.05 percent.Note: A passenger vehicle is defined here as a car or light truck (including pickups, vans, and sport utility vehicles).Source: National Highway Traffic Safety Administration, Fatality Analysis Reporting System (FARS).
Vehicle-Related FactorsSingle-Vehicle Crashes Multiple-Vehicle Crashes TotalNumber Percent Number Percent Number Percent
Tires 322 2.0% 192 0.8% 514 1.3%Vehicle Registration for Handicapped 127 0.8% 230 0.9% 357 0.9%Brake System 24 0.2% 25 0.1% 49 0.1%Headlights 10 0.1% 21 0.1% 31 0.1%Steering 18 0.1% 8 * 26 0.1%Vehicle Contributing Factors - No Details 5 * 16 0.1% 21 0.1%Reconstructed/Altered Vehicle 13 0.1% 3 * 16 *Power Train 4 * 10 * 14 *Other Working Vehicle (Not Construction,
Maintenance, Utility, Police, Fire, or EMS Vehicle) 5 * 7 * 12 *Wheels 5 * 7 * 12 *At Least One Vehicle-Related Factor Recorded 582 3.7% 610 2.4% 1,192 2.9%No Vehicle-Related Factors Recorded 15,131 96.3% 24,694 97.6% 39,825 97.1%Total 15,713 100.0% 25,304 100.0% 41,017 100.0%
Vehicles Table 34. Passenger Vehicles in Fatal Crashes by Number of Vehicles Involved and Vehicle-Related Factors, 2017
*Less than 0.05 percent.Note: A passenger vehicle is defined here as a car or light truck (including pickups, vans, and sport utility vehicles).Source: National Highway Traffic Safety Administration, Fatality Analysis Reporting System (FARS).

[This page intentionally left blank.]
FMCSA Analysis Division Large Truck and Bus Crash Facts 2017 Page 87
PeopleThis chapter contains information on drivers of large trucks and buses in fatal, injury, and property damage only crashes and on people killed or injured in large truck crashes. Some statistics for passenger vehicle drivers are also listed, to allow comparisons. It is important to note that the number of large truck or bus drivers in crashes is not exactly equal to the number of large trucks or buses in crashes, because some vehicles did not have drivers at the time of their crash. Below is a summary of some of the information in this section:
Of the 4,600 drivers of large trucks involved in fatal crashes in 2017, 270 (6 percent) were 25 years of age or younger, and 299 (6 percent) were 66 years of age or older. In comparison, 3 (1 percent) of the 230 drivers of buses in fatal crashes were 25 years of age or younger, and 33 (14 percent) were 66 years of age or older.
In 2017, 13 percent (713) of large truck occupants in fatal crashes were not wearing a safety belt, of which 322 (45 percent) were killed in the crash. In contrast, only 378 (9 percent) of the 4,310 large truck occupants wearing safety belts in fatal crashes were killed. Nine percent of the 4,600 drivers of large trucks involved in fatal crashes (434) were not wearing a safety belt at the time of the crash.
In 2017, 252 of the 4,600 large truck drivers in fatal crashes (5 percent) tested positive for at least one drug, although 59 percent of them were not tested. Conversely, 7,694 of the 25,918 drivers of all vehicles in fatal crashes (15 percent) tested positive for at least one drug, although 50 percent of them were not tested. A driver is more likely to be tested for drugs if there is information from the crash indicating that drugs may have been a factor.
In 2017, at least one driver-related factor was recorded for 32 percent of the large truck drivers in fatal crashes, compared to 54 percent of the passenger vehicle drivers in fatal crashes. “Speeding of Any Kind” was the most frequent driver-related factor for drivers of both vehicle types; “Distraction/Inattention” was the second most common for large truck drivers, and “Impairment (Fatigue, Alcohol, Illness, etc.)” was the second most common for passenger vehicle drivers.
There were 841 large truck occupant fatalities in 2017, a 16-percent increase from the 725 fatalities in 2016. In 2017, 85 percent of these occupant fatalities were drivers of large trucks, and 15 percent were passengers in large trucks.
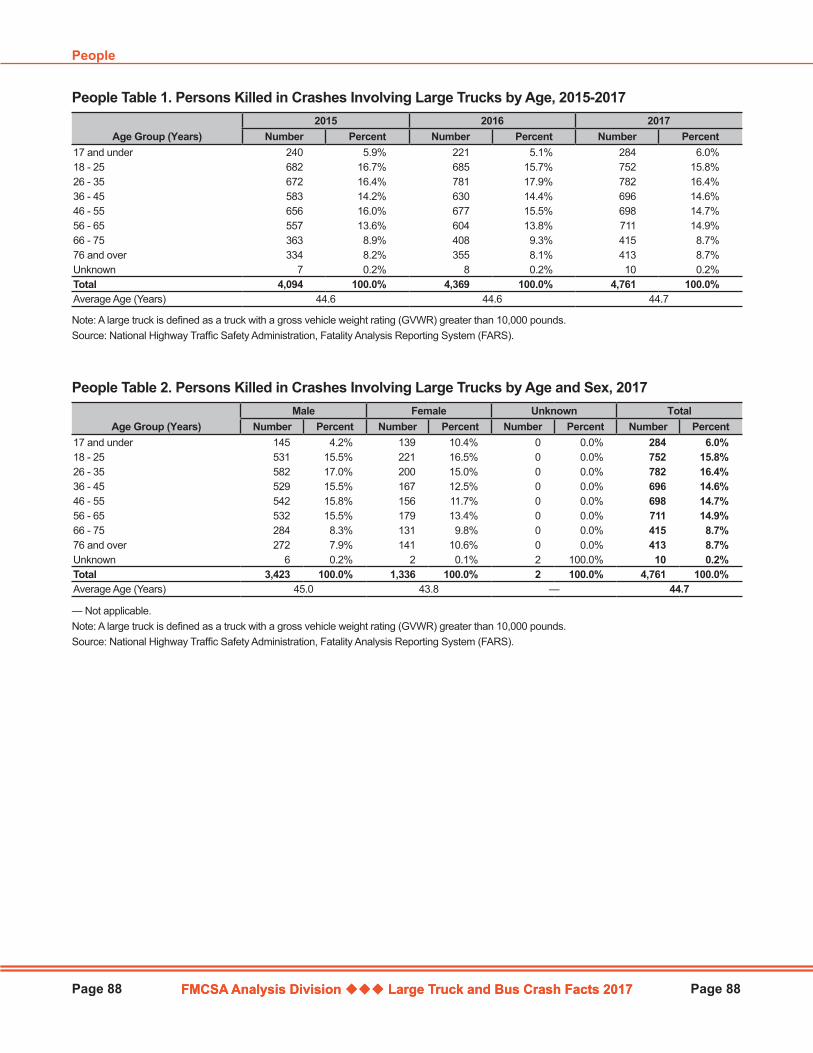
FMCSA Analysis Division Large Truck and Bus Crash Facts 2017
People
Page 88 FMCSA Analysis Division Large Truck and Bus Crash Facts 2017 Page 88
Age Group (Years)2015 2016 2017
Number Percent Number Percent Number Percent17 and under 240 5.9% 221 5.1% 284 6.0%18 - 25 682 16.7% 685 15.7% 752 15.8%26 - 35 672 16.4% 781 17.9% 782 16.4%36 - 45 583 14.2% 630 14.4% 696 14.6%46 - 55 656 16.0% 677 15.5% 698 14.7%56 - 65 557 13.6% 604 13.8% 711 14.9%66 - 75 363 8.9% 408 9.3% 415 8.7%76 and over 334 8.2% 355 8.1% 413 8.7%Unknown 7 0.2% 8 0.2% 10 0.2%Total 4,094 100.0% 4,369 100.0% 4,761 100.0%Average Age (Years) 44.6 44.6 44.7
People Table 1. Persons Killed in Crashes Involving Large Trucks by Age, 2015-2017
Note: A large truck is defined as a truck with a gross vehicle weight rating (GVWR) greater than 10,000 pounds.Source: National Highway Traffic Safety Administration, Fatality Analysis Reporting System (FARS).
Age Group (Years)Male Female Unknown Total
Number Percent Number Percent Number Percent Number Percent17 and under 145 4.2% 139 10.4% 0 0.0% 284 6.0%18 - 25 531 15.5% 221 16.5% 0 0.0% 752 15.8%26 - 35 582 17.0% 200 15.0% 0 0.0% 782 16.4%36 - 45 529 15.5% 167 12.5% 0 0.0% 696 14.6%46 - 55 542 15.8% 156 11.7% 0 0.0% 698 14.7%56 - 65 532 15.5% 179 13.4% 0 0.0% 711 14.9%66 - 75 284 8.3% 131 9.8% 0 0.0% 415 8.7%76 and over 272 7.9% 141 10.6% 0 0.0% 413 8.7%Unknown 6 0.2% 2 0.1% 2 100.0% 10 0.2%Total 3,423 100.0% 1,336 100.0% 2 100.0% 4,761 100.0%Average Age (Years) 45.0 43.8 — 44.7
People Table 2. Persons Killed in Crashes Involving Large Trucks by Age and Sex, 2017
— Not applicable.Note: A large truck is defined as a truck with a gross vehicle weight rating (GVWR) greater than 10,000 pounds.Source: National Highway Traffic Safety Administration, Fatality Analysis Reporting System (FARS).

FMCSA Analysis Division Large Truck and Bus Crash Facts 2017
Large Truck and Bus Crash Facts 2017
Page 89
Age Group (Years)2015 2016 2017
Number Percent Number Percent Number Percent17 and under 2,097 6.7% 2,185 6.6% 2,070 6.4%18 - 25 5,915 19.0% 6,221 18.8% 5,747 17.7%26 - 35 5,363 17.2% 5,781 17.5% 5,633 17.3%36 - 45 3,877 12.5% 4,195 12.7% 4,256 13.1%46 - 55 4,449 14.3% 4,465 13.5% 4,479 13.8%56 - 65 3,933 12.6% 4,214 12.8% 4,338 13.3%66 - 75 2,676 8.6% 2,853 8.6% 2,822 8.7%76 and over 2,752 8.8% 3,014 9.1% 3,062 9.4%Unknown 67 0.2% 88 0.3% 112 0.3%Total 31,129 100.0% 33,016 100.0% 32,519 100.0%Average Age (Years) 42.8 43.5 44.1
People Table 3. Persons Killed in Crashes Involving Passenger Vehicles by Age, 2015-2017
Note: A passenger vehicle is defined as a car or light truck (including pickups, vans, and sport utility vehicles).Source: National Highway Traffic Safety Administration, Fatality Analysis Reporting System (FARS).
Age Group (Years)Male Female Unknown Total
Number Percent Number Percent Number Percent Number Percent17 and under 1,234 5.5% 836 8.3% 0 0.0% 2,070 6.4%18 - 25 4,066 18.2% 1,679 16.6% 2 4.9% 5,747 17.7%26 - 35 4,108 18.4% 1,524 15.1% 1 2.4% 5,633 17.3%36 - 45 3,032 13.6% 1,223 12.1% 1 2.4% 4,256 13.1%46 - 55 3,167 14.2% 1,310 13.0% 2 4.9% 4,479 13.8%56 - 65 3,072 13.7% 1,263 12.5% 3 7.3% 4,338 13.3%66 - 75 1,808 8.1% 1,014 10.0% 0 0.0% 2,822 8.7%76 and over 1,829 8.2% 1,233 12.2% 0 0.0% 3,062 9.4%Unknown 57 0.3% 23 0.2% 32 78.0% 112 0.3%Total 22,373 100.0% 10,105 100.0% 41 100.0% 32,519 100.0%Average Age (Years) 43.6 45.2 42.4 44.1
People Table 4. Persons Killed in Crashes Involving Passenger Vehicles by Age and Sex, 2017
Note: A passenger vehicle is defined as a car or light truck (including pickups, vans, and sport utility vehicles).Source: National Highway Traffic Safety Administration, Fatality Analysis Reporting System (FARS).
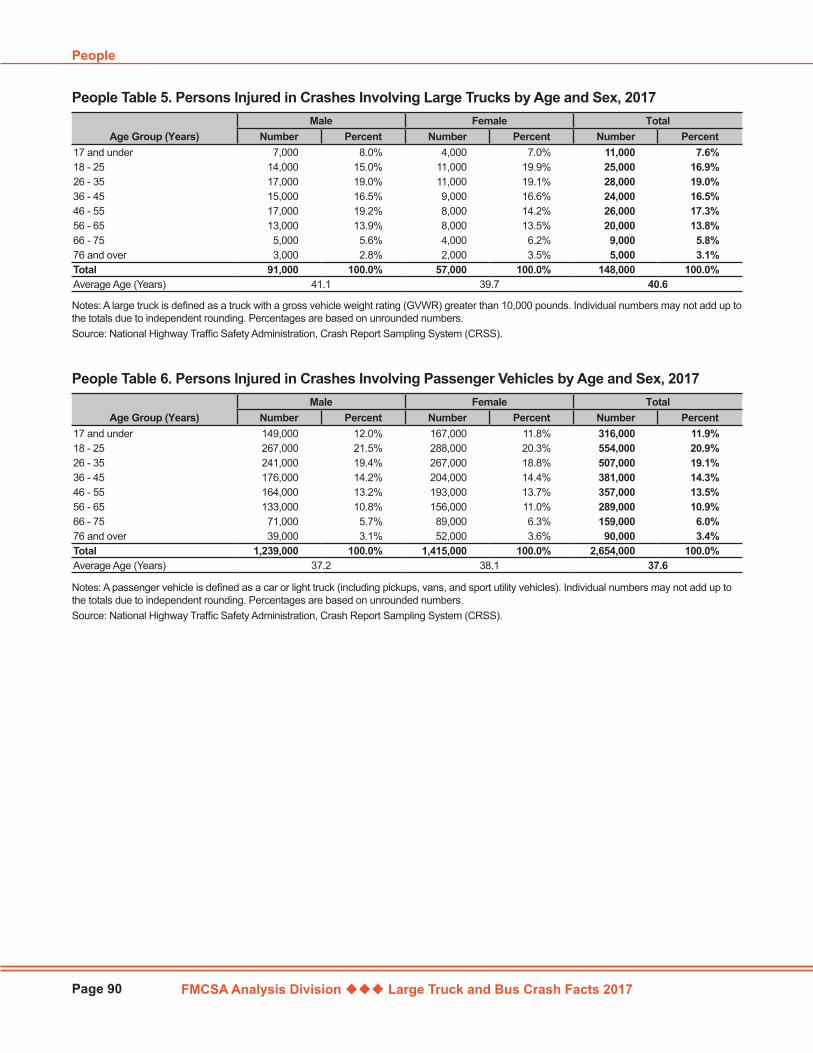
FMCSA Analysis Division Large Truck and Bus Crash Facts 2017
People
Page 90
Age Group (Years)Male Female Total
Number Percent Number Percent Number Percent17 and under 7,000 8.0% 4,000 7.0% 11,000 7.6%18 - 25 14,000 15.0% 11,000 19.9% 25,000 16.9%26 - 35 17,000 19.0% 11,000 19.1% 28,000 19.0%36 - 45 15,000 16.5% 9,000 16.6% 24,000 16.5%46 - 55 17,000 19.2% 8,000 14.2% 26,000 17.3%56 - 65 13,000 13.9% 8,000 13.5% 20,000 13.8%66 - 75 5,000 5.6% 4,000 6.2% 9,000 5.8%76 and over 3,000 2.8% 2,000 3.5% 5,000 3.1%Total 91,000 100.0% 57,000 100.0% 148,000 100.0%Average Age (Years) 41.1 39.7 40.6
People Table 5. Persons Injured in Crashes Involving Large Trucks by Age and Sex, 2017
Notes: A large truck is defined as a truck with a gross vehicle weight rating (GVWR) greater than 10,000 pounds. Individual numbers may not add up to the totals due to independent rounding. Percentages are based on unrounded numbers.Source: National Highway Traffic Safety Administration, Crash Report Sampling System (CRSS).
Age Group (Years)Male Female Total
Number Percent Number Percent Number Percent17 and under 149,000 12.0% 167,000 11.8% 316,000 11.9%18 - 25 267,000 21.5% 288,000 20.3% 554,000 20.9%26 - 35 241,000 19.4% 267,000 18.8% 507,000 19.1%36 - 45 176,000 14.2% 204,000 14.4% 381,000 14.3%46 - 55 164,000 13.2% 193,000 13.7% 357,000 13.5%56 - 65 133,000 10.8% 156,000 11.0% 289,000 10.9%66 - 75 71,000 5.7% 89,000 6.3% 159,000 6.0%76 and over 39,000 3.1% 52,000 3.6% 90,000 3.4%Total 1,239,000 100.0% 1,415,000 100.0% 2,654,000 100.0%Average Age (Years) 37.2 38.1 37.6
People Table 6. Persons Injured in Crashes Involving Passenger Vehicles by Age and Sex, 2017
Notes: A passenger vehicle is defined as a car or light truck (including pickups, vans, and sport utility vehicles). Individual numbers may not add up to the totals due to independent rounding. Percentages are based on unrounded numbers.Source: National Highway Traffic Safety Administration, Crash Report Sampling System (CRSS).
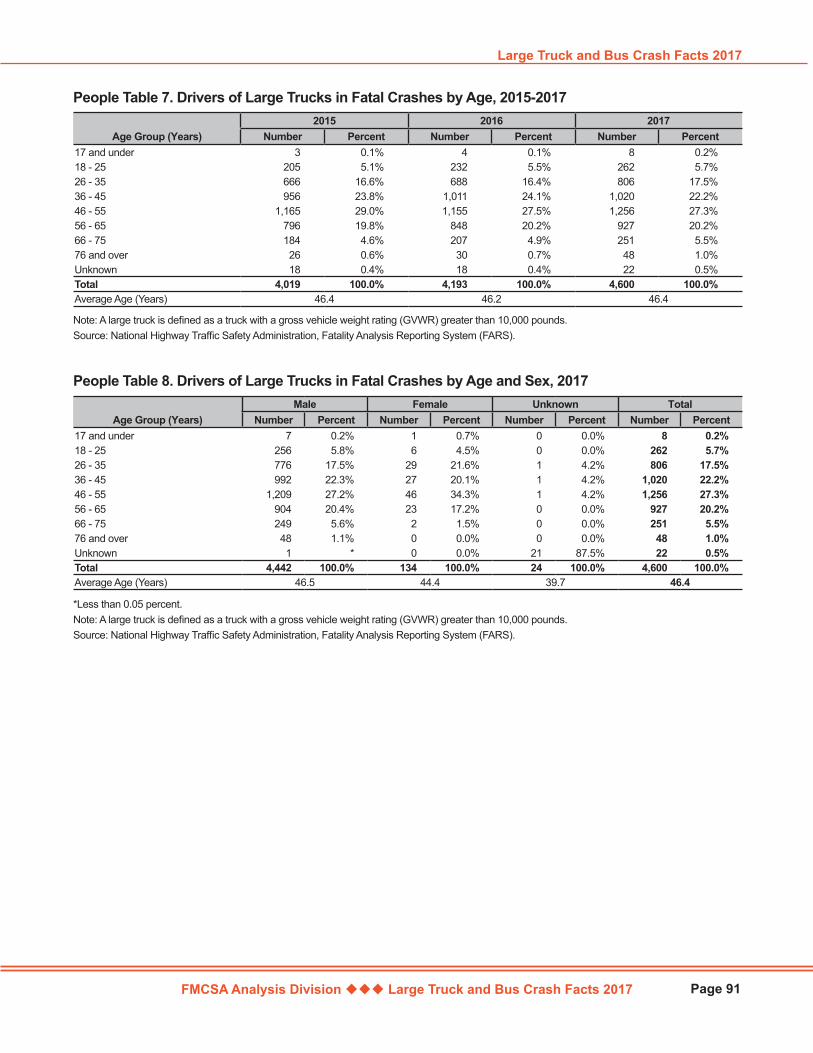
FMCSA Analysis Division Large Truck and Bus Crash Facts 2017
Large Truck and Bus Crash Facts 2017
Page 91
Age Group (Years)2015 2016 2017
Number Percent Number Percent Number Percent17 and under 3 0.1% 4 0.1% 8 0.2%18 - 25 205 5.1% 232 5.5% 262 5.7%26 - 35 666 16.6% 688 16.4% 806 17.5%36 - 45 956 23.8% 1,011 24.1% 1,020 22.2%46 - 55 1,165 29.0% 1,155 27.5% 1,256 27.3%56 - 65 796 19.8% 848 20.2% 927 20.2%66 - 75 184 4.6% 207 4.9% 251 5.5%76 and over 26 0.6% 30 0.7% 48 1.0%Unknown 18 0.4% 18 0.4% 22 0.5%Total 4,019 100.0% 4,193 100.0% 4,600 100.0%Average Age (Years) 46.4 46.2 46.4
People Table 7. Drivers of Large Trucks in Fatal Crashes by Age, 2015-2017
Note: A large truck is defined as a truck with a gross vehicle weight rating (GVWR) greater than 10,000 pounds.Source: National Highway Traffic Safety Administration, Fatality Analysis Reporting System (FARS).
Age Group (Years)Male Female Unknown Total
Number Percent Number Percent Number Percent Number Percent17 and under 7 0.2% 1 0.7% 0 0.0% 8 0.2%18 - 25 256 5.8% 6 4.5% 0 0.0% 262 5.7%26 - 35 776 17.5% 29 21.6% 1 4.2% 806 17.5%36 - 45 992 22.3% 27 20.1% 1 4.2% 1,020 22.2%46 - 55 1,209 27.2% 46 34.3% 1 4.2% 1,256 27.3%56 - 65 904 20.4% 23 17.2% 0 0.0% 927 20.2%66 - 75 249 5.6% 2 1.5% 0 0.0% 251 5.5%76 and over 48 1.1% 0 0.0% 0 0.0% 48 1.0%Unknown 1 * 0 0.0% 21 87.5% 22 0.5%Total 4,442 100.0% 134 100.0% 24 100.0% 4,600 100.0%Average Age (Years) 46.5 44.4 39.7 46.4
People Table 8. Drivers of Large Trucks in Fatal Crashes by Age and Sex, 2017
*Less than 0.05 percent. Note: A large truck is defined as a truck with a gross vehicle weight rating (GVWR) greater than 10,000 pounds.Source: National Highway Traffic Safety Administration, Fatality Analysis Reporting System (FARS).

FMCSA Analysis Division Large Truck and Bus Crash Facts 2017
People
Page 92
Age Group (Years)Male Female Unknown Total
Number Percent Number Percent Number Percent Number Percent17 and under 0 0.0% 0 0.0% 0 — 0 0.0%18 - 25 2 1.3% 1 1.4% 0 — 3 1.3%26 - 35 19 12.2% 10 13.5% 0 — 29 12.6%36 - 45 21 13.5% 19 25.7% 0 — 40 17.4%46 - 55 41 26.3% 23 31.1% 0 — 64 27.8%56 - 65 44 28.2% 17 23.0% 0 — 61 26.5%66 - 75 25 16.0% 4 5.4% 0 — 29 12.6%76 and over 4 2.6% 0 0.0% 0 — 4 1.7%Unknown 0 0.0% 0 0.0% 0 — 0 0.0%Total 156 100.0% 74 100.0% 0 — 230 100.0%Average Age (Years) 53.2 48.1 — 51.6
Age Group (Years)2015 2016 2017
Number Percent Number Percent Number Percent17 and under 0 0.0% 0 0.0% 0 0.0%18 - 25 4 1.5% 6 2.6% 3 1.3%26 - 35 22 8.4% 23 9.9% 29 12.6%36 - 45 48 18.3% 37 15.9% 40 17.4%46 - 55 84 31.9% 70 30.0% 64 27.8%56 - 65 69 26.2% 70 30.0% 61 26.5%66 - 75 28 10.6% 24 10.3% 29 12.6%76 and over 7 2.7% 3 1.3% 4 1.7%Unknown 1 0.4% 0 0.0% 0 0.0%Total 263 100.0% 233 100.0% 230 100.0%Average Age (Years) 52.6 51.7 51.6
People Table 9. Drivers of Buses in Fatal Crashes by Age, 2015-2017
Note: A bus is defined as any motor vehicle designed primarily to transport nine or more persons, including the driver.Source: National Highway Traffic Safety Administration, Fatality Analysis Reporting System (FARS).
People Table 10. Drivers of Buses in Fatal Crashes by Age and Sex, 2017
— Not applicable.Note: A bus is defined as any motor vehicle designed primarily to transport nine or more persons, including the driver.Source: National Highway Traffic Safety Administration, Fatality Analysis Reporting System (FARS).

FMCSA Analysis Division Large Truck and Bus Crash Facts 2017
Large Truck and Bus Crash Facts 2017
Page 93
Time of Day2015 2016 2017
Number Percent Number Percent Number Percent12am - 3am 323 7.9% 383 8.8% 354 7.4%3am - 6am 384 9.4% 508 11.6% 468 9.8%6am - 9am 651 15.9% 648 14.8% 695 14.6%9am - 12pm 664 16.2% 722 16.5% 715 15.0%12pm - 3pm 728 17.8% 729 16.7% 897 18.8%3pm - 6pm 624 15.2% 645 14.8% 782 16.4%6pm - 9pm 373 9.1% 398 9.1% 476 10.0%9pm - 12am 340 8.3% 330 7.6% 369 7.8%Unknown 7 0.2% 6 0.1% 5 0.1%Daytime (6am - 6pm) 2,667 65.1% 2,744 62.8% 3,089 64.9%Nighttime (6pm - 6am) 1,420 34.7% 1,619 37.1% 1,667 35.0%Total 4,094 100.0% 4,369 100.0% 4,761 100.0%
People Table 11. Persons Killed in Crashes Involving Large Trucks by Time of Day, 2015-2017
Note: A large truck is defined as a truck with a gross vehicle weight rating (GVWR) greater than 10,000 pounds.Source: National Highway Traffic Safety Administration, Fatality Analysis Reporting System (FARS).
Time of DayPersons Killed Persons Injured
Number Percent Number Percent12am - 3am 354 7.4% 5,000 3.4%3am - 6am 468 9.8% 7,000 4.7%6am - 9am 695 14.6% 23,000 15.4%9am - 12pm 715 15.0% 27,000 18.0%12pm - 3pm 897 18.8% 37,000 24.7%3pm - 6pm 782 16.4% 29,000 19.8%6pm - 9pm 476 10.0% 12,000 8.3%9pm - 12am 369 7.8% 8,000 5.7%Unknown 5 0.1% * *Daytime (6am - 6pm) 3,089 64.9% 115,000 77.9%Nighttime (6pm - 6am) 1,667 35.0% 33,000 22.1%Total 4,761 100.0% 148,000 100.0%
People Table 12. Persons Killed and Injured in Crashes Involving Large Trucks by Time of Day, 2017
*Less than 500 or less than 0.05 percent.Notes: A large truck is defined as a truck with a gross vehicle weight rating (GVWR) greater than 10,000 pounds. Individual numbers may not add up to the totals due to independent rounding. Percentages are based on unrounded numbers.Sources: Persons Killed: National Highway Traffic Safety Administration (NHTSA), Fatality Analysis Reporting System (FARS). Persons Injured: NHTSA, Crash Report Sampling System (CRSS).
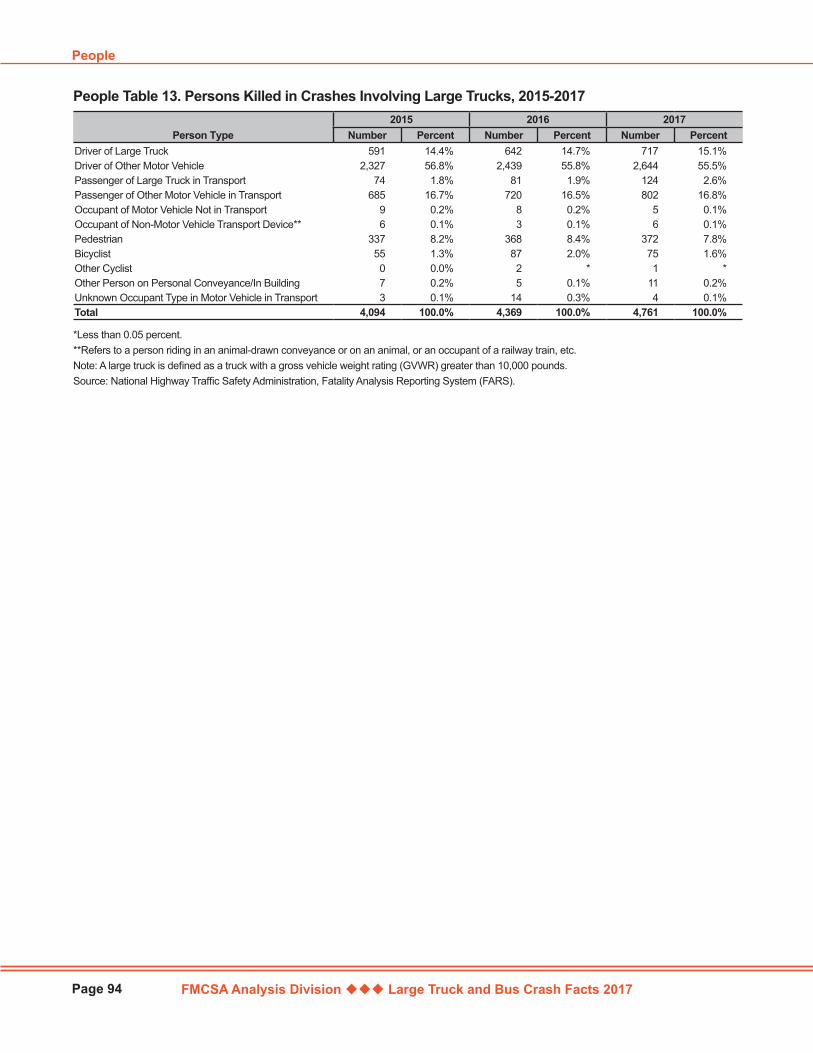
FMCSA Analysis Division Large Truck and Bus Crash Facts 2017
People
Page 94
Person Type2015 2016 2017
Number Percent Number Percent Number PercentDriver of Large Truck 591 14.4% 642 14.7% 717 15.1%Driver of Other Motor Vehicle 2,327 56.8% 2,439 55.8% 2,644 55.5%Passenger of Large Truck in Transport 74 1.8% 81 1.9% 124 2.6%Passenger of Other Motor Vehicle in Transport 685 16.7% 720 16.5% 802 16.8%Occupant of Motor Vehicle Not in Transport 9 0.2% 8 0.2% 5 0.1%Occupant of Non-Motor Vehicle Transport Device** 6 0.1% 3 0.1% 6 0.1%Pedestrian 337 8.2% 368 8.4% 372 7.8%Bicyclist 55 1.3% 87 2.0% 75 1.6%Other Cyclist 0 0.0% 2 * 1 *Other Person on Personal Conveyance/In Building 7 0.2% 5 0.1% 11 0.2%Unknown Occupant Type in Motor Vehicle in Transport 3 0.1% 14 0.3% 4 0.1%Total 4,094 100.0% 4,369 100.0% 4,761 100.0%
People Table 13. Persons Killed in Crashes Involving Large Trucks, 2015-2017
*Less than 0.05 percent. **Refers to a person riding in an animal-drawn conveyance or on an animal, or an occupant of a railway train, etc.Note: A large truck is defined as a truck with a gross vehicle weight rating (GVWR) greater than 10,000 pounds.Source: National Highway Traffic Safety Administration, Fatality Analysis Reporting System (FARS).
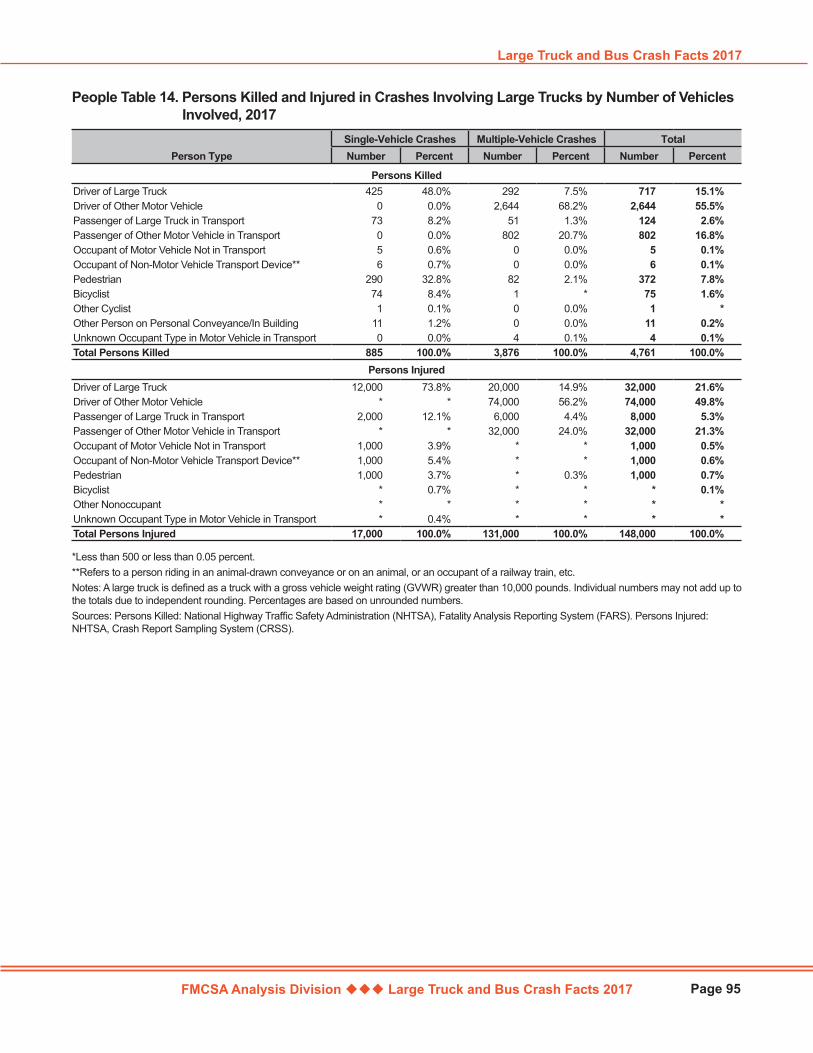
FMCSA Analysis Division Large Truck and Bus Crash Facts 2017
Large Truck and Bus Crash Facts 2017
Page 95
Person TypeSingle-Vehicle Crashes Multiple-Vehicle Crashes TotalNumber Percent Number Percent Number Percent
Persons KilledDriver of Large Truck 425 48.0% 292 7.5% 717 15.1%Driver of Other Motor Vehicle 0 0.0% 2,644 68.2% 2,644 55.5%Passenger of Large Truck in Transport 73 8.2% 51 1.3% 124 2.6%Passenger of Other Motor Vehicle in Transport 0 0.0% 802 20.7% 802 16.8%Occupant of Motor Vehicle Not in Transport 5 0.6% 0 0.0% 5 0.1%Occupant of Non-Motor Vehicle Transport Device** 6 0.7% 0 0.0% 6 0.1%Pedestrian 290 32.8% 82 2.1% 372 7.8%Bicyclist 74 8.4% 1 * 75 1.6%Other Cyclist 1 0.1% 0 0.0% 1 *Other Person on Personal Conveyance/In Building 11 1.2% 0 0.0% 11 0.2%Unknown Occupant Type in Motor Vehicle in Transport 0 0.0% 4 0.1% 4 0.1%Total Persons Killed 885 100.0% 3,876 100.0% 4,761 100.0%
Persons InjuredDriver of Large Truck 12,000 73.8% 20,000 14.9% 32,000 21.6%Driver of Other Motor Vehicle * * 74,000 56.2% 74,000 49.8%Passenger of Large Truck in Transport 2,000 12.1% 6,000 4.4% 8,000 5.3%Passenger of Other Motor Vehicle in Transport * * 32,000 24.0% 32,000 21.3%Occupant of Motor Vehicle Not in Transport 1,000 3.9% * * 1,000 0.5%Occupant of Non-Motor Vehicle Transport Device** 1,000 5.4% * * 1,000 0.6%Pedestrian 1,000 3.7% * 0.3% 1,000 0.7%Bicyclist * 0.7% * * * 0.1%Other Nonoccupant * * * * * *Unknown Occupant Type in Motor Vehicle in Transport * 0.4% * * * *Total Persons Injured 17,000 100.0% 131,000 100.0% 148,000 100.0%
People Table 14. Persons Killed and Injured in Crashes Involving Large Trucks by Number of Vehicles Involved, 2017
*Less than 500 or less than 0.05 percent.**Refers to a person riding in an animal-drawn conveyance or on an animal, or an occupant of a railway train, etc.Notes: A large truck is defined as a truck with a gross vehicle weight rating (GVWR) greater than 10,000 pounds. Individual numbers may not add up to the totals due to independent rounding. Percentages are based on unrounded numbers.Sources: Persons Killed: National Highway Traffic Safety Administration (NHTSA), Fatality Analysis Reporting System (FARS). Persons Injured: NHTSA, Crash Report Sampling System (CRSS).

FMCSA Analysis Division Large Truck and Bus Crash Facts 2017
People
Page 96
Person Type2015 2016 2017
Number Percent Number Percent Number PercentDriver 591 88.9% 642 88.6% 717 85.3%Passenger 74 11.1% 81 11.2% 124 14.7%Unknown Occupant Type 0 0.0% 2 0.3% 0 0.0%Total 665 100.0% 725 100.0% 841 100.0%
People Table 15. Large Truck Occupants Killed by Person Type, 2015-2017
Note: A large truck is defined as a truck with a gross vehicle weight rating (GVWR) greater than 10,000 pounds.Source: National Highway Traffic Safety Administration, Fatality Analysis Reporting System (FARS).
Person TypeLarge Truck Occupants Killed Large Truck Occupants Injured
Number Percent Number PercentDriver 717 85.3% 32,000 80.1%Passenger 124 14.7% 8,000 19.7%Unknown Occupant Type 0 0.0% * 0.2%Total 841 100.0% 40,000 100.0%
People Table 16. Large Truck Occupants Killed and Injured by Person Type, 2017
*Less than 500.Notes: A large truck is defined as a truck with a gross vehicle weight rating (GVWR) greater than 10,000 pounds. Individual numbers may not add up to the totals due to independent rounding. Percentages are based on unrounded numbers.Sources: Persons Killed: National Highway Traffic Safety Administration (NHTSA), Fatality Analysis Reporting System (FARS). Persons Injured: NHTSA, Crash Report Sampling System (CRSS).
Vehicle/Person TypeVehicles Involved Persons Involved Persons Killed
Number Percent Number Percent Number PercentVehicles/Vehicle Occupants
Passenger Car 2,009 22.6% 3,013 24.2% 1,687 35.4%Light Truck 1,859 20.9% 2,998 24.1% 1,448 30.4%Large Truck (Single-Vehicle Crash) 859 9.7% 1,051 8.4% 498 10.5%Large Truck (Multiple-Vehicle Crash) 3,798 42.7% 4,372 35.1% 343 7.2%Bus 11 0.1% 97 0.8% 17 0.4%Motorcycle 280 3.1% 299 2.4% 275 5.8%Other Vehicle Type 79 0.9% 56 0.5% 23 0.5%Total Vehicles/Vehicle Occupants 8,895 100.0% 11,886 95.5% 4,291 90.1%
NonmotoristsOccupant of a Motor Vehicle Not In Transport — — 52 0.3% 5 0.1%Occupant of a Non-Motor Vehicle Transport Device — — 11 0.1% 6 0.1%Pedestrian — — 403 2.6% 372 7.8%Bicyclist — — 76 0.5% 76 1.6%Person on a Personal Conveyance — — 12 0.1% 11 0.2%Person in or on a Building — — 1 * 0 0.0%Total Nonmotorists — — 555 3.5% 470 9.9%Total 8,895 100.0% 15,773 100.0% 4,761 100.0%
People Table 17. Vehicles Involved, Persons Involved, and Persons Killed in Fatal Large Truck Crashes, 2017
— Not applicable.*Less than 0.05 percent.Notes: A passenger car is defined as a motor vehicle used primarily for carrying passengers, including convertibles, sedans, and station wagons. A light truck is defined as a truck with a gross vehicle weight rating (GVWR) of 10,000 pounds or less, including pickups, vans, truck-based station wagons, and sport utility vehicles. A large truck is defined as a truck with a gross vehicle weight rating (GVWR) greater than 10,000 pounds. A bus is defined as any motor vehicle designed primarily to transport nine or more persons, including the driver. Vehicles with unknown numbers of occupants are assumed here to have one occupant.Source: National Highway Traffic Safety Administration, Fatality Analysis Reporting System (FARS).
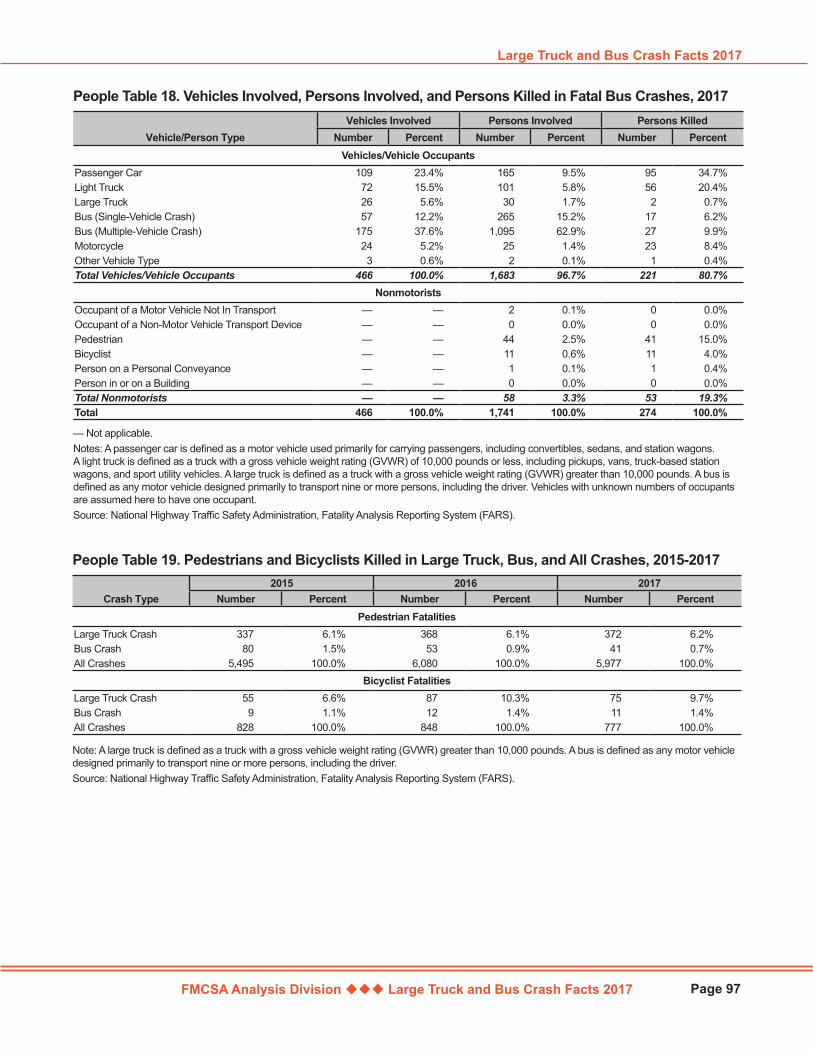
FMCSA Analysis Division Large Truck and Bus Crash Facts 2017
Large Truck and Bus Crash Facts 2017
Page 97
Vehicle/Person TypeVehicles Involved Persons Involved Persons Killed
Number Percent Number Percent Number PercentVehicles/Vehicle Occupants
Passenger Car 109 23.4% 165 9.5% 95 34.7%Light Truck 72 15.5% 101 5.8% 56 20.4%Large Truck 26 5.6% 30 1.7% 2 0.7%Bus (Single-Vehicle Crash) 57 12.2% 265 15.2% 17 6.2%Bus (Multiple-Vehicle Crash) 175 37.6% 1,095 62.9% 27 9.9%Motorcycle 24 5.2% 25 1.4% 23 8.4%Other Vehicle Type 3 0.6% 2 0.1% 1 0.4%Total Vehicles/Vehicle Occupants 466 100.0% 1,683 96.7% 221 80.7%
NonmotoristsOccupant of a Motor Vehicle Not In Transport — — 2 0.1% 0 0.0%Occupant of a Non-Motor Vehicle Transport Device — — 0 0.0% 0 0.0%Pedestrian — — 44 2.5% 41 15.0%Bicyclist — — 11 0.6% 11 4.0%Person on a Personal Conveyance — — 1 0.1% 1 0.4%Person in or on a Building — — 0 0.0% 0 0.0%Total Nonmotorists — — 58 3.3% 53 19.3%Total 466 100.0% 1,741 100.0% 274 100.0%
People Table 18. Vehicles Involved, Persons Involved, and Persons Killed in Fatal Bus Crashes, 2017
— Not applicable.Notes: A passenger car is defined as a motor vehicle used primarily for carrying passengers, including convertibles, sedans, and station wagons. A light truck is defined as a truck with a gross vehicle weight rating (GVWR) of 10,000 pounds or less, including pickups, vans, truck-based station wagons, and sport utility vehicles. A large truck is defined as a truck with a gross vehicle weight rating (GVWR) greater than 10,000 pounds. A bus is defined as any motor vehicle designed primarily to transport nine or more persons, including the driver. Vehicles with unknown numbers of occupants are assumed here to have one occupant.Source: National Highway Traffic Safety Administration, Fatality Analysis Reporting System (FARS).
Crash Type2015 2016 2017
Number Percent Number Percent Number PercentPedestrian Fatalities
Large Truck Crash 337 6.1% 368 6.1% 372 6.2%Bus Crash 80 1.5% 53 0.9% 41 0.7%All Crashes 5,495 100.0% 6,080 100.0% 5,977 100.0%
Bicyclist FatalitiesLarge Truck Crash 55 6.6% 87 10.3% 75 9.7%Bus Crash 9 1.1% 12 1.4% 11 1.4%All Crashes 828 100.0% 848 100.0% 777 100.0%
People Table 19. Pedestrians and Bicyclists Killed in Large Truck, Bus, and All Crashes, 2015-2017
Note: A large truck is defined as a truck with a gross vehicle weight rating (GVWR) greater than 10,000 pounds. A bus is defined as any motor vehicle designed primarily to transport nine or more persons, including the driver.Source: National Highway Traffic Safety Administration, Fatality Analysis Reporting System (FARS).

FMCSA Analysis Division Large Truck and Bus Crash Facts 2017
People
Page 98
Restraint Use2015 2016 2017
Number Percent Number Percent Number PercentNone 325 8.1% 403 9.6% 434 9.4%Yes 3,412 84.9% 3,487 83.2% 3,848 83.7% Shoulder Belt Only 12 0.3% 12 0.3% 8 0.2% Lap Belt Only 34 0.8% 37 0.9% 29 0.6% Lap and Shoulder Belt 3,320 82.6% 3,396 81.0% 3,796 82.5% Type Unknown 46 1.1% 42 1.0% 15 0.3%Unknown 282 7.0% 303 7.2% 318 6.9%Total 4,019 100.0% 4,193 100.0% 4,600 100.0%
People Table 20. Drivers of Large Trucks in Fatal Crashes by Restraint Use, 2015-2017
Note: A large truck is defined as a truck with a gross vehicle weight rating (GVWR) greater than 10,000 pounds.Source: National Highway Traffic Safety Administration, Fatality Analysis Reporting System (FARS).
Restraint Use
Ejection from the VehicleTotalNot Ejected Totally Ejected Partially Ejected Unknown
Number Percent Number Percent Number Percent Number Percent Number PercentNone 296 6.7% 102 74.5% 33 67.3% 3 16.7% 434 9.4%Yes 3,821 86.9% 13 9.5% 11 22.4% 3 16.7% 3,848 83.7% Shoulder Belt Only 8 0.2% 0 0.0% 0 0.0% 0 0.0% 8 0.2% Lap Belt Only 29 0.7% 0 0.0% 0 0.0% 0 0.0% 29 0.6% Lap and Shoulder Belt 3,769 85.7% 13 9.5% 11 22.4% 3 16.7% 3,796 82.5% Type Unknown 15 0.3% 0 0.0% 0 0.0% 0 0.0% 15 0.3%Unknown 279 6.3% 22 16.1% 5 10.2% 12 66.7% 318 6.9%Total 4,396 100.0% 137 100.0% 49 100.0% 18 100.0% 4,600 100.0%
People Table 21. Drivers of Large Trucks in Fatal Crashes by Restraint Use and Ejection from the Vehicle, 2017
Note: A large truck is defined as a truck with a gross vehicle weight rating (GVWR) greater than 10,000 pounds.Source: National Highway Traffic Safety Administration, Fatality Analysis Reporting System (FARS).
Injury Severity
Restraint UseNone Yes Unknown Total
Number Percent Number Percent Number Percent Number PercentFatal Injury 322 45.2% 378 8.8% 141 35.3% 841 15.5%Injury 158 22.2% 590 13.7% 41 10.3% 789 14.5%Unknown Injury Severity 46 6.5% 508 11.8% 35 8.8% 589 10.9%No Apparent Injury 187 26.2% 2,833 65.7% 183 45.8% 3,203 59.1%Died Prior to Crash 0 0.0% 1 * 0 0.0% 1 *Total 713 100.0% 4,310 100.0% 400 100.0% 5,423 100.0%
People Table 22. Large Truck Occupants in Fatal Crashes by Injury Severity and Restraint Use, 2017
*Less than 0.05 percent.Notes: A large truck is defined as a truck with a gross vehicle weight rating (GVWR) greater than 10,000 pounds. Restraint uses of “Shoulder Belt Only,” “Lap Belt Only,” “Lap and Shoulder Belt," and "Type Unknown” are grouped together as “Yes.” Injury severities of “Suspected Minor Injury,” “Suspected Serious Injury,” and “Injured, Severity Unknown” are grouped together as “Injury.” Injury severities of “Possible Injury” and “Unknown” are grouped together as "Unknown Injury Severity.”Source: National Highway Traffic Safety Administration, Fatality Analysis Reporting System (FARS).
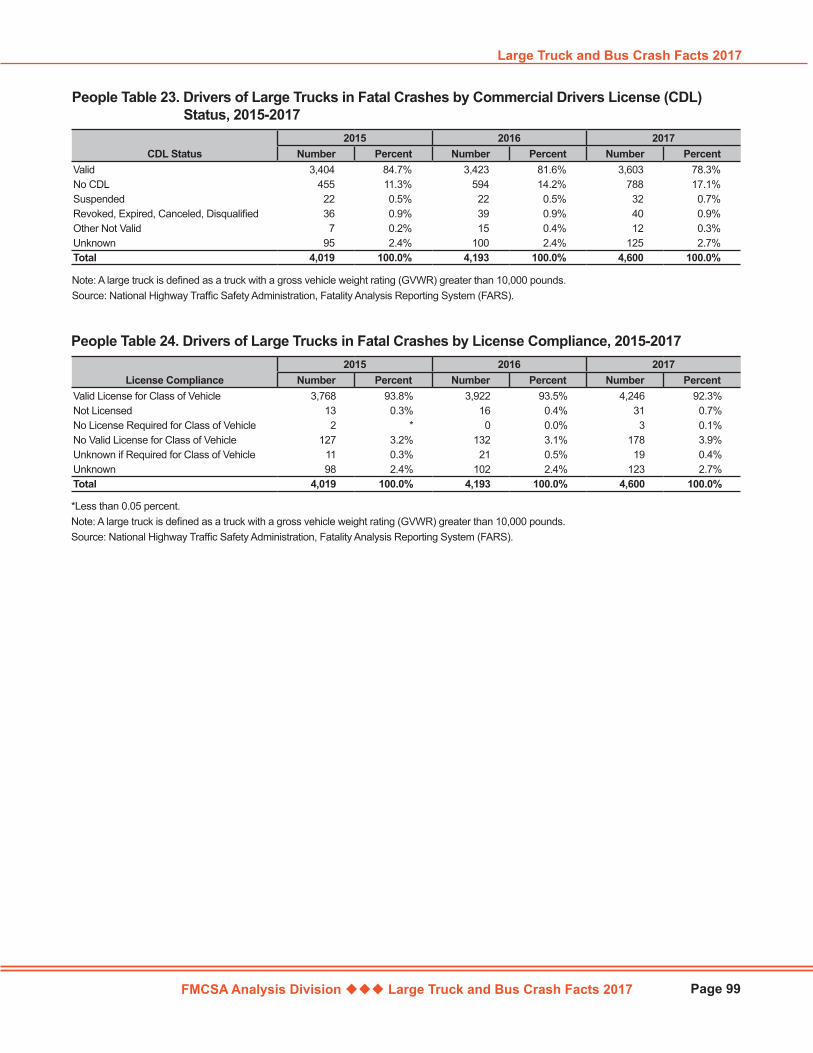
FMCSA Analysis Division Large Truck and Bus Crash Facts 2017
Large Truck and Bus Crash Facts 2017
Page 99
License Compliance2015 2016 2017
Number Percent Number Percent Number PercentValid License for Class of Vehicle 3,768 93.8% 3,922 93.5% 4,246 92.3%Not Licensed 13 0.3% 16 0.4% 31 0.7%No License Required for Class of Vehicle 2 * 0 0.0% 3 0.1%No Valid License for Class of Vehicle 127 3.2% 132 3.1% 178 3.9%Unknown if Required for Class of Vehicle 11 0.3% 21 0.5% 19 0.4%Unknown 98 2.4% 102 2.4% 123 2.7%Total 4,019 100.0% 4,193 100.0% 4,600 100.0%
CDL Status2015 2016 2017
Number Percent Number Percent Number PercentValid 3,404 84.7% 3,423 81.6% 3,603 78.3%No CDL 455 11.3% 594 14.2% 788 17.1%Suspended 22 0.5% 22 0.5% 32 0.7%Revoked, Expired, Canceled, Disqualified 36 0.9% 39 0.9% 40 0.9%Other Not Valid 7 0.2% 15 0.4% 12 0.3%Unknown 95 2.4% 100 2.4% 125 2.7%Total 4,019 100.0% 4,193 100.0% 4,600 100.0%
People Table 23. Drivers of Large Trucks in Fatal Crashes by Commercial Drivers License (CDL) Status, 2015-2017
Note: A large truck is defined as a truck with a gross vehicle weight rating (GVWR) greater than 10,000 pounds.Source: National Highway Traffic Safety Administration, Fatality Analysis Reporting System (FARS).
People Table 24. Drivers of Large Trucks in Fatal Crashes by License Compliance, 2015-2017
*Less than 0.05 percent.Note: A large truck is defined as a truck with a gross vehicle weight rating (GVWR) greater than 10,000 pounds.Source: National Highway Traffic Safety Administration, Fatality Analysis Reporting System (FARS).
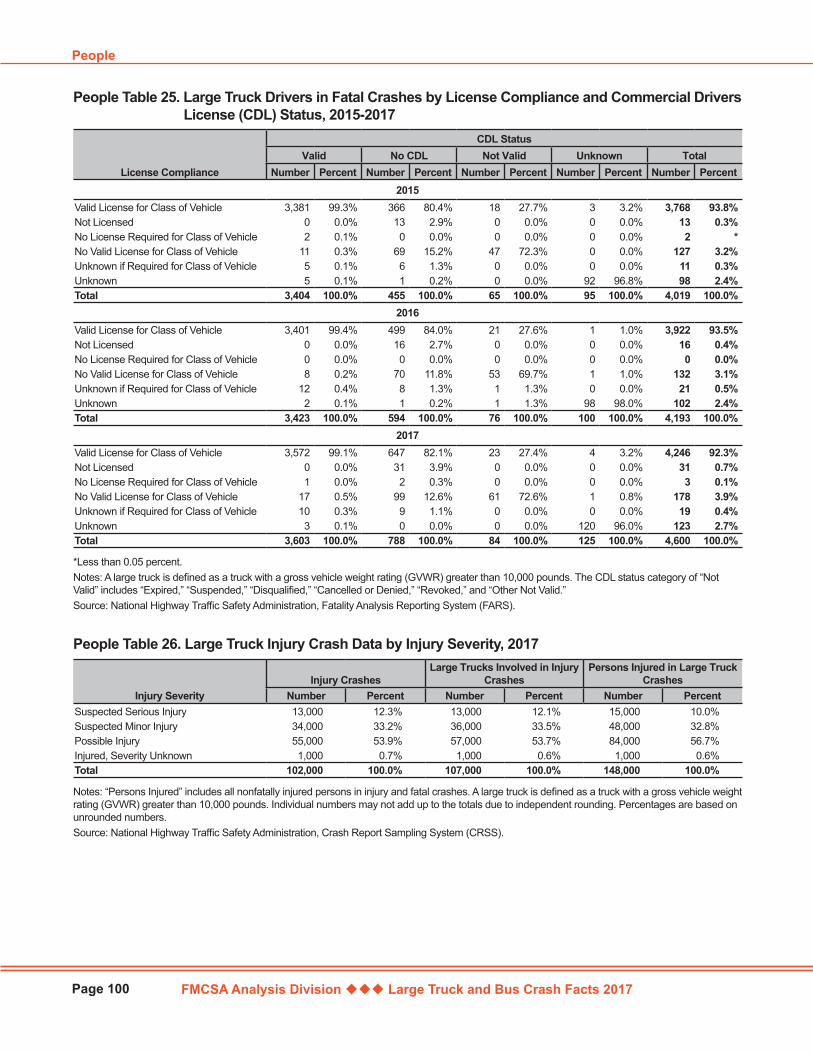
FMCSA Analysis Division Large Truck and Bus Crash Facts 2017
People
Page 100
License Compliance
CDL StatusValid No CDL Not Valid Unknown Total
Number Percent Number Percent Number Percent Number Percent Number Percent2015
Valid License for Class of Vehicle 3,381 99.3% 366 80.4% 18 27.7% 3 3.2% 3,768 93.8%Not Licensed 0 0.0% 13 2.9% 0 0.0% 0 0.0% 13 0.3%No License Required for Class of Vehicle 2 0.1% 0 0.0% 0 0.0% 0 0.0% 2 *No Valid License for Class of Vehicle 11 0.3% 69 15.2% 47 72.3% 0 0.0% 127 3.2%Unknown if Required for Class of Vehicle 5 0.1% 6 1.3% 0 0.0% 0 0.0% 11 0.3%Unknown 5 0.1% 1 0.2% 0 0.0% 92 96.8% 98 2.4%Total 3,404 100.0% 455 100.0% 65 100.0% 95 100.0% 4,019 100.0%
2016Valid License for Class of Vehicle 3,401 99.4% 499 84.0% 21 27.6% 1 1.0% 3,922 93.5%Not Licensed 0 0.0% 16 2.7% 0 0.0% 0 0.0% 16 0.4%No License Required for Class of Vehicle 0 0.0% 0 0.0% 0 0.0% 0 0.0% 0 0.0%No Valid License for Class of Vehicle 8 0.2% 70 11.8% 53 69.7% 1 1.0% 132 3.1%Unknown if Required for Class of Vehicle 12 0.4% 8 1.3% 1 1.3% 0 0.0% 21 0.5%Unknown 2 0.1% 1 0.2% 1 1.3% 98 98.0% 102 2.4%Total 3,423 100.0% 594 100.0% 76 100.0% 100 100.0% 4,193 100.0%
2017Valid License for Class of Vehicle 3,572 99.1% 647 82.1% 23 27.4% 4 3.2% 4,246 92.3%Not Licensed 0 0.0% 31 3.9% 0 0.0% 0 0.0% 31 0.7%No License Required for Class of Vehicle 1 0.0% 2 0.3% 0 0.0% 0 0.0% 3 0.1%No Valid License for Class of Vehicle 17 0.5% 99 12.6% 61 72.6% 1 0.8% 178 3.9%Unknown if Required for Class of Vehicle 10 0.3% 9 1.1% 0 0.0% 0 0.0% 19 0.4%Unknown 3 0.1% 0 0.0% 0 0.0% 120 96.0% 123 2.7%Total 3,603 100.0% 788 100.0% 84 100.0% 125 100.0% 4,600 100.0%
People Table 25. Large Truck Drivers in Fatal Crashes by License Compliance and Commercial Drivers License (CDL) Status, 2015-2017
*Less than 0.05 percent.Notes: A large truck is defined as a truck with a gross vehicle weight rating (GVWR) greater than 10,000 pounds. The CDL status category of “Not Valid” includes “Expired,” “Suspended,” “Disqualified,” “Cancelled or Denied,” “Revoked,” and “Other Not Valid.” Source: National Highway Traffic Safety Administration, Fatality Analysis Reporting System (FARS).
Injury SeverityInjury Crashes
Large Trucks Involved in Injury Crashes
Persons Injured in Large Truck Crashes
Number Percent Number Percent Number PercentSuspected Serious Injury 13,000 12.3% 13,000 12.1% 15,000 10.0%Suspected Minor Injury 34,000 33.2% 36,000 33.5% 48,000 32.8%Possible Injury 55,000 53.9% 57,000 53.7% 84,000 56.7%Injured, Severity Unknown 1,000 0.7% 1,000 0.6% 1,000 0.6%Total 102,000 100.0% 107,000 100.0% 148,000 100.0%
People Table 26. Large Truck Injury Crash Data by Injury Severity, 2017
Notes: “Persons Injured” includes all nonfatally injured persons in injury and fatal crashes. A large truck is defined as a truck with a gross vehicle weight rating (GVWR) greater than 10,000 pounds. Individual numbers may not add up to the totals due to independent rounding. Percentages are based on unrounded numbers.Source: National Highway Traffic Safety Administration, Crash Report Sampling System (CRSS).
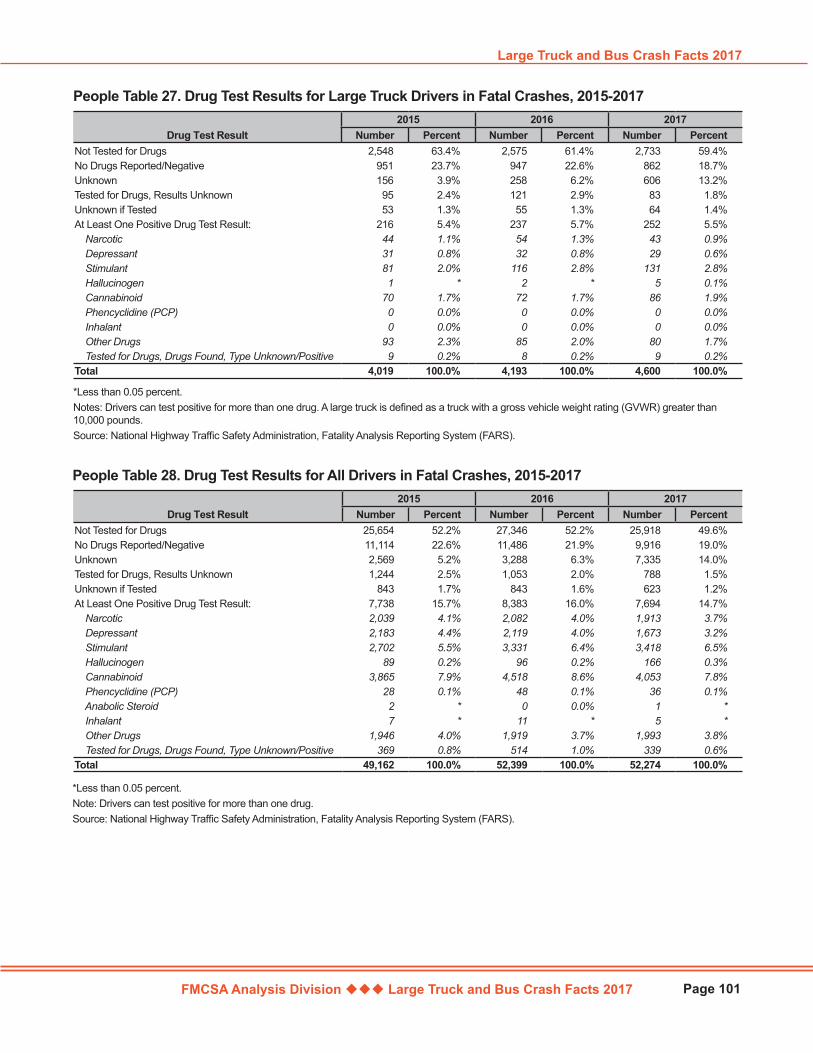
FMCSA Analysis Division Large Truck and Bus Crash Facts 2017
Large Truck and Bus Crash Facts 2017
Page 101
Drug Test Result2015 2016 2017
Number Percent Number Percent Number PercentNot Tested for Drugs 25,654 52.2% 27,346 52.2% 25,918 49.6%No Drugs Reported/Negative 11,114 22.6% 11,486 21.9% 9,916 19.0%Unknown 2,569 5.2% 3,288 6.3% 7,335 14.0%Tested for Drugs, Results Unknown 1,244 2.5% 1,053 2.0% 788 1.5%Unknown if Tested 843 1.7% 843 1.6% 623 1.2%At Least One Positive Drug Test Result: 7,738 15.7% 8,383 16.0% 7,694 14.7% Narcotic 2,039 4.1% 2,082 4.0% 1,913 3.7% Depressant 2,183 4.4% 2,119 4.0% 1,673 3.2% Stimulant 2,702 5.5% 3,331 6.4% 3,418 6.5% Hallucinogen 89 0.2% 96 0.2% 166 0.3% Cannabinoid 3,865 7.9% 4,518 8.6% 4,053 7.8% Phencyclidine (PCP) 28 0.1% 48 0.1% 36 0.1% Anabolic Steroid 2 * 0 0.0% 1 * Inhalant 7 * 11 * 5 * Other Drugs 1,946 4.0% 1,919 3.7% 1,993 3.8% Tested for Drugs, Drugs Found, Type Unknown/Positive 369 0.8% 514 1.0% 339 0.6%Total 49,162 100.0% 52,399 100.0% 52,274 100.0%
Drug Test Result2015 2016 2017
Number Percent Number Percent Number PercentNot Tested for Drugs 2,548 63.4% 2,575 61.4% 2,733 59.4%No Drugs Reported/Negative 951 23.7% 947 22.6% 862 18.7%Unknown 156 3.9% 258 6.2% 606 13.2%Tested for Drugs, Results Unknown 95 2.4% 121 2.9% 83 1.8%Unknown if Tested 53 1.3% 55 1.3% 64 1.4%At Least One Positive Drug Test Result: 216 5.4% 237 5.7% 252 5.5% Narcotic 44 1.1% 54 1.3% 43 0.9% Depressant 31 0.8% 32 0.8% 29 0.6% Stimulant 81 2.0% 116 2.8% 131 2.8% Hallucinogen 1 * 2 * 5 0.1% Cannabinoid 70 1.7% 72 1.7% 86 1.9% Phencyclidine (PCP) 0 0.0% 0 0.0% 0 0.0% Inhalant 0 0.0% 0 0.0% 0 0.0% Other Drugs 93 2.3% 85 2.0% 80 1.7% Tested for Drugs, Drugs Found, Type Unknown/Positive 9 0.2% 8 0.2% 9 0.2%Total 4,019 100.0% 4,193 100.0% 4,600 100.0%
People Table 27. Drug Test Results for Large Truck Drivers in Fatal Crashes, 2015-2017
*Less than 0.05 percent.Notes: Drivers can test positive for more than one drug. A large truck is defined as a truck with a gross vehicle weight rating (GVWR) greater than 10,000 pounds.Source: National Highway Traffic Safety Administration, Fatality Analysis Reporting System (FARS).
People Table 28. Drug Test Results for All Drivers in Fatal Crashes, 2015-2017
*Less than 0.05 percent.Note: Drivers can test positive for more than one drug.Source: National Highway Traffic Safety Administration, Fatality Analysis Reporting System (FARS).
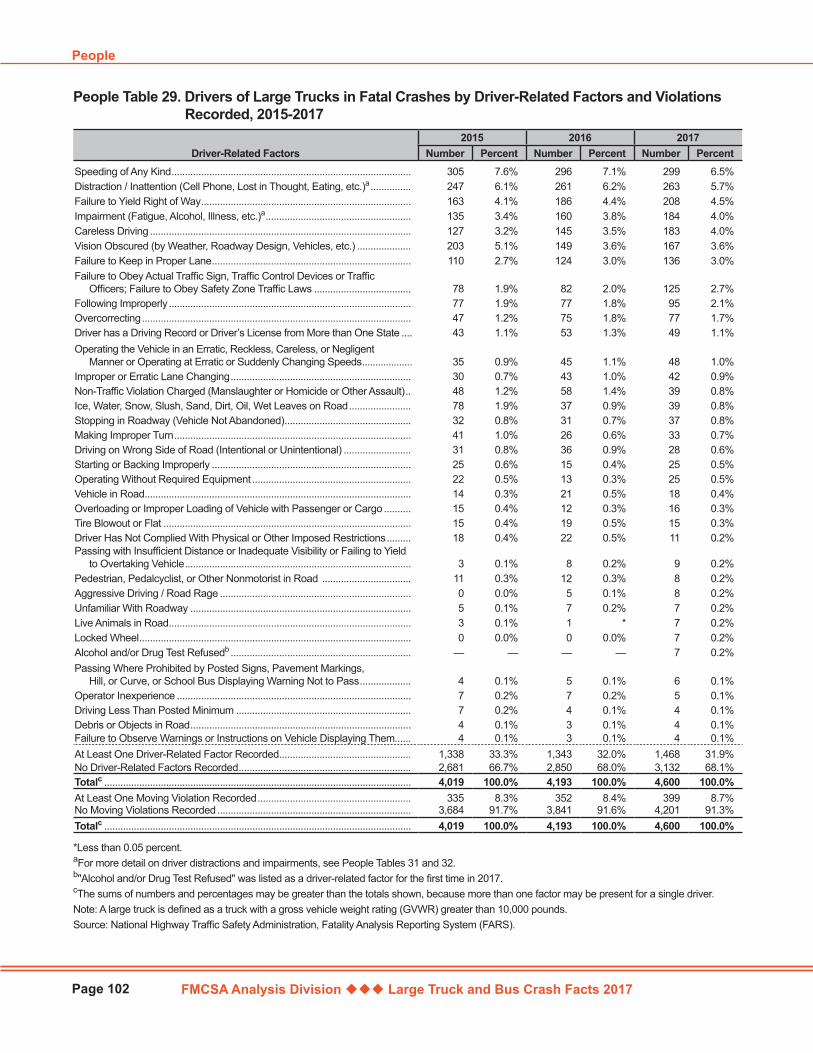
FMCSA Analysis Division Large Truck and Bus Crash Facts 2017
People
Page 102
Driver-Related Factors2015 2016 2017
Number Percent Number Percent Number PercentSpeeding of Any Kind ......................................................................................... 305 7.6% 296 7.1% 299 6.5%Distraction / Inattention (Cell Phone, Lost in Thought, Eating, etc.)a ............... 247 6.1% 261 6.2% 263 5.7%Failure to Yield Right of Way .............................................................................. 163 4.1% 186 4.4% 208 4.5%Impairment (Fatigue, Alcohol, Illness, etc.)a ...................................................... 135 3.4% 160 3.8% 184 4.0%Careless Driving ................................................................................................. 127 3.2% 145 3.5% 183 4.0%Vision Obscured (by Weather, Roadway Design, Vehicles, etc.) .................... 203 5.1% 149 3.6% 167 3.6%Failure to Keep in Proper Lane .......................................................................... 110 2.7% 124 3.0% 136 3.0%Failure to Obey Actual Traffic Sign, Traffic Control Devices or Traffic
Officers; Failure to Obey Safety Zone Traffic Laws .................................... 78 1.9% 82 2.0% 125 2.7%Following Improperly .......................................................................................... 77 1.9% 77 1.8% 95 2.1%Overcorrecting .................................................................................................... 47 1.2% 75 1.8% 77 1.7%Driver has a Driving Record or Driver’s License from More than One State .... 43 1.1% 53 1.3% 49 1.1%Operating the Vehicle in an Erratic, Reckless, Careless, or Negligent
Manner or Operating at Erratic or Suddenly Changing Speeds ................... 35 0.9% 45 1.1% 48 1.0%Improper or Erratic Lane Changing ................................................................... 30 0.7% 43 1.0% 42 0.9%Non-Traffic Violation Charged (Manslaughter or Homicide or Other Assault) .. 48 1.2% 58 1.4% 39 0.8%Ice, Water, Snow, Slush, Sand, Dirt, Oil, Wet Leaves on Road ....................... 78 1.9% 37 0.9% 39 0.8%Stopping in Roadway (Vehicle Not Abandoned) ............................................... 32 0.8% 31 0.7% 37 0.8%Making Improper Turn ........................................................................................ 41 1.0% 26 0.6% 33 0.7%Driving on Wrong Side of Road (Intentional or Unintentional) ......................... 31 0.8% 36 0.9% 28 0.6%Starting or Backing Improperly .......................................................................... 25 0.6% 15 0.4% 25 0.5%Operating Without Required Equipment ........................................................... 22 0.5% 13 0.3% 25 0.5%Vehicle in Road................................................................................................... 14 0.3% 21 0.5% 18 0.4%Overloading or Improper Loading of Vehicle with Passenger or Cargo .......... 15 0.4% 12 0.3% 16 0.3%Tire Blowout or Flat ............................................................................................ 15 0.4% 19 0.5% 15 0.3%Driver Has Not Complied With Physical or Other Imposed Restrictions ......... 18 0.4% 22 0.5% 11 0.2%Passing with Insufficient Distance or Inadequate Visibility or Failing to Yield
to Overtaking Vehicle .................................................................................... 3 0.1% 8 0.2% 9 0.2%Pedestrian, Pedalcyclist, or Other Nonmotorist in Road ................................. 11 0.3% 12 0.3% 8 0.2%Aggressive Driving / Road Rage ....................................................................... 0 0.0% 5 0.1% 8 0.2%Unfamiliar With Roadway .................................................................................. 5 0.1% 7 0.2% 7 0.2%Live Animals in Road .......................................................................................... 3 0.1% 1 * 7 0.2%Locked Wheel ..................................................................................................... 0 0.0% 0 0.0% 7 0.2%Alcohol and/or Drug Test Refusedb ................................................................... — — — — 7 0.2%Passing Where Prohibited by Posted Signs, Pavement Markings,
Hill, or Curve, or School Bus Displaying Warning Not to Pass ................... 4 0.1% 5 0.1% 6 0.1%Operator Inexperience ....................................................................................... 7 0.2% 7 0.2% 5 0.1%Driving Less Than Posted Minimum ................................................................. 7 0.2% 4 0.1% 4 0.1%Debris or Objects in Road .................................................................................. 4 0.1% 3 0.1% 4 0.1%Failure to Observe Warnings or Instructions on Vehicle Displaying Them...... 4 0.1% 3 0.1% 4 0.1%At Least One Driver-Related Factor Recorded ................................................. 1,338 33.3% 1,343 32.0% 1,468 31.9%No Driver-Related Factors Recorded ................................................................ 2,681 66.7% 2,850 68.0% 3,132 68.1%Totalc .................................................................................................................. 4,019 100.0% 4,193 100.0% 4,600 100.0%At Least One Moving Violation Recorded ......................................................... 335 8.3% 352 8.4% 399 8.7%No Moving Violations Recorded ........................................................................ 3,684 91.7% 3,841 91.6% 4,201 91.3%Totalc .................................................................................................................. 4,019 100.0% 4,193 100.0% 4,600 100.0%
People Table 29. Drivers of Large Trucks in Fatal Crashes by Driver-Related Factors and Violations Recorded, 2015-2017
*Less than 0.05 percent.aFor more detail on driver distractions and impairments, see People Tables 31 and 32.b"Alcohol and/or Drug Test Refused" was listed as a driver-related factor for the first time in 2017.cThe sums of numbers and percentages may be greater than the totals shown, because more than one factor may be present for a single driver.Note: A large truck is defined as a truck with a gross vehicle weight rating (GVWR) greater than 10,000 pounds.Source: National Highway Traffic Safety Administration, Fatality Analysis Reporting System (FARS).
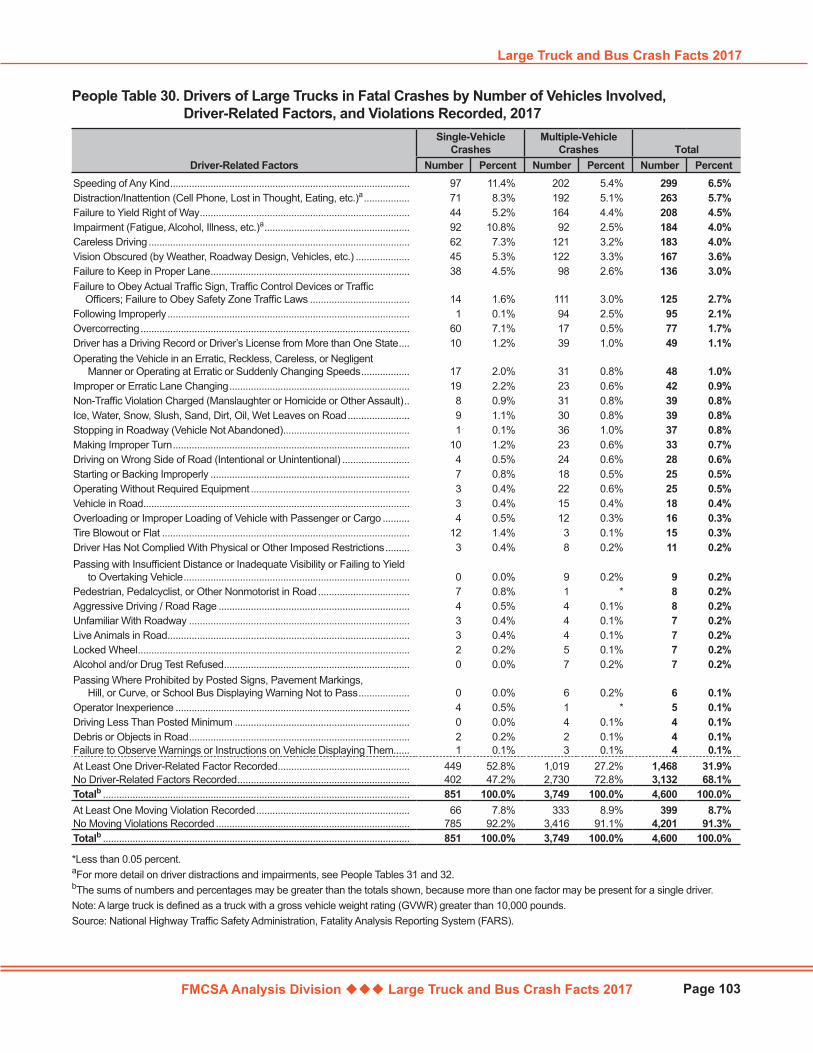
FMCSA Analysis Division Large Truck and Bus Crash Facts 2017
Large Truck and Bus Crash Facts 2017
Page 103
Driver-Related Factors
Single-Vehicle Crashes
Multiple-Vehicle Crashes Total
Number Percent Number Percent Number PercentSpeeding of Any Kind ......................................................................................... 97 11.4% 202 5.4% 299 6.5%Distraction/Inattention (Cell Phone, Lost in Thought, Eating, etc.)a ................. 71 8.3% 192 5.1% 263 5.7%Failure to Yield Right of Way .............................................................................. 44 5.2% 164 4.4% 208 4.5%Impairment (Fatigue, Alcohol, Illness, etc.)a ...................................................... 92 10.8% 92 2.5% 184 4.0%Careless Driving ................................................................................................. 62 7.3% 121 3.2% 183 4.0%Vision Obscured (by Weather, Roadway Design, Vehicles, etc.) .................... 45 5.3% 122 3.3% 167 3.6%Failure to Keep in Proper Lane .......................................................................... 38 4.5% 98 2.6% 136 3.0%Failure to Obey Actual Traffic Sign, Traffic Control Devices or Traffic
Officers; Failure to Obey Safety Zone Traffic Laws ..................................... 14 1.6% 111 3.0% 125 2.7%Following Improperly .......................................................................................... 1 0.1% 94 2.5% 95 2.1%Overcorrecting .................................................................................................... 60 7.1% 17 0.5% 77 1.7%Driver has a Driving Record or Driver’s License from More than One State .... 10 1.2% 39 1.0% 49 1.1%Operating the Vehicle in an Erratic, Reckless, Careless, or Negligent
Manner or Operating at Erratic or Suddenly Changing Speeds .................. 17 2.0% 31 0.8% 48 1.0%Improper or Erratic Lane Changing ................................................................... 19 2.2% 23 0.6% 42 0.9%Non-Traffic Violation Charged (Manslaughter or Homicide or Other Assault) .. 8 0.9% 31 0.8% 39 0.8%Ice, Water, Snow, Slush, Sand, Dirt, Oil, Wet Leaves on Road ....................... 9 1.1% 30 0.8% 39 0.8%Stopping in Roadway (Vehicle Not Abandoned) ............................................... 1 0.1% 36 1.0% 37 0.8%Making Improper Turn ........................................................................................ 10 1.2% 23 0.6% 33 0.7%Driving on Wrong Side of Road (Intentional or Unintentional) ......................... 4 0.5% 24 0.6% 28 0.6%Starting or Backing Improperly .......................................................................... 7 0.8% 18 0.5% 25 0.5%Operating Without Required Equipment ........................................................... 3 0.4% 22 0.6% 25 0.5%Vehicle in Road................................................................................................... 3 0.4% 15 0.4% 18 0.4%Overloading or Improper Loading of Vehicle with Passenger or Cargo .......... 4 0.5% 12 0.3% 16 0.3%Tire Blowout or Flat ............................................................................................ 12 1.4% 3 0.1% 15 0.3%Driver Has Not Complied With Physical or Other Imposed Restrictions ......... 3 0.4% 8 0.2% 11 0.2%Passing with Insufficient Distance or Inadequate Visibility or Failing to Yield
to Overtaking Vehicle .................................................................................... 0 0.0% 9 0.2% 9 0.2%Pedestrian, Pedalcyclist, or Other Nonmotorist in Road .................................. 7 0.8% 1 * 8 0.2%Aggressive Driving / Road Rage ....................................................................... 4 0.5% 4 0.1% 8 0.2%Unfamiliar With Roadway .................................................................................. 3 0.4% 4 0.1% 7 0.2%Live Animals in Road .......................................................................................... 3 0.4% 4 0.1% 7 0.2%Locked Wheel ..................................................................................................... 2 0.2% 5 0.1% 7 0.2%Alcohol and/or Drug Test Refused ..................................................................... 0 0.0% 7 0.2% 7 0.2%Passing Where Prohibited by Posted Signs, Pavement Markings,
Hill, or Curve, or School Bus Displaying Warning Not to Pass ................... 0 0.0% 6 0.2% 6 0.1%Operator Inexperience ....................................................................................... 4 0.5% 1 * 5 0.1%Driving Less Than Posted Minimum ................................................................. 0 0.0% 4 0.1% 4 0.1%Debris or Objects in Road .................................................................................. 2 0.2% 2 0.1% 4 0.1%Failure to Observe Warnings or Instructions on Vehicle Displaying Them...... 1 0.1% 3 0.1% 4 0.1%At Least One Driver-Related Factor Recorded ................................................. 449 52.8% 1,019 27.2% 1,468 31.9%No Driver-Related Factors Recorded ................................................................ 402 47.2% 2,730 72.8% 3,132 68.1%Totalb .................................................................................................................. 851 100.0% 3,749 100.0% 4,600 100.0%At Least One Moving Violation Recorded ......................................................... 66 7.8% 333 8.9% 399 8.7%No Moving Violations Recorded ........................................................................ 785 92.2% 3,416 91.1% 4,201 91.3%Totalb .................................................................................................................. 851 100.0% 3,749 100.0% 4,600 100.0%
People Table 30. Drivers of Large Trucks in Fatal Crashes by Number of Vehicles Involved, Driver-Related Factors, and Violations Recorded, 2017
*Less than 0.05 percent.aFor more detail on driver distractions and impairments, see People Tables 31 and 32.bThe sums of numbers and percentages may be greater than the totals shown, because more than one factor may be present for a single driver.Note: A large truck is defined as a truck with a gross vehicle weight rating (GVWR) greater than 10,000 pounds.Source: National Highway Traffic Safety Administration, Fatality Analysis Reporting System (FARS).
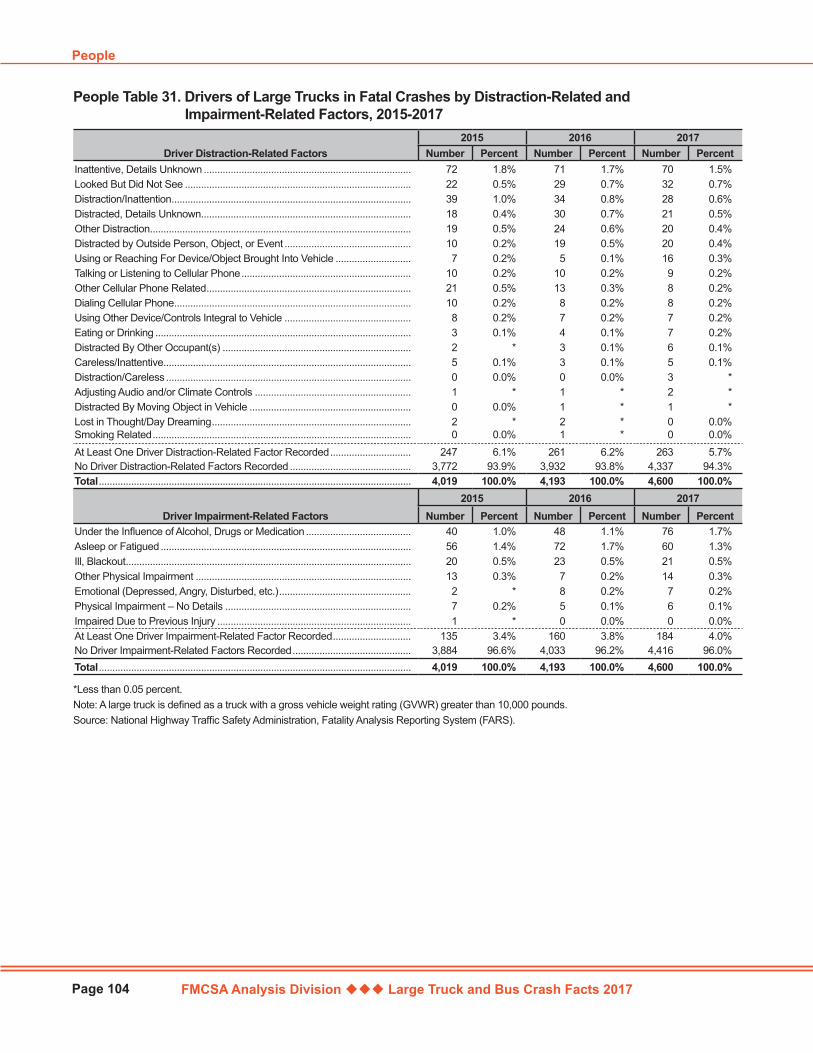
FMCSA Analysis Division Large Truck and Bus Crash Facts 2017
People
Page 104
Driver Distraction-Related Factors2015 2016 2017
Number Percent Number Percent Number PercentInattentive, Details Unknown ............................................................................. 72 1.8% 71 1.7% 70 1.5%Looked But Did Not See .................................................................................... 22 0.5% 29 0.7% 32 0.7%Distraction/Inattention ......................................................................................... 39 1.0% 34 0.8% 28 0.6%Distracted, Details Unknown.............................................................................. 18 0.4% 30 0.7% 21 0.5%Other Distraction ................................................................................................. 19 0.5% 24 0.6% 20 0.4%Distracted by Outside Person, Object, or Event ............................................... 10 0.2% 19 0.5% 20 0.4%Using or Reaching For Device/Object Brought Into Vehicle ............................ 7 0.2% 5 0.1% 16 0.3%Talking or Listening to Cellular Phone ............................................................... 10 0.2% 10 0.2% 9 0.2%Other Cellular Phone Related ............................................................................ 21 0.5% 13 0.3% 8 0.2%Dialing Cellular Phone ........................................................................................ 10 0.2% 8 0.2% 8 0.2%Using Other Device/Controls Integral to Vehicle ............................................... 8 0.2% 7 0.2% 7 0.2%Eating or Drinking ............................................................................................... 3 0.1% 4 0.1% 7 0.2%Distracted By Other Occupant(s) ...................................................................... 2 * 3 0.1% 6 0.1%Careless/Inattentive ............................................................................................ 5 0.1% 3 0.1% 5 0.1%Distraction/Careless ........................................................................................... 0 0.0% 0 0.0% 3 *Adjusting Audio and/or Climate Controls .......................................................... 1 * 1 * 2 *Distracted By Moving Object in Vehicle ............................................................ 0 0.0% 1 * 1 *Lost in Thought/Day Dreaming .......................................................................... 2 * 2 * 0 0.0%Smoking Related ................................................................................................ 0 0.0% 1 * 0 0.0%At Least One Driver Distraction-Related Factor Recorded .............................. 247 6.1% 261 6.2% 263 5.7%No Driver Distraction-Related Factors Recorded ............................................. 3,772 93.9% 3,932 93.8% 4,337 94.3%Total .................................................................................................................... 4,019 100.0% 4,193 100.0% 4,600 100.0%
Driver Impairment-Related Factors2015 2016 2017
Number Percent Number Percent Number PercentUnder the Influence of Alcohol, Drugs or Medication ....................................... 40 1.0% 48 1.1% 76 1.7%Asleep or Fatigued ............................................................................................. 56 1.4% 72 1.7% 60 1.3%Ill, Blackout .......................................................................................................... 20 0.5% 23 0.5% 21 0.5%Other Physical Impairment ................................................................................ 13 0.3% 7 0.2% 14 0.3%Emotional (Depressed, Angry, Disturbed, etc.) ................................................. 2 * 8 0.2% 7 0.2%Physical Impairment – No Details ..................................................................... 7 0.2% 5 0.1% 6 0.1%Impaired Due to Previous Injury ........................................................................ 1 * 0 0.0% 0 0.0%At Least One Driver Impairment-Related Factor Recorded ............................. 135 3.4% 160 3.8% 184 4.0%No Driver Impairment-Related Factors Recorded ............................................ 3,884 96.6% 4,033 96.2% 4,416 96.0%Total .................................................................................................................... 4,019 100.0% 4,193 100.0% 4,600 100.0%
People Table 31. Drivers of Large Trucks in Fatal Crashes by Distraction-Related and Impairment-Related Factors, 2015-2017
*Less than 0.05 percent.Note: A large truck is defined as a truck with a gross vehicle weight rating (GVWR) greater than 10,000 pounds.Source: National Highway Traffic Safety Administration, Fatality Analysis Reporting System (FARS).
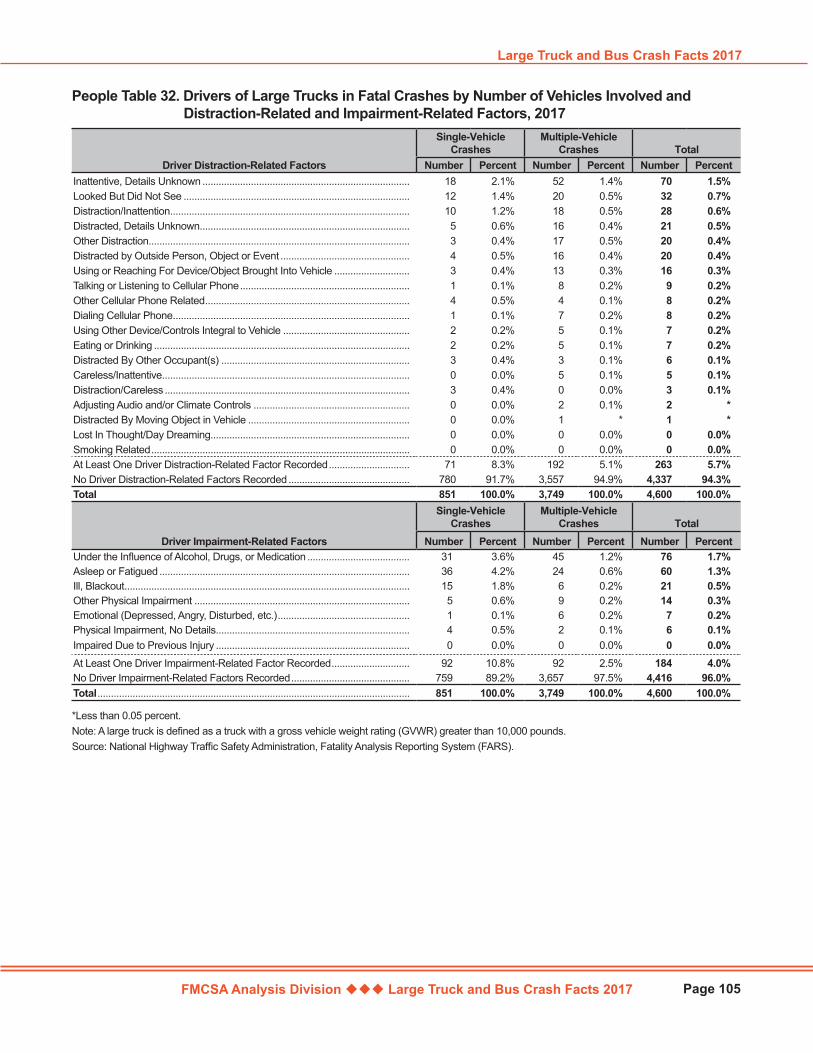
FMCSA Analysis Division Large Truck and Bus Crash Facts 2017
Large Truck and Bus Crash Facts 2017
Page 105
Driver Distraction-Related Factors
Single-Vehicle Crashes
Multiple-Vehicle Crashes Total
Number Percent Number Percent Number PercentInattentive, Details Unknown ............................................................................. 18 2.1% 52 1.4% 70 1.5%Looked But Did Not See .................................................................................... 12 1.4% 20 0.5% 32 0.7%Distraction/Inattention ......................................................................................... 10 1.2% 18 0.5% 28 0.6%Distracted, Details Unknown.............................................................................. 5 0.6% 16 0.4% 21 0.5%Other Distraction ................................................................................................. 3 0.4% 17 0.5% 20 0.4%Distracted by Outside Person, Object or Event ................................................ 4 0.5% 16 0.4% 20 0.4%Using or Reaching For Device/Object Brought Into Vehicle ............................ 3 0.4% 13 0.3% 16 0.3%Talking or Listening to Cellular Phone ............................................................... 1 0.1% 8 0.2% 9 0.2%Other Cellular Phone Related ............................................................................ 4 0.5% 4 0.1% 8 0.2%Dialing Cellular Phone ........................................................................................ 1 0.1% 7 0.2% 8 0.2%Using Other Device/Controls Integral to Vehicle ............................................... 2 0.2% 5 0.1% 7 0.2%Eating or Drinking ............................................................................................... 2 0.2% 5 0.1% 7 0.2%Distracted By Other Occupant(s) ...................................................................... 3 0.4% 3 0.1% 6 0.1%Careless/Inattentive ............................................................................................ 0 0.0% 5 0.1% 5 0.1%Distraction/Careless ........................................................................................... 3 0.4% 0 0.0% 3 0.1%Adjusting Audio and/or Climate Controls .......................................................... 0 0.0% 2 0.1% 2 *Distracted By Moving Object in Vehicle ............................................................ 0 0.0% 1 * 1 *Lost In Thought/Day Dreaming.......................................................................... 0 0.0% 0 0.0% 0 0.0%Smoking Related ................................................................................................ 0 0.0% 0 0.0% 0 0.0%At Least One Driver Distraction-Related Factor Recorded .............................. 71 8.3% 192 5.1% 263 5.7%No Driver Distraction-Related Factors Recorded ............................................. 780 91.7% 3,557 94.9% 4,337 94.3%Total 851 100.0% 3,749 100.0% 4,600 100.0%
Driver Impairment-Related Factors
Single-Vehicle Crashes
Multiple-Vehicle Crashes Total
Number Percent Number Percent Number PercentUnder the Influence of Alcohol, Drugs, or Medication ...................................... 31 3.6% 45 1.2% 76 1.7%Asleep or Fatigued ............................................................................................. 36 4.2% 24 0.6% 60 1.3%Ill, Blackout .......................................................................................................... 15 1.8% 6 0.2% 21 0.5%Other Physical Impairment ................................................................................ 5 0.6% 9 0.2% 14 0.3%Emotional (Depressed, Angry, Disturbed, etc.) ................................................. 1 0.1% 6 0.2% 7 0.2%Physical Impairment, No Details ........................................................................ 4 0.5% 2 0.1% 6 0.1%Impaired Due to Previous Injury ........................................................................ 0 0.0% 0 0.0% 0 0.0%At Least One Driver Impairment-Related Factor Recorded ............................. 92 10.8% 92 2.5% 184 4.0%No Driver Impairment-Related Factors Recorded ............................................ 759 89.2% 3,657 97.5% 4,416 96.0%Total .................................................................................................................... 851 100.0% 3,749 100.0% 4,600 100.0%
People Table 32. Drivers of Large Trucks in Fatal Crashes by Number of Vehicles Involved and Distraction-Related and Impairment-Related Factors, 2017
*Less than 0.05 percent.Note: A large truck is defined as a truck with a gross vehicle weight rating (GVWR) greater than 10,000 pounds.Source: National Highway Traffic Safety Administration, Fatality Analysis Reporting System (FARS).
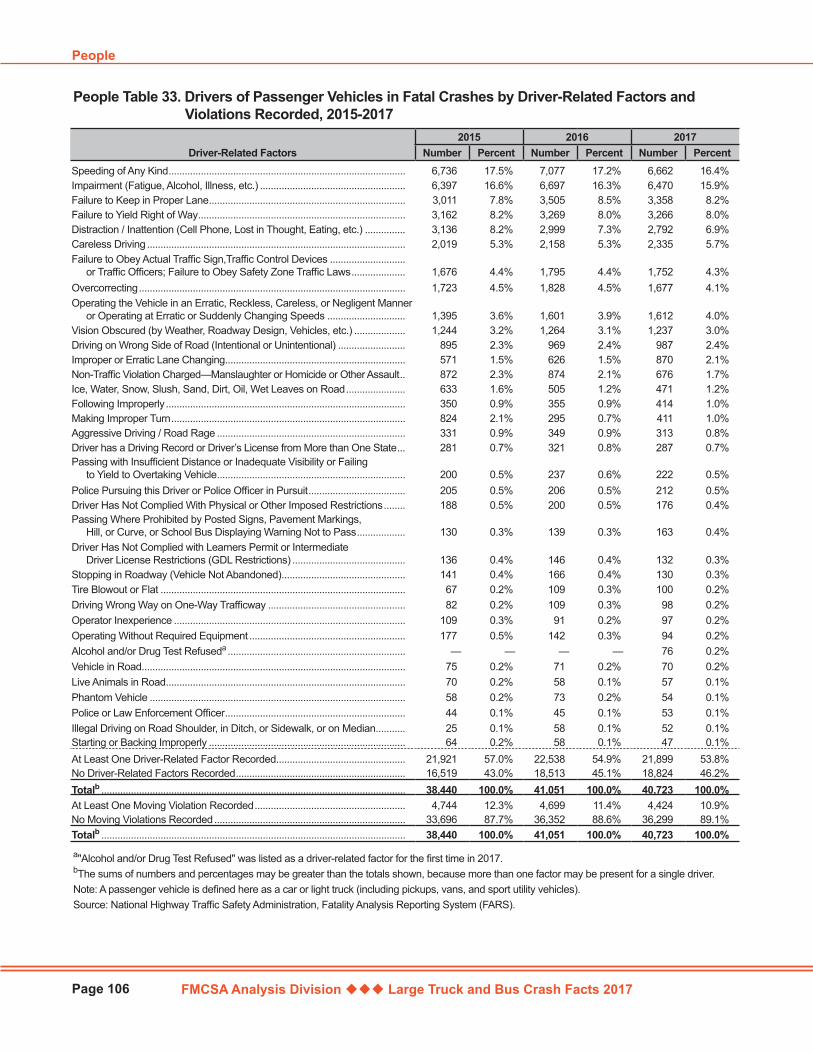
FMCSA Analysis Division Large Truck and Bus Crash Facts 2017
People
Page 106
Driver-Related Factors2015 2016 2017
Number Percent Number Percent Number PercentSpeeding of Any Kind ........................................................................................ 6,736 17.5% 7,077 17.2% 6,662 16.4%Impairment (Fatigue, Alcohol, Illness, etc.) ...................................................... 6,397 16.6% 6,697 16.3% 6,470 15.9%Failure to Keep in Proper Lane ......................................................................... 3,011 7.8% 3,505 8.5% 3,358 8.2%Failure to Yield Right of Way ............................................................................. 3,162 8.2% 3,269 8.0% 3,266 8.0%Distraction / Inattention (Cell Phone, Lost in Thought, Eating, etc.) ............... 3,136 8.2% 2,999 7.3% 2,792 6.9%Careless Driving ................................................................................................ 2,019 5.3% 2,158 5.3% 2,335 5.7%Failure to Obey Actual Traffic Sign,Traffic Control Devices ............................
or Traffic Officers; Failure to Obey Safety Zone Traffic Laws .................... 1,676 4.4% 1,795 4.4% 1,752 4.3%Overcorrecting ................................................................................................... 1,723 4.5% 1,828 4.5% 1,677 4.1%Operating the Vehicle in an Erratic, Reckless, Careless, or Negligent Manner
or Operating at Erratic or Suddenly Changing Speeds ............................. 1,395 3.6% 1,601 3.9% 1,612 4.0%Vision Obscured (by Weather, Roadway Design, Vehicles, etc.) ................... 1,244 3.2% 1,264 3.1% 1,237 3.0%Driving on Wrong Side of Road (Intentional or Unintentional) ......................... 895 2.3% 969 2.4% 987 2.4%Improper or Erratic Lane Changing ................................................................... 571 1.5% 626 1.5% 870 2.1%Non-Traffic Violation Charged—Manslaughter or Homicide or Other Assault .. 872 2.3% 874 2.1% 676 1.7%Ice, Water, Snow, Slush, Sand, Dirt, Oil, Wet Leaves on Road ...................... 633 1.6% 505 1.2% 471 1.2%Following Improperly ......................................................................................... 350 0.9% 355 0.9% 414 1.0%Making Improper Turn ....................................................................................... 824 2.1% 295 0.7% 411 1.0%Aggressive Driving / Road Rage ...................................................................... 331 0.9% 349 0.9% 313 0.8%Driver has a Driving Record or Driver’s License from More than One State ... 281 0.7% 321 0.8% 287 0.7%Passing with Insufficient Distance or Inadequate Visibility or Failing
to Yield to Overtaking Vehicle ...................................................................... 200 0.5% 237 0.6% 222 0.5%Police Pursuing this Driver or Police Officer in Pursuit .................................... 205 0.5% 206 0.5% 212 0.5%Driver Has Not Complied With Physical or Other Imposed Restrictions ........ 188 0.5% 200 0.5% 176 0.4%Passing Where Prohibited by Posted Signs, Pavement Markings,
Hill, or Curve, or School Bus Displaying Warning Not to Pass .................. 130 0.3% 139 0.3% 163 0.4%Driver Has Not Complied with Learners Permit or Intermediate
Driver License Restrictions (GDL Restrictions) .......................................... 136 0.4% 146 0.4% 132 0.3%Stopping in Roadway (Vehicle Not Abandoned) .............................................. 141 0.4% 166 0.4% 130 0.3%Tire Blowout or Flat ........................................................................................... 67 0.2% 109 0.3% 100 0.2%Driving Wrong Way on One-Way Trafficway ................................................... 82 0.2% 109 0.3% 98 0.2%Operator Inexperience ...................................................................................... 109 0.3% 91 0.2% 97 0.2%Operating Without Required Equipment .......................................................... 177 0.5% 142 0.3% 94 0.2%Alcohol and/or Drug Test Refuseda .................................................................. — — — — 76 0.2%Vehicle in Road.................................................................................................. 75 0.2% 71 0.2% 70 0.2%Live Animals in Road ......................................................................................... 70 0.2% 58 0.1% 57 0.1%Phantom Vehicle ............................................................................................... 58 0.2% 73 0.2% 54 0.1%Police or Law Enforcement Officer ................................................................... 44 0.1% 45 0.1% 53 0.1%Illegal Driving on Road Shoulder, in Ditch, or Sidewalk, or on Median ........... 25 0.1% 58 0.1% 52 0.1%Starting or Backing Improperly ......................................................................... 64 0.2% 58 0.1% 47 0.1%At Least One Driver-Related Factor Recorded ................................................ 21,921 57.0% 22,538 54.9% 21,899 53.8%No Driver-Related Factors Recorded ............................................................... 16,519 43.0% 18,513 45.1% 18,824 46.2%Totalb ................................................................................................................. 38,440 100.0% 41,051 100.0% 40,723 100.0%At Least One Moving Violation Recorded ........................................................ 4,744 12.3% 4,699 11.4% 4,424 10.9%No Moving Violations Recorded ....................................................................... 33,696 87.7% 36,352 88.6% 36,299 89.1%Totalb ................................................................................................................. 38,440 100.0% 41,051 100.0% 40,723 100.0%
People Table 33. Drivers of Passenger Vehicles in Fatal Crashes by Driver-Related Factors and Violations Recorded, 2015-2017
a"Alcohol and/or Drug Test Refused" was listed as a driver-related factor for the first time in 2017. bThe sums of numbers and percentages may be greater than the totals shown, because more than one factor may be present for a single driver.Note: A passenger vehicle is defined here as a car or light truck (including pickups, vans, and sport utility vehicles).Source: National Highway Traffic Safety Administration, Fatality Analysis Reporting System (FARS).
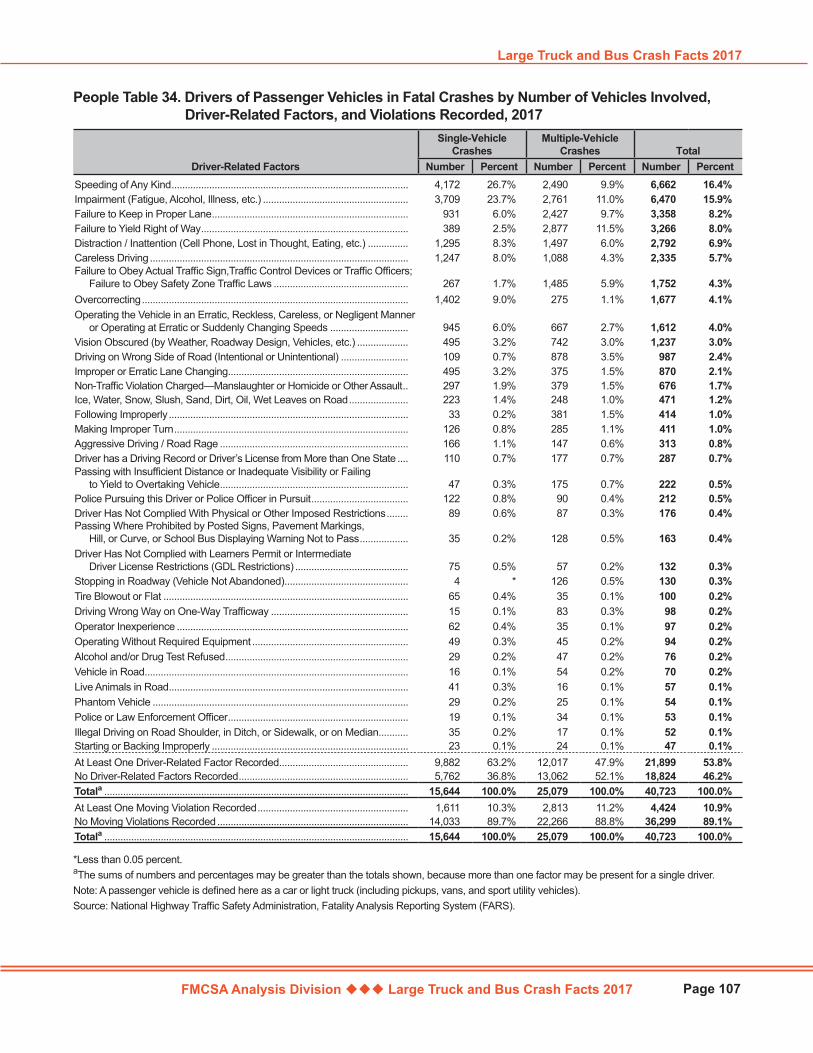
FMCSA Analysis Division Large Truck and Bus Crash Facts 2017
Large Truck and Bus Crash Facts 2017
Page 107
Driver-Related Factors
Single-Vehicle Crashes
Multiple-Vehicle Crashes Total
Number Percent Number Percent Number PercentSpeeding of Any Kind ........................................................................................ 4,172 26.7% 2,490 9.9% 6,662 16.4%Impairment (Fatigue, Alcohol, Illness, etc.) ...................................................... 3,709 23.7% 2,761 11.0% 6,470 15.9%Failure to Keep in Proper Lane ......................................................................... 931 6.0% 2,427 9.7% 3,358 8.2%Failure to Yield Right of Way ............................................................................. 389 2.5% 2,877 11.5% 3,266 8.0%Distraction / Inattention (Cell Phone, Lost in Thought, Eating, etc.) ............... 1,295 8.3% 1,497 6.0% 2,792 6.9%Careless Driving ................................................................................................ 1,247 8.0% 1,088 4.3% 2,335 5.7%Failure to Obey Actual Traffic Sign,Traffic Control Devices or Traffic Officers;
Failure to Obey Safety Zone Traffic Laws .................................................. 267 1.7% 1,485 5.9% 1,752 4.3%Overcorrecting ................................................................................................... 1,402 9.0% 275 1.1% 1,677 4.1%Operating the Vehicle in an Erratic, Reckless, Careless, or Negligent Manner
or Operating at Erratic or Suddenly Changing Speeds ............................. 945 6.0% 667 2.7% 1,612 4.0%Vision Obscured (by Weather, Roadway Design, Vehicles, etc.) ................... 495 3.2% 742 3.0% 1,237 3.0%Driving on Wrong Side of Road (Intentional or Unintentional) ......................... 109 0.7% 878 3.5% 987 2.4%Improper or Erratic Lane Changing ................................................................... 495 3.2% 375 1.5% 870 2.1%Non-Traffic Violation Charged—Manslaughter or Homicide or Other Assault .. 297 1.9% 379 1.5% 676 1.7%Ice, Water, Snow, Slush, Sand, Dirt, Oil, Wet Leaves on Road ...................... 223 1.4% 248 1.0% 471 1.2%Following Improperly ......................................................................................... 33 0.2% 381 1.5% 414 1.0%Making Improper Turn ....................................................................................... 126 0.8% 285 1.1% 411 1.0%Aggressive Driving / Road Rage ...................................................................... 166 1.1% 147 0.6% 313 0.8%Driver has a Driving Record or Driver’s License from More than One State .... 110 0.7% 177 0.7% 287 0.7%Passing with Insufficient Distance or Inadequate Visibility or Failing
to Yield to Overtaking Vehicle ...................................................................... 47 0.3% 175 0.7% 222 0.5%Police Pursuing this Driver or Police Officer in Pursuit .................................... 122 0.8% 90 0.4% 212 0.5%Driver Has Not Complied With Physical or Other Imposed Restrictions ........ 89 0.6% 87 0.3% 176 0.4%Passing Where Prohibited by Posted Signs, Pavement Markings,
Hill, or Curve, or School Bus Displaying Warning Not to Pass .................. 35 0.2% 128 0.5% 163 0.4%Driver Has Not Complied with Learners Permit or Intermediate
Driver License Restrictions (GDL Restrictions) .......................................... 75 0.5% 57 0.2% 132 0.3%Stopping in Roadway (Vehicle Not Abandoned) .............................................. 4 * 126 0.5% 130 0.3%Tire Blowout or Flat ........................................................................................... 65 0.4% 35 0.1% 100 0.2%Driving Wrong Way on One-Way Trafficway ................................................... 15 0.1% 83 0.3% 98 0.2%Operator Inexperience ...................................................................................... 62 0.4% 35 0.1% 97 0.2%Operating Without Required Equipment .......................................................... 49 0.3% 45 0.2% 94 0.2%Alcohol and/or Drug Test Refused .................................................................... 29 0.2% 47 0.2% 76 0.2%Vehicle in Road.................................................................................................. 16 0.1% 54 0.2% 70 0.2%Live Animals in Road ......................................................................................... 41 0.3% 16 0.1% 57 0.1%Phantom Vehicle ............................................................................................... 29 0.2% 25 0.1% 54 0.1%Police or Law Enforcement Officer ................................................................... 19 0.1% 34 0.1% 53 0.1%Illegal Driving on Road Shoulder, in Ditch, or Sidewalk, or on Median ........... 35 0.2% 17 0.1% 52 0.1%Starting or Backing Improperly ......................................................................... 23 0.1% 24 0.1% 47 0.1%At Least One Driver-Related Factor Recorded ................................................ 9,882 63.2% 12,017 47.9% 21,899 53.8%No Driver-Related Factors Recorded ............................................................... 5,762 36.8% 13,062 52.1% 18,824 46.2%Totala ................................................................................................................. 15,644 100.0% 25,079 100.0% 40,723 100.0%At Least One Moving Violation Recorded ........................................................ 1,611 10.3% 2,813 11.2% 4,424 10.9%No Moving Violations Recorded ....................................................................... 14,033 89.7% 22,266 88.8% 36,299 89.1%Totala ................................................................................................................. 15,644 100.0% 25,079 100.0% 40,723 100.0%
People Table 34. Drivers of Passenger Vehicles in Fatal Crashes by Number of Vehicles Involved, Driver-Related Factors, and Violations Recorded, 2017
*Less than 0.05 percent. aThe sums of numbers and percentages may be greater than the totals shown, because more than one factor may be present for a single driver.Note: A passenger vehicle is defined here as a car or light truck (including pickups, vans, and sport utility vehicles).Source: National Highway Traffic Safety Administration, Fatality Analysis Reporting System (FARS).

For more information, contact the Analysis Division at (202) 366-4869, or visit our Web sites at www.fmcsa.dot.gov and ai.fmcsa.dot.gov.
FMCSA-RRA-18-018May 2019