traffic environmental assessment studies for township … · traffic environmental assessment...
TRANSCRIPT

Traffic Environmental Assessment Studies for Township Re-development: Present Status and Future Prediction
Baby S.1, and Al-Sarawi M.A.1&2, 1Wataniya Environmental Services Co., Environmental Consultancy Department, Kuwait
2Kuwait University, Earth and Environmental Sciences Department, Kuwait Contact Email: [email protected]
Abstract—This paper presents the study aimed at the determining traffic impact for the ‘New Township Redevelopment Project’ in Kuwait, predicted growth of traffic, related consumption of fuel and pollutant emission scenario. Traffic counts were carried out at eight roadway locations during both the morning and the afternoon peak hours, repeated 3 times at each location. In addition, traffic flow was measured at five other roadway locations from 7:30 am to 2:30 pm, continuously. The volume counts included the three vehicle-size categories of small, medium, and heavy vehicles. Synchro computer model was applied for urban traffic network. Three traffic growth scenarios were examined for their impact on the network of roadways in ‘New Township Area’. These scenarios were each for a 3 year period in the future: Scenario 1 for 2010; Scenario 2 for 2013; and Scenario 3 for 2015 / 2016, assuming that the construction of the Petroleum Sector ‘New Township Redevelopment Project’ will be completed and fully occupied. The impact of future traffic (2015 / 2016) on the roadway network of New Township Area will be significant.
Keywords: Synchro-computer model, Trip Rate Model, Socio-Economic Traits, Level of Service (LOS), CO, NOX, VOC,
I. INTRODUCTION AND BACKGROUND INFORMATION The study for traffic impact for the Township Re-
development was carried as part of complete ‘Environmental Impact Studies’ involving physical-chemical, biological and socio-economical conditions. The purpose of the EA is to identify and consider the social, economic, and environmental (SEE) impacts of the proposed action. A comprehensive data collection and traffic modeling to assess traffic operations and develop improvements to reduce delays, congestion and to reduce pollution through information transfer to managements to take appropriate steps in time was the main motto of the study.
The New Township Redevelopment Project’s Master Plan provides the location and arrangement of various types of residential, commercial, and recreational land-uses of the redevelopment project. The existing 1610 housing units will be replaced with a total of approximately 3500 new housing units. The residential land-use is the largest element of the master plan and covers nearly 2.7 million square meters. In addition, an area of approximately 2.2 million square meters is allocated for future expansion. No information however is provided about the details of future plans for expansion. A
total of 675,000 square meters of land has also been allocated for office and business center land use development. An estimate of the number of employment in the petroleum sector linked to the new township was also given as approximately 5000 persons.
Using the traffic data, signal timings a Synchro-computer traffic model (DLZ, 2004) was developed for the existing situation in the study area. The purposes of this model were to characterize the existing peak hour traffic operations and to serve as a baseline for analysis of future traffic conditions.
II. OBJECTIVES The specific objectives of the study were:
1. Monitor traffic flow variables (Volume, mix) on the roadways in the vicinity of the redevelopment project.
2. Develop a “Base Year” profile of the Level of Service (LOS) of the roadway network of arterials and collectors.
3. Develop a traffic-generation model based on a survey of a sample of households in the study area.
4. Forecast future traffic flows and determine the LOS which will be provided by the network of roadways for the year 2020.
5. Identify the roadway network sections / locations in need of capacity expansion and / or strategies for alternative modes of transportation systems.
III. METHODOLOGY
A. Traffic Counts Traffic counts were carried out at eight roadway
locations during both the morning and the afternoon peak hours, repeated 3 times at each location. In addition, traffic flow was measured at five other roadway locations from 7:30 am to 2:30 pm, continuously. The volume counts included the three vehicle-size categories of small, medium, and heavy vehicles. This categorization of vehicles by size is necessary for both, the estimation of traffic air and noise pollution impacts as well as the analysis of the roadway LOS and capacity.
443
2010 International Conference on Biology, Environment and Chemistry IPCBEE vol.1 (2011) © (2011) IACSIT Press, Singapore

A summary of the traffic counts during the morning and afternoon peak hours at eight roadway locations is presented in Table 1. These locations were spread over the network of main roadways in Ahmadi, as shown in Figure 1. As the data in Table 1 shows that the volumes of traffic were heavy on Roadway 212 and Road 604 during both peak hours of the day. Traffic volumes were considerably heavier during the afternoon peak hours. Road 604 also experiences a large volume of heavy truck traffic.
The result of the 7-hour working day traffic counts is presented in Table 2. These counts were made at the four roundabouts adjacent to tank farms and near the existing shopping center. The data in table 2 shows that the traffic volumes on these roadway locations are high, even during the off-peak hours of the day. Also, given in table 2, are information on data of monitoring and the number of traffic lanes per direction for each roadway location.
TABLE 1: PETROLEUM SECTOR TOWNSHIP TRAFFIC SURVEY COUNTS
Figure 1: Petroleum Sector Township Traffic Count Locations
B. Measurements of Traffic Signal Cycle Length The timing and phasing of traffic signals affect the
capacity / LOS of both intersections and the connecting roadway sections. In addition, signal cycle length has an
impact on fuel consumption and on air pollution emissions. The length and the phasing (Green, Yellow, and Red) of traffic signal cycles are both needed as input to the Synchro Model for capacity, Level of Service (LOS), Fuel Consumption, and Air Pollution Emissions.
444

TABLE 2: PETROLEUM SECTOR TOWNSHIP WORKING-DAY TRAFFIC COUNTS
The result of the measurements of traffic signal cycles in
New Township Area is given in Table 3, which also provides information on signal location and phasing. In general, and as is the case for all traffic signals in Kuwait, the length of signal cycles vary between 2 to 3 minutes. Studies show that shorter cycle lengths are preferred because these minimize delays, fuel consumption, and accidents at intersections.
C. The Synchro Computer Model Synchro (DLZ. 2004; Shen and Lu 2003) is an
optimizing model for urban traffic network. Synchro is a software application for optimizing traffic signal timing and performing capacity analysis. The software optimize splits, offsets and cycle lengths for individual intersections, an arterial or a complete network. Synchro performs capacity analysis using both the ICU (Intersection Capacity Utilization) and HCM methods (Highway Capacity Manual).
Synchro developed the Intersection Capacity Utilization (ICU) methodology for analyzing intersection capacity. The Intersection Capacity Utilization (ICU) is more precise and less subject to manipulation and is intended to be used in planning applications such as future
roadway design and site impact studies. The Intersection Capacity Utilization (ICU) is designed to be used in conjunction with delay based methods such as synchro and the HCM to give an overall picture of intersections. Another benefit derived from the installation and operation of synchro is the ability to provide delay calculation as well as gas emissions and fuel consumption calculation, and these are some of the objectives of this research study.
• Synchro models streets and intersections as links and nodes. These links and nodes are created on the map window. In the map window, a line indicates a link and an intersection is indicated by a circle.
• The requirement for site specific data is minimized through the use of assumed value for most of the operating parameters and by a set of steps that will be reasonable and effective for operating Synchro.
• Cycle lengths that are too short do not provide adequate green time for all phases and result in cycle failures. Longer cycle lengths result in increased delay and queues for all users.
TABLE 3: STUDY AREA MEASUREMENTS OF TRAFFIC SIGNAL CYCLES LENGTH
Signal Signal .No LOCATION
DURATION (in Seconds) DESCRIPTION
Location RED GREEN YELLOW
2
2A On the Road # 212, before New Township Area Governorate building
65 70 3 Direction -East to West; 2Direction signal
2C On the Road # 212, before New Township Area Governorate building
65 70 3 Direction -West to East; 2Direction signal
445

2B On the Road # 212, before New Township Area Governorate building
120 10 3 Direction -South to North; one Direction signal
4
3 On the Road # 602, Near South Tank farm 60 60 3 4- Way , 2Direction signal,
To West and to North.
4 On the Road # 602, Near South Tank farm 70 75 3 4- Way , 2Direction signal,
To West and to South.
5 On the Road # 602, Near South Tank farm 100 20 3 4- Way , 2Direction signal,
To East and to South.
6A On the Road # 602, Near South Tank farm 110 10 3 4- Way , ONE Direction
signal, To East
6B On the Road # 602, Near South Tank farm 55 65 3 4- Way , ONE Direction
signal, To South
3
7 On the Road # 602, Near industrial area 80 30 3 3- Way , 2 Direction signal,
To North and to East
8 On the Road # 602, Near industrial area 80 30 3 3- Way , ONE Direction
signal, To to West
9 On the Road # 602, Near industrial area 85 20 3 3- Way , ONE Direction
signal, To to East
1
10 On the Road # 602, Near industrial area 70 25 3 4- Way , ONE Direction
signal, To to East
11 On the Road # 602, Near industrial area 120 10 3 4- Way , ONE Direction
signal, To to North
12 On the Road # 602, Near industrial area 45 15 3 4- Way , ONE Direction
signal, To to West
13 On the Road # 602, Near industrial area 80 20 3 4- Way , ONE Direction
signal, To to East
D. Analysis of Roadway Network The impact factor of traffic on the network of major and
minor arterial roadways is measured by a number of factors. The most important of these factors include the amount of vehicle-delay, average speed, fuel consumption, and CO, NOX, and VOC air pollution emitted by traffic on the roadway network. The Synchro Model was employed to develop these roadway performance measures for the network of roads in Study Area – both for the present time (Baseline), and in the future year, when the New Redevelopment Project is completed and fully occupied (Future Year).
The application of the Synchro Model requires: a) Data on the network: Length, number of traffic
lanes, location of signalized intersections and roundabouts.
b) Data on traffic signal cycle length and phasing. c) Volume of traffic on each roadway.
These data were collected by means of traffic volume counts and signal cycle / phasing measurements, as presented and discussed previously. Roadway lengths were taken off the scale-map of New Township Area and recorded along with the number of traffic lanes in each direction. These data were needed to construct the network of roadways for use by the Synchro Model.
E. Travel Survey In the absence of any data on travel behavior of
employees, a brief travel survey was conducted. The main aim of the survey was to determine daily trip rates and trip
characteristics of the households residing in housings in study area.
The survey was carried out via a structured questionnaire which was developed for travel survey. The questionnaire was distributed to over 200 employees who benefits from the township and work at petroleum sector nearby. A total of 169 completed questionnaires were processed for trip rate analysis. The socio-economic characteristics and the daily trip-making behavior of the sample employees are presented next.
F. Socio-Economic Traits The surveyed population’s characteristics in Table 6,
include nationality, gender, marital status, family size, family income, and family car ownership. The non-Kuwaitis constitute the majority of employed individuals (69.2%), and nearly 21% of the respondents were women; more than 66% of the surveyed population was married; only less than 10% were single; nearly 25% had a family size of 3 persons; and 23% had 5 or more persons in the family. Approximately, 1/3 had a monthly income of between KD 500 – KD 700; and almost 8% had an income of more than KD 2000 per month. Nearly 57% of the responding samples owned 2 cars, no-one was car-less and 5.6% owned 4 or more cars.
TABLE 6: SOCIO-ECONOMIC TRAITS OF THE RESPONDENTS
Variable Name Percentage Cumulative PercentageNationality:
Kuwaiti 30.8 30.8 Non-Kuwaiti 69.2 100.0
Gender: Men 79.2 79.2 Women 20.8 100.0
Marital Status: Married 66.3 66.3
446

Single 33.7 100.0 Family Size: 1 8.9 8.9 2 22.1 31.0 3 24.7 55.7 4 22.2 77.9 5 or More 23.1 100.0 Family Income: Less than 250 3.6 3.6 250 – 500 13.8 17.4 501 – 750 31.1 48.5 751 – 1000 21.6 70.1 1001 – 1500 9.6 79.7 1501 – 2000 12.5 92.2 More than 2000 7.8 100.0 Car Ownership: 1 27.4 27.4 2 56.6 84.0
3 10.4 94.4 4 or More 5.6 100.0
The surveyed samples’ work and residence locations,
family employment at Petroleum Sector, and the number of daily trips are presented in Table 7. Nearly 2/3 of the respondents live in Township locality; approximately 46% work at Petroleum Sector; nearly 22% work in other places (Not in Petroleum Sector), and the same percentage worked outside the area designated for redevelopment of township. The percentage of respondents who did not work was 10.7%. More than 59% of the surveyed population had one person employed at Petroleum Sector; another 32.5% had 2 family members working at Petroleum Sector, and more than 8% of the sample families had 3 persons employed at Petroleum Sector.
TABLE 7: WORK AND RESIDENCE LOCATION, EMPLOYMENT AND TRIP-MAKING TRAITS
Variable Name Percentage Cumulative Percentage Where do you live? At new township development area 64.6 64.6 Other 35.4 100.0 Where is your Work Location? Petroleum Sector 45.6 45.6 Not Petroleum Sector 21.9 67.5 Outside new township development area 21.8 89.3 Don’t Work 10.7 100.0 Family Employment at Petroleum Sector: 1 59.2 59.2 2 32.5 91.7 3 or more 8.3 100.0 * No. of Family Round Trips / Day: 1 9.5 9.5 2 29.6 39.1 3 18.3 57.4 4 11.8 69.2 5 7.1 76.3 6 12.4 88.8 7 or More 11.2 100.0 * 1 Round Trip = 2 Trips
G. Characteristics of Daily Travel The distribution of daily travel of the sample families in
table 7, shows that nearly 10% made one round trip (2 Trips) per day, and almost 30% made two round trips or four trips each day. More than 18% of the respondents made 6 trips daily for work and other family activities. Approximately 30% of the sample families made 10 or more trips per day to accomplish family work, school, shopping, recreational, and other daily work.
The trip data were also analyzed to determine the other characteristics of the daily family trips in Township Area. The results are presented in Table 8. Nearly 87% of the daily trips are made by cars, as is expected. Less than 12% are made by bus, and the remaining 3% are made by use of taxis, walking and perhaps biking.
TABLE 8: TRIP CHARACTERISTICS: MODE, PURPOSE, TIME AND DESTINATION
Variable Name Frequency PercentTrip Mode (All Daily Trips):
Car 144 86.8 Bus 19 11.5 Taxi / Walk / Other 3 1.7
First Trip: Work 134 84.3 School 13 8.2 Shopping - - Social / Recreational 12 7.5 Other - -
Start Time: 6 am or before 41 25.8 6 – 7 am 84 52.8 7 – 8 am 27 17.0 After 8 am 7 4.4
Destination: Petroleum Sector 78 49.1 In New Township Area 36 22.6 Outside New Township Area 45 28.3
In addition to the trip mode, trip purpose, trip time, and
trip destination are also important in travel analysis. The time of a trip, for example, will indicate the contribution of the trip to traffic congestion. As the data in Table 8 show,
447
almost 85% of the first trips of surveyed individuals were for the purpose of going to work, as is expected. School trips constituted another 13%, and the remaining trips were made for social and recreational purposes.
Almost 26% of the first family trips started before 6 am, and another 52.8%, had their start between 6 and 7 am. The remaining trips started between 7 and 8 am (17%), or after 8 am (4.4%). The largest percentage of daily trips which started before 7 am in the morning helps reduce the magnitude of traffic congestion, which usually begins after 7 am.
A further analysis of the data was aimed at the determination of the mean rates of pertinent socio-economic and trip variables. The results are given in Table 9. The data shows that on the average, a sample family has 2.1 employed members, 1.5 of which works at Petroleum Sector. An average sample family also owned 2 cars, had a family size of 3.3 persons, and an income of KD 980 per month. The average number of trips of a sample family was nearly 7.5 per day (3.7 round trips). The knowledge of the daily trip rate and the total number of families which will reside in Petroleum Sector’s New Township Redevelopment Project will provide for an estimate of the total daily trips generated by the residents of the new township.
TABLE 9 MEAN SOCIO-ECONOMIC AND TRIP RATES – NEW TOWNSHIP AREA
Variable Name Mean StandardDeviation
Family Employment 2.1 1.0 Petroleum Sector Employment 1.5 0.7 Daily Family Trips (Trips / Day) 7.4 2.1 Car Ownership (Cars / Family) 2.0 0.9 Family Size (Persons / Family) 3.3 1.4 Family income (KD / Month) 980 624
A more precise method to estimate the number of daily trips however would be to categorize the sample families by the number of employments. A trip rate will then be computed for each employment category. The rational for this is simple: the more the number of employed persons in a family, the more trips generated by the family.
H. Trip Rate Model As indicated above, the trip generation rate (Shen and
Lu 2003). of a given family will most likely demonstrate a positive association with the number of persons employed in the family. Another family-related factor which also affects the trip-making behavior of the family is nationality - all else being equal, a Kuwaiti family will, again, most likely make more daily trips than a non-Kuwait family (More social visits, etc.).
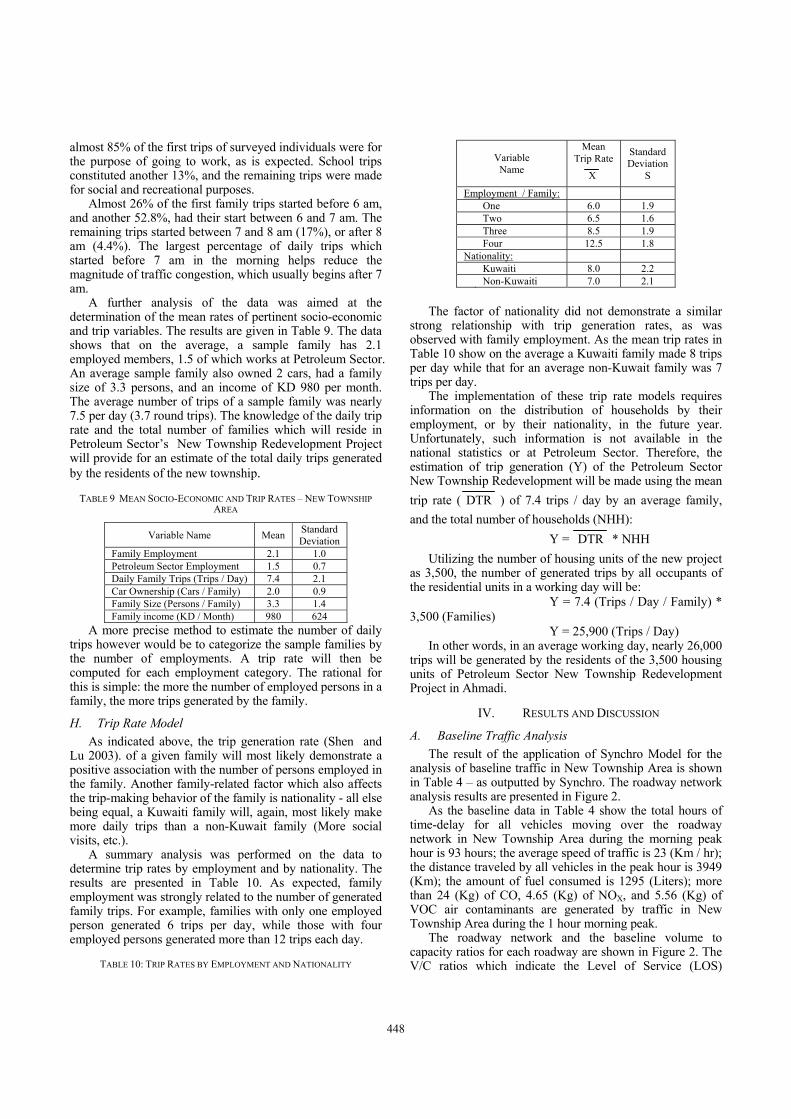
A summary analysis was performed on the data to determine trip rates by employment and by nationality. The results are presented in Table 10. As expected, family employment was strongly related to the number of generated family trips. For example, families with only one employed person generated 6 trips per day, while those with four employed persons generated more than 12 trips each day.
TABLE 10: TRIP RATES BY EMPLOYMENT AND NATIONALITY
Variable Name
Mean Trip Rate
X
StandardDeviation
S
Employment / Family: One 6.0 1.9 Two 6.5 1.6 Three 8.5 1.9 Four 12.5 1.8 Nationality: Kuwaiti 8.0 2.2 Non-Kuwaiti 7.0 2.1
The factor of nationality did not demonstrate a similar
strong relationship with trip generation rates, as was observed with family employment. As the mean trip rates in Table 10 show on the average a Kuwaiti family made 8 trips per day while that for an average non-Kuwait family was 7 trips per day.
The implementation of these trip rate models requires information on the distribution of households by their employment, or by their nationality, in the future year. Unfortunately, such information is not available in the national statistics or at Petroleum Sector. Therefore, the estimation of trip generation (Y) of the Petroleum Sector New Township Redevelopment will be made using the mean trip rate ( DTR ) of 7.4 trips / day by an average family, and the total number of households (NHH):
Y = DTR * NHH Utilizing the number of housing units of the new project
as 3,500, the number of generated trips by all occupants of the residential units in a working day will be: Y = 7.4 (Trips / Day / Family) * 3,500 (Families) Y = 25,900 (Trips / Day)
In other words, in an average working day, nearly 26,000 trips will be generated by the residents of the 3,500 housing units of Petroleum Sector New Township Redevelopment Project in Ahmadi.
IV. RESULTS AND DISCUSSION
A. Baseline Traffic Analysis The result of the application of Synchro Model for the
analysis of baseline traffic in New Township Area is shown in Table 4 – as outputted by Synchro. The roadway network analysis results are presented in Figure 2.
As the baseline data in Table 4 show the total hours of time-delay for all vehicles moving over the roadway network in New Township Area during the morning peak hour is 93 hours; the average speed of traffic is 23 (Km / hr); the distance traveled by all vehicles in the peak hour is 3949 (Km); the amount of fuel consumed is 1295 (Liters); more than 24 (Kg) of CO, 4.65 (Kg) of NOX, and 5.56 (Kg) of VOC air contaminants are generated by traffic in New Township Area during the 1 hour morning peak.
The roadway network and the baseline volume to capacity ratios for each roadway are shown in Figure 2. The V/C ratios which indicate the Level of Service (LOS)
448
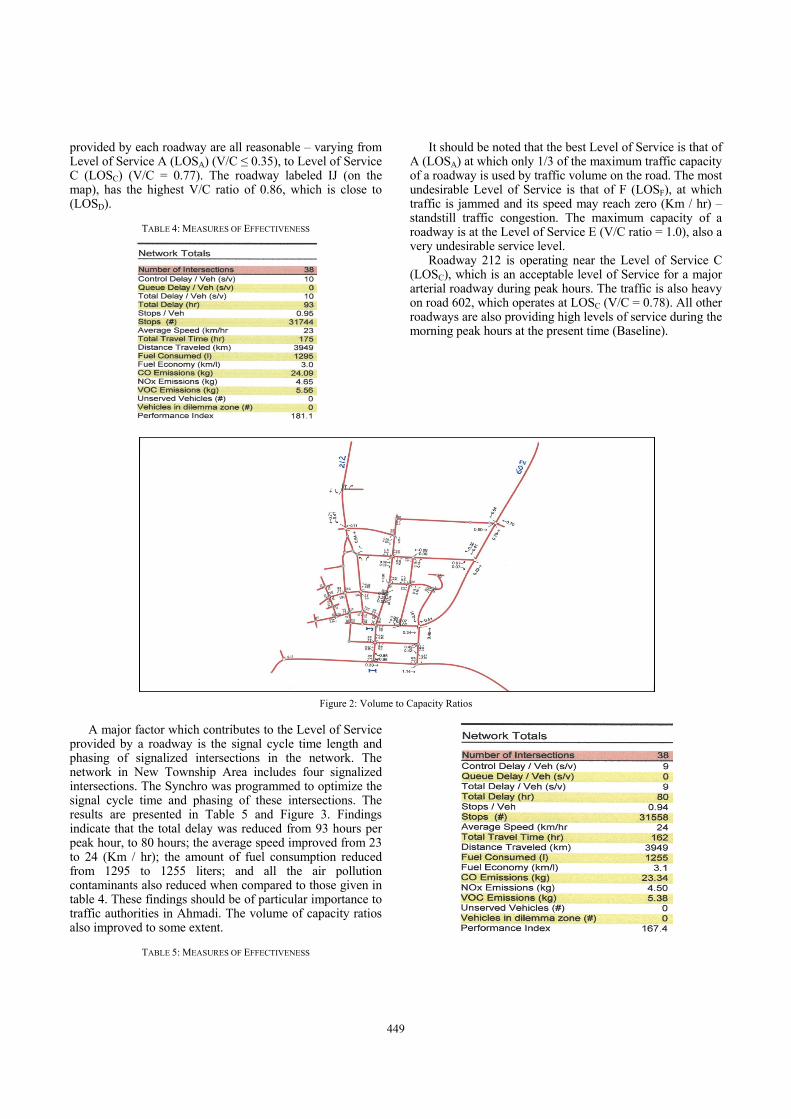
provided by each roadway are all reasonable – varying from Level of Service A (LOSA) (V/C ≤ 0.35), to Level of Service C (LOSC) (V/C = 0.77). The roadway labeled IJ (on the map), has the highest V/C ratio of 0.86, which is close to (LOSD).
TABLE 4: MEASURES OF EFFECTIVENESS
It should be noted that the best Level of Service is that of A (LOSA) at which only 1/3 of the maximum traffic capacity of a roadway is used by traffic volume on the road. The most undesirable Level of Service is that of F (LOSF), at which traffic is jammed and its speed may reach zero (Km / hr) – standstill traffic congestion. The maximum capacity of a roadway is at the Level of Service E (V/C ratio = 1.0), also a very undesirable service level.
Roadway 212 is operating near the Level of Service C (LOSC), which is an acceptable level of Service for a major arterial roadway during peak hours. The traffic is also heavy on road 602, which operates at LOSC (V/C = 0.78). All other roadways are also providing high levels of service during the morning peak hours at the present time (Baseline).
Figure 2: Volume to Capacity Ratios
A major factor which contributes to the Level of Service provided by a roadway is the signal cycle time length and phasing of signalized intersections in the network. The network in New Township Area includes four signalized intersections. The Synchro was programmed to optimize the signal cycle time and phasing of these intersections. The results are presented in Table 5 and Figure 3. Findings indicate that the total delay was reduced from 93 hours per peak hour, to 80 hours; the average speed improved from 23 to 24 (Km / hr); the amount of fuel consumption reduced from 1295 to 1255 liters; and all the air pollution contaminants also reduced when compared to those given in table 4. These findings should be of particular importance to traffic authorities in Ahmadi. The volume of capacity ratios also improved to some extent.
TABLE 5: MEASURES OF EFFECTIVENESS
449

Figure 3: Volume of Capacity Ratios
B. Peak-Hour Traffic Volume Analysis of the surveyed household travel data showed
that the percentage of daily trips which are generated during a typical morning peak hour (7:00 am – 8:00 am), varied from a low of 17% to high of 20 percent of daily trips. It is therefore safe to assume that 18 – 19 percent of daily trips will be generated between 7:00 am – 8:00 am, or between 7:30 – 8:30 am – the morning peak hour. This would result in approximately 4800 trips during each morning peak hour (26000 * 18.5% = 4810).
C. Future Traffic Impact Three traffic growth scenarios were examined for their
impact on the network of roadways in ‘New Township Area’. These scenarios were each for a 3 year period in the future: Scenario 1 for 2010; Scenario 2 for 2013; and Scenario 3 for 2015 / 2016, assuming that the construction of the Petroleum Sector New Township Redevelopment Project will be completed and fully occupied.
The choice of the three scenarios was due to the lack or unavailability of data on the socio-economic profiles of the future residents of the housing areas, and occupants of the commercial areas in the New Township Redevelopment Project. No data was available on the composition, income, car ownership of the future households, or on the distribution of residence / employment locations of the households. The growth scenarios assume a reasonable / realistic rate of approximately 3% per year for traffic growth including that of the Petroleum Sector
1) Scenario 1 – The Year 2010
The network of roadways in New Township Area was first modified to include the proposed extension of the new connection between the New Township and the main freeway (No. 40). A 10% increase in traffic volumes was considered for scenario 1. The result of Synchro Model application for the scenario is presented in Table 11, for road network performance, and in Figure 4, for volume to capacity ratio and service level.
The data in Table 11 shows that, when compared with the present condition (Table 4), the total vehicle delay during the morning peak traffic hour will increase from 93 hours to 112 hours; the average traffic speed will not change; the distance traveled will increase from 3949 (Km) to 5070 (Km); the fuel consumption will increase by: 1642 – 1295 = 347 (Liters); and the air pollution emissions will also increase.
TABLE 11: MEASURES OF EFFECTIVENESS
450

Figure 4: Volume to Capacity Ratios
The volume to capacity ratios (V/C) of the roadways will not change large enough to reduce the service level of the network. However, road IJ (marked on Figure 4) will almost operate at maximum capacity (V/C = 0.96), causing traffic congestion on surrounding roadways during the morning peak hours. Roadway 212 and 602 will both be operating between LOSC and LOSB in the morning peak hours. 2) Scenario 2 – The Year 2013
This scenario considers a 20% growth in traffic by the year 2013 over that of the present level (2007). The application of the Sychro Mode with the projected traffic growth on the roadway network of New Township Area resulted in the estimates of future network performance shown in Table 12, and Figure 5.
The results show that by 2013, the performance of roadway network will deteriorate due to the projected growth in traffic. A comparison of data in Table 12 with those of Table 4 (Baseline), indicates that the amount of delay during the morning peak hour will reach 130 hours; the distance traveled will increase to 5567 (Km); 1825 Liters of fuel will be consumed by peak-hour traffic, and all air
pollution emissions will also be significantly higher than the levels at the present time.
TABLE 12: MEASURES OF EFFECTIVENESS
Figure 5: Volume to Capacity Ratios
451

By 2013, and the consideration of 20% increase in traffic volumes, the roadway network of arterials and collector roadways will mostly be congested, at least during peak hours. The heaviest congestion will be on Road IJ and the surrounding roadways which will be operating at the failed level of service (LOSF = V/C > 1.0). Roadway 212 and 602 will also be providing services close to LOSD – heavy traffic during the morning peak hours. With heavy congestions on Road IJ and surrounding roadways / streets, the new proposed roadway will not be able to shift much traffic from Road 212. 3) Scenario 3 – The Year 2016
By the year 2016, the construction of the New Township Redevelopment Project has certainly been completed, and all new residential, commercial and other area land-use developments have also been fully occupied and operational. The projected growth of traffic volumes by the year 2016 is 30% over that of the present traffic (2007). No major shift in urban transportation policy (More emphasis on public transit, and much less favoring of auto travel), will occur between now and then, New Township Area will be experiencing very heavy traffic congestions during all peak hours of the day.
As a result of Synchro Model applications for the year 2016, growth scenario shows (Table 13) the amount of time-delay during one hour in the morning peak will increase by 243% over that experienced at the present time. The average traffic speed will be reduced to 15 (Km / hr) – a decrease of 35%. The amount of fuel consumed by vehicles during one hour of the morning peak traffic will increase to 2627 Liters – an increase of more than 100% of the consumption at the present time. The emission of CO air pollution will reach nearly 50 (Kg / hr); NOX will be nearly 10 (Kg / hr), and VOC emissions will exceed 11 (Kg / hr), during the peak traffic hours in the morning.
TABLE 13: MEASURES OF EFFECTIVENESS
The impact of future traffic (2015 / 2016) on the
roadway network of New Township Area will also be significant. As shown in Figure 6, the roadway IJ and its surrounding streets will experience stand-still traffic jams everyday during the peak hour. This roadway will experience a V/C = 1.20 – 20% more traffic than its maximum capacity. Roadway 212 and 602 will also be operating at their maximum capacities, V/C of 0.94, and 0.96, respectively. The most congested intersection (and of course its connecting streets), is that of intersection K (Marked on Figure 6). The roadway IK will have a V/C = 1.77, indicating practically a speed of less than the walking speed and mostly standing / waiting traffic situation during the peak hours of the day. The two proposed roadway extensions may however, carry a major portion of traffic when the level of congestion on other roads and streets worsens.
Figure 6: Volume to Capacity Ratios
452

A summary of the traffic impact for the present condition (Baseline) and the three future scenarios is presented in
Table 14.
TABLE 14: SUMMARY OF TRAFFIC IMPACT ANALYSIS
Present and Future Scenarios
Peak Hour Traffic and Air Pollution Impacts Roadway Total
Delay (Hr)
Avg. Speed
(Km / Hr)
Fuel Consumed (Liters)
CO (Kg)
NOX (Kg)
VOC (Kg) (V/C) LoS
Present Road 212 0.71 B-C Road 602 0.78 C 93 23 1295 24.1 4.7 5.6 Road IJ 0.86 C-D
Scenario 1 Road 212 0.78 C Road 602 0.86 C-D 112 23 1642 30.6 5.9 7.0 Road IJ 0.96 D-E
Scenario 2 Road 212 0.86 C-D Road 602 0.87 C-D 130 23 1825 33.9 6.6 7.8 Road IJ 1.07 E
Scenario 3 Road 212 0.94 D Road 602 0.96 D-E 319 15 2627 48.9 9.4 11.3 Road IJ 1.22 F Heavy Traffic Congestion during Daily Peak Hours
V. CONCLUSION AND RECOMMENDATIONS The studies show that by 2013, the performance of
roadway network will deteriorate due to the projected growth in traffic. By the year 2016, the construction of the New Township Redevelopment Project has certainly been completed, and all new residential, commercial and other area land-use developments have also been fully occupied and operational. The projected growth of traffic volumes by the year 2016 is 30% over that of the present traffic (2007). The impact of future traffic (2015 / 2016) on the roadway network of New Township Area will also be significant. Traffic impact for the present condition (Baseline) and the three future scenarios is presented in Table 14. The impact of future traffic (2015 / 2016) on the roadway network of New Township Area will also be significant. The amount of fuel consumed by vehicles during one hour of the morning peak traffic will increase to 2627 Liters – an increase of more than 100% of the consumption at the present time. The emission of CO air pollution will reach nearly 50 (Kg / hr); NOX will be nearly 10 (Kg / hr), and VOC emissions will exceed 11 (Kg / hr), during the peak traffic hours in the morning. Mitigation Measures
Four types of actions will need to be implemented in order to minimize the impact of future traffic growth on New Township Area roadway network and on the environment.
These include roadway and intersection capacity improvement, establishment of a minibus public transit system, establishment of a school bus system for the transport of children to schools, and a comprehensive program of public education and awareness concerning
excessive trip making and its adverse impact on health, safety, and the environment.
The capacity of a number of roadways / streets will need to be expanded between now and the next five years. Expansion priority should be given to the roadways marked IJ, IK, IL and LK. Roadway 602 will also need expansion in its capacity. This roadway is used by a large volume of heavy truck traffic. The proposed roadway linking New Township Area to the main freeway (No. 40) should also be constructed. This road will take the traffic pressure off Road No. 212 in the future.
Numerous cases and studies have shown that expanding roadway capacity and construction of new roads will certainly fail to reduce traffic congestion, if not accomplished by shifting travel demand away from the private auto to public transit systems. In fact, it is an accepted fact by transport specialists in North America and Europe, that building and expanding roadways alone, will not improve, but worsen the traffic congestion in the long-run. The establishment of a minibus public transit system in New Township Area is a must, if extensive traffic congestion is to be avoided in the near future. Petroleum Sector should establish a free minibus system for the transport of its employees.
The transport of children to school is a major contributory factor to daily traffic congestion in Kuwait urban areas at the present time. It is recommended that a school minibus system should be established to transport children to schools. This is the way children in all North American and European cities are transported to schools.
Finally, the establishment of comprehensive, coordinated, and continuous program of public education and awareness is also a must for the improvement of daily congestion. The public will need to be educated and become aware of the
453

adverse and significant impacts of daily congestion on safety, health, energy, and on the environment.
ACKNOWLEDGEMENT The authors are grateful to ‘Late Prof (Dr.) Koshki’,
from ‘Civil Engineering Department, Kuwait University’ for his major role as advisor and contribution in traffic modeling. This paper is dedicated in memory and esteem homage to him.
REFERENCES [1] DLZ. 2004. I-75 Gaylord East-West Crossing Study Report. DLZ
Michigan, Inc., Midwestern Consulting, LLC. Pp 102. [2] Shen W. and Lu H. 2003. A Destination-Based Model of Induced
Traffic Distribution for Traffic Impact Assessment. Proceedings of the Eastern Asia Society for Transportation Studies, Vol.4.
454