traffic stats - custom area analysis - tomtom … · custom area analysis provides highly granular...
TRANSCRIPT
© 2015 TomTom. All rights reserved. 2015.05.I.CAA.EN
WWW.TOMTOM.COM/GEOSPATIAL
MAPS & CONTENT
REAL TIME & HISTORICAL TRAFFIC
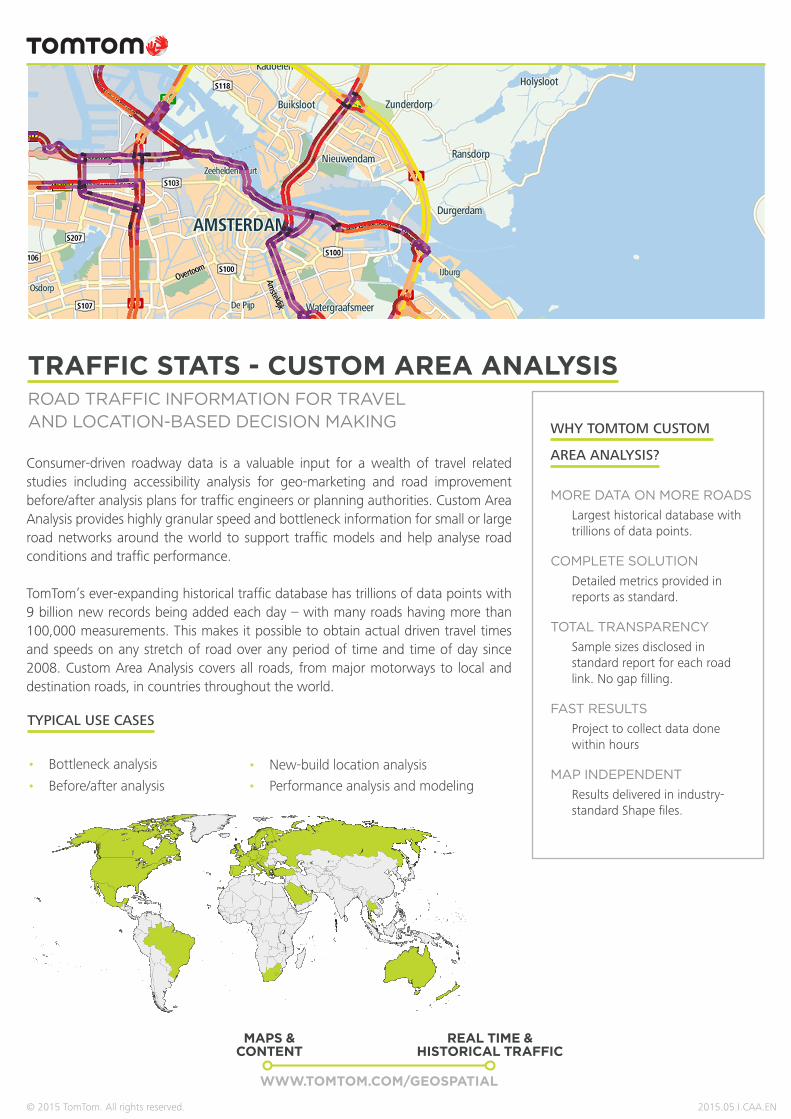
Consumer-driven roadway data is a valuable input for a wealth of travel related studies including accessibility analysis for geo-marketing and road improvement before/after analysis plans for traffic engineers or planning authorities. Custom Area Analysis provides highly granular speed and bottleneck information for small or large road networks around the world to support traffic models and help analyse road conditions and traffic performance.
TomTom’s ever-expanding historical traffic database has trillions of data points with 9 billion new records being added each day – with many roads having more than 100,000 measurements. This makes it possible to obtain actual driven travel times and speeds on any stretch of road over any period of time and time of day since 2008. Custom Area Analysis covers all roads, from major motorways to local and destination roads, in countries throughout the world.
WHY TOMTOM CUSTOM
AREA ANALYSIS?
MORE DATA ON MORE ROADS • Largest historical database with
trillions of data points.
COMPLETE SOLUTIONDetailed metrics provided in reports as standard.
TOTAL TRANSPARENCY Sample sizes disclosed in standard report for each road link. No gap filling.
FAST RESULTS Project to collect data done within hours
MAP INDEPENDENT Results delivered in industry-standard Shape files.
ROAD TRAFFIC INFORMATION FOR TRAVEL AND LOCATION-BASED DECISION MAKING
TRAFFIC STATS - CUSTOM AREA ANALYSIS
TYPICAL USE CASES
• Bottleneck analysis
• Before/after analysis
• New-build location analysis
• Performance analysis and modeling
© 2015 TomTom. All rights reserved. 2015.05.I.CAA.EN
WWW.TOMTOM.COM/GEOSPATIAL
MAPS & CONTENT
REAL TIME & HISTORICAL TRAFFIC
FEATURE BENEFIT
BROAD COVERAGE • Actual speed and travel time information available for highways and
secondary roads in many countries. See what is happing beyond the
measured network.
SIGNIFICANT
SAMPLE SIZE
• Most reliable data for confident decisions. Not bound to circumstances
of a single field study day.
DETAILED
GRANULARITY
• Road segments ranging from a few meters to several kilometers, at
any time of the day.
CLOUD BASED • Easy to access and run reports in three easy steps on any internet-
enabled PC.
USES EXISTING
DATABASE
• Retrospective reports can be run without additional equipment; no
equipment or field surveys needed.
HIGHLY
CUSTOMISED
• Choose if you want to take holidays or extreme situations such as
weather conditions into account.
API • For customers and partners who want to consume large volumes
of data.
2015.05.I.CAA.EN
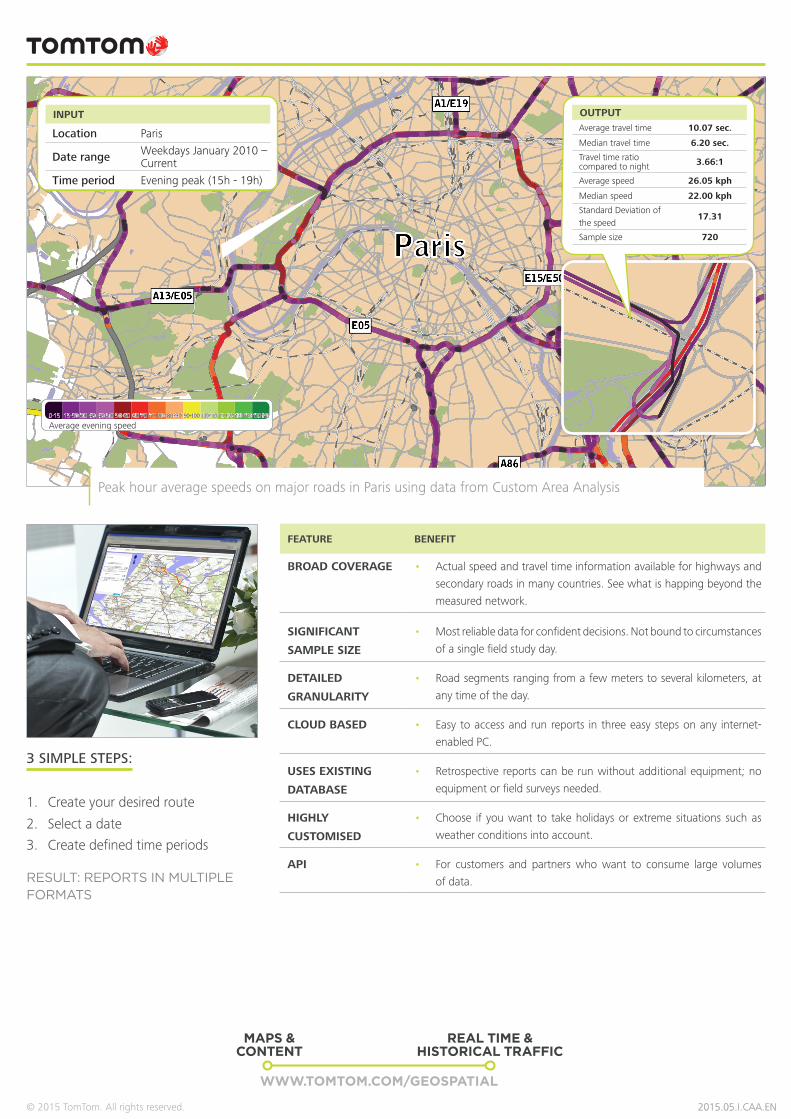
INPUT
Location Paris
Date range Weekdays January 2010 – Current
Time period Evening peak (15h - 19h)
0-150-15 15-3015-30 30-4030-40 40-5040-50 50-6050-60 60-7060-70 70-8070-80 80-9080-90 90-10090-100 100-110100-110 110-120110-120 120-130120-130 130-140130-140
Average evening speed
OUTPUTAverage travel time 10.07 sec.
Median travel time 6.20 sec.
Travel time ratio compared to night 3.66:1
Average speed 26.05 kph
Median speed 22.00 kph
Standard Deviation of the speed
17.31
Sample size 720
Peak hour average speeds on major roads in Paris using data from Custom Area Analysis
3 SIMPLE STEPS:
1. Create your desired route
2. Select a date
3. Create defined time periods
RESULT: REPORTS IN MULTIPLE FORMATS