traffic survey report -...
TRANSCRIPT

Paul Waite & Mike Barbour
26/10/2014
TRAFFIC SURVEY REPORT
– HARVINGTON PT1
(CREST HILL)
October 20-24th 2014
Conducted voluntarily by the residents of Harvington Village. This report has
been prepared in light of the planning application W14/01788/OU Crest Hill.
Traffic Survey Report Harvington (Part One) relates to the Crest Hill aspect of
the vehicular traffic survey. Some of data for Village Street (Part two) is used
for comparison however full breakdown figures shall be revealed in Village
Street (Part Two) following the anticipated planning application for 200
Dwellings south of Village Street.

26/10/2014
2
TRAFFIC SURVEY REPORT –
HARVINGTON PT1 (CREST HILL)
October 20-24th 2014
The manual traffic survey was conducted at two sites in Harvington Village from 20-24th October
2014. The traffic count sites were situated at the Harvington crossroads with B4088 (fig.1) and at
the Crest Hill Junction with Harvington Lane (fig.2).
Fig.1 Village Street Fig.2 Crest Hill
The Survey was conducted over the following time periods and dissected into 30 minute periods
as follows:
AM Count PM Count
0700-0730 1430-1500
0730-0800 1500-1530
0800-0830 1530-1600
0830-0900 1600-1630
0900-0930 1630-1700
0930-1000 1700-1730
1730-1800
1800-1830
The traffic count periods were carefully selected to ascertain the known peak timings of traffic
flow through the village.
Objective No.3 – To ascertain the
current village use of sustainable
transport.

26/10/2014
3
Objectives
The objectives of the survey were to determine the following:
1) The traffic flow through the village at peak times.
2) Village use of sustainable modes of transport.
3) Reliability of public transport.
4) The difference in vehicular traffic between school days and non-school days affecting
the village.
Traffic Flow Summary
The total vehicular count for the 5 day survey was 19,022 vehicle movements which break down
as follows:
Total Traffic Flow for the period 20-24th October 2014
Morning Count
Afternoon Count
Totals
Crest Hill
1653
1826
3479
Village Street
6120
9423
15543
19022
Crest Hill Peak Traffic Flow Times:
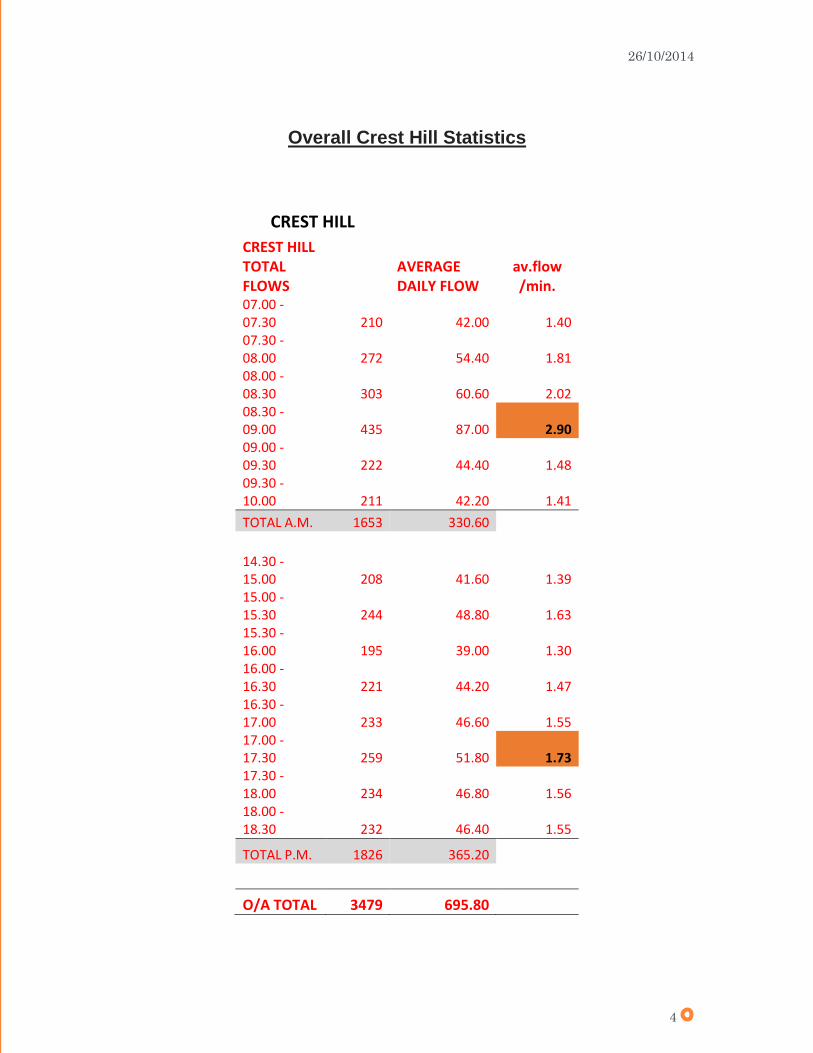
In the morning, peak flow in Crest Hill was between 8.30 and 9.00hrs. This is coincident with
school and pre-school timings. The total vehicular movements during this period were 435 which
equates to 2.9 vehicles per minute over the period.
In the evening, peak flow times on Crest Hill was between 1700-1730. Total movements of 259
equating to 1.73 vehicles per minute over the period.
26/10/2014
4
Overall Crest Hill Statistics
CREST HILL
CREST HILL TOTAL FLOWS
AVERAGE DAILY FLOW
av.flow /min.
07.00 - 07.30 210 42.00 1.40 07.30 - 08.00 272 54.40 1.81 08.00 - 08.30 303 60.60 2.02 08.30 - 09.00 435 87.00 2.90
09.00 - 09.30 222 44.40 1.48 09.30 - 10.00 211 42.20 1.41
TOTAL A.M. 1653 330.60
14.30 - 15.00 208 41.60 1.39 15.00 - 15.30 244 48.80 1.63 15.30 - 16.00 195 39.00 1.30 16.00 - 16.30 221 44.20 1.47 16.30 - 17.00 233 46.60 1.55 17.00 - 17.30 259 51.80 1.73
17.30 - 18.00 234 46.80 1.56 18.00 - 18.30 232 46.40 1.55
TOTAL P.M. 1826 365.20
O/A TOTAL 3479 695.80

26/10/2014
5
EXIT VILLAGE ENTER VILLAGE
OVERALL SITE TOTALS
CREST HILL TO NORTON
CREST HILL TO SALFORD P. EX NORTON
EX SALFORD PRIORS TOTALS
DAY 1 179 256 62 206 703
DAY2 199 254 54 199 706
DAY 3 187 276 70 195 728
DAY 4 180 267 48 236 731
DAY 5 159 220 42 190 611
TOTAL 904 1273 276 1026 3479
O/A VEHICLE TYPE DAY 1 DAY 2 DAY 3 DAY 4 DAY 5 TOTAL
PEDAL/MOTOR CYCLES 16 0 11 5 3 35
CARS /TAXIS incl. MINI BUS
533 603 596 588 466 2786
LGV 122 73 86 105 105 491
HGV 1 2 3 4 7 13 29
HGV 2 2 0 0 0 1 3
PSV 27 27 26 26 23 129
AGRIC. VEHICLE 1 0 5 0 0 6
TOTAL 703 706 728 731 611 3479
Observations Affecting Crest Hill Flow of Traffic.
> On Day 2, frequent morning precipitation occurred resulting in a spike of Car usage and drop in
Pedal/Motorcycle usage.
> Days 1-4, during the morning peak time, vehicular parking outside Harvington First School
stretched 200m either side of the school which incorporates a blind corner. Parked traffic
extended to within 150m of the junction with Crest Hill at the Coach & Horses Public House.
> There were over 4500 vehicle movements in and out of Village Street (from Crest Hill and
Harvington Cross) during the 5 days which compounds the traffic congestion at the school in
particular where between 35 (Friday) and 50 (Monday-Thursday) vehicles have been recorded
with up to 400 metres of parked cars.

26/10/2014
6
Photographs taken 0850hrs on Friday 20
th October 2014
> On Day 5, Prince Henry’s High School was already closed for half-term which resulted in a
reduction of vehicular traffic.
> On Day 5, Pedestrian footfall at Harvington First School increased significantly with less cars
parked in the vicinity of the school. Households with children in Harvington First AND Prince
Henry’s using vehicular transportation for drop-offs predominantly opted to walk.
Sustainable Transport
In light of promoting sustainable transport as part of the National Planning Policy Framework,
usage of public transport and cycles were counted and assessed.
Cycle movement around working pattern times and school times was deemed to be low with only
35 cycle movements counted at Crest Hill, most of which were motorcycles. This accounts for
less than 1% of the total traffic count.
There were 125 Public Service buses operated by Warwickshire Stagecoach Ltd. The number
28/28A route serves the Stratford Upon Avon to Evesham Town route. The timetable is restrictive
with a schedule that captures 11 hours per day and varies in frequency from every 30 minutes to
hourly.
As this is a Warwickshire Bus company service, savings on saver tickets are difficult to achieve
as Harvington is within the county of Worcestershire. This renders this use of transport as
expensive and in peak times, average use was less than 10 people.

26/10/2014
7
BUS TIMES DAY 1 DAY 2 DAY 3 DAY 4 DAY 5
EX STRATFORD
7.13 7.12 7.18 7.12 7.14 7.12
8.03 8.04 8.04 8.06 8.01 8.16
8.38 8.36 8.36 8.41 8.42 8.38
9.28 9.30 9.29 9.30 9.35 9.37
9.58 xx 9.58 xx xx xx
14.28 xx 14.36 14.28 14.28 14.32
14.58 14.59 15.00 14.56 15.01 15.07
15.28 15.31 15.30 15.32 15.38 15.32
16.08 16.15 16.11 16.14 16.22 16.06
16.38 16.43 16.39 16.43 16.51 16.33
17.08 17.10 17.06 17.06 17.12 17.27
17.38 17.43 17.38 17.42 17.41 17.43
18.08 18.17 18.06 18.09 18.15 18.31
Number of Buses 65
Number outside of Charter 28 43.07%
BUS TIMES DAY 1 DAY 2 DAY 3 DAY 4 DAY 5
EX EVESHAM
7.31 7.31 7.30 7.40 7.31 7.34
7.57 7.59 8.11 8.05 8.06 7.59
8.56 9.05 8.58 9.00 8.57 8.38
9.36 9.40 9.36 9.39 9.40 9.33
14.46 14.55 14.45 14.48 14.47 14.47
15.16 15.20 15.30 15.16 15.23 15.18
15.56 16.00 16.04 16.01 16.00 16.16
16.26 16.30 16.28 16.30 16.29 16.44
16.56 17.15 17.06 17.04 17.13 17.13
17.26 17.36 17.26 17.29 17.43 17.44
17.56 17.58 17.54 18.00 18.15 18.23
18.26 18.27 18.26 18.29 xx 18.31
Evesham Buses 60
Outside Charter 23 38.33%
Overall Figures Number of Buses
125
Number Outside of Charter 51 40.80%

26/10/2014
8
Stagecoach operate a charter that states that ”Our punctuality target is that 95% of scheduled
journeys will run no more than five minutes late or one minute early.”
For the assessed period, the punctuality target was 59.2%. The amount of buses that operated
outside of the charter was 51 of the 125 counted (40.8%) with 10% over 25minutes late or did not
appear at all.
Taking into consideration cost,
Worcestershire/Warwickshire border issues and
the punctuality, it is understandable why the
bus service was infrequently used or relied
upon.
Traffic Forecast In an attempt to comprehend the traffic impact
of planning application W/14/01788/OU and the outlined plan for 85 new dwellings on Crest Hill, a
similar new dwellings site was assessed.
Poppy Fields was originally advertised as an extension to Lavender Fields in Evesham,
constructed by Taylor Wimpey Homes. The site consisted of 1,2,3,4 bedroom houses (95 in total)
over a larger area than proposed for Crest Hill.
At 11pm on Monday 20th October, the traffic count of parked cars on the estate was 141. At 11am
on Tuesday 21st October, the traffic count of parked cars on the estate was 37. This would
indicate a conservative (and at worst case) traffic movement of 104 cars from the quiet period to
post morning rush hour. This does not take into consideration repeat journeys or drop-offs, nor
does it include PSV and LGV movements.
It is our estimate that 85 new dwellings on Crest Hill will generate an extra 25-35% vehicular
traffic during the periods similar to those assessed within this survey.
Summary The traffic survey at Crest Hill has highlighted that there are predictable movements of vehicular
traffic which are characteristic of a category 2 village with this demographic. Traffic patterns
indicate that cars are the overwhelming mode of transport. Motorcycles and cycles are somewhat
under-utilised. Public transport has punctuality issues and is also under-utilised.
Not mentioned within the report until now, speed of traffic on Crest Hill is a concern as vehicles
are perceived to be travelling at speeds in excess of the speed limit. Although no speed recording
equipment have been used for this survey, speed concerns are well documented within the
Parish Council minutes over the last 3-4 years and many checks have proved an issue exists.
This is a highway safety concern.
An extra 85 dwellings within the immediate vicinity of Crest Hill will have a negative impact on this
road in terms of Increased vehicular traffic, increased CO2 emissions, an increased risk to
highway safety, an increased congestion problem at school times on Village Street. The proposed
site is clearly not regarded as a sustainable location due to the lack of sustainable modes of
transport.
Punctuality of the bus service
against the passenger charter is
59.2%

26/10/2014
9
Appendices: A) Crest Hill Sample Page
B) Notes to Recorders
C) Guide to vehicle classifications

26/10/2014
10
Appendix A – Crest Hill Sample Page
DAY 1 EXIT VILLAGE ENTER VILLAGE Total
0700 -0730
CREST HILL TO NORTON
CREST HILL TO SALFORD P. EX NORTON
EX SALFORD PRIORS
PEDAL/MOTOR CYCLES 0 1 0 0 1
CARS /TAXIS incl. MINI BUS 11 26 1 2 40
LGV 1 3 0 0 4
HGV 1 0 0 0 0 0
HGV 2 0 0 0 0 0
PSV 1 0 1 0 2
AGRIC. VEHICLE 0 0 0 0 0
TOTAL 13 30 2 2 47
DAY 1 EXIT VILLAGE ENTER VILLAGE
0730-0800
CREST HILL TO NORTON
CREST HILL TO SALFORD P. EX NORTON
EX SALFORD PRIORS
PEDAL/MOTOR CYCLES 0 0 0 0 0
CARS /TAXIS incl. MINI BUS 11 22 3 3 39
LGV 2 2 1 0 5
HGV 1 0 0 0 0 0
HGV 2 0 1 0 0 1
PSV 0 0 1 0 1
AGRIC. VEHICLE 0 0
TOTAL 13 25 5 3 46

26/10/2014
11
DAY 1 EXIT VILLAGE ENTER VILLAGE
0800-0830
CREST HILL TO NORTON
CREST HILL TO SALFORD P. EX NORTON
EX SALFORD PRIORS
PEDAL/MOTOR CYCLES 0 0 0 0 0
CARS /TAXIS incl. MINI BUS 3 36 1 7 47
LGV 4 1 1 1 7
HGV 1 0 0 0 0 0
HGV 2 0 0 0 0 0
PSV 2 0 0 0 2
AGRIC. VEHICLE 1 0 0 0 1
TOTAL 10 37 2 8 57
DAY 1 EXIT VILLAGE ENTER VILLAGE
0830-0900
CREST HILL TO NORTON
CREST HILL TO SALFORD P. EX NORTON
EX SALFORD PRIORS
PEDAL/MOTOR CYCLES 0 1 2 0 3
CARS /TAXIS incl. MINI BUS 31 29 2 5 67
LGV 10 9 2 0 21
HGV 1 0 0 0 0 0
HGV 2 0 0 0 0 0
PSV 1 0 1 0 2
AGRIC. VEHICLE 0 0 0 0 0
TOTAL 42 39 7 5 93

26/10/2014
12
DAY 1 EXIT VILLAGE ENTER VILLAGE
0900-0930
CREST HILL TO NORTON
CREST HILL TO SALFORD P. EX NORTON
EX SALFORD PRIORS
PEDAL/MOTOR CYCLES 0 0 0 0 0
CARS /TAXIS incl. MINI BUS 6 18 2 10 36
LGV 2 0 1 1 4
HGV 1 0 0 0 0 0
HGV 2 0 0 0 0 0
PSV 0 0 0 0 0
AGRIC. VEHICLE 0 0 0 0 0
TOTAL 8 18 3 11 40
DAY 1 EXIT VILLAGE ENTER VILLAGE
0930-1000
CREST HILL TO NORTON
CREST HILL TO SALFORD P. EX NORTON
EX SALFORD PRIORS
PEDAL/MOTOR CYCLES 0 1 1 1 3
CARS /TAXIS incl. MINI BUS 12 11 4 5 32
LGV 0 1 0 2 3
HGV 1 0 0 0 0 0
HGV 2 0 0 0 0 0
PSV 1 0 1 0 2
AGRIC. VEHICLE 0 0 0 0 0
TOTAL 13 13 6 8 40
A.M. TOTALS 99 162 25 37 323

26/10/2014
13
Appendix B – Notes for Recorders
NOTES FOR RECORDERS
1. Please turn up at least 5 minutes before your allotted time so you can be updated by the previous Recorder.
2. Recording can be from your car if preferred, but please park well off the carriageway: Crest Hill Recorders should be based on the wide verge just below the entry to “Jack Straw”; X-roads Recorders should find space on the verge on the left just entering Leys Road.
3. Pencils, rubbers, record sheets and clipboards will be provided, you will need to be dressed suitably for the weather and also carry a watch or other means of telling the time accurately.
4. All entries should be made clearly in pencil
5. Enter date and start time on every sheet used
6. Use a fresh sheet for each ½ hour period –if there is no space left for entries during a busy period start a new sheet and always add date and time again
7. Use the “gate” method to record vehicle movements in blocks of 5 i.e.
8. SAFETY – Your personal safety, as well as that other road users is paramount, be aware you are working close to fast moving traffic, park all vehicles safely off the carriageway and do not cause obstructions, when on foot remain in the pedestrian areas where possible and be visible to other road users. Do not be a distraction to drivers

26/10/2014
14
Appendix C – Vehicle Classifications