training analytics: what works® - cedma europecedma-europe.org/newsletter...
TRANSCRIPT

Training Analytics: The Time is Now © Bersin & Associates
Training Analytics: What Works® What is Training Analytics? How do you get started?
By Josh Bersin © Bersin & Associates March, 2005 Version 2.2
© Bersin & Associates 2 March, 2005 This material is not to be duplicated or reused without written permission from Bersin & Associates
Table of Contents
Table of Contents.......................................................................... 2
Abstract:......................................................................................... 3
Why Measure Training and E-Learning?.................................... 3 Training is a large investment. ........................................................................... 3 Training generates large amounts of revenue. ............................................... 4
Three Benchmark Measures: Efficiency, Effectiveness, Compliance......................................................................................................... 4
Correlation of Training to Business Measures - ROI ................................... 5 The Training “Dashboard” ................................................................................. 6 The Concept of Actionable Information ......................................................... 8
The Measurement Challenge Today ........................................... 9 Few companies measure training consistently ............................................... 9 Measurement is Costly ....................................................................................... 9
Enter Training Analytics: Make Measurement Easy................ 10 The role of the LMS........................................................................................... 10 Analytics vs. Reporting...................................................................................... 10 Designed for Business People, not Programmers ....................................... 11 Training Analytics Needs by Audience .......................................................... 11 The Training Analytics Architecture .............................................................. 12 Source Information: LMS and Other Systems............................................. 12 The Role of the Data Mart:.............................................................................. 13 Business Intelligence Tools............................................................................... 13 The role of e-learning standards ..................................................................... 13 Security................................................................................................................. 14
How Do You Get Started?.......................................................... 14
The Advent of Packaged Analytics Solutions ........................... 14 SumTotal Analytics ............................................................................................ 14 Saba Analytics...................................................................................................... 16
Benefits to the Enterprise: Closing the Loop .......................... 18
About Bersin & Associates: ........................................................ 19 Current Research Available ............................................................................. 20

Training Analytics: Introduction
© Bersin & Associates 3 March, 2005 This material is not to be duplicated or reused without written permission from Bersin & Associates
Learning More: ............................................................................ 20
Abstract:
For decades companies have struggled with the real costs, benefits, and return-on-investment of training. Now that E-Learning and blended learning has become a major initiatives, even more investments are needed in the training organization. Using all the new tools and technology now available, is it finally time for companies to truly apply business analytics to understand the activity, effectiveness, and impact of e-learning and training? The answer is yes. Training Analytics is here. This report will define this exciting new space, help you understand why it is important to you, and help you understand what leading companies and vendors are doing to make training analytics a reality.
Why Measure Training and E-Learning?
Training is a large investment. Corporations invest large amounts of money, resources, and time in training. According to the 2004 ASTD (American Society of Training and Development) survey of more than 375 major corporations, companies spend between 1 and 3% of their total payroll on training. In some cases, the “benchmarking” companies spend as much as 4% – and budgets have increased, despite the US recession. On a per-person basis, the average spent on training is more than $700 per employee per year – and in the “leading” companies, more than $1400 per employee per year. Across a large enterprise, these numbers can become staggering. In 2003, for example, the average profitability of the S&P 500 companies was less than 9 %. If training expense is viewed as a percent of profits, the training budget represent as much as 5-20% of total corporate profits!

Training Analytics: Introduction
© Bersin & Associates 4 March, 2005 This material is not to be duplicated or reused without written permission from Bersin & Associates
Training generates large amounts of revenue. For product and services companies, training can also be a significant contributor to top line revenue. In product centric businesses (software and retail computers, for example), customer education and training is one of the most profitable businesses they have. Software companies, for example, see training revenues of 5-10% of their license revenues – and typically have margins on training revenue greater than 50%. Understanding the source of this revenue, product mix, and profitability is critical to optimizing this revenue.
Three Benchmark Measures: Efficiency, Effectiveness, Compliance
“If you can’t measure it, you can’t manage it.”
Nolan & Norton Consultants As the Nolan & Norton quote drives home, it is impossible to improve and optimize the training function if you cannot measure its operations. Nolan & Norton advocate the creation of “benchmark measures” which can be established as guidelines to measure the efficiency and effectiveness of any business operation.
© Bersin & Associates10 Training Analytics SeriesTraining Analytics Series
Three Training MeasuresThree Training Measures
•• Improve Effectiveness, Efficiency, or ComplianceImprove Effectiveness, Efficiency, or Compliance
EffectivenessEffectiveness
EfficiencyEfficiency
ComplianceCompliance
Are we getting learning and business impact from our programs?
Are we getting learning and business Are we getting learning and business impact from our programs?impact from our programs?
Which of our programs are mostcost-effective? How can we efficiently
reach our target audience?
Which of our programs are mostWhich of our programs are mostcostcost--effective? How can we efficientlyeffective? How can we efficiently
reach our target audience?reach our target audience?
Are we in compliance? Who is not incompliance? What risk do we have of
falling out of compliance?
Are we in compliance? Who is not inAre we in compliance? Who is not incompliance? What risk do we have of compliance? What risk do we have of
falling out of compliance?falling out of compliance?
Figure 1: The Three Benchmark Measurement Types

Training Analytics: Introduction
© Bersin & Associates 5 March, 2005 This material is not to be duplicated or reused without written permission from Bersin & Associates
In training, there are three critical issues which we face: efficiency, effectiveness, and compliance. Every major decision a training organization faces falls into one of these three areas, and we can establish benchmarks and measures in each: Effectiveness:
• Enrollment rates, completion rates • Scores and certification rates • Learner and Manager satisfaction (Kirkpatrick level 1) • Improvements in sales, reduction in turnover, improvement in quality tied to
specific training programs (level 2 and level 3 measures)
Efficiency:
• Training budget as percentage of revenue • Training budget per employee • Training budget per offering • Revenue per training program or per customer • Cost of training per student hour or student day
Compliance:
• Completion rates for mandatory programs • Certification acquisition rates • Percent certified in each business unit • Risk of falling out of compliance, days to expire.
As I talk with training organizations throughout the world, however, I find that many are not benchmarking themselves – primarily because it is hard to get the data they need. In fact, it is easy to find this information, and a training analytics makes it even easier.
Figure 2: The Three Benchmark Measurement Categories in Training
Correlation of Training to Business Measures - ROI The holy grail of training measurement has always been the dream to directly correlate training to business impact: sales revenue, productivity, turnover, product quality. The problem has always been the difficulty of obtaining data across a large sample, and then analyzing the data in a way that clearly isolates the impact of training on a given business initiative.

Training Analytics: Introduction
© Bersin & Associates 6 March, 2005 This material is not to be duplicated or reused without written permission from Bersin & Associates
Training Analytics provides the systematic and easy-to-use way to solve this problem. With a training analytics solution, companies could view sales results across an entire organization and compare sales volumes before and after a training event with the click of a button. Sales managers could easily see quota attainment numbers compared to training completion. As you will see from some of the sample screen shots below, these analyses will help companies decide which programs are most effective – and help managers drive training through their organization by identifying those who are not meeting objectives.
Figure 3: Correlating Training to Sales (SumTotal)
“Training Analytics will enable us to easily measure the impact of our e-learning investments on sales, on a product by product basis. With this information we can
rapidly improve our learning programs to deliver higher sales productivity. It is a critical part of our strategy to provide the most cost-effective high-impact e-learning in our
industry.”
Whitney Shelley, Chief Learning Officer, Countrywide
The Training “Dashboard” Back in the mid 1990’s Nolan and Norton pioneered the concept of a business “scorecard” (often called the “Balanced Scorecard”) which would set specific metrics by which a company could measure itself. These scorecards monitor specific business metrics which are important to the company itself. With a training analytics system, these dashboards are easy to create. The dashboard is designed to help you monitor and distribute the measures which your company. Some examples of training dashboards are shown below:

Training Analytics: Introduction
© Bersin & Associates 7 March, 2005 This material is not to be duplicated or reused without written permission from Bersin & Associates
© Bersin & AssociatesSlide 35 Analytics: The Time is NowAnalytics: The Time is Now
Training Executive DashboardTraining Executive Dashboard
Utilization HistoryUtilization History
Jan Feb Mar Apr May Jun Jul Aug Sep Oct Nov Dec
Student DaysStudent Days
Joe Boxer 45% 30%
Course # of students Survey Instructor
Java 101 355 4.5 Smith
Training Executive Dashboard – July 2002
View CoursesView Courses View FacilitiesView Facilities
View InstructorsView Instructors
Top Courses This MonthTop Courses This Month
Intro to Saba 322 4.2 JonesDemand Forecasting 114 4.8 Bessa
Intro to EJB 107 3.1 Reyes
Top Facilities This MonthTop Facilities This MonthFacility Total Students Revenue Utilization
San Jose 1650 $1,400,000 56%
Chicago 1299 $1,100,000 86%
New York 844 $7630,000 59%
YTD Student Days: 1824YTD Student Days: 1824YTD Target: 2400YTD Target: 2400
% of Plan: 74%% of Plan: 74%
UtilizationUtilization
View CustomersView Customers
View DepartmentsView DepartmentsView CertificationsView Certifications
Runs Analytic Reports Sorted
Subtotalled
ComputedWeekly orMonthly
Figure 4: Training Executive Dashboard
© Bersin & AssociatesSlide 36 Analytics: The Time is NowAnalytics: The Time is Now
Sales/Dealer Training DashboardSales/Dealer Training Dashboard
Dealership Training ActivityDealership Training Activity
Jan Feb Mar Apr May Jun Jul Aug Sep Oct Nov Dec
EnrollmentsEnrollments
ScoresScoresSales per storeSales per storeJoe Boxer 45% 30%Student Completion Score
Josh Bersin 35% 30%Bobbie Jones 45% 50%David Rubin 55% 40%Grant Stevens 35% 20%
SF Dealerships
John McIster 35% 30%John Wayne 45% 50%Steve Stevens 55% 40%John Shmo 35% 10%
San Jose Dealerships
General Products Sales District Dashboard
Student RankingStudent Ranking CertificationsCertifications
Course CatalogCourse Catalog Employee ListEmployee List
Area Pulldown
Figure 5: Sales Manager Training Dashboard

Training Analytics: Introduction
© Bersin & Associates 8 March, 2005 This material is not to be duplicated or reused without written permission from Bersin & Associates
The Concept of Actionable Information One of the most important topics in training measurement is the goal of identifying “actionable” information. Although Kirkpatrick (Levels 1-4) and Phillips (ROI) have given us good models for measuring various aspects of training programs, neither of these approaches tell us how to create actionable information. “Actionable” means that we want the information to be specific and detailed enough that we can take specification action on it. Understanding that a program generated a 125% ROI is not actionable. Understanding how to double the ROI IS actionable. Understanding that a program generated a 2.3 average satisfaction is not actionable. Understanding which specific elements of the program scored low compared to other similar programs IS actionable.
© Bersin & Associates9 Training Analytics SeriesTraining Analytics Series
Definition of Actionable InformationDefinition of Actionable Information
•• Specifically identifies:Specifically identifies:•• An audience issue An audience issue •• A program elementA program element•• A delivery issue or errorA delivery issue or error•• A design flaw or inadequacyA design flaw or inadequacy•• A content errorA content error•• A timing or scheduling issueA timing or scheduling issue……
•• Which can be addressedWhich can be addressed to improve efficiency, to improve efficiency, effectiveness, or compliance.effectiveness, or compliance.

Training Analytics: Introduction
© Bersin & Associates 9 March, 2005 This material is not to be duplicated or reused without written permission from Bersin & Associates
The Measurement Challenge Today
Few companies measure training consistently Unfortunately, there is a lack of measurement going on. The ASTD 2002 industry survey found that only 1/3 of companies profiled try to measure learning effectiveness. ASTD found that 12% or less try to measure job and business impact.
© Bersin & Associates4 IQPC, December, 2002IQPC, December, 2002
There is an amazing There is an amazing lack of lack of measurementmeasurement going on.going on.
% of companies using these methods to measure training% of companies using these methods to measure training
82%
35%
12%6%
0%10%20%30%40%50%60%70%80%90%
Level 1 Level 2 Level 3 Level 4
ASTD State of the Industry: 2002 ASTD State of the Industry: 2002 –– 687 Companies687 Companies
Figure 6: Training Measurement in Use Today (ASTD 2003 State of the Industry Study)
Measurement is Costly Why is this? In our research with more than 60 different training organizations in 2003 and 2004, we found that the biggest reason that companies do not measure training more rigorously is that they do not have the experience, tools and infrastructure to do so. It is not lack of interest or importance – but rather lack of tools and expertise. If you consider the total training investment per person in an organization, how much should you spend on measurement? 1%? 5%? 10%? According to the most recent ASTD survey of best practices, most companies spend 40-50% of their training dollars on content development, 8-10% on infrastructure, and the remaining on salaries and facilities cost.
It is time to add “measurement systems” to training budget.
Think about allocating a small but fixed percentage of the budget to providing the tools and systems to measure the effectiveness of the overall investment.

Training Analytics: Introduction
© Bersin & Associates 10 March, 2005 This material is not to be duplicated or reused without written permission from Bersin & Associates
We have found that spending $2-10 per learner on a training analytics system can give you
dramatic improvements in the measurability and ROI of training.
Enter Training Analytics: Make Measurement Easy
The advent of Training Analytics changes this equation. Let us now discuss what a training analytics solution looks like and how you can implement training analytics in your company.
The role of the LMS Analysis requires data. The data you need today resides in your LMS. If you have implemented some kind of LMS which houses enrollments, fees, completion data, scores, and certifications – then you have the basis for an analytics system. It is important to make sure that your LMS and e-learning content implements AICC and SCORM standards, so that you can rely on the completion and scores data from e-learning and webinar courses. The LMS itself, however, is not a system designed to analyze data and answer business questions. As you will see below, Analytics solutions typically “bolt on” to LMS systems and capture data from the LMS as well as other sources to help you analyze and improve training.
Analytics vs. Reporting Most LMS systems have built-in reports. Although reporting tools are important, they alone will not give you the total solution you need.
Analyze: (Webster’s Dictionary): The word “analyze” means to divide a complex whole into its parts or elements.
ANALYZE suggests separating or distinguishing the component parts of something (as a substance, a process, a situation)
so as to discover its true nature or inner relationships. Analysis is not the same as “reporting.” It is important to understand this. A “report” is the results of an analysis. Before you can create a “report,” you have to dive into the information to understand what it is you want to understand. From there you can create a “report” to view that information regularly.

Training Analytics: Introduction
© Bersin & Associates 11 March, 2005 This material is not to be duplicated or reused without written permission from Bersin & Associates
In the appendix we describe the transition to analytics which occurred in the direct marketing industry. In order to create dashboards, benchmarks, and measures you will need information which is not located in your LMS today. The analytics solution will create computed measures which give you business insights – this information is derived from information in your LMS.
Designed for Business People, not Programmers The concept of analytics, as described above, is to provide a software solution that lets a normal human business person (not a PhD statistician or SQL programmer) understand what’s going on in their training and e-learning operations. The solution should answer basic business questions, such as:
• How much did something cost? • What were the components of the cost? • Who took or completed a learning offering? • What can we do to improve it?
The training analytics solution gives different users the information they need to make decisions:
Training Analytics Needs by Audience Once you understand the business questions needed, the next issue to address is making it easy to find the information you need. In our research we have identified three categories of analytics users (information consumers). Depending on their jobs, they use information for different purposes. Audience Analytics Needs Decisions they make Executives Overall metrics, financial
information, compliance, and training efficiency.
Drive compliance, ensure training is efficient, make sure that employees are developed.
Line Managers Training compliance, skills development to meet their job needs, completion of mandatory programs.
Drive compliance, develop people, ensure training costs are reasonable, ensure that people are completing and learning something.
Training executives and managers
Training volumes, completion rates, vendor effectiveness, facility efficiency, program effectiveness, overall costs and financial efficiency.
What courses should be offered? What media and programs work? Which audiences consume the most? Which audiences learn best? Which vendors’ content performs well? How do we optimize scarce resources? What should we stop doing? What should we do more of?

Training Analytics: Introduction
© Bersin & Associates 12 March, 2005 This material is not to be duplicated or reused without written permission from Bersin & Associates
As you decide how to proceed, remember that these three different groups need slightly different views of information. Executives typically want “dashboards” or charts. Line managers typically need tabular reports and charts designed around their audiences and programs. Training managers and executives need the ability to slice, dice, drill, and filter to find just the information they need.
The Training Analytics Architecture
© Bersin & AssociatesSlide 10 Analytics: The Time is NowAnalytics: The Time is Now
Training Analytics ArchitectureTraining Analytics Architecture
Analysts, Managers browse
for Information theyNeed
Learning ActivityLearning Activity
Catalog UtilizationCatalog Utilization
Financial AnalysisFinancial Analysis
Certifications andCertifications andComplianceCompliance
LearningLearningEffectivenessEffectiveness
Query andQuery andReportingReportingInterfaceInterface
The Training Analytics The Training Analytics SystemSystem
LMSLMS
(Training Activity(Training ActivityResults,Results,
Financials)Financials)
Data MartData MartOLAP DatabaseOLAP Database
Other DataOther Data(Financial, HR)(Financial, HR)
Figure 7: Training Analytics Technical Architecture
Source Information: LMS and Other Systems In most companies, the first step is to just analyze information in your existing LMS. This is the easiest and lowest cost solution. If your LMS has been implemented for 6 months or longer, you already probably have the right information to get started. As your analysis needs grow, you will find that you also want information about costs, revenue, or organizational hierarchy which is located in other systems. The Analytics system must be open so that information can be brought in from other sources. Most importantly, business metrics and non-learning data (ie. Sales data) may be integrated so you can directly correlate learning to business measures.

Training Analytics: Introduction
© Bersin & Associates 13 March, 2005 This material is not to be duplicated or reused without written permission from Bersin & Associates
The Role of the Data Mart: The analytics database is a reorganized database (typically built as a “data mart” or multidimensional database) which is designed for fast access and easy “aggregation.” The concept of aggregation, drilling, and charting is critical to analytics. “Aggregation” means summarizing or aggregating data: for example: Aggregation: I want to know all the training costs incurred last year for Sales Training by sales geography. Now I want to know all the training costs incurred last year for Sales Training across the company. Now I want to know all the costs for all training across the company. Let’s compare this to last year. This is an “aggregation” of training costs. Drilling: I see we spent $7.2 Million on training last year. How much did we spend per learning area? Within the engineering training area, how much did we spend on new hire training vs. continuing education? Within new hire training, how much did we spend in North America vs. the Rest of the World? Within North America, how do our geographies compare? Let’s chart them by region. These types of analyses are easy to answer with a data mart and an analytics system. They are difficult to impossible to answer from your LMS alone.
Business Intelligence Tools The query and reporting interface shown above consists of off-the-shelf business intelligence tools which make it easy to create reports, drill into information, and create dashboards. Most companies already have licenses for these tools – typically Cognos, Business Objects, Actuate, or others.
The role of e-learning standards What you find when you implement such a system is that information must be complete. Since most companies are migrating 10-50% or more of their training to e-learning, more and more data is available now than ever before. A well designed e-learning program will tell you enrollments, student-hours, completion rates, scores, and even dropout rates. In order to get this information, however it is more important than ever that your content adhere to AICC or SCORM standards. Only if your content adheres to these standards will you get the tracking information you need to measure and analyze your training investments.

Training Analytics: Introduction
© Bersin & Associates 14 March, 2005 This material is not to be duplicated or reused without written permission from Bersin & Associates
Security One of the other big issues in training analytics is security. Once all the training information is in one, easy-to-find place, it is necessary to make sure that managers cannot see information from employees they are not privileged to see. Managers should only be able to see information for those reporting to them, not their peers or people higher in the organization chart.
How Do You Get Started?
How do you start implementing or buying an analytics system? The first step is to decide that you are ready. As we describe in one the appendixes, you must convince your management that reporting and analysis is worth the investment. We firmly believe that an investment of $2-10 per learner will pay for itself many times over in such a solution – but you must cost justify this for your own company. The second step is to define your specific reporting requirements. You have probably already done this through your implementation of LMS. Now you must go back to these reports and identify the measures and metrics you think will be critical in benchmarking your system. We have a complete set of measures you can use to help get started, available through http://www.bersin.com . The third step is to buy or build the technology infrastructure. Most companies already have data marts and reporting systems, so often the IT organization has a team ready to build such a system – with tools in house.
The Advent of Packaged Analytics Solutions
Two vendors have turnkey analytics solutions today: Saba and SumTotal. These systems give you “out-of-the-box” analysis which will let you quickly understand the activity, efficiency, and effectiveness of your training.
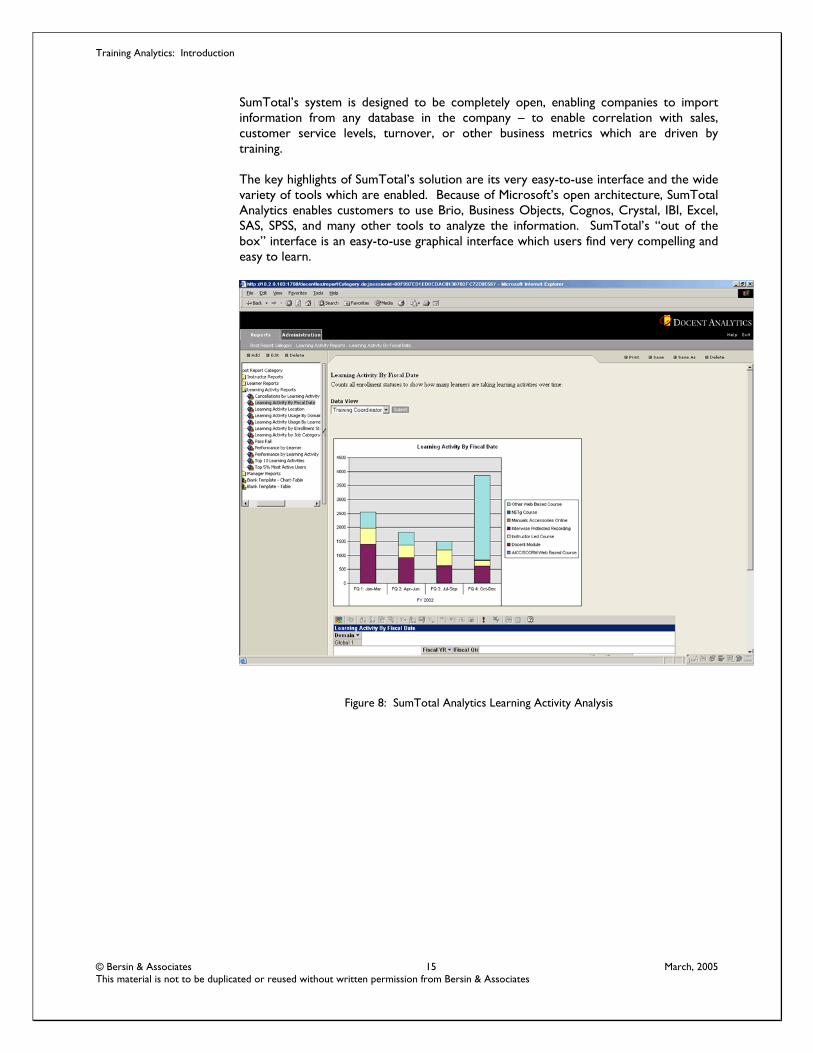
SumTotal Analytics SumTotal has built an end-to-end solution based on Microsoft Analysis services which provides a very easy-to-use, point and click interface to a wide variety of information. Their product is broken into a series of analytic applications, each of which draws upon data which resides in the SumTotal LMS.
Training Analytics: Introduction
© Bersin & Associates 15 March, 2005 This material is not to be duplicated or reused without written permission from Bersin & Associates
SumTotal’s system is designed to be completely open, enabling companies to import information from any database in the company – to enable correlation with sales, customer service levels, turnover, or other business metrics which are driven by training. The key highlights of SumTotal’s solution are its very easy-to-use interface and the wide variety of tools which are enabled. Because of Microsoft’s open architecture, SumTotal Analytics enables customers to use Brio, Business Objects, Cognos, Crystal, IBI, Excel, SAS, SPSS, and many other tools to analyze the information. SumTotal’s “out of the box” interface is an easy-to-use graphical interface which users find very compelling and easy to learn.
Figure 8: SumTotal Analytics Learning Activity Analysis
Training Analytics: Introduction
© Bersin & Associates 16 March, 2005 This material is not to be duplicated or reused without written permission from Bersin & Associates
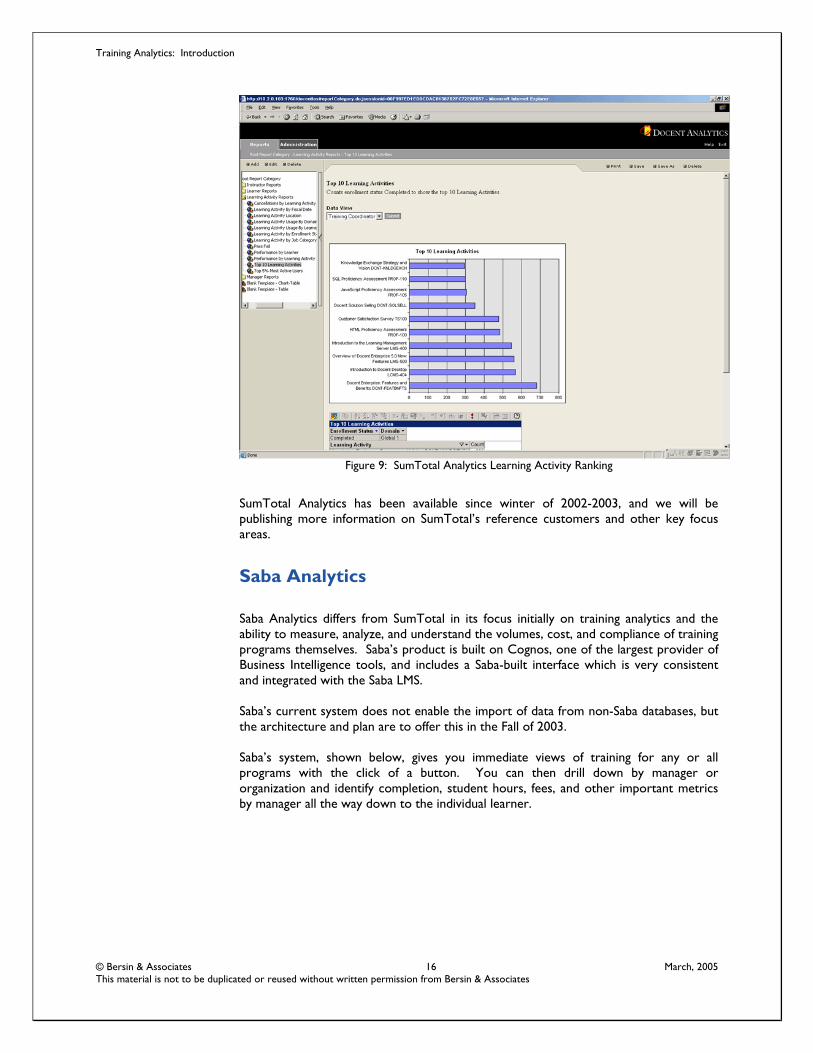
Figure 9: SumTotal Analytics Learning Activity Ranking
SumTotal Analytics has been available since winter of 2002-2003, and we will be publishing more information on SumTotal’s reference customers and other key focus areas.
Saba Analytics Saba Analytics differs from SumTotal in its focus initially on training analytics and the ability to measure, analyze, and understand the volumes, cost, and compliance of training programs themselves. Saba’s product is built on Cognos, one of the largest provider of Business Intelligence tools, and includes a Saba-built interface which is very consistent and integrated with the Saba LMS. Saba’s current system does not enable the import of data from non-Saba databases, but the architecture and plan are to offer this in the Fall of 2003. Saba’s system, shown below, gives you immediate views of training for any or all programs with the click of a button. You can then drill down by manager or organization and identify completion, student hours, fees, and other important metrics by manager all the way down to the individual learner.

Training Analytics: Introduction
© Bersin & Associates 17 March, 2005 This material is not to be duplicated or reused without written permission from Bersin & Associates
Figure 10: Saba Analytics Sample Compliance Analysis
Filters –Just click
To use
Sort Columns
Easily
Shows whatFilters are
active
Click to drill Up to next
Higher levelClick to CreateA chart
Filters –Just click
To use
Sort Columns
Easily
Shows whatFilters are
active
Click to drill Up to next
Higher levelClick to CreateA chart
Figure 11: Saba Analytics Sample Learning Activity Analysis
Training Analytics: Introduction
© Bersin & Associates 18 March, 2005 This material is not to be duplicated or reused without written permission from Bersin & Associates
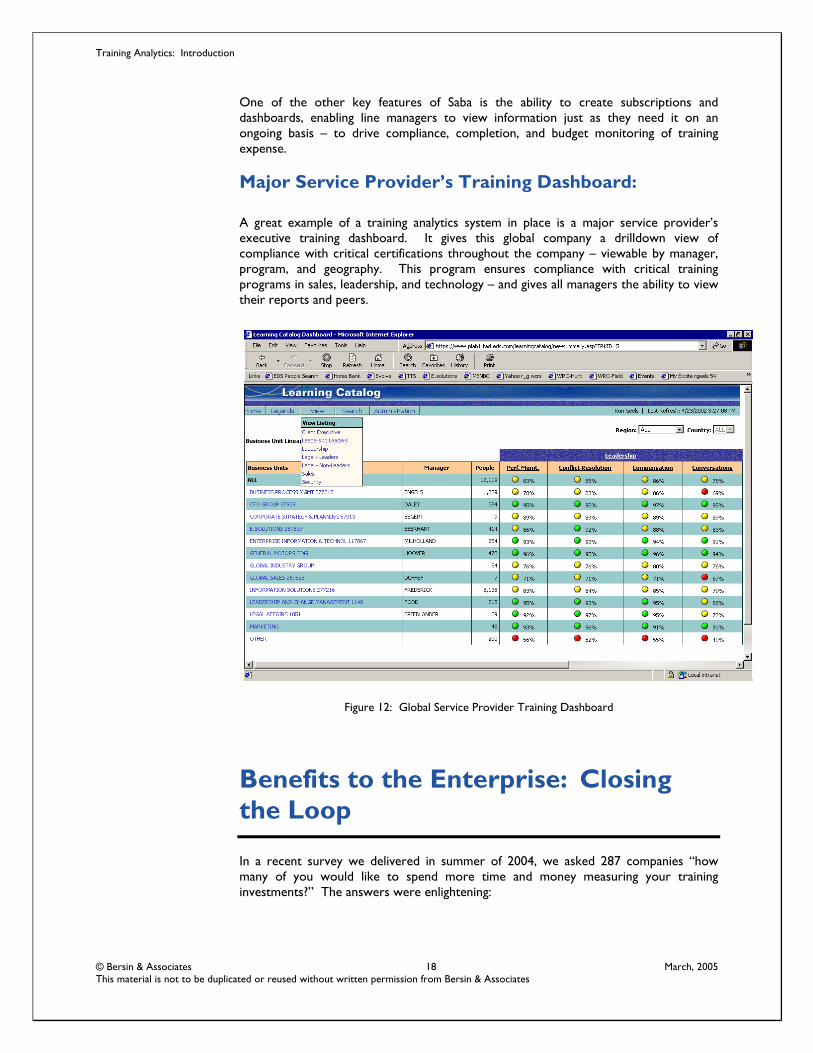
One of the other key features of Saba is the ability to create subscriptions and dashboards, enabling line managers to view information just as they need it on an ongoing basis – to drive compliance, completion, and budget monitoring of training expense. Major Service Provider’s Training Dashboard: A great example of a training analytics system in place is a major service provider’s executive training dashboard. It gives this global company a drilldown view of compliance with critical certifications throughout the company – viewable by manager, program, and geography. This program ensures compliance with critical training programs in sales, leadership, and technology – and gives all managers the ability to view their reports and peers.
Figure 12: Global Service Provider Training Dashboard
Benefits to the Enterprise: Closing the Loop
In a recent survey we delivered in summer of 2004, we asked 287 companies “how many of you would like to spend more time and money measuring your training investments?” The answers were enlightening:

Training Analytics: Introduction
© Bersin & Associates 19 March, 2005 This material is not to be duplicated or reused without written permission from Bersin & Associates
"Should your company invest more in the measurement of your training programs?"
45%
25%
20%
10%
Much MoreMoreSameLess
Figure 13: Industry Demand for Training Measurement
Clearly there is a demand for more analysis of training today. Companies want to “close the loop” between training investments and business results. The time has come for Training Analytics.
About Bersin & Associates:
Bersin & Associates is the only research and consulting firm solely focused on What Works™ enterprise learning research. With more than 20 years of experience in e-learning, training, and enterprise technology, Bersin & Associates provides a wide range of services including market research, best-practices, vendor and product analysis, corporate workshops, corporate implementation plans and sales and marketing programs. Some of Bersin & Associates innovations include a complete methodology for LMS selection and application usage, an end-to-end architecture and solution for training analytics, and one of the industry's largest research studies on blended learning implementations. Bersin & Associates offers the industry's first enterprise learning research membership program (http://www.elearningresearch.com ) which offers up-to-date research, product selection guides, whitepapers, advisory services, and access to other experts online. This service enables corporate training managers, vendors, and consultants make faster, better decisions about e-learning strategy, programs and technology. Bersin & Associates can be reached at http://www.bersin.com or (510) 654-8500.

Training Analytics: Introduction
© Bersin & Associates 20 March, 2005 This material is not to be duplicated or reused without written permission from Bersin & Associates
Learning More:
If you would like to learn more about how to develop, build, or implement Training Analytics in your organization visit our research store for up to date research. You can access the Bersin & Associates research store at http://store.bersinassociates.com .