training for high tech jobs
TRANSCRIPT
Training for High-Tech Jobs Implementation and Early Impacts from the TechHire and Strengthening Working Families Initiative Randomized Controlled Trial
Submitted to:U.S. Department of Labor, ASP/CEO200 Constitution Avenue, NW
Washington, DC 20210
Submitted by:Westat An Employee-Owned Research Corporation®
1600 Research Boulevard
Rockville, Maryland 20850
In Partnership with:MDRC200 Vesey Street23rd Floor New York, NY 10281
Contract #: DOL-OPS-16-U-00136September 2021

Evaluation of the TechHire and Strengthening Working Families Initiative Grant Programs
Implementation and Early Impacts from the TechHire and Strengthening Working Families Initiative Randomized Controlled Trial
September 2021
Betsy Tessler, Kelsey Schaberg, Barbara Fink, and Joseph Gasper with Rachael Metz, Andrew Rock, Deondre’ Jones, and Henry Kanengiser
Submitted to: U.S. Department of Labor, ASP/CEO 200 Constitution Avenue, NW Washington, DC 20210
Contract Number: DOL-OPS-16-U-00136
Project Director: Joseph Gasper 1600 Research Boulevard Rockville, Maryland 20850
Disclaimer This report was prepared for the U.S. Department of Labor (DOL), Chief Evaluation Office (CEO) by Westat, under contract number DOL-OPS-16-U-00136. The views expressed are those of the authors and should not be attributed to DOL, nor does mention of trade names, commercial products, or organizations imply endorsement of same by the U.S. Government.

Implementation and Early Impacts Report ii
Table of Contents
Acknowledgments vi
Executive Summary vii
Data Sources, Follow-Up Period, and Sample Characteristics x Key Findings xii Future Reports xviii
Chapter 1. Introduction 1-1
Program Participation in the Randomized Controlled Trial 1-3 Data Sources and Follow-Up Period 1-5
Chapter 2. Program Background, Design, and Implementation 2-1
Geographic Area 2-1 Partnerships 2-2 Target Population 2-5 Targeted Industries and Training Delivered 2-6 Staffing and Service Delivery 2-9 Support Services 2-15
Chapter 3. Randomized Controlled Trial Flow, Baseline Characteristics, and Program Participation 3-1
Participant Recruitment 3-1 Intake, Assessment, and Random Assignment 3-6 Baseline Characteristics of the Sample 3-8 Participation in TechHire and SWFI Programs 3-14
Chapter 4. Impacts on Service Receipt, Child Care, and Employment and Earnings 4-1
What Is Needed for a Program to Produce Impacts? 4-2 Services Available to the Control Group 4-3 Impacts on Education and Training 4-4 Impacts on Child Care Arrangements and Assistance 4-8 Impacts on Job Readiness Training, Job Search Assistance, and Support
Services 4-10 Impacts on Employment, Job Characteristics, and Perceptions of the Future 4-11 Impacts on Training, Child Care, and Employment, by Subgroup 4-13

Implementation and Early Impacts Report iii
Table of Contents (continued)
Chapter 5. Conclusion 5-1
Variation in Program Participants 5-1 Recruitment Challenges 5-2 Training Levels: Intended Versus Actual 5-2 Distinction Between TechHire or SWFI and Other Skills Training Programs 5-3 Training Participation Impacts 5-4 Child Care Supports 5-5 Employer Partnerships and Engagement 5-6 Career Awareness, Job Readiness, and Job Development 5-6 Labor Market Outcomes 5-6 A Changing Economic Environment 5-7 Sustainability 5-7 Future Reports 5-8
References R-1
Appendixes
A Supplementary Exhibit for Chapter 2 A-1 B Collection and Analysis Approaches for the Randomized
Controlled Trial Quantitative Data B-1 C Supplementary Exhibit for Chapter 3 C-1 D Supplementary Exhibits for Chapter 4 D-1
Tables ES-1 Data sources for the TechHire and SWFI Randomized Controlled
Trial (RCT) xi 1-1 Program characteristics 1-3 1-2 Data sources the TechHire and SWFI Randomized Controlled Trial
(RCT) 1-5 2-1 Staffing structures 2-10 3-1 Randomized controlled trial program sample sizes and
enrollment targets 3-1 3-2 Selected baseline characteristics for TechHire/SWFI sample
members 3-10

Implementation and Early Impacts Report iv
Table of Contents (continued)
Tables
3-3 Parental status and child care arrangements at baseline for SWFI sample members 3-13
3-4 Participation in TechHire and SWFI programs within 6 months of random assignment, among TechHire/SWFI group members 3-15
4-1 Impacts on education, training, and financial assistance 4-6 4-2 Impact on enrollment in or completion of training (confirmatory
outcome) 4-7 4-3 Impacts on child care arrangements and assistance 4-9 4-4 Impacts on service receipt 4-10 4-5 Impacts on employment and job characteristics 4-12 4-6 Impacts on perceptions of the future 4-13 A-1 Program training characteristics A-1 B-1 Random assignment ratios, enrollment dates, and sample sizes, by
program B-1 B-2 Selected baseline characteristics for TechHire/SWFI sample
members, by research group B-2 B-3 Estimated regression coefficients for probability of being a
TechHire/SWFI group member B-4 B-4 Wave 1 survey response rates, overall and by program B-5 B-5 Variables included in nonresponse bias analysis B-6 B-6 Comparison of Wave 1 survey respondents with nonrespondents
and with the full sample B-8 B-7 Impacts on training, employment, and child care arrangements,
weighted by likelihood of survey response B-9 B-8 Comparison of U.S. Department of Labor Participant Individual
Record Layout (PIRL) data and Wave 1 survey reports of participation in training since random assignment among TechHire/SWFI Group survey respondents, by program and overall B-11
B-9 Minimum detectable effects, by sample B-13 B-10 Minimum detectable effect for the confirmatory outcome B-14 B-11 Comparison of impacts on wages, hours, earnings, and amount
paid for training, by level of exclusion of outlier values B-17

Implementation and Early Impacts Report v
Table of Contents (continued)
Tables
B-12 Percentage missing on key outcomes B-18 B-13 Comparison of covariate-adjusted versus unadjusted impacts on
training, employment, and child care arrangements B-19 B-14 Confidence intervals, standard errors, and effect sizes for key
outcomes B-20 C-1 Participation in TechHire and SWFI programs within 6 to 27
months of random assignment, among TechHire/SWFI group members C-1
D-1 Impacts on training, employment, and child care arrangements by TechHire/SWFI subgroup D-1
D-2 Impacts on training, employment, and child care arrangements by labor market attachment subgroup D-3
Figures
2-1 Programs participating in the TechHire and SWFI randomized controlled trial 2-2
3-1 Participation in key program activities within 6 months of random assignment, among TechHire/SWFI group members 3-16

Implementation and Early Impacts Report vi
Acknowledgments
This report would not have been possible without the contributions of many people.1 We are especially grateful to the students who are participating in the TechHire and Strengthening Working Families Initiative (SWFI) programs through CareerSource Tampa Bay, Community College of Aurora, Community College of Denver, Daytona State College, Eastern Florida State College, Florida State College at Jacksonville, LaGuardia Community College, and Vermont Technical College, whose experiences have informed this report. We also want to give special thanks to the staff members of these organizations who have been implementing their grant programs and whose experiences inform the operational lessons documented in this report; the study depends greatly on their efforts to implement their TechHire and SWFI programs with care. These include Heleyna Bostick, Barbara Eyer, Darcy Brouillette, Elizabeth Collins, Elizabeth Schroeder, Jessica Cassarino, Marcus Smothers, Michele Valdez, Michelle Schultz, Phillip O’Meally, Shrie Ramey-Allen, and Stephanie Wolf.
We are also grateful to the staff at the U.S. Department of Labor for their valuable feedback on the evaluation and for reviewing drafts of this report. These include Christina Yancey, Deborah Martierrez, and Jennifer Daley, who have been sources of steady and thoughtful guidance on all aspects of this study. The study would not have been possible without their support.
We also want to thank the members of our technical working group—Gina Adams, David Berman, Mindy Feldbaum, Kevin Hollenbeck, and Jeff Smith—for their feedback throughout the project.
Our research partners at Westat—the lead organization on this evaluation—were essential to the successful implementation of the randomized controlled trial (RCT) on which this report focuses, including conducting the survey. From Westat, Joseph Gasper served as the Project Director and led all aspects of the study. Michael Hornbostel directed the web and telephone data collection for the six-month follow-up survey, and Kevin Baier cleaned the data and conducted nonresponse analysis. We also thank Lindsay Giesen and Benjamin Muz, who, with MDRC, canvassed the grantees to identify suitable candidates for the RCT. From MDRC, working with Westat, Andrew Rock, Frieda Molina, Liza Paudel, and Rachael Metz provided ongoing technical assistance to the TechHire and SWFI programs and assisted in collection of qualitative research data. Richard Hendra, the study’s Principal Investigator, provided guidance and insights throughout the study and a close review of this report. Barbara Goldman and Carolyn Hill also offered valuable insights on findings and report drafts, and Ginger Knox and Jill Kirschenbaum provided important feedback on the report. Daron Holman, Deondre’ Jones, Henry Kanengiser, Liza Paudel, and Camille Préel-Dumas processed and analyzed the quantitative data. Jálynn Castleman-Smith coordinated the production of the report. Margaret Bald edited the report, and Ann Kottner did preliminary production work to prepare the report for editing and publication. Finally, we appreciate the support of our resource manager, Ebony Scott.
The Authors
1 The Acknowledgments list the institutions with which individuals were affiliated at the time they contributed to the
work reflected in this report.

Implementation and Early Impacts Report vii
Executive Summary
The H-1B visa program, established in 1990 by Congress, allows employers to hire individuals from outside the United States to work in “specialty occupations” (such as science, technology, engineering, mathematics, health care, business, financial services, or life sciences) on a temporary basis. In 1998, a user fee was added to fund scholarship and training programs that develop the skills of the existing U.S. workforce in high-demand fields that employ large numbers of H-1B workers. Those fees have underwritten more than $1 billion in technical skills training programs managed by the U.S. Department of Labor (U.S. DOL) and designed to reduce or replace the need for importing skilled labor from other countries.
Two grant programs funded through this authority and administered by the U.S. DOL, launched in 2015 by President Barack Obama, are H-1B TechHire Partnership Grants (TechHire) and the Strengthening Working Families Initiative (SWFI).2 These grant programs were designed to provide funding, through a competitive application process, for programs that would make training more accessible to individuals who might otherwise experience barriers to training and employment; provide support services that address the unique and varied challenges facing these individuals; and offer a range of training strategies, including accelerated training and online options, to address skills deficits (see Box ES.1). These local programs were expected to prepare disadvantaged individuals for “well-paying middle- and high-skilled jobs in high-growth H-1B industries.”3 Additionally, SWFI program grantees were expected to undertake activities with key stakeholders across the child care, workforce, and human services systems to streamline access to child care for disadvantaged workers.
The opportunity to develop such programs and apply for TechHire and SWFI grants was open to partnerships consisting of workforce agencies, education and training providers, and business-related nonprofit organizations. In June 2016, the U.S. DOL Employment and Training Administration awarded 39 TechHire grants providing services in 25 states and 14 SWFI grants providing services in 13 states. Programs were expected to operate for four years, roughly from June 2016 to June 2020.
2 Both TechHire and SWFI are authorized under Section 414(c) of the American Competitiveness and Workforce
Investment Act of 1998. 3 U.S. Department of Labor, Employment and Training Administration, Notice of Availability of Funds and Funding
Opportunity Announcement for Grant Applications for H-1B TechHire Partnership Grants. (https://www.dol.gov/sites/dolgov/files/ETA/skillstraining/FOA-ETA-16-01%20TechHire.pdf).

Implementation and Early Impacts Report viii
Box ES.1 Characteristics of TechHire and SWFI
TechHire • Target population: young adults ages 17 to 29 with barriers to training and employment;a or special
populations defined as individuals with disabilities, limited English proficiency, or criminal records.b • Provides accelerated learning options (such as bootcamp style programs), specialized training strategies,
support services, and other focused participant services such as networking and job search, active job development, transportation, mentoring, and financial counseling.
SWFI • Target population: low- to middle-skilled custodial parents, who are eligible to work in the United States,
with at least one dependent who is 13 years of age or younger or at least one dependent with a disability or developmental delay who may be older than 13 years of age.
• Provides training that gives entry into or promotes movement along a career pathway, as well as customized participant support services, including child care, necessary to support the successful completion of skill enhancement and job placement.
All H-1B grants require participants to be at least 17 years of age and out of secondary school, per the requirements of the American Competitiveness and Workforce Improvement Act of 1998.
Notes: aFor programs targeting young adults, at least 75 percent of the participants served had to meet this requirement. The other 25 percent of participants could be unemployed, dislocated, underemployed, or incumbent workers of any age. bFor programs targeting special populations, at least 50 percent of the participants served had to meet this requirement. The other 50 percent of participants could be unemployed, underemployed, or incumbent workers. No more than 25 percent of participants could be incumbent, front-line workers.
In September 2016, the U.S. DOL Chief Evaluation Office awarded Westat, with MDRC, a contract to conduct an evaluation of the 53 TechHire and SWFI programs (the Westat/MDRC team is referred to in this report as the “evaluation team”). The evaluation comprises an outcomes and implementation study conducted by Westat of all 53 TechHire and SWFI programs, making use of surveys and interviews with program directors and key partners, as well as a randomized controlled trial (RCT) conducted by MDRC of a small subset of the programs—three TechHire programs and two SWFI programs.4 The RCT officially launched in the first program in April 2018 and in all five programs by September 2018, about two years after the programs received their TechHire and SWFI grant awards and began operating.
The RCT is assessing the extent to which TechHire and SWFI’s combination of training, case management, and support services helped people increase their employment and earnings over and above what they would have achieved in the absence of these programs. It is also looking at whether these programs led people to obtain the kinds of middle- to high-skilled jobs that the grant programs intended and to receive more support—including child care—than those who were not in
4 The five programs participating in the RCT are East Coast Florida TechHire (consisting of Daytona State College,
Eastern Florida State College, and Florida State College at Jacksonville), New York City TechHire (LaGuardia Community College), Tampa TechHire (CareerSource Tampa Bay), Denver SWFI (Community College of Aurora and Community College of Denver), and Vermont SWFI (Vermont Technical College). They offered training in a mix of information technology, advanced manufacturing, and health care, and were varied in their geographic context, staffing structures, other services offered, and strategies for delivering services.

Implementation and Early Impacts Report ix
the programs. The results of this evaluation, including the study of all 53 programs and the smaller RCT of five of the programs, were intended to help federal, state, and local policymakers learn whether the combinations of job training approaches, case management, and support services offered across the programs helped disadvantaged people secure employment in high-demand sectors and increase their earnings.
This report focuses on the implementation and short-term impacts of TechHire and SWFI—capturing between 7 and 14 months of follow-up—in the five programs that participated in the RCT.5 The implementation analysis explored broad research questions about how the programs were implemented and what factors facilitated or inhibited implementation. Additionally, it aimed to uncover practices the programs put in place that could help explain increased participation in and completion of training, and eventually increased employment and earnings, relative to what would have happened in the absence of the programs. Specifically, the implementation analysis examined (1) how each of the five programs in the RCT was implemented, whether and why implementation practices changed over time, how the training and services delivered by the program compared with those originally conceived in the grantee’s application, and how the TechHire and SWFI programs might differ from other programs available to potential TechHire and SWFI enrollees; (2) the extent to which various services were received by the program group; and (3) the contrast in service use between the program and control groups. The impact analysis is exploring the effects of TechHire and SWFI on participation in and completion of training, receipt of credentials, and use of child care and other services, as well as on longer-term outcomes such as employment and earnings, advancement and job quality, and other, secondary outcomes such as overall well-being, health, and housing status. Limitations of the RCT include the small sample sizes, the generalizability of findings to the broader group of 53 TechHire and SWFI programs and other similar training programs, and the short follow-up period for the current report. Additionally, findings from the implementation analysis are suggestive about what could be driving impacts, but they are not definitive. Other reports will focus on longer-term findings for the RCT, as well as more in-depth implementation and outcomes information about all 53 TechHire and SWFI programs.
5 In the RCT, eligible applicants to the programs were assigned at random to one of two groups: The “program group”
was eligible to receive TechHire- or SWFI-funded program training and services, while the “control group” was not eligible for these services but could receive other training or services available in the community or funded by other sources. The only difference between these two groups is in the program services being evaluated. As a result, if sample sizes are large enough, any statistically significant differences observed between the two groups, such as differences in average levels of employment or earnings, can be attributed to the program; these differences are called “impacts” or “program effects.” Launching the RCT after program operations were already underway required programs to shift how they conducted recruitment and enrollment, since the RCT required that there be enough applicants for there to be a control group member for every person in the program. This essentially meant that programs had to recruit and enroll double the number of people they had planned for initially, which was a substantial challenge for the programs.
Implementation and Early Impacts Report x
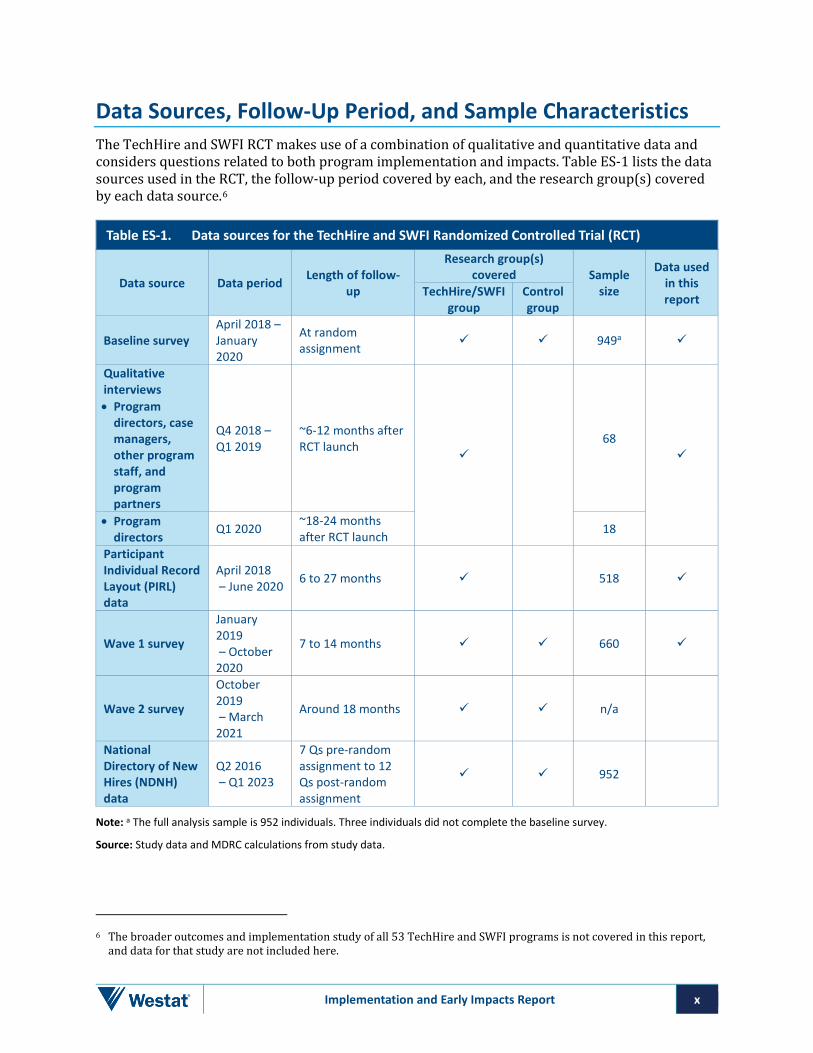
Data Sources, Follow-Up Period, and Sample Characteristics The TechHire and SWFI RCT makes use of a combination of qualitative and quantitative data and considers questions related to both program implementation and impacts. Table ES-1 lists the data sources used in the RCT, the follow-up period covered by each, and the research group(s) covered by each data source.6
Table ES-1. Data sources for the TechHire and SWFI Randomized Controlled Trial (RCT)
Data source Data period Length of follow-up
Research group(s) covered Sample
size
Data used in this report TechHire/SWFI
group Control group
Baseline survey April 2018 – January 2020
At random assignment 949a
Qualitative interviews • Program
directors, case managers, other program staff, and program partners
Q4 2018 – Q1 2019
~6-12 months after RCT launch
68
• Program directors
Q1 2020 ~18-24 months after RCT launch 18
Participant Individual Record Layout (PIRL) data
April 2018 – June 2020 6 to 27 months 518
Wave 1 survey
January 2019 – October 2020
7 to 14 months 660
Wave 2 survey
October 2019 – March 2021
Around 18 months n/a
National Directory of New Hires (NDNH) data
Q2 2016 – Q1 2023
7 Qs pre-random assignment to 12 Qs post-random assignment
952
Note: a The full analysis sample is 952 individuals. Three individuals did not complete the baseline survey.
Source: Study data and MDRC calculations from study data.
6 The broader outcomes and implementation study of all 53 TechHire and SWFI programs is not covered in this report,
and data for that study are not included here.

Implementation and Early Impacts Report xi
For the purpose of the RCT’s impact evaluation, the study participants from the three TechHire and two SWFI programs in the RCT were pooled together; that is, individuals assigned to the program group or control group across the five programs were combined into one program group and one control group. Because smaller numbers of individuals enrolled into the RCT than were anticipated, the TechHire programs alone or the SWFI programs alone did not provide a large enough sample size to be able to detect statistically significant impacts at a commonly accepted level for the two programs separately. (See Appendix B in the full report for more information.) The TechHire and SWFI programs also share many common features, and combining the samples enables the analysis to explore the overall effectiveness of the intervention across a range of providers. The program group is sometimes referred to in this report as the “TechHire/SWFI group.”
A baseline survey was administered as part of the process to randomly assign eligible individuals to the RCT’s TechHire/SWFI group or the control group to capture demographic and labor market characteristics. (See Appendix B in the full report for more information.) In brief, the TechHire and SWFI programs enrolled 952 people into the RCT (known as “sample members”), with a little over half in the program group (518 individuals), who were eligible to receive TechHire or SWFI services, and a little less than half in the control group (434 individuals). As expected, TechHire sample members tended to be younger (28 versus 32 years old, on average) and were less likely to have children (18 versus 80 percent) than SWFI sample members. One quarter of sample members identified as Hispanic/Latino, 44 percent as White, and 43 percent as Black/African American, and more than 57 percent of all individuals who enrolled in the RCT were women. Only 4 percent of sample members did not have a high school diploma or GED; almost all (96%) sample members had prior work experience, although only about half were working when they entered the study.
As shown in Table ES-1, the evaluation team conducted two rounds of qualitative interviews with program staff and partners to learn about program implementation, challenges, and promising practices. The team collected program tracking data from the Participant Individual Record Layout (PIRL) database maintained by the U.S. DOL. These data, reported by the programs, track demographic and socioeconomic characteristics; program entry and exit; participation in training; receipt of credentials, degrees, and diplomas; and receipt of other services, including case management and assessments. The RCT’s impact analysis is assessing the impact of the TechHire and SWFI programs on participants’ outcomes—including their impact on participation in occupational skills training, attainment of credentials and certifications, child care assistance and services, employment and earnings, advancement and job quality, and overall well-being.7 These outcomes will cover both the TechHire/SWFI group and control group. The impact analysis in this report presents outcomes from the Wave 1 Survey only, which captures a 7- to 14-month follow-up period.8 The next report will present outcomes over a longer-term follow-up period (up to three years); those outcomes will be drawn from the Wave 2 Survey and National Directory of New Hires data.
7 In this study, impacts are considered statistically significant if they are significantly different from zero at the
10 percent level of statistical significance. 8 The survey achieved a 70 percent response rate overall, with a less than 1 percent differential between research
groups. The response rate was 70 percent for the TechHire/SWFI group and 69 percent for the control group. See Appendix B in the full report for more information on the Wave 1 survey.
The Wave 1 Survey was fielded from January 2019 to October 2020. Thus, some individuals were surveyed during the COVID-19 pandemic and associated economic recessionary period.

Implementation and Early Impacts Report xii
Key Findings Variation in Program Participants • Differences in how eligibility was defined and in the level of pre-screening resulted in notable
variation across the programs in program participants’ characteristics.
As learned through the implementation analysis, local discretion to define “barriers to employment” (for TechHire) and “training needs” (for SWFI) gave the programs flexibility in setting their eligibility criteria—over and above the basic ones established by the grant—and screening processes. One program recruited mostly from among current community college students, while others focused on individuals with barriers who were less likely to find their way to college-based training programs independently. One program used rigorous screening to increase the likelihood that eventual program participants would be successful in its demanding program. These differences, and other variations in age, education, employment history, and transportation and child care needs, are factors that could influence success in completing training programs as well as in finding post-training employment.
Recruitment Challenges • Three programs struggled to meet recruitment targets; thus, the sample for the RCT was one-
third smaller than intended.
Programs faced several challenges recruiting eligible individuals for the study, including insufficient staffing for outreach activities, an initial lack of connections with community agencies, and the reluctance of referral partners to send individuals to the program once random assignment began, given the chance that some referrals would not be randomly assigned to the program group. Some TechHire programs had difficulty finding interested young adults in the designated age range. During the time the programs were implemented, low unemployment rates meant that members of the target population could find fairly well-paying jobs easily, making training less appealing.
Training Skill Levels—Intended Versus Actual There was a discrepancy between the skill level of the intended training to “train workers with the skills required for well-paying, middle- and high-skilled, and high-growth jobs,” as described in the Funding Opportunity Announcements for TechHire and SWFI, and the relatively low level of skill provided by the training offered. At three of the five programs, this led to placement in mostly entry-level, lower-skilled jobs that were not in demand. Notably, “well-paying” and “middle- and high-skilled” are not clearly defined in the Funding Opportunity Announcement for TechHire and SWFI - the closest definition is, “Occupations at H-1B skill levels generally require a bachelor’s degree or comparable experience and are middle to-high-skill level.” – Some programs made clear in their applications that they would be training people for entry-level positions, which was allowable according to the Funding Opportunity Announcements as long as there was a clear, demonstrated pathway to middle- and high-skilled jobs.
The TechHire and SWFI grants had ambitious goals of preparing individuals with low skills and barriers to training for high-skilled jobs – many of which typically required bachelor’s degrees – in a short period of time. Even with case management and financial supports, this is likely to be a challenging goal to achieve. All programs in the RCT successfully offered training in “high-tech” industries, including information technology, health care, and advanced manufacturing. However,

Implementation and Early Impacts Report xiii
in practice, at three of the programs, most of the training was designed to lead to entry-level jobs within high-tech industries rather than middle-and high-skilled jobs. Additionally, work-based learning—one component of the TechHire and SWFI programs that could have potentially given participants some work experience, possibly leading to higher-level, higher-paying jobs—was largely missing across all the programs, as discussed below.
It is not possible to determine definitively what caused a mismatch between the types of higher-skilled training called for in the TechHire and SWFI Funding Opportunity Announcements—which better aligned with the level of skills employers were looking for—and the types of training offered at three of the programs, which were more geared toward lower-skilled, entry-level jobs.9 Possible explanations worth considering, as well as implications for future similar workforce programs, include the following:
• Individuals with relatively low baseline skills, such as that of the target population for these programs, would likely need considerably more support—possibly in the form of tutoring or a preparatory bridge program—to be successful in training that required a higher level of skill. Absent that, they are more likely to succeed in skills training programs that are closer to their current skill levels, such as those offered by most of the five TechHire and SWFI programs in the RCT.
• One program director said that the assumption of those who designed the local program was that placing graduates into even entry-level jobs in high-tech industries would at least set them on a pathway to a better-paying job. This director noted that this program design, which was based on the needs and skill levels of the population to be served and the feedback from industry regarding need, as well as the potential for participants to build on their initial credentials and obtain additional credentials with other educators and partners, was funded as proposed. Other staff at this program noted that entry-level jobs turned out to be scarce. A future report will provide some evidence on whether the strategy of helping people get a start in high-tech industries, even in entry-level positions – a strategy that was approved by U.S. DOL when it awarded these TechHire and SWFI grants – led to higher earnings longer-term (relative to the control group), but will not be able to speak to whether individuals advanced into higher-skill jobs in the target industries.
• One program that did train people for middle- and high-skilled jobs heavily screened applicants before accepting them into the program to ensure they had the skills necessary to be successful in training. The participants in this program had higher levels of education, including many who had bachelor’s degrees. This underscores how challenging it can be to train people with lower levels of technical skills for high-skilled jobs, especially in a short time.
9 Longer-term follow-up will provide more insights on the types of jobs that individuals in the TechHire and SWFI
programs obtained and whether they were “well-paying” relative to jobs obtained by the control group.

Implementation and Early Impacts Report xiv
Distinction Between TechHire or SWFI and Other Skills Training Programs • There was considerable variation in the extent to which the occupational skills training
offered under the TechHire and SWFI programs differed from training that individuals could receive from other available training programs in the community.
In most of the TechHire and SWFI programs, the occupational skills training offered was the same, or nearly the same, as what individuals could get outside TechHire or SWFI, sometimes at the same college offering the TechHire and SWFI training. In at least one program, TechHire/SWFI and control group members might even sit next to each other in the same classrooms. Often the content of training offered under TechHire and SWFI and to the general public at the college was very similar, but the TechHire and SWFI classes were smaller or offered in a cohort, or self-paced online, instead of on a regular academic schedule. But it may have been possible in some locations to find similarly structured classes in the community. At one program, the training offered through TechHire was not available at the college outside TechHire, but staff reported that similar training was offered elsewhere in the community. Without clear distinctions between training and services received by program group members and control group members, it can be harder for a program to result in positive impacts on employment and earnings.
• Across all the programs, TechHire and SWFI staff reported that the provision of case management support was a distinguishing feature relative to training programs available in the broader community.
Case management support was a key difference between the TechHire and SWFI training programs and those available to control group members. All five of the TechHire and SWFI programs had hired dedicated case managers to provide support to participants.10 These staff members checked in with students, followed up with them if they missed class, and helped them address barriers keeping them from participating. Even where control group members could receive very similar or identical training to TechHire and SWFI at the same colleges, they would not have access to the support provided by the programs’ case managers. Though it is not possible to isolate the effects of case management support from other aspects of the programs, case management support could be an important feature of the programs leading to impacts on participation in training, discussed below.
• One notable difference between TechHire or SWFI and other similar training programs was that there was no cost to participants for TechHire and SWFI training.
Although the training offered under TechHire and SWFI was often similar to other training available in the community, it was offered at no cost to the student. This was intended to increase access for a population that would not otherwise be able to afford training programs or would end up with a substantial amount of debt. At one program, however, other grants were available to control group members, enabling them to receive the same training offered to the TechHire/SWFI group, also at no cost. Overall, the survey findings showed that TechHire and SWFI reduced the number of people paying for training relative to the control group by 7 percentage points, and the amount paid out of pocket by close to $500—both statistically significant amounts.
10 At the East Coast Florida program, one of the three colleges in the partnership had a case manager.
Implementation and Early Impacts Report xv
Program Participation Impacts • The Wave 1 survey showed that the TechHire and SWFI programs produced statistically
significant impacts on outcomes related to the provision of case management support.
Case management support included receipt of job readiness training and preemployment services intended to help participants look for and obtain a job. Impacts on receipt of a variety of preemployment services ranged from 9 percentage points for receiving help developing a résumé to 22 percentage points for receiving help with job readiness or soft skills training. While financial supports, such as assistance with transportation, books, tools, or uniforms, were also made available to the TechHire/SWFI group, in practice, according to staff, they were not used as much as staff expected. Still, the programs increased the receipt of such support services by 21 percentage points, a statistically significant impact.
• The TechHire and SWFI programs increased participation in occupational skills training relative to the control group.11 TechHire/SWFI also produced a statistically significant impact on currently being enrolled in or having already completed occupational skills training within 7 to 14 months of entering the RCT, the study’s confirmatory outcome.12
The increase in training participation and the impact on the study’s confirmatory outcome are positive results and provide evidence that the study achieved a treatment contrast.13 As of the Wave 1 survey, 43 percent of TechHire/SWFI group members were either currently enrolled in or had completed occupational skills training, compared with only 21 percent of control group members. For the TechHire and SWFI programs, enrolling in and completing training are the first steps toward increasing participants’ employment and earnings.
• SWFI increased the likelihood of participants receiving help to find or access child care by a statistically significant amount, including receiving help to find child care that is more convenient. SWFI did not have an impact on the use of child care or on participants seeing child care as a barrier to training or employment. Interviews with staff revealed a mismatch between participants’ child care needs and what the programs could offer.
11 As mentioned, some individuals were interviewed for the Wave 1 Survey after the onset of the COVID-19 pandemic.
Based on the intake period and average training lengths, most individuals in the TechHire/SWFI group were likely out of training prior to March 2020. The Wave 2 Survey will provide more evidence on whether (and how many) individuals were in training during the COVID-19 pandemic and whether those training were impacted (for example, whether they moved online).
12 The research team prespecified a set of outcomes for the impact analysis and categorized each of these outcomes as “confirmatory” or “exploratory.” The confirmatory outcome is the one most likely to be affected in the current follow-up period if the programs were successful. A statistically significant impact on this outcome represents the highest level of evidence of the success of the programs. If the programs do not pass the confirmatory test but produce statistically significant impacts on other measures, it does not mean that the programs were unsuccessful. It simply means that the programs passed a lower standard of evidence. All the other outcomes in this report are considered exploratory, meaning they either are not directly targeted by the intervention or are outcomes where there is a lower likelihood of detectable impacts given the timing of measurement and given the statistical power of the design.
13 A study’s “treatment contrast” represents the differences in the services available to the program and control groups, as well as in the rates of key services (in this case, occupational skills training) received across research groups.

Implementation and Early Impacts Report xvi
A key method by which the SWFI programs aimed to help parents successfully participate in and complete training was to help them find high-quality, reliable, and affordable child care.14 There is some evidence the programs achieved their goal of offering support for child care—31 percent of SWFI group members reported receiving help finding child care, a 17 percentage point and statistically significant increase over the control group average.15 The SWFI programs also helped more individuals find child care that was more convenient for them, for example child care that was in a convenient location or available at needed hours. However, this offered support did not translate into an increase in child care use or a reduction in child care barriers. While staff may have offered to help with child care needs and even provided guidance on finding child care, the help may not have been needed or useful, for a few reasons. Several staff members from both SWFI programs reported that students commonly relied on informal care from family, neighbors, or friends while in training, and therefore most did not express the need for formal child care when they entered the SWFI program. Also, formal child care was not available in the evening, which is when many training classes were held. Both SWFI programs were engaged in systems-change efforts aimed at overcoming these barriers and improving the availability, quality, and affordability of child care in their local areas.
Employer Partnerships and Engagement • Employer partnerships and engagement fell short of program leadership’s expectations,
especially in the provision of work-based learning and/or providing jobs for training graduates.
Employer partners provided input on program design and curricula and participated in advisory groups and career and job awareness activities. Although the programs developed strong partnerships with employers for training incumbent workers (who were not part of the RCT),16 the programs were largely unable to induce employers to provide internships or apprenticeships for training participants, nor were employers willing to give hiring preferences to training graduates. Staff persons across all five TechHire and SWFI programs noted that employers wanted to hire people with experience, not those fresh from a training class. Staff had hoped that work-based learning opportunities, such as internships and apprenticeships, would provide relevant job experiences to their training graduates, but employers ultimately did not provide many of these types of work-based learning experiences.17 The lack of job developers among program staff in all but one site further limited connections with employers.
14 The COVID-19 pandemic may have had an affect on individual’s ability to obtain child care, or on the likelihood
individuals used child care. The Wave 2 Survey will provide some insight into whether individuals had child care-related issues as a result of the pandemic and if so, whether those child care-related issues affected individuals ability to work.
15 Because only the SWFI programs specifically targeted parents and were designed to provide child care assistance to participants, the impacts related to child care arrangements and assistance discussed here are only among individuals randomly assigned at the two SWFI programs. This is one of the study’s key subgroups. In general, the impacts on child care arrangements and assistance among the pooled sample are consistent but smaller.
16 Incumbent workers in TechHire and SWFI were people who were already employed in the industry and sent to the programs by their employers for training.
17 The NYC TechHire program reported that 35 students participated in paid internships through TechHire and found them to be beneficial in preparing for employment. Some of these students were hired by their internship site. For others, according to a program administrator, the applied experience in the internship gave students the confidence they needed to obtain training-related employment and to pass technical interviews.

Implementation and Early Impacts Report xvii
Career Awareness, Job Development, and Job Placement • Career awareness, job development, and job placement services were not fully developed or
integrated with other components of the TechHire and SWFI programs.
Staffing limitations minimized the attention given to preparing and supporting participants in their job searches post-training. One program spent much of its first two weeks of each training cohort focused on career awareness and job readiness activities, but it did not have job developers on staff to help when students were ready to look for jobs. Only one program had a dedicated job developer for the duration of its training program. Case managers often filled in or were asked to handle these functions. Staff mentioned that some instructors helped students make connections with employers. Staff at a few colleges spoke of the difficulty getting participants to communicate with them once training ended. These programs had few opportunities post-training to work with participants and prepare them for employment.
Labor Market Outcomes • As expected, given the short follow-up period captured by the Wave 1 survey (7 to
14 months), there is no evidence yet that TechHire/SWFI affected labor market outcomes.18 However, the impacts on participation in and completion of occupational skills training, including the impact on the study’s confirmatory outcome, provide a reason to be cautiously optimistic about longer-term impacts on employment and earnings emerging.
It is unclear at this point whether the short-term training impacts will hold in the long term and whether they will translate into impacts on employment and earnings. Past research has shown that it can take up to two or even three years before economic impacts begin to emerge.19 This is well beyond the follow-up period covered in this report. The Wave 2 survey (which will capture a roughly 18-month follow-up period) will provide more evidence on how many participants complete training and succeed in obtaining jobs.
Based on the implementation findings, there are reasons both within and outside the programs’ control that TechHire/SWFI may or may not produce impacts on labor market outcomes. As noted above, these programs lacked dedicated job developers, struggled to provide internships or other work-based learning opportunities, and generally lacked employers’ commitment to hire training graduates. Three programs discussed the fact that entry-level jobs in these industries, jobs for which the training they provided prepared individuals, were drying up. On the other hand, case managers provided individualized support that seemed to help participants persist in training, and that could potentially help them become job-ready in other ways, and instructors and other staff sometimes took on the role of job developer.
18 The labor market outcomes for some individuals were measured during the economic recession that resulted from the
COVID-19 pandemic. This could have affected the likelihood that individuals were able to obtain jobs and the types of jobs that individuals obtained. The Wave 2 Survey will provide more evidence on whether individuals were unable to find jobs or lost their jobs as a result of the COVID-19 pandemic, and whether the TechHire and SWFI programs had an effect on these outcomes.
19 David Card, Jochen Kluve, and Andrea Weber, “What Works? A Meta Analysis of Recent Active Labor Market Program Evaluations,” What Works? A Meta Analysis of Recent Active Labor Market Program Evaluations 16, 3 (2018): 894–931; Kelsey Schaberg, Can Sector Strategies Promote Longer-Term Effects? Three-Year Impacts from the WorkAdvance Demonstration (New York: MDRC, 2017).

Implementation and Early Impacts Report xviii
Future Reports Future reports, using data with up to three years of follow-up, will assess whether the increase in training participation will translate into an increase in employment and earnings. Another question that will continue to be explored is to what extent TechHire and SWFI participants can find entry-level, middle- or high-skilled jobs in high-growth sectors and whether entry-level jobs offer pathways into well-paying, middle- or high-skilled jobs.

Implementation and Early Impacts Report 1-1
1. Introduction
The H-1B visa program, established in 1990 by Congress, allows employers to hire individuals from outside the United States to work in “specialty occupations” (such as science, technology, engineering, mathematics, health care, business, financial services, or life sciences) on a temporary basis. In 1998, a user fee was added to fund scholarship and training programs that develop the skills of the existing U.S. workforce in high-demand fields that employ large numbers of H-1B workers. Those fees have underwritten more than $1 billion for technical skills training programs, managed by the U.S. Department of Labor (U.S. DOL), designed to reduce or replace the need for importing skilled labor from other countries.
Two grant programs funded under this authority and administered by the U.S. DOL, launched in 2015 by President Barack Obama, are H-1B TechHire Partnership Grants (TechHire) and the Strengthening Working Families Initiative (SWFI). These grant programs were designed to provide funding, through a competitive application process, for programs that would make training more accessible to individuals who might otherwise experience barriers to training; provide support services that address the unique and varied challenges facing people who have barriers to employment; and offer a range of training strategies, including accelerated training and online options, to address skills deficits, especially for populations that could not afford to drop out of the labor market for a long time to pursue traditional academic studies (see Box 1.1). These local programs were expected to prepare disadvantaged individuals for well-paying middle- and high-skilled jobs in high-growth H-1B industries. Additionally, SWFI program grantees were expected to undertake activities with key stakeholders across the child care, workforce, and human services systems to streamline access to child care for disadvantaged workers.
The opportunity to develop such programs and apply for TechHire and SWFI grants was open to partnerships consisting of workforce agencies, education and training providers, and business-related nonprofit organizations. In June 2016, the U.S. DOL Employment and Training Administration awarded 39 TechHire grants providing services in 25 states, and 14 SWFI grants providing services in 13 states. Programs were expected to operate for four years, roughly from June 2016 to June 2020.
In September 2016, the U.S. DOL Chief Evaluation Office awarded Westat, with MDRC, a contract to conduct an evaluation of the 53 TechHire and SWFI programs (the Westat/MDRC team is referred to in this report as the “evaluation team”). The evaluation comprises an outcomes and implementation study conducted by Westat of all 53 TechHire and SWFI programs, making use of surveys and interviews with program directors and key partners, as well as a randomized controlled trial (RCT) conducted by MDRC of a small subset of the programs—three TechHire programs and two SWFI programs. The RCT, described in more detail below, is assessing the extent to which TechHire and SWFI’s combination of training, case management, and support services helped people increase their employment and earnings over and above what they would have achieved in the absence of these programs. It is also looking at whether these programs led people to obtain the kinds of middle- to high-skilled jobs that the grant programs intended and to receive more support—including child care—than those who were not in the programs. The results of this evaluation, including the study of all 53 programs and the smaller RCT of five of the programs, were intended to help federal, state, and local policymakers learn whether the combinations of job training approaches, case management, and support services offered across the programs helped disadvantaged people secure employment in high-demand sectors and increase their earnings.

Implementation and Early Impacts Report 1-2
Box 1.1 Characteristics of TechHire and SWFI
TechHire • Target population: young adults ages 17 to 29 with barriers to training and employment;a or special
populations defined as individuals with disabilities, limited English proficiency, or criminal records.b • Provides accelerated learning options (such as bootcamp style programs), specialized training strategies,
support services, and other focused participant services such as networking and job search, active job development, transportation, mentoring, and financial counseling.
SWFI • Target population: low- to middle-skilled custodial parents, who are eligible to work in the United States,
with at least one dependent who is 13 years of age or younger or at least one dependent with a disability or developmental delay who may be older than 13 years of age.
• Provides training that gives entry into or promotes movement along a career pathway, as well as customized participant support services, including child care, necessary to support the successful completion of skill enhancement and job placement.
All H-1B grants require participants to be at least 17 years of age and out of secondary school, per the requirements of the American Competitiveness and Workforce Improvement Act of 1998. Notes: aFor programs targeting young adults, at least 75 percent of the participants served had to meet this requirement. The other 25 percent of participants could be unemployed, dislocated, underemployed, or incumbent workers of any age. bFor programs targeting special populations, at least 50 percent of the participants served had to meet this requirement. The other 50 percent of participants could be unemployed, underemployed, or incumbent workers. No more than 25 percent of participants could be incumbent, front-line workers.
This report focuses on the implementation and short-term impacts of TechHire and SWFI—capturing between 7 and 14 months of follow-up—in the five programs that participated in the RCT (as shown in Table 1-1). The implementation analysis explored broad research questions about how the programs were implemented and what factors facilitated or inhibited implementation. Additionally, it aimed to uncover practices the programs put in place that could help explain increased participation in and completion of training, and eventually increased employment and earnings, relative to what would have happened in the absence of the programs. Specifically, the implementation analysis examined (1) how each of the five programs in the RCT was implemented, whether and why implementation practices changed over time, how the training and services delivered by the program compared with those originally conceived in the grantee’s application, and how the TechHire and SWFI programs might differ from other programs available to potential TechHire and SWFI enrollees; (2) the extent to which various services were received by the program group; and (3) the contrast in service use between the program and control groups. The impact analysis is exploring the effects of TechHire and SWFI on participation in and completion of training, receipt of credentials, and use of child care and other services, as well as on longer-term outcomes such as employment and earnings, advancement and job quality, and other, secondary outcomes such as overall well-being, health, and housing status. Limitations of the RCT include the small sample sizes, the generalizability of findings to the broader group of 53 TechHire and SWFI programs and other similar training programs, and the short follow-up period for the current report. Additionally, findings from the implementation analysis are suggestive about what could be driving impacts, but they are not definitive. Other reports will focus on longer-term findings for the
Implementation and Early Impacts Report 1-3
RCT as well as more in-depth implementation and outcomes information about all 53 TechHire and SWFI programs.
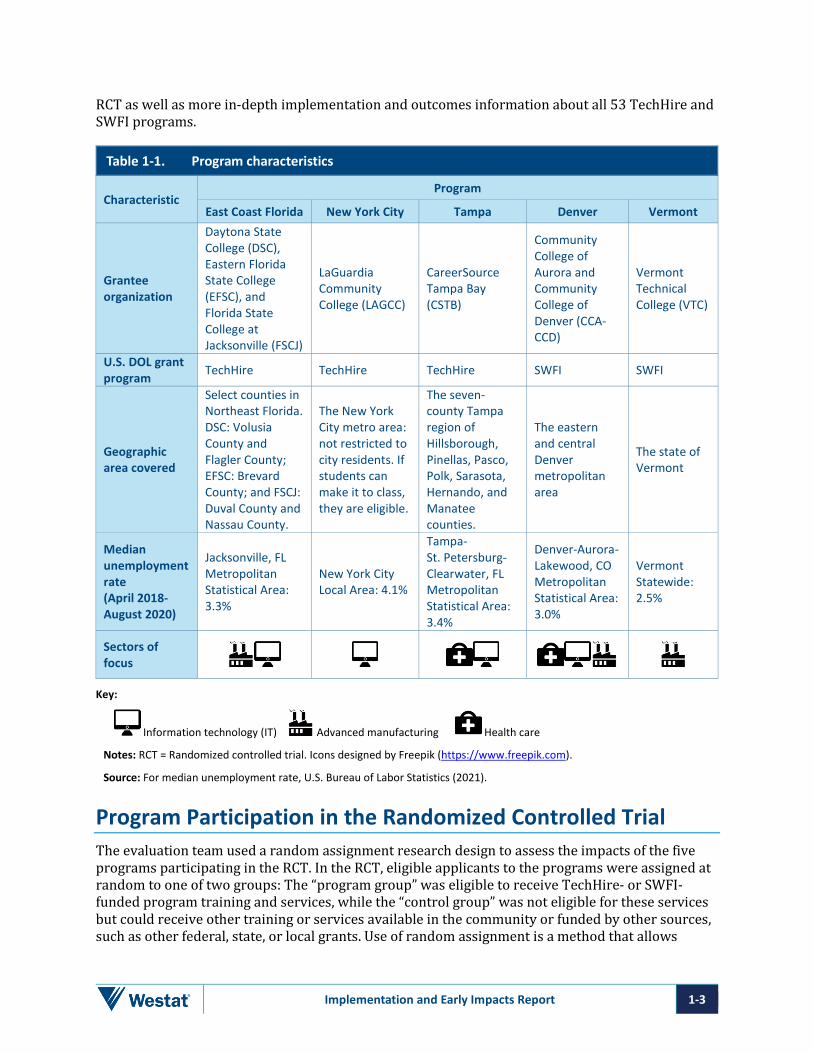
Table 1-1. Program characteristics
Characteristic Program
East Coast Florida New York City Tampa Denver Vermont
Grantee organization
Daytona State College (DSC), Eastern Florida State College (EFSC), and Florida State College at Jacksonville (FSCJ)
LaGuardia Community College (LAGCC)
CareerSource Tampa Bay (CSTB)
Community College of Aurora and Community College of Denver (CCA-CCD)
Vermont Technical College (VTC)
U.S. DOL grant program TechHire TechHire TechHire SWFI SWFI
Geographic area covered
Select counties in Northeast Florida. DSC: Volusia County and Flagler County; EFSC: Brevard County; and FSCJ: Duval County and Nassau County.
The New York City metro area: not restricted to city residents. If students can make it to class, they are eligible.
The seven-county Tampa region of Hillsborough, Pinellas, Pasco, Polk, Sarasota, Hernando, and Manatee counties.
The eastern and central Denver metropolitan area
The state of Vermont
Median unemployment rate (April 2018-August 2020)
Jacksonville, FL Metropolitan Statistical Area: 3.3%
New York City Local Area: 4.1%
Tampa-St. Petersburg-Clearwater, FL Metropolitan Statistical Area: 3.4%
Denver-Aurora-Lakewood, CO Metropolitan Statistical Area: 3.0%
Vermont Statewide: 2.5%
Sectors of focus
Key:
Information technology (IT) Advanced manufacturing Health care
Notes: RCT = Randomized controlled trial. Icons designed by Freepik (https://www.freepik.com).
Source: For median unemployment rate, U.S. Bureau of Labor Statistics (2021).
Program Participation in the Randomized Controlled Trial The evaluation team used a random assignment research design to assess the impacts of the five programs participating in the RCT. In the RCT, eligible applicants to the programs were assigned at random to one of two groups: The “program group” was eligible to receive TechHire- or SWFI-funded program training and services, while the “control group” was not eligible for these services but could receive other training or services available in the community or funded by other sources, such as other federal, state, or local grants. Use of random assignment is a method that allows

Implementation and Early Impacts Report 1-4
practitioners and policymakers to have a high degree of confidence in the results. Random assignment research designs are considered the “gold standard” because the randomization process creates two groups that are expected to be statistically alike at baseline in terms of background characteristics that could affect participants’ experiences in the programs and the outcomes they achieve. The only expected difference between these two groups is in the program services being evaluated. As a result, if sample sizes are large enough, any statistically significant differences observed between the two groups, such as differences in average levels of employment or earnings, can very likely be attributed to the program; these differences are called “impacts” or “program effects.”
To select the TechHire and SWFI programs that would participate in the RCT, beginning in the fall of 2016, the evaluation team reviewed applications from all 53 TechHire and SWFI grantee organizations. Factors considered included their program models; the types of training, support services, and, for the SWFI grantees, child care services offered; the number of participants they expected to serve and the types of participants they were hoping to recruit; and their marketing and recruitment plans, among other details. A subset of grantees was selected for phone calls with program leadership in late 2016 and early 2017 to learn more about their programs and make sure they would be a good fit for an RCT. For example, the evaluation team sought to learn whether there was enough local demand for the program such that the grantee expected to be able to recruit a sufficient research sample—that is, the number of people they were expected to serve along with a comparably sized control group that would not be served by the program. Another consideration was whether the TechHire and SWFI programs were substantially different from the kinds of training and services someone could get without access to the TechHire or SWFI programs.20 Phone calls were followed by visits in the early months of 2017 to seven programs, where again researchers aimed to learn even more about program flows and processes to help inform a decision about which programs to select for the RCT. After considering and weighing these factors, along with aiming to have some diversity among the programs in geographic location and industry, six programs were selected at the end of March 2017, and ultimately five programs agreed to be part of the RCT.21
The three TechHire and two SWFI programs selected for the RCT were notified of their selection roughly nine months after they were awarded the grants to run their programs, and the programs had already started to recruit participants and provide training. The need to recruit enough individuals for both the program and control groups and to incorporate RCT procedures into their enrollment flows required that the programs make substantial changes in their recruitment and enrollment practices—which was difficult to do given that the programs were under way and procedures were already in place. The evaluation team spent a substantial amount of time with staff from the five programs prior to the launch of the RCT, explaining how they could prepare for being part of this special study. One aspect of that preparation addressed how to handle individuals assigned to the control group. Staff had to adjust to the idea that while they could not provide program services to control group members, or at least not services funded by the program, staff could refer them to known agencies in the community for services, such as local workforce agencies. Because staff had been operating their programs for some time outside a study
20 From this point on, this report refers to TechHire and SWFI “programs” rather than “grantees,” except where the
discussion has to distinguish a program’s lead grantee from other partners or relates to its relationship of obligation to the U.S. DOL.
21 The five programs selected for the RCT are not representative of the full set of 53 TechHire and SWFI grantee organizations The findings discussed in this report, therefore, and not generalizable to all TechHire and SWFI programs.

Implementation and Early Impacts Report 1-5
environment with its attendant restrictions, that adjustment was difficult during the beginning of the RCT, even while staff generally understood and appreciated the value of learning about the overall effectiveness of the TechHire and SWFI models by participating in the RCT.
Over the first three quarters of 2018, the evaluation team trained staff at the five programs in the random assignment study’s enrollment procedures, which involved screening for program and study eligibility, obtaining the consent of eligible applicants to participate in the RCT, collecting some demographic information about them, and using MDRC’s web-based system to randomly assign them.22 The RCT officially launched at the first program in April 2018 and in all five programs by September 2018—a full two years after the programs had received their TechHire and SWFI grant awards. Later sections of this report discuss in detail the substantial marketing and recruitment efforts required to come as close as feasible to meeting study enrollment requirements. They also discuss the intake and screening procedures that preceded the random assignment of eligible individuals into either the TechHire and SWFI programs or the control group.
Data Sources and Follow-Up Period The TechHire and SWFI RCT makes use of a combination of qualitative and quantitative data and considers questions related to both program implementation and impacts. Table 1-2 lists the data sources used in the RCT, the follow-up period covered by each, and the research group(s) covered by each data source.23
Table 1-2. Data sources the TechHire and SWFI Randomized Controlled Trial (RCT)
Data source Data period Length of follow-up
Research group(s) covered Sample
size
Data used in
this report
TechHire/SWFI group
Control group
Baseline survey April 2018 – January 2020
At random assignment 949a
Qualitative interviews • Program
directors, case managers, other program staff, and program partners
Q4 2018 – Q1 2019
~6-12 months after RCT launch
• Program directors
Q1 2020 ~18-24 months after RCT launch
Participant Individual Record Layout (PIRL) data
April 2018 – June 2020 6 to 27 months 518
22 These procedures are discussed in detail later in this report. 23 The broader outcomes and implementation study of all 53 TechHire and SWFI programs is not covered in this report,
and data for that study are not included here.

Implementation and Early Impacts Report 1-6
Table 1-2. Data sources the TechHire and SWFI Randomized Controlled Trial (RCT) (continued)
Data source Data period Length of follow-up
Research group(s) covered Sample
size
Data used
in this report
TechHire/SWFI group
Control group
Wave 1 survey January 2019 – October 2020 7 to 14 months 660
Wave 2 survey October 2019 – March 2021 Around 18 months n/a
National Directory of New Hires (NDNH) data
Q2 2016 – Q1 2023
7 Qs pre-random assignment to 12 Qs post-random assignment
952
Note: a The full analysis sample is 952 individuals. Three individuals did not complete the baseline survey.
Source: Study data and MDRC calculations from study data.
For the purpose of the RCT’s impact evaluation, the study participants from the three TechHire and two SWFI programs in the RCT were pooled together; that is, individuals assigned to the program group or control group across the five programs were combined into one program group and one control group. This was done for several reasons: (1) the TechHire and SWFI programs offered a similar combination of accelerated training in the same high-tech industries with case management and support services, and (2) the number of individuals enrolled into the RCT (known as the “sample sizes”) for the TechHire programs alone or the SWFI programs alone was not large enough to be able to detect statistically significant impacts at a commonly accepted level for the two programs separately. (See Appendix B for more information.) The program group is sometimes referred to in this report as the “TechHire/SWFI group.”
A baseline survey was administered as part of the process to randomly assign eligible individuals to the RCT’s TechHire/SWFI group or control group. The Baseline Information Form (BIF) captures information on participant characteristics—including demographics, prior employment and education, and various other characteristics—at the time of random assignment. The baseline data are used to describe the study sample, refine statistical estimates (covariates), and create subgroups. (See Appendix B for more information.) Random assignment and baseline survey data collection occurred from April 2018 to January 2020.
In brief, the TechHire and SWFI programs enrolled 952 people into the RCT (known as “sample members”) with a little over half in the program group, who were eligible to receive TechHire or SWFI services, and a little less than half in the control group. As expected, TechHire sample members tended to be younger (28 versus 32 years old, on average) and were less likely to have children (18 versus 80 percent) than SWFI sample members. One quarter of sample members identified as Hispanic/Latino, 44 percent as White, and 43 percent as Black/African American, and more than 57 percent of all individuals who enrolled in the RCT were women. Only 4 percent of sample members did not have a high school diploma or GED; almost all (96%) individuals in the RCT had prior work experience, although only about half were working when they entered the study. More information about the sample characteristics is presented in Chapter 3.

Implementation and Early Impacts Report 1-7
In early 2019, after the RCT had been under way for roughly six months to nearly a year across the three TechHire and two SWFI programs, the evaluation team visited the five programs and conducted in-depth, in-person qualitative interviews with program directors, case managers, recruiters, job developers, grants managers, senior staff, and selected provider and referral partners to learn about program implementation, challenges, and promising practices. A year later, in the first quarter of 2020, researchers conducted in-depth qualitative interviews with program directors only, this time by phone.
The evaluation team collected program tracking data from the Participant Individual Record Layout (PIRL) database maintained by the U.S. DOL. All TechHire and SWFI grantees were required to report information on participants in the PIRL. These data track demographic and socioeconomic characteristics; program entry and exit; participation in training; receipt of credentials, degrees, and diplomas; and receipt of other services, including case management and assessments. The PIRL data used in this report cover program start (April 2018) through June 2020. Outcomes on participation in the TechHire and SWFI program are presented within the first six months after enrollment in the study.
The RCT’s impact analysis is assessing the impact of the TechHire and SWFI programs on participant outcomes—including their impact on participation in occupational skills training, attainment of credentials and certifications, child care assistance and services, employment and earnings, advancement and job quality, and overall well-being. These outcomes will cover both the TechHire/SWFI group and control group and will come from three sources of data:
• Wave 1 Survey. This survey was completed by individuals between 7 and 14 months after they entered the RCT. Respondents were asked about their participation in education and job training, use of child care, job readiness, and preemployment services, employment and earnings history, and perceptions of the future since random assignment. Fielding for the Wave 1 Survey lasted from January 2019 to October 2020 and, thus, the outcomes for some individuals were measured after the onset of the COVID-19 pandemic and the resulting economic recession.
• Wave 2 Survey. This survey will be completed by individuals around 18 months after random assignment. Respondents were asked questions about the same domains as captured by the Wave 1 Survey, as well as new questions related to their income, financial well-being, housing status, and criminal justice involvement.24 The Wave 2 Survey also includes questions about how the COVID-19 pandemic affected individuals training, child care, and employment situations.
• Administrative data on employment and earnings obtained from the National Directory of New Hires (NDNH): The NDNH database is maintained by the Office of Child Support Enforcement. It contains quarterly wage and employment information collected from state unemployment insurance records. The evaluation team is planning to collect employment and earnings data for up to two years pre–random assignment and up to three years post-study enrollment for all RCT participants.
24 Outcomes related to income, financial well-being, housing status, and criminal justice involvement were not included in
the Wave 1 Survey for two reasons: (1) that survey was designed to be short and a way to keep in touch with individuals in the study and (2) these outcomes were not expected to be affected in the time period covered by that survey (7 to 14 months).

Implementation and Early Impacts Report 1-2
The impact analysis in this report presents outcomes from the Wave 1 Survey only.25 The next report will present outcomes over a longer-term follow-up period; those outcomes will be drawn from the Wave 2 Survey and the NDNH data.
25 The survey achieved a 70 percent response rate overall, with a less than 1 percent differential between research
groups. The response rate was 70 percent for the TechHire/SWFI group and 69 percent for the control group. See Appendix B for more information on the Wave 1 survey.

Implementation and Early Impacts Report 2-1
2. Program Background, Design, and Implementation
The five programs in the TechHire and Strengthening Working Families Initiative (SWFI) randomized controlled trial (RCT), introduced in Chapter 1 and described in Table 1-1, were varied in their geographic context, sectors of focus, staffing structures, training, other services offered, and strategies for delivering services. They had a variety of arrangements for where their programs were housed and whether their occupational skills training was offered for credit (Appendix Table A-1). All but the Tampa program were based in colleges, three on the “academic” (for- credit) side, and one on the “workforce” or “continuing education” (noncredit) side. In Tampa, Career Source Tampa Bay, the local workforce agency, had partnerships with three colleges to deliver training (noncredit). Several of the community college–based programs delivered some parts of their training in house and partnered with either another college or external training programs to deliver other parts of their training.
This chapter describes in more detail the five programs: East Coast Florida TechHire (led by Daytona State College, with partners Eastern Florida State College, and Florida State College at Jacksonville), New York City TechHire (LaGuardia Community College), Tampa TechHire (CareerSource Tampa Bay), Denver SWFI (Community College of Aurora and Community College of Denver), and Vermont SWFI (Vermont Technical College). The chapter describes the partnerships the lead organizations established to operate their programs, their target populations, and the training and services they offered. The implementation analysis included in this chapter explored broad research questions about how the programs were implemented and what factors facilitated or inhibited implementation. Additionally, it aimed to uncover practices the programs put in place that could help explain increased participation in and completion of training, and eventually increased employment and earnings, relative to what would have happened in the absence of the programs. Specifically, the implementation analysis examined (1) how each of the five programs in the RCT was implemented, whether and why implementation practices changed over time, how the training and services delivered by the program compared with those originally conceived in the grantee’s application, and how the TechHire and SWFI programs might differ from other programs available to potential TechHire and SWFI enrollees; (2) the extent to which various services were received by the program group; and (3) the contrast in service use between the program and control groups.
Geographic Area As noted in Figure 2-1, the five programs in the RCT were quite varied in the geographic areas they were aiming to serve, from largely urban metropolitan areas in New York City, Tampa, and Denver, to a sprawling 200-mile stretch of coast in northeastern Florida spanning three community colleges, to the entire, largely rural, state of Vermont. The New York City program (at LaGuardia Community College) is located in the borough of Queens, and while most students came from Queens, anyone in the region was invited to participate; many came from Brooklyn, some from Manhattan, a few from Staten Island, and even a few came from Long Island to take part in the TechHire program. The Tampa program (led by CareerSource Tampa Bay, a workforce agency) encompassed the seven-county region of Hillsborough, Pinellas, Pasco, Polk, Sarasota, Manatee, and Hernando counties, though most outreach was done in Hillsborough and Pinellas counties. The Denver program (comprising Community College of Aurora and Community College of Denver)
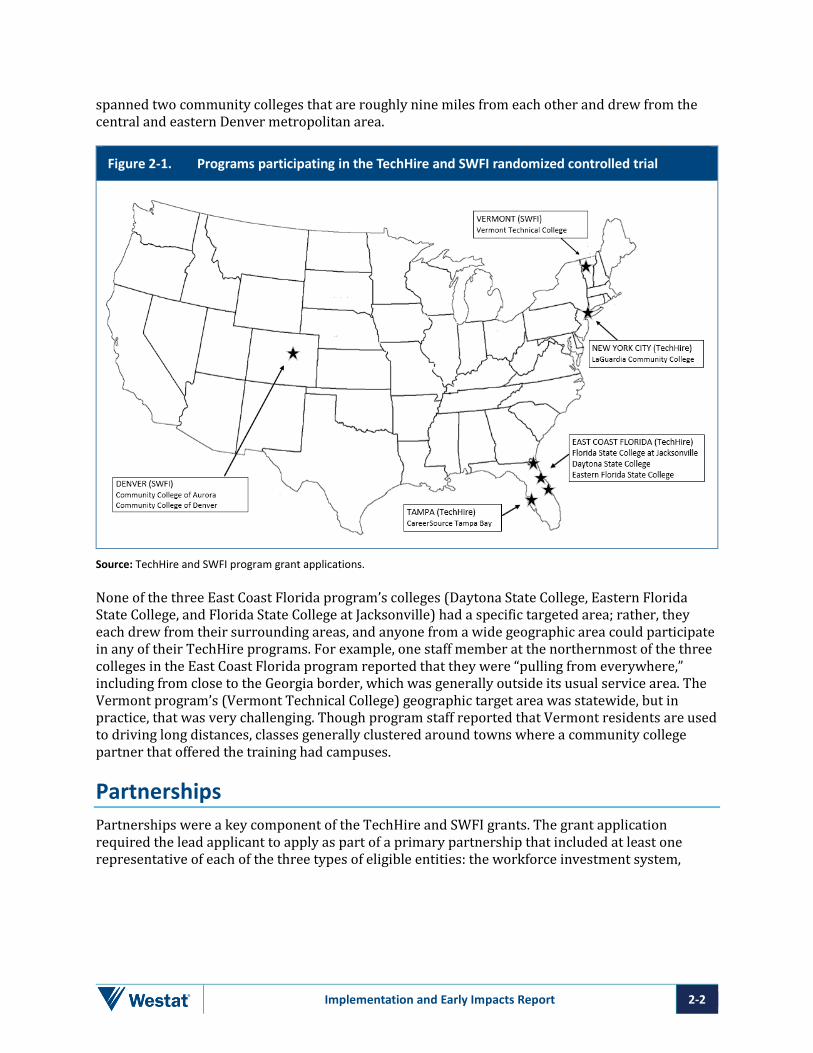
Implementation and Early Impacts Report 2-2
spanned two community colleges that are roughly nine miles from each other and drew from the central and eastern Denver metropolitan area.
Figure 2-1. Programs participating in the TechHire and SWFI randomized controlled trial
Source: TechHire and SWFI program grant applications.
None of the three East Coast Florida program’s colleges (Daytona State College, Eastern Florida State College, and Florida State College at Jacksonville) had a specific targeted area; rather, they each drew from their surrounding areas, and anyone from a wide geographic area could participate in any of their TechHire programs. For example, one staff member at the northernmost of the three colleges in the East Coast Florida program reported that they were “pulling from everywhere,” including from close to the Georgia border, which was generally outside its usual service area. The Vermont program’s (Vermont Technical College) geographic target area was statewide, but in practice, that was very challenging. Though program staff reported that Vermont residents are used to driving long distances, classes generally clustered around towns where a community college partner that offered the training had campuses.
Partnerships Partnerships were a key component of the TechHire and SWFI grants. The grant application required the lead applicant to apply as part of a primary partnership that included at least one representative of each of the three types of eligible entities: the workforce investment system,

Implementation and Early Impacts Report 2-3
education and training providers, and business-related partners.26 Furthermore, the grants required the applications to include employers with demonstrated engagement in the project and representing the H-1B occupations,27 industries, and service areas targeted through the projects. Beyond the required partners, the grants encouraged applicants to partner with a wide variety of organizations, including government agencies, community-based organizations, and faith-based organizations, among others. According to the program directors, some grantee organizations began their TechHire and SWFI programs with established partners based on prior relationships but added new partners over time. Additionally, the SWFI grant required that the grantees initiate or participate in activities that would bring together key stakeholders from various “systems”—such as the child care, workforce, and human services systems—to simplify and streamline access to services and supports that would enable low- to middle-skilled parents to successfully participate in and complete the offered training programs.
In practice, the TechHire and SWFI lead grantee organizations worked with three types of partners: referral partners (often community-based organizations that sent potential candidates to the programs), provider partners (such as other colleges and community-based service organizations), and employer partners.28 Provider and employer partners were the lead grantee organizations’ primary partners for delivery of their programs.
Education, Training, and Support Service Provider Partners Provider partners included organizations and institutions that offered training, support, or employment services. They were key to providing the core occupational skills training for the TechHire and SWFI programs and were engaged through a formal contract and paid for their services. For example, LaGuardia Community College, the lead grantee for the New York City TechHire program, partnered with three tech training companies to teach specific tech skills; Vermont Technical College, the lead grantee for the Vermont SWFI program, partnered with the Community College of Vermont to provide its Certified Production Technician training; and Career Source Tampa Bay, a workforce agency that was the lead grantee for the Tampa program, contracted with three colleges to provide its program’s skills training. The TechHire and SWFI lead grantee organizations also engaged partners to provide employment services and support services; these could include job readiness skills training, housing assistance, mental health services, food assistance, and interview clothes, among others. Denver’s SWFI program, as shown in Box 2.1, engaged partners for general workplace skills instruction and employer connections as well as support services. The SWFI grantee organizations also had child care–related partners, which will be discussed later in this chapter.
26 Business-related partners could include a business-related nonprofit organization, an organization functioning as a
workforce intermediary for the expressed purpose of serving the needs of businesses, a consortium of three or more businesses, or at least three independent businesses.
27 As noted earlier in this report, the H-1B visa program allows employers to hire individuals from outside the United States, on a temporary basis, to work in “specialty occupations,” including science, technology, engineering, mathematics, health care, business, financial services, or life sciences.
28 Referral partners are discussed below in the section of this report that focuses on recruitment and intake.

Implementation and Early Impacts Report 2-4
Box 2.1 Denver: Community College of Aurora and Community College of Denver (SWFI)
While Community College of Aurora (CCA), the lead grantee, and Community College of Denver (CCD), CCA’s sub-awardee, which both operated the Denver SWFI program, conducted occupational skills trainings themselves, other aspects of the SWFI program model were provided in partnership with off-site partners. The program relied partly on government and community-based partner organizations to refer student-parents while also soliciting internal participant referrals from the colleges. For support services, the colleges supplemented internal capacity for general workplace skills instruction and employer connections with an outside partner doing employer engagement work. While the partner’s staff member assigned to CCA came to campus, the staff assigned to CCD did not. This led to lower engagement with CCD student-parents. CCD later adapted to this implementation challenge by funneling support dollars through the partner, which gave students an incentive to go off site to pick up the money and made it more likely that they would receive services. Both colleges partnered with a local early childhood council for child care navigation services and with another organization that provided SWFI students with refurbished laptops.
Key:
= Information Technology
= Advanced Manufacturing
= Health Care
Employer Partners Employer partners were engaged for a variety of purposes. They provided a mix of labor market information, input on program design and curricula, participation in advisory or umbrella employer groups to inform the programs about emerging occupations in their industries and new training the TechHire and SWFI programs might want to develop, participation in mock interview sessions and job fairs, tours of their facilities, sessions with employees who talked with current TechHire and SWFI students about their pathway to their current employment, and, in rare instances, internship placements. These types of employer partners sometimes hired graduates, though none had committed to hiring TechHire and SWFI graduates; four of the programs had loose agreements with employers to interview and consider TechHire and SWFI students or graduates. According to program directors, most programs also had strong partnerships with employers whose employees the programs were training through the incumbent worker slots that were available through the TechHire and SWFI grants. These employees could be trained directly by the programs in the RCT without being subject to the random assignment process.29 One program started off with a strong partnership with a large employer and expected to train its employees, but those plans fell through.
29 Both the TechHire and SWFI grants stipulated that up to 25 percent of participants could be incumbent workers—that
is, employees sent to the programs by employers to enhance their skills. Incumbent workers were excluded from the randomized controlled trial. In other words, they did not go through random assignment into the program or control group; rather, they could automatically receive TechHire or SWFI services if they met the programs’ eligibility requirements.
Implementation and Early Impacts Report 2-5
One program reported having a hard time engaging employers for internship placements, even when they explained that the college would pay for the internships through the TechHire grant. But mostly, program directors across the five TechHire and SWFI programs said they had good relationships with employers and experienced few challenges. Said one program’s director, “They’re very open and honest about what works and what doesn’t. They don’t have problems telling you what’s going on, what needs to be tweaked, figuring out why something is happening.” The relationship with employers was also not one way: the TechHire and SWFI programs also provided services to employers. According to staff, those services included diversifying their workforces, providing “qualified employees who have tenacity, skill, determination, talent,” enhancing the skills of current employees, providing professional development for managers, and establishing a relationship for the employer with the programs’ colleges, beyond the TechHire and SWFI programs.
Target Population As noted earlier, to be eligible for TechHire, participants had to be young adults age 17 to 29 who were out of secondary school and had barriers to training and employment; or individuals with disabilities, limited English proficiency, or criminal records. For SWFI, participants had to be low- to middle-skilled custodial parents, who were age 17 or older and out of secondary school, eligible to work in the United States, with at least one dependent age 13 or younger or at least one dependent with a disability or developmental delay who might be older than age 13. Even though there were common eligibility criteria for the TechHire programs, and a different set of criteria common to the SWFI programs, with some similar criteria across both TechHire and SWFI, the programs interpreted barriers to employment and training needs in their own ways when designing their programs. While the programs could have targeted very similar audiences, in practice, the populations targeted for recruitment were quite varied.
For example, the Denver SWFI program reached out to current students who were parents to see whether they were eligible for SWFI, interested in health care, information technology, or advanced manufacturing, and interested in receiving the extra services that SWFI could potentially provide. It also made a point of reaching out to the broader community to recruit parents not already connected with the two colleges that partnered to offer this program—particularly parents from what SWFI leadership described as underrepresented groups—that is, groups that made up a smaller percentage at the colleges than they did in the broader community.
Likewise, the East Coast Florida TechHire program targeted underserved, disadvantaged populations in their surrounding communities—that is, people whom they identified as needing more help than they were currently receiving to address barriers—including those who were underemployed, had criminal records, or did not have a high school diploma. Staff at one of the East Coast Florida colleges noted how different the TechHire program was from previous grant-funded training programs they had operated because the “mindset” of the TechHire students was so different: As one staff member stated, “People have been told, ‘You can’t do this,’ for so long, and they do not believe they can succeed; this program shows them that they can.” Staff are there to encourage them, according to this staff member—particularly when they do not have the support of family or members of their household. Discussing their meetings with some students, one case manager noted, “Some days it feels like therapy sessions.”
According to staff from the New York City TechHire program, which offered training in information technology, students generally came into the program with more skills and education than those in some of the college’s other workforce programs, such as healthcare and construction, yet they were

Implementation and Early Impacts Report 2-6
still unemployed and underemployed. While TechHire generally aimed to attract people who were starting off with a lower skill set, the NYC TechHire participants’ barriers to employment were evidenced by the reality that they were unable to find employment or unable to find full-time employment before coming to the program. Furthermore, the NYC TechHire program targeted primarily students of color, who faced barriers to employment as a result, and who were vastly underrepresented in technology occupations in New York City. (See Box 2.2.) According to one staff member, the students “look like the college”—that is, they were immigrants, Latino, Asian, Haitian, and other students of color.
Box 2.2 New York City: LaGuardia Community College (TechHire)
LaGuardia’s training focused especially on the relatively high-paying field of web development. The boot camp–style training was usually six to nine months in a cohort-style format. The TechHire Program Director described the program’s mission as “diversifying the technology workforce. It is changing the expectations of what a tech worker could be, and creating a pathway that can allow people from these communities to get into those jobs, which wasn’t happening very much.” Staff emphasized their strong case management focus on coaching and relationship-building, as well as program-sponsored networking events built into the program. Their alumni network encourages collaboration of current and former students about program experiences and post-program activities, engaging alumni in projects and events, and sending newsletters with job postings.
Key:
= Information Technology
While applicants for the New York City TechHire program had to be unemployed or underemployed, they were required to have a high school diploma or equivalency, because program staff determined that was necessary for them to be successful in the training. The TechHire staff reported that they sometimes struggled to define “barriers to education and employment”—a requirement for the target population according to the TechHire grant: “If someone has a bachelor’s degree, do they have a barrier?” Ultimately, the New York City TechHire program was opened to people with bachelor’s degrees, as long as they could demonstrate that they were unemployed or underemployed. Staff noted that even some students with computer science degrees were not getting hired into technology jobs because they lacked practical experience—and the TechHire program, with its boot camp assignments, gave them experience that they could put on their résumés.
Targeted Industries and Training Delivered As noted earlier, the TechHire and SWFI grants were established by the U.S. Department of Labor (U.S. DOL) to encourage development of training programs in the “high-tech” industries for which many employers make use of the H-1B visa program. The five TechHire and SWFI programs in the RCT all offered training in either one or a mix of these industries. Appendix Table A-1 lists the industries that each TechHire or SWFI program targeted, the training and credentials offered, the institutions and partners delivering training, and the mode of training: in person, online, or hybrid. The New York City TechHire program focused exclusively on information technology, and the Vermont SWFI program focused exclusively on advanced manufacturing. The remaining three

Implementation and Early Impacts Report 2-7
programs offered a mix of health care, information technology, and advanced manufacturing training, including a wide variety of certificates and credentials within each of these industries.
Though the TechHire and SWFI grant programs were intended to train workers for “well-paying, middle- and high-skilled, and high-growth jobs,” in practice three of the five programs were designed and awarded to train for more entry-level jobs, though within high-tech industries.30 Those three programs discussed the fact that entry-level jobs in these industries were drying up and that the need was for more people to fill middle- and even high-skilled jobs. For example, staff at the Denver program noted that workers with specialized industry cybersecurity and network security credentials were needed in the region, but the information technology training approved for their SWFI program focused on short-term, basic certificates, rather than those credentials or degrees requiring more time for higher-skilled, higher-paying web design, cloud design, and system architecture jobs. The original project design focused on entry-level roles in high-growth career pathways with advanced and ongoing education potential; however, traditional hiring practices emphasizing experience and four-year degrees restricted available job opportunities. Similarly, Denver staff also noted that there was a strong need for people to be trained in health care professions because of the growth in the state population. The program provided multiple cohort trainings in certified nursing assistant certification for one employer partner who created advancement opportunities for housekeeping and health aide staff. However, in addition to certified nursing assistants, demand was also high for people qualified for higher-skilled occupations like nurses, radiology specialists, and doctors—training that was outside the programs approved for SWFI.
Staff from the East Coast Florida TechHire program (described in Box 2.3) discussed something similar. Several program supervisors acknowledged that while information technology was one of the high-tech industries for which training could be offered under the TechHire grant—and this program did offer information technology training—the East Coast Florida area was not a key location for the technology industry. Rather, logistics, hospitality and tourism, advanced manufacturing, and health care were the key local industries. And where the industry was looking for workers to fill information technology jobs, they were interested in candidates with higher-level certifications than the entry-level ones that TechHire offered. Additionally, technology employers wanted students who had some programming and coding background, which the TechHire training did not cover.
In the field of advanced manufacturing, which supervisors acknowledged was a growing high-demand industry, the training promoted by one of the East Coast Florida TechHire colleges did not prepare graduates for higher-level manufacturing jobs. Though the program offered training toward a Certified Production Technician certificate, the training most people pursued was just the first step toward that credential: an Occupational Safety and Health Administration (OSHA) certificate that led to entry-level positions. Most students stopped there and did not continue. As one staff member described, the jobs TechHire was preparing people for were “simple, basic jobs—[employers] watch them for punctuality, if they’re careful, etc. If employers are trying to build a safety program, OSHA30 should be okay.”
30 The Funding Opportunity Announcements defined “high-growth” jobs as those that “1) are projected to add substantial
numbers of new jobs to the economy; 2) are being transformed by technology and innovation that require workers to obtain new skill sets; and 3) have a significant impact on the economy overall or on the growth of other industries and occupations.” Definitions for middle- and high-skilled jobs were not included.
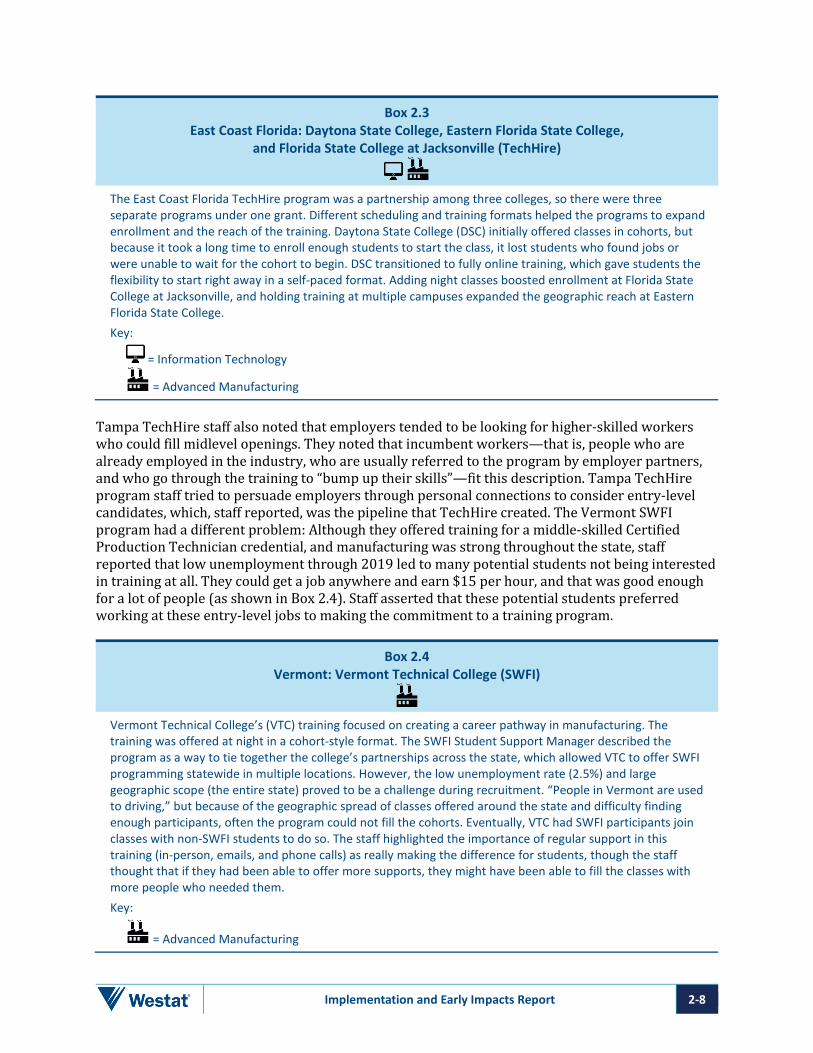
Implementation and Early Impacts Report 2-8
Box 2.3 East Coast Florida: Daytona State College, Eastern Florida State College,
and Florida State College at Jacksonville (TechHire)
The East Coast Florida TechHire program was a partnership among three colleges, so there were three separate programs under one grant. Different scheduling and training formats helped the programs to expand enrollment and the reach of the training. Daytona State College (DSC) initially offered classes in cohorts, but because it took a long time to enroll enough students to start the class, it lost students who found jobs or were unable to wait for the cohort to begin. DSC transitioned to fully online training, which gave students the flexibility to start right away in a self-paced format. Adding night classes boosted enrollment at Florida State College at Jacksonville, and holding training at multiple campuses expanded the geographic reach at Eastern Florida State College. Key:
= Information Technology
= Advanced Manufacturing
Tampa TechHire staff also noted that employers tended to be looking for higher-skilled workers who could fill midlevel openings. They noted that incumbent workers—that is, people who are already employed in the industry, who are usually referred to the program by employer partners, and who go through the training to “bump up their skills”—fit this description. Tampa TechHire program staff tried to persuade employers through personal connections to consider entry-level candidates, which, staff reported, was the pipeline that TechHire created. The Vermont SWFI program had a different problem: Although they offered training for a middle-skilled Certified Production Technician credential, and manufacturing was strong throughout the state, staff reported that low unemployment through 2019 led to many potential students not being interested in training at all. They could get a job anywhere and earn $15 per hour, and that was good enough for a lot of people (as shown in Box 2.4). Staff asserted that these potential students preferred working at these entry-level jobs to making the commitment to a training program.
Box 2.4 Vermont: Vermont Technical College (SWFI)
Vermont Technical College’s (VTC) training focused on creating a career pathway in manufacturing. The training was offered at night in a cohort-style format. The SWFI Student Support Manager described the program as a way to tie together the college’s partnerships across the state, which allowed VTC to offer SWFI programming statewide in multiple locations. However, the low unemployment rate (2.5%) and large geographic scope (the entire state) proved to be a challenge during recruitment. “People in Vermont are used to driving,” but because of the geographic spread of classes offered around the state and difficulty finding enough participants, often the program could not fill the cohorts. Eventually, VTC had SWFI participants join classes with non-SWFI students to do so. The staff highlighted the importance of regular support in this training (in-person, emails, and phone calls) as really making the difference for students, though the staff thought that if they had been able to offer more supports, they might have been able to fill the classes with more people who needed them. Key:
= Advanced Manufacturing

Implementation and Early Impacts Report 2-9
The notable exception to this pattern of offering training involving more entry-level skills was the New York City TechHire program, which trained students for high-skilled technology jobs within rapidly growing occupations, including web development and networking. Staff at this program acknowledged the challenge of moving young adults with some significant barriers to employment into these high-skilled jobs but noted that once they were employed, “they could easily earn $60,000 or more per year.” The New York City TechHire program chose to focus exclusively on the technology industry because, according to staff, its labor market research had clearly shown that over the last 5 to 10 years, New York City had established itself as a hub for technology companies, and technology jobs were growing and were expected to continue to grow—and in all sectors, not only in tech companies. According to New York City TechHire staff, there was fierce competition for talent when the economy was very strong and unemployment was low; tech companies were willing to take a chance on young students and students of color. LaGuardia Community College, operator of the New York City TechHire program, made it its mission to diversify the tech workforce, as noted earlier.
Staffing and Service Delivery All TechHire and SWFI programs had an overall program director who managed day-to-day operations of their programs and partnerships. Three programs had dedicated recruitment staff, with titles such as Recruiter or Outreach and Recruitment Coordinator (see Table 2-1), while in two programs, staff who had other responsibilities were also involved with outreach and recruitment. In one case, this staff member spent most of her time on case management and a smaller amount of time on outreach and recruitment, and in the other, the staff member spent the majority of her time on recruitment but also had a mix of other responsibilities. All the programs had someone in a case manager or coaching role, with titles such as Achievement Coach, Student Support Specialist, and Case Manager. At one program, these case manager/coaches described their role as providing “holistic support services to students: a little bit academic adviser, a little bit counselor, a little bit social service worker.” These staff would sometimes also help with outreach and recruitment or with employment preparation. Two programs began with a dedicated job developer, though one left and was not replaced. Programs also usually had a grant manager/data coordinator, who was responsible for tracking outcomes and reporting to the U.S. DOL. All programs had at least one staff member who was paid completely from the TechHire or SWFI grants and devoted 100 percent of their time to the program. Aside from the supervisors, most other positions were new and established specifically for the TechHire or SWFI programs.
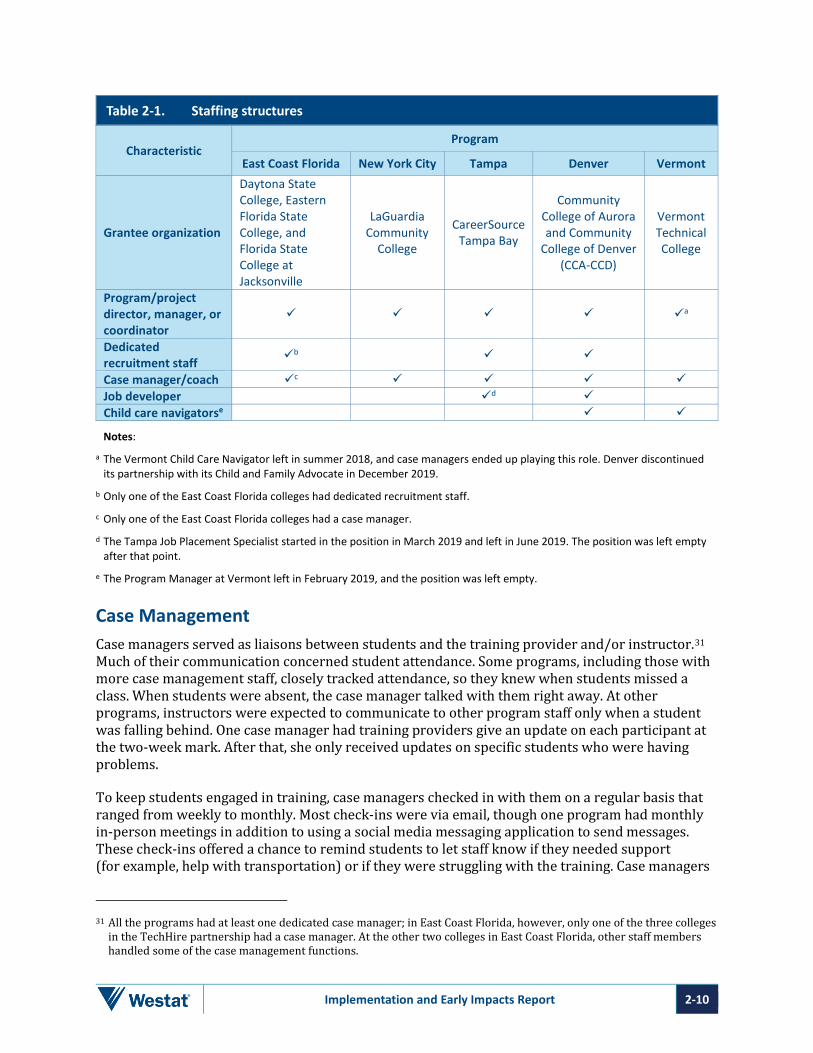
Implementation and Early Impacts Report 2-10
Table 2-1. Staffing structures
Characteristic Program
East Coast Florida New York City Tampa Denver Vermont
Grantee organization
Daytona State College, Eastern Florida State College, and Florida State College at Jacksonville
LaGuardia Community
College
CareerSource Tampa Bay
Community College of Aurora and Community
College of Denver (CCA-CCD)
Vermont Technical College
Program/project director, manager, or coordinator
a
Dedicated recruitment staff b
Case manager/coach c Job developer d Child care navigatorse
Notes:
a The Vermont Child Care Navigator left in summer 2018, and case managers ended up playing this role. Denver discontinued its partnership with its Child and Family Advocate in December 2019.
b Only one of the East Coast Florida colleges had dedicated recruitment staff.
c Only one of the East Coast Florida colleges had a case manager.
d The Tampa Job Placement Specialist started in the position in March 2019 and left in June 2019. The position was left empty after that point.
e The Program Manager at Vermont left in February 2019, and the position was left empty. Case Management Case managers served as liaisons between students and the training provider and/or instructor.31 Much of their communication concerned student attendance. Some programs, including those with more case management staff, closely tracked attendance, so they knew when students missed a class. When students were absent, the case manager talked with them right away. At other programs, instructors were expected to communicate to other program staff only when a student was falling behind. One case manager had training providers give an update on each participant at the two-week mark. After that, she only received updates on specific students who were having problems.
To keep students engaged in training, case managers checked in with them on a regular basis that ranged from weekly to monthly. Most check-ins were via email, though one program had monthly in-person meetings in addition to using a social media messaging application to send messages. These check-ins offered a chance to remind students to let staff know if they needed support (for example, help with transportation) or if they were struggling with the training. Case managers
31 All the programs had at least one dedicated case manager; in East Coast Florida, however, only one of the three colleges
in the TechHire partnership had a case manager. At the other two colleges in East Coast Florida, other staff members handled some of the case management functions.
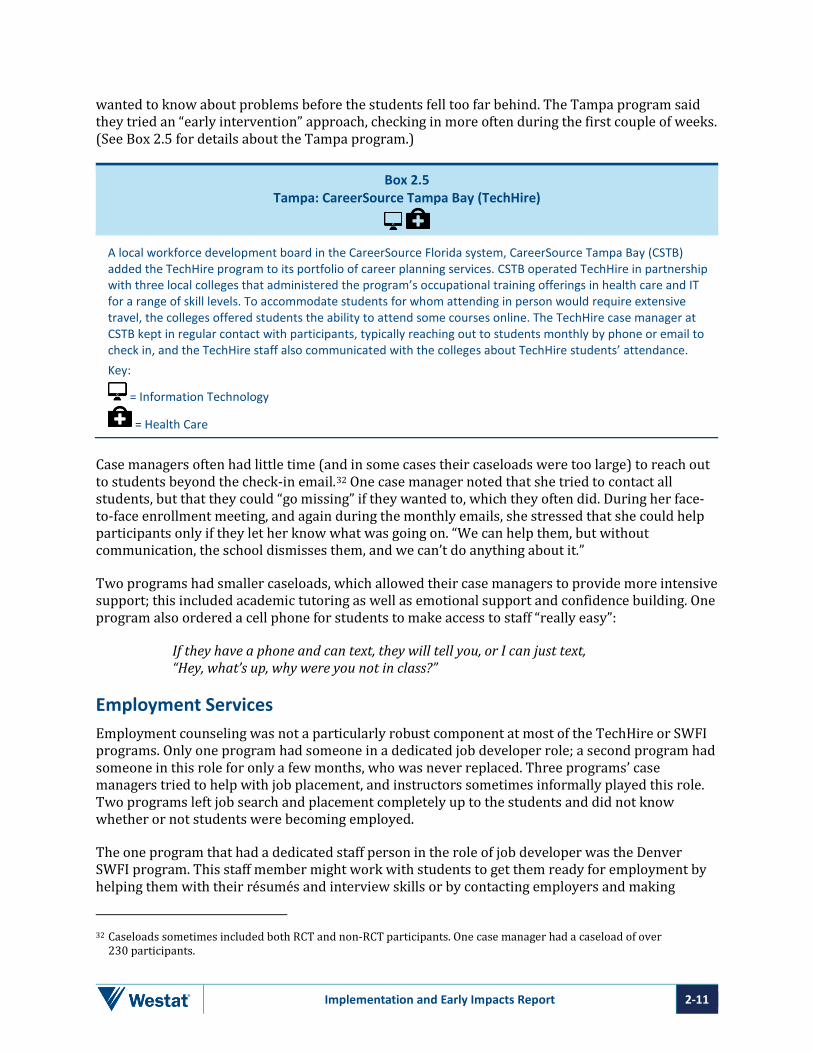
Implementation and Early Impacts Report 2-11
wanted to know about problems before the students fell too far behind. The Tampa program said they tried an “early intervention” approach, checking in more often during the first couple of weeks. (See Box 2.5 for details about the Tampa program.)
Box 2.5 Tampa: CareerSource Tampa Bay (TechHire)
A local workforce development board in the CareerSource Florida system, CareerSource Tampa Bay (CSTB) added the TechHire program to its portfolio of career planning services. CSTB operated TechHire in partnership with three local colleges that administered the program’s occupational training offerings in health care and IT for a range of skill levels. To accommodate students for whom attending in person would require extensive travel, the colleges offered students the ability to attend some courses online. The TechHire case manager at CSTB kept in regular contact with participants, typically reaching out to students monthly by phone or email to check in, and the TechHire staff also communicated with the colleges about TechHire students’ attendance. Key:
= Information Technology
= Health Care
Case managers often had little time (and in some cases their caseloads were too large) to reach out to students beyond the check-in email.32 One case manager noted that she tried to contact all students, but that they could “go missing” if they wanted to, which they often did. During her face-to-face enrollment meeting, and again during the monthly emails, she stressed that she could help participants only if they let her know what was going on. “We can help them, but without communication, the school dismisses them, and we can’t do anything about it.”
Two programs had smaller caseloads, which allowed their case managers to provide more intensive support; this included academic tutoring as well as emotional support and confidence building. One program also ordered a cell phone for students to make access to staff “really easy”:
If they have a phone and can text, they will tell you, or I can just text, “Hey, what’s up, why were you not in class?”
Employment Services Employment counseling was not a particularly robust component at most of the TechHire or SWFI programs. Only one program had someone in a dedicated job developer role; a second program had someone in this role for only a few months, who was never replaced. Three programs’ case managers tried to help with job placement, and instructors sometimes informally played this role. Two programs left job search and placement completely up to the students and did not know whether or not students were becoming employed.
The one program that had a dedicated staff person in the role of job developer was the Denver SWFI program. This staff member might work with students to get them ready for employment by helping them with their résumés and interview skills or by contacting employers and making
32 Caseloads sometimes included both RCT and non-RCT participants. One case manager had a caseload of over
230 participants.

Implementation and Early Impacts Report 2-12
matches with SWFI program graduates. The Tampa TechHire program had a job placement specialist for a few months in 2019 who was never replaced; the case manager took on many of these responsibilities. Staff at the New York City TechHire program noted that they had expected their training provider partners to provide more intensive job development and placement services, but that did not materialize. Instead, TechHire graduates could work with the college’s general Career Development Center. The Center’s Employer Relations Specialist did spend time reaching out to tech employers, but her role was spread across all continuing education programs at the college. TechHire staff in New York City expressed a desire for a dedicated TechHire job placement/employer relations specialist who could work more closely with tech employers and TechHire graduates.
Other programs also either had TechHire or SWFI students work with their general career services offices or used career services to reach out to employers for the program. For example, the Tampa program’s general business services staff worked on recruiting employers for all training programs affiliated with Career Source Tampa Bay, the workforce agency that was the home of Tampa’s TechHire program. In some cases, as in Denver, instructors played an informal role in connecting students to employers.
Delivery of Child Care Services and Child Care Systems-Level Activities SWFI grantees were encouraged to increase access to child care resources by establishing a “navigator” role within the SWFI program—that is, a staff person whose role was to help students navigate what could be complex systems to find quality child care at the times and locations they needed and to apply for and receive any state or county child care funding for which they might be eligible. The two SWFI programs in the RCT, Denver and Vermont, had planned for, and initially had, staff (or partners with staff) devoted to child care system navigation, per the SWFI grant expectations. However, at one program the child care navigator left her position, and efforts to replace her were unsuccessful, while at the other program the arrangement with a partner to provide these services ultimately did not work out. Eventually, the case managers at these programs ended up fulfilling this role, in addition to their other duties.
The Denver SWFI program initially had two child care navigators, one at each of the colleges, provided by a community-based early childhood partner. By design, the navigators were hired and managed by a local early childhood council partner to maximize access to child care resources and expertise that the colleges lacked internally. But in early 2019, the SWFI program and partner determined that the arrangement was not working as they had hoped. Together with the partner, the Denver program put in place an alternative strategy to deliver similar services, but ultimately. the formal relationship with that partner terminated at the end of 2019. Following the termination of the partnership, the SWFI program continued to promote child care navigation supports, as well as county child care subsidies, through the achievement coaches, which was viewed as an important institutionalization and sustainability strategy. The program also provided emergency funding for families if there was a gap in child care arrangements during the process of securing publicly subsidized childcare. As one staff member described, “As staff [the achievement coaches] got more comfortable with these processes, they became more empowered.” Acknowledging the challenges, staff felt that the Denver SWFI program was able to provide some helpful guidance about child care, but they were not able to provide the kind of robust assistance they had initially planned.
The Vermont SWFI program also originally had a child care liaison housed at the Department for Children and Families, Child Development Division. She had substantial knowledge of child care

Implementation and Early Impacts Report 2-13
issues and worked part time for the Child Development Division and part time for SWFI as the navigator. This child care liaison left that position, and there was an unsuccessful attempt to replace her. Ultimately, the Student Support Specialist at the Vermont program added child care navigation to her other responsibilities.
The loss of these dedicated child care navigators may not have had as much of an effect on students’ lives as might be expected, because the need for child care services in both SWFI programs turned out to be much lower than anticipated. A case manager at the Denver program reported that staff asked every student about their child care needs but that students generally reported not needing assistance. A manager at the Denver program agreed and reported that most students had informal child care that worked well while they were in training.33 When they really needed to move to formal, more consistent, and longer-term child care was when they became employed, but SWFI could not work with students after they completed training.
If the Denver SWFI staff had been able to connect more students to formal child care and enroll them in the county’s Child Care Assistance Program (CCAP, the county child care subsidy) while they were in training, this child care and subsidy could have carried over once the students became employed. Though the Denver SWFI program had intended to do this, the two colleges that made up the program had different experiences connecting students to CCAP and formal care. While the program director at one college reported having some success, the other struggled to make these connections. A variety of challenges prevented the program from connecting more students to CCAP-funded care: The primary difficulty was that student-parents mainly used “friend, family and neighbor” providers who were unlicensed and therefore not able to accept the CCAP payments. In many cases, the private homes where informal care took place could not meet building and fire code regulations, such as the requirement to have fire sprinklers, which hindered their ability to become licensed. Additionally, some SWFI staff spoke of having a difficult time navigating what they experienced as a bureaucratic CCAP system to help SWFI participants get the services they needed. Knowledge of that system was a strength of the partner that was originally engaged by the SWFI program to provide navigation services to student-parents, but it was not an area of expertise for the SWFI staff, who took over these responsibilities after that partnership ended.
Vermont’s SWFI program reported something similar: Though they asked students about child care needs, most students reported not needing formal child care because they relied on family, neighbors, the child’s other parent, or friends. For SWFI participants who did want formal child care, it was generally not available at the times when they needed it, which was usually in the evening. There was very little formal child care past 6 p.m., and most SWFI classes started at that time. In fact, during the program’s first year, it had never offered a daytime class. Additionally, SWFI could assist only with formal, registered child care providers. The Student Support Specialist described one situation in which the program was unable to help: “I had one student … whose mom was helping her out; she lost that help when her mom got a job. She wanted her sister to do the child care and wanted to pay her, but SWFI couldn’t pay for that because she’s not an approved child care provider.”
33 A Denver SWFI program manager reported that there were some differences across the two colleges that made up the
Denver program in the need for and use of child care services. Students at the Community College of Denver (CCD) used more formal, licensed providers, whereas Community College of Aurora (CCA) students tended to use more informal care options. Similarly, CCA students took greater advantage of child care navigation services and funding resources than CCD students.

Implementation and Early Impacts Report 2-14
As noted earlier, the SWFI grant required that the grantees initiate or participate in activities that would bring together key stakeholders from various systems—such as the child care, workforce, and human services systems—to simplify and streamline access to services and supports that would enable low- to middle-skilled parents to successfully participate in and complete the offered training programs. These activities are often referred to as “systems-level” or “systems-change” activities. In Vermont, systems-level activities were already under way before SWFI. The policy director for the Child Development Division reported that Vermont had already brought stakeholders together to focus on quality, affordability, and availability of child care. While much attention had already been paid to quality and affordability, new attention was starting to be paid to availability—or, more precisely, the lack of availability of formal child care in much of Vermont, especially outside normal business hours. This was precisely the challenge that SWFI participants reported experiencing. The original child care liaison was in a good position to bring the real-world experiences of low-skilled parents seeking training to these systems-change conversations, and then to bring information about resources that did exist back to the SWFI program. But when she left, the Child Development Division was unable to find a replacement for her, and the Vermont SWFI program became less connected to any systems-change activities that were still taking place.
The Denver SWFI program set up a substantial infrastructure for effecting change in child care systems and made progress during the grant period. With SWFI grant dollars and funds from Gary Community Investments/The Piton Foundation, the Denver SWFI program grant lead (Community College of Aurora) and the Colorado Department of Human Services (CDHS) led the formation of the Denver SWFI Learning Community, which brought together regional partners to identify systemic barriers to and potential solutions for providing child care to low-income parents striving to secure employment or advance in their careers. The Learning Community first met in June 2017 and continued to meet quarterly until March 2020, when the effects of the COVID-19 pandemic overwhelmed the partnership’s staff with other priorities. The Learning Community did reconvene in September 2020 for a final meeting and celebration. In the first year of its convening, the Learning Community established four core strategies for its work: increasing the affordability and financial viability of child care, creating policy solutions that expand access to quality child care, expanding availability of quality child care, and increasing awareness of quality child care options. At the March 2018 convening, the Learning Community formed four action teams, one to correspond to each of the core strategies.
The action teams and their constituent partners pursued these goals in diverse ways. One urged CDHS to make the Colorado Shines website (an online state repository of child care providers) more user-friendly so that parents or caregivers could more easily find information on providers. This team also developed a comprehensive child care resource and referral guide to sustain child care navigation support after the grant ended and to bolster the capacity of community referral partners. Another team tracked proposed legislation and existing policy, such as local fire codes, which, as written, prevented some in-home child care providers from accepting or adding clients and limited their ability to become licensed and thereby accept CCAP payments. A third team identified the need to expand available care focusing on informal and home-based providers and launched a new nonprofit organization called Springboard Child Care to provide co-working space as well as business coaching, licensing and technology support to grow home-based providers in underserved parts of the college’s community.

Implementation and Early Impacts Report 2-15
Support Services In addition to skills training, case management, and, in the SWFI programs, child care assistance, the TechHire and SWFI programs also offered financial support services. Transportation help in the form of bus passes was the support most commonly mentioned by staff. Denver SWFI staff noted that not all participants lived on a bus line; on occasion, they referred participants to a nonprofit that pays for vehicle repairs. New York City TechHire staff said that the vast majority of students needed help paying for subway Metrocards; they eventually provided some students with assistance through funds from another source. Vermont SWFI staff received many requests for help with transportation, which they were able to address through a nonprofit that uses donated vans to bring individuals to and from training. Tampa’s TechHire program had $100 gift cards available to support participants, usually used to help pay for transportation, though staff estimated that less than 5 percent of participants received those gift cards.
Through referrals to other departments or nonprofits, programs helped participants to meet a variety of needs: for work clothes, books, food, and legal help, such as with evictions and immigration. Vermont’s SWFI program helped participants by providing refurbished laptops and internet access. The colleges that hosted all but one of the TechHire and SWFI programs noted that TechHire and SWFI students had access to everything that students in academic degree programs had, such as libraries, computer labs, study skills help, and counselors.
Though help with supports such as transportation costs and food assistance was available, in at least one program it seemed that few participants received it. One staff member said that “the program is not set up to help participants overcome obstacles beyond providing the money needed to pay for the training.” Participants in this program were told they could receive support services at the time they enrolled in the program, but the staff did not advertise that assistance was available. Instead, they waited until participants came to them for help.

Implementation and Early Impacts Report 3-1
3. Randomized Controlled Trial Flow, Baseline Characteristics, and Program Participation
Before receiving program services, the TechHire and the Strengthening Working Families Initiative (SWFI) programs in the randomized controlled trial (RCT) had to set a target number of people to enroll; develop and execute recruitment strategies; bring people into their programs to assess their interest, eligibility, and suitability for the training programs; collect baseline information about them; and follow the procedures to randomly assign them into either the TechHire/SWFI (program) group or the control group. This chapter describes these processes, as well as the baseline characteristics of the sample members who ended up enrolling in the RCT and the participation patterns of the program group.
Participant Recruitment Recruitment Goals In consultation with senior staff at each program, the evaluation team developed targets for the number of individuals to be enrolled in the RCT. These targets were based on the number of individuals the programs expected to serve.34 In total, the TechHire and SWFI programs aimed to enroll nearly 1,500 participants in the RCT, with a little more than half being assigned at random into the TechHire/SWFI group (518 individuals) and a little less than half into the control group (434 individuals). (Table 3-1 shows the RCT target sample sizes and the total number of individuals who were ultimately enrolled in the RCT.) Enrollment in the RCT started between April 2018 and August 2018 and continued in the last program until early 2020.
Table 3-1. Randomized controlled trial program sample sizes and enrollment targets
Program RCT Target sample size
Total enrolled in RCT
TechHire/SWFI group Control group Total East Coast Floridaa 240 121 119 240 New York City 250 77 43 120 Tampab 300 150 149 299 Denverc 444 129 84 213 Vermont 200 41 39 80 Total 1,434 518 434 952
Notes: RCT = Randomized controlled trial.
a The colleges in this consortium split the target sample size evenly across the three colleges.
b The original sample target for Tampa was 600.
c The colleges in this consortium split the target sample size evenly across the two colleges.
34 During the analysis planning phase, the study team calculated the minimum detectable effect sizes for various expected
sample sizes. This was also taking into consideration when developing the sample size targets for each site.

Implementation and Early Impacts Report 3-2
Recruitment Strategies Before offering TechHire or SWFI training and other services, the five TechHire and SWFI programs in the RCT had to publicize their programs and recruit eligible individuals. Programs marketed and publicized their training opportunities and then identified, from among individuals who expressed interest, those who met the eligibility criteria. Getting the word out was a critical first step in reaching program and RCT enrollment goals. As one TechHire staff member noted, “[We] focused everything on recruiting, because we don’t have a program if we don’t have students.”
Recruiting eligible participants for programs such as TechHire and SWFI could be challenging.35 Programs’ recruitment challenges intensified when they were selected for the RCT roughly nine months after being awarded their grants to start their programs. In their grant applications to the U.S. Department of Labor, programs set a target number of individuals they planned to serve. These expectations about the number of participants did not change as a result of the RCT. But, for a period that was slated to last about 15 months, these programs were asked to recruit twice the number of eligible individuals they had planned to serve—half would be assigned at random to the TechHire/SWFI group and half to the control group.36 So, for example, instead of recruiting and serving between 100 and 200 individuals, as most of the RCT programs had planned, they had to recruit between 200 and 400 eligible people, depending on the program. This section describes the processes by which the programs recruited and enrolled participants.
Nearly all outreach publicized that the TechHire and SWFI programs’ training was “free” or at no cost to the individual. One program initially used the word “scholarship” in its marketing efforts, but staff reported that this confused applicants, so they changed the wording to “free training.” Several staff indicated that “free training” was not as easy a sell as they had expected. One staff member, surprised that the most common reaction was instant suspicion, said that individuals were often hesitant to move forward until they trusted that there would not be any strings attached and that they would not be charged later. Another staff member said most of the initial meetings with applicants involved convincing them that the training really would be free.
Staff members also pitched that the training could lead to a new job in a relatively short time. Several programs appealed to those who were currently working but were underemployed in dead-end jobs, by explaining that the training could fit into anyone’s schedule—including one of the East Coast Florida colleges (Daytona State College) that offered self-paced, completely online training and another (Florida State College at Jacksonville) that offered evening and weekend classes.
Community Outreach Networking was an important outreach strategy. A staff member from one of the East Coast Florida TechHire programs acknowledged that their program started “at square one” in terms of recruitment, and some of their earliest marketing attempts were one-on-one contacts. If someone looked like a good employee, they would hand the person a flyer. They handed out flyers at Walmart and at the beach near a youth camp. A staff member at one program used an acquaintance who is a barber to get the word out. Seeking individuals interested in information technology, some TechHire staff members from the Tampa program posted flyers at internet cafés and gaming spots.
35 James Bell Associates (2010); Wulfsohn, Gaubert, and Wharton-Fields (2019); Molina and Wharton-Fields (2019). 36 The RCT did require extra staff effort, and the five TechHire and SWFI programs each received a payment from the
evaluation funds that could be used to support that effort. For example, some programs used these funds to purchase advertising for their programs.

Implementation and Early Impacts Report 3-3
The Vermont SWFI program posted flyers in popular bars and restaurants where potential students might congregate.
Over time, programs moved away from individual, one-on-one recruiting to reach out more to businesses and nonprofit organizations with a more efficient and effective marketing approach. Networking within their own college community was also helpful. For instance, academic advisers at the Denver SWFI program referred parents to the program. Staff at this program also worked with the Student Life Department and posted flyers on college bulletin boards. One TechHire program staff member spoke about making sure that all departments in the college that interacted with TechHire were kept updated about the program, and this helped to get the word out.
TechHire and SWFI program staff made presentations to a mix of businesses and nonprofit organizations—for example, women’s centers, YMCAs, Boys and Girls clubs, libraries, and church groups—to encourage these organizations to refer people to them. TechHire and SWFI staff drew on existing relationships, but for the most part, they worked to establish new ones. One of the East Coast Florida TechHire programs placed an emphasis on developing relationships with transitional housing programs that required their residents to be either working or in an education or training program. TechHire was marketed to this group as a way to fulfill that requirement . These were new relationships, and it took a while to learn which partners “to focus on and which ones not to.” The Vermont SWFI program had an arrangement with one of its grant partners—a statewide organization that provided adult basic education—to recruit potential SWFI students and refer them to the program. The program reached out to community organizations via email and phone and by knocking on doors. One recruiter said that she and her program director met for weekly strategy sessions, and then she spent two days in the office and two days out in the community every week.
Networking also included contacting employers and the local workforce agency to build relationships. Businesses were often targeted for recruiting incumbent workers (who, as noted earlier, were not required to be part of the RCT) and also with the hope of finding internships for participants. TechHire and SWFI staff also attended school open houses, tech “meet-ups,” and other events where they could meet potential students. They visited job fairs to put out the message, “I’m not hiring, but we have training that will put you in the job market soon.” The Tampa TechHire program said that its top recruitment strategy was holding recruitment and enrollment events at training partners where students were enrolled “on the spot.”
Over time, word of mouth was reportedly one of the most useful ways that new applicants found their way to the TechHire and SWFI programs. It was especially helpful coming from graduates or people currently in the programs. Staff members at one of the East Coast Florida colleges remarked on the “social aspect” of outreach; for example, they found parents who heard about the training and passed the information along to their adult children.
Social Media and Traditional Media The popularity of social media—especially with the age group targeted for the TechHire program—meant that it was often used to market the training programs.37 The Denver and Vermont SWFI programs both used a location-based service so that ads popped up on social media apps when someone was within a geographic area near one of the colleges or training locations. One of the programs held a Facebook Live event that reached many people and led the phone to “ring off the
37 The most popular of these were Facebook and Twitter, but programs also used LinkedIn and Instagram.
Implementation and Early Impacts Report 3-4
hook for two weeks.” Another college received an influx of inquiries after posting about “free IT courses” on a “Who’s Hiring” Facebook group.
The New York City TechHire program used a targeted approach. Recognizing that they wanted to reach a population interested in information technology, they used technology-related events such as Npower, Meetups, and Women Who Code to find people who already had a demonstrated interest in technology but did not have formal training or work experience in the technology sector. Some advertising efforts tried to reach a broader audience; the Vermont SWFI program and one of the East Coast Florida TechHire colleges tried ads on local television news stations and radio. East Coast Florida TechHire also found success with highway billboards. As one staff member said, “When someone is driving or if they are stuck in traffic, they see the billboard placed on the expressway and in high traffic areas throughout the city.” TechHire staff were surprised by the hugely positive response. They described this as “not a regular billboard” that one usually sees on the highway. Staff said it was workforce-oriented with a simple message about free training and a phone number to call.
Recruitment Challenges As shown in Table 3-1, several programs had difficulty meeting their recruitment targets. At the time the programs had begun recruitment for the RCT, some were already struggling with recruitment for their programs. Program staff discussed a number of reasons for the difficulties.
Random Assignment. Because the RCT—and random assignment in particular—were introduced roughly nine months after the program and outreach were under way, some community organizations and referral partners became reluctant to refer individuals to the TechHire and SWFI programs. Understandably, these partners referred their clients to a variety of training programs and services, including TechHire and SWFI, because they felt the clients needed those services and could benefit from them. It was discouraging that under the RCT only about 50 percent of the people they referred would receive those services. In some cases, these organizations ceased referring their clients, as they preferred to send them to programs where they knew they could be served. One TechHire program experienced a decrease in referrals from a partner with strong connections to young people, which stopped telling people about the program. There was also a sense among some referral partners that random assignment was not appropriate for people with multiple or significant barriers to employment. As one partner stated, “The demographic we work with are people that face a lot of barriers, so randomly assigning them to a control group feels like a failure.” For some, worries about random assignment and recruitment proved to be unfounded. Two programs mentioned that random assignment did not deter applicants.
Staffing. Outreach and recruitment took a significant amount of time and effort. Several programs benefitted from having a dedicated staff person assigned to outreach and recruitment, consistent with findings from previous studies.38 The two programs without dedicated outreach staff had serious challenges meeting their recruitment targets. Nonetheless, having a dedicated recruiter was not sufficient. Even in the programs with dedicated recruiters, other staff members also helped with this task.
38 Wulfsohn, Gaubert, and Wharton-Fields (2019); Friend and Paulsell (2020).

Implementation and Early Impacts Report 3-5
Across the programs, at least at the beginning, staff acknowledged they lacked connections with key individuals and organizations in the community. They learned how to conduct outreach as they went along, trying different strategies to see what worked. As they developed more relationships with community agencies, applications increased. As one staff member explained:
When I started, there was no clear pathway on how to work on branding, marketing, outreach. We were kind of all over the place. Now it is clear to me that the budget for marketing has to be used efficiently. Also having good branding and good social media presence, alumni strategies.
One staff member described her program’s unconventional approach as “guerilla style” —going to places where they might find someone fitting the profile and putting up flyers, and also sending flyers to partners.
Marketing expertise can help but must be combined with knowledge about the target population. One program outsourced the TechHire marketing campaign to an external marketing company. A staff member from this program said it was helpful but not necessarily the best option:
The website flow was not good; it was not easy for those interested to figure out how to apply; and the campaign’s reach may have only reached those with higher education levels, not those who were really interested.
Local Economic Conditions. The TechHire and SWFI programs in the RCT all began to offer training during a period of low unemployment and a strong economy in 2016-2017, which affected decisions potential students made about the opportunity costs of enrolling in training. Three programs cited the low unemployment rate as a factor in recruiting fewer participants than they had expected. For example, the unemployment rate in Vermont in 2017 and 2018 was less than 3 percent. Denver and Vermont described losing potential students who found entry-level jobs that paid $15 per hour, substantially higher than Denver’s minimum wage of $9.30 per hour or Vermont’s minimum wage of $10 per hour in 2017. Community college enrollment was down across the board because, as noted earlier, potential students were forgoing training for a job that was available as a result of the low unemployment rate.
The payoff from training may have been too uncertain to attract more individuals. One staff member in Vermont explained:
The population that we really need to focus on are those that are working but in fields that don’t give them the kind of job security that manufacturing could give them. It’s a hard group to recruit from. People have a job, even if it’s low pay or not secure, they just live month to month, are not looking ahead to having longevity to a career, better salary, better benefits. The state overall has tried to do a better job with promoting manufacturing, but that’s been slow to happen.
The TechHire and SWFI programs had to compete with other training and tech boot camp programs, which at least one program reported had proliferated since they applied for their grant. In addition, some programs reported a lack of interest in training among individuals in the targeted age group.

Implementation and Early Impacts Report 3-6
Intake, Assessment, and Random Assignment After marketing the programs and recruiting prospective participants, the five TechHire and SWFI programs in the RCT screened all applicants to make sure they were eligible for their respective programs. To varying degrees, the programs also assessed interest in and suitability for the training before enrolling individuals into the RCT and, if assigned to the program group, into a training course.
Although each program was different, the basic outline of the intake and assessment process included:
1. Interest form/application
2. In-person interview
3. Other program-specific screening
4. Collection of baseline information and random assignment
Step 1. An online application collected contact and other basic information and typically gave staff members a good sense of whether the individual met the TechHire or SWFI eligibility criteria.
Step 2. Staff conducted an in-person interview to determine the applicant’s interest in the training and willingness to participate in an RCT. Interviewers typically asked about applicants’ career interests and goals and tried to ascertain how much, if any, experience they had in the sector. They confirmed that applicants met the eligibility criteria and collected required documentation, such as a child’s birth certificate for SWFI applicants and proof of Selective Service registration for men. They described random assignment, explaining that applicants had a 50-50 chance of getting the training and that those assigned to the control group would receive a $50 gift card.
Interest in the type of training offered was also explored during the interview. For instance, by asking questions, the interviewer might discern whether an applicant for an information technology training course was self-taught, seeking formal certifications, or someone without experience but looking for a change and viewed technology as a career field that was on the rise. Programs preferred applicants with knowledge about the field, assuming that they would be more likely to persist and complete the training. Most programs were lenient and flexible and prevented few who expressed interest from continuing with the intake process. One TechHire staff member said that the program would let in applicants who lacked knowledge about the sector because, “you never know what could happen.” Another program diverged from the lenient attitude toward prior knowledge and suitability; this program instituted a rigorous process for determining whether it considered applicants “suitable” for the training. (See Box 3.2) Evaluations of other training programs have found that rigorous pre-screening of participants likely contributed to high rates of participation in training.39
39 See, for example, Hendra et al. (2016) and Fein and Hamadyk (2018).

Implementation and Early Impacts Report 3-7
Box 3.2 New York City Program Eligibility and Assessment
The New York City TechHire program (at LaGuardia Community College) had a rigorous process for determining whether applicants were considered “suitable” for training. They used their interview to discern genuine interest in the field. Said one administrator, “We were looking for that sweet spot of an individual interested in technology, who has attended events or looked up information online, but doesn’t have technology work experience or the training needed to land a job in the sector.” They based acceptance decisions on the interview and how the applicant talked about technology and their motivation. Speaking about a staff member who conducts the interviews, one administrator said:
She wants to see if they truly are interested in tech, or is it just because it’s a free training? She’ll ask, “Have you been to any recent hack-a-thons or meet-ups, or have you taught yourself any code? From which websites?” If they can’t really answer, or they say “YouTube,” then we know they’re not really into it. If she asks which meet-up they’ve been to, and they say, “a tech meet-up,” then she knows they’re not serious…She also asks, “If you were accepted into this program, and you completed this training, which job title would you be going for?” If they just say, “a web developer,” then she knows they don’t know the difference between front-end and back-end, etc.
The program also conducted a second assessment after random assignment into the TechHire program that consisted of a two-week trial period.* This pre-training appraisal consisted of full-day (9 a.m. to 5 p.m.) in-person career exploration and coding instruction. Led by the program’s case manager and instructor, these sessions were intended to prepare students for the information technology field and their career goals in the field. These staff assessed students on attendance, submitting assignments on time, and quality of the homework and in-class assignments. Some students left the program at this point before beginning their official TechHire training, even though they had already been assigned to the RCT’s program group. (A decision was made not to wait to conduct random assignment until after this two-week trial period, because participants would have invested too much time by that point to then be told they were assigned to the control group.) Staff found this two-week assessment useful:
It’s helpful [for the students] to have insight into the training and a chance for the staff to get to know the students. If a student has a low level of tech knowledge, it’s a chance to get their feet wet. It wouldn’t be good for a student who doesn’t have a lot of experience to jump right into the training.
__________________________
* Ideally, random assignment would have taken place after the second assessment rather than before it, so that some individuals assigned to the TechHire program group would not end up being screened out later as unsuitable and therefore be unable to continue in the program or would not decide on their own after the two-week trial period that they did not want to continue. Individuals who did not continue to participate in TechHire for these reasons are still part of the RCT’s program group and are included in the study’s measures of participants’ average rates of participation in training. Staff did not anticipate that a large number of people would be screened out by the second assessment, so conducting random assignment before the two-week trial period was determined to be the best approach.
Step 3. Programs also instituted additional screening, such as conducting criminal background checks and educational assessments. Reasons cited for many of the additional criteria referred to applicants’ abilities to get jobs post-training. Program-specific eligibility considerations included:
• High school diploma or equivalency
• Measure of math/English readiness
• No felony convictions
• No financial obligations to the college
• Live in the target area

Implementation and Early Impacts Report 3-8
Step 4. Enrollment into the RCT, including the random assignment processes, was integrated into programs’ existing procedures. In addition to meeting eligibility criteria and being interested in fields such as information technology, advanced manufacturing, or health care, applicants had to be willing to participate in random assignment. Applicants were reminded that there was no guarantee that they would end up in the TechHire or SWFI program. They completed an online baseline questionnaire and signed a form consenting to participate in the RCT. A web-based system managed by MDRC was used both to randomly assign applicants and, for most programs, to collect the data from the baseline questionnaire.40
The time that elapsed from when someone submitted an application until they were randomly assigned varied somewhat across the programs. Staff said that after they received the online application, they tried to follow up within one to two days in several programs or within two weeks at the most for another program. Once they scheduled the interview in Step 2 and the person came in, the rest of the process happened the same day. Individuals left knowing whether they were in the TechHire/SWFI group or the control group.
Individuals assigned to the TechHire/SWFI group were enrolled in a training course offered by the programs. Individuals assigned to the control group received a $50 gift card and a list of other resources in the community. In some programs, TechHire and SWFI students were placed in training cohorts only with other TechHire or SWFI students, and in other programs they could be in classes with students whose training was paid for by another grant or by their employer or who were paying their own tuition. Because control group members were free to avail themselves of any resources they found on their own in the community, it is possible that they could find their way into similar training programs. Sometimes they could even be in the same classes with program group members, but in those cases, they would not receive other supports that the TechHire or SWFI program group members were eligible to receive.
Baseline Characteristics of the Sample Ultimately, given the challenges of recruitment, the TechHire and SWFI programs enrolled 952 people into the RCT, out of the target sample size of close to 1,500, with a little over half being assigned at random to the program group (also referred to in the report as the TechHire/SWFI group) and being eligible to receive TechHire or SWFI services, and a little less than half being assigned to the control group. Table 3-2 presents selected characteristics of the individuals who enrolled in the TechHire/SWFI RCT at the time of study entry and includes both TechHire/SWFI and control group members. These average baseline characteristics are presented by program and overall. Given the variation in target populations across the TechHire and SWFI programs, as well as the differences in target sectors across all of the programs, there are differences in some of the characteristics across the programs. Various tests for baseline equivalence between the TechHire/SWFI group and the control group are discussed in Appendix B. As expected, (by virtue of the random assignment research design), there are no meaningful or systematic differences in baseline characteristics between the research groups.
40 The one exception was the Denver SWFI program. There, applicants entered only a few key identifiers—for example,
name and Social Security Number—into MDRC’s system. Applicants then completed the baseline questionnaire in an online survey tool developed and maintained by the Denver program. The same set of questions was asked to applicants. Their responses were sent to MDRC and then entered into MDRC’s random assignment database. After completing the questionnaire, applicants were randomized using MDRC’s online system.

Implementation and Early Impacts Report 3-9
As expected, TechHire sample members tended to be younger and were less likely to have children than SWFI sample members. All sample members at two of the TechHire programs—the New York City and Tampa programs—were between 17 and 29 years old (the East Coast Florida program served some older individuals in one of the special populations), while the average age of individuals from the two SWFI programs was at least 30 years old. Less than 28 percent of sample members at each of the three TechHire programs had a child at the time of entry into the RCT compared with at least three-quarters of sample members at the two SWFI programs.
One-fourth of sample members identified as Hispanic/Latino, 44 percent as White, and 43 percent as Black/African American. The majority (89%) of individuals in the RCT spoke English as their primary language, with a lower rate (73%) among individuals in the Denver program.
Over 57 percent of all individuals who enrolled in the RCT were women, although there were notable differences across the programs that may reflect the typical gender breakdown of the target sectors. The programs that targeted the health care sector (Denver and Tampa) had higher rates of women (84% and 59%), while the program that only targeted information technology (New York City) had a lower rate of women (35%).
Only 4 percent of sample members did not have a high school diploma or GED (which may reflect the screening criteria used by some programs), and 28 percent had a two- or four-year college degree. Some individuals had previously attended training in an H-1B industry, with information technology and health care being the most common (11 and 15%, respectively).

`
3-10
Table 3-2. Selected baseline characteristics for TechHire/SWFI sample members
Characteristic TechHire programs SWFI programs All programs East Coast Florida New York City Tampa Denver Vermont
TechHire/SWFI group 50.4 64.2 50.2 61.0 51.3 54.5 Demographics Average age (years) 34 25 24 31 34 29 Age (%)
17 to 24 27.9 40.8 62.2 17.6 16.3 37.1 25 to 29 20.8 59.2 37.8 29.0 20.0 32.8 30 and older 51.3 0.0 0.0 53.3 63.8 30.1
Gender (%) Male 52.5 65.5 40.1 16.2 51.9 42.1 Female 47.1 34.5 59.2 83.8 48.1 57.6 Other 0.4 0.0 0.7 0.0 0.0 0.3
Hispanic/Latino (%) 10.3 42.9 29.5 30.8 5.0 24.4 Racea (%)
White 45.9 23.5 44.2 37.5 82.1 44.2 Black/African American 48.5 27.6 49.1 48.0 7.7 42.7 Asian 5.2 30.6 6.4 5.0 6.4 8.4 Native Hawaiian or Pacific Islander 0.9 0.0 1.4 1.5 0.0 1.0 American Indian or Alaska Native 4.3 5.1 2.8 8.5 2.6 4.7 Other race 5.2 15.3 4.6 7.0 2.6 6.3
Primary spoken language is English (%) 95.4 81.9 95.3 72.9 93.8 88.6 Family status Marital status (%)
Single, never married 62.5 84.3 91.9 49.3 57.5 71.2 Married and living with spouse 2.2 1.7 1.3 4.8 5.0 2.7 Married but living apart from spouse 22.0 11.3 4.7 35.3 21.3 18.0 Legally separated, divorced, or widowed 13.4 2.6 2.0 10.6 16.3 8.1
Living with a partner (%) 17.4 10.8 12.8 14.6 30.4 15.6 Parent of one or more children under 19 (%) 27.5 0.9 16.7 73.3 98.8 37.3
Implem
entation and Early Impacts Report

`
3-11
Table 3-2. Selected baseline characteristics for TechHire/SWFI sample members (continued)
Characteristic TechHire programs SWFI programs All programs East Coast Florida New York City Tampa Denver Vermont
Education level Highest level of education attainment (%)
Less than high school diploma/GED 7.7 0.0 1.0 0.0 16.3 3.6 High school diploma 26.6 18.3 32.2 36.8 31.3 30.1 GED 8.6 8.7 5.0 13.4 11.3 8.8 Certificate from IEP 1.3 0.0 0.3 1.0 0.0 0.6 Some college/advanced training certificate 25.8 27.0 28.9 35.4 25.0 29.0 Associate’s degree 13.7 12.2 14.8 4.8 5.0 11.1 Bachelor’s degree or higher 16.3 33.9 17.8 8.6 11.3 16.8
Previously participated in training in an H-1B industry (%) Information technology 20.8 8.9 7.1 10.1 1.3 11.0 Advanced manufacturing 4.2 0.9 0.3 1.4 1.3 1.7 Health care 8.9 1.8 13.9 32.4 5.0 14.5
Employment Ever employed (%) 97.0 94.7 95.3 95.7 97.5 95.9 Currently employed (%) 55.3 48.7 47.8 56.4 30.0 50.2 Unemployed for 7 or more months (%) 11.1 12.9 14.6 17.3 36.7 16.2 Worked full time (35 or more hours) (%) 63.7 35.0 39.9 48.9 66.7 49.2 Currently or previously employed in an H-1B industry (%)
Information technology 8.8 5.5 4.4 3.5 1.3 5.1 Advanced manufacturing 3.5 0.9 0.3 1.5 7.5 2.1 Health care 4.4 2.7 11.1 23.9 7.5 10.9
Public assistance and health insurance Household public assistance receipt (%)
Food stamps/SNAP 28.3 14.2 27.1 50.5 61.3 33.8 Welfare/TANF 0.8 0.0 2.0 14.8 33.8 7.0 Medicaid 20.0 25.0 14.4 66.2 73.8 33.6 WIC 7.5 0.8 5.7 23.3 26.3 11.2 Public medical insurance for their children 2.5 0.8 1.3 8.6 66.3 8.6
Has health insurance (%) 57.7 77.8 55.1 79.7 84.8 66.5
Implem
entation and Early Impacts Report

`
3-12
Table 3-2. Selected baseline characteristics for TechHire/SWFI sample members (continued)
Characteristic TechHire programs SWFI programs All programs East Coast Florida New York City Tampa Denver Vermont
Circumstances that may affect job change or retention Child care or after-school arrangements limit type or amount of work (%) 6.9 0.0 5.4 36.4 56.3 16.5 Transportation-related issues limit ability to work (%) 18.9 5.6 12.7 23.8 33.8 17.8 Ever convicted of a crime or incarcerated (%) 18.0 0.9 5.8 11.4 34.6 11.9 Sample size 240 120 299 210 80 949
Notes: Sample sizes may vary because of missing values.
SWFI = Strengthening Working Families Initiative; GED = General Educational Development certificate; IEP = Individualized Education Program; TANF = Temporary Assistance for Needy Families; SNAP = Supplemental Nutrition Assistance Program; WIC = Women, Infants, and Children food program.
The full analysis sample is 952 individuals. Three individuals from the Denver site did not complete the Baseline Information Form.
a Respondents were allowed to select more than one response, so percentages may sum to more than 100 percent.
Source: TechHire/SWFI Baseline Information Form.
Implem
entation and Early Impacts Report

Implementation and Early Impacts Report 3-13
Almost all (96%) individuals in the RCT had work experience, although only about half were working when they entered the study. In addition, more than 16 percent of individuals had been unemployed for at least seven months before RCT entry. Eighteen percent of sample members had current or previous work experience in an H-1B industry.
Some individuals entered the RCT experiencing one or more barriers to employment. For example, around 18 percent had transportation-related problems that limited their ability to work and 12 percent had previously been convicted of a crime.
Table 3-3 shows several baseline characteristics related to parental status and child care arrangements for individuals at the two SWFI programs. Around 61 percent of individuals at both programs had a child 5 years old or younger, and 19 percent had a child with a disability or developmental delay (these children could have been of any age).
Table 3-3. Parental status and child care arrangements at baseline for SWFI sample members
Characteristic SWFI programs All SWFI programs Denver Vermont Parental status Pregnant (%) 11.2 5.0 9.4 Parent of one or more children under 19 (%) 73.3 98.8 80.3 Average number of children under 19 living with study participant 1.3 1.5 1.4
Has a child in the following age ranges living with them (%) Less than 1 year old 18.7 6.3 15.2 1 to 5 years old 44.3 50.0 45.9 6 to 13 years old 32.0 48.8 36.7 14 to 18 years old 4.9 16.3 8.1
Has a child with a disability or developmental delay (%) 11.2 30.0 19.3 Child care Has child care or after-school arrangements for their children (%) 36.8 47.5 39.8
Does not pay the full cost of child care (%) Government agency, employer, or someone else pays for part or all of child care costs 10.1 28.8 15.6
Cost of child care depends on respondent’s income 7.9 5.0 7.1 Sample size 210 80 290
Notes: Sample sizes may vary because of missing values.
SWFI = Strengthening Working Families Initiative.
Italics indicate that the metric is not among the full sample shown in the table.
Three individuals from the Denver site did not complete the Baseline Information Form.
Source: TechHire/SWFI Baseline Information Form
Almost 40 percent of individuals at the two SWFI programs already had child care or after-school arrangements in place for their children when they entered the RCT. Among individuals with child care or after-school arrangements, 16 percent reported that the government, their employer, or someone else paid at least part of their child care costs and 7 percent reported that the amount they paid in child care depended on their income.

Implementation and Early Impacts Report 3-14
Participation in TechHire and SWFI Programs As discussed, individuals who were randomly assigned into the TechHire/SWFI group were then enrolled in the programs and signed up for training. Table 3-4 shows participation in the TechHire and SWFI programs and training among TechHire/SWFI group members, within the first six months after each individual entered the program (this is referred to in this report as the “common follow-up period”).41 These outcomes are based on the Participant Individual Record Layout (PIRL) data and capture only participation in training reported by the TechHire and SWFI programs.42
Over 82 percent of the individuals who were assigned to the TechHire/SWFI group ever entered their respective TechHire or SWFI program within six months of random assignment, although the rate differed somewhat by program (from 70% in Tampa to 98% in Vermont). “Entering the program” means an individual was entered into the PIRL database and was counted as having received a grant-funded services (not necessarily training). Some individuals are not counted as entering a TechHire/SWFI program, even though they enrolled in the RCT, because they never received a grant-funded service.
Not all TechHire/SWFI group members who entered the programs started and completed training: Seventy-four percent of TechHire/SWFI group members started at least one training program, and 26 percent completed at least one training program within six months of enrolling in the RCT. Given the length of the training offered by the programs (which was more than six months in some cases) , it was assumed that not all individuals who started training would have completed it within the six-month period captured by the PIRL data.
In most cases, completion of training led to earning a certificate, credential, or degree. Some programs offered informal certificates marking completion of the training, while others offered industry-recognized certificates and credentials. Across all of the programs, 20 percent of TechHire/SWFI group members obtained a recognized diploma, degree, or credential—meaning they obtained an industry-recognized credential or certification, a certificate of completion of a registered apprenticeship, a state- or federally recognized license, or an associate’s or bachelor’s degree. This rate does not include individuals who obtained certificates for completing a program. In the case of at least one program, training met local employer demand for skilled workers, even though it did not lead to a formal, industry-recognized credential.
41 Appendix Table C-1 shows outcomes over the full follow-up period, which ranges from six to 27 months depending on
when individuals entered the RCT. 42 All of the TechHire and SWFI programs were asked to report on the same set of metrics in the PIRL that these outcomes
are based on. It is possible that some of the differences in participation rates seen across the programs are due to differences in when and for whom the programs entered information into the PIRL. Chapter 4 reports on participation using data from the Wave 1 survey for both the TechHire/SWFI group and the control group.

`
3-15
Table 3-4. Participation in TechHire and SWFI programs within 6 months of random assignment, among TechHire/SWFI group members
Outcome TechHire programs SWFI programs All programs East Coast Florida New York City Tampa Denver Vermont
Entered the program (%) 84.3 71.4 70.0 96.9 97.6 82.4 Exited the program (%) 7.4 11.7 0.0 10.9 0.0 6.2 Training servicesa (%)
Never started training 27.3 28.6 32.0 12.4 39.0 26.1 Started one or more training programs 72.7 71.4 68.0 87.6 61.0 73.9 Completed one or more training programsb 45.5 10.4 16.7 23.3 41.5 26.1 Withdrew from one or more training programsb 28.9 3.9 0.7 12.4 9.8 11.4 Received a diploma, degree, or credential from one or more training programsc 19.8 2.6 22.0 20.9 41.5 19.9
Started a training in selected occupational field (%) Computer and mathematical occupationsd 47.9 71.4 33.3 27.9 0.0 38.4 Health care occupationse 29.8 0.0 28.7 45.7 0.0 26.6
Average number of weeks enrolled in the program 18.2 15.0 14.2 24.2 25.0 18.6 Average number of months enrolled in the program 4.1 3.2 3.0 5.6 5.8 4.1 Sample size 121 77 150 129 41 518
Notes: SWFI = Strengthening Working Families Initiative.
a The PIRL data captured up to three trainings. 8.5 percent of TechHire/SWFI group members in the full sample enrolled in more than one training.
b “Completed training” and “Withdrew from training” are not mutually exclusive outcomes. These outcomes show rates of experiences across all of the training programs participants attended. Additionally, some participants were likely attending training at the end of the follow-up period, but data were not available to measure current enrollment in training.
c This outcome captures receipt of an industry-recognized credential or certification, a certification of completion of a registered apprenticeship, a state- or federally recognized license, or an associate’s or bachelor’s degree.
d Training for this major occupational group includes Information Technology (IT) training.
e This outcome includes training targeting two major occupational groups: (1) Health Care Practitioners and Technical Occupations and (2) Health Care Support Occupations.
Source: U.S. Department of Labor Participant Individual Record Layout (PIRL) data.
Implem
entation and Early Impacts Report
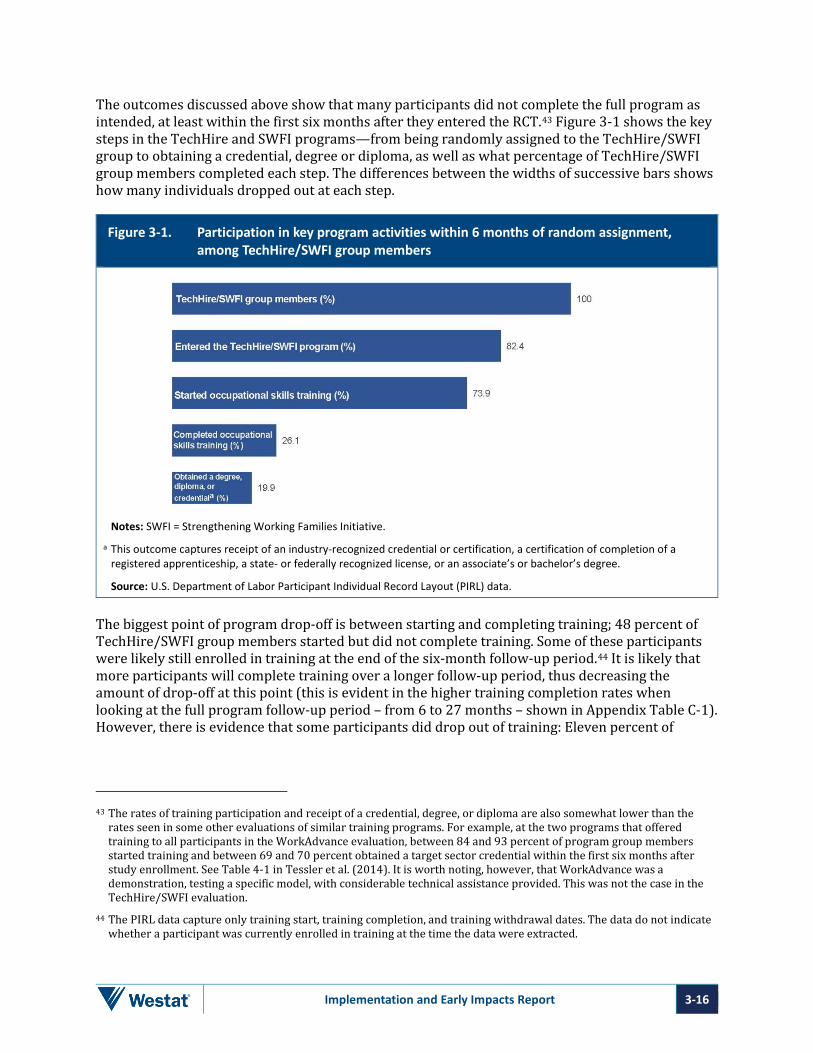
Implementation and Early Impacts Report 3-16
The outcomes discussed above show that many participants did not complete the full program as intended, at least within the first six months after they entered the RCT.43 Figure 3-1 shows the key steps in the TechHire and SWFI programs—from being randomly assigned to the TechHire/SWFI group to obtaining a credential, degree or diploma, as well as what percentage of TechHire/SWFI group members completed each step. The differences between the widths of successive bars shows how many individuals dropped out at each step.
Figure 3-1. Participation in key program activities within 6 months of random assignment, among TechHire/SWFI group members
Notes: SWFI = Strengthening Working Families Initiative.
a This outcome captures receipt of an industry-recognized credential or certification, a certification of completion of a registered apprenticeship, a state- or federally recognized license, or an associate’s or bachelor’s degree.
Source: U.S. Department of Labor Participant Individual Record Layout (PIRL) data.
The biggest point of program drop-off is between starting and completing training; 48 percent of TechHire/SWFI group members started but did not complete training. Some of these participants were likely still enrolled in training at the end of the six-month follow-up period.44 It is likely that more participants will complete training over a longer follow-up period, thus decreasing the amount of drop-off at this point (this is evident in the higher training completion rates when looking at the full program follow-up period – from 6 to 27 months – shown in Appendix Table C-1). However, there is evidence that some participants did drop out of training: Eleven percent of
43 The rates of training participation and receipt of a credential, degree, or diploma are also somewhat lower than the
rates seen in some other evaluations of similar training programs. For example, at the two programs that offered training to all participants in the WorkAdvance evaluation, between 84 and 93 percent of program group members started training and between 69 and 70 percent obtained a target sector credential within the first six months after study enrollment. See Table 4-1 in Tessler et al. (2014). It is worth noting, however, that WorkAdvance was a demonstration, testing a specific model, with considerable technical assistance provided. This was not the case in the TechHire/SWFI evaluation.
44 The PIRL data capture only training start, training completion, and training withdrawal dates. The data do not indicate whether a participant was currently enrolled in training at the time the data were extracted.

Implementation and Early Impacts Report 3-17
participants withdrew from at least one training (shown in Table 3-4). This suggests that some participants had difficulty completing or decided not to complete the training.
The second biggest point of drop-off is between enrolling in the RCT and receiving a grant-funded service. Over 17 percent of TechHire/SWFI group members dropped out at this point and never received any grant-funded services. It is unlikely that more participants will reengage with the programs beyond the six-month follow-up period.
There are a few reasons individuals may have dropped out at this point. First, for some individuals, enrollment into the training happened on the same day they were randomly assigned; in other cases, the course enrollment happened later.45 The length of time before training began varied both within and among programs. Several programs engaged in continuous recruitment and enrollment. One of the East Coast Florida TechHire colleges offered online, self-paced training and brought in individuals on a rolling basis, so they began training immediately. Some programs, however, had continuous enrollment, and based on the training start date, there could be long waits—as long as several months—before training classes began. Three programs recruited cohorts of individuals at a time for a specific training course. Staff at one of these programs said it could vary from two to three days or as long as a month or more before the training began. These delays may have led some individuals to drop out of the program before starting training. Additionally, in the East Coast Florida program, the appeal of the $50 gift card that control group members received may have led some people to apply for TechHire who were not interested in the TechHire training but rather simply wanted to receive the gift card. One college subsequently decided not to market the gift card and told individuals about it only at the time of random assignment.
45 While most programs counted students in the TechHire/SWFI group as enrolled right away, students at the Tampa
TechHire program were enrolled in EmployFlorida (an online database that matches job applicants and employment opportunities) and Atlas (a web-based tracking systems for workforce agencies), but they were not entered into the U.S. DOL’s PIRL database for TechHire until they started training. Also, before students were enrolled in training, the Tampa program required all TechHire group members to pass the Test of Adult Basic Education (TABE). If they failed, they had 30 days to retake the TABE. If candidates did not pass the TABE, they could not participate in TechHire, which “follows the stipulations of the grant,” according to staff. Everyone, including high school graduates, was required to take the TABE. A new version of the TABE instituted in 2019 made it more difficult to pass. After that, Tampa relaxed its policy and waived the TABE requirement for some students.

Implementation and Early Impacts Report 4-1
4. Impacts on Service Receipt, Child Care, and Employment and Earnings
This chapter presents findings from the randomized controlled trial’s (RCT) impact analysis, which is assessing the effect the TechHire and Strengthening Working Families Initiative (SWFI) programs had on participant outcomes. The impact findings presented in this report include a limited set of short-term outcomes (which capture a 7- to 14-month follow-up period). These outcomes include education and training, child care services, job readiness, and employment and earnings. A future report will look at a broader range of outcomes over a longer-term follow-up period (up to three years).
All the outcomes presented in this chapter are based on data collected as part of the Wave 1 survey. TechHire/SWFI (program) group and control group members were interviewed for this survey between 7 and 14 months after they entered the RCT, with the average interview occurring 9 months post-RCT entry.46 Survey respondents were asked about their participation in education and training programs, use of child care services, receipt of child care assistance, employment and earnings histories, and overall well-being since the time they entered the study. Comparing the responses of TechHire/SWFI and control group members reveals TechHire/SWFI’s estimated “impacts” on outcomes. (Box 4.1 explains how to read the impact tables in this chapter.)
The main impact analysis is done at the pooled sample level—meaning the impacts are estimated among individuals from all five programs combined. This decision was made during the analysis planning stage.47 The pooled sample estimates indicate TechHire/SWFI’s effects across a range of programs.
In addition, impacts were also examined for two pre-specified, exploratory subgroups of interest: (1) grant program—impacts are estimated separately for individuals who enrolled in the TechHire programs and for individuals who enrolled in the SWFI programs and (2) level of labor market attachment—impacts are estimated separately for individuals who were currently or recently employed (defined as working within the prior six months, including those who were currently working) when they entered the RCT and for individuals who were considered long-term unemployed (meaning they had been out of work for seven or more months, including those who had never worked).
46 There are several notable differences between the Wave 1 survey data and the Participant Individual Record Layout
(PIRL) data (which the outcomes in Chapter 3 were based on). First, the PIRL data cover only the TechHire/SWFI group, while the survey data cover both the TechHire/SWFI and control groups. Next, the PIRL data include only the training offered by the TechHire and SWFI programs; the survey data, on the other hand, capture participation in any training—offered both by the TechHire and SWFI programs and by other organizations and education providers. Finally, the PIRL data are reported by the TechHire and SWFI programs and the survey data are reported by study participants. See Appendix B and Appendix Table B.6 for a comparison of participation in training between the PIRL data and the survey data.
47 See Appendix B for more information.

Implementation and Early Impacts Report 4-2
Box 4.1 How to Read the Impact Tables in This Chapter
Most tables in this chapter use a similar format, illustrated in the table excerpt below. The table shows two training outcomes for the TechHire/SWFI group and the control group. The top row of the table below, for example, shows that 72 percent of TechHire/SWFI group members ever started occupational skills training, compared with 33 percent of control group members.
Because study participants were assigned randomly to either the TechHire/SWFI (program) group or the control group, the effects of TechHire/SWFI can be estimated by the difference in outcomes between the two groups. The “Difference (Impact)” column in the table shows the TechHire/SWFI group’s training outcomes minus the control group’s training outcomes—in other words, TechHire/SWFI’s impact on training. For example, the impact on ever started occupational skills training is calculated by subtracting 32.6 from 71.9, yielding 39.3 percentage points.
The “P-value” column gives an indication of how unlikely it is that the impact is due to chance (see Appendix B for more information on how the impacts were estimated). The lower the p-value, the less likely it is that the impact is due to chance. Impacts are considered statistically significant if they have a p-value below 0.100, meaning there is less than a 10 percent chance that the impact is due to chance (or in other words, meaning there is less than a 10 percent chance that the true impact is zero). Differences marked with an asterisk are statistically significant. The number of asterisks indicates whether the impact is statistically significant at the 1 percent, 5 percent, or 10 percent level (the lower the level, the more asterisks and the less likelihood that the impact was due to chance). For example, the p-value for the outcome of ever starting occupational skills training is < 0.001. This indicates there is less than a 1 percent chance of observing an impact of 39 percentage points or larger if TechHire/SWFI had no effect on ever starting occupational skills training. Three asterisks indicate that this impact is statistically significant at the 1 percent level.
Outcome TechHire/ SWFI group
Control group
Difference (impact) P-value
Ever started occupational skills training (%) 71.9 32.6 39.3*** 0.000 Ever completed occupational skills training (%) 31.4 16.7 14.7*** 0.000
Note: Statistical significance levels are indicated as: *** = 1 percent; ** = 5 percent; * = 10 percent.
Source: TechHire/SWFI Wave 1 survey.
What Is Needed for a Program to Produce Impacts? The ultimate goals of the TechHire and SWFI programs are to increase participants’ employment and earnings by offering training that will lead to a well-paying middle- or high-skilled job in a high-growth H-1B industry. However, one or more conditions must be in place for a program such as TechHire or SWFI to lead to impacts on labor market outcomes. For one, the services offered to participants by the TechHire/SWFI programs could differ from the services available to the control group either in terms of quality or dosage. Next, more TechHire/SWFI group members than control group members could receive those services. Or, in other words, there could be a difference in the rates of participation in key program services (in this case, occupational skills training) between the TechHire/SWFI group and the control group. While a program does not have to lead to a difference in all of these factors, it must have a difference in at least one.
Taken together, these differences in the services available and the rates of services received across research groups represent the study’s “treatment contrast.” Moreover, the larger these differences are between the TechHire/SWFI group and the control group, the more likely the program will

Implementation and Early Impacts Report 4-3
make a difference for participants and produce impacts on outcomes like employment, earnings, and other measures.
The next section highlights the differences in services available through the TechHire and SWFI programs compared with the services control group members could have received. The following sections then assess whether more TechHire/SWFI group members received the available services compared with the rates of control group members who received similar types of services—including education and training, child care, and other job readiness services. Finally, the subsequent section describes whether the treatment contrast was large enough to translate into impacts on employment or earnings in the short term.
Services Available to the Control Group The extent to which the training offered under the TechHire and SWFI programs differed from the training individuals could receive outside the programs varied substantially by program. In some programs, the training offered was the same, or almost the same, as what participants could get at the college outside TechHire or SWFI—they would just have to pay out of pocket for it. In one program, there were even other grants that would pay for the exact same training, so a control group member could receive the identical training as a TechHire/SWFI group member and also receive it at no cost. In these programs, TechHire/SWFI and control group members might be sitting next to each other in the same classrooms.
In some programs, the content of training offered under TechHire and SWFI and to the general public at the college was very similar, but the TechHire and SWFI classes were smaller or offered in a cohort or self-paced online instead of on a regular academic schedule. However, it was also possible in some locations to find similarly structured classes in the community. At one program, the training offered through TechHire was not available at the college outside TechHire, though similar training was offered elsewhere in the community. Though the training in the community was generally tuition-based, there were also ways in which some similar training might also be tuition-free, such as when it was offered under other similar grant programs.
Even though it was possible to receive similar or identical technical training outside TechHire and SWFI, some of the TechHire and SWFI training included more than what might be found in a traditional skills training curriculum. As a staff person at one program noted, “[We’re] teaching things you’re expected to know on the job, rather than just theory and concepts. [The instructor] teaches hands-on applications as though you’re actually on the job and trying to get it done—they’re teaching through experience.” Whether or not instructors outside TechHire and SWFI taught in this manner likely varied by instructor. But given the target populations of TechHire and SWFI—students who are generally underserved and more disadvantaged in a variety of ways—it is not surprising that some instructors took a more holistic approach to teaching and incorporated some “life skills” instruction into their classes, and this might be less common in regular training classes. Likewise, TechHire and SWFI case managers checked in with students to try to keep them engaged in training, which would not occur in a regular college course.
For some, the difference is being able to get credit for the training through TechHire or SWFI and have a smooth transition to continuing one’s education: As one program supervisor noted, “[The difference is that] the students are getting credit for their studies; there are guaranteed transfer agreements. For career pathways, their credentials are accredited, and they can transfer to an AA or a BA. For the true career pathway model, this is ideal. When they go to private programs, there is no

Implementation and Early Impacts Report 4-4
articulation agreement. They get their credential, and that’s it. [Our program] can truly move people along a career pathway.”
The main difference in the services available may not have been the training. At most programs, staff agreed that case management and support services distinguished the TechHire and SWFI programs from other similar programs. As one interviewee said, “[It’s the] individual support—having a case manager and instructors who continue working with you even if you have a lot of challenges. Whether these are things like food insecurity or academic challenges, they will work with you. This is really important when working with populations that aren’t the typical populations [for these kinds of training programs].”
Impacts on Education and Training A key goal of the TechHire and SWFI programs was to make training more accessible and completion more feasible for populations with specific barriers and needs. Several earlier studies have demonstrated that attending and completing training can be challenging for many individuals.48 This may be owing to financial issues (both having to pay for training and potentially needing to reduce work to attend training), lack of academic preparation, or being able to balance training with other commitments (including caring for children).49 The TechHire and SWFI programs attempted to directly address some of these issues—for example, by offering training to participants at no cost.
Chapter 3 described the rates of training participation among TechHire/SWFI group members. It did not, however, show whether the TechHire/SWFI programs were able to increase participation in training beyond the level that would have been achieved in the absence of the programs (that is, the rate of training participation among the control group). This section answers that question.
It should also be noted that some individuals were surveyed after the onset of the COVID-19 pandemic. Based on the intake period and average training lengths, most individuals in the TechHire/SWFI group were likely out of training prior to March 2020. However, some individuals may still have been enrolled in training and those trainings may have been affected as a result of the pandemic. The Wave 2 Survey will provide more evidence on whether the pandemic affected individuals’ training-related outcomes, and whether it impacted individuals in the TechHire/SWFI and control groups differently.
While training completion is the ultimate goal of the TechHire and SWFI programs, given the range in the length of training offered by the programs (from one to 24 months), it was expected that at least some TechHire/SWFI group members would still be enrolled in training at the time of the Wave 1 survey. Based on this, the research team prespecified one “confirmatory” outcome for the current impact analysis: currently enrolled in or completed occupational skills training as measured by the Wave 1 survey. All the other education and training-related outcomes are considered “exploratory.” (See Box 4.2 and Appendix B for more information on these terms and on how the study categorized outcomes.)
48 Gueron and Hamilton (2002). 49 Seefeldt, Engstrom, and Gardiner (2016).

Implementation and Early Impacts Report 4-5
Seventy-two percent of TechHire/SWFI group members started an occupational skills training program compared with 33 percent of control group members, a statistically significant increase of 39 percentage points (Table 4-1).50 The programs also increased the likelihood that individuals started training in all three target H-1B industries—information technology, advanced manufacturing, and health care. The impact on overall training start is similar in size to other evaluations of training programs with a sector focus.51
Box 4.2 Impact Analysis Outcomes
The research team prespecified a set of outcomes for the impact analysis and categorized each of these outcomes as “confirmatory” or “exploratory.”
In recent years, the issue of multiple test bias has become more prominent in the academic literature and the field of program evaluation. Every time an impact on an outcome is estimated, there is a precisely defined probability (conventionally, 10 percent in studies such as the TechHire/SWFI evaluation) of concluding that a program had an impact when the observed difference is simply due to chance. Since researchers typically examine many outcomes, the probability that at least one estimate will be statistically significant, simply by chance, can get very high.
One approach to this problem is to conduct fewer impact estimates and to state in advance which tests will be conducted.* The research team followed this approach, specifying one confirmatory outcome in the analysis planning phase—currently enrolled in or completed training as measured by the Wave 1 survey—as the most likely to be affected in the current follow-up period if the programs were successful. A statistically significant impact on this outcome represents the highest level of evidence of the success of the programs with the available amount of follow-up data. If the programs do not pass the confirmatory test but produce statistically significant impacts on other measures, it does not mean that the programs were unsuccessful. It simply means that the programs passed a lower standard of evidence, given the available amount of follow-up data.
All the other outcomes in the impact analysis covered in this report are considered exploratory. The exploratory outcomes are outcomes that either are not directly targeted by the intervention or outcomes where there is a lower likelihood of detectable impacts given the timing of measurement and given the statistical power of the design. These outcomes can help explain an impact seen on the confirmatory outcome, if there is one. __________________________
* Olken (2015).
At the time of the Wave 1 survey, some individuals had completed training, while others were still enrolled in training. Twenty-one percent of TechHire/SWFI group members and 8 percent of control group members were currently enrolled in training at the time of the survey, a statistically significant 13 percentage point increase.
TechHire and SWFI also increased the rate of training completion. Thirty-one percent of TechHire/SWFI group members and 17 percent of control group members had completed training by the time of the Wave 1 survey. It is likely that the rates of training completion will be higher for
50 The rate of training start for TechHire/SWFI group members from the Wave 1 survey is similar to the rate of training
seen in the PIRL data. See Appendix B and Appendix Table B.6 for more information. 51 See, for example, Hendra et al. (2016).

Implementation and Early Impacts Report 4-6
both research groups in the Wave 2 survey, which will capture outcomes over a longer follow-up period, around 18 months after RCT entry.
Because the TechHire and SWFI programs increased the likelihood that individuals completed training and that individuals were currently enrolled in training, the programs also produced a statistically significant impact on the study’s confirmatory outcome: Forty-three percent of TechHire/SWFI group members were either currently enrolled in or had completed occupational skills training at the time of the Wave 1 survey, a 21 percentage point increase over the control group average (Table 4-2).
Table 4-1. Impacts on education, training, and financial assistance
Outcome TH/SWFI group
Control group
Difference (impact) P-value
Education and training Ever participated in (%)
ESL classes 8.1 9.3 -1.2 0.580 ABE or GED classes 9.6 7.2 2.4 0.270 College courses for credit 39.5 33.3 6.2* 0.081
Ever started occupational skills training (%) 71.9 32.6 39.3*** 0.000 IT 39.8 12.8 27.0*** 0.000 Advanced manufacturing 7.9 3.8 4.1** 0.011 Health care 21.2 9.8 11.4*** 0.000
Currently enrolled in occupational skills training (%) 21.1 8.3 12.8*** 0.000 Ever completed occupational skills training (%) 31.4 16.7 14.7*** 0.000
IT 17.6 6.2 11.4*** 0.000 Advanced manufacturing 4.3 2.2 2.1 0.114 Health care 9.6 6.1 3.5* 0.095
Ever dropped out of occupational skills training (%) 7.5 1.0 6.5*** 0.000 Main reason dropped out of training, among those who dropped out (%)
Problems with transportation 20.2 84.5 Illness or disability 20.3 50.2 Other 86.2 24.4
Ever obtained a professional certification or state/industry license (%) 19.1 9.7 9.3*** 0.001
IT 8.7 2.6 6.1*** 0.001 Advanced manufacturing 2.7 1.4 1.3 0.238 Health care 7.9 4.8 3.2* 0.097
Ever participated in on-the-job training, an internship, or an apprenticeship (%) 19.2 14.3 4.9 0.100
Financial assistance Paid for training out of pocket or with loans (%) 6.4 12.7 -6.3*** 0.005 Amount paid for training ($) 155 652 -497*** 0.001 Sample size 361 299
Notes: Estimates were regression-adjusted using ordinary least squares, controlling for pre–random assignment characteristics of sample members. See a full list of covariates in Appendix B.
Sample sizes may vary because of missing values.
Statistical significance levels are indicated as: *** = 1 percent; ** = 5 percent; * = 10 percent.
TH = TechHire; SWFI = Strengthening Working Families Initiative; ESL = English as a Second Language; ABE = Adult Basic Education; GED = General Educational Development certificate.
Italics indicate the metric is not among the full sample shown in the table.
Source: TechHire/SWFI Wave 1 survey.

Implementation and Early Impacts Report 4-7
Table 4-2. Impact on enrollment in or completion of training (confirmatory outcome)
Outcome TH/SWFI group
Control group
Difference (impact) P-value
Currently enrolled in or completed occupational skills training (%) 42.5 21.3 21.2*** 0.000
Sample size 361 299
Notes: Estimate was regression-adjusted using ordinary least squares, controlling for pre–random assignment characteristics of sample members. See a full list of covariates in Appendix B.
Sample sizes may vary because of missing values.
Statistical significance levels are indicated as: *** = 1 percent; ** = 5 percent; * = 10 percent.
TH = TechHire; SWFI = Strengthening Working Families Initiative.
A one-tailed t-test was used for the confirmatory outcome.
Source: TechHire/SWFI Wave 1 survey.
The TechHire and SWFI programs covered most or all of the costs of training for participants. The tuition and fees associated with training programs can be a barrier to potential participants. Those who take out loans to attend can be left with high amounts of debt.52 TechHire/SWFI reduced both the likelihood that individuals paid for training out of pocket or with loans and the amount they paid for training by statistically significant amounts (Table 4-1). Only 6 percent of TechHire/SWFI group members paid for training compared with 13 percent of control group members. This may be one factor that led to the increases in training start and completion discussed above.
All of the training the TechHire and SWFI programs offered led to a credential or certification. As expected, given the increase in training, TechHire/SWFI increased the likelihood of obtaining a professional certification or license by 9 percentage points, a statistically significant increase (Table 4-1). Nineteen percent of TechHire/SWFI group members obtained a certification or license compared with 10 percent of control group members. Similar to training completion, these rates may increase for both research groups in the Wave 2 survey.
TechHire/SWFI did not have a statistically significant effect on participation in on-the-job training, an internship, or an apprenticeship. Nineteen percent of TechHire/SWFI group members attended one or more of these work-based learning experiences, compared with 14 percent of control group members (Table 4-1). Some but not all TechHire and SWFI programs offered these other types of training.
The training-related impacts discussed in this section provide evidence that the RCT achieved a treatment contrast—or in other words, a difference in the rate of TechHire/SWFI and control group members who participated in the key program service, occupational skills training. It is unclear whether the increase in training participation is large enough to translate into an increase in employment and earnings outcomes over a longer follow-up period.53
52 Seefeldt, Engstrom, and Gardiner (2016). 53 As one example, the Health Profession Opportunity Grants (HPOG) Impact Study found that the HPOG programs
increased enrollment in or completion of training by 7 percentage points around one year after study entry. However, the programs did not lead to an increase in earnings over a three-year follow-up period. Peck et al. (2018) and Peck et al. (2019).

Implementation and Early Impacts Report 4-8
Impacts on Child Care Arrangements and Assistance
As discussed, the SWFI grant program is explicitly intended to address the lack of available, accessible, and affordable child care as a barrier for parents who want to enroll in education or training programs. There have been a few previous studies on how increases in child care coverage are associated with training and employment outcomes, but the track record is mixed.54 This section discusses whether the two SWFI programs in the RCT were able to increase access to child care services, the likelihood that individuals received help accessing such services, and whether the programs reduced child care as a barrier to training and employment. Because only the SWFI programs specifically targeted parents and were designed to provide child care assistance to participants, the impacts on child care arrangements and assistance are discussed for both the pooled sample and the SWFI sample (as part of the grant subgroup analysis). Finally, the COVID-19 pandemic may have had an effect on individual’s ability to obtain child care or their likelihood to use child care. The Wave 2 Survey will provide some insight into whether individuals had child care-related issues as a result of the pandemic and if so, whether those child care-related issues affected individuals ability to work.
Among individuals at the two SWFI programs, 47 percent of SWFI (program) group members and 44 percent of control group members reported that their youngest child received care from someone other than themselves or their spouse or partner while they were working or in training (Appendix Table D-1). This difference is not statistically significant. Although individuals had to be parents to be eligible for the SWFI programs, less than half of individuals in both research groups used child care services. This could suggest that most individuals had older children who did not need child care (although at study entry, around 60 percent of individuals randomly assigned at both SWFI programs had a child 5 years old or younger). Or it could suggest that parents of younger children were able to handle child care responsibilities themselves or shared them with a spouse or partner. The rates of child care use are lower for both research groups among the pooled sample (including the TechHire programs), as expected (Table 4-3).
Findings from the implementation analysis showed that one of the SWFI programs in the RCT did not directly pay for continuing child care services while participants were enrolled at the college. The Denver program was able to pay for child care services in some cases—for example, for interim child care participants needed while they were waiting to get approval to receive subsidized child care through the county or to cover child care needed in the evening.55 In most cases, however, the programs tried to connect eligible participants to available subsidies offered outside the programs.
It is unclear from the Wave 1 survey how many participants ultimately received a subsidy, although the survey data show that the SWFI programs did not have a statistically significant effect on outcomes related to paying for child care. Twenty-five percent of SWFI group members paid for child care for their youngest child, compared with 23 percent of control group members. Related, the difference in rates of SWFI and control group members who reported being reimbursed for payments made for child care was not statistically significant (12 percent and 9 percent, respectively) (Appendix Table D-1).
However, the SWFI programs did increase the likelihood that individuals received help finding or accessing child care services. This is somewhat surprising, given that the programs did not affect
54 Gennetian and Michalopoulos (2003). 55 It is not known how many participants received child care payments in these situations.

Implementation and Early Impacts Report 4-9
the use of child care services. Thirty-one percent of SWFI group members reported receiving help compared with 14 percent of control group members, an increase of 17 percentage points. The SWFI programs also helped more individuals access child care that was more convenient for them. For example, SWFI group members were 15 percentage points more likely than control group members to have received help finding child care in a convenient location and 11 percentage points more likely to have received help finding child care at needed hours (Appendix Table D-1). These impacts are also observed—but are smaller—among the pooled sample. It is possible that being able to access more convenient child care could help parents stay engaged in training or employment at a higher rate or for a longer time.
Table 4-3. Impacts on child care arrangements and assistance
Outcome (%) TH/SWFI group
Control group
Difference (impact) P-value
Child care arrangements Youngest child received care while working or in training 20.4 18.9 1.5 0.594
At Head Start or Early Head Start 1.9 1.4 0.6 0.568 At preschool, nursery school, or child care center 5.7 6.2 -0.5 0.792 At family day care home 2.2 1.0 1.2 0.226 From relative 10.4 9.1 1.3 0.562 From nonrelative 4.8 5.3 -0.5 0.772 Child cared for him or herself 0.2 0.4 -0.2 0.691
Paying for child care for youngest child Paid for child care 11.7 10.5 1.2 0.614 Was reimbursed for some or all child care payments 4.5 4.4 0.1 0.951 Help with child care arrangements Received help
Finding child care 14.0 7.7 6.4** 0.005 Finding child care in a convenient location 13.5 8.0 5.5** 0.015 Finding child care at needed hours 12.3 7.8 4.5** 0.041 Finding an alternative to regular child care in an emergency 9.4 6.6 2.8 0.172 Paying for child care 13.2 10.4 2.7 0.235 Finding or paying for transportation to child care 9.4 4.2 5.1*** 0.007
Difficulty with child care arrangements Had to quit a job, school, job search, or training due to issues obtaining or keeping child care 12.2 12.3 -0.2 0.947
Did not take a job or did not start training due to issues obtaining or keeping child care 17.9 20.6 -2.7 0.320
Sample size 361 299
Notes: Estimates were regression-adjusted using ordinary least squares, controlling for pre–random assignment characteristics of sample members. See a full list of covariates in Appendix B.
Sample sizes may vary because of missing values.
Statistical significance levels are indicated as: *** = 1 percent; ** = 5 percent; * = 10 percent.
TH = TechHire; SWFI = Strengthening Working Families Initiative.
Source: TechHire/SWFI Wave 1 survey.
As discussed, the child care services the SWFI programs offered were intended to help participants overcome barriers to attending training. As with the above child care–related impacts, the SWFI programs did not reduce child care as a barrier to training and employment. Similar rates of SWFI and control group members (29%) reported they had to quit a job, job search, school, or training

Implementation and Early Impacts Report 4-10
because of difficulties with their child care arrangements. The difference in the rates of SWFI group members and control group members (39% versus 47%) who have not taken a job or not started training because they had problems with child care is not statistically significant (Appendix Table D-1). Because the rates of not being able to start training or a job owing to child care issues are more than a third for the SWFI group and close to half for the control group, it is clear that many individuals experienced child care as a barrier.
Impacts on Job Readiness Training, Job Search Assistance, and Support Services The TechHire and SWFI programs offered a range of other services to participants in addition to occupational skills training, including job readiness training and preemployment services geared toward helping participants look for and obtain a job. As discussed in Chapter 2, the specific services offered, as well as how often and by whom, differed across programs.
TechHire/SWFI produced statistically significant impacts on most of these outcomes. For example, TechHire/SWFI group members were 22 percentage points more likely than control group members to have received job readiness training and 18 percentage points more likely to have received help planning a career path (Table 4-4). These types of services are important to help participants complete training, find a job, and remain employed.
Table 4-4. Impacts on service receipt
Outcome TH/SWFI group
Control group
Difference (impact) P-value
Received help with the following (%) Job readiness or soft skills training 61.8 39.4 22.4*** 0.000 Figuring out a career path 68.8 51.0 17.8** 0.000 Developing a résumé 59.5 50.9 8.6** 0.027 Filling out a job application 48.9 43.3 5.6 0.151 Getting a job recommendation 49.1 37.4 11.7*** 0.002 Finding job leads or scheduling interviews 64.2 48.6 15.6*** 0.000 Practicing for a job interview 46.8 34.7 12.1*** 0.002 Supportive services 49.2 28.5 20.7*** 0.000
Sample size 361 299
Notes: Estimates were regression-adjusted using ordinary least squares, controlling for pre–random assignment characteristics of sample members. See a full list of covariates in Appendix B.
Sample sizes may vary because of missing values.
Statistical significance levels are indicated as: *** = 1 percent; ** = 5 percent; * = 10 percent.
TH = TechHire; SWFI = Strengthening Working Families Initiative
Source: TechHire/SWFI Wave 1 survey.
The programs also offered support services to encourage participants to remain engaged in the programs and complete the training offered. As discussed in Chapter 2, these supports ranged from paying for or arranging transportation to the training to providing a referral to an outside organization for food or housing assistance. TechHire/SWFI produced a statistically significant impact on receiving help with support services. Forty-nine percent of TechHire/SWFI group members reported receiving such help compared with 29 percent of control group members.

Implementation and Early Impacts Report 4-11
Impacts on Employment, Job Characteristics, and Perceptions of the Future The research team expected that TechHire/SWFI group members could have lower employment rates than the control group in the first few months following RCT entry, given the opportunity cost of training. In other words, many individuals experience a “cost” to attending training in the form of lost wages because they either reduce their work schedules or drop out of the labor market entirely in order to participate in training. The research team expected that not all control group members would access training on their own (this was seen in the training impacts discussed above), given the tuition and other fees associated with training programs and, in the case of SWFI sample members, difficulties accessing child care. Instead, the team thought that most control group members would seek more immediate employment. On the other hand, TechHire/SWFI group members would begin looking for and finding jobs only after completing training, which lasted between one and 24 months.
Past research has shown that it can take up to two or even three years before economic impacts begin to emerge.56 This is well beyond the follow-up period covered in this report. Therefore, all the employment outcomes from the Wave 1 survey are considered exploratory.
Finally, as mentioned, the follow-up period captured by the Wave 1 Survey covers the COVID-19 pandemic and resulting economic recessionary period for some individuals. The pandemic could have affected individuals job search and employment related outcomes. The Wave 2 Survey will provide more evidence on whether individuals were unable to find jobs or lost their jobs as a result of the COVID-19 pandemic, and whether the TechHire and SWFI programs had an effect on these outcomes.
Consistent with these expectations, TechHire/SWFI did not have a statistically significant effect on ever being employed in the first 7 to 14 months after enrolling in the study: Seventy-four percent of TechHire/SWFI group members and 77 percent of control group members ever worked since random assignment (Table 4-5). Lower rates of employment for both research groups were seen at the time of the Wave 1 survey (58% and 63%), suggesting that some individuals may have stopped working to attend training or left their job for another reason. The effect on current employment is not statistically significant either.
The Wave 2 survey will provide more evidence on whether individuals were able to enter or reenter the labor market over a longer follow-up period and whether the TechHire and SWFI programs were able to help individuals maintain their employment better than they would have been able to on their own.
The TechHire and SWFI programs also have the potential to affect the types of jobs individuals obtain. One main job characteristic of interest is the industry; the programs were expected to prepare participants for jobs in high-growth H-1B industries to help put them on a path to economic mobility. Table 4-5, however, shows that the rates of ever working in the target H-1B industries—information technology, advanced manufacturing, and health care—were similar across research groups. For example, around 13 percent of TechHire/SWFI and control group members were ever employed in the health care industry since random assignment. It is possible
56 Card, Kluve, and Weber (2018); Schaberg (2017).

Implementation and Early Impacts Report 4-12
that the programs will affect these outcomes as more individuals complete training, obtain credentials, and find jobs in the target industries.
Table 4-5. Impacts on employment and job characteristics
Outcome TH/SWFI group
Control group
Difference (impact) P-value
Ever employed (%) 74.1 77.3 -3.2 0.290 IT 8.9 9.8 -0.9 0.687 Advanced manufacturing 2.7 3.5 -0.8 0.557 Health care 13.0 12.5 0.5 0.844
Currently employed (%) 57.7 63.1 -5.4 0.128 Percentage of months employed 0.5 0.5 0.0 0.722 Current or most recent job characteristics Average number of hours worked per week 23.2 25.4 -2.2* 0.066 Worked full time (35 or more hours per week) (%) 40.1 42.4 -2.3 0.522 Average hourly wage ($) 10.92 10.88 0.04 0.955 Hourly wage above $15 (%) 30.0 33.7 -3.7 0.307 Average weekly earnings ($) 342 366 -24 0.337 Job is closely related to most recent education or training (%) 14.8 15.1 -0.2 0.943 Job offers many opportunities for career advancement (%) 41.9 43.4 -1.5 0.693 Sample size 361 299
Notes: Estimates were regression-adjusted using ordinary least squares, controlling for pre–random assignment characteristics of sample members. See a full list of covariates in Appendix B.
Sample sizes may vary because of missing values.
Statistical significance levels are indicated as: *** = 1 percent; ** = 5 percent; * = 10 percent.
TH = TechHire; SWFI = Strengthening Working Families Initiative.
Source: TechHire/SWFI Wave 1 survey. Findings from other studies have shown that moving people into in-demand industries is not enough on its own to also increase their earnings.57 The industry jobs must also pay more, offer more hours, or offer better benefits than the types of in- or out-of-industry jobs that individuals could obtain on their own. Not surprisingly, given the follow-up period and pattern of employment impacts, there is little to no evidence yet that TechHire/SWFI increased the likelihood of individuals obtaining better paying or better quality jobs. For example, the average hourly wage was $10.92 for TechHire/SWFI group members and $10.88 for control group members (there is no measurable difference between these hourly wages). This is consistent with findings from the qualitative interviews that suggested that the programs were training people primarily for lower-skilled, entry-level jobs. The one exception is the average hours worked per week. TechHire/SWFI group members worked 23 hours per week on average, while control group members worked 25 hours per week.
Survey respondents were also asked about their perceptions of the future. TechHire/SWFI group members were 9 percentage points more likely than control group members to feel they were making progress toward their long-term employment goals and 8 percentage points more likely to feel they were on a career path (Table 4-6). These impacts are both statistically significant. Future
57 Hendra et al. (2016); Peck et al. (2019); Roder and Elliott (2019).
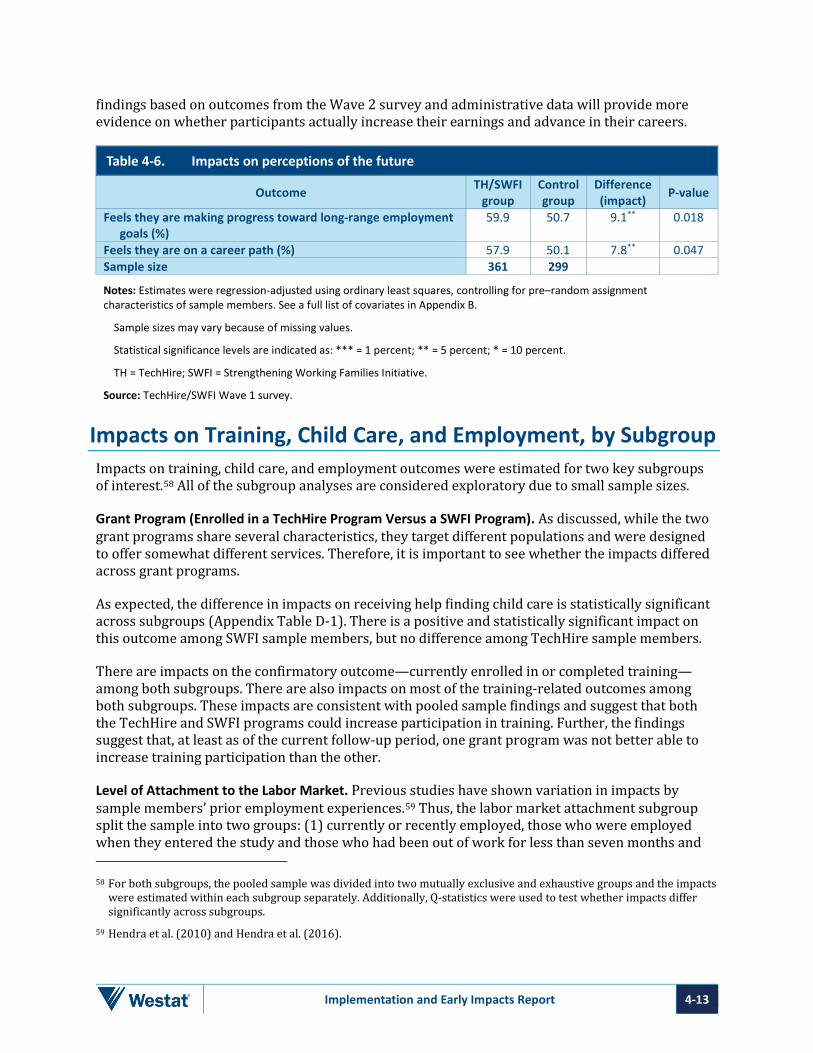
Implementation and Early Impacts Report 4-13
findings based on outcomes from the Wave 2 survey and administrative data will provide more evidence on whether participants actually increase their earnings and advance in their careers.
Table 4-6. Impacts on perceptions of the future
Outcome TH/SWFI group
Control group
Difference (impact) P-value
Feels they are making progress toward long-range employment goals (%)
59.9 50.7 9.1** 0.018
Feels they are on a career path (%) 57.9 50.1 7.8** 0.047 Sample size 361 299
Notes: Estimates were regression-adjusted using ordinary least squares, controlling for pre–random assignment characteristics of sample members. See a full list of covariates in Appendix B.
Sample sizes may vary because of missing values.
Statistical significance levels are indicated as: *** = 1 percent; ** = 5 percent; * = 10 percent.
TH = TechHire; SWFI = Strengthening Working Families Initiative.
Source: TechHire/SWFI Wave 1 survey.
Impacts on Training, Child Care, and Employment, by Subgroup Impacts on training, child care, and employment outcomes were estimated for two key subgroups of interest.58 All of the subgroup analyses are considered exploratory due to small sample sizes.
Grant Program (Enrolled in a TechHire Program Versus a SWFI Program). As discussed, while the two grant programs share several characteristics, they target different populations and were designed to offer somewhat different services. Therefore, it is important to see whether the impacts differed across grant programs.
As expected, the difference in impacts on receiving help finding child care is statistically significant across subgroups (Appendix Table D-1). There is a positive and statistically significant impact on this outcome among SWFI sample members, but no difference among TechHire sample members.
There are impacts on the confirmatory outcome—currently enrolled in or completed training—among both subgroups. There are also impacts on most of the training-related outcomes among both subgroups. These impacts are consistent with pooled sample findings and suggest that both the TechHire and SWFI programs could increase participation in training. Further, the findings suggest that, at least as of the current follow-up period, one grant program was not better able to increase training participation than the other.
Level of Attachment to the Labor Market. Previous studies have shown variation in impacts by sample members’ prior employment experiences.59 Thus, the labor market attachment subgroup split the sample into two groups: (1) currently or recently employed, those who were employed when they entered the study and those who had been out of work for less than seven months and 58 For both subgroups, the pooled sample was divided into two mutually exclusive and exhaustive groups and the impacts
were estimated within each subgroup separately. Additionally, Q-statistics were used to test whether impacts differ significantly across subgroups.
59 Hendra et al. (2010) and Hendra et al. (2016).

Implementation and Early Impacts Report 4-14
(2) the long-term unemployed, those who had never worked and those who had been out of work for seven or more months at study entry. Based on previous findings, it was hypothesized that the TechHire/SWFI programs might be more effective for individuals in the currently or recently employed group.60 The rationale is that the TechHire/SWFI services could help these individuals get back into the workforce or into better-paying jobs, and these individuals would likely not have as many barriers to overcome as the long-term unemployed might, in order to benefit from the programs.
For most outcomes examined, the differences in impacts across the level of labor market attachment subgroups are not statistically significant (Appendix Table D-2). The one exception is for current employment. Among the currently and recently employed, there is a negative and statistically significant impact on current employment (possibly because some TechHire/SWFI group members dropped out of the labor market to attend training). On the other hand, among the long-term unemployed, the impact on current employment is not statistically significant. It should be noted that the rates of current employment for both research groups are much higher among the current and recently employed than among the long-term unemployed, as one would expect.
The differences in impacts across the subgroups are not statistically significant for other outcomes. There is, however, an impact on completing training among the currently and recently employed, but not among the long-term unemployed.
60 See, for example, Hendra et al. (2010).

Implementation and Early Impacts Report 5-1
5. Conclusion
The TechHire Partnership Grants (TechHire) and the Strengthening Working Families Initiative (SWFI) were created as part of a broad agenda to reduce employers’ need to hire temporary workers from outside the United States through the H-1B visa program.61 These grant programs aimed to achieve this by funding local organizations to offer accessible training and supports to unemployed and underemployed potential U.S. workers who had barriers to training, creating a pipeline of workers able to fill jobs in the high-tech fields that employ large numbers of H-1B workers. The first step toward achieving these broad aims is to get individuals from the target populations into training and help them complete it.
This chapter summarizes the key implementation and short-term impact findings for the five TechHire and SWFI grantees (out of 53 in total) that participated in the randomized controlled trial (RCT). Future reports, based on longer-term follow-up (up to three years), will assess the extent to which the mix of TechHire and SWFI training courses, case management, and support services helped low-skilled workers increase their employment and earnings over and above what they would have achieved in the absence of these programs. The RCT will also examine whether these programs led participants to the middle- and high-skilled jobs in information technology, health care, and advanced manufacturing that employers often turn to imported labor to fill, thereby shedding light on whether the TechHire and SWFI grants were beginning to meet their intended policy goals.
Variation in Program Participants • Differences in how eligibility was defined and in the level of pre-screening resulted in notable
variation across the programs in program participants’ characteristics.
As learned through the implementation analysis, local discretion to define “barriers to employment” (for TechHire) and “training needs” (for SWFI) allowed the programs to set their eligibility criteria—over and above the basic ones established by the grants—and screening processes. One program recruited mostly from among current community college students, while others focused on individuals with barriers who were less likely to find their way to college-based training programs independently. One program used rigorous screening to increase the likelihood that eventual program participants would be successful in its demanding program. These differences, and other variations in age, education, employment history, and transportation and child care needs, are factors that could influence success in completing training programs as well as in finding post-training employment.
61 Given that these programs largely operated before the onset of the coronavirus pandemic in the United States
beginning roughly in March 2020, it remains to be seen whether and how the industries targeted by these grants, and their need for workers, will change as the pandemic recedes and the economy recovers.

Implementation and Early Impacts Report 5-2
Recruitment Challenges • Three programs struggled to meet recruitment targets; thus, the sample for the RCT was one-
third smaller than intended.
Programs faced several challenges recruiting eligible individuals for the study, including insufficient staffing for outreach activities, an initial lack of connections with community agencies, and the reluctance of referral partners to send individuals to the program once random assignment began. Some TechHire programs had difficulty finding interested young adults in the designated age range. During the time that the programs were implemented, low unemployment rates meant that members of the target population could find fairly well-paying jobs easily, making training less appealing.
Training Levels: Intended Versus Actual • There was a discrepancy between the skill level of the intended training to “train workers
with the skills required for well-paying, middle- and high-skilled, and high-growth jobs,” as described in the Funding Opportunity Announcements for TechHire and SWFI, and the relatively low level of skill provided by the training offered,. At three of the five programs, this led to placement in mostly entry-level, lower-skilled jobs that were not in demand. Notably, “well-paying” and “middle- and high-skilled jobs” are not defined in the Funding Opportunity Announcement for TechHire and SWFI, and some programs made clear in their applications that they would be training people for entry-level positions.
The TechHire and SWFI grants had ambitious goals of preparing low-skilled individuals with barriers to training for high-skilled jobs in a short period of time. Even with case management and financial supports, this is likely to be a challenging goal to achieve. All programs in the RCT successfully offered training in “high-tech” industries, including information technology, health care, and advanced manufacturing. However, in practice, at three of the programs, most of the training was designed to lead to entry-level jobs within high-tech industries rather than middle- and high-skilled jobs. Additionally, work-based learning—one component of the TechHire and SWFI programs that could have potentially given participants some work experience, possibly leading to higher-level, higher-paying jobs—was largely missing across all the programs, as discussed below.
It is not possible to determine definitively what caused a mismatch between the types of higher-skilled training called for in the TechHire and SWFI Funding Opportunity Announcements—which better aligned with the level of skills employers were looking for—and the types of training offered at three of the programs, which were more geared toward lower-skilled, entry-level jobs.62 Possible explanations worth considering, as well as implications for future studies of similar workforce programs, include the following:
• Individuals with relatively low baseline skills, such as that of the target population for these programs, would likely need considerably more support—possibly in the form of tutoring or a preparatory bridge program—to be successful in training that required a higher level of
62 It is possible that training leading to lower-skilled, more entry-level jobs than intended by the TechHire and SWFI
grants could result in program group members finding employment in lower-paying jobs than expected, or not finding employment at all, which could dilute the impacts of the program.
Implementation and Early Impacts Report 5-3
skill. Absent that, they are more likely to succeed in skills training programs that are closer to their current skill levels, such as those offered by most of the TechHire and SWFI programs.
• One program director shared that she thought the assumption of those who designed the local program was that placing graduates into even entry-level jobs in high-tech industries would at least set them on a pathway to a better-paying job. This director noted that this program design, which was based on the needs and skill levels of the population to be served and the feedback from industry regarding need, as well as the potential for participants to build on their initial credentials and obtain additional credentials with other educators and partners, was funded as proposed. Other staff at this program noted that entry-level jobs turned out to be scarce, which was not anticipated by program designers. Longer-term follow up will help determine whether the strategy of helping people get a start in high-tech industries, even in entry-level position – a strategy that was approved by U.S. DOL when it awarded these TechHire and SWFI grants – will yield the intended results of moving individuals with lower skills into well-paying, higher-skilled jobs.
• One of the programs that did train people for middle- and high-skilled jobs heavily screened applicants before accepting them into the program to ensure they had the skills necessary to be successful in training. The participants in this program had higher levels of education, including many who had bachelor’s degrees. This underscores how challenging it can be to train people with low levels of technical skills for high-skilled jobs, especially in a short time frame.
Distinction Between TechHire or SWFI and Other Skills Training Programs • There was considerable variation in the extent to which the occupational skills training
offered under the TechHire and SWFI programs differed from training that individuals could receive outside the programs. Across all the programs, TechHire and SWFI staff reported that the provision of case management support was a distinguishing feature relative to training programs available in the broader community. Additionally, the Wave 1 survey (which captured 7 to 14 months of follow-up) showed that the TechHire and SWFI programs produced statistically significant impacts on outcomes related to the provision of this kind of support, including receipt of job readiness training and preemployment services geared toward helping participants look for and obtain a job.
In most of the TechHire and SWFI programs, the occupational skills training offered was the same, or nearly the same, as what individuals could get outside TechHire or SWFI, sometimes at the same college offering the TechHire and SWFI training. In at least one program, TechHire/SWFI and control group members might even sit next to each other in the same classrooms. Often the content of training offered under TechHire and SWFI and to the general public at the college was very similar, but the TechHire and SWFI classes were smaller or offered in a cohort, or self-paced online, instead of on a regular academic schedule. But it may have been possible in some locations to find similarly structured classes in the community. At one program, the training offered through TechHire was not available at the college outside TechHire, but staff reported that similar training was offered elsewhere in the community. Without clear distinctions between training and services
Implementation and Early Impacts Report 5-4
received by program group members and control group members, it can be harder for a program to result in positive impacts on employment and earnings.
However, one notable difference between TechHire or SWFI and other similar training programs was the cost to participants. Although the training offered under TechHire and SWFI was often similar to other training available in the community, the TechHire and SWFI training was offered at no cost to the student. This was intended to increase access for a population that would not otherwise be able to afford training programs or would end up with a substantial amount of debt. At one program, however, other grants were available to control group members, enabling them to receive the same training offered to the TechHire/SWFI group, also at no cost. Overall, the survey findings showed that TechHire and SWFI reduced the number of people paying for training relative to the control group, and the amount paid out-of-pocket, by a statistically significant amount.
Case management support was a key difference between the TechHire and SWFI programs and training programs available to control group members. All five of the TechHire and SWFI programs had hired dedicated case managers to provide support to participants.63 These staff members checked in with students, followed up with them if they missed class, and helped them address barriers keeping them from participating. Even where control group members could receive similar or identical training to TechHire and SWFI at the same colleges, they would not have access to the support provided by the programs’ case managers. Though it is not possible to isolate the effects of case management support from other aspects of the programs, case management support could be an important feature of the programs leading to impacts on participation in training, discussed below.
Financial supports, such as assistance with transportation, books, tools, or uniforms, were also made available to the TechHire/SWFI group, but in practice, according to staff, they were not used as much as expected. Still, the programs produced statistically significant impacts on the receipt of such support services.
Training Participation Impacts • The TechHire and SWFI programs increased participation in occupational skills training
relative to the control group. TechHire/SWFI also produced a statistically significant impact on currently being enrolled in or having already completed occupational skills training within 7 to 14 months of entering the RCT, the study’s confirmatory outcome.64
63 At the East Coast Florida program, one of the three colleges in the partnership had a case manager. 64 The confirmatory outcome is the one most likely to be affected in the current follow-up period if the programs were
successful. A statistically significant impact on this outcome represents the highest level of evidence of the success of the programs. See Box 4.2 for more information.
Implementation and Early Impacts Report 5-5
The increase in training participation and the impact on the study’s confirmatory outcome are positive results and provide evidence that the study achieved a treatment contrast.65 As of the Wave 1 survey, 43 percent of TechHire/SWFI group members were either currently enrolled in or had completed occupational skills training, compared with only 21 percent of control group members. For the TechHire and SWFI programs, enrolling in and completing training are the first steps toward increasing participants’ employment and earnings.
Child Care Supports • SWFI increased the likelihood of participants receiving help to find or access child care (by a
statistically significant amount), though it did not have an impact on the use of child care or on seeing child care as a barrier to training or employment. Interviews with staff revealed a mismatch between participants’ child care needs and what the programs could offer.
A key method by which the SWFI programs aimed to help parents successfully participate in and complete training was to help them find high-quality, reliable, and affordable child care. There is some evidence the programs achieved their goal of offering support for child care—31 percent of SWFI group members reported receiving help finding child care, a 17 percentage point increase over the control group average. However, this offered support did not translate into an increase in child care use or a reduction in child care barriers.
For example, similar rates of SWFI and control group members (29%) reported having to quit a job, job search, or training because of difficulties obtaining child care. A reasonable explanation for the SWFI programs having an impact on receiving help finding child care but not on the use of child care or elimination of child care as a barrier is that survey respondents were thinking about the help they received, and not necessarily about whether they found child care they could use with that help. While staff may have offered to help with child care and even provided guidance on finding child care, the help may not have been needed (because informal child care was already in place) or useful, perhaps because child care was not available when the participant needed it.
Several staff members from both SWFI programs reported that students commonly relied on informal care from family, neighbors, or friends while in training, and therefore most did not express the need for formal child care when they entered the SWFI program. One reason why formal care was not used more often was that it was not available in the evening, which is when many training classes were held. SWFI staff also noted that the time when formal child care arrangements were most likely to be needed was when participants became employed—but the programs were only able to help participants during training. While there were substantial barriers to helping informal care providers become licensed in order to be paid by county child care subsidies, both SWFI programs were engaged in systems-change efforts aimed at overcoming these barriers and improving the availability, quality, and affordability of child care in their local areas.
65 A study’s “treatment contrast” represents the differences in the services available to the program and control groups,
as well as in the rates of key services (in this case, occupational skills training) received across research groups.

Implementation and Early Impacts Report 5-6
Employer Partnerships and Engagement • Employer partnerships and engagement fell short of program leadership’s expectations,
especially in the provision of work-based learning and/or providing jobs for training graduates.
Employer partners provided input on program design and curricula and participated in advisory groups and career and job awareness activities. Although the programs developed strong partnerships with employers for training incumbent workers (who were not part of the RCT),66 the programs were largely unable to induce employers to provide internships or apprenticeships for training participants, nor were employers willing to give hiring preferences to training graduates. Staff members across all five TechHire and SWFI programs noted that employers wanted to hire people with experience, rather than those fresh from a training class. Staff had hoped that work-based learning opportunities, such as internships and apprenticeships, would provide relevant job experiences to their training graduates, but employers ultimately did not provide these types of work-based learning experiences. The lack of job developers among program staff in all but one site further limited connections with employers.
Career Awareness, Job Readiness, and Job Development • For the most part, career awareness, job readiness training, and job development were not
fully developed or integrated with other components of the TechHire and SWFI programs.
Staffing limitations minimized the attention given to preparing and supporting participants in their job searches after they had completed training. One program spent much of its first two weeks of each training cohort focused on career awareness and job readiness activities, but it did not have job developers on staff to help when students were ready to look for jobs. Only one program had a dedicated job developer for the duration of its training program. Case managers often handled these functions. Staff members mentioned that some instructors helped students make connections with employers. Staff at a few colleges spoke of the difficulty getting participants to communicate with them once training ended. These programs had few opportunities post-training to work with participants and prepare them for employment.
Labor Market Outcomes • As expected, given the short follow-up period captured by the Wave 1 survey (7 to
14 months), there is no evidence yet that TechHire/SWFI affected labor market outcomes. However, the impacts on participation in and completion of occupational skills training, including the impact on the study’s confirmatory outcome, provide a reason to be cautiously optimistic about longer-term impacts on employment and earnings emerging.
66 Incumbent workers, in TechHire and SWFI, were people who were already employed in the industry and sent to the
programs by their employers for training.

Implementation and Early Impacts Report 5-7
It is unclear at this point whether the short-term training impacts will hold in the long term and whether they will translate into impacts on employment and earnings. Past research has shown that it can take up to two or even three years before economic impacts begin to emerge.67 This is well beyond the follow-up period covered in this report. The Wave 2 survey (which will capture a roughly 18-month follow-up period) will provide more evidence on how many participants complete training and succeed in obtaining jobs.
Based on the implementation findings, there are reasons both within and outside the programs’ control that TechHire and SWFI may or may not produce impacts on labor market outcomes. As noted above, these programs lacked dedicated job developers, struggled to provide internships or other work-based learning opportunities, and generally lacked employers’ commitment to hire training graduates. Three programs discussed the fact that entry-level jobs in these industries, jobs for which the training they provided prepared individuals, were drying up. On the other hand, case managers provided individualized support that seemed to help participants persist in training, and that could potentially help them become job-ready in other ways, and instructors and other staff sometimes took on the role of job developer.
A Changing Economic Environment • In spring 2020, there were massive changes in local economic contexts because of the
coronavirus pandemic. It is unclear whether or how the industries targeted by the TechHire and SWFI programs, and the needs for skilled labor, will change as a result.
The final interviews with program staff in March and April 2020 occurred at the beginning of the economic downturn caused by the coronavirus pandemic and pointed to economic changes already under way. At one program that offered information technology training, staff noted that they were getting more applications from women and people with more experience. They reported that in the past when the economy was strong, they enrolled many underemployed students. Since the pandemic began, they expected to see higher numbers of fully unemployed people and were already starting to see even more people with four-year degrees. Staff at all programs expected the pandemic would bring significant changes to their communities, their programs, and the participants, but it was too early to know what these changes would be. A future report will provide some evidence on how the pandemic affected the training, child care, and labor market outcomes for the individuals in the study, and discuss whether the pandemic could have changed the impacts of the TechHire and SWFI programs.
Sustainability • Though many staff across the TechHire and SWFI programs expressed interest in continuing
to offer training and services, they acknowledged that this would be challenging without continued funding.
One program noted that it was trying to “institutionalize” its services by identifying promising practices from its program and incorporating those practices into other existing programs. Several programs noted that the TechHire or SWFI grants allowed them to make investments in equipment that would help them continue to offer similar training in the future. Finally, several programs noted that the training offered under TechHire or SWFI could continue, but unless they could 67 Card, Kluve, and Weber (2018) and Schaberg (2017).

Implementation and Early Impacts Report 5-8
secure other grant funding in the future, it would have to be tuition-based rather than at no cost to students. It also remained unclear how, if it all, programs could continue to offer the kind of case management support provided through their TechHire and SWFI programs unless they could secure additional grant funds.68
Future Reports At this point, it is too early to conclude whether TechHire and SWFI increased participants’ employment and earnings. Past research has shown that it can take up to two or even three years before economic impacts begin to emerge for participants in similar training programs. Future reports, using data with longer follow-up periods (up to three years), will assess whether the increase in training participation will translate into an increase in employment and earnings. Another question that will continue to be explored is to what extent TechHire and SWFI participants can find entry-level, middle-, or high-skilled jobs in high-growth sectors and whether entry-level jobs offer pathways into well-paying, middle- or high-skilled jobs.
68 Sustainability efforts may have continued to be developed after the conclusion of data collection. The efforts reported
here, therefore, may not be exhaustive of all efforts that the programs eventually put in place.

Implementation and Early Impacts Report R-1
References
Card, David, Jochen Kluve, and Andrea Weber. (2018). “What Works? A Meta Analysis of Recent Active Labor Market Program Evaluations.” Journal of the European Economic Association 16, 3: 894–931.
Cohen, Jacob. (1992). “A Power Primer.” Psychological Bulletin 112, 1: 155.
Fein, David, and Jill Hamadyk. (2018). Bridging the Opportunity Divide for Low-Income Youth: Implementation and Early Impacts of the Year Up Program. OPRE Report 2018-65. Washington, DC: Office of Planning, Research, and Evaluation, Administration for Children and Families, U.S. Department of Health and Human Services.
Friend, Daniel, and Diane Paulsell. (2020). Research to Practice Brief: Developing Strong Recruitment Practices for Healthy Marriage and Relationship Education (HMRE) Programs. Washington, DC: Office of Planning, Research and Evaluation, Administration for Children and Families, U.S. Department of Health and Human Services.
Gennetian, Lisa, and Charles Michalopoulos. (2003). Child Care and Employment: Evidence from Random Assignment Studies of Welfare and Work Programs. New York: MDRC.
Gueron, Judith, and Gayle Hamilton. (2002). The Role of Education and Training in Welfare Reform. Welfare Reform and Beyond. Policy Brief (April). New York: MDRC.
Hendra, Richard, Keri-Nicole Dillman, Gayle Hamilton, Erika Lundquist, Karin Martinson, and Melissa Wavelet. (2010). How Effective Are Different Approaches Aiming to Increase Employment Retention and Advancement? New York: MDRC.
Hendra, Richard, David H. Greenberg, Gayle Hamilton, Ari Oppenheim, Alexandra Pennington, Kelsey Schaberg, and Betsy L. Tessler. (2016). Encouraging Evidence on a Sector-Focused Advancement Strategy: Two-Year Impacts from the WorkAdvance Demonstration. New York: MDRC.
Hill, Carolyn J., Howard S. Bloom, Alison Rebeck Black, and Mark W. Lipsey. (2007). “Empirical Benchmarks for Interpreting Effect Sizes in Research.” Unpublished paper. New York: MDRC.
James Bell Associates. (2010). Implementation Resource Guide for Social Service Programs: An Introduction to Evidence-Based Programming. Washington, DC: Office of Family Assistance, U.S. Department of Health and Human Services.
Magidson, Jay. (2005). SI-CHAID 4.0 User’s Guide. Belmont, MA: Statistical Innovations Inc.
Maynard, Rebecca A., and Nianbo Dong. (2013). “PowerUp!: A Tool for Calculating Minimum Detectable Effect Sizes and Minimum Required Sample Sizes for Experimental and Quasi-Experimental Design Studies. Journal of Research on Educational Effectiveness 6, 1:24-67.
Molina, Frieda, and Donna Wharton-Fields. (2019). Filling All the Seats in the Room: Using Data to Analyze Enrollment Drop-Off. New York: MDRC.
Olken, Benjamin A. (2015). “Promises and Perils of Pre-Analysis Plans.” The Journal of Economic Perspectives 29, 3: 61-80.

Implementation and Early Impacts Report R-2
Peck, Laura R., Daniel Litwok, Douglas Walton, Eleanor Harvill, and Alan Werner. (2019). Health Profession Opportunity Grants (HPOG 1.0) Impact Study: Three-Year Impacts Report. Washington, DC: Office of Planning, Research, and Evaluation, Administration for Children and Families, U.S. Department of Health and Human Services.
Peck, Laura R., Alan Werner, Eleanor Harvill, Daniel Litwok, Shawn Moulton, Alyssa Rulf Fountain, and Gretchen Locke. (2018). Health Profession Opportunity Grants (HPOG 1.0) Impact Study Interim Report: Program Implementation and Short-Term Impacts. Washington, DC: Office of Planning, Research, and Evaluation, Administration for Children and Families, U.S. Department of Health and Human Services.
Roder, Anne, and Mark Elliott. (2019). Nine Year Gains: Project QUEST’s Continuing Impact. New York: Economic Mobility Corporation.
Schaberg, Kelsey. (2017). Can Sector Strategies Promote Longer-Term Effects? Three-Year Impacts from the WorkAdvance Demonstration. New York: MDRC.
Seefeldt, Kristin, Whitney Engstrom, and Karen Gardiner. (2016). Finances, Family, Materials, and Time: Career Pathways Participants’ Perceived Challenges. OPRE Report 2016-28. Washington DC: Office of Planning, Research and Evaluation, Administration for Children and Families, U.S. Department of Health and Human Services.
Tessler, Betsy, Michael Bangser, Alexandra Pennington, Kelsey Schaberg, and Hannah Dalporto. (2014). Meeting the Needs of Workers and Employers: Implementation of a Sector-Focused Career Advancement Model for Low-Skilled Adults. New York: MDRC.
U.S. Bureau of Labor Statistics. “Local Area Unemployment Statistics.” Data extracted on Jan 7, 2021. Website: https://www.bls.gov/lau/.
Wulfsohn, Samantha, Jennifer Miller Gaubert, and Donna Wharton-Fields. (2019). Recruiting New Participants: Eight Steps to Full Enrollment. New York: MDRC.

Appendix A
Supplementary Exhibit for Chapter 2

Implementation and Early Impacts Report A-1
Appendix A Supplementary Exhibit for Chapter 2
Table A-1. Program training characteristics
Program Training length Training/credentials offered
Training delivery Who delivers the training? How is training delivered, pre- and post-COVID-19
pandemic?
Credit or noncredit
Denver
1-4 semesters
BootUp Camps at CCD: 6 days
Health Care: Nurse Aide; Phlebotomy Technician; Emergency Medical Tech; Food, Nutrition & Wellness; Patient Care Tech; Patient Representative; Medical Assistant; Human Services.
Information Technology (IT): IT Tech and Support; Creative Tools; Data Analytics; Computer Technology; Office Assistant; Basic Networking & Security; Office Administration; PC Application Specialist; Computer Services & Support; Cyber Security; Network Security; Healthcare Administration; IT in Healthcare; BootUp Camps (A+ I & II; Network+; Microsoft Office Specialist (MOS); Internet Core Competency Certification (IC3).
CCA and CCD delivered the training directly.
In light of the COVID-19 pandemic, Certified Nursing Assistant (CNA) classroom portions of classes went online but clinical portions could not go online. Advanced manufacturing has ceased altogether because these courses are hands-on.
Credit

Implementation and Early Impacts Report A-2
Table A-1. Program training characteristics (continued)
Program Training length Training/credentials offered
Training delivery Who delivers the training? How is training delivered, pre- and post-COVID-19
pandemic?
Credit or noncredit
Tampa 1 week-6 months
IT: CompTIA A+; CompTIA A+ Certification; CompTIA A+ Combined; CompTIA Network+; CompTIA Network+ Certification; CompTIA Security+; CompTIA Security+ Certification; Cisco CCNA Certification (CCENT); Cisco Certified Network Associate (CCNA); CIW Javascript Specialist; Database Analytics Bootcamp; Digital Marketing; HTML 5/CSS3; Intermediate Python Programming; Introduction to Python; Introduction to Programming Using Python Certification; Introduction to SQL; Introduction to SQL Database Certification; iOS Application Development; iOS Application Development Fundamentals Certification; Java 8SE; Java 8SE Certification; Java Programming 1 Bootcamp; Java Programming 2 Bootcamp; Microsoft Certification: Python Programming; Programming in HTML5 with Javascript and CSS3; Python 1 Bootcamp; Python 2 Bootcamp; Web Development Bootcamp; Web Development Program, WordPress Fundamentals.
Partner colleges – Hillsborough Community College (HCC), St. Pete College (SPC), University of South Florida (USF) – deliver the training. USF delivers the bootcamps.
Since the pandemic, courses have gone online. All USF courses were already either hybrid online/in-person or fully online and other providers had online courses already. IT bootcamp has always been online. The Health Care program’s externships, which are required parts of courses, have not been able to move their externships virtual since the pandemic, which has slowed program completion.
Noncredit

Implementation and Early Impacts Report A-3
Table A-1. Program training characteristics (continued)
Program Training length Training/credentials offered
Training delivery Who delivers the training? How is training delivered, pre- and post-COVID-19
pandemic?
Credit or noncredit
East Coast Florida
IT: 6-12 weeks.
Advanced Manufacturing: 1-12 weeks.
Many classes were self-paced.
Advanced Manufacturing: IPC J-Std. Soldering; IPC 610 Inspection; IPC 620 Cable and Harness; CNC Machinist; OSHA 10; OSHA 30; OSHA 40; HAZWOPER 40; Certified Production Technician MSSC Certification; Tier 2 NIMS Certifications (Electrical, Mechanical, Rigging); Basic Soldering; Advanced Soldering.
IT: CompTIA Fundamentals; CompTIA A+; CompTIA Network+; CompTIA Security+; Project Management; Microsoft Office Specialist; Agile; Java SE 8; Oracle Databases; Microsoft Access.
Colleges delivered the training directly.
Most classes were online before the pandemic, but all went online afterwards.
Credit
New York City 5-9 months
IT: Web Development (certification: Completion SE Training); A+Net+ (certifications: CompTIA A+ and Network+).
LAGCC partnered with three training providers: General Assembly, Software Guild, and Udacity.
Prior to the pandemic, each provider had a different training system: General Assembly was completely classroom-based, Software Guild was a hybrid of in-person and online, and Udacity was fully online. After the pandemic hit, all courses were moved to online.
Noncredit
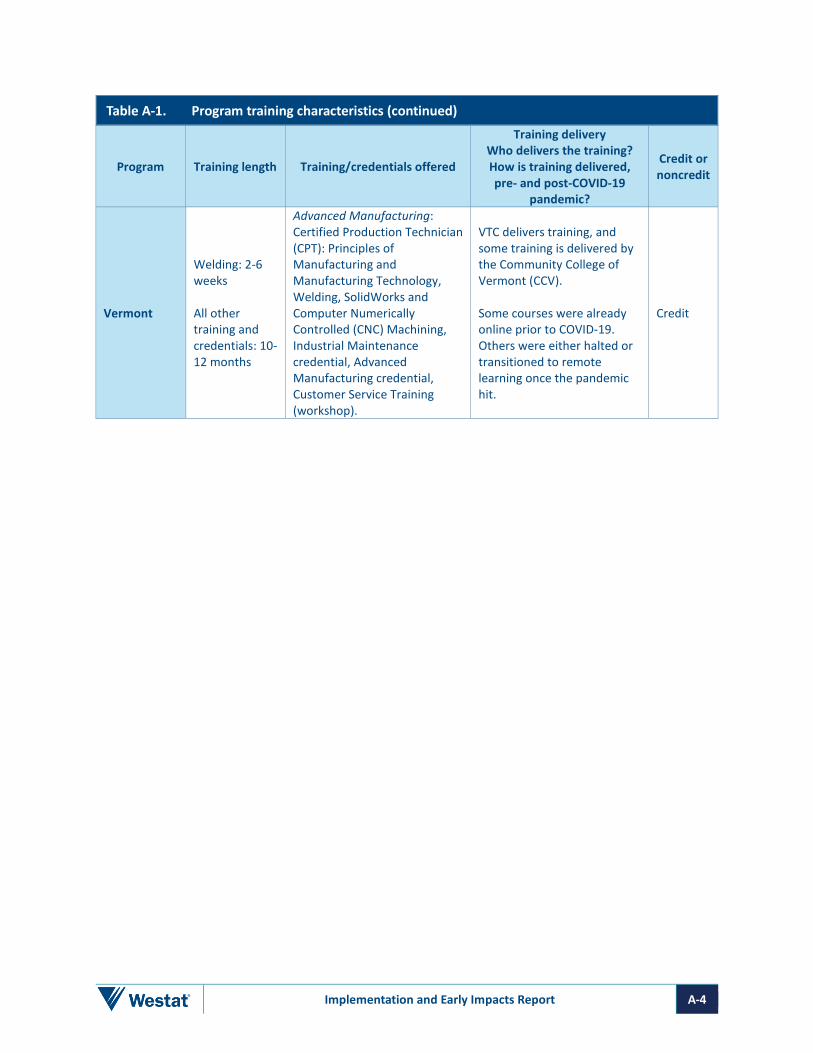
Implementation and Early Impacts Report A-4
Table A-1. Program training characteristics (continued)
Program Training length Training/credentials offered
Training delivery Who delivers the training? How is training delivered, pre- and post-COVID-19
pandemic?
Credit or noncredit
Vermont
Welding: 2-6 weeks All other training and credentials: 10-12 months
Advanced Manufacturing: Certified Production Technician (CPT): Principles of Manufacturing and Manufacturing Technology, Welding, SolidWorks and Computer Numerically Controlled (CNC) Machining, Industrial Maintenance credential, Advanced Manufacturing credential, Customer Service Training (workshop).
VTC delivers training, and some training is delivered by the Community College of Vermont (CCV).
Some courses were already online prior to COVID-19. Others were either halted or transitioned to remote learning once the pandemic hit.
Credit

Appendix B
Collection and Analysis Approaches for the Randomized Controlled Trial Quantitative Data

Implementation and Early Impacts Report B-1
Appendix B Collection and Analysis Approaches for the Randomized Controlled Trial Quantitative Data
This appendix describes the collection and analysis approaches for the quantitative data used in this report.
Random Assignment and Baseline Data After individuals completed the intake process and were deemed eligible for the study, they were randomly assigned using a web-based system managed by MDRC. Individuals also completed a baseline survey at that time. This survey asked individuals about their demographics, prior employment and education, and various other characteristics.
Random Assignment Ratio The random assignment ratio differed across the TechHire/SWFI programs based on an agreement with each program. Three programs (East Coast Florida, Tampa, and Vermont) used a 50/50 random assignment ratio, one program (Denver) used a 60/40 random assignment ratio, and one program (New York City) initially used a 50/50 random assignment ratio and then later transitioned to a 66/33 ratio.69
The de-facto “average” random assignment ratio for the pooled sample is 54/46. Appendix Table B-1 shows the enrollment dates and random assignment ratio for each program, along with the number of sample members who were randomly assigned in each program at each ratio.
Table B-1. Random assignment ratios, enrollment dates, and sample sizes, by program
Program Random assignment ratio Enrollment dates Number of individuals randomly assigned
East Coast Florida 50/50 4/23/2018 – 2/4/2019 240
New York City 50/50 9/18/2018 24 66/33 3/1/2019 – 12/19/2019 96
Tampa 50/50 8/6/2018 – 8/12/2019 299 Denver 60/40 5/30/2018 – 1/3/2020 213 Vermont 50/50 8/22/2018 – 10/1/2019 80
Source: TechHire/SWFI random assignment data.
69 The New York City program used “batch random assignment,” meaning the program identified a group of individuals
eligible for each training cycle they offered and then the entire group was randomly assigned at once. All of the other program used continuing, individual-level random assignment.

Implementation and Early Impacts Report B-2
Baseline Equivalence The evaluation team conducted a special analysis to check for statistically significant differences in select baseline characteristics by research group. As expected, only one statistically significant difference in the selected baseline characteristics was found: individuals in the TechHire/SWFI group were more likely than individuals in the control group to be Asian (Table B-2). In addition, a logistic regression was run to test whether key baseline characteristics could predict whether a participant was in the TechHire/SWFI group. The model included 21 covariates that were regressed on a TechHire/SWFI group indicator (P = 1 = TechHire/SWFI group; P = 0 = control group). The model is not statistically significant (p-value = 0.315), indicating that TechHire/SWFI and control group members do not differ significantly across the key selected baseline characteristics (Table B-3).
Table B-2. Selected baseline characteristics for TechHire/SWFI sample members, by research group
Characteristic TH/SWFI group Control group P-value Demographics
Average age (years) 29 29 0.945 Age
17 to 24 34.8 39.8 0.336 25 to 29 35.6 29.4 0.336 30 and older 29.6 30.8 0.690
Gender (%) Male 43.8 40.0 0.400 Female 56.0 59.5 0.400 Other 0.2 0.5 0.400
Hispanic/Latino (%) 25.0 23.7 0.646 Race (%)
White 44.0 44.4 0.910 Black/African-American 40.7 45.1 0.183 Asian 10.2 6.4 0.042** Native Hawaiian or Pacific Islander 1.2 0.7 0.450 American Indian or Alaska Native 4.4 5.1 0.580 Other race 6.4 6.1 0.853
Primary spoken language is English (%) 88.0 89.3 0.534 Family status Marital status (%)
Single, never married 70.5 72.1 0.467 Married and living with spouse 2.2 3.3 0.467 Married but living apart from spouse 19.5 16.3 0.467 Legally separated, divorced, or widowed 7.9 8.3 0.467
Living with a partner (%) 14.2 17.4 0.182 Parent of one or more children under 19 (%) 38.7 35.7 0.334
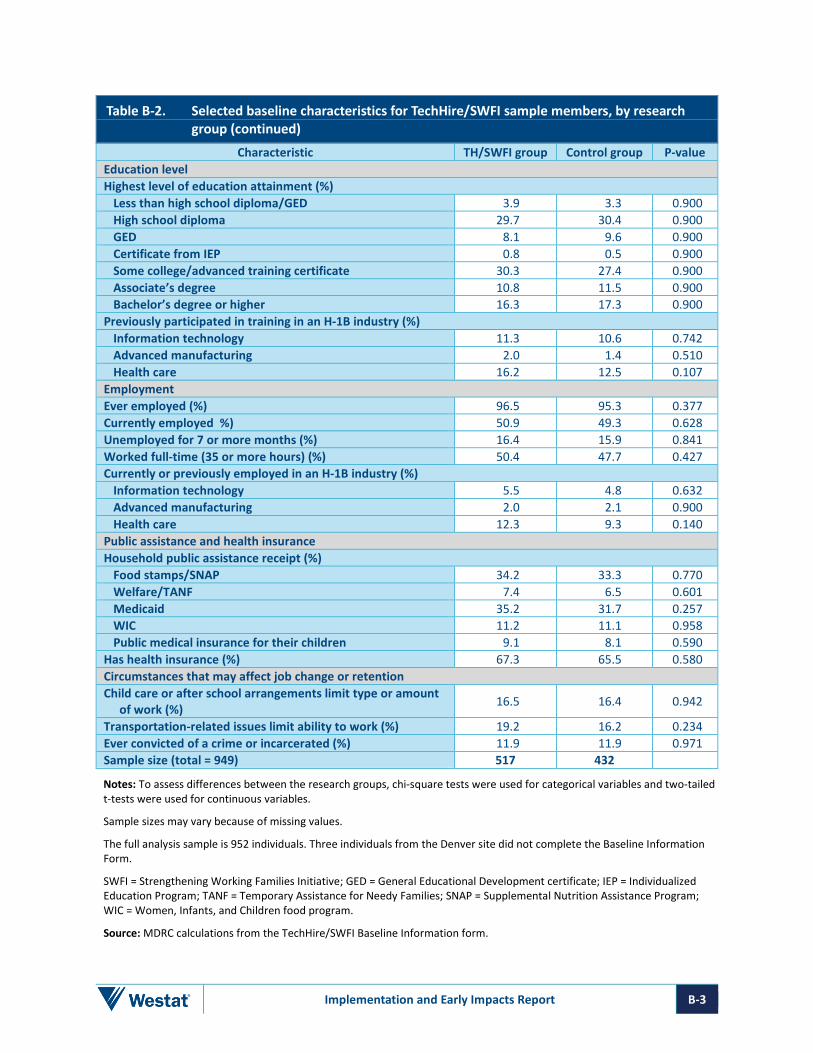
Implementation and Early Impacts Report B-3
Table B-2. Selected baseline characteristics for TechHire/SWFI sample members, by research group (continued)
Characteristic TH/SWFI group Control group P-value Education level Highest level of education attainment (%)
Less than high school diploma/GED 3.9 3.3 0.900 High school diploma 29.7 30.4 0.900 GED 8.1 9.6 0.900 Certificate from IEP 0.8 0.5 0.900 Some college/advanced training certificate 30.3 27.4 0.900 Associate’s degree 10.8 11.5 0.900 Bachelor’s degree or higher 16.3 17.3 0.900
Previously participated in training in an H-1B industry (%) Information technology 11.3 10.6 0.742 Advanced manufacturing 2.0 1.4 0.510 Health care 16.2 12.5 0.107
Employment Ever employed (%) 96.5 95.3 0.377 Currently employed %) 50.9 49.3 0.628 Unemployed for 7 or more months (%) 16.4 15.9 0.841 Worked full-time (35 or more hours) (%) 50.4 47.7 0.427 Currently or previously employed in an H-1B industry (%)
Information technology 5.5 4.8 0.632 Advanced manufacturing 2.0 2.1 0.900 Health care 12.3 9.3 0.140
Public assistance and health insurance Household public assistance receipt (%)
Food stamps/SNAP 34.2 33.3 0.770 Welfare/TANF 7.4 6.5 0.601 Medicaid 35.2 31.7 0.257 WIC 11.2 11.1 0.958 Public medical insurance for their children 9.1 8.1 0.590
Has health insurance (%) 67.3 65.5 0.580 Circumstances that may affect job change or retention Child care or after school arrangements limit type or amount
of work (%) 16.5 16.4 0.942
Transportation-related issues limit ability to work (%) 19.2 16.2 0.234 Ever convicted of a crime or incarcerated (%) 11.9 11.9 0.971 Sample size (total = 949) 517 432
Notes: To assess differences between the research groups, chi-square tests were used for categorical variables and two-tailed t-tests were used for continuous variables.
Sample sizes may vary because of missing values.
The full analysis sample is 952 individuals. Three individuals from the Denver site did not complete the Baseline Information Form.
SWFI = Strengthening Working Families Initiative; GED = General Educational Development certificate; IEP = Individualized Education Program; TANF = Temporary Assistance for Needy Families; SNAP = Supplemental Nutrition Assistance Program; WIC = Women, Infants, and Children food program.
Source: MDRC calculations from the TechHire/SWFI Baseline Information form.

Implementation and Early Impacts Report B-4
Table B-3. Estimated regression coefficients for probability of being a TechHire/SWFI group member
Characteristic Parameter estimate Age 17-24 -0.190 Age -0.004 Female -0.193 Hispanic 0.023 Black/African-American -0.227 Parent of any children under age 19 or pregnant 0.116 Lives with a child ages 1 to 5 0.135 Primary language is English 0.063 Has some college/advanced training certification or more education 0.023 Previously received training in target industry 0.039 Childcare arrangements limit the amount/type of work -0.192 Currently employed 0.095 Employed in last 7 months 0.072 Worked full-time at current/most recent job 0.147 Receives food stamps/SNAP 0.072 Transportation-related issues limit ability to work 0.306 Randomly assigned at Denver program 0.607** Randomly assigned at East Coast Florida program 0.161 Randomly assigned at New York City program 0.964** Randomly assigned at Tampa Bay program 0.266 Randomly assigned at 50/50 ratio at New York City program -0.77* Model Statistics R-squared 0.028 Chi-square statistic 26.768 P-value of chi-square statistic 0.315
Notes: A chi-square test was applied to differences between outcomes for TechHire/SWFI group and control group members.
Statistical significance levels are indicated as follows: *** = 1 percent; ** = 5 percent; * = 10 percent.
SWFI = Strengthening Working Families Initiative.
Source: MDRC calculations from the TechHire/SWFI Baseline Information form.
Wave 1 Survey The evaluation team conducted the Wave 1 survey with randomized controlled trial (RCT) study participants starting approximately six months after random assignment. The survey was fielded to the full sample of participants randomly assigned to the three TechHire and two SWFI programs. The survey was conducted in two phases. In the first phase, participants were contacted by letter or email asking them to complete the survey on the web. Nonrespondents received weekly letter, email, and text message reminders. In the second phase, nonrespondents were contacted to complete the survey by telephone. On average, interviews were completed nine months after random assignment. The distribution of interview months was similar between the TechHire/SWFI and control groups.
The Wave 1 survey provides data on study participants’ job search activities, education and training, use of child care, job readiness and preemployment services, and employment and earnings. This section discusses the nonresponse analysis and weighting adjustments.

Implementation and Early Impacts Report B-5
Nonresponse Analysis and Weighting Appendix Table B-4 shows the Wave 1 survey response rates overall and by program. Among the 952 participants the evaluation team attempted to contact, 662 completed the survey, for an overall response rate of 70 percent.70 The response rate ranged from 55 percent (for the Vermont program) to 73 percent (for the Denver and New York City programs). There was a 1 percentage point difference in the response rates between the TechHire/SWFI and control groups overall (70 versus 69%), and there were small differences between the groups in some programs. To compensate for differential response, the evaluation team conducted a nonresponse bias analysis and created nonresponse-adjusted weights.
Table B-4. Wave 1 survey response rates, overall and by program
Sample All programs TechHire programs SWFI programs
East Coast Florida New York City Tampa Denver Vermont Overall Sampled (N) 952 240 120 299 213 80 Respondents (N) 662 160 88 214 156 44 Response rate (%) 70 67 73 72 73 55 TechHire/SWFI group Sampled (N) 518 121 77 150 129 41 Respondents (N) 362 86 58 103 91 24 Response rate (%) 70 71 75 69 71 59 Control group Sampled (N) 434 119 43 149 84 39 Respondents (N) 300 74 30 111 65 20 Response rate (%) 69 62 70 74 77 51
If the full sample differs from the survey respondents, nonresponse bias could be introduced into the impact estimates. In addition, if response rates differ between the TechHire/SWFI and control groups, this could also bias the impact estimates. To address this problem, the evaluation team computed non-response weighting adjustments based on the relationship between baseline covariates and response propensities using standard methods in survey research. (Appendix Table B-5 lists the variables included in the analysis.) These weights take into account how respondents differ from the full sample and reweight the respondents accordingly. These weights were applied to the analyses as a sensitivity check. It is important to note that the nonresponse-adjusted weights correct for bias from observable differences between respondents and nonrespondents. As is the case in all impact evaluations, it is not possible to address potential bias from unobservable characteristics.
70 Two Wave 1 survey respondents were excluded from the main impact analysis shown in this report because they were
interviewed more than 14 months after they entered the RCT.

Implementation and Early Impacts Report B-6
The following procedures were used to create the nonresponse weights:
• Use a Chi-square automatic interaction detection (CHAID) analysis to identify interactions between baseline characteristics that are predictive of survey response.71
• Use a stepwise logistic regression to predict survey response based on baseline characteristics and any interactions found in the CHAID analysis.
• Develop predicted probabilities of response using a logistic regression and the variables identified in Steps 1 and 2 above.
• Sort the data based on the response propensity and then divide the sample into quintiles.
• Create the nonresponse-adjusted weights by taking the inverse of the response rate within each quintile.
Each step is described in more detail below.
Table B-5. Variables included in nonresponse bias analysis
Female Age African American Hispanic Primary language is English Education is at least some college or higher Lives with child ages 0 to 5 Parent of any child age 19 or younger Currently employed Currently working full time Previously received training in the target industry Household receives Supplemental Nutritional Assistance Program (SNAP) Limited in amount/type of work by child care arrangements Limited in amount/type of work by transportation-related issues Program TechHire/SWFI group Random assignment in the first half of the program’s intake period
Note: Missing data indicators were also included for each baseline characteristic that had missing data.
Source: Baseline Information Form. Step 1
The evaluation team used baseline characteristics from the baseline information form in a CHAID analysis to identify interactions predictive of survey response. A CHAID analysis is preferable to using logistic regression because of the large number of interactions to be tested. For the CHAID analysis, the evaluation team tested all possible three-way interactions and set the maximum p-value, for a split to be considered at 0.30. The CHAID analysis found only one three-way interaction that met this criterion: (1) participants in the Vermont program with some college or higher and 71 Magidson (2005).

Implementation and Early Impacts Report B-7
transportation problems and (2) participants in other programs with less than a college education and no transportation problems.
Step 2
Next, the evaluation team ran a logistic regression analysis to determine which variables to include in the model predicting survey response. The team used forward selection with a p-value of 0.20 to both enter and stay in the model. All of the baseline characteristics were included as well as two- and three-way interactions among program, education, and transportation identified in the CHAID analysis. The evaluation team also included indicator variables for missing baseline characteristics. The team forced program and TechHire/SWFI group to be retained in the model even if not significant. The stepwise regression revealed that the following baseline characteristics were predictive of survey response: female, some college or higher, employed, has children, prior training experience, the interaction of the Vermont program and transportation issues, and the indicator for missing the English as the primary language variable.
Step 3
The evaluation team included the variables identified in step 2 above in the final response status model. In addition to these variables, the team also included in the response status model the transportation problems variables because the interaction with other variables was included. The speaks English as the primary language variables were also included because the missing indicator was included. The evaluation team calculated predicted response propensities as the predicted probabilities from the logistic regression.
Step 4
The evaluation team calculated the predicted response propensities from the response status model for both survey respondents and nonrespondents and sorted the data into five equal groups, or quintiles, based on the response propensities.
Step 5
Finally, the evaluation team calculated nonresponse-adjusted weights as the inverse of the response rate within each quintile. This method is useful for reducing the effect on the weights of observations with extreme response propensities. The team calculated normalized weights by dividing each nonresponse-adjusted weight by the mean weight.
Comparison of Wave 1 Survey Respondents with Survey Nonrespondents and with the Full Sample Appendix Table B-6 compares the baseline characteristics of survey respondents with survey nonrespondents and with the full sample of participants randomly assigned. The comparisons are conducted with and without nonresponse weights (using a p-value of 0.100). Only one characteristic—having more than a college education—is significantly different between the survey respondents and the full sample. Respondents with more education were more likely to respond to the survey. When the survey respondents were weighted to account for nonresponse propensity, respondents and the full sample do not differ on this or any of the other variables. Overall, while only one variable differed significantly before weighting, the weights do a good job of making the two samples more similar on all of the baseline characteristics.

Implementation and Early Impacts Report B-8
Table B-6. Comparison of Wave 1 survey respondents with nonrespondents and with the full sample
Variable Full sample percentage
Survey nonrespondents
percentage
Unweighted respondents Weighted respondents
Percentage Chi-square P-value vs. full sample
Percentage Chi-square P-value vs. full sample
Program East Coast Florida 25.2 27.6 24.2 0.63 25.7 0.83 Denver 22.4 19.7 23.6 0.58 22.4 0.98 New York City 12.6 11 13.3 0.68 12.8 0.9 Tampa 31.4 29.3 32.3 0.7 31.7 0.89 Vermont 8.4 12.4 6.7 0.19 7.4 0.44 Random
assignment in first half of intake period
48.6 48.3 48.8 0.95 48.7 0.98
TechHire/SWFI group 54.4 53.8 54.7 0.91 54.9 0.83
Age 17 to 29 69.6 71 69 0.79 69.2 0.86 Black 39.9 36.6 41.4 0.55 41.6 0.49 English as primary
language 87.9 89 87.5 0.78 88 0.94
Female 57.1 53.1 58.9 0.48 57 0.95 Hispanic 23.7 23.8 23.7 0.99 23 0.73 Some college or
higher 55.9 45.9 60.3* 0.08 55.9 1
Lives with child ages 0 to 5 23.4 27.9 21.5 0.35 22.8 0.77
Parent of any child age 19 or younger
36.7 39 35.7 0.68 36.4 0.91
Household receives Supplemental Nutrition Assistance Program (SNAP)
33.7 35.9 32.8 0.69 33.3 0.88
Limited in amount/type of work by child care arrangements
16.1 16.9 15.7 0.85 15.6 0.79
Currently employed 49.1 42.8 51.8 0.28 49.4 0.9
Received training in target industry
21.9 16.6 24.2 0.27 22.2 0.89

Implementation and Early Impacts Report B-9
Table B-6. Comparison of Wave 1 survey respondents with nonrespondents and with the full sample (continued)
Variable Full sample percentage
Survey nonrespondents
percentage
Unweighted respondents Weighted respondents
Percentage Chi-square P-value vs. full sample
Percentage Chi-square P-value vs. full sample
Limited in amount/type of work by transportation-related issues
17.2 19.3 16.3 0.63 16.1 0.56
Working full time 44.5 45.5 44.1 0.86 44.3 0.93
Notes: Characteristics with missing data were set to zero.
Statistical significance levels are indicated as: *** = 1 percent; ** = 5 percent; * = 10 percent.
Source: TechHire/SWFI Baseline Information Form. The nonresponse weights only adjust for bias in observed characteristics between the respondents and nonrespondents. As is the case in all impact evaluations, it is not possible to guarantee that there are not biases due to unobserved differences between respondents and nonrespondents.
Wave 1 Survey Weighted Impacts Appendix Table B-7 shows impacts on the study’s confirmatory outcome, as well as other key outcomes, weighted by the likelihood of survey response. The nonresponse weights were used as an additional sensitivity check to see whether there were any issues with the representativeness of who responded to the survey.
Table B-7. Impacts on training, employment, and child care arrangements, weighted by likelihood of survey response
Outcome (%) TH/SWFI group
Control group
Difference (impact) P-value
Confirmatory outcome Currently enrolled in or completed occupational skills training 42.2 21.6 20.6*** 0.000 Training Ever started occupational skills training 71.7 32.9 38.8*** 0.000 Currently enrolled in occupational skills training 20.9 8.4 12.5*** 0.000 Ever completed occupational skills training 31.2 16.9 14.3*** 0.000 Ever dropped out of occupational skills training 7.6 0.9 6.6*** 0.000 Ever obtained a professional certification or state/industry
license 19.1 9.8 9.3*** 0.001
Ever participated in on-the-job training, an internship, or an apprenticeship 19.0 14.5 4.5 0.129
Employment Ever employed 74.4 76.9 -2.5 0.426 Currently employed 58.1 62.6 -4.5 0.207

Implementation and Early Impacts Report B-10
Table B-7. Impacts on training, employment, and child care arrangements, weighted by likelihood of survey response (continued)
Outcome (%) TH/SWFI group
Control group
Difference (impact) P-value
Child care Youngest child received care while working or in training 20.5 19.1 1.4 0.615 Paid for child care 11.5 10.9 0.6 0.810 Was reimbursed for some or all child care payments 4.5 4.4 0.0 0.981 Received help finding child care 13.8 7.8 6.1*** 0.007 Had to quit a job, school, job search, or training due to issues
obtaining child care 12.2 12.4 -0.2 0.927
Did not take a job or did not start training due to issues obtaining child care 18.0 20.7 -2.7 0.330
Sample size (total = 660) 361 299
Notes: Estimates were regression-adjusted using ordinary least squares, controlling for pre–random assignment characteristics of sample members.
Sample sizes may vary because of missing values.
Statistical significance levels are indicated as: *** = 1 percent; ** = 5 percent; * = 10 percent.
TH = TechHire; SWFI = Strengthening Working Families Initiative.
Source: TechHire/SWFI Wave 1 survey. The results of the weighted analysis are extremely similar to the unweighted impacts. There are statistically significant impacts on the same outcomes, and the strength of those impacts are very similar. This provides assurance that there were not likely any serious issues with the representativeness of the survey sample.
Program Tracking Data The evaluation team collected program tracking data from the Participant Individual Record Layout (PIRL) database maintained by the U.S. Department of Labor. All TechHire and SWFI grantees were required to report information on participants in the PIRL database. These data track demographic and socioeconomic characteristics; program entry and exit; participation in training; receipt of credentials, degrees, and diplomas; and receipt of other services, including case management and assessments.
Appendix Table B-8, which compares the rates of training start between the PIRL data and the Wave 1 survey data, shows that the providers’ training records are mostly consistent with TechHire/SWFI group members’ responses to the question about their participation in training. For example, 74 percent of the TechHire/SWFI Wave 1 survey respondents indicated that they either did (63%) or did not (11%) participate in training, and the PIRL data support these responses. The remaining 26 percent of TechHire/SWFI survey respondents did not have consistent records across the data sources, and the results suggest that some respondents likely had challenges recalling that they participated in training.

`
B-11
Table B-8. Comparison of U.S. Department of Labor Participant Individual Record Layout (PIRL) data and Wave 1 survey reports of participation in training since random assignment among TechHire/SWFI Group survey respondents, by program and overall
Outcome East Coast Florida New York City Tampa Denver Vermont All programs
N % N % N % N % N % N % Not in training 8 9.3 5 8.6 17 16.7 5 5.5 4 16.7 39 10.8 PIRL-reported training only 27 31.4 7 12.1 7 6.9 18 19.8 2 8.3 61 16.9 Survey-reported training only 7 8.1 10 17.2 8 7.8 3 3.3 5 20.8 33 9.1 PIRL and survey-reported training 44 51.2 36 62.1 70 68.6 65 71.4 13 54.2 228 63.2 Sample size 86 58 102 91 24 361
Notes: Sample sizes may vary because of missing values.
N = number (sample size).
Sources: TechHire/SWFI Wave 1 survey and PIRL data.
Implem
entation and Early Impacts Report

Implementation and Early Impacts Report B-12
There are often some differences between what a program-tracking system will show and what an individual may recall or think of during a survey when asked specific questions about what they did. Additionally, TechHire and SWFI participants may have received services outside the programs and this training would be captured only in the survey data. Because of this, program-tracking data and survey data are not expected to match completely, but this type of comparison does provide some measure of the extent to which provider staff members use their systems to record participant activities.
Estimating the Effects of TechHire/SWFI Before estimating the effects of the TechHire/SWFI programs, the evaluation team conducted an analysis planning process and drafted an analysis plan that was reviewed by the study’s technical working group. All the analytic decisions discussed in this section were prespecified during that planning process and are included in the study’s analysis plan, with minor changes noted. Prespecification is a key means of safeguarding a statistical study from drawing false conclusions. By prespecifying, analysts are limited in their ability to “search for impacts” when they may not be present.
Pooling and Minimum Detectable Effects In any multisite impact evaluation, a key question is whether the impact estimates will be at the site level or whether the sites will be pooled in some way. In the case of the TechHire/SWFI evaluation, the research team considered pooling at the grant level—in other words, pooling the samples from the TechHire sites and the SWFI sites separately—and pooling the sample across all five grantees involved in the RCT.
To determine whether a grant-level analysis was possible, the research team calculated the minimum detectable effects (MDEs).72 The MDE is the smallest true effect that would yield statistically significant estimated effects 80 percent of the time in the proposed design. MDEs are commonly expressed in effect size units (specifically, in terms of standard deviations) to permit comparisons across outcomes with different units. A common rule of thumb is to ensure that studies have sufficient power to detect impacts at or below an MDE size (MDES) of 0.2, which is a common threshold for a “small” effect size.73
Appendix Table B-9 shows the MDEs for the pooled sample (combining the samples from the TechHire and SWFI grantees), for the TechHire sample, and for the SWFI sample. For each of these three samples, MDEs are shown based on the final sample size for the Wave 1 survey data.
72 MDEs were calculated using the PowerUp! tool. For more information, see Maynard and Dong (2013). 73 The 0.2 rule of thumb comes from Cohen. Cohen defined an effect size of 0.2 as “small,” 0.5 as “medium,” and 0.8 as
“large.” Lipsey, another prominent researcher, sets the threshold lower. To Lipsey, an effect size of 0.15 or lower is small. See Cohen (1992) and Hill, Bloom, Black, and Lipsey (2007).
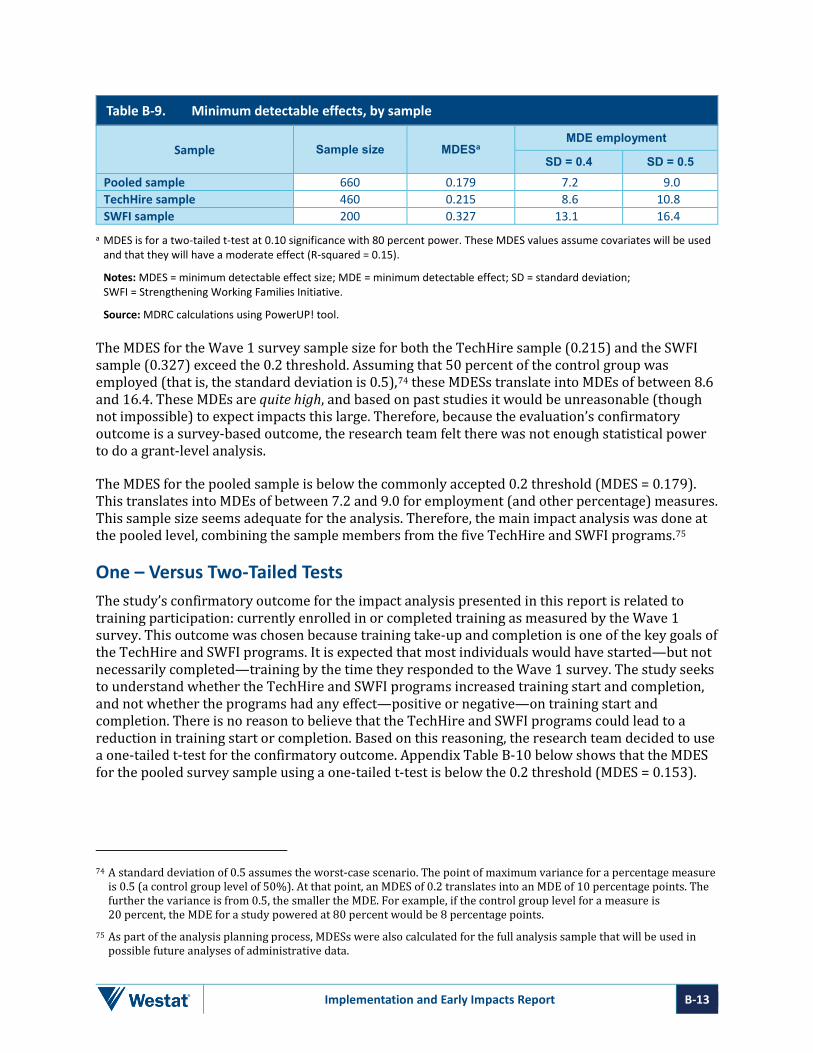
Implementation and Early Impacts Report B-13
Table B-9. Minimum detectable effects, by sample
Sample Sample size MDESa MDE employment
SD = 0.4 SD = 0.5 Pooled sample 660 0.179 7.2 9.0 TechHire sample 460 0.215 8.6 10.8 SWFI sample 200 0.327 13.1 16.4
a MDES is for a two-tailed t-test at 0.10 significance with 80 percent power. These MDES values assume covariates will be used and that they will have a moderate effect (R-squared = 0.15).
Notes: MDES = minimum detectable effect size; MDE = minimum detectable effect; SD = standard deviation; SWFI = Strengthening Working Families Initiative.
Source: MDRC calculations using PowerUP! tool. The MDES for the Wave 1 survey sample size for both the TechHire sample (0.215) and the SWFI sample (0.327) exceed the 0.2 threshold. Assuming that 50 percent of the control group was employed (that is, the standard deviation is 0.5),74 these MDESs translate into MDEs of between 8.6 and 16.4. These MDEs are quite high, and based on past studies it would be unreasonable (though not impossible) to expect impacts this large. Therefore, because the evaluation’s confirmatory outcome is a survey-based outcome, the research team felt there was not enough statistical power to do a grant-level analysis.
The MDES for the pooled sample is below the commonly accepted 0.2 threshold (MDES = 0.179). This translates into MDEs of between 7.2 and 9.0 for employment (and other percentage) measures. This sample size seems adequate for the analysis. Therefore, the main impact analysis was done at the pooled level, combining the sample members from the five TechHire and SWFI programs.75
One – Versus Two-Tailed Tests The study’s confirmatory outcome for the impact analysis presented in this report is related to training participation: currently enrolled in or completed training as measured by the Wave 1 survey. This outcome was chosen because training take-up and completion is one of the key goals of the TechHire and SWFI programs. It is expected that most individuals would have started—but not necessarily completed—training by the time they responded to the Wave 1 survey. The study seeks to understand whether the TechHire and SWFI programs increased training start and completion, and not whether the programs had any effect—positive or negative—on training start and completion. There is no reason to believe that the TechHire and SWFI programs could lead to a reduction in training start or completion. Based on this reasoning, the research team decided to use a one-tailed t-test for the confirmatory outcome. Appendix Table B-10 below shows that the MDES for the pooled survey sample using a one-tailed t-test is below the 0.2 threshold (MDES = 0.153).
74 A standard deviation of 0.5 assumes the worst-case scenario. The point of maximum variance for a percentage measure
is 0.5 (a control group level of 50%). At that point, an MDES of 0.2 translates into an MDE of 10 percentage points. The further the variance is from 0.5, the smaller the MDE. For example, if the control group level for a measure is 20 percent, the MDE for a study powered at 80 percent would be 8 percentage points.
75 As part of the analysis planning process, MDESs were also calculated for the full analysis sample that will be used in possible future analyses of administrative data.

Implementation and Early Impacts Report B-14
Table B-10. Minimum detectable effect for the confirmatory outcome
Sample Sample size MDESa MDE enrollment in or completion of training
SD = 0.4 SD = 0.5 Pooled sample 660 0.153 6.1 7.7
a MDES is for a one-tailed t-test at 0.10 significance with 80 percent power. This MDES assumes covariates will be used and that they will have a moderate effect (R-squared = 0.15).
Notes: MDES = minimum detectable effect size; MDE = minimum detectable effect; SD = standard deviation.
Source: MDRC calculations using PowerUP! tool. Two-tailed t-tests were used for all exploratory outcomes. For many of these outcomes, it is possible that the programs could have negative effects. Programs often have unintended consequences and for some exploratory outcomes, the research team did not have a good theory for what to expect.
Impact Model Specification Results presented in this study are based on “intent-to-treat” impact estimates. That is, the impacts are calculated by comparing all individuals in the TechHire/SWFI group with all individuals assigned to the control group, regardless of whether or how long they were engaged in TechHire/SWFI services. The impact estimates are regression-adjusted using background characteristics of the sample (see the section on covariates below).
For impacts on outcomes, regression models of the following form were estimated, using ordinary least squares.
𝑌𝑌𝑖𝑖 = 𝛼𝛼 + 𝛽𝛽 ∗ 𝑃𝑃𝑖𝑖 + 𝛿𝛿𝑋𝑋𝑖𝑖 + 𝜀𝜀𝑖𝑖
where:
Yi is the outcome measure for sample member I;
Pi is an indicator variable equal to “1” for TechHire/SWFI group members and equal to “0” for control group members;
Xi is a set of background characteristics for sample member i;
εi is a random error term for sample member i;
β is the estimate of the impact of the program on the average value of the outcome;
α is the intercept of the regression; and
δ is the set of regression coefficients for the background characteristics.
Implementation and Early Impacts Report B-15
Covariates Covariate selection for the TechHire/SWFI evaluation was based on theory. All covariates are based on pre–random assignment characteristics drawn from the TechHire/SWFI baseline survey. Following is a list of the baseline characteristics that were used as covariates in the regression models for survey-based outcomes:76
• Age 17–24 (0/1)
• Age (continuous)
• Female (0/1)
• Hispanic (0/1)
• Black/African American (0/1)
• Parent of any children under age 19 or pregnant (0/1)
• Lives with a child ages 1 to 5 (0/1)
• Primary language is English (0/1)
• Has some college/advanced training certification or more education (0/1)
• Previously received training in target industry (0/1)
• Child care arrangements limit the amount or type of work respondent can do (0/1)
• Currently employed (0/1)
• Worked full time at current or most recent job (0/1)
• Employed within 7 months of random assignment date (0/1)
• Receives food stamps/SNAP (0/1)
• Transportation-related issues limit ability to work (0/1)
• Sample member at East Coast Florida program (0/1)
• Sample member at Denver program (0/1)
• Sample member at New York City program (0/1)
76 Additional covariates drawn from National Directory of New Hires (NDNH) data will be used in the possible future
analysis of NDNH-based outcomes. These additional covariates will capture pre–random assignment measures of employment and earnings.

Implementation and Early Impacts Report B-16
• Sample member at Tampa program (0/1)
• Sample member at New York City program randomly assigned at the 50/50 ratio (0/1)
Outliers To improve precision, when estimating program effects on the key continuous outcomes (those that would be most affected by outliers, such as dollar-value measures), extreme values were identified as outliers, and for some measures, outliers were recoded based on responses to other survey questions. Appendix Table B.9 compares the impacts on hours, hourly wages, weekly earnings, and amount paid for training by the level of exclusion of outlier values.
The first row under each measure shows the impact with all values included. The second row shows the impacts with extreme outliers recoded (these are the impacts presented in the main report). Not all measures shown in the table had extreme outliers, and for those measures, the impacts are the same in the first two rows. Some of the details on changes made to outlier values are included in the footnotes in Appendix Table B-11. The third row shows the impact after excluding the top 1 percent of values.
The table shows that the findings regarding hours worked and amount paid for training were robust to outliers. The findings related to hourly wages and weekly earnings, however, differ when outliers are excluded compared with when they are not. For both outcomes, there are large impacts when all values are included, but no impacts when extreme outliers were recoded and when the top one percent of values are removed. The standard errors for both measures are quite large ($12.15 and $604) when including all values though. After removing outliers, the standard errors are reduced to more reasonable values (for example, the standard error for hours worked decreases from $12.15 to $0.67 when extreme outliers are removed). Considering the distributions of these variables, the research team views the post-removal outcomes as much more reliable. Treating outliers this way is consistent with the analysis plan and standard in evaluations of this type.77
77 Walfish, S. (2006). A review of statistical outlier methods. Pharmaceutical technology, 30(11), 82.

Implementation and Early Impacts Report B-17
Table B-11. Comparison of impacts on wages, hours, earnings, and amount paid for training, by level of exclusion of outlier values
Outcome N SE TH/SWFI group
Control group
Difference (impact)
Hours worked per weeka (N) All responses 651 1.2 23.2 25.4 -2.2* Extreme outliers removed 651 1.2 23.2 25.4 -2.2* Top 1 percent excluded 644 1.2 22.6 25.0 -2.4**
Average hourly wagesb ($) All responses 622 12.15 34.20 10.31 23.88**
Extreme outliers removed 622 0.67 10.92 10.88 0.04 Top 1 percent excluded 616 0.64 10.60 10.89 -0.29 Average weekly earningsb ($) All responses 622 604 1,363 330 1,033* Extreme outliers removed 622 25 342 366 -24 Top 1 percent excluded 616 24 330 367 -36 Amount paid for training out of pocket or with loansa ($) All responses 654 155 155 652 -497*** Extreme outliers removed 654 155 155 652 -497*** Top 1 percent excluded 647 76 120 300 -180**
a There were no extreme outliers for this outcome, and therefore none were removed.
b Extreme wage and earnings outliers are defined as earning more than $50 an hour, more than $2,000 a week, more than $8,000 a month, and more than $10,400 a year. Extreme wage cases were calculated using the unit of time that appeared to best fit the amount.
Notes: Estimates were regression-adjusted using ordinary least squares, controlling for pre–random assignment characteristics of sample members.
Statistical significance levels are indicated as: *** = 1 percent; ** = 5 percent; * = 10 percent.
TH = TechHire; SWFI = Strengthening Working Families Initiative; N = sample size; SE = standard error.
The impacts presented in the tables in the main body of the report are the impacts with extreme outliers removed. No extreme outliers were identified or removed from measures except as indicated.
Source: TechHire/SWFI Wave 1 survey.
Missing Data Outcomes. Sample members with missing values for dependent variables (outcomes) were excluded from the impact estimates. Appendix Table B-12 shows the percentage of sample members with missing values on key outcomes from the Wave 1 survey. Note that the rates of missingness were very low for the key outcomes across both research groups. The highest rates of missingness were seen in the child care outcomes, which ranged from 0.8 percent to 1.1 percent. All other key outcomes had missingness rates that are below 1 percent.

Implementation and Early Impacts Report B-18
Table B-12. Percentage missing on key outcomes
Outcome (%) TH/SWFI group
Control group
Confirmatory outcome Currently enrolled in or completed occupational skills training 0.0 0.0 Training Ever started occupational skills training 0.0 0.0 Currently enrolled in occupational skills training 0.0 0.0 Ever completed occupational skills training 0.0 0.0 Ever dropped out of occupational skills training 0.0 0.0 Ever obtained a professional certification or state/industry license 0.0 0.0 Ever participated in on-the-job training, an internship, or an apprenticeship 0.0 0.0 Employment Ever employed 0.3 0.0 Currently employed 0.6 0.0 Child care Youngest child received care while working or in training 0.8 1.0 Paid for child care 0.8 1.0 Was reimbursed for some or all child care payments 0.8 1.0 Received help finding child care 0.8 1.0 Had to quit a job, school, job search, or training due to issues obtaining child care 1.1 1.0 Did not take a job or did not start training due to issues obtaining child care 1.1 1.0 Sample size (total = 660) 361 299
Note: TH = TechHire; SWFI = Strengthening Working Families Initiative.
Source: TechHire/SWFI Wave 1 survey. Covariates. Sixteen of the 21 covariates in the regression models for estimating program impacts had missing values. Among the full research sample, the proportion of missing responses for these measures ranged from less than 1 percent (for age and receives SNAP/food stamps) to 9 percent (if a respondent worked full time at their current or most recent job). In response, missing values for covariates were imputed using the full sample’s mean, and dummy variables were added to the model for any covariates with more than 5 percent missingness. This resulted in missing indicators for three of the covariates (respondent identified as Black/African American, worked full time at current or most recent job, and employed within less than seven months of random assignment date).
Comparison of Covariate-Adjusted Versus – Unadjusted Impacts To test the sensitivity of the regression adjustment, the evaluation team compared the covariate-adjusted and -unadjusted research group means and differences (impacts) for key outcome measures (see Appendix Table B-13). As shown, the adjusted and unadjusted estimates for most outcomes are very similar. The two exceptions are the measures of employment and current employment. For those outcomes, there is a statistically significant impact when covariates are not included in the impact model, but there is no impact when covariates are included. Overall, the findings help increase confidence that the random assignment process resulted in the creation of research groups with similar characteristics and that the effort to field the TechHire/SWFI Wave 1 survey did not bias the results.

`
B-19
Table B-13. Comparison of covariate-adjusted versus unadjusted impacts on training, employment, and child care arrangements
Outcome (%) Adjusted Unadjusted
TH/SWFI group
Control group
Difference (impact) P-value TH/SWFI
group Control group
Difference (impact) P-value
Confirmatory outcome Currently enrolled in or completed occupational skills
training 42.5 21.3 21.2 0.000 42.9 20.7 22.2 0.000
Training Ever started occupational skills training 71.9 32.6 39.3 0.000 72.3 32.1 40.2 0.000 Currently enrolled in occupational skills training 21.1 8.3 12.8 0.000 21.6 7.7 13.9 0.000 Ever completed occupational skills training 31.4 16.7 14.7 0.000 31.6 16.4 15.2 0.000 Ever dropped out of occupational skills training 7.5 1.0 6.5 0.000 7.5 1.0 6.5 0.000 Ever obtained a professional certification or
state/industry license 19.1 9.7 9.3 0.001 19.1 9.7 9.4 0.001
Ever participated in on-the-job training, an internship, or an apprenticeship 19.2 14.3 4.9 0.100 19.1 14.4 4.7 0.107
Employment Ever employed 74.1 77.3 -3.2 0.290 72.8 78.9 -6.2 0.067 Currently employed 57.7 63.1 -5.4 0.128 56.5 64.5 -8.0 0.037 Child care Youngest child received care while working or in training 20.4 18.9 1.5 0.594 21.5 17.6 3.9 0.208 Paid for child care 11.7 10.5 1.2 0.614 12.3 9.8 2.5 0.314 Was reimbursed for some or all child care payments 4.5 4.4 0.1 0.951 4.7 4.1 0.7 0.668 Received help finding child care 14.0 7.7 6.4 0.005 14.5 7.1 7.4 0.003 Had to quit a job, school, job search, or training due to
issues obtaining child care 12.2 12.3 -0.2 0.947 12.6 11.8 0.8 0.762
Did not take a job or did not start training due to issues obtaining child care
17.9 20.6 -2.7 0.320 18.5 19.9 -1.4 0.641
Sample size (total = 660) 361 299 361 299
Notes: Sample sizes may vary because of missing values.
Statistical significance levels are indicated as: *** = 1 percent; ** = 5 percent; * = 10 percent.
TH = TechHire; SWFI = Strengthening Working Families Initiative.
Source: TechHire/SWFI Wave 1 survey.
Implem
entation and Early Impacts Report

Implementation and Early Impacts Report B-20
Confidence Intervals, Standard Errors, and Effect Sizes Appendix Table B-14 displays more detailed statistical data on the impact estimates of the confirmatory and other key outcomes. These details are included to provide more information on the uncertainty associated with specific impact estimates; they may be useful to meta-analysts who are interested in including the TechHire/SWFI findings. For each measure, the first two columns show the lower and upper limits of the 90 percent confidence interval, the third column shows the standard error, and the fourth column displays the effect sizes in absolute values. For each measure, the effect size was calculated by dividing the impact estimate by the standard deviation for the full sample. Effect sizes standardize impact estimates for comparison with impact estimates from other studies.
Table B-14. Confidence intervals, standard errors, and effect sizes for key outcomes
Outcome 90 Percent
confidence interval SE Effect size Lower Upper
Confirmatory outcome Currently enrolled in or completed occupational skills training 15.2 27.2 3.6 0.46 Training Ever started occupational skills training 33.3 45.3 3.6 0.86 Currently enrolled in occupational skills training 8.1 17.4 2.8 0.36 Ever completed occupational skills training 9.1 20.3 3.4 0.35 Ever dropped out of occupational skills training 3.8 9.2 1.6 0.31 Ever obtained a professional certification or state/industry license 4.7 13.9 2.8 0.26 Ever participated in on-the-job training, an internship, or an
apprenticeship 0.0 9.8 3.0 0.13
Employment Ever employed -8.3 1.8 3.1 -0.08 Currently employed -11.3 0.4 3.6 -0.11 Child care Youngest child received care while working or in training -3.1 6.1 2.8 0.04 Paid for child care -2.7 5.1 2.4 0.04 Was reimbursed for some or all child care payments -2.6 2.8 1.6 0.00 Received help finding child care 2.7 10.0 2.2 0.20 Had to quit a job, school, job search, or training due to issues
obtaining child care -4.1 3.8 2.4 0.00
Did not take a job or did not start training due to issues obtaining child care -7.3 1.8 2.8 -0.07
Sample size (total = 660)
Notes: Sample sizes may vary because of missing values.
Effect sizes are shown as absolute values and were calculated by dividing the impact estimate by the standard deviation for the pooled sample of individuals in both research groups.
TH = TechHire; SWFI = Strengthening Working Families Initiative, SE = standard error.
Source: TechHire/SWFI Wave 1 survey.

Implementation and Early Impacts Report B-21
For example, for the confirmatory outcome currently enrolled in or completed training, the 90 percent confidence interval ranges from 15 to 27. The 90 percent confidence interval is an estimate of the statistical imprecision of the effects of TechHire/SWFI. Specifically, there is a 90 percent chance that the true effect would fall within the 90 percent confidence interval. A narrower confidence interval suggests a more precise estimate than a wider confidence interval (which indicates greater variability and greater uncertainty). Confidence intervals in which zero does not fall between the lower and upper limits—including the interval for currently enrolled in or completed training—indicate that the impact estimate is significantly different from zero at the 10 percent level of statistical significance. This means there is less than a 10 percent chance this estimate would have been seen if TechHire/SWFI made no difference.
The standard error reflects the statistical uncertainty associated with this estimate, factoring in the sample size, the standard deviation, and the unit of measurement. The final element, the effect size (0.46), indicates that the impact on the confirmatory outcome is a medium-sized impact based on statistical literature on effect sizes.78
Assessment of Possible Effects of Multiple Comparisons In recent years, the issue of multiple test bias has become more prominent in both the academic literature and the field of program evaluation more generally. The basic issue is well known and not new. Every time one estimates an impact on an outcome there is a precisely defined probability (conventionally 10 percent in such studies as TechHire/SWFI) of concluding that a program has had a true impact when the observed difference is simply due to chance. Since researchers typically examine many outcomes, the probability that at least one estimate will be statistically significant simply by chance can get very high.
A three-part strategy was used to deal with the potential for false positives emerging from analysis of multiple outcome measures:
• Distinguishing between confirmatory and exploratory outcomes of interest and specifying single measures and units for each outcome.
• Limiting the analysis to one to three confirmatory outcomes for each round of the impact analysis.
• Using the Benjamini-Hochberg procedure to adjust for multiple comparisons of the confirmatory outcomes. Because the impact analysis presented in this report includes only one confirmatory outcome, there was no need to make any adjustments for multiple comparisons. The next report will make adjustments across the three confirmatory outcomes selected for the longer-term impact analysis. It should be noted that the study was not powered for multiple comparisons.
78 The 0.5 rule of thumb comes from Cohen. Cohen defined an effect size of 0.2 as “small,” 0.5 as “medium,” and 0.8 as
“large.” Lipsey, another prominent researcher, sets the thresholds lower. To Lipsey, an effect size of 0.15 or lower is small. See Hill, Bloom, Black, and Lipsey (2007); Cohen (1992).

Appendix C
Supplementary Exhibit for Chapter 3

`
C-1
Appendix C Supplementary Exhibit for Chapter 3
Table C-1. Participation in TechHire and SWFI programs within 6 to 27 months of random assignment, among TechHire/SWFI group members
Outcome TechHire programs SWFI programs All programs East Coast Florida New York City Tampa Denver Vermont
Entered the program (%) 86.0 71.4 70.0 96.9 97.6 82.8 Exited the program (%) 34.7 15.6 5.3 51.9 0.0 24.9 Training servicesa (%)
Never started training 23.1 28.6 30.7 10.1 36.6 23.9 Started one or more trainings 76.9 71.4 69.3 89.9 63.4 76.1 Completed one or more trainingsb 47.9 36.4 20.7 44.2 43.9 37.1 Withdrew from one or more trainingsb 43.8 3.9 2.7 29.5 12.2 19.9 Received a diploma, degree, or credential from one
or more training programsc 21.5 3.9 26.0 40.3 43.9 26.6
Started a training in selected occupational field (%) Computer and mathematical occupationsd 51.2 71.4 33.3 29.5 0.0 39.6 Health care occupationse 29.8 0.0 30.0 47.3 0.0 27.4
Ever received (%) Assessment services 86.0 71.4 70.0 63.6 58.5 71.4 Case management services 86.0 71.4 70.0 64.3 0.0 67.0
Average number of weeks in the program 61.0 28.2 39.4 58.9 61.9 49.4 Average number of months in the program 13.8 6.0 8.8 13.2 13.8 11.0 Sample size 121 77 150 129 41 518
Notes: SWFI = Strengthening Working Families Initiative. a The PIRL data captured up to three trainings. Eleven percent of TechHire/SWFI group members in the full sample enrolled in more than one training. b “Completed training” and “Withdrew from training” are not mutually exclusive outcomes. These outcomes show rates of experiences across all of the training programs
participants attended. Additionally, some participants were likely attending training at the end of the follow-up period, but data were not available to measure current enrollment in training.
c This outcome captures receipt of an industry-recognized credential or certification, a certification of completion of a registered apprenticeship, a state- or federally recognized license, or an associate’s or bachelor’s degree.
d Training for this major occupational group includes Information Technology (IT) trainings. e This outcome includes training targeting two major occupational groups: (1) Health Care Practitioners and Technical Occupations and (2) Health Care Support Occupations. Source: U.S. Department of Labor Participant Individual Record Layout (PIRL) data.
Implem
entation and Early Impacts Report

Appendix D
Supplementary Exhibits for Chapter 4

`
D-1
Appendix D Supplementary Exhibits for Chapter 4
Table D-1. Impacts on training, employment, and child care arrangements by TechHire/SWFI subgroup
Outcome (%) TechHire sample member SWFI sample member
Sig. TH/SWFI group
Control group
Difference (impact)
P-value
SWFI group
Control group
Difference (impact)
P-value
Confirmatory outcome Currently enrolled in or completed occupational
skills training 40.5 18.8 21.7*** 0.000 47.4 26.4 21.1*** 0.004
Training Ever started occupational skills training 71.4 28.7 42.7*** 0.000 74.5 40.3 34.2*** 0.000 Currently enrolled in occupational skills training 18.2 7.1 11.1*** 0.000 28.8 9.3 19.5*** 0.001 Ever completed occupational skills training 30.4 15.5 14.9*** 0.000 32.8 20.4 12.4* 0.067 Ever dropped out of occupational skills training 7.8 0.9 6.9*** 0.001 6.5 1.7 4.8 0.115 Ever obtained a professional certification or
state/industry license 18.7 8.9 9.7*** 0.003 19.1 12.9 6.2 0.252
Ever participated in on-the-job training, an internship, or an apprenticeship 18.9 12.8 6.1* 0.076 20.0 17.6 2.4 0.691
Employment Ever employed 76.0 80.9 -4.9 0.174 69.3 69.4 -0.2 0.980 Currently employed 58.8 64.4 -5.6 0.197 54.3 61.3 -7.0 0.287
Implem
entation and Early Impacts Report

`
D-2
Table D-1. Impacts on training, employment, and child care arrangements by TechHire/SWFI subgroup (continued)
Outcome (%) TechHire sample member SWFI sample member
Sig. TH/SWFI group
Control group
Difference (impact)
P-value
SWFI group
Control group
Difference (impact)
P-value
Child care Youngest child received care while working or in
training 8.7 8.4 0.2 0.920 46.5 43.5 3.0 0.683
Paid for child care 5.9 5.1 0.8 0.706 24.7 23.3 1.4 0.826 Received help finding child care 6.1 4.8 1.3 0.511 31.4 14.3 17.2*** 0.004 ††† Received help finding child care in a convenient
location 5.7 4.8 0.9 0.666 30.6 15.4 15.3** 0.012 ††
Received help finding child care at needed hours 6.1 4.8 1.3 0.514 25.8 14.8 11.0* 0.058 Received help finding or paying for
transportation to child care 3.2 2.9 0.3 0.870 22.7 7.2 15.4*** 0.003 †††
Had to quit a job, school, job search, or training 5.0 5.1 -0.1 0.942 28.8 28.8 0.0 0.995 Did not take a job or did not start training due to 9.4 8.6 0.7 0.765 39.0 46.9 -7.9 0.281 Sample size (Total = 660) 246 214 115 85
Notes: Estimates were regression-adjusted using ordinary least squares, controlling for pre–random assignment characteristics of sample members. See a full list of covariates in Appendix B.
Sample sizes may vary because of missing values. Statistical significance levels are indicated as: *** = 1 percent; ** = 5 percent; * = 10 percent. Differences across subgroups were tested for statistical significance. Statistical significance levels (Sig.) are indicated as follows: ††† = 1 percent; †† = 5 percent; † = 10 percent. TH = TechHire; SWFI = Strengthening Working Families Initiative.
Source: TechHire/SWFI Wave 1 survey.
Implem
entation and Early Impacts Report

`
D-3
Table D-2. Impacts on training, employment, and child care arrangements by labor market attachment subgroup
Outcome (%) Long-term unemployed Currently or recently employed
Sig. TH/SWFI Group
Control group
Difference (impact)
P-value
SWFI group
Control group
Difference (impact)
P-value
Confirmatory outcome Currently enrolled in or completed occupational
skills training 36.7 22.1 14.6 0.189 43.7 22.2 21.5*** 0.000
Training Ever started occupational skills training 71.5 34.9 36.5*** 0.001 72.8 32.8 40.1*** 0.000 Currently enrolled in occupational skills training 18.4 3.5 14.9* 0.057 20.8 9.2 11.6*** 0.000 Ever completed occupational skills training 28.5 22.6 6.0 0.570 32.7 16.2 16.4*** 0.000 Ever dropped out of occupational skills training 8.6 1.4 7.3 0.170 7.4 1.3 6.1*** 0.001 Ever obtained a professional certification or
state/industry license 19.9 16.2 3.6 0.693 19.3 9.6 9.7*** 0.002
Ever participated in on-the-job training, an internship, or an apprenticeship 20.3 23.0 -2.7 0.768 19.6 13.0 6.5* 0.050
Employment Ever employed 37.0 41.7 -4.8 0.641 83.2 86.3 -3.1 0.323 Currently employed 31.0 21.2 9.7 0.289 64.5 73.7 -9.1** 0.024 †
Implem
entation and Early Impacts Report

`
D-4
Table D-2. Impacts on training, employment, and child care arrangements by labor market attachment subgroup (continued)
Outcome (%) Long-term unemployed Currently or recently employed
Sig. TH/SWFI Group
Control group
Difference (impact)
P-value
SWFI group
Control group
Difference (impact)
P-value
Child care Youngest child received care while working or in
training 28.8 29.7 -0.9 0.927 18.4 16.9 1.4 0.643
Paid for child care 14.3 17.5 -3.3 0.702 10.4 9.9 0.5 0.842 Was reimbursed for some or all child care
payments 4.2 13.3 -9.1 0.157 3.8 3.7 0.1 0.948
Received help finding child care 23.2 18.5 4.7 0.599 11.1 6.5 4.5 0.050 Had to quit a job, school, job search, or training
due to issues obtaining child care 14.1 13.1 1.0 0.898 12.2 12.9 -0.7 0.793
Did not take a job or did not start training due to issues obtaining child care 23.9 28.0 -4.2 0.671 16.7 20.5 -3.9 0.197
Sample size (Total = 612) 63 40 270 239
Notes: Estimates were regression-adjusted using ordinary least squares, controlling for pre–random assignment characteristics of sample members. See a full list of covariates in Appendix B.
Sample sizes may vary because of missing values. Statistical significance levels are indicated as: *** = 1 percent; ** = 5 percent; * = 10 percent. Differences across subgroups were tested for statistical significance. Statistical significance levels (Sig.) are indicated as follows: ††† = 1 percent; †† = 5 percent; † = 10 percent. TH = TechHire; SWFI = Strengthening Working Families Initiative. The currently or recently employed subgroup includes individuals who were working at study entry and individuals who had been out of work for less than7 months. The long-term unemployed subgroup includes individuals who had been out of work for 7 or more months at study entry and individuals who had never worked.
Source: TechHire/SWFI Wave 1 survey.
Implem
entation and Early Impacts Report