trait directed de novo population transcriptome dissects ... · trait directed de novo population...
TRANSCRIPT

Trait directed de novo population transcriptome dissects geneticregulation of a balanced polymorphism in phosphorusnutrition/arsenate tolerance in a wild grass Holcus lanatusMeharg, C., Khan, B., Norton, G., Deacon, C., Johnson, D., Reinhardt, R., ... Meharg, A. A. (2014). Trait directedde novo population transcriptome dissects genetic regulation of a balanced polymorphism in phosphorusnutrition/arsenate tolerance in a wild grass Holcus lanatus. New Phytologist, 201(1), 144-154. DOI:10.1111/nph.12491
Published in:New Phytologist
Document Version:Peer reviewed version
Queen's University Belfast - Research Portal:Link to publication record in Queen's University Belfast Research Portal
Publisher rights© 2013 The Authors. New Phytologist © 2013 New Phytologist TrustThis is the peer reviewed version of the following article: Meharg, C., Khan, B., Norton, G., Deacon, C., Johnson, D., Reinhardt, R., Huettel,B. and Meharg, A. A. (2014), Trait-directed de novo population transcriptome dissects genetic regulation of a balanced polymorphism inphosphorus nutrition/arsenate tolerance in a wild grass, Holcus lanatus. New Phytologist, 201: 144–154. , which has been published in finalform at http://onlinelibrary.wiley.com/doi/10.1111/nph.12491/abstract. This article may be used for non-commercial purposes in accordancewith Wiley Terms and Conditions for Self-ArchivingGeneral rightsCopyright for the publications made accessible via the Queen's University Belfast Research Portal is retained by the author(s) and / or othercopyright owners and it is a condition of accessing these publications that users recognise and abide by the legal requirements associatedwith these rights.
Take down policyThe Research Portal is Queen's institutional repository that provides access to Queen's research output. Every effort has been made toensure that content in the Research Portal does not infringe any person's rights, or applicable UK laws. If you discover content in theResearch Portal that you believe breaches copyright or violates any law, please contact [email protected].
Download date:28. May. 2018
1
Trait directed de novo population transcriptome dissects 1
genetic regulation of a balanced polymorphism in phosphorus 2
nutrition/arsenate tolerance in a wild grass Holcus lanatus L. 3
4 5
6
Caroline Meharg1*, Bayezid Khan2, Gareth Norton2, Claire Deacon2, David Johnson2, 7
Richard Reinhardt3, Bruno Huettel3, Andrew A. Meharg1* 8
9
10
1. Institute for Global Food Security, Queen’s University Belfast, David Keir 11
Building, Malone Road, Belfast BT9 5BN. 12
2. Institute of Biological and Environmental Sciences, University of Aberdeen, 13
Cruickshank Building, St Machar Drive, Aberdeen AB24 3UU. 14
3. Max Planck Institute for Plant Breeding Research, Carl-‐von-‐Linné-‐Weg 15
10, 50829 Köln, Germany. 16
17
* Corresponding authors 18
19
20
21
22

2
Summary 1
• Here we characterize the genetic regulation of a single gene balanced 2
polymorphism for phosphate fertilizer responsiveness, as well as arsenate 3
tolerance, in wild grass Holcus lanatus L. genotypes screened from the same 4
habitat, treated with high and low phosphorus (P) as phosphate. 5
• De novo transcriptome sequencing, RNAseq and SNP calling was conducted 6
on extracted RNA. Roche 454 sequencing data was assembled into ~22,000 7
isotigs and Illumina reads for phosphorous starved (P-‐) and phosphorous 8
treated (P+) genovars of tolerant (T) and non-‐tolerant (N) phenotype were 9
mapped to this reference transcriptome. 10
• Heatmaps of the gene expression data showed strong clustering of each 11
P+/P-‐ treated genovar, as well as clustering by N/T phenotype. Statistical 12
analysis identified 87 isotigs to be significantly differentially expressed 13
between N and T phenotypes and 258 between P+ and P-‐ treated plants. 14
• This single gene for tolerance led to distinct phenotype transcriptomes, with 15
large differences in post-‐translational and post-‐transcriptional regulation 16
rather than in P nutrition transport and metabolism; and the identification of 17
SNPs that systematically differ between phenotype, again in transcripts with 18
predicted regulatory function including several proteases, kinases and 19
ribonuclear RNA binding protein and concurrent up-‐regulation of expressed 20
transposons in the T phenotype. 21
22
23
24

3
Introduction 1
Grasses are known to have complex genomes of various size, often large, with 2
extensive repetitive elements, local rearrangements, differences in genomic 3
structure, ploidy level and chromosome number, and are consequently challenging 4
with respect to whole genome sequencing and assembly (Buckler et al., 2001; 5
Feuillet & Keller, 2002; Jackson et al., 2011, Hamilton & Buell, 2012). Transcriptome 6
sequencing bypasses genomic complexity by focusing on protein coding genes 7
(Hamilton & Buell, 2012) (~25,000 to 56,000 in grasses) derived from a well-‐8
conserved and relatively small proportion of the genome (~84% of gene families 9
shared between grass sub-‐families) (The International Brachypodium Initiative, 10
2010). As transcripts are sensitive to environment, RNA sequencing can be clustered 11
by function through use of appropriate experimental manipulation to further aid in 12
gene pathway identification (Suarez Rodriguez et al., 2010; Urzica et al., 2012; 13
O’Rourke et al., 2013). 14
15
While genomic sequencing has led to unparalleled advance in our understanding 16
of the physiology and ecology of model organisms, it is not currently feasible 17
(due to expense) to conduct trait led genome sequencing investigations in all 18
wild species of interest (Nawy, 2012), rather there is a reliance in finding traits 19
that exist (naturally or through mutation) in model species (Jackson et al., 2011). 20
While laboratory generated (site directed, knockdown, overexpression, chemical 21
or radiation induced) mutants are essential for studying gene function and serve 22
as breeding resource (Kuromori et al., 2009), natural polymorphisms in non-‐23
model species are a greatly untapped resource. 24

4
1
The wild grass Holcus lanatus L., an outcrossing diploid (2n=14) and closely related to 2
B. distachyon (Aliscioni et al., 2012), has a remarkable balanced polymorphism in 3
arsenate tolerance, screened from a semi-‐natural, non-‐arsenic contaminated 4
populations (Meharg et al., 1993), coded by a single gene (Macnair et al., 1992). As 5
arsenate is a phosphate analogue it has been postulated that this polymorphism is 6
maintained due to phosphorus nutrition, not arsenate tolerance per se, particularly 7
as the tolerance gene co-‐segregates with suppression of High affinity Phosphate 8
Transport (HAPT) (Meharg et al., 1992a; Meharg & Macnair, 1992b), though an 9
explicit ecological link to phosphorus status of soils has yet to be proven (Naylor et 10
al., 1996). This soil P responsiveness is addressed in this current study along with the 11
transcriptomic consequences of being of tolerant (T) or non-‐tolerant (N) phenotype 12
to ascertain why and how this polymorphism is maintained. 13
14
15
16
17

5
Materials and methods 1
Chemicals used in experiments were Trace element grade or better, while all 2
chemicals used for analytical purposes were Aristar grade. 3
4
Plant & soil collection 5
Single tillers of H. lanatus were collected from a semi-‐natural grassland, 6
Cruickshank Botanic Gardens (CBG), University of Aberdeen, UK, where H. 7
lanatus is a dominant species. Only one tiller was taken from each of 250 8
individual plants, and only isolated plants were selected, spaced at least 5 m 9
from each other. Surface soil (0-‐10 cm) from the CBG population was collected 10
and 2 mm sieved and stored at field moist conditions until use. Tillers were 11
cultivated in a temperate glasshouse following potting (10 cm wide pots) into 12
John Innes number 2 compost. 13
14
Plant growth characterization 15
Tiller testing was conducted according to procedures outlined in Macnair et al. 16
(1992). Following tiller tolerance testing, genotypes were selected for further 17
study where their longest root length after 2 wk growth in arsenate free solution 18
exceeded 100 mm. The plants were either classified as non-‐tolerant (N) or 19
tolerant (T) based on their tolerance index (TI), where TI = 100 * (root growth in 20
0.013 mM arsenate/root growth in absence of arsenic), with this segregation 21
shown in Fig. 1. Out of the 250 genotypes screened, ~30 of each phenotype were 22
selected for detailed study. 23
24

6
A P fertilization experiment was conducted on these ~60 genotypes, split into N 1
and T phenotype, where each genotype was a single replicate, and where the 2
CBG soil was fertilized with phosphate (100 P mg/kg soil d.wt. as disodium 3
phosphate). Plants were grown in control (no fertilization) and with fertilization 4
for 60 d before harvesting. At harvest roots were washed free of soil and root 5
and shoot dry weight recorded along with shoot P. P was analysed in 6
powderised shoot by Inductively Coupled Plasma – Mass Spectrometry (ICP-‐MS) 7
on an Agilent 4000 instrument, following microwave assisted digestion (CEM-‐8
Technologies) in concentrated nitric acid. 9
10
RNA preparation 11
Tillers were grown hydroponically for 2 wk in 50 ml either complete Hoaglands 12
solution, or that solution minus the phosphate, in individual centrifuge tubes with 13
base of the tubes covered in tin foil to block out light. Plants were grown in a heated 14
glasshouse (~180C), under supplemental sodium lamps. Roche 454 sequencing was 15
conducted on one non-‐tolerant replicate grown plus (P+) or minus (P-‐) phosphate. A 16
genotype of the non-‐tolerant phenotype was chosen for 454 transcriptome 17
sequencing and assembly as it was assumed that the non-‐tolerant phenotype would 18
be the most P responsive from previous physiological studies (Meharg & Macnair, 19
1992a). For Illumina sequencing a further 4 replicate individual genotypes (not 20
including the genotype used for 454 sequencing), of each phenotype (T or N) were 21
grown in P+ and P-‐ in a factorial design, phenotype (tolerance) by phosphorous [P] 22
treatment, i.e. 16 samples in total. The N genotype used for 454 sequencing, and 23
another T genotype, where analysed by Illumina in the same experiment used for 24

7
454 sequencing, but where not included in the phenotyope*P Illumina analysis 1
experiment analysis as there RNA was extracted at a different time point which lead 2
to differential gene expression. However, these additional T and N genotype were 3
used in SNP analysis so that SNP calling was conducted on 20 samples. 4
5
On harvesting blotted lightly dry roots and shoots for each replicate had their RNA 6
extracted. Samples were ground under liquid nitrogen and total RNA was extracted 7
using the Plant RNeasy extraction method (Qiagen), with the additional on-‐column 8
DNase treatment. The resulting material was stored at -‐800C until shipping on dry ice 9
for analysis. 10
11
Transcriptome sequencing 12
Sequencing was conducted at the Max Planck Plant Breeding Research Institute, 13
Cologne, Germany. RNA was reverse transcribed to cDNA, fragmented, polyA 14
enriched and sequenced on a 454 GS-‐FLX (Titanium Chemistry) and HiSeq 2000 (100 15
bp paired end Illumina technology). 16
17
For generation of a reference transcriptome assembly, two normalized Roche 454 18
libraries were prepared for one arsenic non-‐tolerant genovar (N) and sequenced on a 19
Roche 454 GS-‐FLX using Titanium chemistry. Half a plate was used for transcriptome 20
sequencing of phosphorous treated (N+) and half a plate for non-‐treated (N-‐) plants. 21
22
For gene expression and SNP analysis (RNAseq), a 100bp paired end Illumina 23
sequencing library was generated for each of the 20 samples. These included all 4 24

8
samples from the first experiment (T-‐, N-‐, T+, N+), as well as another 16 samples 1
(experiment 2) consisting of 4 tolerant (T) and 4 non-‐tolerant (N) genovars, receiving 2
P-‐ and P+ treatment (4 N-‐, 4 N+, 4 T-‐, 4 T+). Illumina reads were mapped to the 454 3
reference transcriptome assembly. 4
5
For annotation of the reference transcriptome with standalone BLAST (blast-‐2.2.22, 6
ftp://ftp.ncbi.nlm.nih.gov/blast/executables/release/2.2.22/), the 7
Osativa_193_transcript and Osativa_193_peptide databases were downloaded from 8
ftp://ftp.plantgdb.org/download/Genomes/OsGDB/, the plant-‐refseq database from 9
ftp://ftp.ncbi.nih.gov/refseq/release/plant/ and the nucleotide (nt) database from 10
ftp://ftp.ncbi.nih.gov/blast/db/. 11
12
For generation of the reference transcriptome, the 454 reads were adapter and 13
quality trimmed and assembled with Newbler version 2.6. After assembly, isotigs 14
were annotated by blasting them against Oryza sativa transcript (BLASTn), O. sativa 15
peptide, plant-‐refseq (BLASTx) and nt (BLASTn) using an e-‐value cutoff of 1.00 E-‐08. 16
A BLAST report was compiled by parsing of all BLAST results with Perl scripts using 17
BioPerl modules (Stajich et al., 2002) to extract the top hit accession, description, E-‐18
value, percent identification (id) from each BLAST search. Annotation of putative 19
function for O. sativa-‐peptides and O. sativa-‐transcripts were inserted into the Blast 20
report after submission to http://rice.plantbiology.msu.edu/downloads_gad.shtml 21
(annotation of all isotigs is reported in SI Annotated-‐DESeq-‐Result.xlsx). 22
23
24

9
For identification of differentially expressed transcripts/genes, 100bp paired end 1
Illumina reads from experiment 1 (4 samples) and experiment2 (16 samples) were 2
aligned to the assembled 454 reference transcriptome (isotigs) using bowtie 3
(Langmead et al., 2009), allowing multiple matches (option -‐a) reporting only the 4
best hits obtained for each read pair (option -‐-‐best -‐-‐strata) with an allowed 5
maximum of 3 end-‐to-‐end mismatches (option –v 3) to an isotig. For each of the 20 6
samples the number of reported reads aligning to each isotig was counted with use 7
of a Perl script. 8
9
Differentially expressed transcripts/isotigs were identified in R (http://www.r-‐10
project.org/) with package DESeq (Anders & Huber, 2010) using the FDR<0.1 as 11
cutoff for significance. DESeq analysis was carried out on the Illumina data from the 12
second experiment (n=4) for all 4 pairwise comparisons (N-‐ vs. T-‐, N+ vs. T+, N-‐ vs. 13
N+, T-‐ vs. T+) to allow identification of genes relevant to P+/ P-‐ treatment and those 14
involved in tolerant vs. non-‐tolerant phenotype. After DESeq analysis the log2 Fold 15
Change (log2FC) of lowly expressed genes was recalculated as follows: DESeq 16
calculated normalized counts of <5 were set to a baseline of 5. This allowed 17
estimation of log2FC even if one of the treatments showed a mean normalized count 18
of 0 and furthermore ensured that all 2-‐fold changes reported had normalized mean 19
expression values of at least ≥10 in one of the treatments in question. Isotigs with 20
False Discovery Rate (FDR) < 0.1 for any treatment comparison (344 isotigs) were 21
submitted to BLAST2GO (default settings: BLASTx, nr, BLAST expect value 1.0E-‐03, 22
number of BLAST hits 20) (Conesa & Götz, 2008) for further functional analysis 23

10
including Gene Ontology, Enzyme Code and Interpro domain search. The full 1
annotated DESeq result is reported in SI Annotated-‐DESeq-‐Result.xlsx. 2
3
For identification of isotigs showing homology to specific proteins of interest 4
proteins were blasted against all isotigs (tBLASTn). For visualisation of assigned 5
protein homologies, some selected isotigs were translated into protein (expasy, 6
http://web.expasy.org/translate/) and aligned with homologous plant protein 7
sequences using mafft version7 (Katoh & Standley 2013). Mafft alignments were 8
imported into Seaview (Gouy et al., 2010), and the alignments exported (SI Figs. 1-‐8). 9
10
Samtools was used for identification of SNPs with variant and mapping quality >20 11
(Li et al., 2009). SNP tables of all 20 plants were merged and homozygous and 12
heterozygous SNPs consistent across N and T phenotype (n=10) were extracted as 13
potentially relevant drivers of N versus T phenotype using a Perl script. 14
15
The data is in the process of being submitted to Short Read Archive (SRA) at the 16
European Nucleotide Archive (www.ebi.ac.uk/ena/), to be released upon 17
publication. 18
19
20
21
22

11
Results and Discussion 1
There was a clear segregation into tolerant and non-‐tolerant classes (Fig. 1). 2
This was expected as previous studies have shown the ubiquity of this balanced 3
polymorphism (Meharg et al. ,1993; Naylor et al., 1996). When grown in their 4
soil of origin the plants responded differentially to phosphate fertilizer (Fig. 2). 5
General Linear Modeling (GLM) (using Minitab (v.16)) of ranked data (due to 6
non-‐normality of untransformed data) found a significant (P=0.004) 7
phenotype*P fertilization interaction for shoot/root ratio, all other model terms 8
were not significant for this comparison. This phenotype*P fertilization 9
interaction term was caused by a decrease in shoot/root ratio, in tolerants 10
treated with P, showing that the tolerant phenotype is not reducing relative root 11
growth in response to P nutrition. Plants normally reduce relative root 12
production under P nutrition (Gojon et al., 2009). This is the first characterization 13
of a phosphate specific response for this polymorphism and the differential 14
allocation to root and shoot biomass in response to P availability likely to be the 15
reason why this polymorphism is maintained, and this will explained and 16
outlined in more detail in subsequent publications. There were no significantly 17
different (i.e. P>0.005) terms for both shoot weight and shoot P, while only the 18
treatment term was significant for root weight. These data show that shoot P 19
(root P was not measured as it is impossible to remove all adhering soil which 20
greatly confounds interpretation) does not differ between phenotypes, and that 21
this shoot P status is not P fertilizer responsive, all indicating tight homeostasis, 22
a known characteristic with respect to plant P nutrition (Gojon et al., 2009; Hill et 23
al., 2006). 24
25

12
Roche 454 sequencing generated ~1 million reads and a total of 474 megabases (MB) 1
of sequence data for assembly of a reference transcriptome. Circa. 82% of all reads 2
and ~85% of all bases (400MB) aligned. The inferred read error was 1.06% 3
(Supporting Information [SI] Illumina-‐and-‐454-‐Stats.xlsx). Assembly with Newbler 4
2.6 generated a reference transcriptome (SI 454Isotigs.fna) with a total of 22,313 5
isotigs. The overall size of the assembled reference transcriptome was 29 megabases 6
(MB). The average isotig size obtained was 1,302bp, the N50 Isotig size 1,489bp, the 7
number of isotigs ≥1kb was 12,828, (SI Illumina-‐and-‐454-‐Stats.xlsx, Sheet1). When 8
BLASTed against O. sativa, plant refseq transcriptome databases and non-‐redundant 9
nucleotide database (nt) (SI Annotated-‐DESeq-‐Result.xlsx)). Of these, 18,204 10
returned a match against O. sativa transcripts, 18,954 returned a match against O. 11
sativa peptides, 19,344 against plant refseq and 19,589 against nt (cutoff for 12
significance < 1.00 E-‐08). BLAST against nt returned hits almost exclusively against 13
plant cDNA/mRNA, predominantly Hordeum vulgare (barley), Triticum aestivum 14
(wheat). Highest homologous matches against Plant-‐refseq were invariably identified 15
against protein/transcript sequences of Brachypodium, Sorghum bicolor and O. 16
sativa (rice), of these Brachypodium being the most frequent hit and most closely 17
related to H. lanatus (Aliscioni et al., 2012). Further statistics on assembly are 18
reported in the SI Illumina-‐and-‐454-‐Stats.xlsx. The only previously reported H. 19
lanatus gene sequence, AY704470, a CDC25 phosphatases homologue (Bleeker et al., 20
2006), was identified in all genotypes with isotig19077 showing 100% identity to this 21
published sequence (tBLASTn) (SI Fig. 1), giving further verification of the 22
transcriptome assembly. 23
24
13
Paired end Illumina sequencing produced an average of ~53 million reads for each of 1
the 20 libraries giving a total of 1052 million 100bp paired end reads or 210 2
gigabases (GB) of sequence data. Forty-‐eight percent (100GB) of the HiSeq data 3
aligned successfully to the assembled 454 transcriptome without any prior clipping 4
of reads, with an average of 25 million full length 100bp paired end reads (5GB) for 5
each of the 20 libraries mapping successfully to isotigs with 3 or less end-‐to-‐end 6
basepair mismatches (SI Illumina-‐and-‐454-‐Stats.xlsx). Of 22313 isotigs only 52 isotigs 7
did not obtain any mapped paired end Illumina reads when aligning all Illumina reads 8
from (all 20 individual samples) giving good verification of the 454 reference 9
transcriptome assembly (SI RawCounts-‐per-‐isotig.xlsx). The isotigs, which did not 10
obtain any mapped Illumina reads may either have been too short (less than 250bp) 11
or misassembled. Non-‐aligned Illumina reads on the other hand are likely to be a 12
mixture of poor quality reads, reads containing adapter sequence, which would 13
require end-‐trimming, or alternatively originate from lowly expressed transcripts, 14
which may not be represented in the 454 reference library, but may still be picked 15
up amongst the Illumina sequences due to the much deeper coverage achieved with 16
Illumina technology. Transcript expression result showed strong clustering of each 17
P+ and P-‐ treated genotype verifying that each plant was indeed a different 18
genotype (Fig. 3). T genotypes clustered together, as did N, showing that the 19
phenotypes had distinctive transcript expression signatures. Differential expression 20
analysis was carried out with DESeq (Anders & Huber, 2010) and identified 344 21
isotigs, with a False Discovery Rate (FDR) of 0.1, significantly up or down-‐regulated in 22
response to either P+/P-‐ treatment or N/T phenotype (Fig. 4, SI Annotated-‐DESeq-‐23
Result.xlsx). Of these 87 isotigs were shown to be differentially expressed between N 24
14
and T phenotype, while the majority, 258 isotigs, were shown to be differentially 1
expressed in response to different P± nutrition treatment. There was no overlap 2
between the significant isotigs identified for P+/-‐ and N/T phenotype response. 3
There are a number of potential explanations for the independence of transcripts 4
between N/T and P+/P-‐ nutrition. The first is that a single regulatory gene, given that 5
we know that arsenate tolerance is under single gene control (Macnair et al., 1992), 6
is controlling transcript production of a host of genes in the T/N comparison. The 7
second, which is not exclusive of the first, is that differences in metabolism resulting 8
from differential function of a gene(s) may lead to feedback regulating transcripts of 9
interrelated functions such as the obvious impact of P starvation on P metabolism 10
observed here (Figs. 3 and 4). Differences in P stress perception by plants are known 11
to induce a host of differential responses, such as tillering, root biomass production, 12
arbuscular mycorrhizal regulation, and rhizosphere excretion of dicarboxylic acids to 13
mobilize phosphate from iron minerals, and this will lead to differential regulation of 14
a network of genes (Chiou et al., 2011; Gojon et al., 2009; Hill et al., 2006). Again, the 15
arsenate tolerance gene has a range of pleiotropic consequences (shoot/root 16
biomass, HAPT suppression and arsenate tolerance itself), fitting well such a 17
feedback and/or upstream regulator model. 18
19
The amplitude of fold-‐change was greater between phenotypes than between P 20
treatments, while annotation was better for P responsive genes (Fig. 4). Annotated 21
genes in classes that are highly relevant to the current study show that transcripts 22
significantly differentially regulated between T and N phenotype are dominated by 23
kinases, pathogen resistance, plant growth regulators (PGR), proteases, transposable 24

15
elements (TEs) and RNA directed activity, but none involved in phosphate transport 1
(Annotated-‐DESeq-‐Results.xlsx, Fig. 4). It has previously been shown that one 2
consequence of having the arsenate tolerance gene is suppression of high affinity 3
phosphate/arsenate transport (Meharg et al., 1992a,b). The results presented here 4
indicate, therefore, that post-‐transcriptional and post-‐translational mechanisms play 5
a key role in this suppression, as there was no differential expression of transcripts 6
involved in phosphate transport between phenotype. 7
8
With respect to T phenotype the only annotated gene absent compared to N, where 9
it is highly expressed, is a kinase receptor (isotig09647). Furthermore, isotigs with 10
significant homology to cbl-‐interacting kinase, MAPK kinase and serine/threonine 11
kinases had systematic differences in SNPs between N and T phenotype as did isotigs 12
showing homology to proteasome associated protein, transferases and a 13
ribonucloprotein/RNA recognition protein (Fig. 5, SI Table 1). 14
15
A gene that codes for rice adaption to soil P stress, PSTOL1, has been characterized 16
(Gamuyao et al., 2012). This gene is an enhancer of early root growth and over 17
expression leads to increased grain yields, hypothesized to be due to more efficient P 18
capture due to larger root systems, with larger root systems characterizing the H. 19
lanatus T phenotype here (Fig. 2). This gene is a kinase and some homologous 20
sequences were identified in H. lanatus, such as isotig20112 which showed ~ 88% 21
(identities 145/164) homology to the serine/threonine protein kinase 22
LOC_Os01g04570.2 and 63% (identities 108/169) to Pstol1/OsPupK46-‐2, also 23
annotated as serine/threonine protein kinase (SI Fig. 2) and isotig03216, which 24

16
showed 50% (identities 158/312) to protein serine/threonine kinase 1
LOC_Os01g04570.2 and 49% (identities 154/313) to Pstol1/OsPupK46-‐2. Isotig20112 2
was expressed in all T and N phenotypes but was ~4 fold down-‐regulated in 2 out of 3
4 N phenotypes, with no P effect. isotig03216 was again expressed in all N and T 4
phenotypes, but N5, N4, N2 as well as T4 showed ~>3 fold lower expression 5
compared to T2, T3, T5, N3, but the overall observed ~2 fold up-‐regulation in T-‐ 6
versus N-‐ was not statistically significant (SI AnnotatedDeseqResult.xlsx). 7
8
Other transcripts belonging kinases, some of these showing homology to cbl-‐9
interacting kinases 9, 14 & 23, were found to be up-‐regulated under low P status 10
(Fig. 4, SI AnnotatedDeseqResult.xlsx). Cbl-‐interacting kinases are serine/threonine 11
protein kinases, as is PSTOL1 (Gamuyao et al., 2012). The only transcript absent in T 12
compared to N phenotype (present in 3 out of 5 N phenotypes and absent in all 5 T 13
phenotypes), isotig09647, noting that there was also a transposon severely 14
suppressed, was a receptor protein kinase. Another probable serine/threonine 15
protein kinase WNK2-‐like, isotig18018, was ~60 fold up-‐regulated in T compared to 16
N. It is apparent that kinases play a role in both T/N phenotypic and P responsive 17
differences in the H. lanatus transcriptomes presented here and that there is 18
possibly some level functional redundancy. It is pertinent in this context that some 19
kinases have recently been identified as being central in phenotypic differences in 20
plant root response to P status (Gamuyao et al., 2012) as well as shown to be up 21
regulated in response to arsenate stress (Huang et al., 2012). 22
23

17
Also of note is that an auxin binding protein (isotig16840) was highly expressed in 1
the T phenotype compared to the N phenotype. The alignment of the translated 2
isotig16840 is shown in SI Fig. 3 and shows a high homology to auxin binding rice 3
and Brachypodium proteins. One of the key differences between T and N phenotype 4
identified here was in root biomass (Fig. 2). Auxins, and associated expansins, have a 5
key role in root growth (Cosgrove, 1999). The higher expression of an auxin-‐binding 6
protein with decreased expression of an expansin precursor transcript in T 7
phenotype, compared to N, and the enhanced expression of an auxin responsive 8
protein (isotig11028) under high P (SI AnnotatedDeseqResult.xlxs) suggest that auxin 9
signaling is central to the difference in root biomass regulation between T and N. The 10
alignment of translated isotig12721 with expansin precursor can be seen in SI Fig. 4. 11
12
While most expressed transposons, some of these annotated with RNA directed 13
activity, were up regulated in T compared to N (isotig13038, 13187, 13075, 15546, 14
07417), one transposon of the en spm subclass (isotig02887/02888) and one 15
unclassified nucleic acid binding transposon (isotig05913) were suppressed in T 16
compared to N, (SI AnnotatedDeseqResult.xlxs). Transposons and retrotransposons, 17
the most frequent and strongly differentially expressed class of isotigs between 18
phenotypes, are thought to play a role in post-‐transcriptional regulation with 19
silencing of TEs involving both transcriptional and post-‐transcriptional mechanisms 20
(Mirouze & Paszkowski, 2011; Okamoto & Hirochika, 2001). In plants, 21
retrotransposons are commonly known to be expressed under conditions of stress 22
(Grandbastien, 1998). It is also thought that retrotransposon activation is sensitive to 23
environment (Mirouuze & Paszkowski, 2011; Grandbastien, 1998), further enhancing 24
18
their candidacy for regulating stress responses, such as nutritional deficiencies. 1
Transposable Elements (TEs) can evoke gene variation and functional changes (Gao 2
et al., 2012) and are a source of small RNAs and implicated in gene-‐regulation in 3
both animals and plants (McCue & Slotkin, 2012). A role for small RNAs in regulation 4
of P starvation is emerging (Fang et al., 2009; Hsieh et al., 2009; Chiou & Lin, 2011; 5
O’Rourke et al., 2013). Further to this, a potential role of a small RNA targeting 6
transcripts involved in posttranscriptional/posttranslational regulation leading to T 7
and N phenotype in H. lanatus is worth further investigation. 8
9
A suite of isotigs involved in protein degradation including two with homology to 10
aspartic proteinase nepenthesin precursor (isotig17128, isotig10719), one FtsH 11
protease (03772) and a ubiquitination like protein (isotig20448) were suppressed in 12
T compared to N phenotype, indicating that post-‐translational protein degradation 13
may be an important factor for the N phenotype. With respect to P treatment, 14
ubiquitin-‐domain protein (isotig17019), protease inhibitor (isotig19161), putative 15
subtilisin homologue, a non-‐specific protease (isotig03645) were significantly up 16
regulated in response to P starvation, while ubiquitin conjugating enzyme like 17
(isotig08177), ICE-‐like protease p20 domain containing protein (isotig10848), 18
putative Deg protease homologue (isotig09222) and LTPL113 -‐ Protease inhibitor 19
(isotig19161) were significantly down regulated in response to P starvation. 20
21
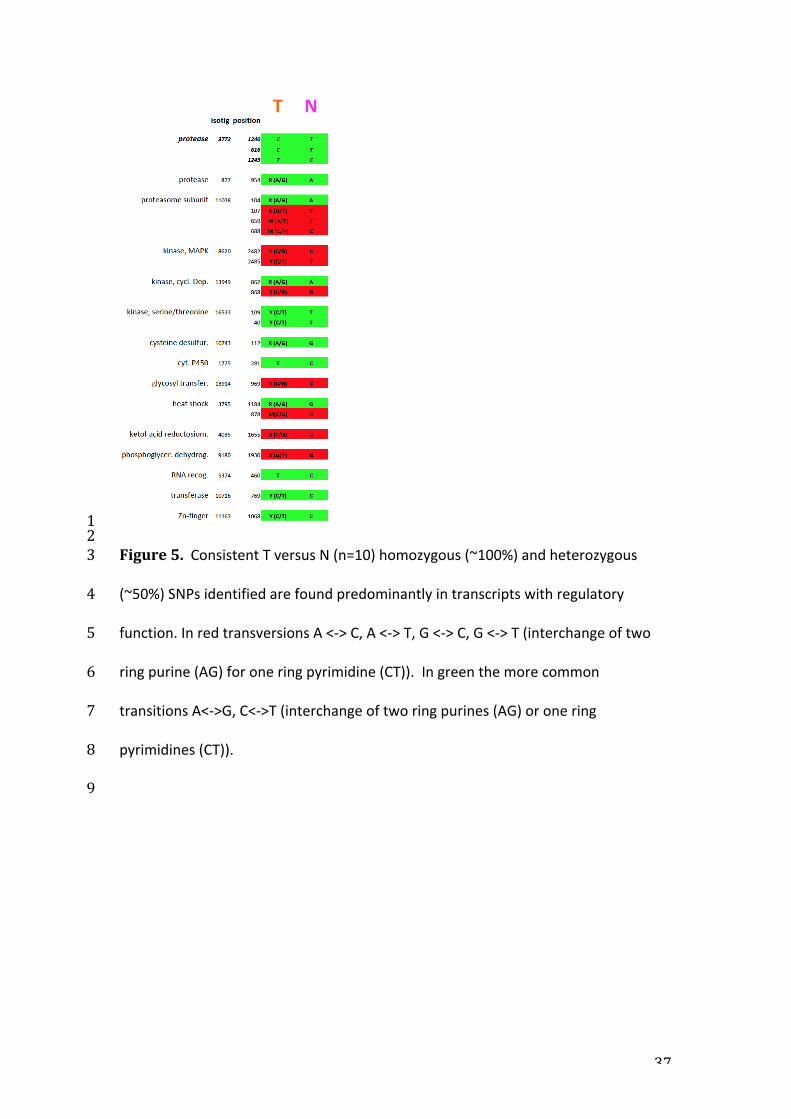
Furthermore, 6 consistent homozygous and 30 consistent heterozygous SNPs for N 22
versus T phenotype (n=10) were identified (Fig. 5). These occurred predominantly in 23
transcripts associated with regulatory function such as proteolysis (protease, 24
19
proteasome subunit, heat shock), protein modification (cysteine desulferase, 1
glycosyl transferase, transferase, kinase) and RNA recognition (RNA-‐binding, 2
ribonucleoprotein) and were a mixture of transitions and transversion SNPs (Fig. 5). 3
Ubiquitins, which mark proteins for proteasome mediated degradation are thought 4
to have a key role in regulation of plant SPX domains in response to P stress (Wu et 5
al., 2012), so it is particularly interesting that we find that the largest number of 6
SNPs (3 transversion and 1 transition SNP) between T and N in an putative 7
proteasome subunit (isotig11038) as well as SNPs in FtsH protease (isotig03772) and 8
heat shock protein (isotig03795/03796). Also while we assume that these SNPs are 9
of genomic origin, without the genomic sequence of H. lanatus it is not possible to 10
rule out that targeted mRNA editing may be involved in some of these cases. RNA-‐11
editing, which has first been identified in the cox2 mRNA of Trypanosoma brucei, is 12
thought to play an important role in organelles (plastids and mitochondria) of plants, 13
with those identified typically involving a change of specific C to U, but other 14
changes can as yet not be ruled out (Grennan, 2011; Jiang et al., 2012). The role of 15
RNA-‐editing in plant plastid as well as nuclear encoded RNA/mRNA, remains to be 16
further investigated by systematic sequencing of plant genome (DNA) and 17
transcriptome (cDNA) as has been described for identification of RNA editing sites in 18
human studies (Ramaswami et al., 2012). While RNA-‐binding proteins of the 19
pentatricopeptide repeat family, multiple organellar RNA editing factor and 20
chloroplast ribonucleoproteins are known to be involved, further proteins remain to 21
be identified (Tillich et al., 2009; Grennan, 2011; Takenaka et al., 2012). So it is 22
noteworthy in this context that one of the homozygous SNPs identified between T 23
versus N phenotype in this study is in isotig05374 which shows 70% homology to a 24

20
RNA recognition motif containing protein/predicted ribonucleoprotein. Further to 1
that, exonuclease (isotig08248), which mediates RNA degradation (Stoppel et al., 2
2012), is strongly up regulated in the N phenotype. Thus both the N/T gene 3
expression result as well as the SNPs obtained for N/T phenotype suggest that post-‐4
translational regulation of proteins via the ubiquitin-‐proteasome system plays an 5
important role in determining the N and T phenotype and furthermore points to a 6
potential role of post-‐transcriptional regulation (RNA degradation and a possible role 7
of RNA editing). A causative upstream master regulatory gene, inducing post-‐8
translational and maybe also post-‐transcriptional events of consequence for 9
arsenate resistance and P uptake efficiency in these plants remains to be identified 10
and potential involvement of small RNAs should be investigated in this context. 11
12
The transcripts differentially regulated by P treatment were more completely 13
annotated compared to between phenotype (SI AnnotatedDeseqResult.xlxs), with 14
many of the genes identified as being significant having well known roles in P 15
transport and metabolism, as well as those involved in post-‐transcription, post-‐16
translation, and signaling (Fig. 4, SI Annotated-‐DESeq-‐Results.xlsx). Some gene 17
expression responses involved phosphate transport. These include 3 isotigs 18
annotated as phosphate co-‐transporters and 2 with SPX domains. All showed the 19
same general pattern, with respect to transcript counts, with up-‐regulation under P 20
starvation, and down-‐regulation in P replete treatment, but there was little 21
difference with respect to the expression changes in response to P-‐/P+ in the T and N 22
phenotype. Alignments of phosphate transport translated isotigs to proteins are 23
shown in SI Fig. 5 & 6. Isotigs01092, 18981, 09507 showed strong homology to 24

21
AAM49810.1 a putative rice HAPT (SI Fig. 5), and isotig16690 to Q651J5 phosphate 1
transporter PHO1-‐3 known to be induced under P deficient conditions (SI Fig. 6). Of 2
the few isotigs with significantly higher counts in P+ compared to P-‐ in T, but not in 3
N, was an auxin induced protein (isotigs11028). Given the strong induction in an 4
auxin-‐binding transcript (isotig16840) in the T versus N phenotype and the observed 5
differences in root growth, auxin mediated response appears to be an important 6
differentiator of the T/N phenotype. The rice and Brachypodium matches to the 7
translated isotig16840 protein sequence are shown in SI Fig. 3. 8
9
A number of recent studies have found up-‐stream regulators of low phosphorus 10
adaption responses in plants with ALFIN—LIKE proteins implicated in regulating root 11
hair growth in Arabidopsis under P stress (Chandrika et al., 2013). ALFIN-‐LIKE 12
proteins are a small family of plant Homeo Domain (PHD) containing putative 13
transcription factors with a methylated histone residue binding component and 14
ALFIN-‐LIKe 6 was shown to control the transcription of a range of genes involved in 15
growth in particular root hair growth (Chandrika et al., 2013). A homologue of this 16
gene was identified in our H. lanatus transcriptome (isotig02053) and the translated 17
isotig showed high similarity to A. thaliana and even higher similarity to B. 18
distachyon ALFIN-‐LIKE protein (SI Fig. 8), providing further evidence of the overall 19
quality of the 454 transcriptome assembly, though this transcript was equally highly 20
expressed in all N and T plants and not differentially regulated between either P 21
treatment or phenotype. 22
23

22
Many of the transcripts responsive to P nutrition are regulated as expected, with 1
many obviously involved in P nutrition and generally strongly up regulated in 2
response to P stress. For example the 4 phosphate transport related transcripts, and 3
the 2 SPX transcripts, identified in H. lanatus in this study were induced by P stress, 4
in line with what has been observed generically in literature studies, as exemplified 5
in the phosphate responsive transcriptome of white lupin (O’Rourke et al., 2013). 6
Other transcripts coding for proteins involved in P regulation or transport identified 7
(SI Annotated-‐DESeq-‐Result.xlsx) include glycerophosphodiester/phosphodiesterase, 8
sucrose-‐phosphate synthase, glucose pyrophosphorylase, purple acid phosphatase, 9
phosphatase, glucose-‐6-‐phosphate phosphate translocator, for example, also 10
differentially regulated when comparing P stressed and P repleat lupin (O’Rourke et 11
al., 2013). 12
13
With respect to arsenate tolerance, the character used to screen the phenotype 14
understudy, one gene with a putative role in arsenic transport/metabolism, besides 15
phosphate transporters and their regulators, was an arsB-‐like gene. The alignment of 16
isotig09604 with ars-‐B like protein can be seen in SI Fig. 9. ArsB, is widely present in 17
arsenic resistant bacteria where its role is as an arsenite efflux channel (Yang et al., 18
2012), though in plants these class of aqua-‐glycerin prions also are involved in silicic 19
acid transport (Zhao et al., 2009). This gene (isotig09604) was more strongly 20
expressed in T compared to N phenotype as was aquaporin Pip1-‐5 like 21
(Plasmamembrane Intrinsic Protein) (isotig00796/00797/00798), but this is only 22
involved in transport of water and small neutral solutes. Logoteta et al. (2009) found 23
that differential efflux of arsenite by H. lanatus was not found between T and N 24

23
phenotype. A protein, HLASR, has been identified in H. lanatus to have a 1
constitutive, but not an adaptive role, in metabolism of arsenate, namely as an 2
arsenate reductase (Bleeker et al. 2006). It was thought that this HLASR gene only 3
had a secondary role with respect to arsenic metabolism and that its primary role 4
was homologous to CDC25 phosphatases, which activate cycline-‐dependent kinases 5
in A. thaliana, which are involved in cell cycle regulation. HLASR is also thought to 6
have a role in GSH oxidation (Bleeker et al., 2006). An exact protein match 7
(isotig19077) to this Cdc25-‐like H. lanatus ASR, the only gene sequence previously 8
published for this species, was found in all 10 N and 10 T transcriptomes (SI Fig. 3), 9
and was shown not to be differentially regulated, confirming that it has no adaptive 10
role in tolerance. 11
12
Returning to the fact that the trait under study here is due to a single loci and that it 13
leads to a range of distinct phenotypic traits is indicative that an upstream regulatory 14
gene is involved. It is now well established that P responsive genes a) give rise to 15
transcriptome signal cascades and/or b) are involved in these signal cascades (Wu et 16
al. 2013; Chiou & Lin, 2011). We identified 87 transcripts whose transcript 17
expression significantly differed between T and P phenotype, and 19 transcripts (17 18
with functional annotation) with consistent SNPs (36 SNPs in total) in all 10 T versus 19
N genotypes (SI Table 1). It is noteworthy that consistent SNPs and significant gene 20
expression changes between N versus T phenotypes are aggregated in transcripts 21
with regulatory functions (Fig.s 4 and 5). Differential post-‐translational and/or post-‐22
transcriptional regulation (involving ubiquitin, proteases, kinases, methylation, 23
transponsons, retrotransposons and RNA binding proteins) of HAPT or proteins 24

24
acting on HAPT, therefore, appear to define the N/T phenotype. Whether identified 1
SNPs are all genomic SNPs or whether in some cases mRNA editing may be involved 2
remains to be elucidated. A master regulatory gene, potentially to be found within 3
our list of target genes or possibly in form of an as yet to be identified small RNA, 4
leading to the observed effect on genes involved in post-‐translational events 5
including protein degradation via the ubiquitin/proteasome complex and potentially 6
also post-‐transcriptional events mediated by RNA binding proteins, is as yet to be 7
identified. This characterization of the genetic consequences the P response 8
polymorphism in H. lanatus provides an unparalleled insight into the signal cascades, 9
optimized under natural selection, involved in P nutrition and has major 10
consequences for understanding how plants respond to phosphorus nutrition and 11
adaptation to arsenate in their environment. We anticipate that this as yet unknown 12
master regulatory gene and it’s downstream targets, which we have already 13
identified, will be of significant consequence for future study and breeding of P-‐14
efficient forage plants and cereal crops. 15
16
17

25
References 1
Aliscioni S, Bell HL, Besnard G, Christin P-‐A, Columbus JT, Duvall MR, Edwards EJ, 2
Giussani L, Hasenstab-‐Lehman K, Hilu KW, Hodkinson TR, Ingram AL, Kellogg EA, 3
Mashayekhi S, Morrone O, Osborne CP, Salamin N, Schaefer H, Spriggs E, Smith SA, 4
Zuloaga F. 2012. New grass phylogeny resolves deep evolutionary relationships and 5
discobers C4 origins. New Phytologist: 193, 304-‐312. 6
7
Anders S, Huber W. 2010. Differential expression analysis for sequence count data. 8
Genome Biology: 11, R106. 9
10
Bleeker PM, Hakvoort HWJ, Bliek M, Souer E, Schat H. 2006. Enhanced arsenate 11
reduction by a CDC25-‐like tyrosine phosphatase explains increased phytochelatin 12
accumulation in arsenate-‐tolerant Holcus lanatus. Plant Journal: 45, 917-‐929. 13
14
Buckler ES, Thornsberry JM, Kresovich S. 2001. Molecular diversity, structure and 15
domestication of grasses. Genetics Research Cambridge: 77, 213-‐218. 16
17
Chandrka NNP, Sundarevelpandian K, Yu S-‐M, Schmidt W. 2013. ALFIN-‐LIKE 6 is 18
involved in root hair elongation during phosphate deficiency in Arabidopsis. New 19
Phytologist: advanced online, doi:10.1111/nph.12194. 20
21
Chiou TJ, Lin SI. 2011. Signaling network in sensing phosphate availability in plants. 22
Annual Review Plant Biology: 62, 185-‐206. 23
24

26
Conesa A, Gotz S. 2008. Blast2GO: A comprehensive suite for functional analysis in 1
plant genomics. International Journal Plant Genomics: Article ID 619832. 2
3
Cosgrove DJ. 1999. Enzymes and other agents that enhance cell wall extensibility. 4
Annual Review Plant Physiology Plant Molecular Biology: 50, 391-‐417. 5
6
Fang ZY, Shao C, Meng YJ, Wu P, Chen M. 2009. Phosphate signaling in Arabidopsis 7
and Oryza sativa. Plant Science: 176, 170-‐180. 8
9
Feuille C, Keller B. 2001. Comparative genomics in the grass family: molecular 10
characterization of grass genome structure and evolution. Annals Botany: 89, 3-‐10. 11
12
Gamuyao R, Chin JH, Pariasca-‐Tanaka J, Catausan S, Dalid D, Slamet-‐Loedin I, Tecson-‐13
Mendoza EM, Wissuwa M, Heur S. 2012. Nature: 488. 535-‐541. 14
15
Gao C, Xiao M, Jiang L, Li J, Yin J, Ren X, Qian W, Oscar O, Fu D, Tang Z. 2012. 16
Characterization of transcriptional activation and inserted-‐into-‐gene preference 17
of various transposable elements in the Brassica species. Molecular Biology Reports: 18
39, 7513-‐7523. 19
20
Gojon A, Nacry P, Davidian JC. 2009. Root uptake regulation: a central process for 21
NPS homeostasis in plants. Current Opinion Plant Biology: 12, 328-‐338. 22
23

27
Grandbastien MA. 1998. Activation of plant retrotransposons under stress 1
conditions, Trends Plant Science 3: 181-‐187. 2
3
Grennan AK. 2011. To thy proteins be true: RNA editing in plants. Plant Physiology: 4
156, 453-‐454. 5
6
Gouy M, Guindon S, Gascuel O. 2010. SeaView version 4 : a multiplatform graphical 7
user interface for sequence alignment and phylogenetic tree building. Molecular 8
Biology Evolution: 27, 221-‐224. 9
10
Hamilton JP, Buell CR. 2012. Advances in plant genome sequencing. The Plant 11
Journal: 70, 177-‐190. 12
13
Hill JO, Simpson RJ, Moore AD, Chapman DF. 2006. Morphology and response of 14
roots of pasture species to phosphorus and nitrogen nutrition. Plant Soil: 286, 7-‐19. 15
16
Hsieh LC, Lin SI, Shih ACC, Chen JW, Lin WY, Tseng CY, Li WH, Chiou TJ. 2009. 17
Uncovering small RNA-‐mediated responses to phosphate deficiency in Arabidopsis 18
by deep sequencing. Plant Physiology: 151, 2120-‐2132. 19
20
Huang TL, Nguyen QT, Fu SF, Lin CY, Chen YC, Huang HJ. 2012. Transcriptomic 21
changes and signaling pathways induced by arsenic stress in rice roots. Plant 22
Molecular Biology: 80, 587-‐608. 23
24

28
Jackson SA, Iwata A, Lee SH, Schmutz J, Shoemaker R. 2011. Sequencing crop 1
genomes: approaches and applications. New Phytologist: 191, 915-‐925. 2
3
Jiang Y, Fan SL, Song MZ, Yu JN, Yu SX. 2012. Identification of RNA editing sites in 4
cotton (Gossypium hirsutum) chloroplasts and editing events that affect secondary 5
and three-‐dimensional protein structures. Genetics Molecular Research: 11, 987-‐6
1001. 7
8
Katoh K, Standley DM. 2013. MAFFT multiple sequence alignment software version 9
7:improvements in performance and usability. Molecular Biology Evolution: 30, 772-‐10
80. 11
12
Kuromori T, Takahashi S, Kondou Y, Shinozaki K, Matsui. 2009. Phenome analysis in 13
plant species using loss-‐of-‐function and gain-‐of-‐function metants. Plant Cell 14
Physiology: 50, 1215-‐1231. 15
16
Langmead B, Trapnell C, Pop M, Salzberg SL. 2009. Ultrafast and memory-‐efficient 17
alignment of short DNA sequences to the human genome. Genome Biology: 10, R25. 18
19
Li JB, Levanon EY, Yoon JK, Aach J, Xie B, Leproust E, Zhang K, Gao Y, Church 20
GM. 2009. Genome-‐wide identification of human RNA editing sites by parallel DNA 21
capturing and sequencing. Science: 324, 1210-‐1213. 22
23

29
Logoteta V, Xu XY, Macnair MR, McGrath SP, Zhao FJ. 2009. Arsenite efflux is not 1
enhanced in the arsenate-‐tolerant phenotype of Holcus lanatus. New Phytologist: 2
183, 340-‐348. 3
4
Macnair MR, Cumbes QJ, Meharg AA. 1992. The genetics of arsenate tolerance in 5
Yorkshire Fog, Holcus lanatus L. Heredity: 69, 325-‐335. 6
7
McCue AD, Slotkin RK. 2012. Transposable element small RNAs as regulators of gene 8
expression. Trends Genetics: 28, 616-‐623. 9
10
Meharg AA, Cumbes QJ, Macnair MR. 1993. Pre-‐adaptation of Holcus lanatus L. to 11
arsenate tolerance. Evolution: 47, 313-‐316. 12
13
Meharg AA, Macnair MR. 1992a. Suppression of the phosphate uptake system: A 14
mechanism of arsenate tolerance in Holcus lanatus L. Journal Experimental Botany: 15
43, 519-‐524. 16
17
Meharg AA, Macnair MR. 1992b. Genetic correlation between arsenate tolerance 18
and the rate of arsenate and phosphate uptake in Holcus lanatus L. Heredity: 69, 19
336-‐341. 20
21
Mirouze M, Paszkowski J. 2011. Epigenetic contribution to stress adaptation in 22
plants. Current Opinion Plant Biology: 14, 267-‐274. 23
24

30
Nawy T. 2012. Non-‐model organisms. Nature Methods: 9, 37. 1
2
Naylor J, Macnair MR, Williams END, Poulton PR. 1996. A polymorphism for 3
phosphate/arsenate tolerance in Holcus lanatus L.: is their a correlation with edaphic 4
or environmental factors? Heridity: 77, 509-‐517. 5
6
O’Rourke JA, Yang SS, Miller SS, Bucciarelli B, Liu J, Rydeen A, Bozsoki Z, Uhde-‐Stone 7
C, Zheng JT, Allan D, Gronwald JW, Vance CP. 2013. An RNA-‐Seq transcriptome 8
analysis of othophosphate-‐deficient white lupin reveals novel insights into 9
phosphorus acclimation in plants. Plant Physiology: 161, 705-‐724. 10
11
Okamoto H, Hirochika H. 2001. Silencing of transposable elements in plants. Trends 12
Plant Sciences: 6, 527-‐534. 13
14
Ramaswami G, Lin W, Piskol R, Tan MH, Davis C, Li JB. 2012. Accurate identification 15
of human Alu and non-‐Alu RNA editing sites. Nature Methods: 9, 579-‐81. 16
17
Takenaka M, Zehrmann A, Verbitskiy D, Kugelmann M, Härtel B, Brennicke A. 2012. 18
Multiple organellar RNA editing factor (MORF) family proteins are required for 19
RNA editing in mitochondria and plastids of plants. PNAS: 109, 5104-‐5109. 20
21
Stajich JE, Block D, Boulez K, Brenne SE, Chervitz SA, Dagdigian C, Fuellen G, Gilbert 22
JGR, Kork I, Lapp H, Lehvaslaiho H, Matsalla C, Mungall CJ, Osborne BI, Pocock MR, 23

31
Schattner P, Senger M, Stein LD, Stupka E, Wilkinson MD, Birney E. 2002. The Bioperl 1
Toolkit: Perl modules for life sciences. Genome Research: 12, 1611-‐1618. 2
3
Stoppel R, Meurer J. 2012. The cutting crew -‐ ribonucleases are key players in the 4
control of plastid gene expression. Journal Experimental Botany: 63, 1663-‐1673. 5
6
Suarez Rodriguez MC, Edsgard D, Hussain SS, Alquezar D, Rasmussen M, Gilbert T, 7
Nielsen BH, Bartels D, Mundy J. 2010. Transcriptome of the dessication-‐tolerant 8
resurrection plant Craterostigma plantagineum. Plant Journal: 63, 212-‐228. 9
10
The International Brachypodium Initiative. 2010. Genome sequencing and analysis of 11
the model grass Brachypodium distachyon. Nature: 463, 763-‐768. 12
Tillich M, Hardel SL, Kupsch C, Armbruster U, Delannoy E, Gualberto JM, 13
Lehwark P, Leister D, Small ID, Schmitz-‐Linneweber C. 2009. Chloroplast 14
ribonucleoprotein CP31A is required for editing and stability of specific 15
chloroplast mRNAs. PNAS: 7106, 6002-‐6007. 16
17
Urzica EI, Yamassaki H, Hsieh SI, Adler LN, Karpowicz SJ, Blaby-‐Hass CE, Clarke SG, 18
Loo JA, Pellegrini M, Merchant SS. 2012. Systems and trans-‐system level analysis 19
identifies conserved iron deficiency resonponses in the plant lineage. Plant Cell: 24, 20
3921-‐3948. 21
22

32
Wu P, Shou H, Xu G, Lian X. 2013. Improvement of phosphorus efficiency in rice on 1
the basis of understanding phosphate signaling and homeostasis. Current Opinions 2
Plant Biology: in press: http://dx.doi.org/10.1016/j.pbi.2013.03.002 3
4
Yang H-‐C, Fu H-‐L, Lin Y-‐F, Rosen BP. 2012. Pathways of arsenic uptake and efflux. In 5
Metal Transporters eds. Lutsenko S and Arguello. Elsevier Inc.. 6
7
Zhao FJ, Ma JF, Meharg AA, McGrath SP. 2009. Arsenic uptake and metabolism in 8
plants. New Phytologist: 181, 777-‐794. 9
10
11
12
13
14
15
16
17
18

33
1
2
3
Figure 1. Tolerance index (100*root length in +As/root length in –As) of Cruickshank 4
garden H. lanatus population grown hydroponically in 0.013 mM arsenic as arsenate 5
for 2 wk.. 6
7
8
34
1
2
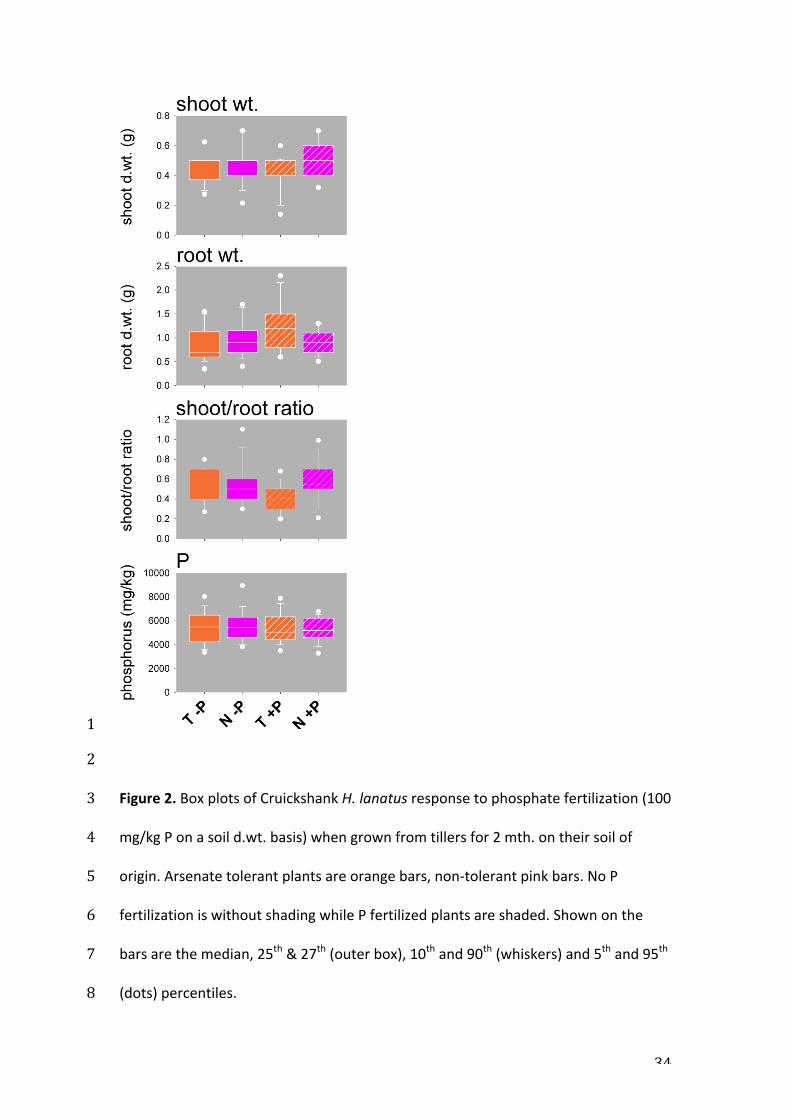
Figure 2. Box plots of Cruickshank H. lanatus response to phosphate fertilization (100 3
mg/kg P on a soil d.wt. basis) when grown from tillers for 2 mth. on their soil of 4
origin. Arsenate tolerant plants are orange bars, non-‐tolerant pink bars. No P 5
fertilization is without shading while P fertilized plants are shaded. Shown on the 6
bars are the median, 25th & 27th (outer box), 10th and 90th (whiskers) and 5th and 95th 7
(dots) percentiles. 8

35
1
2
3
4
Figure 3: Heatmap of the RNAseq gene expression result showing clustering of P+/-‐ 5
of each genotytpe as well as T and N phenotype 6

36
1 2 3 Figure 4. RNAseq gene expression result: up and down regulation identified for P-‐4
/P+ and T/N. As there was no statistical difference between phosphorus treatments 5
and tolerance, the average of all treatments by either P treatment or by phenotype 6
was used in this analysis. All genes significantly differentially regulated (at FDR = 7
0.01) in either treatment (P or phenotype) are shown. Where the ratio was 8
significant between treatments the bars are coloured, where not significant, the bars 9
are white. 10
11 12 13 14 15 16
P-‐/P+ T/N
37
1 2 Figure 5. Consistent T versus N (n=10) homozygous (~100%) and heterozygous 3
(~50%) SNPs identified are found predominantly in transcripts with regulatory 4
function. In red transversions A <-‐> C, A <-‐> T, G <-‐> C, G <-‐> T (interchange of two 5
ring purine (AG) for one ring pyrimidine (CT)). In green the more common 6
transitions A<-‐>G, C<-‐>T (interchange of two ring purines (AG) or one ring 7
pyrimidines (CT)). 8
9