trane technologies plc
TRANSCRIPT
Table of Contents
UNITED STATESSECURITIES AND EXCHANGE COMMISSION
Washington, D.C. 20549 _______________________________
FORM 10-Q_______________________________
☒☒ QUARTERLY REPORT PURSUANT TO SECTION 13 OR 15 (d) OF THE SECURITIES EXCHANGE ACT OF 1934
For the quarterly period ended March 31, 2021or
☐ TRANSITION REPORT PURSUANT TO SECTION 13 OR 15 (d) OF THE SECURITIES EXCHANGE ACT OF 1934For the transition period from to
Commission File Number 001-34400
_____________________________
TRANE TECHNOLOGIES PLC(Exact name of registrant as specified in its charter)
_______________________________Ireland 98-0626632
(State or other jurisdiction of incorporation or organization)
(I.R.S. Employer Identification No.)
170/175 Lakeview Dr.Airside Business Park
Swords Co. DublinIreland
(Address of principal executive offices, including zip code)+(353) (0) 18707400
(Registrant’s telephone number, including area code)
_______________________________Securities registered pursuant to Section 12(b) of the Act:
Title of each class Trading Symbol Name of each exchange on which registeredOrdinary Shares, Par Value $1.00 per Share TT New York Stock Exchange
Indicate by check mark whether the registrant (1) has filed all reports required to be filed by Section 13 or 15(d) of the Securities Exchange Act of 1934 during thepreceding 12 months (or for such shorter period that the registrant was required to file such reports), and (2) has been subject to such filing requirements for the past 90days. Yes x No ¨
Indicate by check mark whether the registrant has submitted electronically every Interactive Data File required to be submitted pursuant to Rule 405 of Regulation S-T(§232.405 of this chapter) during the preceding 12 months (or for such shorter period that the registrant was required to submit such files). Yes x No ¨
Indicate by check mark whether the registrant is a large accelerated filer, an accelerated filer, a non-accelerated filer, a smaller reporting company, or an emerging growthcompany. See definitions of “large accelerated filer,” “accelerated filer,” “smaller reporting company,” and “emerging growth company” in Rule 12b-2 of the Exchange Act.
Large Accelerated Filer x Accelerated filer ¨ Emerging growth company ☐
Non-accelerated filer ¨ Smaller reporting company ☐
If an emerging growth company, indicate by check mark if the registrant has elected not to use the extended transition period for complying with any new or revised financialaccounting standards provided pursuant to Section 13(a) of the Exchange Act. ¨
Indicate by check mark whether the registrant is a shell company (as defined in Rule 12b-2 of the Exchange Act). Yes ☐ No x
The number of ordinary shares outstanding of Trane Technologies plc as of April 23, 2021 was 239,147,507.
Table of Contents
TRANE TECHNOLOGIES PLC
FORM 10-Q
INDEX
PART I FINANCIAL INFORMATION 1Item 1 - Financial Statements 1
Condensed Consolidated Statements of Income (Loss) for the three months ended March 31, 2021 and 2020 1Condensed Consolidated Statements of Comprehensive Income (Loss) for the three months ended March 31, 2021 and 2020 2Condensed Consolidated Balance Sheets at March 31, 2021 and December 31, 2020 3Condensed Consolidated Statements of Equity for the three months ended March 31, 2021 and 2020 4Condensed Consolidated Statements of Cash Flows for the three months ended March 31, 2021 and 2020 5Notes to Condensed Consolidated Financial Statements 6
Item 2 - Management’s Discussion and Analysis of Financial Condition and Results of Operations 27Item 3 - Quantitative and Qualitative Disclosures about Market Risk 40Item 4 - Controls and Procedures 40
PART II OTHER INFORMATION 41Item 1 - Legal Proceedings 41Item 1A - Risk Factors 41Item 2 - Unregistered Sales of Equity Securities and Use of Proceeds 42Item 6 - Exhibits 43
SIGNATURES 44
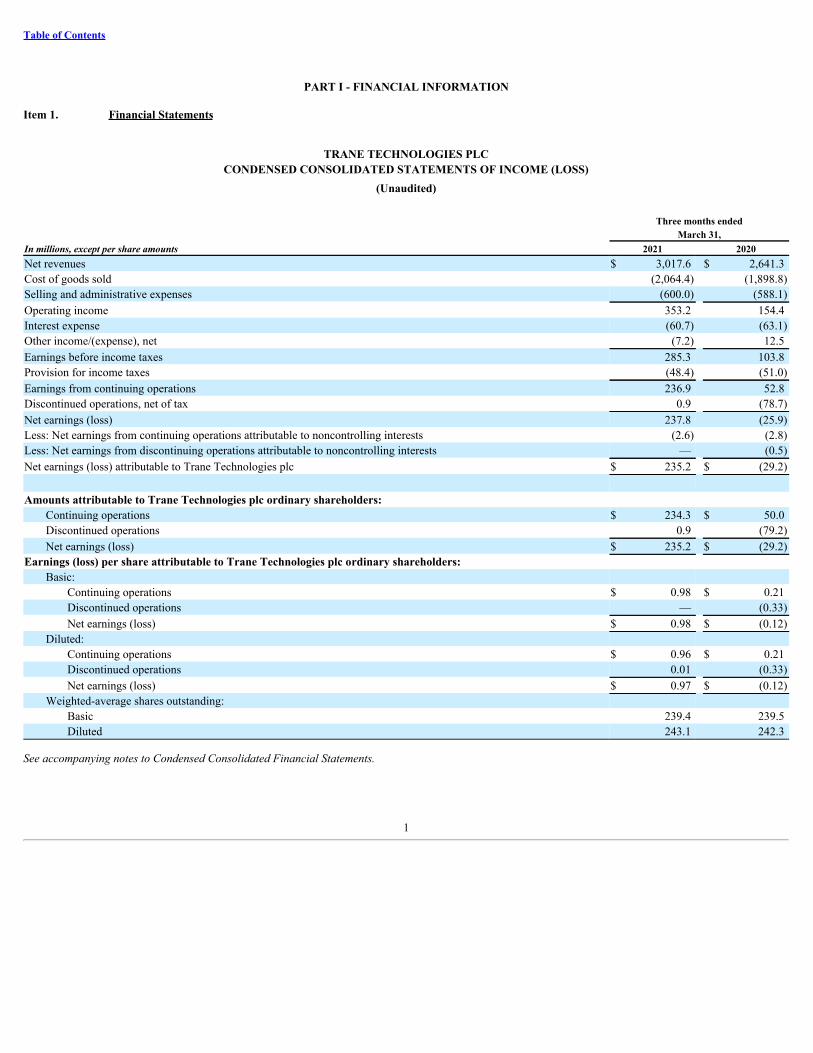
Table of Contents
PART I - FINANCIAL INFORMATION
Item 1. Financial Statements
TRANE TECHNOLOGIES PLCCONDENSED CONSOLIDATED STATEMENTS OF INCOME (LOSS)
(Unaudited)
Three months ended March 31,In millions, except per share amounts 2021 2020Net revenues $ 3,017.6 $ 2,641.3 Cost of goods sold (2,064.4) (1,898.8)Selling and administrative expenses (600.0) (588.1)Operating income 353.2 154.4 Interest expense (60.7) (63.1)Other income/(expense), net (7.2) 12.5 Earnings before income taxes 285.3 103.8 Provision for income taxes (48.4) (51.0)Earnings from continuing operations 236.9 52.8 Discontinued operations, net of tax 0.9 (78.7)Net earnings (loss) 237.8 (25.9)Less: Net earnings from continuing operations attributable to noncontrolling interests (2.6) (2.8)Less: Net earnings from discontinuing operations attributable to noncontrolling interests — (0.5)Net earnings (loss) attributable to Trane Technologies plc $ 235.2 $ (29.2)
Amounts attributable to Trane Technologies plc ordinary shareholders:Continuing operations $ 234.3 $ 50.0 Discontinued operations 0.9 (79.2)Net earnings (loss) $ 235.2 $ (29.2)
Earnings (loss) per share attributable to Trane Technologies plc ordinary shareholders:Basic:
Continuing operations $ 0.98 $ 0.21 Discontinued operations — (0.33)Net earnings (loss) $ 0.98 $ (0.12)
Diluted:Continuing operations $ 0.96 $ 0.21 Discontinued operations 0.01 (0.33)Net earnings (loss) $ 0.97 $ (0.12)
Weighted-average shares outstanding:Basic 239.4 239.5 Diluted 243.1 242.3
See accompanying notes to Condensed Consolidated Financial Statements.
1
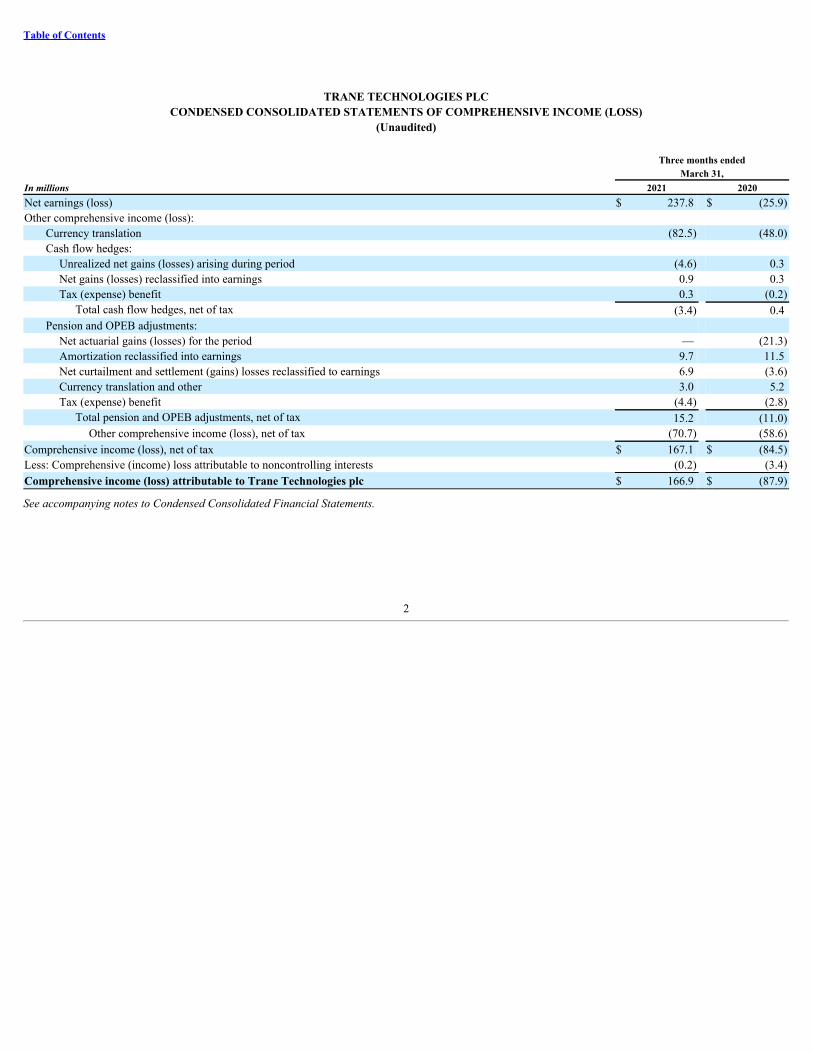
Table of Contents
TRANE TECHNOLOGIES PLCCONDENSED CONSOLIDATED STATEMENTS OF COMPREHENSIVE INCOME (LOSS)
(Unaudited)
Three months endedMarch 31,
In millions 2021 2020Net earnings (loss) $ 237.8 $ (25.9)Other comprehensive income (loss):
Currency translation (82.5) (48.0)Cash flow hedges:
Unrealized net gains (losses) arising during period (4.6) 0.3 Net gains (losses) reclassified into earnings 0.9 0.3 Tax (expense) benefit 0.3 (0.2)
Total cash flow hedges, net of tax (3.4) 0.4 Pension and OPEB adjustments:
Net actuarial gains (losses) for the period — (21.3)Amortization reclassified into earnings 9.7 11.5 Net curtailment and settlement (gains) losses reclassified to earnings 6.9 (3.6)Currency translation and other 3.0 5.2 Tax (expense) benefit (4.4) (2.8)
Total pension and OPEB adjustments, net of tax 15.2 (11.0)Other comprehensive income (loss), net of tax (70.7) (58.6)
Comprehensive income (loss), net of tax $ 167.1 $ (84.5)Less: Comprehensive (income) loss attributable to noncontrolling interests (0.2) (3.4)Comprehensive income (loss) attributable to Trane Technologies plc $ 166.9 $ (87.9)
See accompanying notes to Condensed Consolidated Financial Statements.
2

Table of Contents
TRANE TECHNOLOGIES PLCCONDENSED CONSOLIDATED BALANCE SHEETS
(Unaudited)
In millionsMarch 31,
2021December 31,
2020ASSETSCurrent assets:
Cash and cash equivalents $ 2,838.0 $ 3,289.9 Accounts and notes receivable, net 2,159.4 2,202.1 Inventories 1,373.1 1,189.2 Other current assets 251.6 224.4
Total current assets 6,622.1 6,905.6 Property, plant and equipment, net 1,327.7 1,349.5 Goodwill 5,311.2 5,342.8 Intangible assets, net 3,256.9 3,286.4 Other noncurrent assets 1,306.9 1,272.4
Total assets $ 17,824.8 $ 18,156.7 LIABILITIES AND EQUITYCurrent liabilities:
Accounts payable $ 1,608.9 $ 1,520.2 Accrued compensation and benefits 368.8 451.1 Accrued expenses and other current liabilities 1,721.5 1,592.0 Short-term borrowings and current maturities of long-term debt 475.4 775.6
Total current liabilities 4,174.6 4,338.9 Long-term debt 4,496.3 4,496.5 Postemployment and other benefit liabilities 1,008.2 1,024.6 Deferred and noncurrent income taxes 563.0 578.5 Other noncurrent liabilities 1,269.9 1,291.1
Total liabilities 11,512.0 11,729.6 Equity:
Trane Technologies plc shareholders’ equity:Ordinary shares 263.6 263.3 Ordinary shares held in treasury, at cost (1,719.4) (1,719.4)Retained earnings 8,452.3 8,495.3 Accumulated other comprehensive income (loss) (699.8) (631.5)
Total Trane Technologies plc shareholders’ equity 6,296.7 6,407.7 Noncontrolling interests 16.1 19.4
Total equity 6,312.8 6,427.1 Total liabilities and equity $ 17,824.8 $ 18,156.7
See accompanying notes to Condensed Consolidated Financial Statements.
3
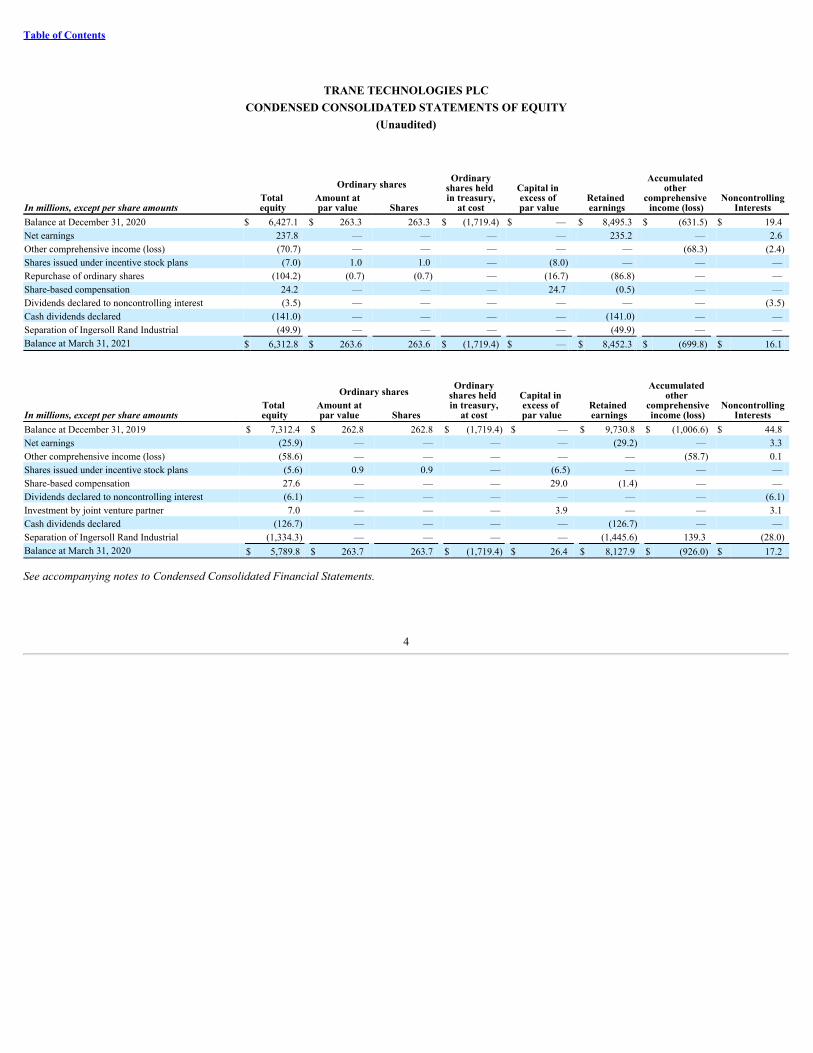
Table of Contents
TRANE TECHNOLOGIES PLCCONDENSED CONSOLIDATED STATEMENTS OF EQUITY
(Unaudited)
In millions, except per share amountsTotal equity
Ordinary shares Ordinaryshares held in treasury,
at cost
Capital in excess of par value
Retained earnings
Accumulated other
comprehensive income (loss)
NoncontrollingInterests
Amount atpar value Shares
Balance at December 31, 2020 $ 6,427.1 $ 263.3 263.3 $ (1,719.4) $ — $ 8,495.3 $ (631.5) $ 19.4 Net earnings 237.8 — — — — 235.2 — 2.6 Other comprehensive income (loss) (70.7) — — — — — (68.3) (2.4)Shares issued under incentive stock plans (7.0) 1.0 1.0 — (8.0) — — — Repurchase of ordinary shares (104.2) (0.7) (0.7) — (16.7) (86.8) — — Share-based compensation 24.2 — — — 24.7 (0.5) — — Dividends declared to noncontrolling interest (3.5) — — — — — — (3.5)Cash dividends declared (141.0) — — — — (141.0) — — Separation of Ingersoll Rand Industrial (49.9) — — — — (49.9) — — Balance at March 31, 2021 $ 6,312.8 $ 263.6 263.6 $ (1,719.4) $ — $ 8,452.3 $ (699.8) $ 16.1
In millions, except per share amountsTotal equity
Ordinary shares Ordinaryshares held in treasury,
at cost
Capital in excess of par value
Retained earnings
Accumulated other
comprehensiveincome (loss)
NoncontrollingInterests
Amount atpar value Shares
Balance at December 31, 2019 $ 7,312.4 $ 262.8 262.8 $ (1,719.4) $ — $ 9,730.8 $ (1,006.6) $ 44.8 Net earnings (25.9) — — — — (29.2) — 3.3 Other comprehensive income (loss) (58.6) — — — — — (58.7) 0.1 Shares issued under incentive stock plans (5.6) 0.9 0.9 — (6.5) — — — Share-based compensation 27.6 — — — 29.0 (1.4) — — Dividends declared to noncontrolling interest (6.1) — — — — — — (6.1)Investment by joint venture partner 7.0 — — — 3.9 — — 3.1 Cash dividends declared (126.7) — — — — (126.7) — — Separation of Ingersoll Rand Industrial (1,334.3) — — — — (1,445.6) 139.3 (28.0)Balance at March 31, 2020 $ 5,789.8 $ 263.7 263.7 $ (1,719.4) $ 26.4 $ 8,127.9 $ (926.0) $ 17.2
See accompanying notes to Condensed Consolidated Financial Statements.
4
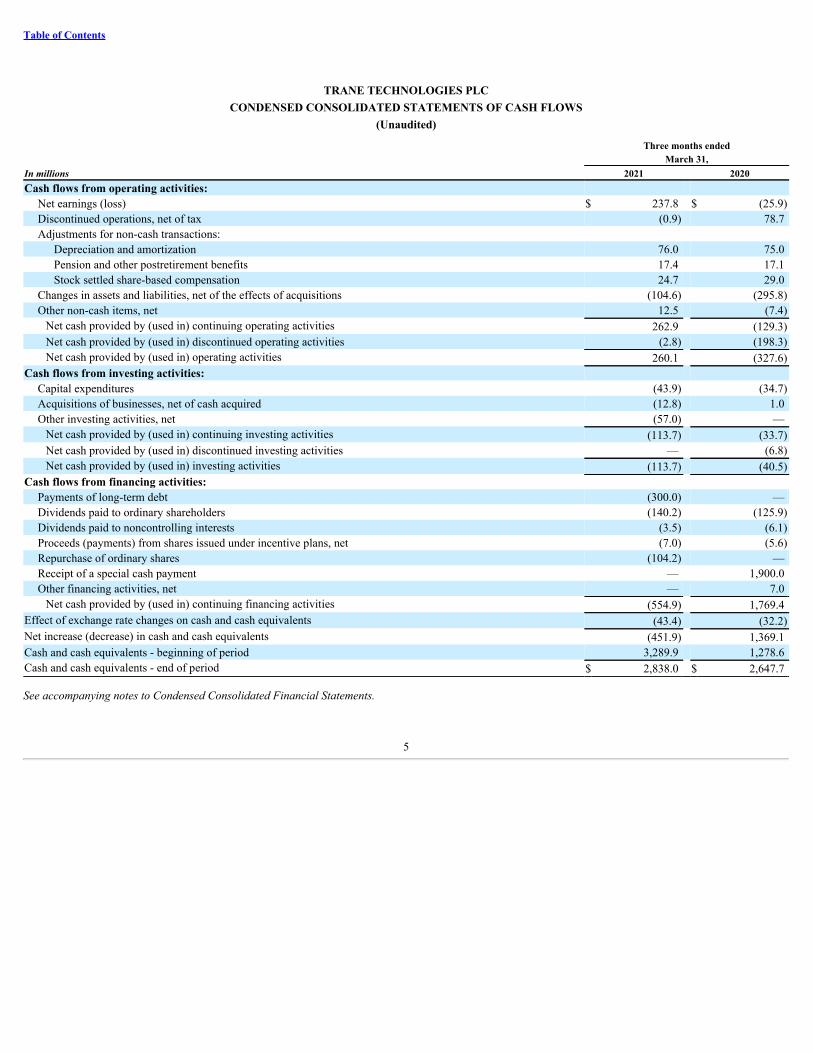
Table of Contents
TRANE TECHNOLOGIES PLCCONDENSED CONSOLIDATED STATEMENTS OF CASH FLOWS
(Unaudited)
Three months ended March 31,In millions 2021 2020Cash flows from operating activities:
Net earnings (loss) $ 237.8 $ (25.9)Discontinued operations, net of tax (0.9) 78.7 Adjustments for non-cash transactions:
Depreciation and amortization 76.0 75.0 Pension and other postretirement benefits 17.4 17.1 Stock settled share-based compensation 24.7 29.0
Changes in assets and liabilities, net of the effects of acquisitions (104.6) (295.8)Other non-cash items, net 12.5 (7.4)
Net cash provided by (used in) continuing operating activities 262.9 (129.3)Net cash provided by (used in) discontinued operating activities (2.8) (198.3)Net cash provided by (used in) operating activities 260.1 (327.6)
Cash flows from investing activities:Capital expenditures (43.9) (34.7)Acquisitions of businesses, net of cash acquired (12.8) 1.0 Other investing activities, net (57.0) —
Net cash provided by (used in) continuing investing activities (113.7) (33.7)Net cash provided by (used in) discontinued investing activities — (6.8)Net cash provided by (used in) investing activities (113.7) (40.5)
Cash flows from financing activities:Payments of long-term debt (300.0) — Dividends paid to ordinary shareholders (140.2) (125.9)Dividends paid to noncontrolling interests (3.5) (6.1)Proceeds (payments) from shares issued under incentive plans, net (7.0) (5.6)Repurchase of ordinary shares (104.2) — Receipt of a special cash payment — 1,900.0 Other financing activities, net — 7.0
Net cash provided by (used in) continuing financing activities (554.9) 1,769.4 Effect of exchange rate changes on cash and cash equivalents (43.4) (32.2)Net increase (decrease) in cash and cash equivalents (451.9) 1,369.1 Cash and cash equivalents - beginning of period 3,289.9 1,278.6 Cash and cash equivalents - end of period $ 2,838.0 $ 2,647.7
See accompanying notes to Condensed Consolidated Financial Statements.
5
Table of Contents
TRANE TECHNOLOGIES PLCNOTES TO CONDENSED CONSOLIDATED FINANCIAL STATEMENTS
(Unaudited)
Note 1. Basis of Presentation
Trane Technologies plc, a public limited company incorporated in Ireland in 2009, and its consolidated subsidiaries (collectively, the Company), is a global climateinnovator that brings efficient and sustainable climate solutions to buildings, homes and transportation driven by strategic brands Trane and Thermo King and anenvironmentally responsible portfolio of products and services. The accompanying unaudited Condensed Consolidated Financial Statements of Trane Technologiesplc reflects the consolidated operations of the Company and have been prepared in accordance with United States Securities and Exchange Commission (SEC)interim reporting requirements. Accordingly, the accompanying Condensed Consolidated Financial Statements do not include all disclosures required byaccounting principles generally accepted in the United States of America (GAAP) for full financial statements and should be read in conjunction with theconsolidated financial statements included in the Company's Annual Report on Form 10-K for the year ended December 31, 2020. In the opinion of management,the accompanying Condensed Consolidated Financial Statements contain all adjustments, which include only normal recurring adjustments, necessary to fairlystate the condensed consolidated results for the interim periods presented.
Reorganization of Aldrich and Murray
On May 1, 2020, certain subsidiaries of the Company underwent an internal corporate restructuring that was effectuated through a series of transactions (2020Corporate Restructuring). As a result, Aldrich Pump LLC (Aldrich) and Murray Boiler LLC (Murray), indirect wholly-owned subsidiaries of Trane Technologiesplc, became solely responsible for the asbestos-related liabilities, and the beneficiaries of the asbestos-related insurance assets, of Trane Technologies CompanyLLC and Trane U.S. Inc, respectively. On a consolidated basis, the 2020 Corporate Restructuring did not have an impact on the Condensed Consolidated FinancialStatements.
On June 18, 2020 (Petition Date), Aldrich and Murray filed voluntary petitions for relief under Chapter 11 of Title 11 of the United States Code (the BankruptcyCode) in the United States Bankruptcy Court for the Western District of North Carolina (the Bankruptcy Court) to resolve equitably and permanently all currentand future asbestos related claims in a manner beneficial to claimants, Aldrich and Murray. As a result of the Chapter 11 filings, all asbestos-related lawsuitsagainst Aldrich and Murray have been stayed due to the imposition of a statutory automatic stay applicable in Chapter 11 bankruptcy cases. Only Aldrich andMurray have filed for Chapter 11 relief. Neither Aldrich's wholly-owned subsidiary, 200 Park, Inc. (200 Park), Murray's wholly-owned subsidiary, ClimateLabsLLC (ClimateLabs), Trane Technologies plc nor its other subsidiaries (the Trane Companies) are part of the Chapter 11 filings. The Trane Companies are expectedto continue to operate as usual, with no disruption to their employees, suppliers, or customers globally. However, as of the Petition Date, Aldrich and its wholly-owned subsidiary 200 Park and Murray and its wholly-owned subsidiary ClimateLabs were deconsolidated and their respective assets and liabilities werederecognized from the Company's Condensed Consolidated Financial Statements. Refer to Note 20, "Commitments and Contingencies," for more informationregarding the Chapter 11 bankruptcy and asbestos-related matters.
Note 2. Completion of Reverse Morris Trust Transaction
On February 29, 2020 (Distribution Date), the Company completed its Reverse Morris Trust transaction (the Transaction) with Gardner Denver Holdings, Inc.(Gardner Denver) whereby the Company separated its former Industrial segment (Ingersoll Rand Industrial) through a pro rata distribution to shareholders ofrecord as of February 24, 2020. Ingersoll Rand Industrial then merged into a wholly-owned subsidiary of Gardner Denver, which changed its name to Ingersoll-Rand Inc. Upon close of the Transaction, the Company’s existing shareholders received 50.1% of the shares of Gardner Denver common stock on a fully-dilutedbasis and Gardner Denver stockholders retained 49.9% of the shares of Gardner Denver on a fully diluted basis. As a result, the Company’s shareholders received.8824 shares of Gardner Denver common stock with respect to each share owned as of February 24, 2020. In connection with the Transaction, Ingersoll-RandServices Company, an affiliate of Ingersoll Rand Industrial, borrowed an aggregate principal amount of $1.9 billion under a senior secured first lien term loanfacility (Term Loan), the proceeds of which were used to make a special cash payment of $1.9 billion to a subsidiary of the Company. The obligations under theTerm Loan were retained by Ingersoll-Rand Services Company, which following the Transaction is a wholly-owned subsidiary of Gardner Denver.
® ®
6
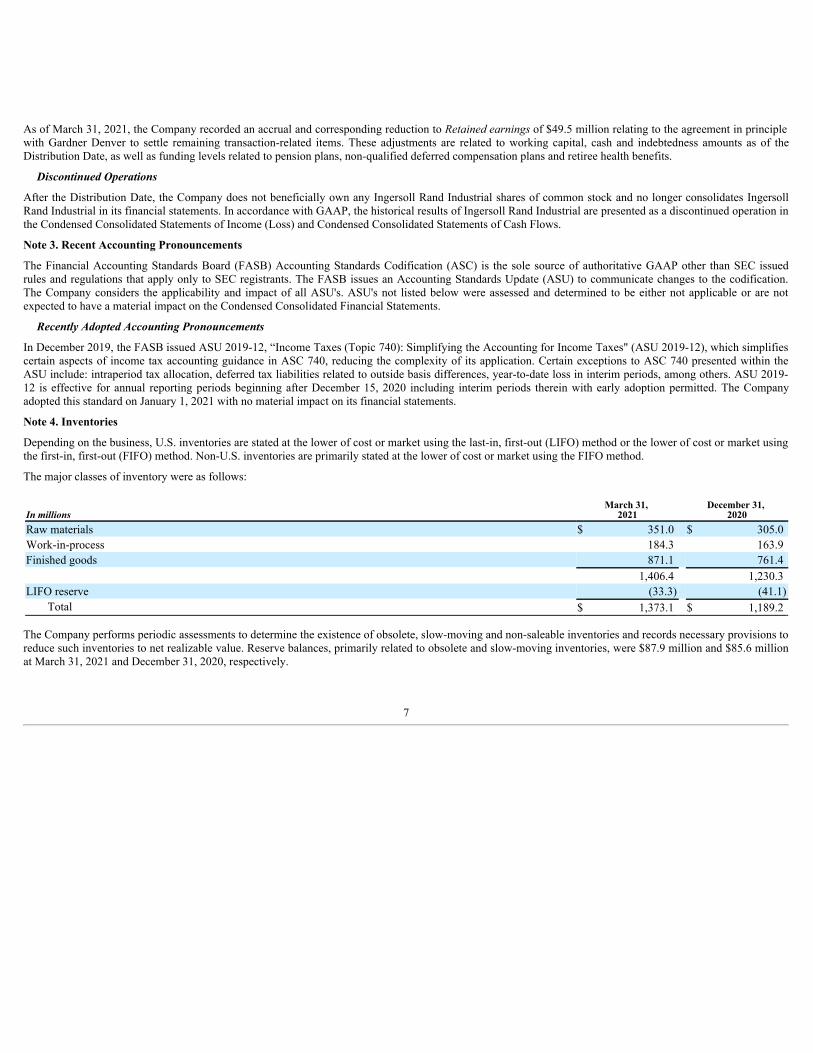
As of March 31, 2021, the Company recorded an accrual and corresponding reduction to Retained earnings of $49.5 million relating to the agreement in principlewith Gardner Denver to settle remaining transaction-related items. These adjustments are related to working capital, cash and indebtedness amounts as of theDistribution Date, as well as funding levels related to pension plans, non-qualified deferred compensation plans and retiree health benefits.
Discontinued Operations
After the Distribution Date, the Company does not beneficially own any Ingersoll Rand Industrial shares of common stock and no longer consolidates IngersollRand Industrial in its financial statements. In accordance with GAAP, the historical results of Ingersoll Rand Industrial are presented as a discontinued operation inthe Condensed Consolidated Statements of Income (Loss) and Condensed Consolidated Statements of Cash Flows.
Note 3. Recent Accounting Pronouncements
The Financial Accounting Standards Board (FASB) Accounting Standards Codification (ASC) is the sole source of authoritative GAAP other than SEC issuedrules and regulations that apply only to SEC registrants. The FASB issues an Accounting Standards Update (ASU) to communicate changes to the codification.The Company considers the applicability and impact of all ASU's. ASU's not listed below were assessed and determined to be either not applicable or are notexpected to have a material impact on the Condensed Consolidated Financial Statements.
Recently Adopted Accounting Pronouncements
In December 2019, the FASB issued ASU 2019-12, “Income Taxes (Topic 740): Simplifying the Accounting for Income Taxes" (ASU 2019-12), which simplifiescertain aspects of income tax accounting guidance in ASC 740, reducing the complexity of its application. Certain exceptions to ASC 740 presented within theASU include: intraperiod tax allocation, deferred tax liabilities related to outside basis differences, year-to-date loss in interim periods, among others. ASU 2019-12 is effective for annual reporting periods beginning after December 15, 2020 including interim periods therein with early adoption permitted. The Companyadopted this standard on January 1, 2021 with no material impact on its financial statements.
Note 4. Inventories
Depending on the business, U.S. inventories are stated at the lower of cost or market using the last-in, first-out (LIFO) method or the lower of cost or market usingthe first-in, first-out (FIFO) method. Non-U.S. inventories are primarily stated at the lower of cost or market using the FIFO method.
The major classes of inventory were as follows:
In millionsMarch 31,
2021December 31,
2020Raw materials $ 351.0 $ 305.0 Work-in-process 184.3 163.9 Finished goods 871.1 761.4
1,406.4 1,230.3 LIFO reserve (33.3) (41.1)
Total $ 1,373.1 $ 1,189.2
The Company performs periodic assessments to determine the existence of obsolete, slow-moving and non-saleable inventories and records necessary provisions toreduce such inventories to net realizable value. Reserve balances, primarily related to obsolete and slow-moving inventories, were $87.9 million and $85.6 millionat March 31, 2021 and December 31, 2020, respectively.
7
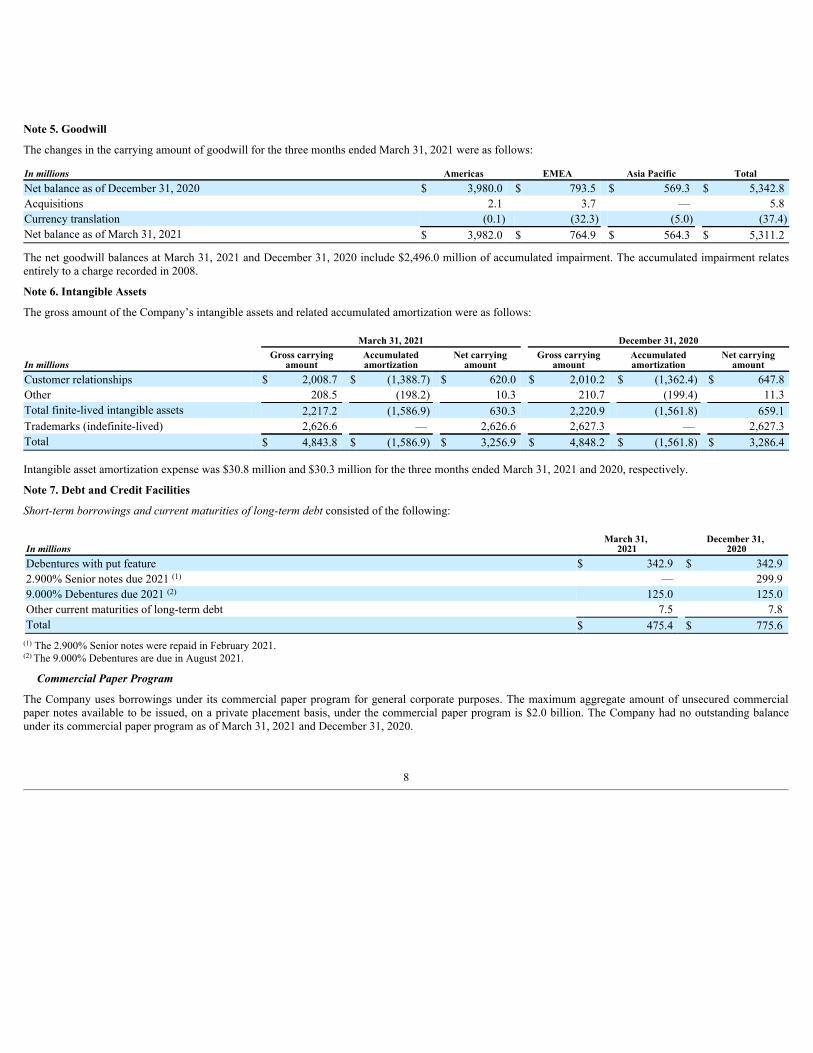
Note 5. Goodwill
The changes in the carrying amount of goodwill for the three months ended March 31, 2021 were as follows:
In millions Americas EMEA Asia Pacific TotalNet balance as of December 31, 2020 $ 3,980.0 $ 793.5 $ 569.3 $ 5,342.8 Acquisitions 2.1 3.7 — 5.8 Currency translation (0.1) (32.3) (5.0) (37.4)Net balance as of March 31, 2021 $ 3,982.0 $ 764.9 $ 564.3 $ 5,311.2
The net goodwill balances at March 31, 2021 and December 31, 2020 include $2,496.0 million of accumulated impairment. The accumulated impairment relatesentirely to a charge recorded in 2008.
Note 6. Intangible Assets
The gross amount of the Company’s intangible assets and related accumulated amortization were as follows:
March 31, 2021 December 31, 2020
In millionsGross carrying
amountAccumulatedamortization
Net carryingamount
Gross carryingamount
Accumulatedamortization
Net carryingamount
Customer relationships $ 2,008.7 $ (1,388.7) $ 620.0 $ 2,010.2 $ (1,362.4) $ 647.8 Other 208.5 (198.2) 10.3 210.7 (199.4) 11.3 Total finite-lived intangible assets 2,217.2 (1,586.9) 630.3 2,220.9 (1,561.8) 659.1 Trademarks (indefinite-lived) 2,626.6 — 2,626.6 2,627.3 — 2,627.3 Total $ 4,843.8 $ (1,586.9) $ 3,256.9 $ 4,848.2 $ (1,561.8) $ 3,286.4
Intangible asset amortization expense was $30.8 million and $30.3 million for the three months ended March 31, 2021 and 2020, respectively.
Note 7. Debt and Credit Facilities
Short-term borrowings and current maturities of long-term debt consisted of the following:
In millionsMarch 31,
2021December 31,
2020Debentures with put feature $ 342.9 $ 342.9 2.900% Senior notes due 2021 — 299.9 9.000% Debentures due 2021 125.0 125.0 Other current maturities of long-term debt 7.5 7.8 Total $ 475.4 $ 775.6
The 2.900% Senior notes were repaid in February 2021.The 9.000% Debentures are due in August 2021.
Commercial Paper Program
The Company uses borrowings under its commercial paper program for general corporate purposes. The maximum aggregate amount of unsecured commercialpaper notes available to be issued, on a private placement basis, under the commercial paper program is $2.0 billion. The Company had no outstanding balanceunder its commercial paper program as of March 31, 2021 and December 31, 2020.
(1)
(2)
(1)
(2)
8
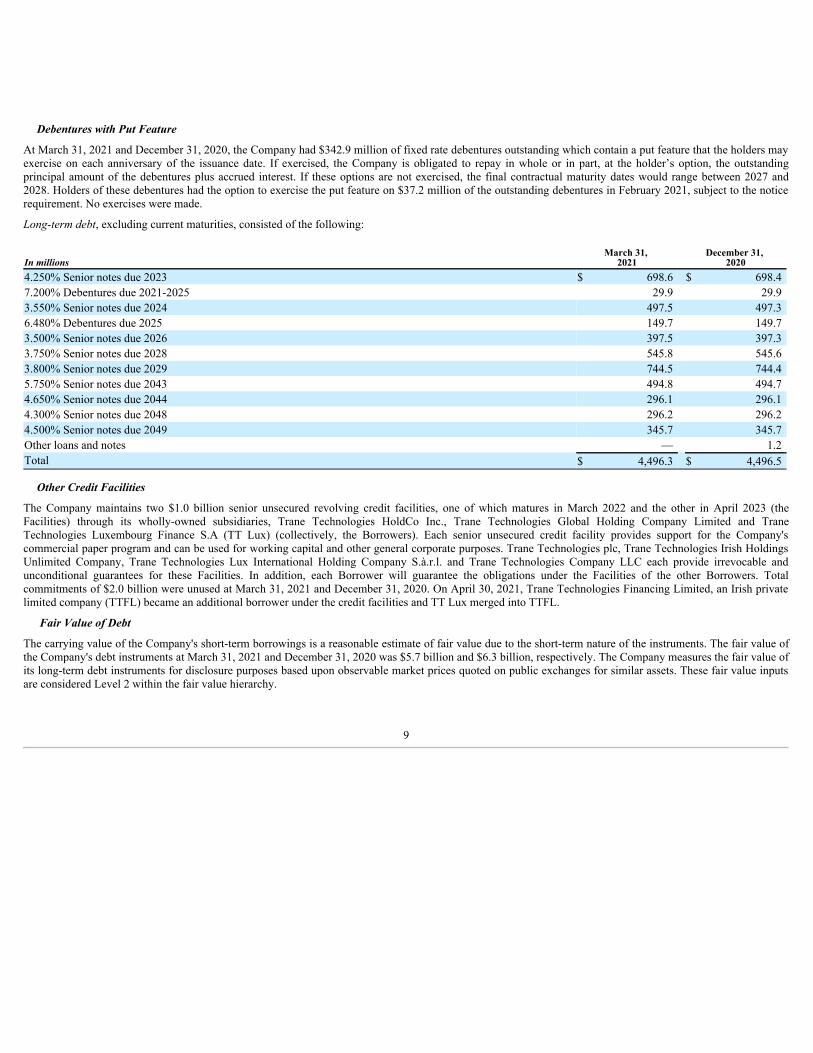
Debentures with Put Feature
At March 31, 2021 and December 31, 2020, the Company had $342.9 million of fixed rate debentures outstanding which contain a put feature that the holders mayexercise on each anniversary of the issuance date. If exercised, the Company is obligated to repay in whole or in part, at the holder’s option, the outstandingprincipal amount of the debentures plus accrued interest. If these options are not exercised, the final contractual maturity dates would range between 2027 and2028. Holders of these debentures had the option to exercise the put feature on $37.2 million of the outstanding debentures in February 2021, subject to the noticerequirement. No exercises were made.
Long-term debt, excluding current maturities, consisted of the following:
In millionsMarch 31,
2021December 31,
20204.250% Senior notes due 2023 $ 698.6 $ 698.4 7.200% Debentures due 2021-2025 29.9 29.9 3.550% Senior notes due 2024 497.5 497.3 6.480% Debentures due 2025 149.7 149.7 3.500% Senior notes due 2026 397.5 397.3 3.750% Senior notes due 2028 545.8 545.6 3.800% Senior notes due 2029 744.5 744.4 5.750% Senior notes due 2043 494.8 494.7 4.650% Senior notes due 2044 296.1 296.1 4.300% Senior notes due 2048 296.2 296.2 4.500% Senior notes due 2049 345.7 345.7 Other loans and notes — 1.2 Total $ 4,496.3 $ 4,496.5
Other Credit Facilities
The Company maintains two $1.0 billion senior unsecured revolving credit facilities, one of which matures in March 2022 and the other in April 2023 (theFacilities) through its wholly-owned subsidiaries, Trane Technologies HoldCo Inc., Trane Technologies Global Holding Company Limited and TraneTechnologies Luxembourg Finance S.A (TT Lux) (collectively, the Borrowers). Each senior unsecured credit facility provides support for the Company'scommercial paper program and can be used for working capital and other general corporate purposes. Trane Technologies plc, Trane Technologies Irish HoldingsUnlimited Company, Trane Technologies Lux International Holding Company S.à.r.l. and Trane Technologies Company LLC each provide irrevocable andunconditional guarantees for these Facilities. In addition, each Borrower will guarantee the obligations under the Facilities of the other Borrowers. Totalcommitments of $2.0 billion were unused at March 31, 2021 and December 31, 2020. On April 30, 2021, Trane Technologies Financing Limited, an Irish privatelimited company (TTFL) became an additional borrower under the credit facilities and TT Lux merged into TTFL.
Fair Value of Debt
The carrying value of the Company's short-term borrowings is a reasonable estimate of fair value due to the short-term nature of the instruments. The fair value ofthe Company's debt instruments at March 31, 2021 and December 31, 2020 was $5.7 billion and $6.3 billion, respectively. The Company measures the fair value ofits long-term debt instruments for disclosure purposes based upon observable market prices quoted on public exchanges for similar assets. These fair value inputsare considered Level 2 within the fair value hierarchy.
9
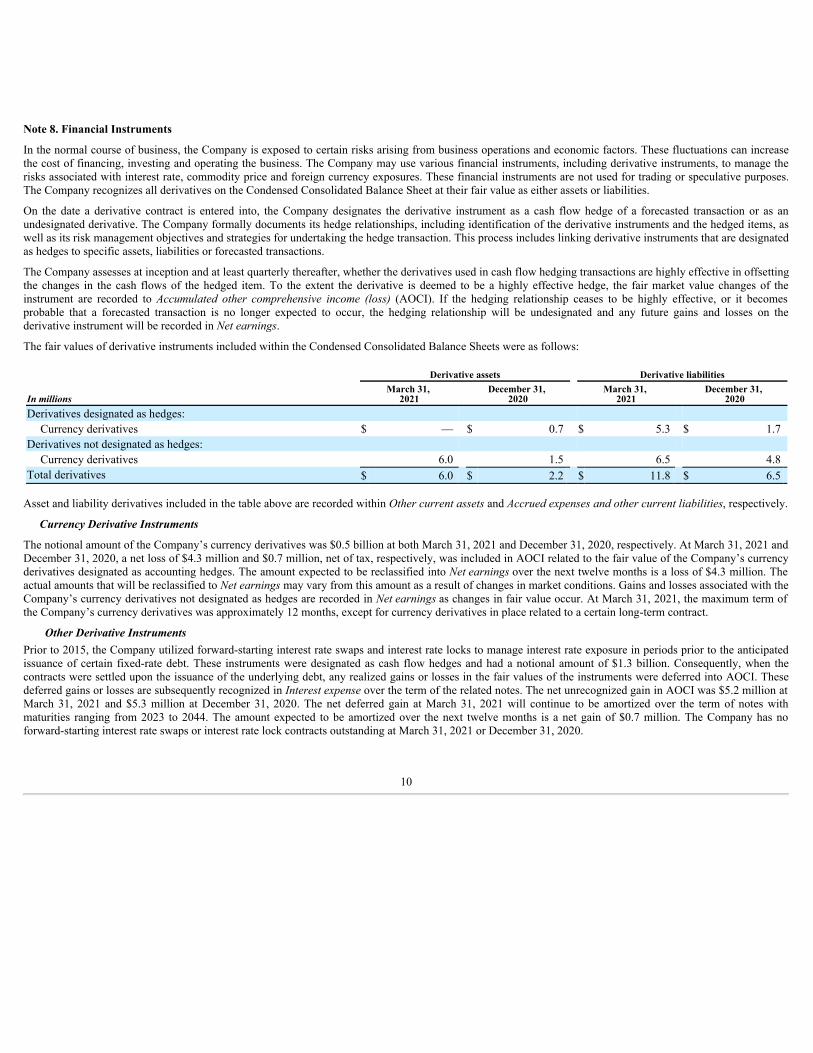
Note 8. Financial Instruments
In the normal course of business, the Company is exposed to certain risks arising from business operations and economic factors. These fluctuations can increasethe cost of financing, investing and operating the business. The Company may use various financial instruments, including derivative instruments, to manage therisks associated with interest rate, commodity price and foreign currency exposures. These financial instruments are not used for trading or speculative purposes.The Company recognizes all derivatives on the Condensed Consolidated Balance Sheet at their fair value as either assets or liabilities.
On the date a derivative contract is entered into, the Company designates the derivative instrument as a cash flow hedge of a forecasted transaction or as anundesignated derivative. The Company formally documents its hedge relationships, including identification of the derivative instruments and the hedged items, aswell as its risk management objectives and strategies for undertaking the hedge transaction. This process includes linking derivative instruments that are designatedas hedges to specific assets, liabilities or forecasted transactions.
The Company assesses at inception and at least quarterly thereafter, whether the derivatives used in cash flow hedging transactions are highly effective in offsettingthe changes in the cash flows of the hedged item. To the extent the derivative is deemed to be a highly effective hedge, the fair market value changes of theinstrument are recorded to Accumulated other comprehensive income (loss) (AOCI). If the hedging relationship ceases to be highly effective, or it becomesprobable that a forecasted transaction is no longer expected to occur, the hedging relationship will be undesignated and any future gains and losses on thederivative instrument will be recorded in Net earnings.
The fair values of derivative instruments included within the Condensed Consolidated Balance Sheets were as follows:
Derivative assets Derivative liabilities
In millionsMarch 31,
2021December 31,
2020March 31,
2021December 31,
2020Derivatives designated as hedges:
Currency derivatives $ — $ 0.7 $ 5.3 $ 1.7 Derivatives not designated as hedges:
Currency derivatives 6.0 1.5 6.5 4.8 Total derivatives $ 6.0 $ 2.2 $ 11.8 $ 6.5
Asset and liability derivatives included in the table above are recorded within Other current assets and Accrued expenses and other current liabilities, respectively.
Currency Derivative Instruments
The notional amount of the Company’s currency derivatives was $0.5 billion at both March 31, 2021 and December 31, 2020, respectively. At March 31, 2021 andDecember 31, 2020, a net loss of $4.3 million and $0.7 million, net of tax, respectively, was included in AOCI related to the fair value of the Company’s currencyderivatives designated as accounting hedges. The amount expected to be reclassified into Net earnings over the next twelve months is a loss of $4.3 million. Theactual amounts that will be reclassified to Net earnings may vary from this amount as a result of changes in market conditions. Gains and losses associated with theCompany’s currency derivatives not designated as hedges are recorded in Net earnings as changes in fair value occur. At March 31, 2021, the maximum term ofthe Company’s currency derivatives was approximately 12 months, except for currency derivatives in place related to a certain long-term contract.
Other Derivative InstrumentsPrior to 2015, the Company utilized forward-starting interest rate swaps and interest rate locks to manage interest rate exposure in periods prior to the anticipatedissuance of certain fixed-rate debt. These instruments were designated as cash flow hedges and had a notional amount of $1.3 billion. Consequently, when thecontracts were settled upon the issuance of the underlying debt, any realized gains or losses in the fair values of the instruments were deferred into AOCI. Thesedeferred gains or losses are subsequently recognized in Interest expense over the term of the related notes. The net unrecognized gain in AOCI was $5.2 million atMarch 31, 2021 and $5.3 million at December 31, 2020. The net deferred gain at March 31, 2021 will continue to be amortized over the term of notes withmaturities ranging from 2023 to 2044. The amount expected to be amortized over the next twelve months is a net gain of $0.7 million. The Company has noforward-starting interest rate swaps or interest rate lock contracts outstanding at March 31, 2021 or December 31, 2020.
10
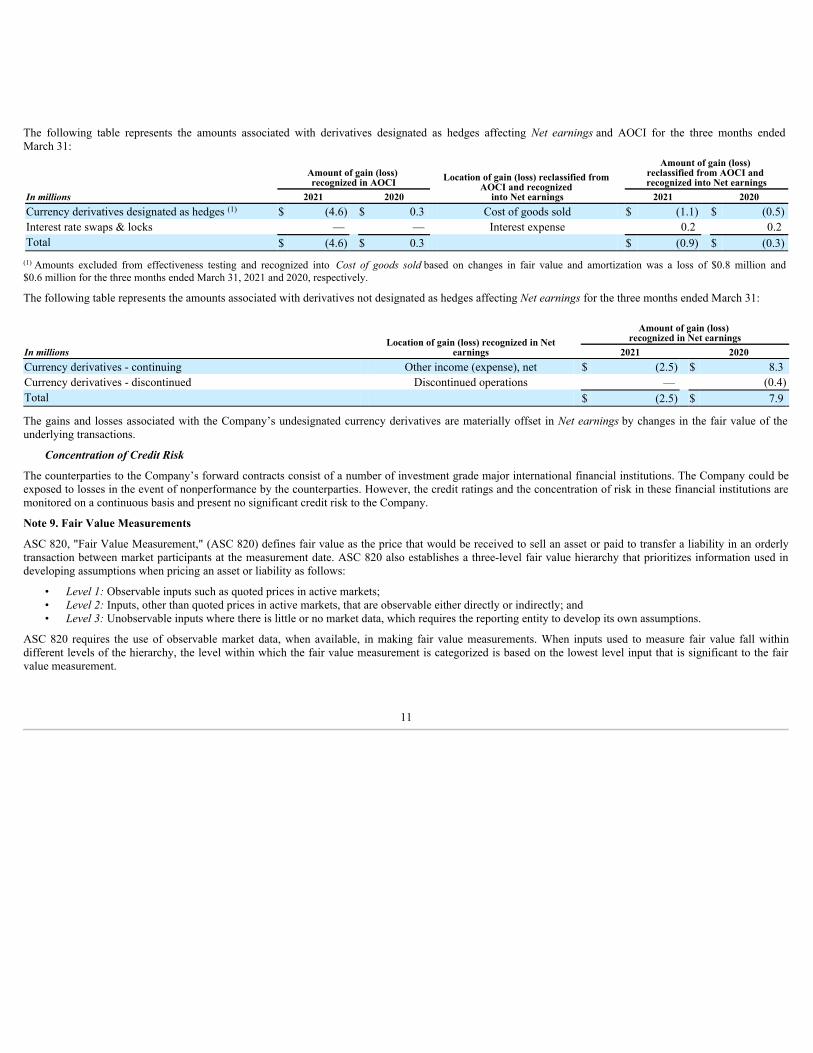
The following table represents the amounts associated with derivatives designated as hedges affecting Net earnings and AOCI for the three months endedMarch 31:
Amount of gain (loss) recognized in AOCI Location of gain (loss) reclassified from
AOCI and recognized into Net earnings
Amount of gain (loss) reclassified from AOCI and recognized into Net earnings
In millions 2021 2020 2021 2020Currency derivatives designated as hedges $ (4.6) $ 0.3 Cost of goods sold $ (1.1) $ (0.5)Interest rate swaps & locks — — Interest expense 0.2 0.2 Total $ (4.6) $ 0.3 $ (0.9) $ (0.3)
Amounts excluded from effectiveness testing and recognized into Cost of goods sold based on changes in fair value and amortization was a loss of $0.8 million and$0.6 million for the three months ended March 31, 2021 and 2020, respectively.
The following table represents the amounts associated with derivatives not designated as hedges affecting Net earnings for the three months ended March 31:
Location of gain (loss) recognized in Netearnings
Amount of gain (loss) recognized in Net earnings
In millions 2021 2020Currency derivatives - continuing Other income (expense), net $ (2.5) $ 8.3 Currency derivatives - discontinued Discontinued operations — (0.4)Total $ (2.5) $ 7.9
The gains and losses associated with the Company’s undesignated currency derivatives are materially offset in Net earnings by changes in the fair value of theunderlying transactions.
Concentration of Credit Risk
The counterparties to the Company’s forward contracts consist of a number of investment grade major international financial institutions. The Company could beexposed to losses in the event of nonperformance by the counterparties. However, the credit ratings and the concentration of risk in these financial institutions aremonitored on a continuous basis and present no significant credit risk to the Company.
Note 9. Fair Value Measurements
ASC 820, "Fair Value Measurement," (ASC 820) defines fair value as the price that would be received to sell an asset or paid to transfer a liability in an orderlytransaction between market participants at the measurement date. ASC 820 also establishes a three-level fair value hierarchy that prioritizes information used indeveloping assumptions when pricing an asset or liability as follows:
• Level 1: Observable inputs such as quoted prices in active markets;• Level 2: Inputs, other than quoted prices in active markets, that are observable either directly or indirectly; and• Level 3: Unobservable inputs where there is little or no market data, which requires the reporting entity to develop its own assumptions.
ASC 820 requires the use of observable market data, when available, in making fair value measurements. When inputs used to measure fair value fall withindifferent levels of the hierarchy, the level within which the fair value measurement is categorized is based on the lowest level input that is significant to the fairvalue measurement.
(1)
(1)
11
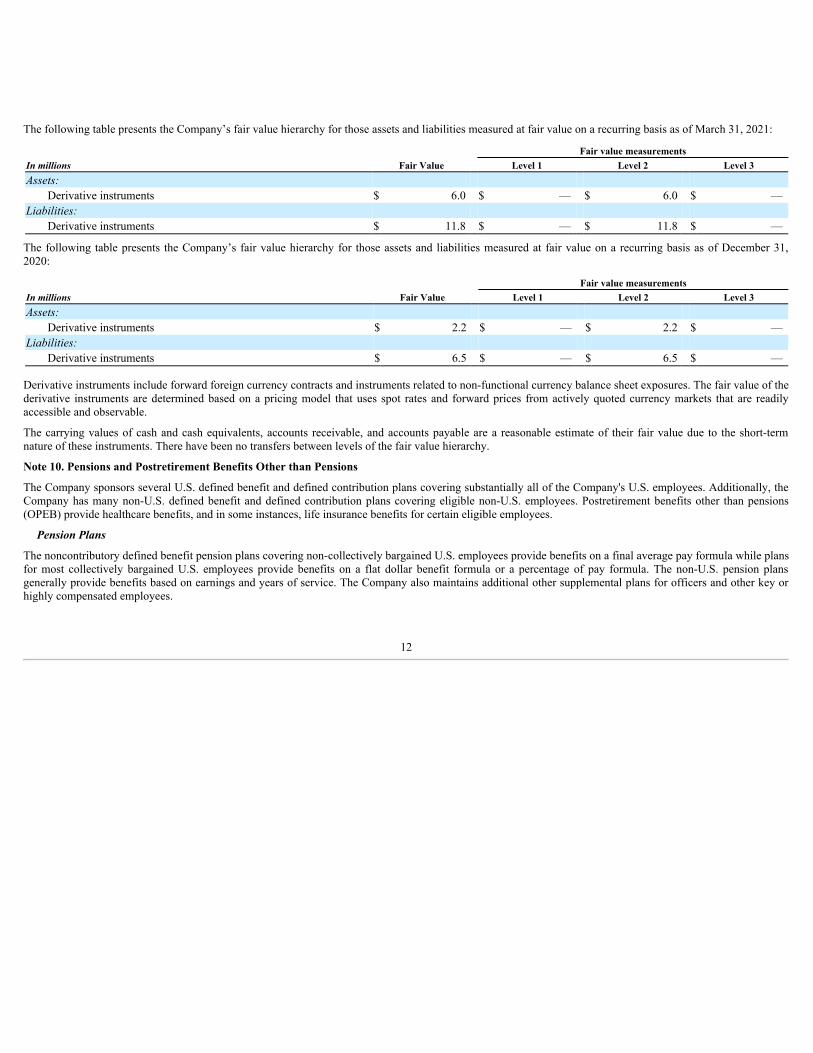
The following table presents the Company’s fair value hierarchy for those assets and liabilities measured at fair value on a recurring basis as of March 31, 2021:
In millions Fair ValueFair value measurements
Level 1 Level 2 Level 3Assets:
Derivative instruments $ 6.0 $ — $ 6.0 $ — Liabilities:
Derivative instruments $ 11.8 $ — $ 11.8 $ —
The following table presents the Company’s fair value hierarchy for those assets and liabilities measured at fair value on a recurring basis as of December 31,2020:
In millions Fair ValueFair value measurements
Level 1 Level 2 Level 3Assets:
Derivative instruments $ 2.2 $ — $ 2.2 $ — Liabilities:
Derivative instruments $ 6.5 $ — $ 6.5 $ —
Derivative instruments include forward foreign currency contracts and instruments related to non-functional currency balance sheet exposures. The fair value of thederivative instruments are determined based on a pricing model that uses spot rates and forward prices from actively quoted currency markets that are readilyaccessible and observable.
The carrying values of cash and cash equivalents, accounts receivable, and accounts payable are a reasonable estimate of their fair value due to the short-termnature of these instruments. There have been no transfers between levels of the fair value hierarchy.
Note 10. Pensions and Postretirement Benefits Other than Pensions
The Company sponsors several U.S. defined benefit and defined contribution plans covering substantially all of the Company's U.S. employees. Additionally, theCompany has many non-U.S. defined benefit and defined contribution plans covering eligible non-U.S. employees. Postretirement benefits other than pensions(OPEB) provide healthcare benefits, and in some instances, life insurance benefits for certain eligible employees.
Pension Plans
The noncontributory defined benefit pension plans covering non-collectively bargained U.S. employees provide benefits on a final average pay formula while plansfor most collectively bargained U.S. employees provide benefits on a flat dollar benefit formula or a percentage of pay formula. The non-U.S. pension plansgenerally provide benefits based on earnings and years of service. The Company also maintains additional other supplemental plans for officers and other key orhighly compensated employees.
12
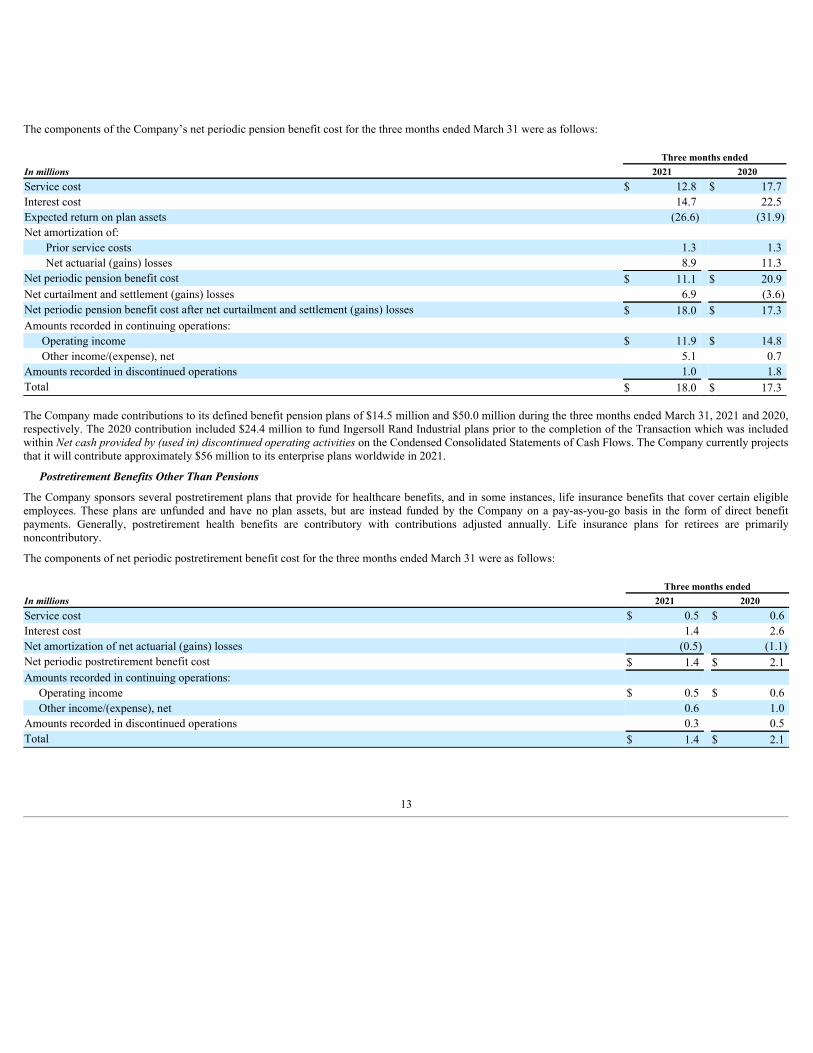
The components of the Company’s net periodic pension benefit cost for the three months ended March 31 were as follows:
Three months endedIn millions 2021 2020Service cost $ 12.8 $ 17.7 Interest cost 14.7 22.5 Expected return on plan assets (26.6) (31.9)Net amortization of:
Prior service costs 1.3 1.3 Net actuarial (gains) losses 8.9 11.3
Net periodic pension benefit cost $ 11.1 $ 20.9 Net curtailment and settlement (gains) losses 6.9 (3.6)Net periodic pension benefit cost after net curtailment and settlement (gains) losses $ 18.0 $ 17.3 Amounts recorded in continuing operations: Operating income $ 11.9 $ 14.8 Other income/(expense), net 5.1 0.7 Amounts recorded in discontinued operations 1.0 1.8 Total $ 18.0 $ 17.3
The Company made contributions to its defined benefit pension plans of $14.5 million and $50.0 million during the three months ended March 31, 2021 and 2020,respectively. The 2020 contribution included $24.4 million to fund Ingersoll Rand Industrial plans prior to the completion of the Transaction which was includedwithin Net cash provided by (used in) discontinued operating activities on the Condensed Consolidated Statements of Cash Flows. The Company currently projectsthat it will contribute approximately $56 million to its enterprise plans worldwide in 2021.
Postretirement Benefits Other Than Pensions
The Company sponsors several postretirement plans that provide for healthcare benefits, and in some instances, life insurance benefits that cover certain eligibleemployees. These plans are unfunded and have no plan assets, but are instead funded by the Company on a pay-as-you-go basis in the form of direct benefitpayments. Generally, postretirement health benefits are contributory with contributions adjusted annually. Life insurance plans for retirees are primarilynoncontributory.
The components of net periodic postretirement benefit cost for the three months ended March 31 were as follows:
Three months endedIn millions 2021 2020Service cost $ 0.5 $ 0.6 Interest cost 1.4 2.6 Net amortization of net actuarial (gains) losses (0.5) (1.1)Net periodic postretirement benefit cost $ 1.4 $ 2.1 Amounts recorded in continuing operations: Operating income $ 0.5 $ 0.6 Other income/(expense), net 0.6 1.0 Amounts recorded in discontinued operations 0.3 0.5 Total $ 1.4 $ 2.1
13
Note 11. Equity
The authorized share capital of Trane Technologies plc is 1,185,040,000 shares, consisting of (1) 1,175,000,000 ordinary shares, par value $1.00 per share,(2) 40,000 ordinary shares, par value EUR 1.00 and (3) 10,000,000 preference shares, par value $0.001 per share. There were no Euro-denominated ordinary sharesor preference shares outstanding at March 31, 2021 or December 31, 2020.
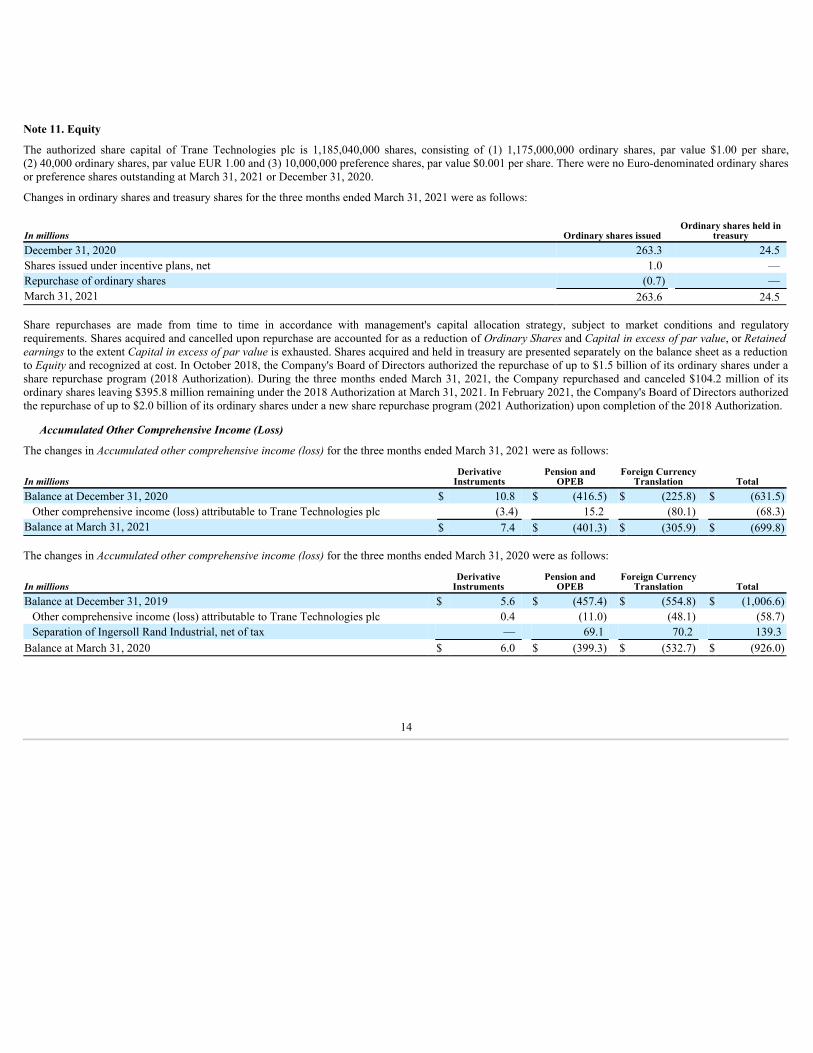
Changes in ordinary shares and treasury shares for the three months ended March 31, 2021 were as follows:
In millions Ordinary shares issuedOrdinary shares held in
treasuryDecember 31, 2020 263.3 24.5 Shares issued under incentive plans, net 1.0 — Repurchase of ordinary shares (0.7) — March 31, 2021 263.6 24.5
Share repurchases are made from time to time in accordance with management's capital allocation strategy, subject to market conditions and regulatoryrequirements. Shares acquired and cancelled upon repurchase are accounted for as a reduction of Ordinary Shares and Capital in excess of par value, or Retainedearnings to the extent Capital in excess of par value is exhausted. Shares acquired and held in treasury are presented separately on the balance sheet as a reductionto Equity and recognized at cost. In October 2018, the Company's Board of Directors authorized the repurchase of up to $1.5 billion of its ordinary shares under ashare repurchase program (2018 Authorization). During the three months ended March 31, 2021, the Company repurchased and canceled $104.2 million of itsordinary shares leaving $395.8 million remaining under the 2018 Authorization at March 31, 2021. In February 2021, the Company's Board of Directors authorizedthe repurchase of up to $2.0 billion of its ordinary shares under a new share repurchase program (2021 Authorization) upon completion of the 2018 Authorization.
Accumulated Other Comprehensive Income (Loss)
The changes in Accumulated other comprehensive income (loss) for the three months ended March 31, 2021 were as follows:
In millionsDerivative
InstrumentsPension and
OPEBForeign Currency
Translation TotalBalance at December 31, 2020 $ 10.8 $ (416.5) $ (225.8) $ (631.5)
Other comprehensive income (loss) attributable to Trane Technologies plc (3.4) 15.2 (80.1) (68.3)Balance at March 31, 2021 $ 7.4 $ (401.3) $ (305.9) $ (699.8)
The changes in Accumulated other comprehensive income (loss) for the three months ended March 31, 2020 were as follows:
In millionsDerivative
InstrumentsPension and
OPEBForeign Currency
Translation TotalBalance at December 31, 2019 $ 5.6 $ (457.4) $ (554.8) $ (1,006.6)
Other comprehensive income (loss) attributable to Trane Technologies plc 0.4 (11.0) (48.1) (58.7)Separation of Ingersoll Rand Industrial, net of tax — 69.1 70.2 139.3
Balance at March 31, 2020 $ 6.0 $ (399.3) $ (532.7) $ (926.0)
14
Note 12. Revenue
The Company recognizes revenue when control of a good or service promised in a contract (i.e., performance obligation) is transferred to a customer. Control isobtained when a customer has the ability to direct the use of and obtain substantially all of the remaining benefits from that good or service. A majority of theCompany's revenues are recognized at a point-in-time as control is transferred at a distinct point in time per the terms of a contract. However, a portion of theCompany's revenues are recognized over time as the customer simultaneously receives control as the Company performs work under a contract. For thesearrangements, the cost-to-cost input method is used as it best depicts the transfer of control to the customer that occurs as the Company incurs costs.
Disaggregated Revenue
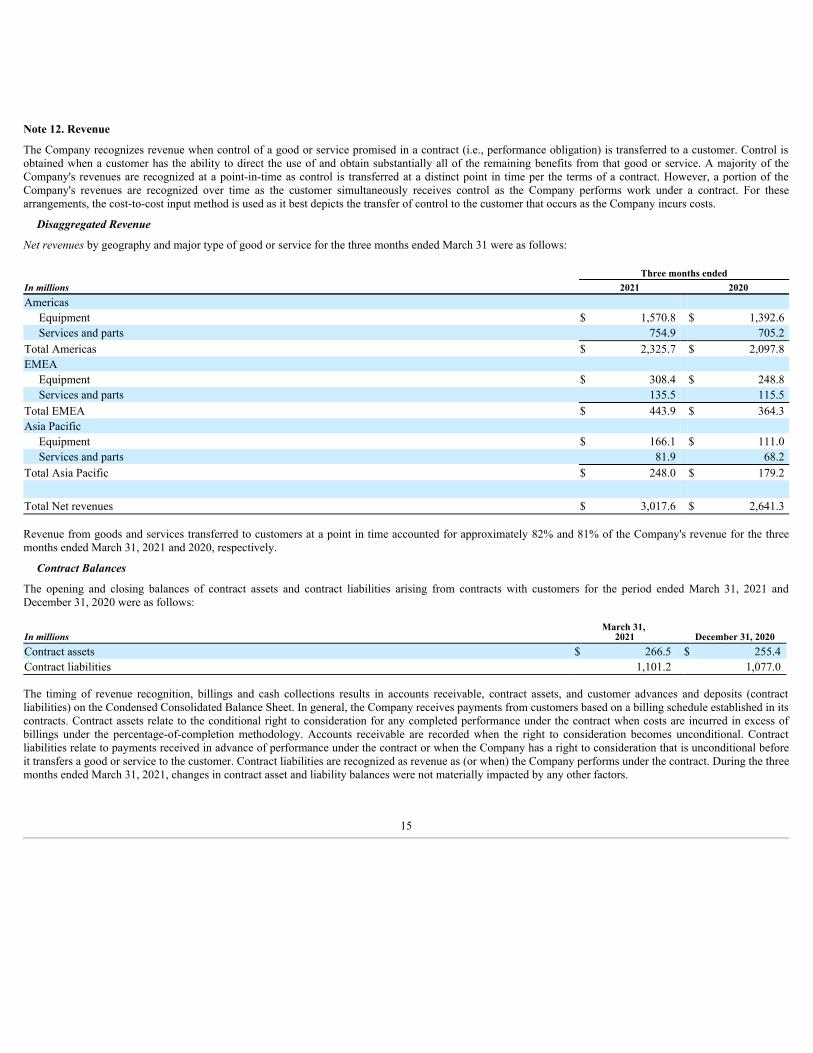
Net revenues by geography and major type of good or service for the three months ended March 31 were as follows:
Three months endedIn millions 2021 2020Americas Equipment $ 1,570.8 $ 1,392.6 Services and parts 754.9 705.2 Total Americas $ 2,325.7 $ 2,097.8 EMEA Equipment $ 308.4 $ 248.8 Services and parts 135.5 115.5 Total EMEA $ 443.9 $ 364.3 Asia Pacific Equipment $ 166.1 $ 111.0 Services and parts 81.9 68.2 Total Asia Pacific $ 248.0 $ 179.2
Total Net revenues $ 3,017.6 $ 2,641.3
Revenue from goods and services transferred to customers at a point in time accounted for approximately 82% and 81% of the Company's revenue for the threemonths ended March 31, 2021 and 2020, respectively.
Contract Balances
The opening and closing balances of contract assets and contract liabilities arising from contracts with customers for the period ended March 31, 2021 andDecember 31, 2020 were as follows:
In millionsMarch 31,
2021 December 31, 2020Contract assets $ 266.5 $ 255.4 Contract liabilities 1,101.2 1,077.0
The timing of revenue recognition, billings and cash collections results in accounts receivable, contract assets, and customer advances and deposits (contractliabilities) on the Condensed Consolidated Balance Sheet. In general, the Company receives payments from customers based on a billing schedule established in itscontracts. Contract assets relate to the conditional right to consideration for any completed performance under the contract when costs are incurred in excess ofbillings under the percentage-of-completion methodology. Accounts receivable are recorded when the right to consideration becomes unconditional. Contractliabilities relate to payments received in advance of performance under the contract or when the Company has a right to consideration that is unconditional beforeit transfers a good or service to the customer. Contract liabilities are recognized as revenue as (or when) the Company performs under the contract. During the threemonths ended March 31, 2021, changes in contract asset and liability balances were not materially impacted by any other factors.
15
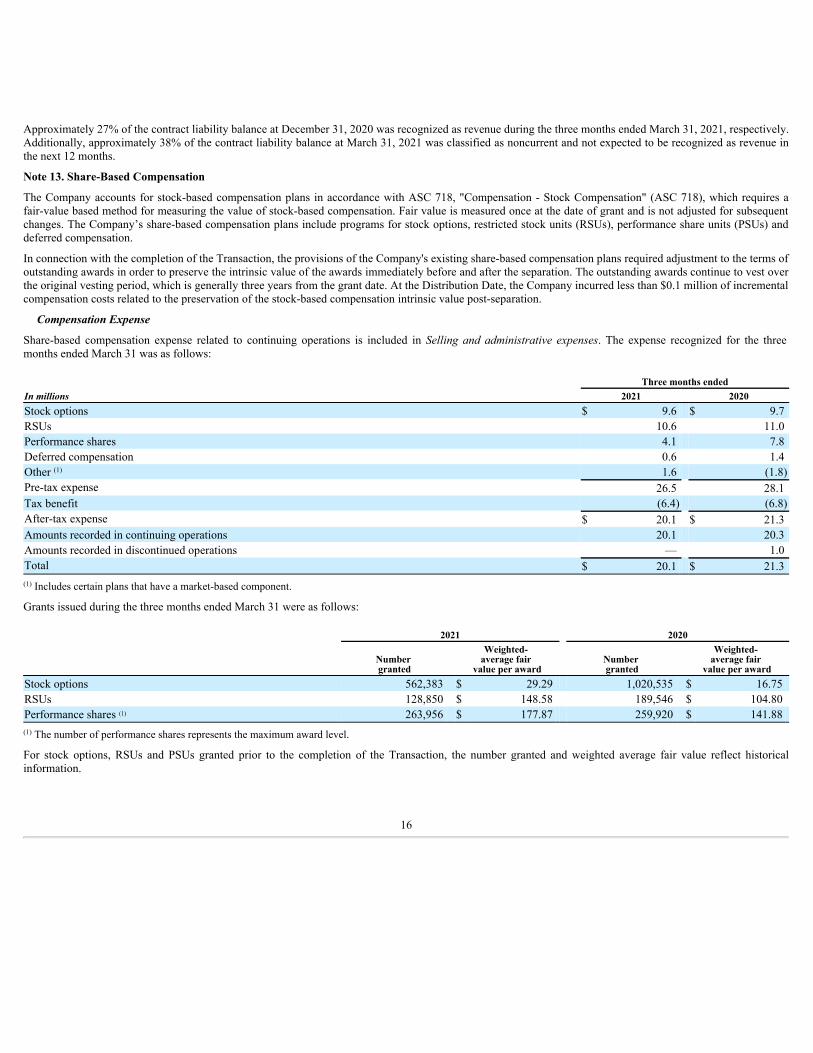
Approximately 27% of the contract liability balance at December 31, 2020 was recognized as revenue during the three months ended March 31, 2021, respectively.Additionally, approximately 38% of the contract liability balance at March 31, 2021 was classified as noncurrent and not expected to be recognized as revenue inthe next 12 months.
Note 13. Share-Based Compensation
The Company accounts for stock-based compensation plans in accordance with ASC 718, "Compensation - Stock Compensation" (ASC 718), which requires afair-value based method for measuring the value of stock-based compensation. Fair value is measured once at the date of grant and is not adjusted for subsequentchanges. The Company’s share-based compensation plans include programs for stock options, restricted stock units (RSUs), performance share units (PSUs) anddeferred compensation.
In connection with the completion of the Transaction, the provisions of the Company's existing share-based compensation plans required adjustment to the terms ofoutstanding awards in order to preserve the intrinsic value of the awards immediately before and after the separation. The outstanding awards continue to vest overthe original vesting period, which is generally three years from the grant date. At the Distribution Date, the Company incurred less than $0.1 million of incrementalcompensation costs related to the preservation of the stock-based compensation intrinsic value post-separation.
Compensation Expense
Share-based compensation expense related to continuing operations is included in Selling and administrative expenses. The expense recognized for the threemonths ended March 31 was as follows:
Three months endedIn millions 2021 2020Stock options $ 9.6 $ 9.7 RSUs 10.6 11.0 Performance shares 4.1 7.8 Deferred compensation 0.6 1.4 Other 1.6 (1.8)Pre-tax expense 26.5 28.1 Tax benefit (6.4) (6.8)After-tax expense $ 20.1 $ 21.3 Amounts recorded in continuing operations 20.1 20.3 Amounts recorded in discontinued operations — 1.0 Total $ 20.1 $ 21.3
Includes certain plans that have a market-based component.
Grants issued during the three months ended March 31 were as follows:
2021 2020
Number granted
Weighted- average fair
value per awardNumber granted
Weighted- average fair
value per awardStock options 562,383 $ 29.29 1,020,535 $ 16.75 RSUs 128,850 $ 148.58 189,546 $ 104.80 Performance shares 263,956 $ 177.87 259,920 $ 141.88
The number of performance shares represents the maximum award level.
For stock options, RSUs and PSUs granted prior to the completion of the Transaction, the number granted and weighted average fair value reflect historicalinformation.
(1)
(1)
(1)
(1)
16
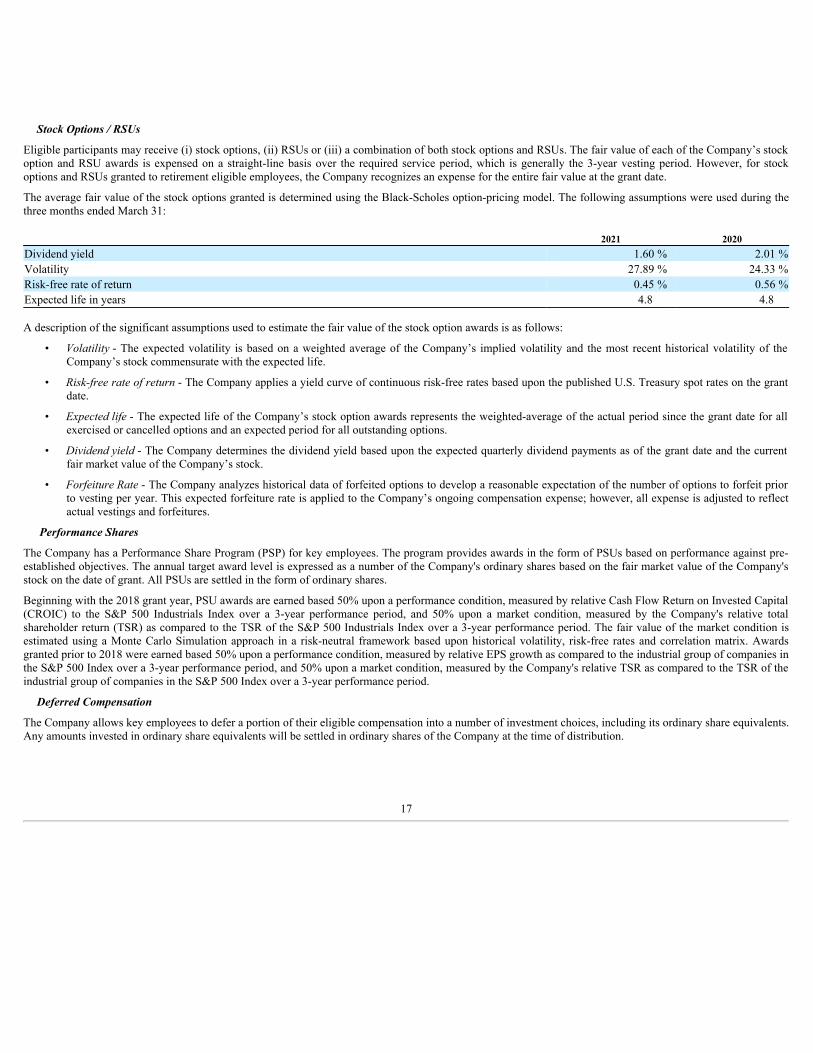
Stock Options / RSUs
Eligible participants may receive (i) stock options, (ii) RSUs or (iii) a combination of both stock options and RSUs. The fair value of each of the Company’s stockoption and RSU awards is expensed on a straight-line basis over the required service period, which is generally the 3-year vesting period. However, for stockoptions and RSUs granted to retirement eligible employees, the Company recognizes an expense for the entire fair value at the grant date.
The average fair value of the stock options granted is determined using the Black-Scholes option-pricing model. The following assumptions were used during thethree months ended March 31:
2021 2020Dividend yield 1.60 % 2.01 %Volatility 27.89 % 24.33 %Risk-free rate of return 0.45 % 0.56 %Expected life in years 4.8 4.8
A description of the significant assumptions used to estimate the fair value of the stock option awards is as follows:
• Volatility - The expected volatility is based on a weighted average of the Company’s implied volatility and the most recent historical volatility of theCompany’s stock commensurate with the expected life.
• Risk-free rate of return - The Company applies a yield curve of continuous risk-free rates based upon the published U.S. Treasury spot rates on the grantdate.
• Expected life - The expected life of the Company’s stock option awards represents the weighted-average of the actual period since the grant date for allexercised or cancelled options and an expected period for all outstanding options.
• Dividend yield - The Company determines the dividend yield based upon the expected quarterly dividend payments as of the grant date and the currentfair market value of the Company’s stock.
• Forfeiture Rate - The Company analyzes historical data of forfeited options to develop a reasonable expectation of the number of options to forfeit priorto vesting per year. This expected forfeiture rate is applied to the Company’s ongoing compensation expense; however, all expense is adjusted to reflectactual vestings and forfeitures.
Performance Shares
The Company has a Performance Share Program (PSP) for key employees. The program provides awards in the form of PSUs based on performance against pre-established objectives. The annual target award level is expressed as a number of the Company's ordinary shares based on the fair market value of the Company'sstock on the date of grant. All PSUs are settled in the form of ordinary shares.
Beginning with the 2018 grant year, PSU awards are earned based 50% upon a performance condition, measured by relative Cash Flow Return on Invested Capital(CROIC) to the S&P 500 Industrials Index over a 3-year performance period, and 50% upon a market condition, measured by the Company's relative totalshareholder return (TSR) as compared to the TSR of the S&P 500 Industrials Index over a 3-year performance period. The fair value of the market condition isestimated using a Monte Carlo Simulation approach in a risk-neutral framework based upon historical volatility, risk-free rates and correlation matrix. Awardsgranted prior to 2018 were earned based 50% upon a performance condition, measured by relative EPS growth as compared to the industrial group of companies inthe S&P 500 Index over a 3-year performance period, and 50% upon a market condition, measured by the Company's relative TSR as compared to the TSR of theindustrial group of companies in the S&P 500 Index over a 3-year performance period.
Deferred Compensation
The Company allows key employees to defer a portion of their eligible compensation into a number of investment choices, including its ordinary share equivalents.Any amounts invested in ordinary share equivalents will be settled in ordinary shares of the Company at the time of distribution.
17
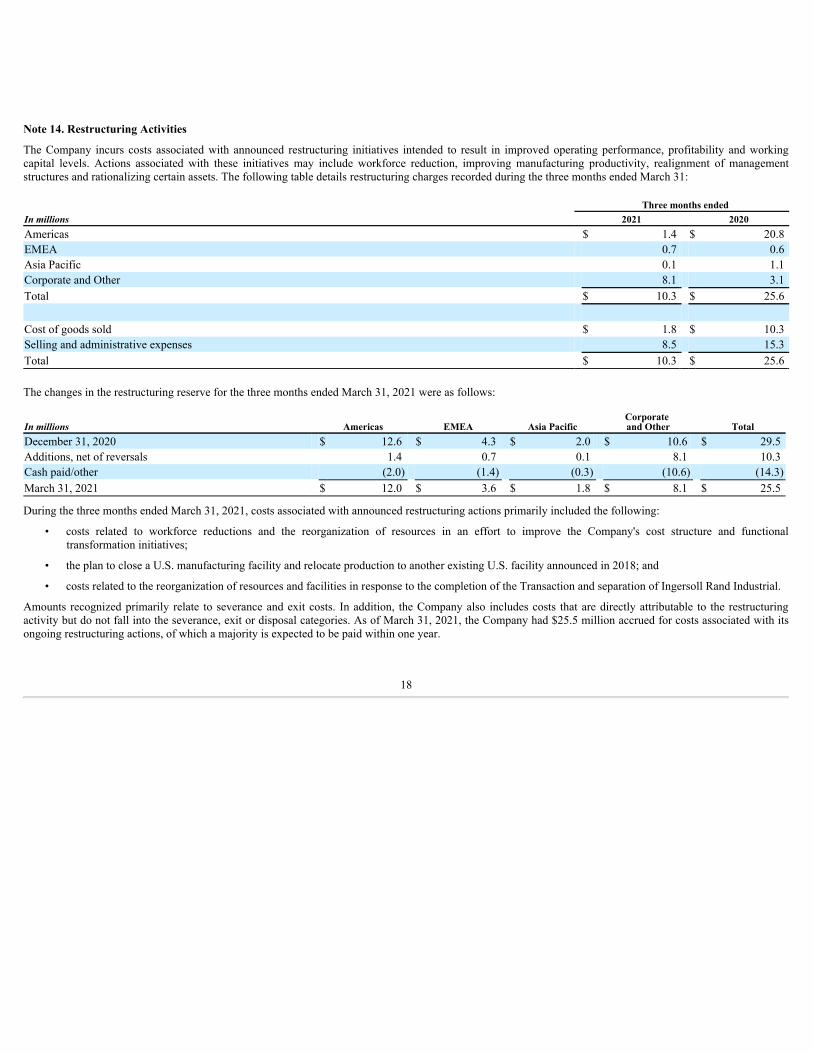
Note 14. Restructuring Activities
The Company incurs costs associated with announced restructuring initiatives intended to result in improved operating performance, profitability and workingcapital levels. Actions associated with these initiatives may include workforce reduction, improving manufacturing productivity, realignment of managementstructures and rationalizing certain assets. The following table details restructuring charges recorded during the three months ended March 31:
Three months endedIn millions 2021 2020Americas $ 1.4 $ 20.8 EMEA 0.7 0.6 Asia Pacific 0.1 1.1 Corporate and Other 8.1 3.1 Total $ 10.3 $ 25.6
Cost of goods sold $ 1.8 $ 10.3 Selling and administrative expenses 8.5 15.3 Total $ 10.3 $ 25.6
The changes in the restructuring reserve for the three months ended March 31, 2021 were as follows:
In millions Americas EMEA Asia PacificCorporate and Other Total
December 31, 2020 $ 12.6 $ 4.3 $ 2.0 $ 10.6 $ 29.5 Additions, net of reversals 1.4 0.7 0.1 8.1 10.3 Cash paid/other (2.0) (1.4) (0.3) (10.6) (14.3)March 31, 2021 $ 12.0 $ 3.6 $ 1.8 $ 8.1 $ 25.5
During the three months ended March 31, 2021, costs associated with announced restructuring actions primarily included the following:
• costs related to workforce reductions and the reorganization of resources in an effort to improve the Company's cost structure and functionaltransformation initiatives;
• the plan to close a U.S. manufacturing facility and relocate production to another existing U.S. facility announced in 2018; and
• costs related to the reorganization of resources and facilities in response to the completion of the Transaction and separation of Ingersoll Rand Industrial.
Amounts recognized primarily relate to severance and exit costs. In addition, the Company also includes costs that are directly attributable to the restructuringactivity but do not fall into the severance, exit or disposal categories. As of March 31, 2021, the Company had $25.5 million accrued for costs associated with itsongoing restructuring actions, of which a majority is expected to be paid within one year.
18
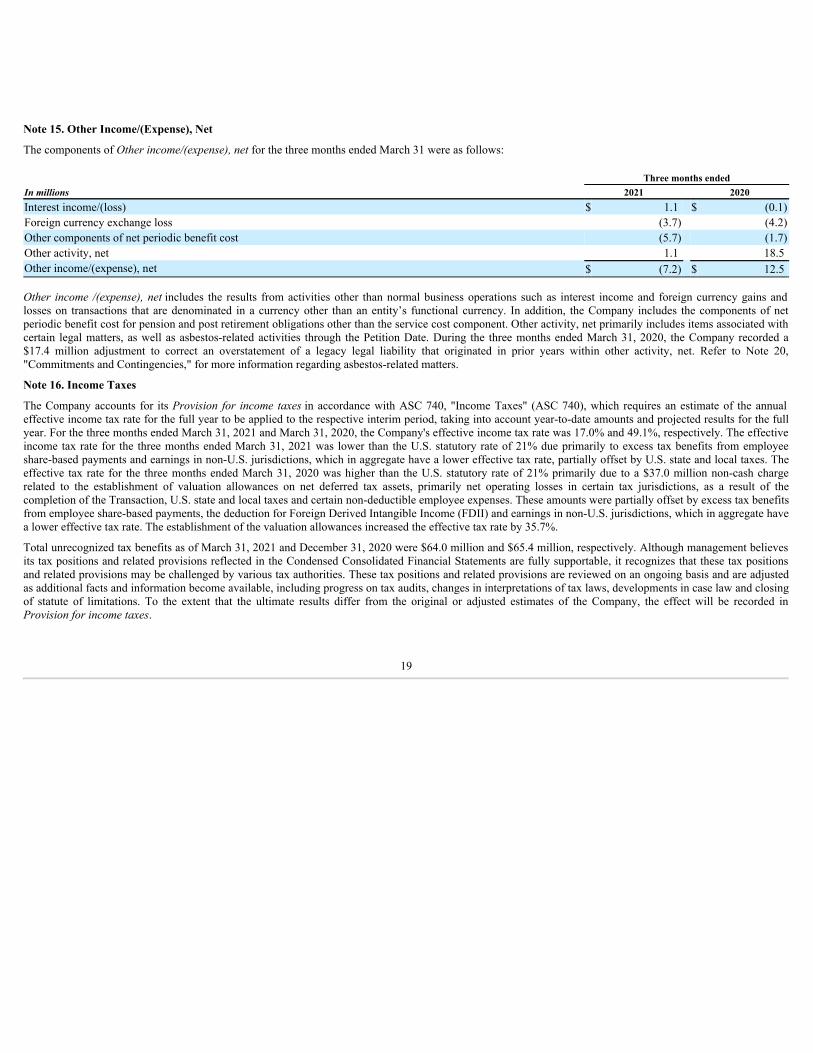
Note 15. Other Income/(Expense), Net
The components of Other income/(expense), net for the three months ended March 31 were as follows:
Three months endedIn millions 2021 2020Interest income/(loss) $ 1.1 $ (0.1)Foreign currency exchange loss (3.7) (4.2)Other components of net periodic benefit cost (5.7) (1.7)Other activity, net 1.1 18.5 Other income/(expense), net $ (7.2) $ 12.5
Other income /(expense), net includes the results from activities other than normal business operations such as interest income and foreign currency gains andlosses on transactions that are denominated in a currency other than an entity’s functional currency. In addition, the Company includes the components of netperiodic benefit cost for pension and post retirement obligations other than the service cost component. Other activity, net primarily includes items associated withcertain legal matters, as well as asbestos-related activities through the Petition Date. During the three months ended March 31, 2020, the Company recorded a$17.4 million adjustment to correct an overstatement of a legacy legal liability that originated in prior years within other activity, net. Refer to Note 20,"Commitments and Contingencies," for more information regarding asbestos-related matters.
Note 16. Income Taxes
The Company accounts for its Provision for income taxes in accordance with ASC 740, "Income Taxes" (ASC 740), which requires an estimate of the annualeffective income tax rate for the full year to be applied to the respective interim period, taking into account year-to-date amounts and projected results for the fullyear. For the three months ended March 31, 2021 and March 31, 2020, the Company's effective income tax rate was 17.0% and 49.1%, respectively. The effectiveincome tax rate for the three months ended March 31, 2021 was lower than the U.S. statutory rate of 21% due primarily to excess tax benefits from employeeshare-based payments and earnings in non-U.S. jurisdictions, which in aggregate have a lower effective tax rate, partially offset by U.S. state and local taxes. Theeffective tax rate for the three months ended March 31, 2020 was higher than the U.S. statutory rate of 21% primarily due to a $37.0 million non-cash chargerelated to the establishment of valuation allowances on net deferred tax assets, primarily net operating losses in certain tax jurisdictions, as a result of thecompletion of the Transaction, U.S. state and local taxes and certain non-deductible employee expenses. These amounts were partially offset by excess tax benefitsfrom employee share-based payments, the deduction for Foreign Derived Intangible Income (FDII) and earnings in non-U.S. jurisdictions, which in aggregate havea lower effective tax rate. The establishment of the valuation allowances increased the effective tax rate by 35.7%.
Total unrecognized tax benefits as of March 31, 2021 and December 31, 2020 were $64.0 million and $65.4 million, respectively. Although management believesits tax positions and related provisions reflected in the Condensed Consolidated Financial Statements are fully supportable, it recognizes that these tax positionsand related provisions may be challenged by various tax authorities. These tax positions and related provisions are reviewed on an ongoing basis and are adjustedas additional facts and information become available, including progress on tax audits, changes in interpretations of tax laws, developments in case law and closingof statute of limitations. To the extent that the ultimate results differ from the original or adjusted estimates of the Company, the effect will be recorded inProvision for income taxes.
19
The Provision for income taxes involves a significant amount of management judgment regarding interpretation of relevant facts and laws in the jurisdictions inwhich the Company operates. Future changes in applicable laws, projected levels of taxable income and tax planning could change the effective tax rate and taxbalances recorded by the Company. In addition, tax authorities periodically review income tax returns filed by the Company and can raise issues regarding its filingpositions, timing and amount of income or deductions, and the allocation of income among the jurisdictions in which the Company operates. A significant periodof time may elapse between the filing of an income tax return and the ultimate resolution of an issue raised by a revenue authority with respect to that return. In thenormal course of business, the Company is subject to examination by taxing authorities throughout the world, including such major jurisdictions as Belgium,Brazil, Canada, China, France, Germany, Ireland, Italy, Mexico, Spain, the Netherlands, the United Kingdom and the United States. These examinations on theirown, or any subsequent litigation related to the examinations, may result in additional taxes or penalties against the Company. If the ultimate result of these auditsdiffer from original or adjusted estimates, they could have a material impact on the Company’s tax provision. The examination of the Company's U.S. federal taxreturns is complete or effectively settled for years prior to 2016. In general, the examination of the Company’s material non-U.S. tax returns is complete oreffectively settled for the years prior to 2011, with certain matters prior to 2011 being resolved through appeals and litigation and also unilateral procedures asprovided for under double tax treaties.
Note 17. Acquisitions and Divestitures
Acquisitions
During the fourth quarter of 2020, the Company acquired two independent dealers, reported within the Americas segment, to support the Company's ongoingstrategy to expand its distribution network and service area. The aggregate cash paid, net of cash acquired, totaled $182.8 million and was financed through cash onhand. Intangible assets associated with these acquisitions totaled $76.9 million and primarily relate to customer relationships. The excess purchase price over theestimated fair value of net assets acquired was recognized as goodwill and totaled $132.1 million.
The fair values of the customer relationship intangible assets were determined using the multi-period excess earnings method based on discounted projected netcash flows associated with the net earnings attributable to the acquired customer relationships. These projected cash flows are estimated over the remainingeconomic life of the intangible asset and are considered from a market participant perspective. Key assumptions used in estimating future cash flows includedprojected revenue growth rates and customer attrition rates. The projected future cash flows are discounted to present value using an appropriate discount rate. Thecustomer relationships had a weighted-average useful life of 16 years.
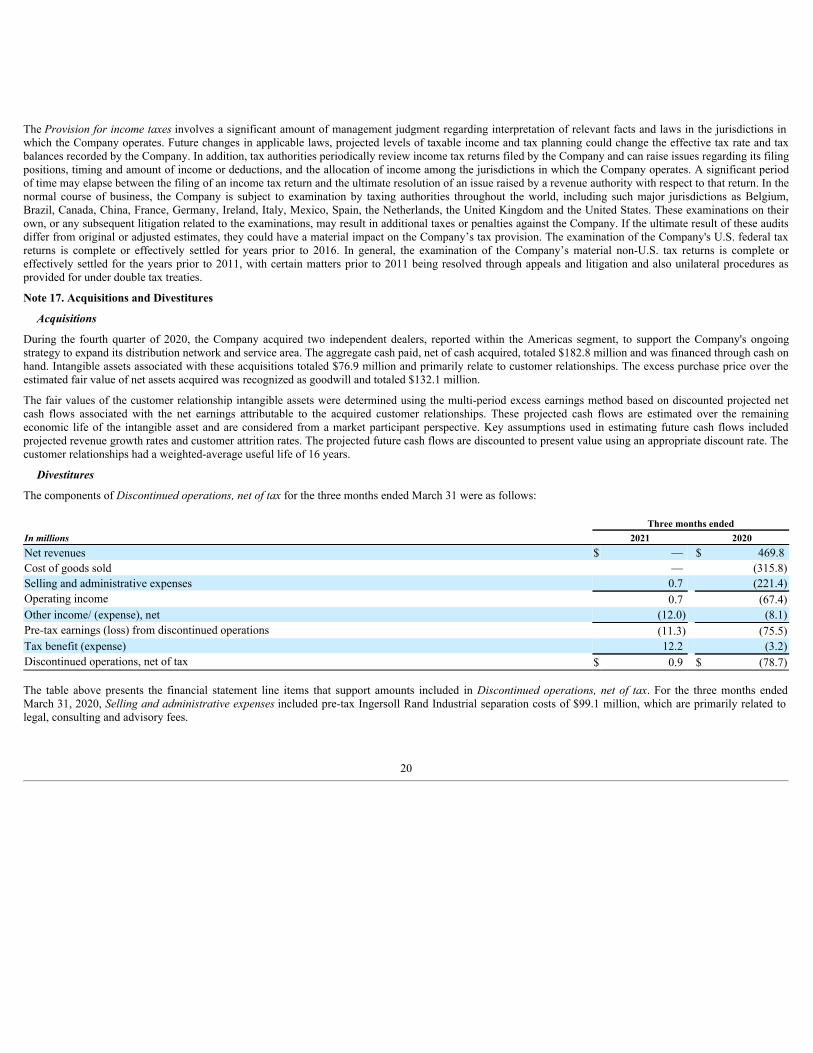
Divestitures
The components of Discontinued operations, net of tax for the three months ended March 31 were as follows:
Three months endedIn millions 2021 2020Net revenues $ — $ 469.8 Cost of goods sold — (315.8)Selling and administrative expenses 0.7 (221.4)Operating income 0.7 (67.4)Other income/ (expense), net (12.0) (8.1)Pre-tax earnings (loss) from discontinued operations (11.3) (75.5)Tax benefit (expense) 12.2 (3.2)Discontinued operations, net of tax $ 0.9 $ (78.7)
The table above presents the financial statement line items that support amounts included in Discontinued operations, net of tax. For the three months endedMarch 31, 2020, Selling and administrative expenses included pre-tax Ingersoll Rand Industrial separation costs of $99.1 million, which are primarily related tolegal, consulting and advisory fees.
20
Separation of Industrial Segment Businesses
On February 29, 2020, the Company completed the Transaction with Gardner Denver whereby the Company separated Ingersoll Rand Industrial which thenmerged with a wholly-owned subsidiary of Gardner Denver. In accordance with GAAP, the historical results of Ingersoll Rand Industrial are presented as adiscontinued operation in the Condensed Consolidated Statements of Income (Loss) and Condensed Consolidated Statements of Cash Flows.
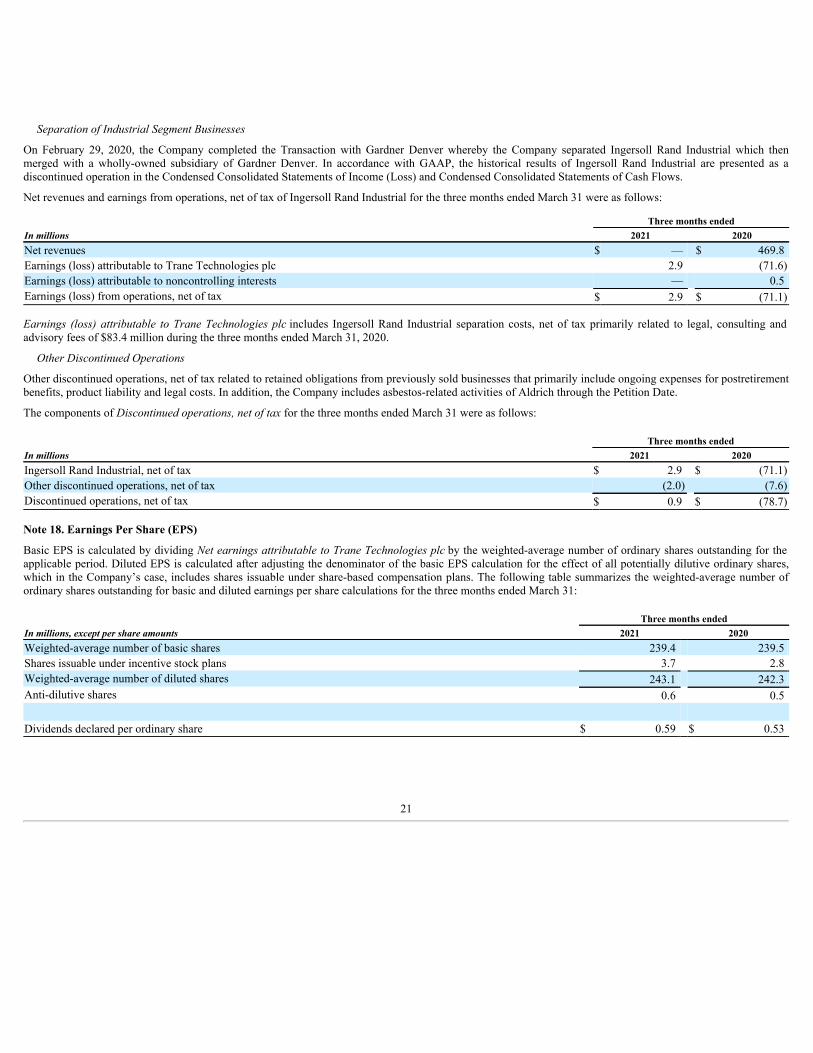
Net revenues and earnings from operations, net of tax of Ingersoll Rand Industrial for the three months ended March 31 were as follows:
Three months endedIn millions 2021 2020Net revenues $ — $ 469.8 Earnings (loss) attributable to Trane Technologies plc 2.9 (71.6)Earnings (loss) attributable to noncontrolling interests — 0.5 Earnings (loss) from operations, net of tax $ 2.9 $ (71.1)
Earnings (loss) attributable to Trane Technologies plc includes Ingersoll Rand Industrial separation costs, net of tax primarily related to legal, consulting andadvisory fees of $83.4 million during the three months ended March 31, 2020.
Other Discontinued Operations
Other discontinued operations, net of tax related to retained obligations from previously sold businesses that primarily include ongoing expenses for postretirementbenefits, product liability and legal costs. In addition, the Company includes asbestos-related activities of Aldrich through the Petition Date.
The components of Discontinued operations, net of tax for the three months ended March 31 were as follows:
Three months endedIn millions 2021 2020Ingersoll Rand Industrial, net of tax $ 2.9 $ (71.1)Other discontinued operations, net of tax (2.0) (7.6)Discontinued operations, net of tax $ 0.9 $ (78.7)
Note 18. Earnings Per Share (EPS)
Basic EPS is calculated by dividing Net earnings attributable to Trane Technologies plc by the weighted-average number of ordinary shares outstanding for theapplicable period. Diluted EPS is calculated after adjusting the denominator of the basic EPS calculation for the effect of all potentially dilutive ordinary shares,which in the Company’s case, includes shares issuable under share-based compensation plans. The following table summarizes the weighted-average number ofordinary shares outstanding for basic and diluted earnings per share calculations for the three months ended March 31:
Three months endedIn millions, except per share amounts 2021 2020Weighted-average number of basic shares 239.4 239.5 Shares issuable under incentive stock plans 3.7 2.8 Weighted-average number of diluted shares 243.1 242.3 Anti-dilutive shares 0.6 0.5
Dividends declared per ordinary share $ 0.59 $ 0.53
21
Note 19. Business Segment Information
The Company operates under three regional operating segments designed to create deep customer focus and relevance in markets around the world. Intercompanysales between segments are immaterial.
• The Company's Americas segment innovates for customers in the North America and Latin America regions. The Americas segment encompassescommercial heating and cooling systems, building controls, and energy services and solutions; residential heating and cooling; and transport refrigerationsystems and solutions.
• The Company's EMEA segment innovates for customers in the Europe, Middle East and Africa region. The EMEA segment encompasses heating andcooling systems, services and solutions for commercial buildings, and transport refrigeration systems and solutions.
• The Company's Asia Pacific segment innovates for customers throughout the Asia Pacific region. The Asia Pacific segment encompasses heating andcooling systems, services and solutions for commercial buildings and transport refrigeration systems and solutions.
Management measures operating performance based on net earnings excluding interest expense, income taxes, depreciation and amortization, restructuring,unallocated corporate expenses and discontinued operations (Segment Adjusted EBITDA). Segment Adjusted EBITDA is not defined under GAAP and may not becomparable to similarly-titled measures used by other companies and should not be considered a substitute for net earnings or other results reported in accordancewith GAAP. The Company believes Segment Adjusted EBITDA provides the most relevant measure of profitability as well as earnings power and the ability togenerate cash. This measure is a useful financial metric to assess the Company's operating performance from period to period by excluding certain items that itbelieves are not representative of its core business and the Company uses this measure for business planning purposes. Segment Adjusted EBITDA also provides auseful tool for assessing the comparability between periods and the Company's ability to generate cash from operations sufficient to pay taxes, to service debt andto undertake capital expenditures because it eliminates non-cash charges such as depreciation and amortization expense.
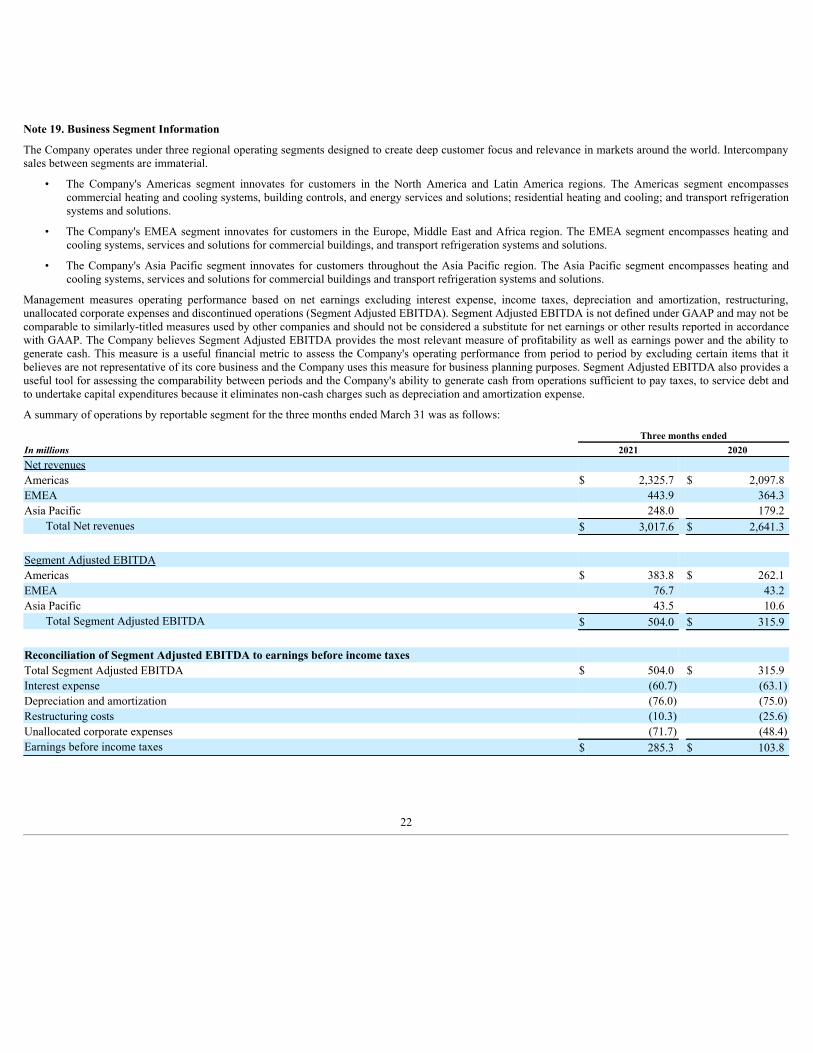
A summary of operations by reportable segment for the three months ended March 31 was as follows:
Three months endedIn millions 2021 2020Net revenuesAmericas $ 2,325.7 $ 2,097.8 EMEA 443.9 364.3 Asia Pacific 248.0 179.2
Total Net revenues $ 3,017.6 $ 2,641.3
Segment Adjusted EBITDAAmericas $ 383.8 $ 262.1 EMEA 76.7 43.2 Asia Pacific 43.5 10.6
Total Segment Adjusted EBITDA $ 504.0 $ 315.9
Reconciliation of Segment Adjusted EBITDA to earnings before income taxesTotal Segment Adjusted EBITDA $ 504.0 $ 315.9 Interest expense (60.7) (63.1)Depreciation and amortization (76.0) (75.0)Restructuring costs (10.3) (25.6)Unallocated corporate expenses (71.7) (48.4)Earnings before income taxes $ 285.3 $ 103.8
22
Note 20. Commitments and Contingencies
The Company is involved in various litigation, claims and administrative proceedings, including those related to the bankruptcy proceedings for Aldrich andMurray and environmental and product liability matters. In accordance with ASC 450, "Contingencies" (ASC 450), the Company records accruals for losscontingencies when it is both probable that a liability will be incurred and the amount of the loss can be reasonably estimated. Amounts recorded for identifiedcontingent liabilities are estimates, which are reviewed periodically and adjusted to reflect additional information when it becomes available. Subject to theuncertainties inherent in estimating future costs for contingent liabilities, except as expressly set forth in this note, management believes that any liability whichmay result from these legal matters would not have a material adverse effect on the financial condition, results of operations, liquidity or cash flows of theCompany.
Asbestos-Related Matters
Certain wholly-owned subsidiaries and former companies of the Company were named as defendants in asbestos-related lawsuits in state and federal courts. Invirtually all of the suits, a large number of other companies have also been named as defendants. The vast majority of those claims were filed against predecessorsof Aldrich and Murray and generally allege injury caused by exposure to asbestos contained in certain historical products sold by predecessors of Aldrich orMurray, primarily pumps, boilers and railroad brake shoes. None of the Company's existing or previously-owned businesses were a producer or manufacturer ofasbestos.
On June 18, 2020, Aldrich and Murray each filed voluntary petitions for relief under Chapter 11 of the Bankruptcy Code to resolve equitably and permanently allcurrent and future asbestos related claims in a manner beneficial to claimants, Aldrich and Murray. As a result of the Chapter 11 filings, all asbestos-relatedlawsuits against Aldrich and Murray have been stayed due to the imposition of a statutory automatic stay applicable in Chapter 11 bankruptcy cases. In addition, atthe request of Aldrich and Murray, the Bankruptcy Court has entered an order temporarily staying all asbestos-related claims against the Trane Companies thatrelate to claims against Aldrich or Murray (except for asbestos-related claims for which the exclusive remedy is provided under workers' compensation statutes orsimilar laws).
The goal of these Chapter 11 filings is an efficient and permanent resolution of all current and future asbestos claims through court approval of a plan ofreorganization, which would establish, in accordance with section 524(g) of the Bankruptcy Code, a trust to which all asbestos claims would be channeled forresolution. Aldrich and Murray intend to seek an agreement with representatives of the asbestos claimants on the terms of a plan for the establishment of such atrust.
Prior to the Petition Date, predecessors of each of Aldrich and Murray had been litigating asbestos-related claims brought against them. No such claims have beenpaid since the Petition Date, and it is not contemplated that any such claims will be paid until the end of the Chapter 11 cases. At this point in the Chapter 11 casesof Aldrich and Murray, it is not possible to predict whether or how long the Bankruptcy Court order temporarily staying asbestos-related claims against the TraneCompanies will be extended, whether or when any agreement with representatives of the asbestos claimants on the terms of a plan for the establishment of a trustwill be reached, what the terms of any plan of reorganization or the extent of the asbestos liability will be or how long the Chapter 11 cases will last.
From an accounting perspective, the Company no longer had control over Aldrich and Murray as of the Petition Date as their activities are subject to review andoversight by the Bankruptcy Court. Therefore, Aldrich and its wholly-owned subsidiary 200 Park and Murray and its wholly-owned subsidiary ClimateLabs weredeconsolidated as of the Petition Date and their respective assets and liabilities were derecognized from the Company's Condensed Consolidated FinancialStatements. Amounts derecognized primarily related to the legacy asbestos-related liabilities and asbestos-related insurance recoveries and $41.7 million of cash.However, in connection with the 2020 Corporate Restructuring, certain subsidiaries of the Company entered into funding agreements with Aldrich and Murray(collectively the Funding Agreements), pursuant to which those subsidiaries are obligated, among other things, to pay the costs and expenses of Aldrich andMurray during the pendency of the Chapter 11 cases to the extent distributions from their respective subsidiaries are insufficient to do so and to provide an amountfor the funding for a trust established pursuant to section 524(g) of the Bankruptcy Code, to the extent that the other assets of Aldrich and Murray are insufficientto provide the requisite trust funding.
23
Accounting Treatment Prior to the Petition Date
Historically, the Company performed a detailed analysis and projected an estimated range of the Company’s total liability for pending and unasserted futureasbestos-related claims. In accordance with ASC 450, the Company recorded the liability at the low end of the range as it believed that no amount within the rangewas a better estimate than any other amount. Asbestos-related defense costs were excluded from the liability and were recorded separately as services wereincurred. The methodology used to prepare estimates relied upon and included the following factors, among others:
• the interpretation of a widely accepted forecast of the population likely to have been occupationally exposed to asbestos;
• epidemiological studies estimating the number of people likely to develop asbestos-related diseases such as mesothelioma and lung cancer;
• the Company’s historical experience with the filing of non-malignancy claims and claims alleging other types of malignant diseases filed against theCompany relative to the number of lung cancer claims filed against the Company;
• the analysis of the number of people likely to file an asbestos-related personal injury claim against the Company based on such epidemiological andhistorical data and the Company’s claims history;
• an analysis of the Company’s pending cases, by type of disease claimed and by year filed;• an analysis of the Company’s history to determine the average settlement and resolution value of claims, by type of disease claimed;• an adjustment for inflation in the future average settlement value of claims, at a 2.5% annual inflation rate, adjusted downward to 1.0% to take account of
the declining value of claims resulting from the aging of the claimant population; and• an analysis of the period over which the Company has and is likely to resolve asbestos-related claims against it in the future (currently projected through
2053).
Prior to the Petition Date, over 73 percent of the open and active claims against the Company were non-malignant or unspecified disease claims. In addition, theCompany had a number of claims that had been placed on inactive or deferred dockets and were expected to have little or no settlement value against theCompany.
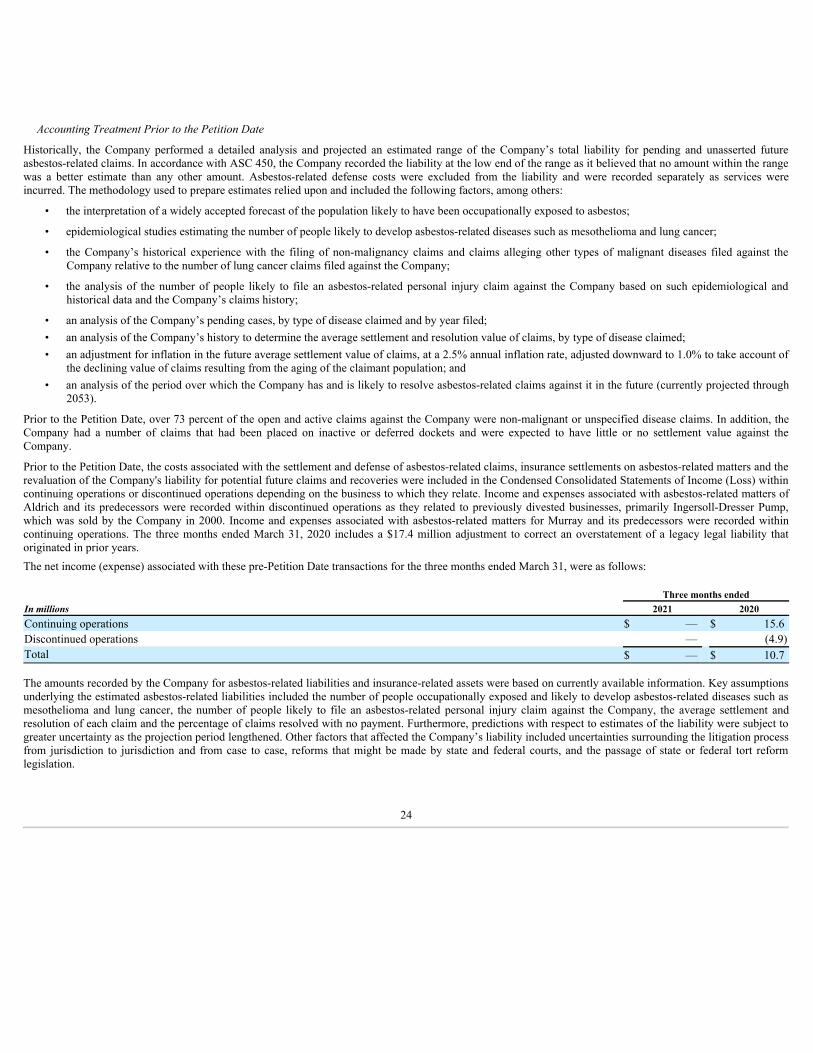
Prior to the Petition Date, the costs associated with the settlement and defense of asbestos-related claims, insurance settlements on asbestos-related matters and therevaluation of the Company's liability for potential future claims and recoveries were included in the Condensed Consolidated Statements of Income (Loss) withincontinuing operations or discontinued operations depending on the business to which they relate. Income and expenses associated with asbestos-related matters ofAldrich and its predecessors were recorded within discontinued operations as they related to previously divested businesses, primarily Ingersoll-Dresser Pump,which was sold by the Company in 2000. Income and expenses associated with asbestos-related matters for Murray and its predecessors were recorded withincontinuing operations. The three months ended March 31, 2020 includes a $17.4 million adjustment to correct an overstatement of a legacy legal liability thatoriginated in prior years.The net income (expense) associated with these pre-Petition Date transactions for the three months ended March 31, were as follows:
Three months endedIn millions 2021 2020Continuing operations $ — $ 15.6 Discontinued operations — (4.9)Total $ — $ 10.7
The amounts recorded by the Company for asbestos-related liabilities and insurance-related assets were based on currently available information. Key assumptionsunderlying the estimated asbestos-related liabilities included the number of people occupationally exposed and likely to develop asbestos-related diseases such asmesothelioma and lung cancer, the number of people likely to file an asbestos-related personal injury claim against the Company, the average settlement andresolution of each claim and the percentage of claims resolved with no payment. Furthermore, predictions with respect to estimates of the liability were subject togreater uncertainty as the projection period lengthened. Other factors that affected the Company’s liability included uncertainties surrounding the litigation processfrom jurisdiction to jurisdiction and from case to case, reforms that might be made by state and federal courts, and the passage of state or federal tort reformlegislation.
24
The aggregate amount of the stated limits in insurance policies available to Aldrich and Murray for asbestos-related claims acquired, over many years and frommany different carriers, is substantial. However, as a result of limitations in that coverage, the projected total liability to claimants substantially exceeds theprobable insurance recovery.
Accounting Treatment After the Petition Date
Upon deconsolidation, the Company recorded its retained interest in Aldrich and Murray at fair value within Other noncurrent assets in the CondensedConsolidated Balance Sheet. In determining the fair value of its equity investment, the Company used a market-adjusted multiple of earnings valuation technique.As a result, the Company recorded an aggregate equity investment of $53.6 million as of the Petition Date.
Simultaneously, the Company recognized a liability of $248.8 million within Other noncurrent liabilities in the Condensed Consolidated Balance Sheet related toits obligation under the Funding Agreements. Although the amounts that Aldrich and Murray may ultimately require under the Funding Agreements are unknown,the Company believes that an estimate of $248.8 million in the aggregate is reasonable as of March 31, 2021 as the Company has no better estimate for theamounts that may ultimately be required under the Funding Agreement. The liability is based on asbestos-related liabilities and insurance-related assets balancespreviously recorded by the Company prior to the Petition Date and may be subject to change based on the facts and circumstances of the Chapter 11 proceedings.As a result of these actions, the Company recognized an aggregate loss in its Condensed Consolidated Statements of Income (Loss) in the second quarter of 2020.Additionally, the deconsolidation resulted in an investing cash outflow of $41.7 million in the Company's Condensed Consolidated Statements of Cash Flows, ofwhich $10.8 million was recorded within continuing operations in the second quarter of 2020.
Furthermore, in connection with the 2020 Corporate Restructuring, Aldrich, Murray and their respective subsidiaries entered into several agreements withsubsidiaries of the Company to ensure they each have access to services necessary for the effective operation of their respective businesses and access to capital toaddress any liquidity needs that arise as a result of working capital requirements or timing issues. In addition, the Company regularly transacts business withAldrich and its wholly-owned subsidiary 200 Park and Murray and its wholly-owned subsidiary ClimateLabs. As of the Petition Date, these entities are consideredrelated parties and post deconsolidation activity between the Company and them are reported as third party transactions and are reflected within the Company'sCondensed Consolidated Statements of Income (Loss). Since the Petition Date, there were no material transactions between the Company and these entities.
Environmental Matters
The Company continues to be dedicated to environmental and sustainability programs to minimize the use of natural resources, and reduce the utilization andgeneration of hazardous materials from our manufacturing processes and to remediate identified environmental concerns. As to the latter, the Company is currentlyengaged in site investigations and remediation activities to address environmental cleanup from past operations at current and former manufacturing facilities.
The Company is sometimes a party to environmental lawsuits and claims and has received notices of potential violations of environmental laws and regulationsfrom the Environmental Protection Agency and similar state authorities. It has also been identified as a potentially responsible party (PRP) for cleanup costsassociated with off-site waste disposal at federal Superfund and state remediation sites. For all such sites, there are other PRPs and, in most instances, theCompany’s involvement is minimal.
In estimating its liability, the Company has assumed it will not bear the entire cost of remediation of any site to the exclusion of other PRPs who may be jointly andseverally liable. The ability of other PRPs to participate has been taken into account, based on the Company's understanding of the parties’ financial condition andprobable contributions on a per site basis. Additional lawsuits and claims involving environmental matters are likely to arise from time to time in the future.
Reserves for environmental matters are classified as Accrued expenses and other current liabilities or Other noncurrent liabilities based on their expected paymentdate. As of March 31, 2021 and December 31, 2020, the Company has recorded reserves for environmental matters of $38.3 million and $39.9 million,respectively. Of these amounts, $35.9 million and $37.5 million, respectively, relate to remediation of sites previously disposed of by the Company.
25
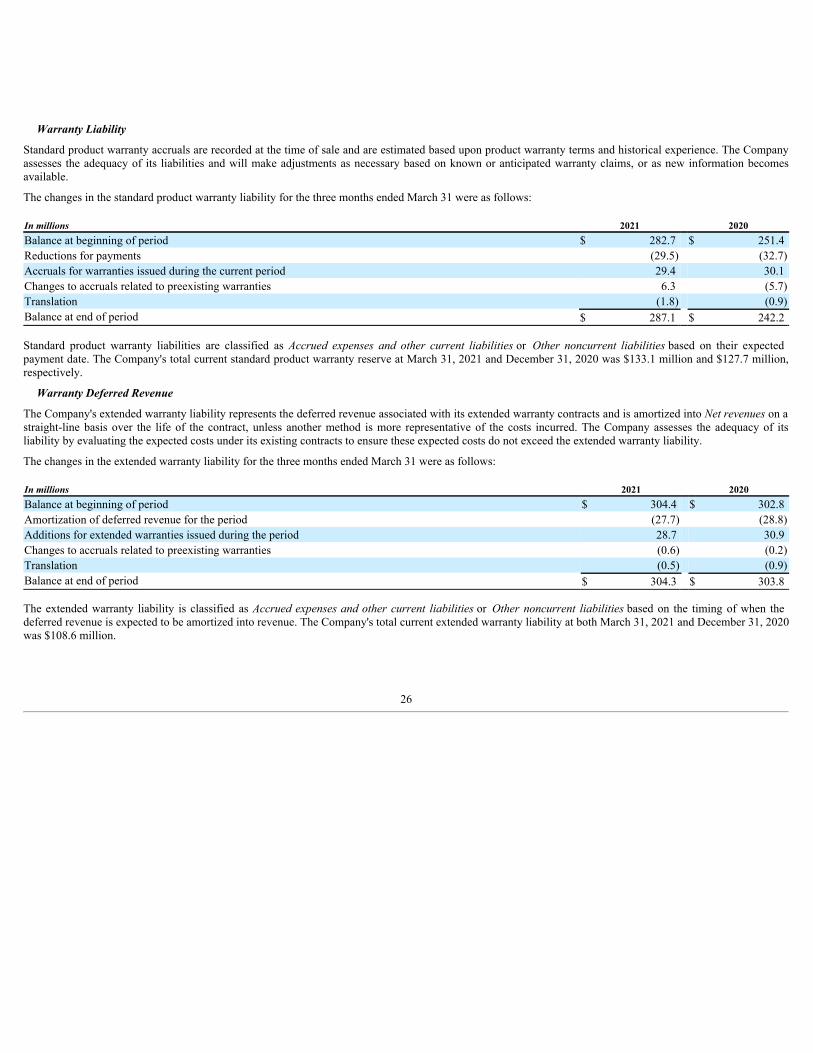
Warranty Liability
Standard product warranty accruals are recorded at the time of sale and are estimated based upon product warranty terms and historical experience. The Companyassesses the adequacy of its liabilities and will make adjustments as necessary based on known or anticipated warranty claims, or as new information becomesavailable.
The changes in the standard product warranty liability for the three months ended March 31 were as follows:
In millions 2021 2020Balance at beginning of period $ 282.7 $ 251.4 Reductions for payments (29.5) (32.7)Accruals for warranties issued during the current period 29.4 30.1 Changes to accruals related to preexisting warranties 6.3 (5.7)Translation (1.8) (0.9)Balance at end of period $ 287.1 $ 242.2
Standard product warranty liabilities are classified as Accrued expenses and other current liabilities or Other noncurrent liabilities based on their expectedpayment date. The Company's total current standard product warranty reserve at March 31, 2021 and December 31, 2020 was $133.1 million and $127.7 million,respectively.
Warranty Deferred Revenue
The Company's extended warranty liability represents the deferred revenue associated with its extended warranty contracts and is amortized into Net revenues on astraight-line basis over the life of the contract, unless another method is more representative of the costs incurred. The Company assesses the adequacy of itsliability by evaluating the expected costs under its existing contracts to ensure these expected costs do not exceed the extended warranty liability.
The changes in the extended warranty liability for the three months ended March 31 were as follows:
In millions 2021 2020Balance at beginning of period $ 304.4 $ 302.8 Amortization of deferred revenue for the period (27.7) (28.8)Additions for extended warranties issued during the period 28.7 30.9 Changes to accruals related to preexisting warranties (0.6) (0.2)Translation (0.5) (0.9)Balance at end of period $ 304.3 $ 303.8
The extended warranty liability is classified as Accrued expenses and other current liabilities or Other noncurrent liabilities based on the timing of when thedeferred revenue is expected to be amortized into revenue. The Company's total current extended warranty liability at both March 31, 2021 and December 31, 2020was $108.6 million.
26

Table of Contents
Item 2 – Management’s Discussion and Analysis of Financial Condition and Results of Operations
The following Management’s Discussion and Analysis of Financial Condition and Results of Operations contains forward-looking statements that involve risksand uncertainties. Our actual results may differ materially from the results discussed in the forward-looking statements. Factors that might cause a differenceinclude, but are not limited to, those discussed under Part I, Item 1A – Risk Factors in the Annual Report on Form 10-K for the fiscal year ended December 31,2020. The following section is qualified in its entirety by the more detailed information, including our financial statements and the notes thereto, which appearselsewhere in this Quarterly Report.
Overview
Organizational
Trane Technologies plc is a global climate innovator. We bring efficient and sustainable climate solutions to buildings, homes and transportation driven bystrategic brands Trane and Thermo King and an environmentally responsible portfolio of products and services.
Separation of Industrial Segment Businesses
On February 29, 2020 (Distribution Date), we completed our Reverse Morris Trust transaction (the Transaction) with Gardner Denver Holdings, Inc. (GardnerDenver, which changed its name to Ingersoll Rand Inc. after the Transaction) whereby we distributed Ingersoll-Rand U.S. HoldCo, Inc., which contained ourformer Industrial segment (Ingersoll Rand Industrial), through a pro rata distribution (the Distribution) to our shareholders of record as of February 24, 2020.Ingersoll Rand Industrial then merged into a wholly-owned subsidiary of Gardner Denver. Upon close of the Transaction, our existing shareholders receivedapproximately 50.1% of the shares of Gardner Denver common stock on a fully-diluted basis and Gardner Denver stockholders retained approximately 49.9% ofthe shares of Gardner Denver on a fully diluted basis. As a result, our shareholders received .8824 shares of Gardner Denver common stock with respect to eachshare owned as of February 24, 2020. In connection with the Transaction, Ingersoll-Rand Services Company, an affiliate of Ingersoll Rand Industrial, borrowed anaggregate principal amount of $1.9 billion under a senior secured first lien term loan facility (Term Loan), the proceeds of which were used to make a special cashpayment of $1.9 billion to a subsidiary of ours. The obligations under the Term Loan were retained by Ingersoll-Rand Services Company, which following theTransaction is a wholly-owned subsidiary of Gardner Denver.
As of March 31, 2021, the Company recorded an accrual and corresponding reduction to Retained earnings of $49.5 million relating to the agreement in principlewith Gardner Denver to settle remaining transaction-related items. These adjustments are related to working capital, cash and indebtedness amounts as of theDistribution Date, as well as funding levels related to pension plans, non-qualified deferred compensation plans and retiree health benefits.
After the Distribution Date, we do not beneficially own any Ingersoll Rand Industrial shares of common stock and no longer consolidate Ingersoll Rand Industrialin our financial statements. In accordance with accounting principles generally accepted in the United States of America (GAAP), the historical results of IngersollRand Industrial are presented as a discontinued operation in the Condensed Consolidated Statements of Income (Loss) and Condensed Consolidated Statements ofCash Flows.
Significant Events
COVID-19 Global Pandemic
In March 2020, the World Health Organization declared COVID-19 a global pandemic and recommended containment and mitigation measures worldwide. Duringthe first half of 2020, the COVID-19 global pandemic adversely impacted our business globally including, but not limited to, lower end customer demand, certainsupply chain delays, temporary facility closures and limitations of our workforce to essential crews only. In response, we proactively initiated cost cutting actionsin an effort to mitigate the impact of the global pandemic on our business. Despite the challenges set forth by the COVID-19 global pandemic, throughout thesecond half of 2020 and continuing through the first quarter of 2021, our production facilities remained open, we continued to sell, install and service our products,and we actively managed our supply chain to prevent any major delays. During the first quarter of 2021, we experienced significant earnings growth as a result ofstrong execution, increased end market demand, price increases to cover rapidly increasing material and component costs and shift to higher margin product sales.In addition, we continued to invest in our businesses, develop and launch new products and deliver innovative customer solutions on electrification of heating andtransport, enhanced indoor air quality, and precise temperature control along the full vaccine cold chain.
As the rate of global vaccinations to fight the COVID-19 global pandemic increases, we expect economic conditions to improve. In addition, we expect continuedincreases in input material costs due to increased end customer demand, but to date have been able to recover these additional costs through corresponding priceincreases. We will continue to monitor the ongoing COVID-19 global pandemic as it evolves globally and will assess any potential impacts to our business andfinancial statements as necessary.
® ®
27
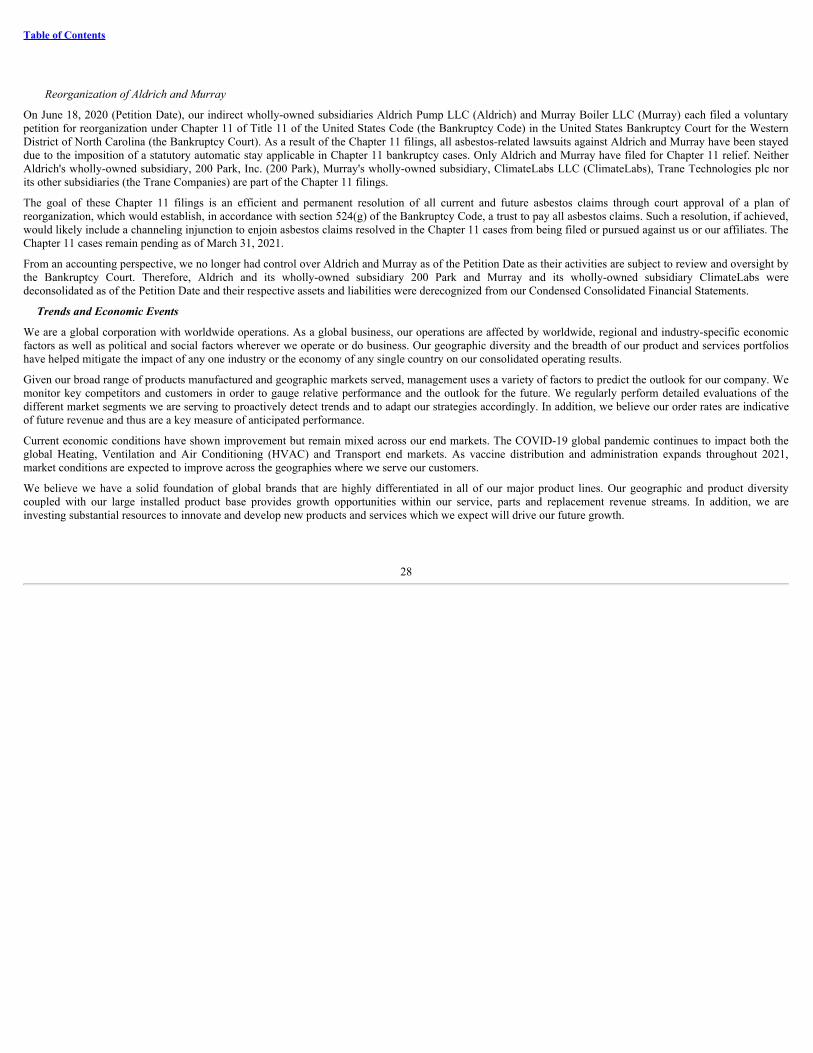
Table of Contents
Reorganization of Aldrich and Murray
On June 18, 2020 (Petition Date), our indirect wholly-owned subsidiaries Aldrich Pump LLC (Aldrich) and Murray Boiler LLC (Murray) each filed a voluntarypetition for reorganization under Chapter 11 of Title 11 of the United States Code (the Bankruptcy Code) in the United States Bankruptcy Court for the WesternDistrict of North Carolina (the Bankruptcy Court). As a result of the Chapter 11 filings, all asbestos-related lawsuits against Aldrich and Murray have been stayeddue to the imposition of a statutory automatic stay applicable in Chapter 11 bankruptcy cases. Only Aldrich and Murray have filed for Chapter 11 relief. NeitherAldrich's wholly-owned subsidiary, 200 Park, Inc. (200 Park), Murray's wholly-owned subsidiary, ClimateLabs LLC (ClimateLabs), Trane Technologies plc norits other subsidiaries (the Trane Companies) are part of the Chapter 11 filings.
The goal of these Chapter 11 filings is an efficient and permanent resolution of all current and future asbestos claims through court approval of a plan ofreorganization, which would establish, in accordance with section 524(g) of the Bankruptcy Code, a trust to pay all asbestos claims. Such a resolution, if achieved,would likely include a channeling injunction to enjoin asbestos claims resolved in the Chapter 11 cases from being filed or pursued against us or our affiliates. TheChapter 11 cases remain pending as of March 31, 2021.
From an accounting perspective, we no longer had control over Aldrich and Murray as of the Petition Date as their activities are subject to review and oversight bythe Bankruptcy Court. Therefore, Aldrich and its wholly-owned subsidiary 200 Park and Murray and its wholly-owned subsidiary ClimateLabs weredeconsolidated as of the Petition Date and their respective assets and liabilities were derecognized from our Condensed Consolidated Financial Statements.
Trends and Economic Events
We are a global corporation with worldwide operations. As a global business, our operations are affected by worldwide, regional and industry-specific economicfactors as well as political and social factors wherever we operate or do business. Our geographic diversity and the breadth of our product and services portfolioshave helped mitigate the impact of any one industry or the economy of any single country on our consolidated operating results.
Given our broad range of products manufactured and geographic markets served, management uses a variety of factors to predict the outlook for our company. Wemonitor key competitors and customers in order to gauge relative performance and the outlook for the future. We regularly perform detailed evaluations of thedifferent market segments we are serving to proactively detect trends and to adapt our strategies accordingly. In addition, we believe our order rates are indicativeof future revenue and thus are a key measure of anticipated performance.
Current economic conditions have shown improvement but remain mixed across our end markets. The COVID-19 global pandemic continues to impact both theglobal Heating, Ventilation and Air Conditioning (HVAC) and Transport end markets. As vaccine distribution and administration expands throughout 2021,market conditions are expected to improve across the geographies where we serve our customers.
We believe we have a solid foundation of global brands that are highly differentiated in all of our major product lines. Our geographic and product diversitycoupled with our large installed product base provides growth opportunities within our service, parts and replacement revenue streams. In addition, we areinvesting substantial resources to innovate and develop new products and services which we expect will drive our future growth.
28
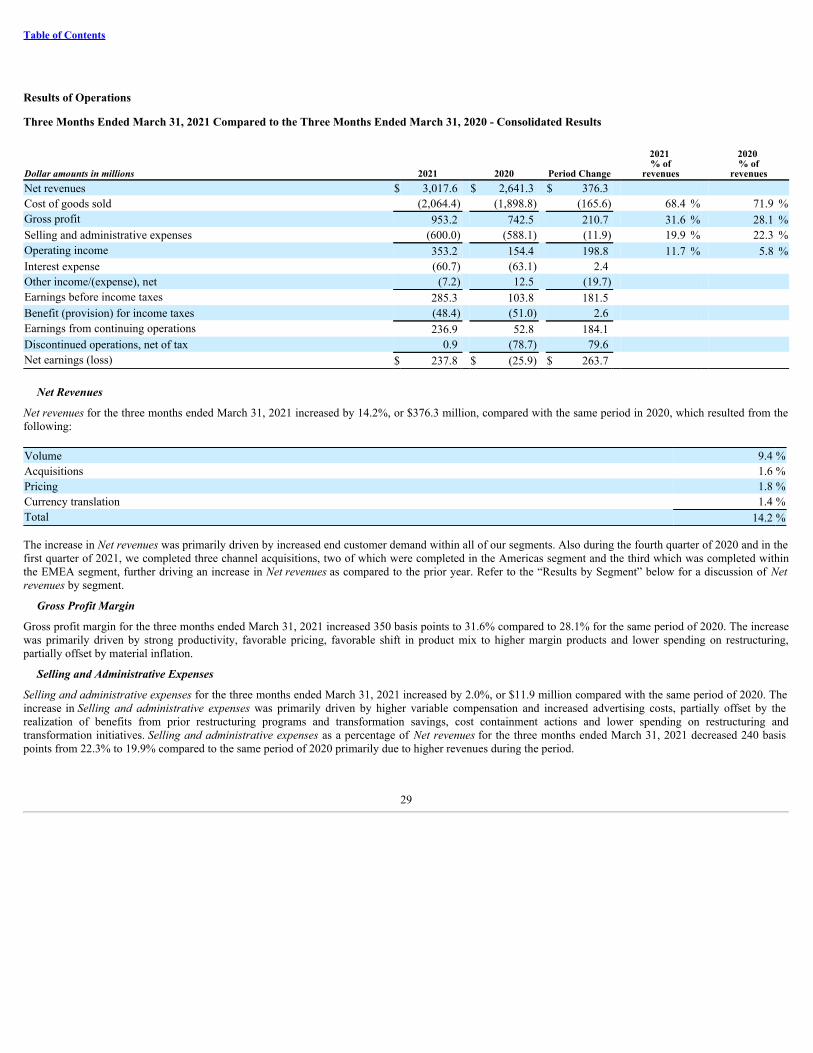
Table of Contents
Results of Operations
Three Months Ended March 31, 2021 Compared to the Three Months Ended March 31, 2020 - Consolidated Results
Dollar amounts in millions 2021 2020 Period Change
2021 % of
revenues
2020 % of
revenuesNet revenues $ 3,017.6 $ 2,641.3 $ 376.3 Cost of goods sold (2,064.4) (1,898.8) (165.6) 68.4 % 71.9 %Gross profit 953.2 742.5 210.7 31.6 % 28.1 %Selling and administrative expenses (600.0) (588.1) (11.9) 19.9 % 22.3 %Operating income 353.2 154.4 198.8 11.7 % 5.8 %Interest expense (60.7) (63.1) 2.4 Other income/(expense), net (7.2) 12.5 (19.7)Earnings before income taxes 285.3 103.8 181.5 Benefit (provision) for income taxes (48.4) (51.0) 2.6 Earnings from continuing operations 236.9 52.8 184.1 Discontinued operations, net of tax 0.9 (78.7) 79.6 Net earnings (loss) $ 237.8 $ (25.9) $ 263.7
Net Revenues
Net revenues for the three months ended March 31, 2021 increased by 14.2%, or $376.3 million, compared with the same period in 2020, which resulted from thefollowing:
Volume 9.4 %Acquisitions 1.6 %Pricing 1.8 %Currency translation 1.4 %Total 14.2 %
The increase in Net revenues was primarily driven by increased end customer demand within all of our segments. Also during the fourth quarter of 2020 and in thefirst quarter of 2021, we completed three channel acquisitions, two of which were completed in the Americas segment and the third which was completed withinthe EMEA segment, further driving an increase in Net revenues as compared to the prior year. Refer to the “Results by Segment” below for a discussion of Netrevenues by segment.
Gross Profit Margin
Gross profit margin for the three months ended March 31, 2021 increased 350 basis points to 31.6% compared to 28.1% for the same period of 2020. The increasewas primarily driven by strong productivity, favorable pricing, favorable shift in product mix to higher margin products and lower spending on restructuring,partially offset by material inflation.
Selling and Administrative Expenses
Selling and administrative expenses for the three months ended March 31, 2021 increased by 2.0%, or $11.9 million compared with the same period of 2020. Theincrease in Selling and administrative expenses was primarily driven by higher variable compensation and increased advertising costs, partially offset by therealization of benefits from prior restructuring programs and transformation savings, cost containment actions and lower spending on restructuring andtransformation initiatives. Selling and administrative expenses as a percentage of Net revenues for the three months ended March 31, 2021 decreased 240 basispoints from 22.3% to 19.9% compared to the same period of 2020 primarily due to higher revenues during the period.
29
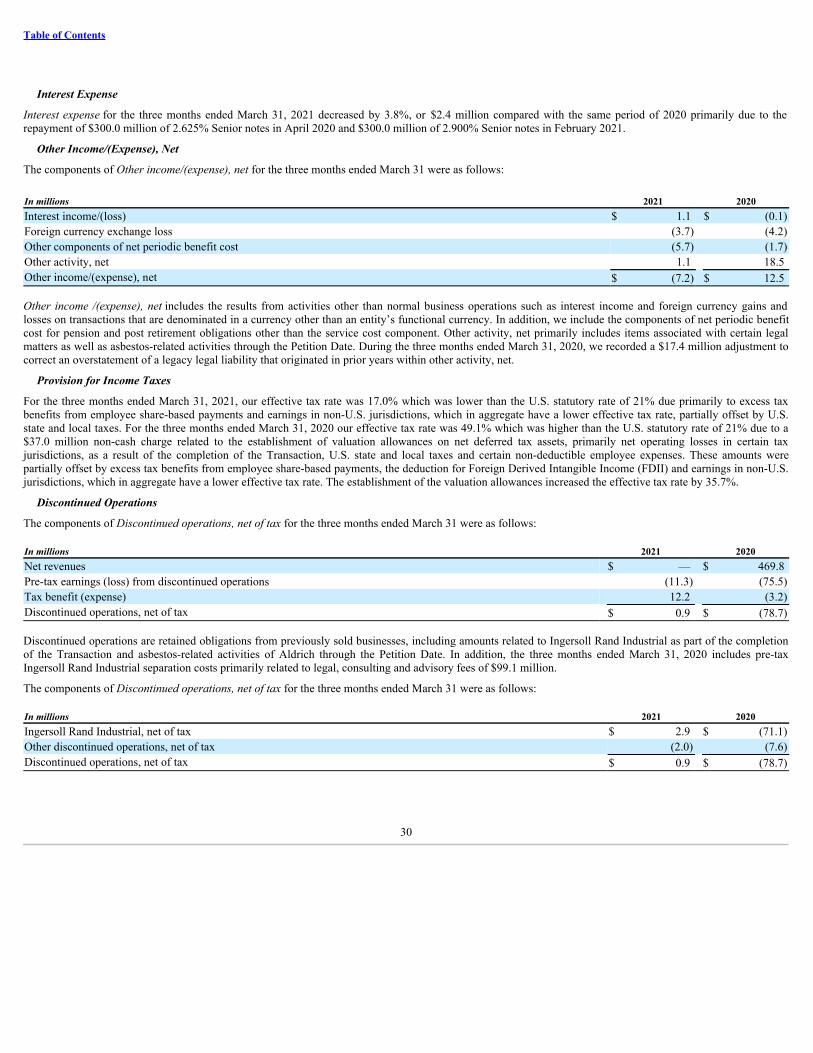
Table of Contents
Interest Expense
Interest expense for the three months ended March 31, 2021 decreased by 3.8%, or $2.4 million compared with the same period of 2020 primarily due to therepayment of $300.0 million of 2.625% Senior notes in April 2020 and $300.0 million of 2.900% Senior notes in February 2021.
Other Income/(Expense), Net
The components of Other income/(expense), net for the three months ended March 31 were as follows:
In millions 2021 2020Interest income/(loss) $ 1.1 $ (0.1)Foreign currency exchange loss (3.7) (4.2)Other components of net periodic benefit cost (5.7) (1.7)Other activity, net 1.1 18.5 Other income/(expense), net $ (7.2) $ 12.5
Other income /(expense), net includes the results from activities other than normal business operations such as interest income and foreign currency gains andlosses on transactions that are denominated in a currency other than an entity’s functional currency. In addition, we include the components of net periodic benefitcost for pension and post retirement obligations other than the service cost component. Other activity, net primarily includes items associated with certain legalmatters as well as asbestos-related activities through the Petition Date. During the three months ended March 31, 2020, we recorded a $17.4 million adjustment tocorrect an overstatement of a legacy legal liability that originated in prior years within other activity, net.
Provision for Income Taxes
For the three months ended March 31, 2021, our effective tax rate was 17.0% which was lower than the U.S. statutory rate of 21% due primarily to excess taxbenefits from employee share-based payments and earnings in non-U.S. jurisdictions, which in aggregate have a lower effective tax rate, partially offset by U.S.state and local taxes. For the three months ended March 31, 2020 our effective tax rate was 49.1% which was higher than the U.S. statutory rate of 21% due to a$37.0 million non-cash charge related to the establishment of valuation allowances on net deferred tax assets, primarily net operating losses in certain taxjurisdictions, as a result of the completion of the Transaction, U.S. state and local taxes and certain non-deductible employee expenses. These amounts werepartially offset by excess tax benefits from employee share-based payments, the deduction for Foreign Derived Intangible Income (FDII) and earnings in non-U.S.jurisdictions, which in aggregate have a lower effective tax rate. The establishment of the valuation allowances increased the effective tax rate by 35.7%.
Discontinued Operations
The components of Discontinued operations, net of tax for the three months ended March 31 were as follows:
In millions 2021 2020Net revenues $ — $ 469.8 Pre-tax earnings (loss) from discontinued operations (11.3) (75.5)Tax benefit (expense) 12.2 (3.2)Discontinued operations, net of tax $ 0.9 $ (78.7)
Discontinued operations are retained obligations from previously sold businesses, including amounts related to Ingersoll Rand Industrial as part of the completionof the Transaction and asbestos-related activities of Aldrich through the Petition Date. In addition, the three months ended March 31, 2020 includes pre-taxIngersoll Rand Industrial separation costs primarily related to legal, consulting and advisory fees of $99.1 million.
The components of Discontinued operations, net of tax for the three months ended March 31 were as follows:
In millions 2021 2020Ingersoll Rand Industrial, net of tax $ 2.9 $ (71.1)Other discontinued operations, net of tax (2.0) (7.6)Discontinued operations, net of tax $ 0.9 $ (78.7)
30
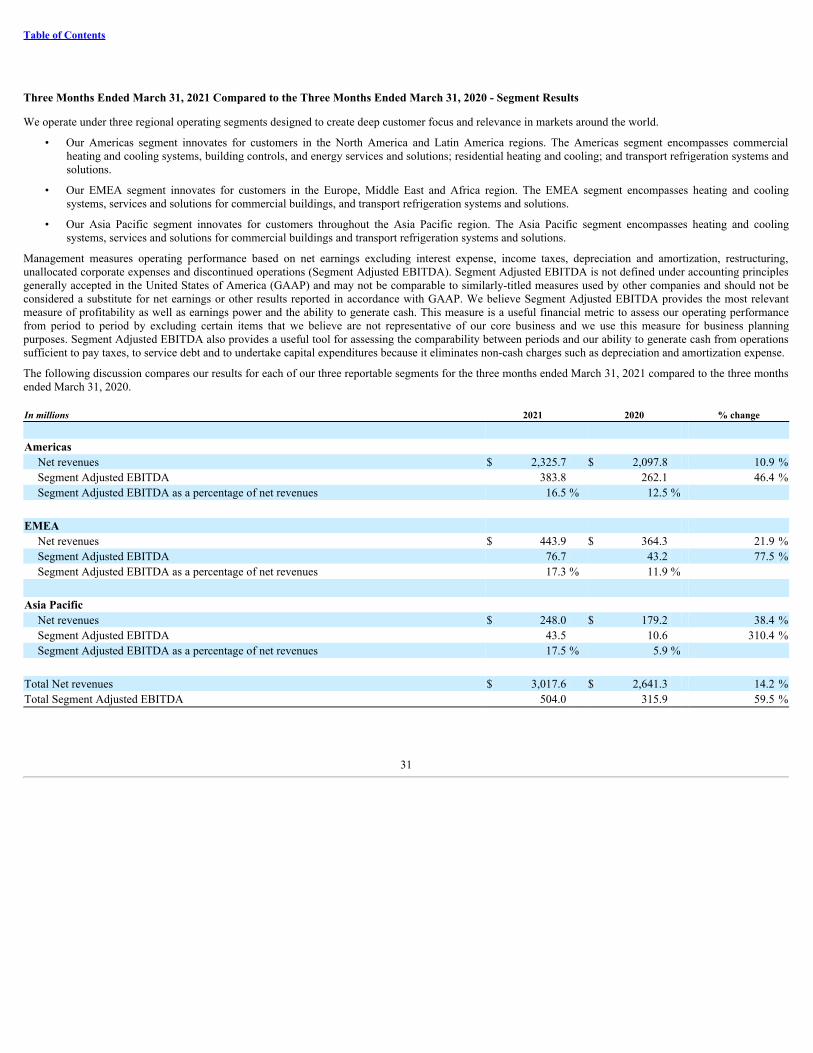
Table of Contents
Three Months Ended March 31, 2021 Compared to the Three Months Ended March 31, 2020 - Segment Results
We operate under three regional operating segments designed to create deep customer focus and relevance in markets around the world.
• Our Americas segment innovates for customers in the North America and Latin America regions. The Americas segment encompasses commercialheating and cooling systems, building controls, and energy services and solutions; residential heating and cooling; and transport refrigeration systems andsolutions.
• Our EMEA segment innovates for customers in the Europe, Middle East and Africa region. The EMEA segment encompasses heating and coolingsystems, services and solutions for commercial buildings, and transport refrigeration systems and solutions.
• Our Asia Pacific segment innovates for customers throughout the Asia Pacific region. The Asia Pacific segment encompasses heating and coolingsystems, services and solutions for commercial buildings and transport refrigeration systems and solutions.
Management measures operating performance based on net earnings excluding interest expense, income taxes, depreciation and amortization, restructuring,unallocated corporate expenses and discontinued operations (Segment Adjusted EBITDA). Segment Adjusted EBITDA is not defined under accounting principlesgenerally accepted in the United States of America (GAAP) and may not be comparable to similarly-titled measures used by other companies and should not beconsidered a substitute for net earnings or other results reported in accordance with GAAP. We believe Segment Adjusted EBITDA provides the most relevantmeasure of profitability as well as earnings power and the ability to generate cash. This measure is a useful financial metric to assess our operating performancefrom period to period by excluding certain items that we believe are not representative of our core business and we use this measure for business planningpurposes. Segment Adjusted EBITDA also provides a useful tool for assessing the comparability between periods and our ability to generate cash from operationssufficient to pay taxes, to service debt and to undertake capital expenditures because it eliminates non-cash charges such as depreciation and amortization expense.
The following discussion compares our results for each of our three reportable segments for the three months ended March 31, 2021 compared to the three monthsended March 31, 2020.
In millions 2021 2020 % change
AmericasNet revenues $ 2,325.7 $ 2,097.8 10.9 %Segment Adjusted EBITDA 383.8 262.1 46.4 %Segment Adjusted EBITDA as a percentage of net revenues 16.5 % 12.5 %
EMEANet revenues $ 443.9 $ 364.3 21.9 %Segment Adjusted EBITDA 76.7 43.2 77.5 %Segment Adjusted EBITDA as a percentage of net revenues 17.3 % 11.9 %
Asia PacificNet revenues $ 248.0 $ 179.2 38.4 %Segment Adjusted EBITDA 43.5 10.6 310.4 %Segment Adjusted EBITDA as a percentage of net revenues 17.5 % 5.9 %
Total Net revenues $ 3,017.6 $ 2,641.3 14.2 %Total Segment Adjusted EBITDA 504.0 315.9 59.5 %
31
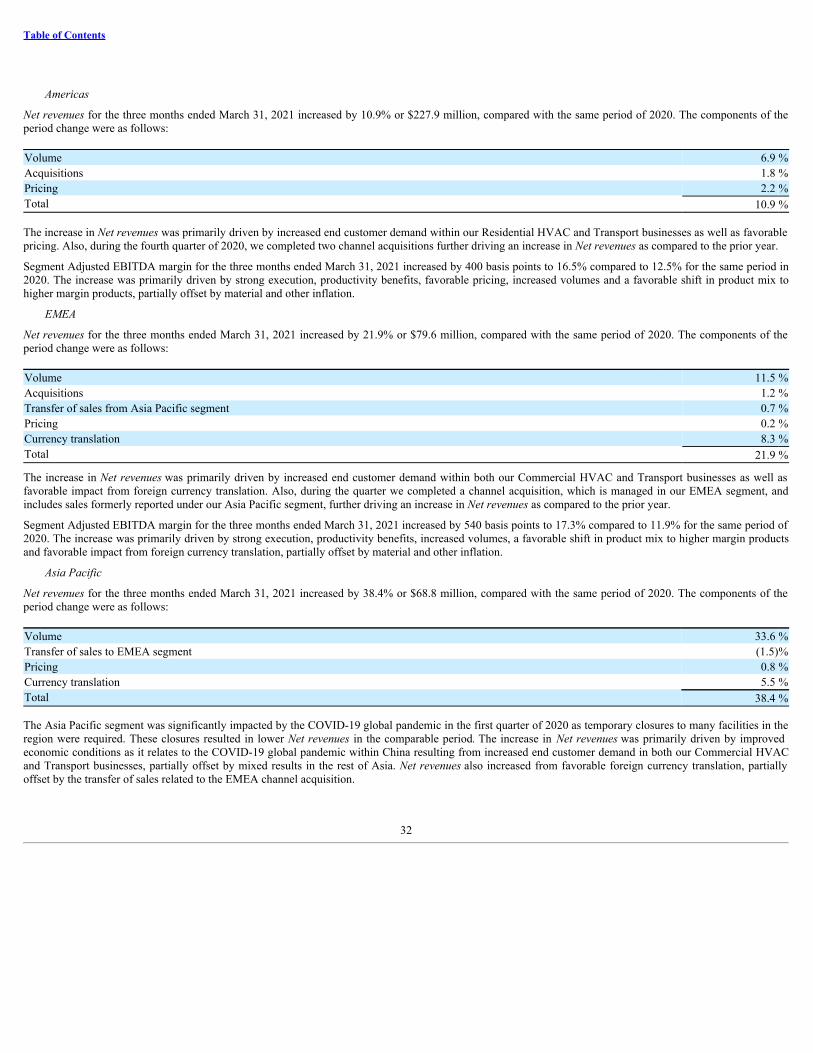
Table of Contents
Americas
Net revenues for the three months ended March 31, 2021 increased by 10.9% or $227.9 million, compared with the same period of 2020. The components of theperiod change were as follows:
Volume 6.9 %Acquisitions 1.8 %Pricing 2.2 %Total 10.9 %
The increase in Net revenues was primarily driven by increased end customer demand within our Residential HVAC and Transport businesses as well as favorablepricing. Also, during the fourth quarter of 2020, we completed two channel acquisitions further driving an increase in Net revenues as compared to the prior year.
Segment Adjusted EBITDA margin for the three months ended March 31, 2021 increased by 400 basis points to 16.5% compared to 12.5% for the same period in2020. The increase was primarily driven by strong execution, productivity benefits, favorable pricing, increased volumes and a favorable shift in product mix tohigher margin products, partially offset by material and other inflation.
EMEA
Net revenues for the three months ended March 31, 2021 increased by 21.9% or $79.6 million, compared with the same period of 2020. The components of theperiod change were as follows:
Volume 11.5 %Acquisitions 1.2 %Transfer of sales from Asia Pacific segment 0.7 %Pricing 0.2 %Currency translation 8.3 %Total 21.9 %
The increase in Net revenues was primarily driven by increased end customer demand within both our Commercial HVAC and Transport businesses as well asfavorable impact from foreign currency translation. Also, during the quarter we completed a channel acquisition, which is managed in our EMEA segment, andincludes sales formerly reported under our Asia Pacific segment, further driving an increase in Net revenues as compared to the prior year.
Segment Adjusted EBITDA margin for the three months ended March 31, 2021 increased by 540 basis points to 17.3% compared to 11.9% for the same period of2020. The increase was primarily driven by strong execution, productivity benefits, increased volumes, a favorable shift in product mix to higher margin productsand favorable impact from foreign currency translation, partially offset by material and other inflation.
Asia Pacific
Net revenues for the three months ended March 31, 2021 increased by 38.4% or $68.8 million, compared with the same period of 2020. The components of theperiod change were as follows:
Volume 33.6 %Transfer of sales to EMEA segment (1.5)%Pricing 0.8 %Currency translation 5.5 %Total 38.4 %
The Asia Pacific segment was significantly impacted by the COVID-19 global pandemic in the first quarter of 2020 as temporary closures to many facilities in theregion were required. These closures resulted in lower Net revenues in the comparable period. The increase in Net revenues was primarily driven by improvedeconomic conditions as it relates to the COVID-19 global pandemic within China resulting from increased end customer demand in both our Commercial HVACand Transport businesses, partially offset by mixed results in the rest of Asia. Net revenues also increased from favorable foreign currency translation, partiallyoffset by the transfer of sales related to the EMEA channel acquisition.
32
Table of Contents
Segment Adjusted EBITDA margin for the three months ended March 31, 2021 increased to 17.5% compared to 5.9% for the same period of 2020. The increasewas primarily driven by higher volumes as a result of increased end customer demand from improved economic conditions as compared to the prior year driven bythe COVID-19 global pandemic as discussed above. Segment Adjusted EBITDA margin also increased due to strong execution, productivity benefits and favorablepricing, partially offset by material and other inflation.
Liquidity and Capital Resources
We assess our liquidity in terms of our ability to generate cash to fund our operating, investing and financing activities. In doing so, we review and analyze ourcurrent cash on hand, the number of days our sales are outstanding, inventory turns, capital expenditure commitments and income tax payments. Our cashrequirements primarily consist of the following:
• Funding of working capital• Funding of capital expenditures• Dividend payments• Debt service requirements
Our primary sources of liquidity include cash balances on hand, cash flow from operations, proceeds from debt offerings, commercial paper, and borrowingavailability under our existing credit facilities. We earn a significant amount of our operating income in jurisdictions where it is deemed to be permanentlyreinvested. Our most prominent jurisdiction of operation is the U.S. We expect existing cash and cash equivalents available to the U.S. operations, the cashgenerated by our U.S. operations, our committed credit lines as well as our expected ability to access the capital and debt markets will be sufficient to fund ourU.S. operating and capital needs for at least the next twelve months and thereafter for the foreseeable future. In addition, we expect existing non-U.S. cash and cashequivalents and the cash generated by our non-U.S. operations will be sufficient to fund our non-U.S. operating and capital needs for at least the next twelvemonths and thereafter for the foreseeable future. The maximum aggregate amount of unsecured commercial paper notes available to be issued, on a privateplacement basis, under the commercial paper program is $2.0 billion, of which the company had no outstanding balance as of March 31, 2021.
As of March 31, 2021, we had $2,838.0 million of cash and cash equivalents on hand, of which $2,277.3 million was held by non-U.S. subsidiaries. Cash and cashequivalents held by our non-U.S. subsidiaries are generally available for use in our U.S. operations via intercompany loans, equity infusions or via distributionsfrom direct or indirectly owned non-U.S. subsidiaries for which we do not assert permanent reinvestment. As a result of the Tax Cuts and Jobs Act in 2017,additional repatriation opportunities to access cash and cash equivalents held by non-U.S. subsidiaries have been created. In general, repatriation of cash to the U.S.can be completed with no significant incremental U.S. tax. However, to the extent that we repatriate funds from non-U.S. subsidiaries for which we assertpermanent reinvestment to fund our U.S. operations, we would be required to accrue and pay applicable non-U.S. taxes. As of March 31, 2021, we currently haveno plans to repatriate funds from subsidiaries for which we assert permanent reinvestment.
Share repurchases are made from time to time in accordance with management's capital allocation strategy, subject to market conditions and regulatoryrequirements. In October 2018, our Board of Directors authorized the repurchase of up to $1.5 billion of our ordinary shares under a share repurchase program(2018 Authorization). During the three months ended March 31, 2021, we repurchased and canceled $104.2 million of our ordinary shares leaving $395.8 millionremaining under the 2018 Authorization at March 31, 2021. In February 2021, our Board of Directors authorized the repurchase of up to $2.0 billion of ourordinary shares under a new share repurchase program (2021 Authorization) upon completion of the 2018 Authorization.
We expect to pay a competitive and growing dividend. In February 2021, we announced an 11% increase in our quarterly share dividend from $0.53 to $0.59 perordinary share, or $2.36 per share annualized. The first quarter 2021 dividend was paid in March 2021 and the second quarter dividend was declared in April 2021and will be paid in June 2021.
We continue to actively manage and strengthen our business portfolio to meet the current and future needs of our customers. We achieve this partly throughengaging in research and development and sustaining activities and partly through acquisitions. Each year, we make a significant investment in new productdevelopment and new technology innovation as they are key factors in achieving our strategic objectives as a leader in the climate sector. We also focus onpartnering with our suppliers and technology providers to align their investment decisions with our technical requirements. In addition, we have a strong focus onsustaining activities, which include costs incurred to reduce production costs, improve existing products, create custom solutions for customers and provide supportto our manufacturing facilities. Combined, these costs account for approximately two percent of annual net revenues each year.
33
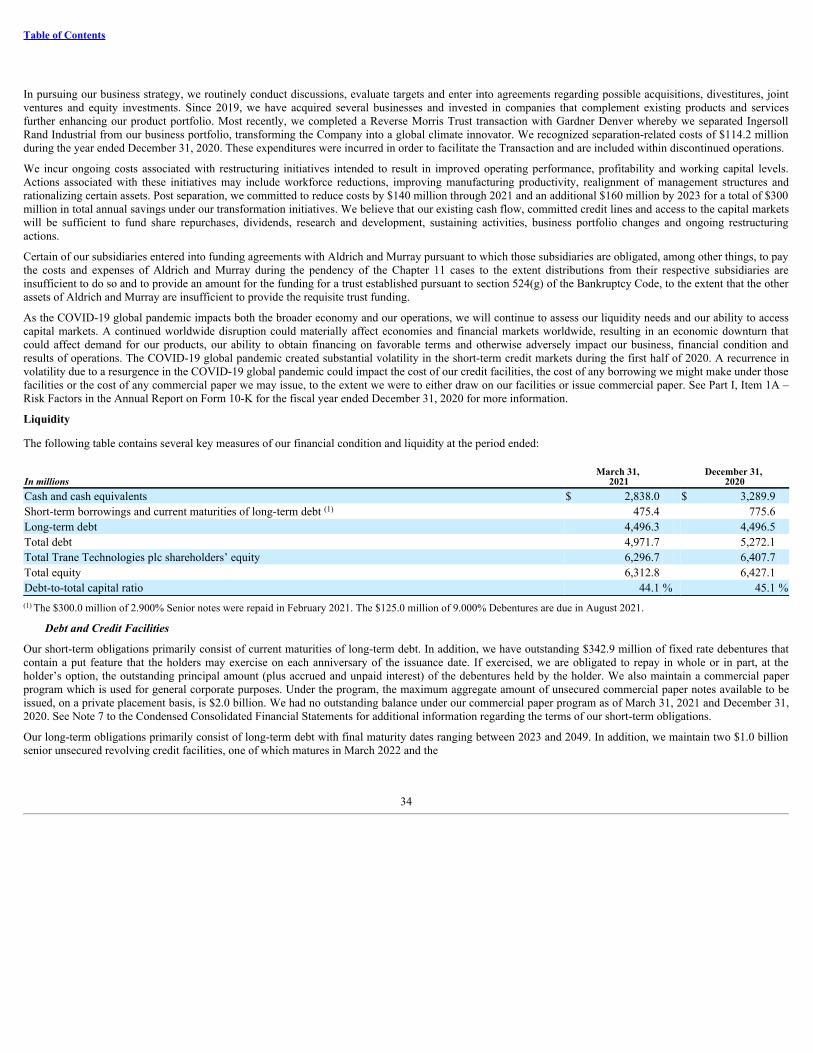
Table of Contents
In pursuing our business strategy, we routinely conduct discussions, evaluate targets and enter into agreements regarding possible acquisitions, divestitures, jointventures and equity investments. Since 2019, we have acquired several businesses and invested in companies that complement existing products and servicesfurther enhancing our product portfolio. Most recently, we completed a Reverse Morris Trust transaction with Gardner Denver whereby we separated IngersollRand Industrial from our business portfolio, transforming the Company into a global climate innovator. We recognized separation-related costs of $114.2 millionduring the year ended December 31, 2020. These expenditures were incurred in order to facilitate the Transaction and are included within discontinued operations.
We incur ongoing costs associated with restructuring initiatives intended to result in improved operating performance, profitability and working capital levels.Actions associated with these initiatives may include workforce reductions, improving manufacturing productivity, realignment of management structures andrationalizing certain assets. Post separation, we committed to reduce costs by $140 million through 2021 and an additional $160 million by 2023 for a total of $300million in total annual savings under our transformation initiatives. We believe that our existing cash flow, committed credit lines and access to the capital marketswill be sufficient to fund share repurchases, dividends, research and development, sustaining activities, business portfolio changes and ongoing restructuringactions.
Certain of our subsidiaries entered into funding agreements with Aldrich and Murray pursuant to which those subsidiaries are obligated, among other things, to paythe costs and expenses of Aldrich and Murray during the pendency of the Chapter 11 cases to the extent distributions from their respective subsidiaries areinsufficient to do so and to provide an amount for the funding for a trust established pursuant to section 524(g) of the Bankruptcy Code, to the extent that the otherassets of Aldrich and Murray are insufficient to provide the requisite trust funding.
As the COVID-19 global pandemic impacts both the broader economy and our operations, we will continue to assess our liquidity needs and our ability to accesscapital markets. A continued worldwide disruption could materially affect economies and financial markets worldwide, resulting in an economic downturn thatcould affect demand for our products, our ability to obtain financing on favorable terms and otherwise adversely impact our business, financial condition andresults of operations. The COVID-19 global pandemic created substantial volatility in the short-term credit markets during the first half of 2020. A recurrence involatility due to a resurgence in the COVID-19 global pandemic could impact the cost of our credit facilities, the cost of any borrowing we might make under thosefacilities or the cost of any commercial paper we may issue, to the extent we were to either draw on our facilities or issue commercial paper. See Part I, Item 1A –Risk Factors in the Annual Report on Form 10-K for the fiscal year ended December 31, 2020 for more information.
Liquidity
The following table contains several key measures of our financial condition and liquidity at the period ended:
In millionsMarch 31,
2021December 31,
2020Cash and cash equivalents $ 2,838.0 $ 3,289.9 Short-term borrowings and current maturities of long-term debt 475.4 775.6 Long-term debt 4,496.3 4,496.5 Total debt 4,971.7 5,272.1 Total Trane Technologies plc shareholders’ equity 6,296.7 6,407.7 Total equity 6,312.8 6,427.1 Debt-to-total capital ratio 44.1 % 45.1 %
The $300.0 million of 2.900% Senior notes were repaid in February 2021. The $125.0 million of 9.000% Debentures are due in August 2021.
Debt and Credit Facilities
Our short-term obligations primarily consist of current maturities of long-term debt. In addition, we have outstanding $342.9 million of fixed rate debentures thatcontain a put feature that the holders may exercise on each anniversary of the issuance date. If exercised, we are obligated to repay in whole or in part, at theholder’s option, the outstanding principal amount (plus accrued and unpaid interest) of the debentures held by the holder. We also maintain a commercial paperprogram which is used for general corporate purposes. Under the program, the maximum aggregate amount of unsecured commercial paper notes available to beissued, on a private placement basis, is $2.0 billion. We had no outstanding balance under our commercial paper program as of March 31, 2021 and December 31,2020. See Note 7 to the Condensed Consolidated Financial Statements for additional information regarding the terms of our short-term obligations.
Our long-term obligations primarily consist of long-term debt with final maturity dates ranging between 2023 and 2049. In addition, we maintain two $1.0 billionsenior unsecured revolving credit facilities, one of which matures in March 2022 and the
(1)
(1)
34
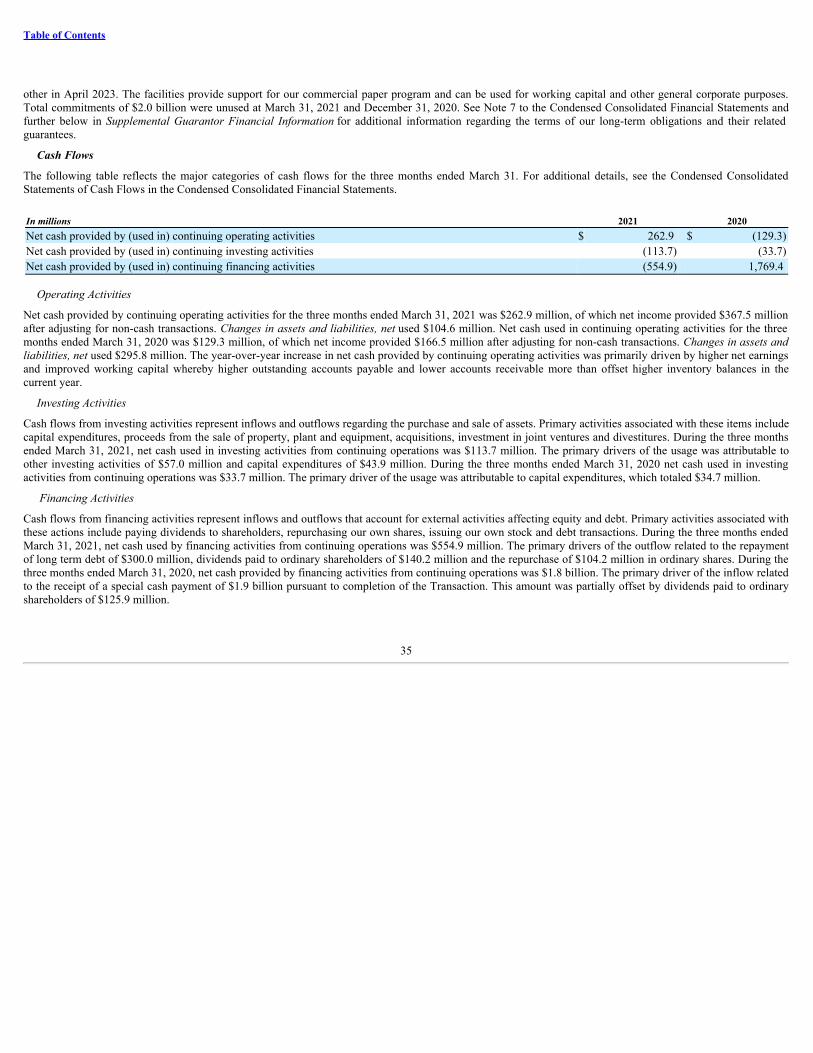
Table of Contents
other in April 2023. The facilities provide support for our commercial paper program and can be used for working capital and other general corporate purposes.Total commitments of $2.0 billion were unused at March 31, 2021 and December 31, 2020. See Note 7 to the Condensed Consolidated Financial Statements andfurther below in Supplemental Guarantor Financial Information for additional information regarding the terms of our long-term obligations and their relatedguarantees.
Cash Flows
The following table reflects the major categories of cash flows for the three months ended March 31. For additional details, see the Condensed ConsolidatedStatements of Cash Flows in the Condensed Consolidated Financial Statements.
In millions 2021 2020Net cash provided by (used in) continuing operating activities $ 262.9 $ (129.3)Net cash provided by (used in) continuing investing activities (113.7) (33.7)Net cash provided by (used in) continuing financing activities (554.9) 1,769.4
Operating Activities
Net cash provided by continuing operating activities for the three months ended March 31, 2021 was $262.9 million, of which net income provided $367.5 millionafter adjusting for non-cash transactions. Changes in assets and liabilities, net used $104.6 million. Net cash used in continuing operating activities for the threemonths ended March 31, 2020 was $129.3 million, of which net income provided $166.5 million after adjusting for non-cash transactions. Changes in assets andliabilities, net used $295.8 million. The year-over-year increase in net cash provided by continuing operating activities was primarily driven by higher net earningsand improved working capital whereby higher outstanding accounts payable and lower accounts receivable more than offset higher inventory balances in thecurrent year.
Investing Activities
Cash flows from investing activities represent inflows and outflows regarding the purchase and sale of assets. Primary activities associated with these items includecapital expenditures, proceeds from the sale of property, plant and equipment, acquisitions, investment in joint ventures and divestitures. During the three monthsended March 31, 2021, net cash used in investing activities from continuing operations was $113.7 million. The primary drivers of the usage was attributable toother investing activities of $57.0 million and capital expenditures of $43.9 million. During the three months ended March 31, 2020 net cash used in investingactivities from continuing operations was $33.7 million. The primary driver of the usage was attributable to capital expenditures, which totaled $34.7 million.
Financing Activities
Cash flows from financing activities represent inflows and outflows that account for external activities affecting equity and debt. Primary activities associated withthese actions include paying dividends to shareholders, repurchasing our own shares, issuing our own stock and debt transactions. During the three months endedMarch 31, 2021, net cash used by financing activities from continuing operations was $554.9 million. The primary drivers of the outflow related to the repaymentof long term debt of $300.0 million, dividends paid to ordinary shareholders of $140.2 million and the repurchase of $104.2 million in ordinary shares. During thethree months ended March 31, 2020, net cash provided by financing activities from continuing operations was $1.8 billion. The primary driver of the inflow relatedto the receipt of a special cash payment of $1.9 billion pursuant to completion of the Transaction. This amount was partially offset by dividends paid to ordinaryshareholders of $125.9 million.
35
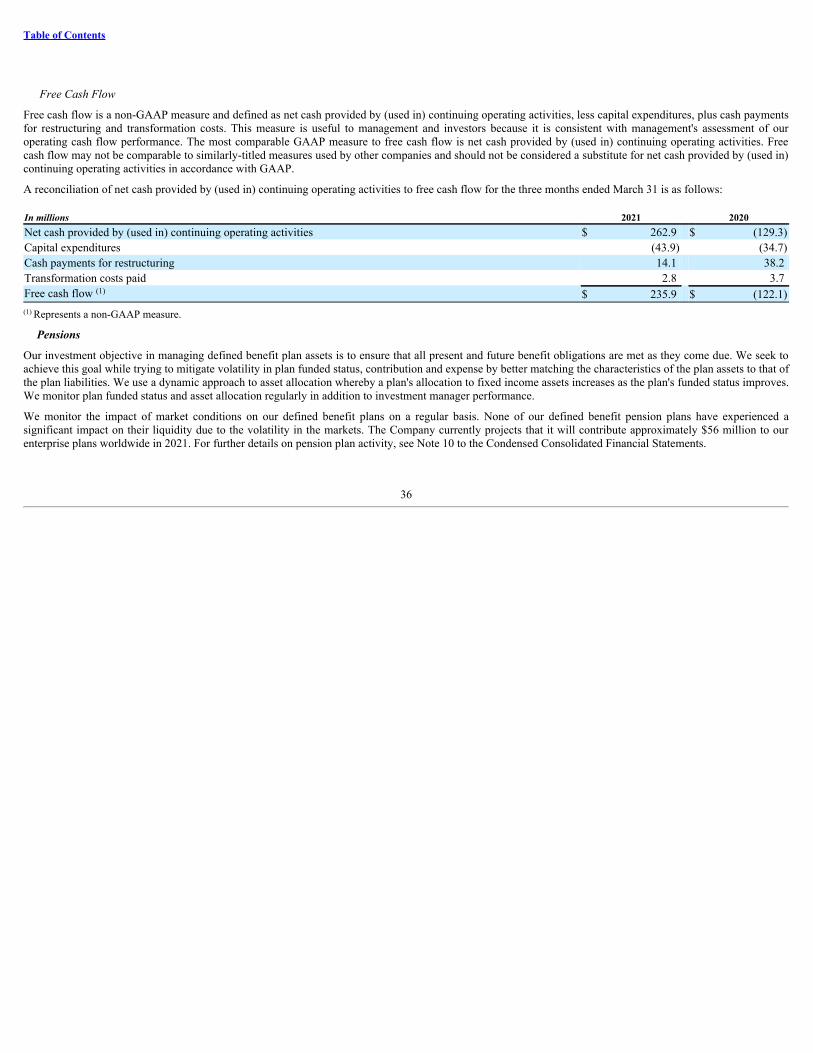
Table of Contents
Free Cash Flow
Free cash flow is a non-GAAP measure and defined as net cash provided by (used in) continuing operating activities, less capital expenditures, plus cash paymentsfor restructuring and transformation costs. This measure is useful to management and investors because it is consistent with management's assessment of ouroperating cash flow performance. The most comparable GAAP measure to free cash flow is net cash provided by (used in) continuing operating activities. Freecash flow may not be comparable to similarly-titled measures used by other companies and should not be considered a substitute for net cash provided by (used in)continuing operating activities in accordance with GAAP.
A reconciliation of net cash provided by (used in) continuing operating activities to free cash flow for the three months ended March 31 is as follows:
In millions 2021 2020Net cash provided by (used in) continuing operating activities $ 262.9 $ (129.3)Capital expenditures (43.9) (34.7)Cash payments for restructuring 14.1 38.2 Transformation costs paid 2.8 3.7 Free cash flow $ 235.9 $ (122.1)
Represents a non-GAAP measure.
Pensions
Our investment objective in managing defined benefit plan assets is to ensure that all present and future benefit obligations are met as they come due. We seek toachieve this goal while trying to mitigate volatility in plan funded status, contribution and expense by better matching the characteristics of the plan assets to that ofthe plan liabilities. We use a dynamic approach to asset allocation whereby a plan's allocation to fixed income assets increases as the plan's funded status improves.We monitor plan funded status and asset allocation regularly in addition to investment manager performance.
We monitor the impact of market conditions on our defined benefit plans on a regular basis. None of our defined benefit pension plans have experienced asignificant impact on their liquidity due to the volatility in the markets. The Company currently projects that it will contribute approximately $56 million to ourenterprise plans worldwide in 2021. For further details on pension plan activity, see Note 10 to the Condensed Consolidated Financial Statements.
(1)
(1)
36
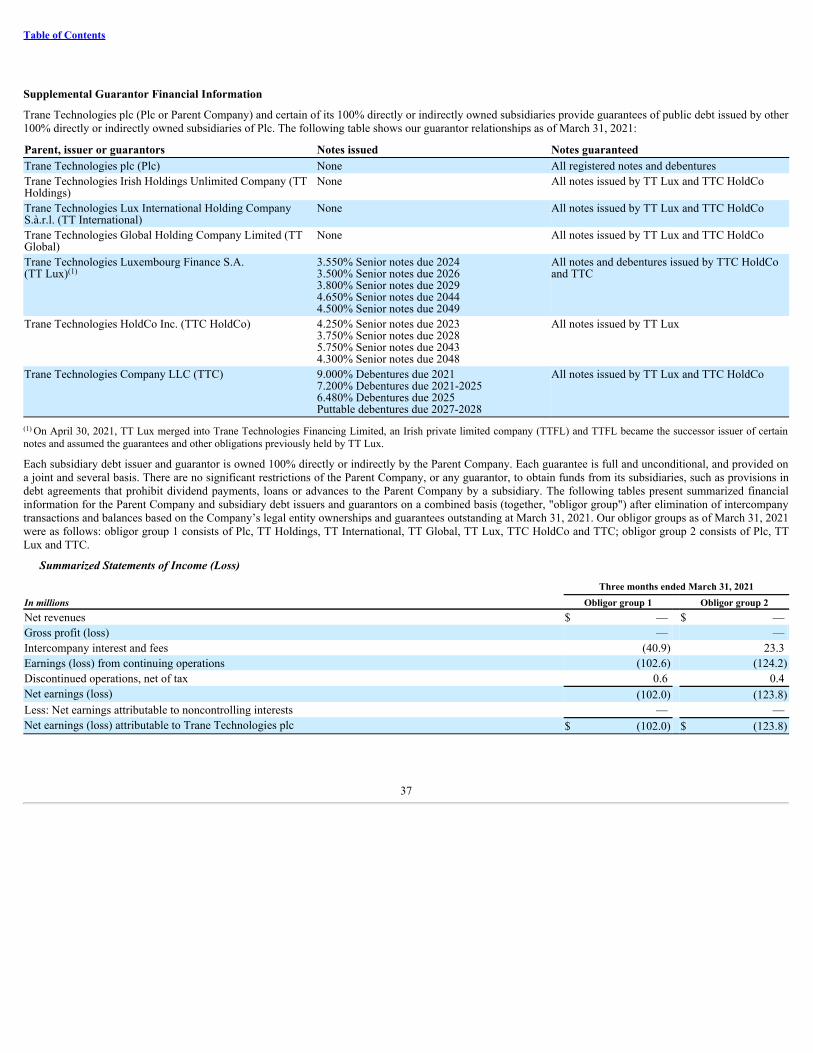
Table of Contents
Supplemental Guarantor Financial Information
Trane Technologies plc (Plc or Parent Company) and certain of its 100% directly or indirectly owned subsidiaries provide guarantees of public debt issued by other100% directly or indirectly owned subsidiaries of Plc. The following table shows our guarantor relationships as of March 31, 2021:
Parent, issuer or guarantors Notes issued Notes guaranteedTrane Technologies plc (Plc) None All registered notes and debenturesTrane Technologies Irish Holdings Unlimited Company (TTHoldings)
None All notes issued by TT Lux and TTC HoldCo
Trane Technologies Lux International Holding CompanyS.à.r.l. (TT International)
None All notes issued by TT Lux and TTC HoldCo
Trane Technologies Global Holding Company Limited (TTGlobal)
None All notes issued by TT Lux and TTC HoldCo
Trane Technologies Luxembourg Finance S.A.(TT Lux)
3.550% Senior notes due 2024 3.500% Senior notes due 2026 3.800% Senior notes due 2029 4.650% Senior notes due 2044 4.500% Senior notes due 2049
All notes and debentures issued by TTC HoldCoand TTC
Trane Technologies HoldCo Inc. (TTC HoldCo) 4.250% Senior notes due 2023 3.750% Senior notes due 2028 5.750% Senior notes due 2043 4.300% Senior notes due 2048
All notes issued by TT Lux
Trane Technologies Company LLC (TTC) 9.000% Debentures due 2021 7.200% Debentures due 2021-2025 6.480% Debentures due 2025 Puttable debentures due 2027-2028
All notes issued by TT Lux and TTC HoldCo
On April 30, 2021, TT Lux merged into Trane Technologies Financing Limited, an Irish private limited company (TTFL) and TTFL became the successor issuer of certainnotes and assumed the guarantees and other obligations previously held by TT Lux.
Each subsidiary debt issuer and guarantor is owned 100% directly or indirectly by the Parent Company. Each guarantee is full and unconditional, and provided ona joint and several basis. There are no significant restrictions of the Parent Company, or any guarantor, to obtain funds from its subsidiaries, such as provisions indebt agreements that prohibit dividend payments, loans or advances to the Parent Company by a subsidiary. The following tables present summarized financialinformation for the Parent Company and subsidiary debt issuers and guarantors on a combined basis (together, "obligor group") after elimination of intercompanytransactions and balances based on the Company’s legal entity ownerships and guarantees outstanding at March 31, 2021. Our obligor groups as of March 31, 2021were as follows: obligor group 1 consists of Plc, TT Holdings, TT International, TT Global, TT Lux, TTC HoldCo and TTC; obligor group 2 consists of Plc, TTLux and TTC.
Summarized Statements of Income (Loss)
Three months ended March 31, 2021In millions Obligor group 1 Obligor group 2Net revenues $ — $ — Gross profit (loss) — — Intercompany interest and fees (40.9) 23.3 Earnings (loss) from continuing operations (102.6) (124.2)Discontinued operations, net of tax 0.6 0.4 Net earnings (loss) (102.0) (123.8)Less: Net earnings attributable to noncontrolling interests — — Net earnings (loss) attributable to Trane Technologies plc $ (102.0) $ (123.8)
(1)
(1)
37
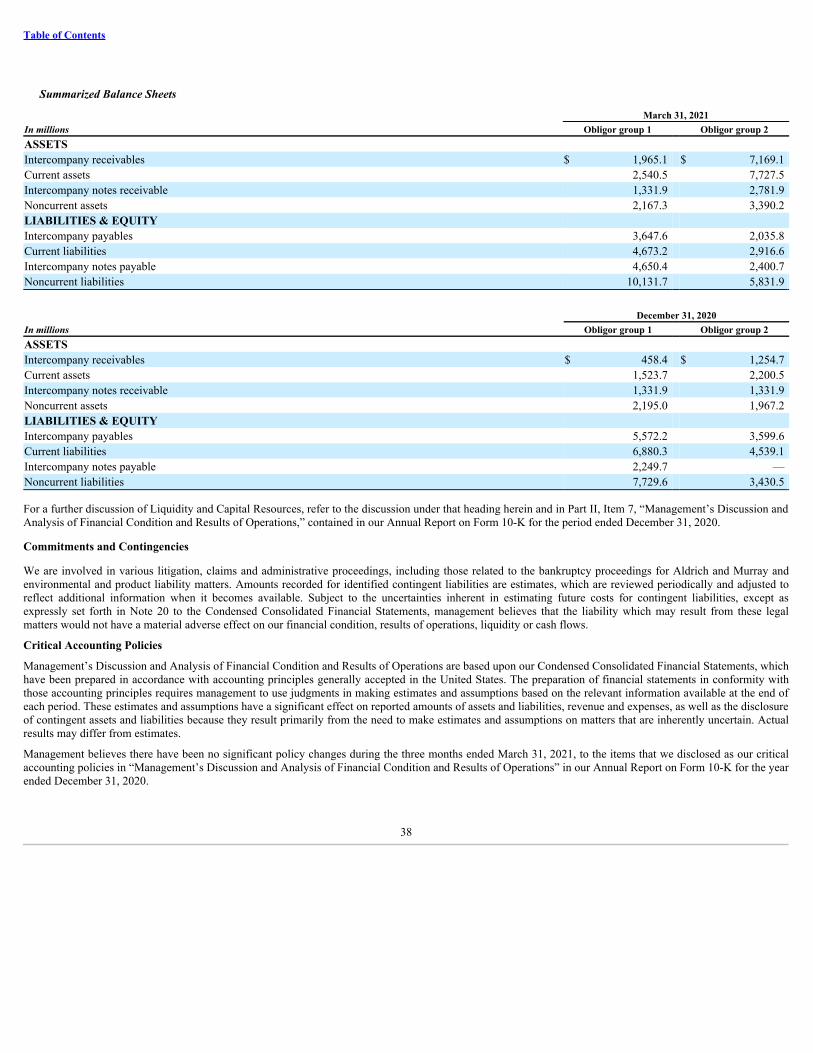
Table of Contents
Summarized Balance Sheets
March 31, 2021In millions Obligor group 1 Obligor group 2ASSETSIntercompany receivables $ 1,965.1 $ 7,169.1 Current assets 2,540.5 7,727.5 Intercompany notes receivable 1,331.9 2,781.9 Noncurrent assets 2,167.3 3,390.2 LIABILITIES & EQUITYIntercompany payables 3,647.6 2,035.8 Current liabilities 4,673.2 2,916.6 Intercompany notes payable 4,650.4 2,400.7 Noncurrent liabilities 10,131.7 5,831.9
December 31, 2020In millions Obligor group 1 Obligor group 2ASSETSIntercompany receivables $ 458.4 $ 1,254.7 Current assets 1,523.7 2,200.5 Intercompany notes receivable 1,331.9 1,331.9 Noncurrent assets 2,195.0 1,967.2 LIABILITIES & EQUITYIntercompany payables 5,572.2 3,599.6 Current liabilities 6,880.3 4,539.1 Intercompany notes payable 2,249.7 — Noncurrent liabilities 7,729.6 3,430.5
For a further discussion of Liquidity and Capital Resources, refer to the discussion under that heading herein and in Part II, Item 7, “Management’s Discussion andAnalysis of Financial Condition and Results of Operations,” contained in our Annual Report on Form 10-K for the period ended December 31, 2020.
Commitments and Contingencies
We are involved in various litigation, claims and administrative proceedings, including those related to the bankruptcy proceedings for Aldrich and Murray andenvironmental and product liability matters. Amounts recorded for identified contingent liabilities are estimates, which are reviewed periodically and adjusted toreflect additional information when it becomes available. Subject to the uncertainties inherent in estimating future costs for contingent liabilities, except asexpressly set forth in Note 20 to the Condensed Consolidated Financial Statements, management believes that the liability which may result from these legalmatters would not have a material adverse effect on our financial condition, results of operations, liquidity or cash flows.
Critical Accounting Policies
Management’s Discussion and Analysis of Financial Condition and Results of Operations are based upon our Condensed Consolidated Financial Statements, whichhave been prepared in accordance with accounting principles generally accepted in the United States. The preparation of financial statements in conformity withthose accounting principles requires management to use judgments in making estimates and assumptions based on the relevant information available at the end ofeach period. These estimates and assumptions have a significant effect on reported amounts of assets and liabilities, revenue and expenses, as well as the disclosureof contingent assets and liabilities because they result primarily from the need to make estimates and assumptions on matters that are inherently uncertain. Actualresults may differ from estimates.
Management believes there have been no significant policy changes during the three months ended March 31, 2021, to the items that we disclosed as our criticalaccounting policies in “Management’s Discussion and Analysis of Financial Condition and Results of Operations” in our Annual Report on Form 10-K for the yearended December 31, 2020.
38
Table of Contents
Recent Accounting PronouncementsSee Note 3 to the Condensed Consolidated Financial Statements for a discussion of recent accounting pronouncements.
Safe Harbor Statement
Certain statements in this report, other than purely historical information, are “forward-looking statements” within the meaning of the Private Securities LitigationReform Act of 1995, Section 27A of the Securities Act of 1933 and Section 21E of the Securities Exchange Act of 1934. These forward-looking statementsgenerally are identified by the words “believe,” “project,” “expect,” “anticipate,” “estimate,” “forecast,” “outlook,” “intend,” “strategy,” “plan,” “may,” “could,”“should,” “will,” “would,” “will be,” “will continue,” “will likely result,” or the negative thereof or variations thereon or similar terminology generally intended toidentify forward-looking statements.
Forward-looking statements may relate to such matters as projections of revenue, margins, expenses, tax provisions, earnings, cash flows, benefit obligations, shareor debt repurchases or other financial items; any statements of the plans, strategies and objectives of management for future operations, including those relating toany statements concerning expected development, performance or market share relating to our products and services; any statements regarding future economicconditions or our performance including our future performance during the COVID-19 global pandemic; any statements regarding pending investigations, claimsor disputes; any statements of expectation or belief; and any statements of assumptions underlying any of the foregoing. These statements are based on currentlyavailable information and our current assumptions, expectations and projections about future events. While we believe that our assumptions, expectations andprojections are reasonable in view of the currently available information, you are cautioned not to place undue reliance on our forward-looking statements. You areadvised to review any further disclosures we make on related subjects in materials we file with or furnish to the SEC. Forward-looking statements speak only as ofthe date they are made and are not guarantees of future performance. They are subject to future events, risks and uncertainties - many of which are beyond ourcontrol - as well as potentially inaccurate assumptions, that could cause actual results to differ materially from our expectations and projections. We do notundertake to update any forward-looking statements.
Factors that might affect our forward-looking statements include, among other things:
• impacts of the COVID-19 global pandemic on our business operations, financial results and financial position and on the world economy;
• overall economic, political and business conditions in the markets in which we operate;
• trade protection measures such as import or export restrictions and requirements, the imposition of tariffs and quotas or revocation or materialmodification of trade agreements;
• competitive factors in the industries in which we compete;
• our ability to develop new products and services and the acceptance of these products in the markets we serve;
• other capital market conditions, including availability of funding sources, interest rates fluctuations and other changes in borrowing costs;
• currency exchange rate fluctuations, exchange controls and currency devaluations;
• the outcome of any litigation, governmental investigations or proceedings;
• the outcome of Chapter 11 proceedings for our deconsolidated subsidiaries Aldrich and Murray;
• the impact of potential information technology, system failures, data security breaches or other cybersecurity issues;
• evolving data privacy and protection laws;
• intellectual property infringement claims and the inability to protect our intellectual property rights;
• changes in laws and regulations;
• health epidemics or pandemics or other contagious outbreaks;
• climate change, changes in weather patterns, natural disasters and seasonal fluctuations;
• availability of and fluctuations in the prices of key commodities;
• the outcome of any income tax audits or settlements;
• the strategic acquisition of businesses, product lines and joint ventures;
• impairment of our goodwill, indefinite-lived intangible assets and/or our long-lived assets;
39
Table of Contents
• changes in tax laws and requirements (including tax rate changes, new tax laws, new and/or revised tax law interpretations and any legislation that maylimit or eliminate potential tax benefits resulting from our incorporation in a non-U.S. jurisdiction, such as Ireland); and
• work stoppages, union negotiations, labor disputes and similar issues
Some of the significant risks and uncertainties that could cause actual results to differ materially from our expectations and projections are described more fully inthe “Risk Factors” section of our Annual Report on Form 10-K for the fiscal year ended December 31, 2020. There may also be other factors that have not beenanticipated or that are not described in our periodic filings with the SEC, generally because we did not believe them to be significant at the time, which could causeresults to differ materially from our expectations.
Available Information
We have used, and intend to continue to use, the homepage, the investor relations and the “News” section of our website (www.tranetechnologies.com), amongother sources such as press releases, public conference calls and webcasts, as a means of disclosing additional information, which may include future developmentsrelated to the COVID-19 global pandemic and/or material non-public information. We encourage investors, the media, and others interested in our Company toreview the information it makes public in these locations on its website.
Item 3 – Quantitative and Qualitative Disclosures about Market Risk
The COVID-19 global pandemic created substantial volatility in the short-term credit markets during the first half of 2020. A recurrence in volatility due to aresurgence in the COVID-19 global pandemic could impact the cost of our credit facilities, the cost of any borrowing we might make under those facilities or thecost of any commercial paper we may issue, to the extent we were to either draw on our facilities or issue commercial paper.
For a discussion of the Company’s exposure to market risk, refer to Part II, Item 7A, “Quantitative and Qualitative Disclosures About Market Risk,” contained inthe Company’s Annual Report on Form 10-K for the fiscal year ended December 31, 2020.
Item 4 – Controls and Procedures
The Company’s management, including its Chief Executive Officer and Chief Financial Officer, have conducted an evaluation of the effectiveness of disclosurecontrols and procedures (as such term is defined in Rules 13a-15(e) and 15d-15(e) under the Securities Exchange Act of 1934, as amended (the Exchange Act)), asof the end of the period covered by this Quarterly Report on Form 10-Q. Based on that evaluation, the Chief Executive Officer and Chief Financial Officerconcluded as of March 31, 2021, that the disclosure controls and procedures are effective in ensuring that all material information required to be filed in thisQuarterly Report on Form 10-Q has been recorded, processed, summarized and reported when required and the information is accumulated and communicated tothe Company's management, including its Chief Executive Officer and Chief Financial Officer, as appropriate, to allow timely decisions regarding requireddisclosure.
There has been no change in the Company’s internal control over financial reporting that occurred during the first quarter of 2021 that has materially affected, or isreasonably likely to materially affect, the Company’s internal control over financial reporting.
40
Table of Contents
PART II – OTHER INFORMATION
Item 1 – Legal Proceedings
In the normal course of business, we are involved in a variety of lawsuits, claims and legal proceedings, including those related to the bankruptcy proceedings forAldrich and Murray, commercial and contract disputes, employment matters, product liability claims, asbestos-related claims, environmental liabilities, intellectualproperty disputes, and tax-related matters. In our opinion, pending legal matters are not expected to have a material adverse impact on our results of operations,financial condition, liquidity or cash flows.
Asbestos-Related Matters
On the Petition Date, Aldrich and Murray each filed a voluntary petition for reorganization under Chapter 11 of the Bankruptcy Code. As a result of the Chapter 11filings, all asbestos-related lawsuits against Aldrich and Murray have been stayed due to the imposition of a statutory automatic stay applicable in Chapter 11bankruptcy cases. Only Aldrich and Murray have filed for Chapter 11 relief. Neither Aldrich's wholly-owned subsidiary, 200 Park, Murray's wholly-ownedsubsidiary, ClimateLabs, Trane Technologies plc nor the Trane Companies are part of the Chapter 11 filings.
The goal of these Chapter 11 filings is an efficient and permanent resolution of all current and future asbestos claims through court approval of a plan ofreorganization, which would establish, in accordance with section 524(g) of the Bankruptcy Code, a trust to pay all asbestos claims. Such a resolution, if achieved,would likely include a channeling injunction to enjoin asbestos claims resolved in the Chapter 11 cases from being filed or pursued against us or our affiliates. TheChapter 11 cases remain pending as of March 31, 2021.Prior to the Petition Date, certain of our wholly-owned subsidiaries and former companies were named as defendants in asbestos-related lawsuits in state andfederal courts. In virtually all of the suits, a large number of other companies have also been named as defendants. The vast majority of those claims allege injurycaused by exposure to asbestos contained in certain historical products, primarily pumps, boilers and railroad brake shoes. None of our existing or previously-owned businesses were a producer or manufacturer of asbestos.
See also the discussion contained in our Annual Report on Form 10-K for the period ended December 31, 2020 under Part II, Item 7, Management’s Discussionand Analysis of Financial Condition and Results of Operations and also Note 20 to the Condensed Consolidated Financial Statements in this Form 10-Q.
Item 1A – Risk Factors
There have been no material changes to our risk factors contained in our Annual Report on Form 10-K for the period ended December 31, 2020. For a furtherdiscussion of our risk factors, refer to Item 1A. "Risk Factors" contained in our Annual Report on Form 10-K for the period ended December 31, 2020.
41
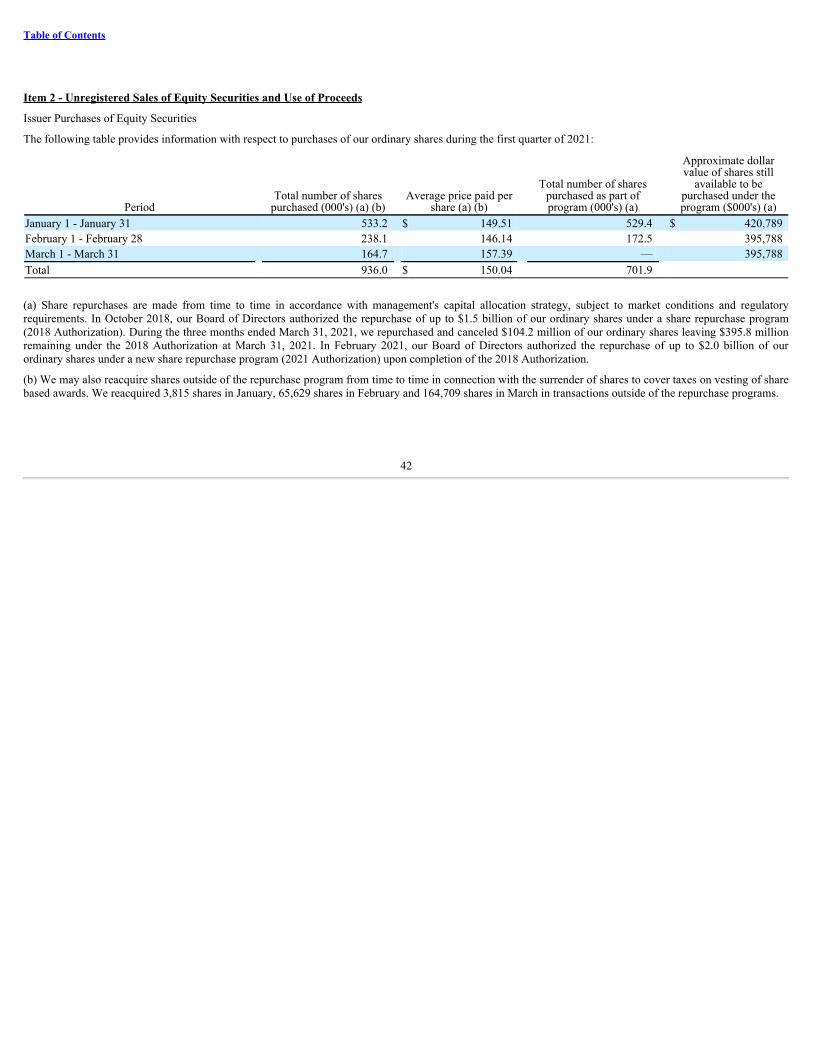
Table of Contents
Item 2 - Unregistered Sales of Equity Securities and Use of Proceeds
Issuer Purchases of Equity Securities
The following table provides information with respect to purchases of our ordinary shares during the first quarter of 2021:
PeriodTotal number of shares
purchased (000's) (a) (b)Average price paid per
share (a) (b)
Total number of sharespurchased as part ofprogram (000's) (a)
Approximate dollarvalue of shares still
available to bepurchased under theprogram ($000's) (a)
January 1 - January 31 533.2 $ 149.51 529.4 $ 420,789 February 1 - February 28 238.1 146.14 172.5 395,788 March 1 - March 31 164.7 157.39 — 395,788 Total 936.0 $ 150.04 701.9
(a) Share repurchases are made from time to time in accordance with management's capital allocation strategy, subject to market conditions and regulatoryrequirements. In October 2018, our Board of Directors authorized the repurchase of up to $1.5 billion of our ordinary shares under a share repurchase program(2018 Authorization). During the three months ended March 31, 2021, we repurchased and canceled $104.2 million of our ordinary shares leaving $395.8 millionremaining under the 2018 Authorization at March 31, 2021. In February 2021, our Board of Directors authorized the repurchase of up to $2.0 billion of ourordinary shares under a new share repurchase program (2021 Authorization) upon completion of the 2018 Authorization.
(b) We may also reacquire shares outside of the repurchase program from time to time in connection with the surrender of shares to cover taxes on vesting of sharebased awards. We reacquired 3,815 shares in January, 65,629 shares in February and 164,709 shares in March in transactions outside of the repurchase programs.
42

Table of Contents
Item 6 – Exhibits
(a) Exhibits
Exhibit No. Description Method of Filing
22.1 List of Guarantors and Subsidiary Issuers of Guaranteed Securities Filed herewith.
31.1 Certification of Chief Executive Officer Pursuant to Rule 13a-14(a) orRule 15d-14(a), as Adopted Pursuant to Section 302 of the Sarbanes-Oxley Act of 2002.
Filed herewith.
31.2 Certification of Chief Financial Officer Pursuant to Rule 13a-14(a) orRule 15d-14(a), as Adopted Pursuant to Section 302 of the Sarbanes-Oxley Act of 2002.
Filed herewith.
32 Certifications of Chief Executive Officer and Chief Financial OfficerPursuant to Rule 13a-14(b) or Rule 15d-14(b) and 18 U.S.C. Section1350, as Adopted Pursuant to Section 906 of the Sarbanes-Oxley Act of2002.
Furnished herewith.
101 The following materials from the Company’s Quarterly Report on Form10-Q for the quarter ended March 31, 2021, formatted in iXBRL (InlineExtensible Business Reporting Language): (i) the CondensedConsolidated Statements of Income (Loss) (ii) the CondensedConsolidated Statements of Comprehensive Income (Loss), (iii) theCondensed Consolidated Balance Sheets, (iv) the CondensedConsolidated Statements of Equity, (v) the Condensed ConsolidatedStatements of Cash Flows, and (vi) Notes to Condensed ConsolidatedFinancial Statements.
Filed herewith.
104 Cover Page Interactive Data File (embedded within the iXBRL documentand contained in Exhibit 101).
Filed herewith.
43

Table of Contents
TRANE TECHNOLOGIES PLC
SIGNATURES
Pursuant to the requirements of the Securities Exchange Act of 1934, the registrant has duly caused this report to be signed on its behalf by the undersignedthereunto duly authorized.
TRANE TECHNOLOGIES PLC(Registrant)
Date: May 5, 2021 /s/ Christopher J. KuehnChristopher J. Kuehn, Senior Vice President
and Chief Financial Officer Principal Financial Officer
Date: May 5, 2021 /s/ Heather R. HowlettHeather R. Howlett, Vice President
and Chief Accounting Officer Principal Accounting Officer
44
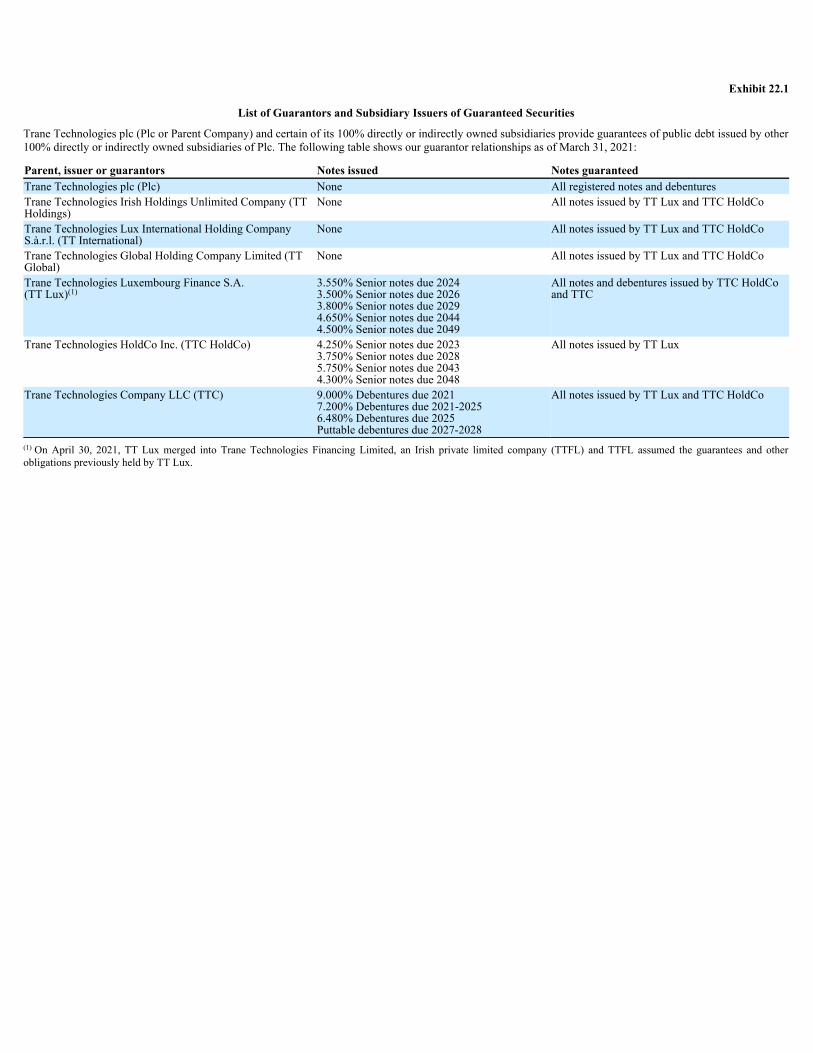
Exhibit 22.1
List of Guarantors and Subsidiary Issuers of Guaranteed Securities
Trane Technologies plc (Plc or Parent Company) and certain of its 100% directly or indirectly owned subsidiaries provide guarantees of public debt issued by other100% directly or indirectly owned subsidiaries of Plc. The following table shows our guarantor relationships as of March 31, 2021:
Parent, issuer or guarantors Notes issued Notes guaranteedTrane Technologies plc (Plc) None All registered notes and debenturesTrane Technologies Irish Holdings Unlimited Company (TTHoldings)
None All notes issued by TT Lux and TTC HoldCo
Trane Technologies Lux International Holding CompanyS.à.r.l. (TT International)
None All notes issued by TT Lux and TTC HoldCo
Trane Technologies Global Holding Company Limited (TTGlobal)
None All notes issued by TT Lux and TTC HoldCo
Trane Technologies Luxembourg Finance S.A.(TT Lux)
3.550% Senior notes due 2024 3.500% Senior notes due 2026 3.800% Senior notes due 2029 4.650% Senior notes due 2044 4.500% Senior notes due 2049
All notes and debentures issued by TTC HoldCoand TTC
Trane Technologies HoldCo Inc. (TTC HoldCo) 4.250% Senior notes due 2023 3.750% Senior notes due 2028 5.750% Senior notes due 2043 4.300% Senior notes due 2048
All notes issued by TT Lux
Trane Technologies Company LLC (TTC) 9.000% Debentures due 2021 7.200% Debentures due 2021-2025 6.480% Debentures due 2025 Puttable debentures due 2027-2028
All notes issued by TT Lux and TTC HoldCo
On April 30, 2021, TT Lux merged into Trane Technologies Financing Limited, an Irish private limited company (TTFL) and TTFL assumed the guarantees and otherobligations previously held by TT Lux.
(1)
(1)
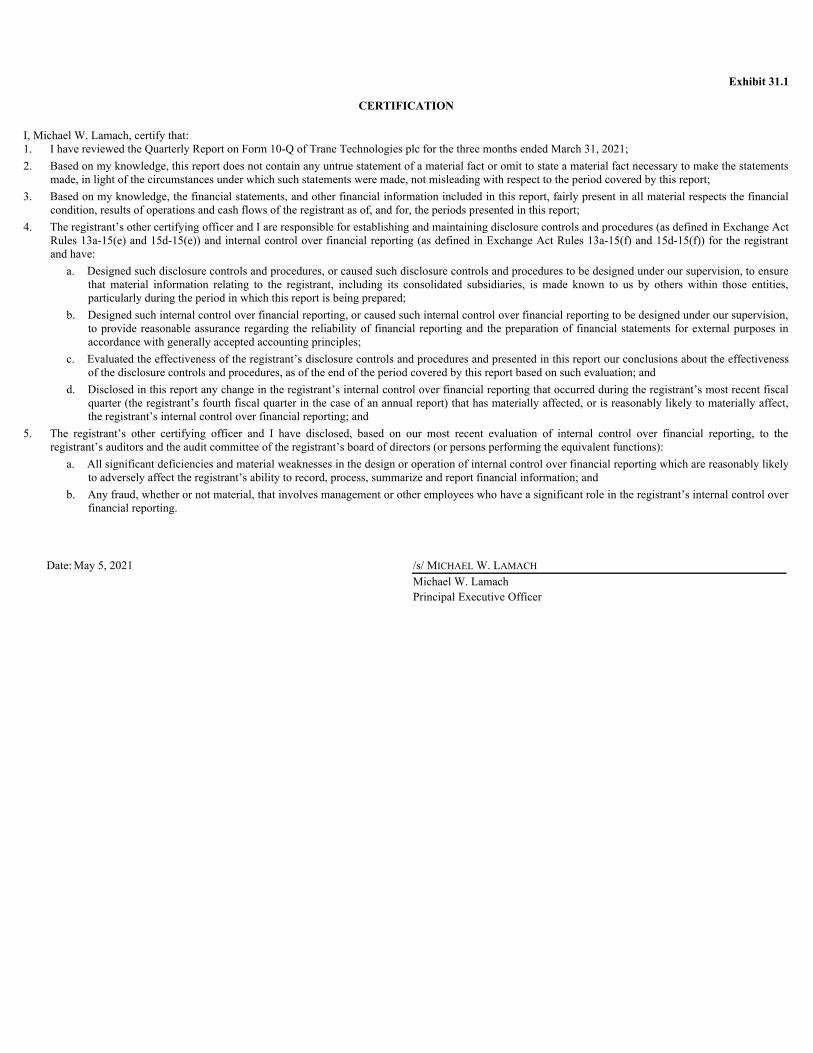
Exhibit 31.1
CERTIFICATION
I, Michael W. Lamach, certify that:1. I have reviewed the Quarterly Report on Form 10-Q of Trane Technologies plc for the three months ended March 31, 2021;2. Based on my knowledge, this report does not contain any untrue statement of a material fact or omit to state a material fact necessary to make the statements
made, in light of the circumstances under which such statements were made, not misleading with respect to the period covered by this report;3. Based on my knowledge, the financial statements, and other financial information included in this report, fairly present in all material respects the financial
condition, results of operations and cash flows of the registrant as of, and for, the periods presented in this report;4. The registrant’s other certifying officer and I are responsible for establishing and maintaining disclosure controls and procedures (as defined in Exchange Act
Rules 13a-15(e) and 15d-15(e)) and internal control over financial reporting (as defined in Exchange Act Rules 13a-15(f) and 15d-15(f)) for the registrantand have:
a. Designed such disclosure controls and procedures, or caused such disclosure controls and procedures to be designed under our supervision, to ensurethat material information relating to the registrant, including its consolidated subsidiaries, is made known to us by others within those entities,particularly during the period in which this report is being prepared;
b. Designed such internal control over financial reporting, or caused such internal control over financial reporting to be designed under our supervision,to provide reasonable assurance regarding the reliability of financial reporting and the preparation of financial statements for external purposes inaccordance with generally accepted accounting principles;
c. Evaluated the effectiveness of the registrant’s disclosure controls and procedures and presented in this report our conclusions about the effectivenessof the disclosure controls and procedures, as of the end of the period covered by this report based on such evaluation; and
d. Disclosed in this report any change in the registrant’s internal control over financial reporting that occurred during the registrant’s most recent fiscalquarter (the registrant’s fourth fiscal quarter in the case of an annual report) that has materially affected, or is reasonably likely to materially affect,the registrant’s internal control over financial reporting; and
5. The registrant’s other certifying officer and I have disclosed, based on our most recent evaluation of internal control over financial reporting, to theregistrant’s auditors and the audit committee of the registrant’s board of directors (or persons performing the equivalent functions):
a. All significant deficiencies and material weaknesses in the design or operation of internal control over financial reporting which are reasonably likelyto adversely affect the registrant’s ability to record, process, summarize and report financial information; and
b. Any fraud, whether or not material, that involves management or other employees who have a significant role in the registrant’s internal control overfinancial reporting.
Date: May 5, 2021 /s/ MICHAEL W. LAMACH
Michael W. Lamach Principal Executive Officer
Exhibit 31.2
CERTIFICATION
I, Christopher J. Kuehn, certify that:1. I have reviewed the Quarterly Report on Form 10-Q of Trane Technologies plc for the three months ended March 31, 2021;2. Based on my knowledge, this report does not contain any untrue statement of a material fact or omit to state a material fact necessary to make the statements
made, in light of the circumstances under which such statements were made, not misleading with respect to the period covered by this report;3. Based on my knowledge, the financial statements, and other financial information included in this report, fairly present in all material respects the financial
condition, results of operations and cash flows of the registrant as of, and for, the periods presented in this report;4. The registrant’s other certifying officer and I are responsible for establishing and maintaining disclosure controls and procedures (as defined in Exchange Act
Rules 13a-15(e) and 15d-15(e)) and internal control over financial reporting (as defined in Exchange Act Rules 13a-15(f) and 15d-15(f)) for the registrantand have:
a. Designed such disclosure controls and procedures, or caused such disclosure controls and procedures to be designed under our supervision, to ensurethat material information relating to the registrant, including its consolidated subsidiaries, is made known to us by others within those entities,particularly during the period in which this report is being prepared;
b. Designed such internal control over financial reporting, or caused such internal control over financial reporting to be designed under our supervision,to provide reasonable assurance regarding the reliability of financial reporting and the preparation of financial statements for external purposes inaccordance with generally accepted accounting principles;
c. Evaluated the effectiveness of the registrant’s disclosure controls and procedures and presented in this report our conclusions about the effectivenessof the disclosure controls and procedures, as of the end of the period covered by this report based on such evaluation; and
d. Disclosed in this report any change in the registrant’s internal control over financial reporting that occurred during the registrant’s most recent fiscalquarter (the registrant’s fourth fiscal quarter in the case of an annual report) that has materially affected, or is reasonably likely to materially affect,the registrant’s internal control over financial reporting; and
5. The registrant’s other certifying officer and I have disclosed, based on our most recent evaluation of internal control over financial reporting, to theregistrant’s auditors and the audit committee of the registrant’s board of directors (or persons performing the equivalent functions):
a. All significant deficiencies and material weaknesses in the design or operation of internal control over financial reporting which are reasonably likelyto adversely affect the registrant’s ability to record, process, summarize and report financial information; and
b. Any fraud, whether or not material, that involves management or other employees who have a significant role in the registrant’s internal control overfinancial reporting.
Date: May 5, 2021 /s/ CHRISTOPHER J. KUEHN
Christopher J. Kuehn Principal Financial Officer
Exhibit 32
Section 1350 CertificationsPursuant to Section 906 of the Sarbanes-Oxley Act of 2002
(Subsections (a) and (b) of Section 1350, Chapter 63 of Title 18, United States Code)
Pursuant to Section 906 of the Sarbanes-Oxley Act of 2002 (Subsections (a) and (b) of Section 1350, Chapter 63 of Title 18, United States Code), each of theundersigned officers of Trane Technologies plc (the Company), does hereby certify that to our knowledge:
The Quarterly Report on Form 10-Q for the three months ended March 31, 2021 (the Form 10-Q) of the Company fully complies with the requirements ofSection 13(a) or 15(d) of the Securities Exchange Act of 1934 and information contained in the Form 10-Q fairly presents, in all material respects, the financialcondition and results of operations of the Company.
/s/ MICHAEL W. LAMACHMichael W. LamachPrincipal Executive OfficerMay 5, 2021
/s/ CHRISTOPHER J. KUEHNChristopher J. KuehnPrincipal Financial OfficerMay 5, 2021