transat a.t.inc
TRANSCRIPT

Transat A .T. Inc .
Annual Repor t2003

Transat A.T. Inc. is an integrated company specializing in
the organization, marketing and distribution of holiday
travel. The core of its business consists of tour operators
in Canada and France. Transat is also involved in air trans-
portation and value-added services at travel destinations.
Finally, Transat has secured a dynamic presence in distri-
bution through travel agency networks.
Above all, Transat has a dedicated team of thorough and
efficient people who deliver quality vacation travel services
at affordable prices to a broad clientele. Already recognized
as a leader in Canada, Transat seeks to maintain its
position as a major player in the holiday travel indus-
try in North America and Europe by continuing to make
travellers its number one priority.

• Implementation of measures to mitigate the negative impact of the SARS outbreakthat disrupted the summer season.
• Revenue growth despite a decrease in the number of travellers.
• Restructuring of tour operator activities in Canada completed: greater efficiency and lower fixed costs.
• Launching of a new identity platform andstrengthening of branding.
• Successful sale of Anyway for proceeds of over $80 million.
• Implementation of a plan to renew Air Transat’s fleet, which will consist of 13 Airbus aircraft in 2004.
• Sound financial position and a clear strategic vision as the Corporation preparesfor growth.
H ighl ights

2 2003 Annual Report, Transat A.T. Inc.
Our organizat ionNorth America and Europe
Travel agencies anddistributionNorth America Europe
Outgoing tour operatorsNorth America Europe
Auratour
KilomètreVoyages
Rêvatours
VacancesAir TransatHolidays
World ofVacations/Nolitour
Brok’Air
LookVoyages
VacancesAir Transat(France)
Club Voyages
exitnow.ca
TravelPlus
Voyagesen Liberté
Club Voyages(France)

3 2003 Annual Report, Transat A.T. Inc.
Air transportationNorth America Europe
Air Transat
Handlex
Star Airlines
Incoming tour operators andservices at travel destinationsNorth America Europe
Air TransatHolidays USA
Cameleon
DMC Transat
JonviewCanada
Trafic Tours
Tourgreece

4 2003 Annual Report, Transat A.T. Inc.
Jean-Marc EustacheChairman of the Board, President and Chief Executive Officer
Message to shareholders

5 2003 Annual Report, Transat A.T. Inc.
Tra n s fo r m e d a n d rea dy fo r g ro w t h
As in 2002, the international tourism industry faced major challenges in 2003.But we had the stamina and the will to overcome these challenges, exceed our objectives and transform our organization. Furthermore, we accomplishedthis with great success, as we recorded satisfactory results and achieved most of our objectives.
Beyond the difficulties of the prevailing conditions, the main trends remainfavourable. According to the World Tourism Organization (WTO), there will be overone billion tourists in the world by 2010, compared with 700 million at present, andthese figures exclude domestic tourism. Several fundamentals can explain such aforecast: the general standard of living is improving; people have more leisure time, enjoy better health and are living longer, some of whose are retiring younger.As well, former totalitarian regimes are now freer, much to the benefit of tourism.
Transat ranks comfortably among the 10 largest tour operators in the world.Solidly established on both sides of the Atlantic, benefiting from a sound financialposition, having a structure which is better adapted and better prepared than everto manage the risks inherent in our industry, we are now able to focus on growthafter two years marred by exceptional events. Our objectives remain the same:maintain our leadership in Canada and our position as a major player in NorthAmerica and Europe.
Over the past two years, and especially in 2003, we transformed our organiza-tion and built a solid foundation to support its growth. We designed, planned andimplemented changes that are undoubtedly the most extensive since the groupwas created in 1987. Efficiency was of course improved—one of our objectivesindeed—but more importantly, we capitalized on the experience acquired in allareas to revamp our way of doing things based on our market strategies andgrowth objectives.

6 2003 Annual Report, Transat A.T. Inc.
In the spirit of transformation, we also accomplished much in terms of distribution. We began by simplifying our brand portfolio and consolidating ourvisual identity. We then clarified the hybrid aspect of our long-term distributionstrategy, which will draw on both travel agents and the Internet, not in parallel, butin a highly integrated manner. Our consolidation and strengthening efforts result-ed in the creation of a new entity, Transat Distribution Canada, which will overseethe integration of distribution operations and the fulfillment of our long-term strategy.
Of the four objectives set last year, three have been achieved or will be soon.We have significantly reduced our operating costs, finalized our fleet renewal plan,the execution of which will be completed within the next few months, and consoli-dated our tour operator and distribution activities. However, Look Voyages, ourmain French tour operator, again showed a loss in 2003, and a turnaround remainsa priority. We expect to achieve this by the end of 2005. Look Voyages is still a majorrecognized player in the French market, and a potential driving force behind ouroperations in Europe.
The winter of 2002-2003 generated growth and better results than the twoprevious years, but spring brought the war in Iraq and, in particular, the outbreak of Severe Acute Respiratory Syndrome (SARS) which ruined the summer season,frightened tourists and disrupted operations to such an extent that load factors andperformance were seriously affected. Thus, the number of travellers was down in 2003, but thanks to a highly aggressive supply management strategy, ourfinancial results were satisfactory. We ended the year with revenues of $2.1 billion,i.e. an increase of 1.1% over last year. Net income stood at $44.9 million ($1.27 pershare), compared with $9.8 million ($0.24 per share) in 2002. Included in this netincome in 2003 is an after-tax charge of $31.3 million related to our restructuringefforts due mainly to the write-off of a large portion of the Air Transat fleet. Asexplained later, we are making some major, very beneficial changes that entail the withdrawal of all our remaining Lockheed L-1011s, paving the way for a smaller,homogeneous fleet.

7
Maximizing shareholder value is clearly the fundamental objective at the baseof the strategic framework we have adopted. We believe this goal goes hand inhand with a corporate vision that focuses on customers, teamwork and discipline.These are the values we uphold and they are essential if we are to reduce costs,become more efficient, penetrate new markets and grow. In this manner, we will beable to meet shareholders’ expectations in terms of financial performance as wellas those of our employees, who also benefit from performance enhancement.
In terms of creating value, shareholders will note the year-end sale of Anyway,our French online agency, to IAC/InterActiveCorp, a world leader in online commerce that operates in particular in the travel industry under the Expediabrand. The value of this timely transaction amounted to about 53.8 million euros ($83.2 million).
Our financial position at the beginning of 2004 is sound; we are more efficiently organized and are focusing more than ever on our customers’ needs.Furthermore, market conditions for the winter season seem promising. With thisbackdrop, we decided to revamp our strategic plan. In Canada, we intend to bolsterour presence in the Ontario market; in Europe, our priority will be to solidify ourposition as the main vendor targeting Canada; and finally we will again look to the U.S. in order to become a truly North American player.
2003 Annual Report, Transat A.T. Inc.
Transat A.T. Inc. Board Committee Chairmen
H. Clifford Hatch Jr. Chairman
Corporate Governance and Nominating Committee
André Bisson, O.C.Chairman
Audit Committee
Jean-Marc EustacheChairman of the Board,
President and Chief Executive Officer
Jean GuertinChairman
Human Ressources and Compensation Committee

8 2003 Annual Report, Transat A.T. Inc.
Shareholders will note that, in accordance with the recommendations of theCanadian Institute of Chartered Accountants, the structure of our Management’sDiscussion and Analysis has changed in order to ensure greater transparency.
Where restructuring is involved, disruptions will occur. In this regard, I wouldlike to thank our staff and management team for their enthusiasm and openness.Together, we succeeded in transforming our organization, while continuing toensure daily operations during what, because of the SARS outbreak, was one ofthe most challenging years ever. Overall, we had a very good year. I would also like to thank our dedicated directors who, as always, performed their duties toshareholders most diligently.
Jean-Marc Eustache
Chairman of the Board,
President and Chief Executive Officer
February 4, 2004

9
T h e B o a rd o f D i re c to r s o f Tra n s a t A . T. I n c .
(from left to right)
Philippe SureauHelen K. SinclairJacques SimoneauPeter G. WhiteBenoît DeschampsJean-Marc EustacheJohn D. ThompsonJean GuertinMarcel GagnonLina De CesareAndré Bisson, O.C.H. Clifford Hatch Jr.
2003 Annual Report, Transat A.T. Inc.

10 2003 Annual Report, Transat A.T. Inc.
Review of our operat ionsNorth America
Travel agenciesand distribution
Outgoing tour operators
Air transportation
Incoming tour operatorsand services
at travel destinations

1 1
U n i f i e d a n d co n v e rg i n g s t ra te g y
In Canada, the structure defining the relationship between our main touroperators and Air Transat was completely revamped. Our strategy changedfrom one based on coordinating several profit centres to an organic, truly integrated approach that focuses on improving business performance andreducing costs throughout the organization. In concrete terms, a new struc-ture, Transat Tours Canada, emerged in 2002, and helped centralize a numberof support functions and significantly improve efficiency. Transat Tours Canadaprimarily plays a strategic role, since a single management team is nowresponsible for positioning our various brands and carrying out a large part ofthe marketing activities of our main tour operators and Air Transat. Soon afterall these changes, we also reorganized the operations of our tour operator,Americanada, some of which have been combined with other divisions.
This structural reform resulted in some very substantial changes in our way of doing business. It can even be said that it paved the way for an important shift in our organizational culture. Also, and above all, it aims at quickly and sub-stantially improving our profit margins. The tangible results of these efforts wereimmediately obvious. Fixed costs dropped by an estimated $3 million annually, and efficiency improved significantly. Our new structure allows for much moreeffective inventory management, whether in terms of hotel rooms or airline seats,and we believe that lower fixed costs are just the tip of the iceberg. Transat ToursCanada has surpassed its financial objectives for 2003.
Transat remains well-positioned in all major regions of Canada and continues to expand its presence with a more extensive product offering. In hopes of intro-ducing their products to new markets, both our main tour operators, Air TransatHolidays and World of Vacations/Nolitour, signed a two-year agreement withWestJet Airlines at the end of 2003. It provides for the chartering of Boeing 737sfrom medium-size Canadian cities to southern destinations. Air Transat’s fleet,which consists of wide-body aircraft, cannot effectively tend to the 26 Canadiancities currently served by WestJet. The agreement, which involves about 120,000seats, represents a winning formula for both organizations and, above all, for our clientele.
2003 Annual Report, Transat A.T. Inc.

12 2003 Annual Report, Transat A.T. Inc.
S t ro n g e r b ra n d
Our street presence and our various points of contact with the traveller,whether in Canada or in France, is a key reflection of our vertical integration strat-egy, which is now more pronounced than ever. In 2003, our brands and our identityplatform were standardized to capitalize on this important asset. Through stand-ardization, our marketing and communications investments will be channelledtoward the same objective, i.e. the creation of a strong image that is recognizablein a number of markets.
As a determining factor in our growth strategy, our new corporate signaturewill gradually be extended to travel agencies, tour operators and Air Transat. Ourtravel agencies are now united under the TravelPlus and Club Voyages brands, andmost signs already feature our new signature. Certain entities in the group willretain a separate identity for strategic reasons.

13
C l ea r d i s t r i b u t i o n s t ra te g y
Transat plans to pursue a hybrid distribution strategy that combines tradi-tional travel agencies and the Internet. Although online transactions are gaining inpopularity around the world and our industry is on the cutting edge in this regard,many customers prefer dealing directly with a travel agent and using the Internetfor information only. That being said, the Internet can play an extremely useful role in initiating and maintaining relations between travel agents and customers. Itcan also offer a wide range of business-related applications and management tools that can add value for travel agents.
Not only are these solutions flexible in meeting the expectations of both cus-tomers and travel agents, they can also reduce transaction costs significantly andbe profitable and efficient for everyone, including the customer.
This is why our distribution strategy includes two interdependent objectives:increase the number of travel agencies under our control, particularly in the major cities, while franchising is preferred elsewhere, and pursue online solutions.Because we became involved early in the online distribution market, the experi-ence we acquired has paid off as shown in exitnow.ca’s technological platform,which is the cornerstone of our online operations.
2003 Annual Report, Transat A.T. Inc.
exitnow.ca

14 2003 Annual Report, Transat A.T. Inc.
A l l -A i r b us f l e e t
Air Transat remained the leading charter carrier in Canada in 2003, carrying closeto approximately 2.5 million passengers to some 90 destinations in 25 countries.During the winter season, the airline served over 50 destinations in 25 countries, flying primarily to southern or other sunshine destinations. In the summer, Air Transatshifts most of its capacity to Europe, while maintaining flights to southern destina-tions. In 2003, Air Transat offered direct flights to some 30 cities in over 20 countriesin Europe.
Beginning in the 2004 summer season, Air Transat will have 13 aircraft. Its six Lockheed L-1011-500s will be retired by the spring of 2004 and replaced by four Airbus A310s. The fleet will then consist only of wide-bodied long-haul Airbus aircraft (four A330s and nine A310s) and will be one of the youngest in Canada.These changes will mean that capacity is better adjusted to the size and nature of the market. But more importantly, they will reduce operating costs substantially.
Our operations will be transferred to Montréal-Pierre Elliott Trudeau Interna-tional Airport, in November 2004, so that we can be fully operational there for thebeginning of the 2005 winter season. We reached a satisfactory agreement withAéroports de Montréal (ADM), and facilities suited to our needs will be built in 2004.Many of our customers will be pleased about the move to a more accessible airportwhere Air Transat will rank second in terms of the number of flights, and first interms of the number of international destinations.
Air Transat’s priorities for 2004 are very clear: continue to reduce costs, ensurethe orderly transition to an all-Airbus fleet and prepare to transfer operations toMontréal-Pierre Elliott Trudeau International Airport. The Corporation will alsofocus on customer service training and is currently looking into various adjust-ments to in-flight service.

15
The past year was an eventful one for Air Transat due mainly to the SARS crisis. Special security measures had to be implemented to prevent the virus fromspreading, such as disinfecting aircraft daily, special training for the flight crews andthe provision of special health kits on board. In addition, the impact of SARS on aircraft load factors had to be actively managed. Despite the relatively tumultuousenvironment, Air Transat had a remarkable year particularly in terms of costs, on-time performance and customer service.
During the 2003 winter season, Star Airlines and Air Transat will exchange aircraftunder a mutually beneficial agreement: Star Airlines will add a wide-bodied aircraft(Airbus A330) to its fleet and Air Transat will operate two Airbus A320s, which aresmaller aircraft with a range that is perfectly suited to the airline’s winter destinations.
Air Transat was designated as a scheduled carrier in Mexico, a status that itholds in 12 other countries. This designation allows us to market seats directly totravel agencies through Global Distribution Systems, to sell seats on the Internetand to enter into agreements with other carriers to offer connecting flights. In short,because of this status, the airline has flexibility in terms of distribution and can also transport freight between Europe and Canada.
2003 Annual Report, Transat A.T. Inc.
Airbus A330
Airbus A310

16 2003 Annual Report, Transat A.T. Inc.
C rea t i n g va l u e t h ro u g h v e r t i c a l i n te g ra t i o n
Incoming tour operators offer products at travel destinations, such as coachtours, and subsequently market them abroad. In Canada, Transat ranks first amongincoming tour operators thanks to Jonview Canada and DMC Transat. The SARSoutbreak made 2003 a difficult year for these tour operators as Canada becametemporarily less attractive as a destination, particularly for its traditional clientelefrom Europe. However, immediate action was taken to limit the damage andremain profitable in 2003. Jonview Canada’s clientele is mainly European, fromFrance, the United Kingdom, Germany, Italy, Switzerland, the Netherlands andBelgium, as well as Japanese. DMC Transat, whose coach tour sales also declined,continues to promote its products in new markets. It is also developing new prod-ucts, such as snowmobile tours, a market segment with good growth potential, as well as pre- and post-convention tours.

17 2003 Annual Report, Transat A.T. Inc.
We still firmly believe that incoming tour operations, hotel management andservices at travel destinations are important factors that can contribute to growthand improve profit margins. They are an integral part of our long-term strategy. In 2004, we expect to complete to 100% our acquisition of Jonview Canada, by exercising a call option in this regard. We also intend to take advantage of oppor-tunities in other countries where transactions could further grow and expand ourmarket presence.
Guides
Tours
Animation

18 2003 Annual Report, Transat A.T. Inc.
Travel agenciesand distribution
Outgoing tour operators
Air transportation
Incoming tour operatorsand services
at travel destinations
Review of our operat ionsEurope

19
A c h a n g i n g p ro d u c t o f fe r i n g
In France, Vacances Air Transat (France) was severely affected by the SARS crisis.While a record year appeared to be taking shape, the organization had to move intocrisis management mode in just a few weeks. For a long time now, Vacances AirTransat (France) has successfully been expanding its product offering, and thiscushioned the effects of the SARS crisis. Always major long-haul destinations forthe French and Transat, Canada and North America generally have less and lessimpact on our sales as Vacances Air Transat (France) launches new products.
Consequently, we are now well established as a long-haul carrier to other destinations such as the Caribbean, Mexico, Cuba, Latin America and Asia. Globaltourist figures indicate that Asian destinations are increasingly competitive and areexpected to take on even more strategic importance, at least in Europe. VacancesAir Transat (France) is thus successfully becoming a long-haul specialist in the Frenchmarket, in cooperation with numerous other airlines. For example, while VacancesAir Transat (France) met 80% of its seat requirements through Air Transat six or sevenyears ago, that number has tumbled to about 30% today.
2003 Annual Report, Transat A.T. Inc.

20 2003 Annual Report, Transat A.T. Inc.
Look Voyages continues to be a dependable tour operator and brand in theFrench market. It had a difficult year due to intense competition and less than opti-mal economic conditions. However, a turnaround has begun primarily with a majorchange in its offering.
We first repositioned its flagship product, the Lookéa Clubs, that had lostground as a result of prices being too high.
A new hotel product, called Lookéko, was also launched. Lookéko is based onindividual agreements with various hotels, and calls for a very aggressive pricingstrategy, as price remains the most important criterion for tourists in France as wellas elsewhere.
Look Voyages, a recognized tour operator to some 800 destinations, madesome major changes in this regard. Look Voyages will focus on destinations whereit holds substantial volumes; it will concentrate on packages and air-only on char-ter flights; it will significantly reduce its exposure to air-only on regular flights, whichhad represented roughly half its business recently.
Look Voyages eliminated a number of jobs and changed its managementteam in 2003. Although much still has to be accomplished in order to return to prof-itability, it has already made considerable progress in this regard.
The accomplishments in France and Canada in 2003 reflect our spirit of transformation and our eagerness to acquire what it takes to be the industrybenchmark. Some changes are tangible from outside, but most are not. However,they all have one thing in common—they are all, without exception, designed to improve our performance to meet the expectations of customers and share-holders alike.

21
Canada
France
Outgoing tour operators 2003 2002
Tour operators under the Revenues ($) 1,433,000,000 1,402,000,000Transat Tours Canada* banner and Employees 2,608 2,854
the airline company Air Transat Passengers1 2,571,000 2,845,000* Air Transat Holidays and World of Vacations/Nolitour
Travellers2 905,000 931,000
Americanada Revenues ($) 20,000,000 37,000,000Employees — 189
Rêvatours Revenues ($) 14,000,000 12,000,000Employees 25 27Travellers 5,000 4,000
Travel agencies and distribution Consultour / Exit Travel Revenues ($) 20,200,000 10,300,000
Outlets owned 27 30Employees 225 252Outlets franchised 182 201
Other airline servicesHandlex Revenues ($) 25,000,000 23,000,000
Employees 861 792
Incoming tour operators andservices at travel destinations
Jonview Canada Revenues ($) 77,000,000 79,000,000Employees 121 141Travellers 265,000 161,000
DMC Transat Revenues ($) 21,000,000 20,000,000Employees 38 40Travellers 31,000 36,000
Air Transat Holidays USA Revenues ($) 6,100,000 6,200,000Employees 19 21
Outgoing tour operatorsVacances Air Transat (France) Revenues (C) 102,000,000 97,000,000
Employees 160 155Travellers 77,000 82,000
Look Voyages Revenues (C) 235,000,000 292,000,000Employees 409 486Passengers 740,000 1,030,000Travellers 140,000 160,000
Brok’Air Revenues (C) 38,000,000 31,000,000Employees 14 26
Travel agencies and distribution Anyway Revenues (C) 8,300,000 6,400,000
Employees — 111
Club Voyages (France) Revenues (C) 8,600,000 8,300,000Employees 178 226Outlets 63 63
1 Airlines record flight segments in terms of passengers.2 Tour operators record round-trip travellers.
2003 Annual Report, Transat A.T. Inc.

22 2003 Annual Report, Transat A.T. Inc.
F I N A N C I A L H I G H L I G H T S
(in thousands of Canadian dollars) 2003 2002 Variance Variance
$ $ $ %
Consolidated statements of income
Revenues 2,096,649 2,073,508 23,141 1.1Restructuring charge 47,972 — N/A N/AGain on disposal of Anyway,
net of related taxes of $18,775 53,101 — N/A N/AMargin1 74,962 74,148 814 1.1Net income (loss) (continuing operations) (9,147) 11,678 (20,825) (178.3)EPS (LPS) – Basic (continuing operations) (0.38) 0.30 (0.68) (226.7)EPS (LPS) – Diluted (continuing operations) (0.38) 0.30 (0.68) (226.7)
Consolidated balance sheets
Cash and cash equivalents 349,125 260,123 89,002 34.2Debt (short term and long term) 65,331 130,546 (65,215) (50.0)Total debt2 595,249 757,646 (162,397) (21.4)Net debt3 352,297 598,823 (246,526) (41.2)
Consolidated statements of cash flows
Operating activities (continuing operations) 71,697 183,234 (111,537) (60.9)
1 Revenues less operating expenses (non-GAAP financial measure used by management as an indicator to evaluate ongoing and recurring operational performance).
2 Debt plus off-balance sheet arrangements presented on p. 37 (non-GAAP financial measure used by management to assess theCorporation’s future liquidity requirements).
3 Total debt less cash and cash equivalents not in trust or otherwise reserved (see note 4 of the audited consolidated financial statements) (non-GAAP financial measure used by management to assess its liquidity position).
This Management’s Discussion and Analysis (“MD&A”) has been restructured and is guided by the guidelines intro-duced by the Canadian Institute of Chartered Accountants (“CICA”). The MD&A provides a review of Transat A.T. Inc.’s opera-tions, performance and financial condition for the year ended October 31, 2003 compared with October 31, 2002 and shouldbe read in conjunction with the audited consolidated financial statements and notes thereto beginning on page 45. ThisMD&A also contains certain forward-looking statements with respect to the Corporation. These forward-looking state-ments, by their nature, necessarily involve risks and uncertainties that could cause actual results to differ materially from thosecontemplated by these forward-looking statements. We consider the assumptions on which these forward-looking state-ments are based to be reasonable, but caution the reader that these assumptions regarding future events, many of which arebeyond our control, may ultimately prove to be incorrect since they are subject to risks and uncertainties that affect us. Youwill find elsewhere in our MD&A certain risks and uncertainties affecting us. The information contained herein is dated as ofFebruary 4, 2004.
We prepare our financial statements in accordance with Canadian generally accepted accounting principles (“GAAP”).We will occasionally refer to non-GAAP financial measures in the MD&A. These non-GAAP financial measures do not haveany meaning prescribed by GAAP and are therefore unlikely to be comparable to similar measures presented by other issuers. All dollar figures are in Canadian dollars unless otherwise indicated. Where we say “Transat,” “we,” “us,” “our” or the“Corporation,” we mean Transat A.T. Inc. and its subsidiaries, unless otherwise indicated.
Management’s discussion and analysis

23 2003 Annual Report, Transat A.T. Inc.
The MD&A is divided into the following sections:
■ OVERVIEW describes the holiday travel industry in general as well as our
business, our strategies and objectives along with the performance drivers and
resources required to successfully implement these strategies and achieve our
objectives.
■ CONSOLIDATED OPERATIONS provides information and analysis about
our performance in 2003 compared with our 2003 objectives and with actual
2002 results.
■ LIQUIDITY AND CAPITAL RESOURCES describes the source and use of
our funds in 2003 compared with 2002 and how we manage our financial
condition and capital resources.
■ ACCOUNTING CHANGES and FUTURE ACCOUNTING CHANGESdiscusses the changes made to our accounting policies in 2003 and the changes
required in 2004.
■ RISKS AND UNCERTAINTIES provides an overview of the key risks and
uncertainties that could affect us.
■ OUTLOOK provides a discussion of the future prospects for Transat in
fiscal 2004.

24 2003 Annual Report, Transat A.T. Inc.
OVERVIEW
IndustryThe holiday travel industry is composed mainly of tour operators, travel agencies (traditional
and online) and air carriers specializing in charter services.Tour operators specialized in outgoing services purchase the various components of a trip
and sell them to the consumer through the services of travel agencies, either as a travel package or separately. Certain tour operators specialize as incoming tour operators, making arrangements forforeign tourists at their destinations.
Travel agencies are the intermediary between the tour operator and the consumer. Travelagents meet with, advise and sell to the consumer. Travel agencies sell travel packages and planetickets offered by tour operators, plane tickets sold directly by airline carriers and other travel prod-ucts and services. Online travel agencies now offer a large range of travel products by way of trans-actional Web sites on the Internet. Currently in both North America and Europe, online travel salesare mostly made up of air-only tickets, with just a small proportion made up of packages (includingair and hotel). Sales of online packages, however, are expected to grow.
Air carriers provide their services to travel agencies and tour operators. These carriers areknown as “scheduled” when they sell their services directly to the public and to travel agencies andas “charter” when they sell their seats in blocks to tour operators.
Generally speaking, air carriers specialized in charter services are active in the holiday travelmarket, whereas scheduled carriers rely mainly on the business travel segment.
BusinessTransat is one of the largest fully integrated holiday package and travel service providers of
international scope in North America. We conduct our activities in a single industry segment, name-ly holiday travel, and we operate in two geographic areas, specifically Canada and France.
Transat’s core business is based on holiday travel packages and charter flights. We operate as both an outgoing and incoming tour operator by bundling products and services bought inCanada and abroad for resale in Canada, France and elsewhere principally through travel agencies,some of which we own. We operate one charter airline company in Canada and own a participationof 44.3% in another charter airline company in France and we also provide destination and hotelmanagement services.

25
StrategyTransat’s objectives are to maintain its leadership in Canada and to maintain its position as a
major player in the holiday travel industry in North America and Europe. We have based our devel-opment strategy on the vertical integration of the major components of holiday travel. The Corpo-ration’s tour operators and travel agencies benefit from the availability of seats on its own air carriers.This strategy encourages synergies, ensures reciprocal loyalty between the levels of operations andpermits better quality control of the Corporation’s products and services. This also allows us moreflexibility to adjust prices, products and services offered by the different levels of operations, there-by enhancing our ability to operate profitably.
This strategy has led the Corporation to acquire, or to invest in, outgoing tour operators andtravel agencies in Canada and France while continuing its air carrier services, as well as acquire,invest in or create incoming tour operators and travel services at destination and to create a hotelmanagement subsidiary with the mission to manage hotels based on the needs of the Corporation’stour operators.
The Corporation’s long-term growth strategy involves focusing on its core business: holiday travel and its related products. We also plan to expand geographically into new and existingmarkets with high profitability potential and continue to leverage vertical integration.
Our strategy is focused on maximizing shareholder value.
2004 ObjectivesThe actions taken in fiscal 2003 have set the stage for us to deliver cost reductions, operational
efficiencies and profitable products and services. To continue to build on this momentum, we haveset the following objectives for fiscal 2004:
• Return Look Voyages to profitability in 2005. As a result, we expect to reduce the lossesat Look Voyages in 2004. Significant changes took place at Look Voyages in 2003, includ-ing a change in the management team. In 2004, a focus on fewer air-only destinations andthe introduction of more packaged products for sale are expected to reduce our losses in2004, thus beginning a turnaround that is anticipated to return Look Voyages to profitability in 2005.
• Pursue Internet technology integration into our business model. Effective yield management and the integration of B2B platforms are expected to boost revenues andgenerate savings for our tour operators and distribution channels, thereby increasing ouroperating margins.
• Leverage flexibility gains and continue to lower costs at the airline company. The consolidation of our Canadian tour operators and distribution activities is expected to resultin better yield management, i.e. better management of our inventory of products such as airline seats and hotel rooms resulting in increased operating margins. These higher mar-gins, coupled with a continued focus on reducing airline-related costs with our smallerreduced fleet, are expected to enhance our profitability.
• Reposition our brand in the marketplace to support our vertical integration strategy.The launch of the Corporation’s new corporate logo will facilitate recognition of the variouscompanies by our customers and employees.
• Identify growth opportunities in North America and France. We will develop a list ofpotential growth opportunities for 2004 and beyond.
2003 Annual Report, Transat A.T. Inc.

26 2003 Annual Report, Transat A.T. Inc.
Key performance driversThe following key performance drivers are essential to the successful implementation of our
strategy and achievement of the objectives we set out for ourselves.Market share Be the leader in Canada in all provinces and increase market share
in holiday travel packages in France.
Cost reduction Reduce costs by $12.0 million to $14.0 million in 2004 and $20.0 millionin 2005.
Margin Produce margins between 3.8% and 4.4% in 2004.
Capability to deliver resultsOur ability to deliver on the objectives we set out for ourselves is dependent on our
financial and non-financial resources, both of which have contributed to the success of our strate-gies and the attainment of our objectives in the past.
Our financial resources include:Cash Our cash balances that are not held in trust or otherwise reserved
totalling $243.0 million as at October 31, 2003 are strong, and ourcontinued focus on expense reductions is expected to maintain these cash balances at healthy levels.
Lines of credit Our existing lines of credit will enable us to access up to $73.5 million in 2004.
Our non-financial resources include:Corporate We recently announced our new corporate logo with the intention identity of creating a strong, visible and easily recognizable link between the
various companies that form our Corporation.
Structure Our vertically integrated structure enables us to ensure better qualitycontrol of our products and services.
Relationship We have exclusive access to certain hotels in the Caribbean as wellwith suppliers as over 15 years of privileged relationships with many hotels in Europe
and in the Caribbean.
Employees Our employees are committed to working together as a team to ensure overall customer satisfaction. The founders of our Corporation are still part of this team of committed employees.
Transat has the resources required to meet the objectives it set out for itself in 2004 and to continue to build on its long-term strategies.

27
CONSOLIDATED OPERATIONS
Comparison of 2003 objectives with 2003 performanceIn 2003, Transat set itself various objectives. Listed below are our 2003 objectives along with
the 2003 performance, which we will discuss in more detail along with our analysis of the 2003 fiscal year throughout the MD&A.
Focus on cost reductions• Reorganized our activities in Canada and France, resulting in the elimination of over
700 positions.• Approved a plan to phase out the use of the six Lockheed L-101 1-500s, thereby reducing
operating expenses.Improve profitability in our French operations• French operations were negatively affected by Look Voyages, whose losses continued to rise
in 2003. Although this objective was not achieved in 2003, we initiated an action plan and weremain committed to returning Look Voyages to profitability. We anticipate that this will onlyoccur in 2005, however.
Undertake a review of our aircraft fleet• Reviewed the fleet, resulting in a plan to phase out the remaining six Lockheed L-101 1s by
April 30, 2004 and add four Airbus A310s by June 2004.Consolidate our tour operator and distribution activities in Canada• Consolidated the management of our back office (including the management of airline seats
and hotel rooms) and administrative functions for all brands, resulting in multiple brandsbeing administered by one management team focused on better yield management, result-ing in better operating margins.
Geographic Business AreasRevenuesYears ended October 31 2003 2002 Variance Variance(in thousands of dollars) $ $ $ %
Canada 1,525,846 1,494,976 30,870 2.1France and other 570,803 578,532 (7,729) (1.3)Total 2,096,649 2,073,508 23,141 1.1
2003 Annual Report, Transat A.T. Inc.
Geographic segmentation of revenues(continuing operations)
CanadaEurope
2003 2002
Canada 72.8% 72.1%Europe 27.2% 27.9%

28 2003 Annual Report, Transat A.T. Inc.
We derive our revenues from outgoing tour operators, air transportation, travel agencies and distribution, incoming tour operators and services at travel destinations.
The overall increase in revenues is due to growth of 2.1% in revenues in Canada, partially offset by a 1.3% decrease in revenues in our French operations. Despite this overall increase in revenues, however, the total number of travellers declined by 4.4% compared with 2002. This 4.4%decline is the result of a 2.6% decrease in the number of travellers in Canada and an 1 1.3% decreasein the number of travellers in France. The overall revenue growth is therefore mostly due to priceincreases and the effect of foreign exchange on our French operations.
We expect the overall number of travellers to climb in 2004, resulting in an increase in revenues compared with 2003.
Operating expensesYears ended October 31 2003 2002 Variance Variance(in thousands of dollars) $ $ $ %
Canada 1,435,190 1,416,686 18,504 1.3France and other 586,497 582,674 3,823 0.7Total 2,021,687 1,999,360 22,327 1.1
Our operating expenses consist mainly of direct costs, payroll, commissions, fuel, maintenance, handling costs and aircraft rental.
Direct costs include the cost of the various components of a trip to be sold to the consumerthrough travel agencies and incurred by our tour operators. They include the costs of blocks of seats or complete flights mainly from third-party air carriers as well as the cost of hotel rooms. In 2003, these costs made up approximately 50% of our total direct costs, up from approximately48% in 2002.
Commissions include the cost paid by tour operators to travel agencies for their services as intermediaries between them and the consumer.
Maintenance costs relate mainly to the engine and airframe overhaul expenses incurred by Air Transat.
Aircraft rental made up approximately 3.3% of our total expenses, compared with 3.6% in 2002.The overall growth in our operating expenses is due to a 1.3% increase in expenses in Canada,
and a slight increase in expenses in our French operations. This overall growth was primarily due tohigher direct costs and the effect of foreign exchange on our French operations.
Approximately 30% to 35% of our operating expenses are payable in U.S. dollars. We did not fullybenefit from the strengthening Canadian dollar, however, due to our hedging program.
As a result of our restructuring efforts, we expect our total operating expenses to fall by $12.0 million to $14.0 million in 2004.
Source of revenues(continuing operations)
20032002
Other 1.4%1.5%
Western 14.7%Canada 12.9%
Quebec 26.3%25.3%
France 27.2%27.9%
Ontario 30.4%32.4%

29
CanadaCanada — Winter seasonYears ended October 31 2003 2002 Variance Variance(in thousands of dollars) $ $ $ %
Revenues 976,336 819,108 157,228 19.2Operating expenses 921,857 781,191 140,666 18.0Margin 54,479 37,917 16,562 43.7Margin (%) 5.6% 4.6% 1.0 ppt* 21.7* ppt: percentage point
In Canada, revenues rose in the winter season due mostly to an 1 1.6% increase in the numberof travellers as well as to higher prices compared with 2002.
Operating expenses were up mostly due to increases in direct costs as a result of businessactivity.
For the current winter season, our margins stood at 5.6%, up from 4.6% in 2002. This growthis due to the first half of our winter season which witnessed increases in both travellers and pricesbeing offset by the second half of our winter season which had more last-minute bookings as aresult of the uncertainty created by the war in Iraq and to the overcapacity in the marketplace.
If current trends are maintained, the 2004 winter season is expected to be better than 2003.Bookings are up and there appears to be a desire to travel despite the continued terrorist threats.
Canada — Summer seasonYears ended October 31 2003 2002 Variance Variance(in thousands of dollars) $ $ $ %
Revenues 549,510 675,868 (126,358) (18.7)Operating expenses 513,333 635,495 (122,162) (19.2)Margin 36,177 40,373 (4,196) (10.4)Margin (%) 6.6% 6.0% 0.6 ppt 10.0
During the summer season in Canada, the number of travellers dropped by over 19% resultingin a 18.7% decrease in revenues. This decrease is attributable to the effects of SARS, which had a significantly negative impact at a very crucial time. The second half of the summer season sawprices rise, partially offsetting decreased revenues. Our cost reduction efforts began to materializeas well during the second half of the summer season.
It is too early to tell what the 2004 summer season will be like, but we expect to see more travellers than in 2003.
In fiscal 2003, we reviewed our tour operator and distribution activities as well as the aircraftfleet in Canada in order to identify operational efficiencies and other cost-saving opportunities.These reviews led to the implementation of a variety of initiatives.
On April 7, 2003, we announced the reorganization of the operations of one of our Canadiantour operators for the purpose of placing its product lines in a business setting that provides it withan opportunity for profitable development. This resulted in the termination of some 150 employees.
On May 5, 2003, we announced further staff reductions of approximately 500 employees atour airline subsidiary and other Canadian tour operators. The slowdown in demand in the tourismindustry as a whole due to the war in Iraq, continued terrorist threats and the negative impact ofSARS as well as the overcapacity in the marketplace led us to continue to reorganize our opera-tions and reduce costs. This resulted in a significant reduction of our capacity. Two of the aircraftleases in our fleet were not renewed in April 2003, resulting in a 10% reduction in capacity.Additionally, we reduced another 15% of our capacity primarily as a result of the SARS crisis.
2003 Annual Report, Transat A.T. Inc.

30 2003 Annual Report, Transat A.T. Inc.
Moreover, we announced a two-year partnership agreement with WestJet Airlines Ltd.(“WestJet”) on August 20, 2003 to charter WestJet’s aircraft to southern vacation destinations.During the first season of fiscal 2004 (November to April), the contract is worth an estimated $29.0 million and represents approximately 8% of our total winter capacity. With this partnershipagreement, we will be able to broaden our service offerings in new markets and better serve ourexisting customers.
Finally, on September 1 1, 2003, we announced the implementation of a plan to phase out theuse of our six Lockheed L-101 1-500s by April 30, 2004. This plan, which originated with our commit-ment to review our fleet earlier in the year, was significantly affected by the events discussed above.Three of these aircraft ceased operations by October 31, 2003, with the remaining three ceasingoperations by April 30, 2004. As a result, we will add an Airbus A310 in each of the months ofFebruary, May and June of 2004, along with an additional Airbus during fiscal 2004 as backup. Thiswill harmonize our fleet and reduce our operating expenses, since we will be left with only twotypes of aircraft. This plan resulted in a charge of $33.7 million before taxes related to the aircraftbeing phased out as part of our restructuring charge. There will also be accelerated depreciation onthe remaining Lockheed L-101 1-500 aircraft that will be used until April 30, 2004, in the amount ofapproximately $6.0 million before taxes.
The result of these events is the development of a restructuring program, which will be discussed elsewhere in the MD&A.
On January 26, 2004, we announced that Transat and Aéroports de Montréal (“ADM”) reachedan agreement that paves the way for our airline’s move to Montréal-Pierre Elliott Trudeau Interna-tional Airport beginning next November. The move will not affect the airline’s cost structure.
In 2004, we will acquire the balance of the shares of Jonview Canada at a price to be deter-mined based on the average earnings realized during two of the three best years prior to the acquisition.
FranceFrance — Winter seasonYears ended October 31 2003 2002 Variance Variance(in thousands of dollars) $ $ $ %
Revenues 271,562 246,365 25,197 10.2Operating expenses 280,796 254,326 26,470 10.4Margin (9,234) (7,961) (1,273) (16.0)Margin (%) (3.4%) (3.2%) (0.2) ppt (6.3)
In Europe, foreign exchange had a significant impact on our operations.In Canadian dollars, we saw increases in both revenues and operating expenses in the 2003
winter season compared with 2002.
Revenues by season(continuing operations)
(in millions of dollars)
Winter seasonSummer season
2003 1,248
849
2002 1,065
1,008

31
However, denominated in euros, revenues and expenses remained relatively flat or decreasedslightly when the two years are compared, resulting in negative margins for the winter season. Theoverall loss in Europe was due to Look Voyages. The number of travellers remained relatively flatwhen both years are compared, however. The overall variance therefore in Canadian dollars is dueto the impact of exchange rates.
In Europe, the 2004 outlook is mixed. We expect long-haul travel from Europe to Caribbeandestinations (travel packages) to do well but air-only travel will not fare as well due to overcapacityin the marketplace.
France — Summer seasonYears ended October 31 2003 2002 Variance Variance(in thousands of dollars) $ $ $ %
Revenues 299,241 332,167 (32,926) (9.9)Operating expenses 305,701 328,348 (22,647) (6.9)Margin (6,460) 3,819 (10,279) (269.2)Margin (%) (2.2%) 1.1% (3.3) ppt (300,0)
In France, the summer season was particularly bad. An already difficult situation becameworse with the effects of SARS, particularly for Vacances Air Transat (France), whose focus is on outbound traffic to Canada.
The number of travellers fell by almost 18% resulting in a $32.9 million decrease in revenues.Our revenues dropped in a higher proportion than our expenses due to the inclusion of fixed-
cost components in our operating expenses, resulting in negative margins.It is too early to tell what the 2004 summer season will be like in France but we expect the
number of travellers from France to Canada to grow compared with 2003. We also expect travelpackages to the Caribbean and the Mediterranean Basin to increase. Air-only sales, however, areexpected to continue to struggle.
Our review of our tour operator activities also had an impact on our French operations. OnFebruary 10, 2003, we announced the reorganization of the management of certain French opera-tions that we felt would enable us to better meet new challenges and seize new opportunities in France, as well as improve profitability in our French operations. This reorganization led to theannouncement, on May 5, 2003, of the redundancy plan (required under French law) which result-ed in the layoff of some 90 employees in France. As a result, we accrued an amount of $5.1 millionas part of our restructuring charge related to this reorganization, mainly for employee terminationbenefits. As part of our commitment to this reorganization, we also invested an additional $15.0 millionin our French operations. We began to realize savings as a result of the reorganization toward theend of fiscal 2003.
On October 31, 2003, we also announced that we had completed the sale of our online travelagency, Caïd S.A. (carrying out business under the name Anyway.com (“Anyway”)) for $83.2 million.See Discontinued operations.
In 2004, we expect to exercise our call option related to the acquisition of our tour operator Tourgreece S.A., which shall result at least in a majority ownership position, up from 40%.The final percentage remains to be determined.
2003 Annual Report, Transat A.T. Inc.

32 2003 Annual Report, Transat A.T. Inc.
AmortizationYears ended October 31 2003 2002 Variance Variance(in thousands of dollars) $ $ $ %
Amortization 42,138 43,189 (1,051) (2.4)
Amortization expense relates to capital assets, other assets that consist mostly of long-termfinancing costs and development costs.
Amortization expenses remained relatively stable, with a 2.4% decrease compared with 2002.We expect amortization expense to decrease in fiscal 2004 by approximately $10.0 million, due
mainly to the elimination of our Lockheed aircraft. The Airbus A310s, which will gradually come intoservice in 2004, will be leased and not owned, resulting in operating expenses and not amortizationexpense.
Restructuring chargeIn line with the objectives we set out in our 2002 Annual Report, we focused our efforts on
reducing our costs, worked on operational efficiencies and ensured that all products and servicesnot generating targeted returns are remedied. As a result, we developed a restructuring programduring the second quarter of the current fiscal year. This program included a change in the manage-ment structure and a reorganization that affected both the nature and focus of our operations inFrance and Canada. The war in Iraq and SARS, which contributed to a slowdown in demand, accel-erated the need for a restructuring program. These events also significantly affected our fleet composition.
During the year, we recorded a restructuring charge in the amount of $48 million before taxes.Of this amount, $33.7 million relates to the restructuring of our fleet.
In accordance with our fleet review, we announced the implementation of a plan to phase outthe use of our six Lockheed-L-1011-500s (which are capitalized on our balance sheet) by April 30,2004. Three of these aircraft ceased operations by October 31, 2003 and resulted in a write-down inthe amount of $21.5 million. We wrote down the three remaining aircraft that are still operating totheir fair values, resulting in an impairment charge in the amount of $12.2 million.
The amount recorded for the year includes cash charges totalling $13.5 million and assetwrite-downs in the amount of $34.5 million. The cash charges include mostly employee terminationbenefits and contract termination costs.
We have substantially completed our restructuring program.The following table highlights the activity and balance of the restructuring provision for the
year ended October 31, 2003.
Amount incurred Balanceduring Cumulative drawdowns as at
(in thousands of dollars) the year Cash Non-cash October 31
Employee termination benefits 11,663 6,049 — 5,614Contract termination costs 767 717 — 50Write-off of property, plant and
equipment and other assets 34,483 — 34,483 —Other costs 1,059 619 — 440Total 47,972 7,385 34,483 6,104

33
InterestYears ended October 31 2003 2002 Variance Variance(in thousands of dollars) $ $ $ %
Interest on long-term debt,obligations under capital leases and debentures 9,771 12,418 (2,647) (21.3)
Other interest and financial expenses 3,071 4,563 (1,492) (32.7)
Interest income (9,530) (5,628) 3,902 69.3
Interest on long-term debt, obligations under capital leases and debenturesThe decrease over 2002 is due to a decline in total debt obligations, the favourable impact
of exchange rates and lower interest rates. The decline in total debt obligations is the result of $40.1 million of debt being repaid in 2003. We expect this expense to decrease in 2004 due to our greater focus on paying down the total debt.
Other interest and financial expensesThe decrease over 2002 relates to a variety of immaterial amounts and is not expected to
change dramatically in 2004.
Interest incomeThe increase in interest income is due to higher balances in average cash and cash equivalents
during the year. We expect interest income to grow slightly in 2004.
Foreign exchange gain on long-term monetary itemsAs a result of the adoption of the amendments introduced by CICA Handbook Section 1650,
“Foreign Currency Translation,” all translation gains and losses on long-term monetary items, whichwere previously deferred and amortized, are now included in earnings for the year. The effect on thecurrent year is a $3.6 million improvement in our results compared with a $2.0 million improvementin our 2002 results.
Share of net income of companies subject to significant influenceThe reduction in net income of companies subject to significant influence in 2003 compared
with 2002 is mainly due to our share in the results of our French airline company for the reasonsdiscussed under France.
Income taxesOur income tax recovery amounted to $5.5 million for the year compared with an expense of
$9.6 million in 2002. This increase is due mainly to the effect of the restructuring charge incurred duringthe year and the losses in our French operations. Excluding the share of net income of companiessubject to significant influence, the effective tax rates were 37.9% for the year ended October 31,2003, and 46.9% for the year ended October 31, 2002. (See note 17 of the audited consolidated financialstatements.)
Net loss from continuing operationsAs a result of the items discussed in our Consolidated operations, our net loss from continuing
operations was $9.2 million or $0.38 per share for the year ended October 31, 2003 compared witha net income from continuing operations of $11.7 million or $0.30 per share in 2002. Excluding theafter-tax effect of our restructuring charge, our net income from continuing operations would havebeen $22.2 million or $0.58 per share. The weighted average number of common shares outstand-ing used to establish the per share amounts was 32,796,000 for the current year and 32,4 18,000 for 2002.
2003 Annual Report, Transat A.T. Inc.
34 2003 Annual Report, Transat A.T. Inc.
Discontinued operationsOn October 31, 2003, Transat completed its sale of its online agency in France, Anyway, to
IAC/InterActiveCorp for a cash consideration of 53.8 million euros ($83.2 million) resulting in a netgain of $53.1 million. (See note 15 of the audited consolidated financial statements.)
The sale of Anyway is not expected to have an effect on our 2004 continuing operationsresults due to the fact that the amounts of revenues and expenses are not significant compared with our consolidated results.
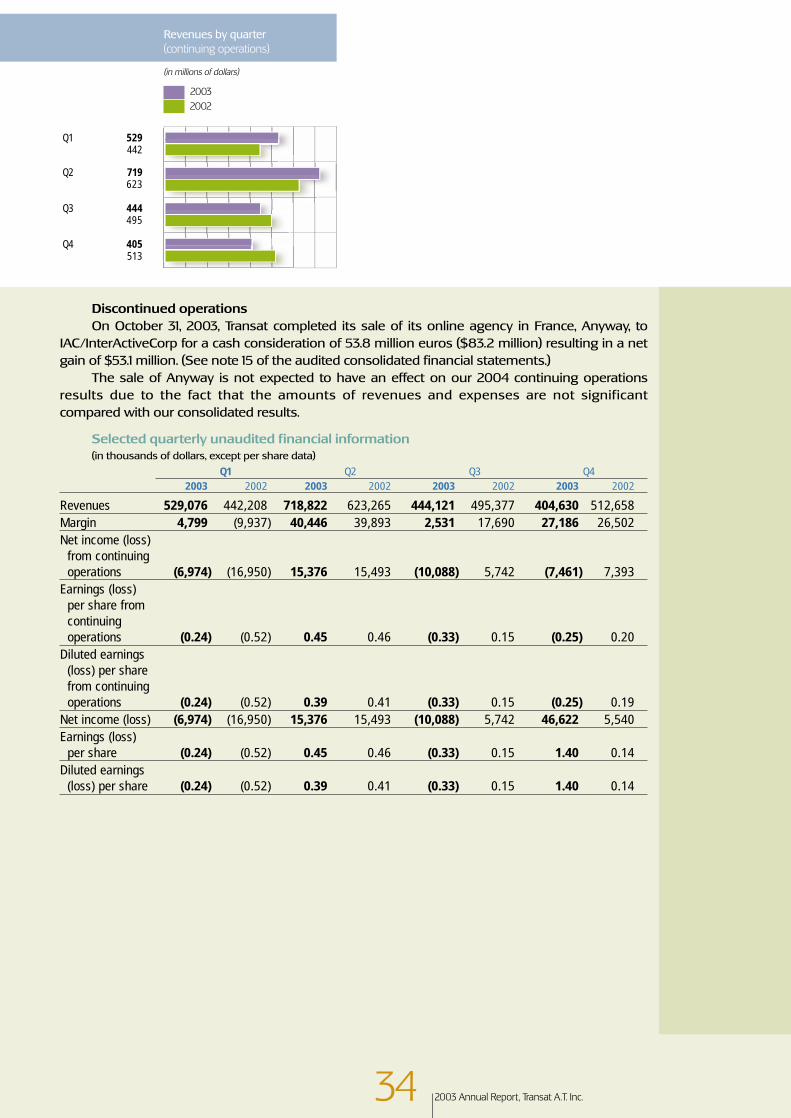
Selected quarterly unaudited financial information(in thousands of dollars, except per share data)
Q1 Q2 Q3 Q42003 2002 2003 2002 2003 2002 2003 2002
Revenues 529,076 442,208 718,822 623,265 444,121 495,377 404,630 512,658Margin 4,799 (9,937) 40,446 39,893 2,531 17,690 27,186 26,502Net income (loss)
from continuing operations (6,974) (16,950) 15,376 15,493 (10,088) 5,742 (7,461) 7,393
Earnings (loss) per share from continuing operations (0.24) (0.52) 0.45 0.46 (0.33) 0.15 (0.25) 0.20
Diluted earnings (loss) per share from continuing operations (0.24) (0.52) 0.39 0.41 (0.33) 0.15 (0.25) 0.19
Net income (loss) (6,974) (16,950) 15,376 15,493 (10,088) 5,742 46,622 5,540Earnings (loss)
per share (0.24) (0.52) 0.45 0.46 (0.33) 0.15 1.40 0.14Diluted earnings
(loss) per share (0.24) (0.52) 0.39 0.41 (0.33) 0.15 1.40 0.14
Revenues by quarter(continuing operations)
(in millions of dollars)
20032002
Q1 529442
Q2 719623
Q3 444495
Q4 405513

35
LIQUIDITY AND CAPITAL RESOURCES
Cash flowsYears ended October 31 2003 2002 Variance(in thousands of dollars) $ $ $
Cash flows relating to operating activities 71,697 183,234 (111,537)Cash flows relating to investing activities (4,275) (25,864) 21,589Cash flows relating to financing activities (56,278) 17,700 (73,978)Net change in cash and cash equivalents 11,144 175,070 163,926The above table sets forth a summary of cash flow activity from continuing operations and should be read in conjunction with our audited consolidated statements of cash flows.
As at October 31, 2003, we held $349.1 million in cash and cash equivalents, (including $106.2 million in trust or otherwise reserved), compared with $260.1 million (including $101.3 millionin trust or otherwise reserved) in 2002. Our balance sheet reflects a current ratio of 1.4 and workingcapital of $144.5 million compared with a current ratio of 1.1 and a working capital of $4 1.8 million in2002. We also have access to unused lines of credit totalling $53.2 million.
Total assets decreased by $58.7 million (7.6%) to $714.8 million from $773.5 million as atOctober 31, 2003. Shareholders’ equity increased by $47.6 million to $24 1.3 million from $193.7 millionas at October 31, 2003 due mainly to $44.9 million in net income for the current year.
Operating activities (continuing operations)During the year, cash flows of $7 1.7 million were generated from operating activities, a decrease
of $1 1 1 .5 million compared with 2002. This decrease is due mainly to the net change in both theworking capital balances related to operations and in the net change in deposits, expenses and provision for engine and airframe overhaul.
The net change in the working capital balances is due mainly to customer deposits and areduction in maintenance expense accruals related to our aircraft. The variance in customer depositsis lower in the current year compared with 2002. The variance was more pronounced in 2002because the comparison was made with 2001, the period following the events of September 1 1, 2001when customer deposits were extremely low. The lower maintenance accruals related to our aircraftare the result of aircraft leases that were not renewed in April 2003, resulting in a 10% reduction incapacity.
The net change in deposits, expenses and provision for engine and airframe overhaul is duemainly to lower deposits with the aircraft lessor as well as higher provisions for aircraft based on anestimate of future expenses.
2003 Annual Report, Transat A.T. Inc.

36 2003 Annual Report, Transat A.T. Inc.
Investing activities (continuing operations)During the year, cash flows of $4.3 million were used for investing activities, a decrease of
$21.6 million compared with 2002. This decrease is basically due to a $10 million decrease in capitalasset acquisitions compared with 2002 and a decrease in other assets.
We expect that capital asset acquisitions will total between $15.0 million and $20.0 million in 2004.
Financing activities (continuing operations)During the year, cash flows of $56.3 million were used from financing activities, a $74 million
decrease compared with 2002. This decrease is primarily due to the issuance of debentures in theamount of $71.0 million in 2002. Cash in 2003 was mainly used for the repayment of long-term debtand obligations under capital leases.
On February 28, 2003, we announced the renewal of our revolving credit facility, whichmatured in February 2003. The renewed credit facility amounts to $90.0 million and is due inAugust 2004.
Cash flows from discontinued operationsCash flows from discontinued operations in the amount of $77.9 million relate mainly to the
cash proceeds received from the sale of Anyway.
Change in cash and cash equivalents
(in millions of dollars)
20032002
Operating cash flow 52.974.0
Working capital balances 17.163.9
Deposits, engine, 1.7air frame 45.3
Additions to property, plant (12.5)and equipment (22.4)
Repayment of (57.6)long-term debt (66.3)
Issue of debentures71.0
Other, net 9.59.6
Discontinued operations 77.90.4
Net change in cash 89.0and cash equivalents 175.5
Cash outflows Cash inflows

37
Off-balance sheet arrangementsIn the normal course of business, Transat enters into arrangements and incurs obligations that
will impact the Corporation’s future operations and liquidity, some of which are reflected as liabilitiesin the Consolidated Financial Statements at year-end. Total debt obligations amounted to $65.3 millionas at October 31, 2003 ($130.5 million in 2002). Obligations that are not reflected as liabilities areconsidered off-balance sheet arrangements. These contractual arrangements are entered intowith entities that are not consolidated with the Corporation and are made up of:
• Guarantees (see notes 9 and 21 of the audited consolidated financial statements)• Operating leases (including any guaranteed residual values) (see note 20 of the audited
consolidated financial statements)The total amount of off-balance sheet debt that can be estimated was approximately
$529.9 million as at October 31, 2003 ($627.1 million in 2002) and can be reconciled as follows:
2003 2002(in thousands of dollars) $ $
GuaranteesIrrevocable letters of credit (note 9) 20,256 14,814Irrevocable letters of credit (note 21) 22,468 24,200Security contracts (note 21) 1,420 2,000
Operating leasesCommitments under operating leases (note 20) 411,188 497,901Guaranteed residual value (note 20) 74,586 88,185
529,918 627,100
Guarantees are required in the normal course of operations in the travel industry to provideindemnification and guarantees to counterparties in transactions such as operating leases, irrevo-cable letters of credit and security contracts. Historically, Transat has not made any significant payments under such guarantees. Operating leases are entered into to enable the Corporation tolease certain items rather than acquire them.
We believe that the Corporation will be able to meet its anticipated cash requirements withcurrent funds, internally generated funds from operations as well as through borrowings underexisting credit facilities.
2003 Annual Report, Transat A.T. Inc.

38 2003 Annual Report, Transat A.T. Inc.
ACCOUNTING CHANGES and FUTURE ACCOUNTING CHANGES
Accounting changesDuring fiscal 2003, we adopted the CICA amendments introduced by CICA Handbook Section
1650, “Foreign Currency Translation,” new Handbook Sections 3870, “Stock-Based Compensationand Other Stock-Based Payments,” 3063, “Impairment of Long-Lived Assets,” and 3475, “Disposal of Long-Lived Assets and Discontinued Operations,” and the new CICA Accounting Guideline 14(AcG-14), “Disclosure of Guarantees.”
Effective November 1, 2002, the standards in Section 1650 require that all unrealized transla-tion gains and losses on assets and liabilities denominated in foreign currencies be included in earn-ings for the year, including gains and losses on long-term monetary assets and liabilities, such aslong-term debt and obligations under capital leases, which were previously deferred and amortizedon a straight-line basis over the remaining lives of the related items. These amendments wereapplied retroactively with restatements of prior periods. As a result, we recorded a cumulativecharge to opening retained earnings in the amount of $1.6 million to write off the unamortized for-eign exchange loss on long-term monetary items. This charge is non-cash in nature and did notaffect our financial position or cash flows.
The new Handbook Section 3870 is also effective for the fiscal year beginning November 1,2002. Under this new standard, the CICA recommends, however does not require, the fair value-based method of accounting for stock options granted to employees but allows the disclosure, ina note to the financial statements, of the pro forma values of net income and earnings per shareobtained by calculating the cost of the stock-based compensation in accordance with the fair value-based accounting method. The recommendations of the Section apply to awards granted on orafter the date of adoption. We have chosen to present in a note to the financial statements theimpact of the application of the fair value-based method to disclose the pro forma net income andthe pro forma earnings per share as if we applied the fair value method. Consequently, the adoptionof this standard did not have any effect on our results, financial position or cash flows.
The new Handbook Section 3063 was adopted effective May 1, 2003. This Section providesguidance on recognizing, measuring and disclosing the impairment of long-lived assets. The stand-ards require the recognition of an impairment loss for a long-lived asset when events or changes incircumstances indicate that the carrying value may not be recoverable and exceeds its fair value. Theimpairment loss is calculated by deducting the fair value of the asset from its carrying value. Theadoption of this Section had an impact on our results and financial position due to the phase-outof a portion of our aircraft fleet. (See note 16 of the audited consolidated financial statements).

39
The new Handbook Section 3475 was effective May 1, 2003. The new standard applies to disposal activities initiated by an enterprise’s commitment to a plan on or after the date of adoption.These new recommendations establish standards for the recognition, measurement, presentationand disclosure of the disposal of long-lived assets by sale or otherwise. The Section in particularspecifies the criteria that must be met for a long-lived asset to be classified as held for sale and spec-ifies that such an asset is measured at the lower of its carrying amount or fair value less selling cost.The new recommendations also establish standards for the presentation and disclosure of discon-tinued operations. In accordance with the provisions of this Section, the Corporation presented theoperating results and cash flows of the subsidiary it sold. The adoption of this Section also impact-ed our results and financial position due to the phase-out of a portion of our aircraft fleet. (See note16 of the audited consolidated financial statements).
AcG-14 was effective February 1, 2003. The Guideline requires a guarantor to disclose significantinformation about guarantees it has provided without regard to whether it will have to make anypayments under the guarantees. The purpose of the Guideline is to improve the transparency of aguarantor’s disclosures about the obligations and risks arising from issuing guarantees. The adop-tion of this Guideline did not have any effect on our results, financial position or cash flows.
Future accounting changesIn November 2001, the CICA issued Accounting Guideline 13 (AcG-13), “Hedging Relationships,”
which will be effective beginning on or after July 1, 2003, although earlier application is encouraged.AcG-13 addresses the identification, designation, documentation and effectiveness of hedging rela-tionships for hedge accounting purposes. In addition, it deals with the discontinuance of hedgeaccounting and establishes conditions for applying hedge accounting. Under the new Guideline, anenterprise is required to document its hedging relationships and explicitly demonstrate that thehedges are sufficiently effective in order to continue accrual accounting for positions hedged withderivatives. The adoption of this Guideline will not have any effect on our results, financial position,or cash flows. At Transat, this Guideline came into effect on November 1, 2003.
In June 2003, the CICA issued Accounting Guideline 15 (AcG-15), “Consolidation of VariableInterest Entities.” This new Guideline presents clarification on the application of consolidation prin-ciples to certain entities that are subject to control on a basis other than ownership of voting inter-ests. Therefore, AcG-15 provides guidance for determining when an enterprise includes the assets,the liabilities and the results of activities of a variable interest entity in its consolidated financialstatements. As a general principle set out in AcG-15, an enterprise should consolidate a variableinterest entity when that enterprise has a variable interest, or combination of variable interest, thatwill absorb a majority of the entity’s expected losses if they occur, receive a majority of the entity’sexpected residual returns if they occur, or both (the “primary beneficiary”). Transat has conductedcertain aircraft financing transactions whereby it guaranteed a portion of the residual value at the end of the lease term under structures involving special purpose entities. These structures are considered variable interest entities and the Corporation is considered to be the primary beneficiary. We are currently evaluating the impact of adopting this Guideline on our results, financial positionand cash flows. At Transat, this Guideline will come into effect on November 1, 2004, although certaindisclosure requirements will be effective as of February 1, 2004.
In September and November of 2003, amendments were introduced by Handbook Section3870 to require that the fair value-based method be applied to awards granted to employees, whichpreviously had not been accounted for at fair value. Enterprises will therefore be required to accountfor the effect of such awards in their financial statements for fiscal years beginning on or afterJanuary 1, 2004. Retroactive or prospective application is allowed. However, prospective applicationis only available to enterprises that elect to apply the fair value-based method of accounting for fis-cal years beginning before January 1, 2004. Thus all other enterprises that adopt the fair value-basedmethod in a fiscal year beginning on or after January 1, 2004 will be required to adopt a retroactiveapplication, with or without restating prior periods. Transat’s adoption of the amendments wereeffective November 1, 2003.
2003 Annual Report, Transat A.T. Inc.

40 2003 Annual Report, Transat A.T. Inc.
RISKS AND UNCERTAINTIES
Economic and general factorsEconomic factors such as a significant downturn in the economy, a recession or a decline in
the employment rate in Canada, France and key international markets may have a negative impacton our business and operating results by affecting demand for our products and services. Our oper-ating results could also be affected by general factors such as extreme weather conditions, war,political instability or terrorism, or any threat thereof, epidemics or disease outbreaks, consumerpreferences and spending patterns, consumer perception of airline safety, demographic trends, dis-ruptions to the air traffic control system, and costs of safety, security and environmental measures.Furthermore, our revenues are sensitive to events affecting domestic and international air travel aswell as the level of car rentals and hotel and cruise reservations.
CompetitionWe face many competitors in the holiday travel industry, some of which are larger in size, have
strong brand name recognition and presence in specific geographic areas, substantial financialresources and preferred relationships with travel suppliers. We also face competition from travelsuppliers selling directly to individual travellers at preferential prices. These pressures may adverse-ly impact our revenues and margins since we would likely have to match competitors’ prices.
Fluctuation of currency exchange rates and interest ratesTransat is exposed, by reason of its many arrangements with foreign-based suppliers, to fluc-
tuations in exchange rates as regards the U.S. dollar against the Canadian dollar and the euro. Thesefluctuations could increase our costs of operations. Changes in interest rates could also impact ourinterest income from our cash and cash equivalents and interest expense from variable rate debtinstruments, in turn affecting our earnings. We currently purchase derivative financial instrumentsto hedge against exchange-rate fluctuations as well as interest rates on a portion of our long-termdebt, obligations under capital leases and off-balance sheet financing for aircraft.

4 1
Fuel costs and supplyTransat is exposed in particular to fluctuations in the cost of fuel. Due to the competitive pres-
sures in the industry, there can be no assurance that we would be able to pass on any increase infuel prices to our customers by increasing fares and that any fare increase would offset increasedfuel costs, which could in turn adversely impact the business, financial condition or results of ouroperations. We currently purchase futures contracts to hedge against the risk of fluctuations in thecost of fuel. Furthermore, to the extent that there would be a reduction in the supply of fuel, ouroperations could be adversely impacted.
Changing industry dynamics: new methods of distributionThe widespread adoption of the Internet has resulted in travellers being able to access infor-
mation about travel products and services and to purchase such products and services directly from suppliers, thereby bypassing both vacation providers such as Transat and retail travel agentsthrough whom we receive a substantial portion of our revenues. In order to remain competitive, we have launched an online booking service in Canada, www.exitnow.ca, allowing consumers topurchase their travel products on line.
Additionally, the recent erosion of commissions paid to travel distributors by travel suppliers,particularly airlines, has weakened the financial condition of many travel agents. Because we cur-rently rely to some extent on retail travel agencies for access to travellers and revenues, a shift inconsumer purchasing away from travel agencies and toward direct purchasing from travel supplierscould have an impact on the Corporation.
Reliance on contracting travel suppliersDespite being well positioned by reason of our vertical integration, we are nonetheless
dependent on travel suppliers for the sale of our products and services. Furthermore, we increas-ingly rely on airlines that are not part of our group to transport our passengers to their vacation des-tination. Our travel suppliers may generally terminate or modify existing agreements with us uponrelatively short notice. The inability to replace these agreements with similar suppliers or to rene-gotiate agreements at reduced rates could have an adverse effect on our results. Furthermore, anydecline in the quality of travel products and services provided by these suppliers, or a perception bytravellers of such a decline, could adversely affect our reputation. The loss of contracts, changes inour pricing agreements, more restricted access to travel suppliers’ products and services or lessfavourable public opinion about certain travel suppliers resulting in low demand for their productsand services could have a significant effect on our results.
Dependence on technologyOur business is dependent on our ability to access information, manage reservation systems,
including handling a high volume of telephone calls on a daily basis, and distribute our vacationproducts to retail travel agents and other travel intermediaries. To this end, we rely on different infor-mation and telecommunications technologies. Rapid changes in these technologies may requiregreater-than-anticipated capital expenditures to improve or upgrade the level of customer service,which could impact our operating results. Additionally, any failure or outage of these systems couldadversely affect our business, customer relationships and operating results.
Dependence on customer deposits and advance paymentsTransat derives significant interest income from consumer deposits and advance payments.
Our investment policy restricts us to investing these deposits and advance payments only in invest-ment-grade securities. A failure of these investment securities to perform at their historical levelscould reduce the interest income realized by the Corporation.
2003 Annual Report, Transat A.T. Inc.

42 2003 Annual Report, Transat A.T. Inc.
Negative working capitalOur activities generate customer deposits and advance payments. If the flow of money from
these advance payments were to diminish and Transat were required to find an alternative sourceof capital, there is no assurance that such source would be available at terms and conditions accept-able to the Corporation and this could have a significant effect on our business.
Fluctuation of financial resultsThe travel industry in general and our operations in particular are seasonal. As a result, our
quarterly operating results are subject to fluctuation. We therefore believe that quarter-to-quartercomparisons of our operating results are not necessarily meaningful and should not be relied uponas an indication of future performance. Furthermore, due to all of the economic and general factorsdescribed above, our operating results in future periods may fall below the expectations of securi-ties analysts and investors, thus affecting the market price of our shares.
Government regulation and taxationFuture results of Transat may vary based upon any actions which governmental authorities
with jurisdiction over the Corporation’s operations may take, including the granting and timing ofcertain governmental approvals or licences, the adoption of regulations that impact customer ser-vice standards, such as new passenger security standards, the adoption of more restrictive noiserestrictions or curfews and the adoption of provincial regulations that impact operations of retailand wholesale travel agencies. Additionally, new or different regulatory schemes or changes withrespect to tax policy could have an effect on our operations as regards hotel taxes, car rental taxes,airline excise taxes as well as airport taxes and fees.
Future capital requirementsTransat may need to raise additional funds in the future in order to take advantage of growth
opportunities or to respond to competitive pressures. There can be no assurance that additionalfinancing will be available on terms and conditions acceptable to the Corporation, and this couldadversely affect our business.
Interruption in operationsShould operations be interrupted for any reason, including unavailability of aircraft due to
mechanical reasons, loss of revenues associated with the utilization of aircraft could have an impacton the business, financial condition and results of our operations.
Insurance coverageFollowing the terrorist attacks of September 11, 2001, the airline insurance market gave notice
to cancel all aircraft hull and liability coverage with respect to risks resulting from war and terroristacts. This notice was subsequently rescinded, but the limit of liability applicable to civil liability tothird parties for bodily injury and property damage was reduced to US$50,000,000.
There being no commercial market immediately available to insure airlines worldwide for their civil liability to third parties resulting from war and terrorist acts in excess ofUS$50,000,000, it was necessary for individual governments to cover their airlines against this riskuntil commercial insurance became available at commercially reasonable terms. Both France andCanada covered their air carriers accordingly.

43
Over the last eighteen months, a commercial market has become available to insure this risk,but it is a subject of some discussion as to whether the terms are reasonable. Moreover, some mar-ket players are not licensed to transact business in Canada. Nevertheless, the French governmenthas withdrawn its protection, forcing the Corporation’s French airline affiliate, Star Airlines, to revertto the commercial insurance market. The Canadian Government continues to afford protection toits air carriers, prompted by the licensing situation and the fact that the US government continuesto provide protection to its own carriers for such risk. However, there can be no assurance that theCanadian government will not withdraw its protection, particularly if the US government shouldchange its position.
In the meantime, the International Civil Aviation Organization (“ICAO”) continues to lobby forsupport from all governments to achieve an industry solution financially aided by each governmentthat would provide the requisite protection at reasonable cost. Thus far, ICAO has failed to obtainmajority support for such a plan from its member governments. There is no assurance that such a solution will be found or if found, how long it will take to be implemented.
Casualty losses We believe that our suppliers and the Corporation have adequate liability insurance to cover
risks arising in the normal course of business, such as claims for serious injury or death arising from accidents involving aircraft or other vehicles carrying our customers. Although we have neverexperienced a liability claim for which we did not have adequate insurance coverage, there is noassurance that our insurance coverage will be sufficient to cover larger claims or that the insurerconcerned will be solvent at the time of any covered loss. Additionally, there is no assurance that wewill be able to obtain insurance coverage at acceptable levels and cost in the future. These uncer-tainties could adversely affect our business and operations.
Slot and gate availabilityAccess to landing and departure runway slots, airport gates and facilities are critical to our
operations and our strategy for future growth. The availability or cost of these facilities in the futurecould have a negative effect on our operations.
Aircraft lease obligationsTransat has significant lease obligations relating to its fleet of aircraft, which obligations may
not be cancelled. To the extent that the revenues derived from the operation of aircraft decrease inthe future, payments to be made on our lease agreements could have a substantial impact on theCorporation’s operations.
Key personnelTransat’s future success will depend on our ability to attract and retain qualified personnel. The
loss of key individuals could adversely affect our business and operating results.
Uncertainty of future collective bargaining agreementsTransat’s operations could be adversely affected by our inability to reach an agreement with
any labour union representing employees, such as pilots.
Our Annual Information Form filed with Canadian securities commissions also contains information on risks and uncertainties.
2003 Annual Report, Transat A.T. Inc.

44 2003 Annual Report, Transat A.T. Inc.
OUTLOOK
Transat ended fiscal 2003 with a strong balance sheet and its restructuring efforts substantially completed.
In fiscal 2004 we expect a strong winter season in Canada and an improvement to our sum-mer season following the devastating effects of the SARS outbreak on the 2003 summer season.We also expect Transat to continue to benefit from the strengthening Canadian dollar.
In France, we will continue to concentrate on reducing the losses at Look Voyages, withthe objective of returning it to profitability in fiscal 2005.
Overall bookings for the winter season are good, and the Corporation is well positioned forgrowth opportunities in 2004 and beyond.
The long-term outlook is equally positive. The tourism industry is expected to grow, and an aging population will have more time for travel.
Our continued focus will be on our core business, a focus that is in line with our strategies and with maximizing shareholder value.

45
The consolidated financial statements are the responsibility of management and have beenapproved by the Board of Directors. Management’sresponsibility in this respect includes the selection of appropriate accounting principles as well as the exercise of sound judgment in establishing reason-able and fair estimates in accordance with Canadiangenerally accepted accounting principles which areadequate in the circumstances. The financial infor-mation presented throughout this annual report is consistent with that appearing in the financialstatements.
The Corporation and its affiliated companieshave set up accounting and internal control systemsdesigned to provide reasonable assurance that theCorporation’s assets are safeguarded against loss or unauthorized use and that its books of accountmay be relied upon for the preparation of financial statements.
The Board of Directors is responsible for theconsolidated financial statements through its AuditCommittee. The Audit Committee reviews the annualconsolidated financial statements and recommendstheir approval to the Board of Directors. The AuditCommittee is also responsible for analyzing, on anongoing basis, the results of the audits by the exter-nal auditors of the accounting methods and policiesused as well as of the internal control systems set upby the Corporation. These financial statements havebeen audited by Ernst & Young LLP, the externalauditors. Their report on the consolidated financialstatements appears opposite.
Jean-Marc EustacheChairman of the Board, President and Chief Executive Officer
Nelson GentilettiVice-President, Finance and Administration and Chief Financial Officer
To the Shareholders of Transat A.T. Inc.We have audited the consolidated balance
sheets of Transat A.T. Inc. as at October 31, 2003 and2002 and the consolidated statements of income,retained earnings and cash flows for the years thenended. These financial statements are the responsi-bility of the Corporation’s management. Our respon-sibility is to express an opinion on these financialstatements based on our audits.
We conducted our audits in accordance withCanadian generally accepted auditing standards.Those standards require that we plan and performan audit to obtain reasonable assurance whether thefinancial statements are free of material misstate-ment. An audit includes examining, on a test basis,evidence supporting the amounts and disclosures in the financial statements. An audit also includesassessing the accounting principles used and signifi-cant estimates made by management, as well as eval-uating the overall financial statement presentation.
In our opinion, these consolidated financialstatements present fairly, in all material respects, thefinancial position of the Corporation as at October 31, 2003 and 2002 and the results of its operationsand its cash flows for the years then ended in accor-dance with Canadian generally accepted accountingprinciples.
Ernst & Young LLPChartered Accountants
Montreal, CanadaDecember 23, 2003
2003 Annual Report, Transat A.T. Inc.
Auditors’ report
Management’s report

46 2003 Annual Report, Transat A.T. Inc.
2003 2002$ $
[restated – note 3]ASSETS Current assetsCash and cash equivalents [note 4] 349,125 260,123Accounts receivable 72,929 101,613Income taxes recoverable — 15,139Future income tax assets 959 1,352Inventories 7,829 10,124Prepaid expenses 40,379 48,389Current portion of deposits 24,053 33,850Total current assets 495,274 470,590Deposits [note 5] 14,172 17,707Future income tax assets [note 17] 13,371 18,028Property, plant and equipment [notes 6 and 16] 101,741 169,316Goodwill 69,682 69,935Other assets [note 7] 20,517 27,892
714,757 773,468
LIABILITIES AND SHAREHOLDERS’ EQUITYCurrent liabilitiesBank loans [note 8] — 18,618Accounts payable and accrued liabilities 181,971 249,852Income taxes payable 2,699 —Customer deposits and deferred income 146,025 136,078Current portion of long-term debt and obligations
under capital leases 20,102 24,257Total current liabilities 350,797 428,805Long-term debt [note 9] 4,811 21,455Obligations under capital leases [note 10] 10,437 36,990Debentures [note 11] 29,981 29,226Provision for engine and airframe overhaul in excess of deposits 43,495 35,614Non-controlling interest and other liabilities 22,474 15,925Future income tax liabilities [note 17] 11,416 11,710
473,411 579,725
Shareholders’ equityShare capital [note 12] 111,247 110,200Convertible debentures and equity component
of a debenture [notes 11 and 13] 52,855 52,786Retained earnings 70,336 28,636Warrants [notes 11 and 12] 4,122 4,122Deferred translation adjustments 2,786 (2,001)
241,346 193,743714,757 773,468
On behalf of the Board:Jean-Marc Eustache, DirectorAndré Bisson, O.C., Director
Commitments and contingencies [note 20]
See accompanying notes to consolidated financial statements.
Consolidated balance sheets
As at October 3 1 [In thousands of dollars]

47 2003 Annual Report, Transat A.T. Inc.
Consolidated statements of income
Years ended October 3 1 [In thousands of dollars, except per share amounts]2003 2002
$ $
[restated –notes 3 and 15]
Revenues 2,096,649 2,073,508Operating expenses 2,021,687 1,999,360
74,962 74,148Amortization [note 14] 42,138 43,189Restructuring charge [note 16] 47,972 —Interest on long-term debt, obligations under
capital leases and debentures 9,771 12,418Other interest and financial expenses 3,071 4,563Interest income (9,530) (5,628)Foreign exchange gain on long-term monetary items (3,873) (984)Share of net income of companies subject to significant influence (673) (919)
88,876 52,639Income (loss) before the following items (13,914) 21,509Income taxes (recovery) [note 17]
Current 6,122 (10,556)Future (11,655) 20,205
(5,533) 9,649Income (loss) before non-controlling interest
in subsidiaries’ results (8,381) 11,860Non-controlling interest in subsidiaries’ results (766) (182)Income (loss) from continuing operations (9,147) 11,678Income (loss) from discontinued operations, net of related
income taxes of $18,775 [$998 in 2002] [note 15] 54,083 (1,853)Net income for the year 44,936 9,825
Basic net earnings (loss) per share [note 12]
Continuing operations (0.38) 0.30Discontinued operations 1.65 (0.06)
1.27 0.24
Diluted earnings (loss) per share [note 12]
Continuing operations (0.38) 0.30Discontinued operations 1.65 (0.06)
1.27 0.24
2003 2002$ $
[restated – note 3]
Retained earnings, beginning of year, as previously reported 30,243 25,879Change in accounting policy [note 3] (1,607) (3,644)Retained earnings, beginning of year 28,636 22,235Net income for the year 44,936 9,825Convertible debentures issue expenses,
net of related future income taxes of $703 — (1,278)Interest on equity component of debentures,
net of related income taxes of $1,431 [$1,141 in 2002] (3,236) (2,146)Retained earnings, end of year 70,336 28,636
See accompanying notes to consolidated financial statements.
Consolidated statements of retained earnings
Years ended October 3 1 [In thousands of dollars]

48 2003 Annual Report, Transat A.T. Inc.
2003 2002$ $
[restated –notes 3 and 15]
OPERATING ACTIVITIESNet income (loss) from continuing operations (9,147) 11,678Operating items not involving an outlay (receipt) of cash
Amortization 42,138 43,189Write-off of property, plant and equipment
and other assets [note 16] 34,483 —Foreign exchange gain on long-term monetary items (3,873) (984)Share of net income of companies subject to significant influence (673) (919)Non-controlling interest in subsidiaries’ results 766 182Future income taxes (11,655) 20,205Interest on debentures 824 664
Operating cash flow 52,863 74,015Net change in non-cash working capital balances
related to operations 17,101 63,915Net change in deposits, expenses and provision
for engine and airframe overhaul 1,733 45,304Cash flows relating to operating activities 71,697 183,234
INVESTING ACTIVITIESRepayment of deposits 5,595 5,373Increase in deposits (1,791) (3,641)Additions to property, plant and equipment (12,513) (22,426)Other assets 4,434 (5,170)Cash flows relating to investing activities (4,275) (25,864)
FINANCING ACTIVITIESChange in bank loans (17,536) 8,806Repayment of revolving term loan — (45,020)Increase in other long-term debt 136 2,205Repayment of other long-term debt and obligations
under capital leases (40,112) (21,264)Proceeds from issue of common shares 744 798Proceeds from issue of debentures, net of issue expenses — 70,989Interest on convertible debentures (4,600) (2,445)Other liabilities 5,090 3,631Cash flows relating to financing activities (56,278) 17,700
Cash flows relating to continuing operations 11,144 175,070Cash flows relating to discontinued operations [note 15] 77,858 434Net change in cash and cash equivalents 89,002 175,504Cash and cash equivalents, beginning of year 260,123 84,619Cash and cash equivalents, end of year1 349,125 260,123
1 Consists of the following:Cash and cash equivalents related to:
Continuing operations 349,125 259,485Discontinued operations — 638
Supplementary informationIncome taxes paid 1,178 355Interest paid 11,348 13,942
See accompanying notes to consolidated financial statements.
Consolidated statements of cash flows
Years ended October 3 1 [In thousands of dollars]

49
1 INCORPORATION AND NATURE OF BUSINESS
Transat A.T. Inc. [the “Corporation”], incorporated under the Canada Business Corporations Act,is an integrated company specializing in the organization, marketing and distribution of holiday travel. Thecore of its business consists of tour operators based in Canada and France. The Corporation is also involvedin air transportation and value-added services at travel destinations. Finally, the Corporation has secured adynamic presence in distribution through travel agency networks.
2 SIGNIFICANT ACCOUNTING POLICIES
The consolidated financial statements of the Corporation have been prepared by management inaccordance with Canadian generally accepted accounting principles. The preparation of financial statementsin accordance with generally accepted accounting principles requires management to make estimates andassumptions that affect the amounts reported in the financial statements and accompanying notes. Actualresults could differ from those estimates. The financial statements have, in management’s opinion, been properlyprepared within reasonable limits of materiality and within the framework of the accounting policies summa-rized below.
Basis of consolidationThe consolidated financial statements include the accounts of the Corporation, its subsidiaries
and a joint venture.
Cash equivalentsCash equivalents consist primarily of term deposits, bankers’ acceptances and commercial
paper that are readily convertible into known amounts of cash with initial maturities of less than three months.These investments are recorded at cost plus accrued interest and their carrying value approximates their fairmarket value.
InventoriesInventories are valued at the lower of cost, determined according to the first-in, first-out method,
and replacement cost.
Capital leasesCapital leases which transfer substantially all the benefits and inherent risks related to the own-
ership of the property leased to the Corporation are capitalized and liabilities are recorded for the presentvalue of the payments under the leases. The leased property is amortized over its estimated useful life. Rentalpayments are recorded partly against the amount of the obligation and partly as interest.
2003 Annual Report, Transat A.T. Inc.
Notes to consolidated financial statements
October 3 1, 2003 and 2002 [Amounts are expressed in thousands of dollars, except for share capital, stock option plans,warrants and amounts per share.]

50 2003 Annual Report, Transat A.T. Inc.
2 SIGNIFICANT ACCOUNTING POLICIES [Cont’d]
Property, plant and equipmentProperty, plant and equipment is recorded at cost and is amortized, taking into account its residual
value, on a straight-line basis over its estimated useful life as follows:
Property under capital leasesAircraft 7 to 10 yearsAircraft engines Cycles usedOther property Lease term
Owned property, plant and equipmentHangar and administrative buildings 35 yearsAircraft 7 to 10 yearsImprovements to aircraft under operating leases Lease termAircraft equipment 5 to 10 yearsComputer equipment and software 3 to 7 yearsAircraft engines Cycles usedOffice furniture and equipment 4 to 10 yearsLeasehold improvements and other Lease termRotable aircraft spare parts Use
GoodwillGoodwill represents the excess of the purchase price over the fair value of net assets acquired.
Goodwill is tested for impairment annually or more often if events or changes in circumstances indicate thatit might be impaired. The impairment test consists of a comparison of the fair value of the reporting unit towhich goodwill is assigned with its carrying amount. Any impairment loss in the carrying amount comparedwith the fair value is charged to income in the year in which the loss is recognized. The Corporation uses thediscounted cash flows method to assess the fair value of its reporting units.
Other assetsOther assets consist in particular of long-term financing costs, development costs and long-term
investments.Deferred long-term financing costs are amortized over the financing period of the related debts
and development costs are amortized over periods not exceeding five years. Long-term investments overwhich the Corporation has the ability to exercise significant influence are accounted for using the equitymethod.
Impairment of long-lived assetsLong-lived assets, excluding goodwill, are reviewed for impairment whenever events or changes in
circumstances indicate that the carrying amount of an asset may not be recoverable. Impairment is assessedby comparing the carrying amount of an asset with its expected future net undiscounted cash flows from usetogether with its residual value [net recoverable value]. If such assets are considered to be impaired, theimpairment to be recognized is measured by the amount by which the carrying amount of the assets exceedsthe net recoverable value.
Deposits, expenses and provision for engine and airframe overhaulThe Corporation provides for engine and airframe overhaul expenses for each aircraft based on
an estimate of all such future expenses until the expiry of the leases for these aircraft, or for their remaininguseful lives while held, amortized over the total number of engine cycles and the total number of flying hoursanticipated for the airframe over the same periods.
These expenses are charged to income according to the number of cycles used or the numberof flying hours recorded during the year, by the amortization of the capitalized overhaul costs or by a provi-sion for future costs, as the case may be. Actual results could differ from those estimates and differences couldbe significant.
The Corporation makes deposits representing a portion of engine and airframe overhaul expensesto certain aircraft lessors. These deposits are usually recoverable upon presentation of claims for eligible over-haul expenses. Amounts so claimed are included under “Accounts receivable”. The excess of the provisionfor future overhaul expenses over deposits made and unclaimed is included in liabilities as “Provision forengine and airframe overhaul in excess of deposits”. The unamortized balance related to engine and airframeoverhaul expenses is included, if any, in assets as “Deposits”.

51
2 SIGNIFICANT ACCOUNTING POLICIES [Cont’d]
Foreign currency translation[a] Self-sustaining foreign operations
The Corporation translates the accounts of its self-sustaining foreign subsidiaries using thecurrent rate method. All assets and liabilities of self-sustaining foreign operations are trans-lated at the exchange rates in effect at year-end. Revenues and expenses are translated ataverage rates of exchange during the period. Net gains or losses resulting from the trans-lation of assets and liabilities are shown in shareholders’ equity.
[b] Accounts and transactions in foreign currenciesThe accounts and transactions of the Corporation denominated in foreign currencies aretranslated using the temporal method. Under this method, monetary items on the balancesheet are translated at the exchange rates in effect at year-end, while non-monetary itemsare translated at the historical rates of exchange. Revenues and expenses are translatedat the rates of exchange on the transaction date or at the average exchange rates for theperiod. Gains or losses resulting from the translation are included in the consolidatedstatement of income.
Stock-based compensation plansThe Corporation accounts for its stock option plan for directors, management and employees
as capital transactions. Accordingly, the issuance of options does not give rise to compensation expenses.The Corporation discloses the impact of applying the fair value-based method on pro forma net income andearnings per share by way of a note to the consolidated financial statements
The Corporation’s contributions to the permanent stock ownership incentive plan for senior executives are recognized in income when the shares are awarded. No compensation expense is recognizedfor the other plans when shares are issued to directors, management and employees. Any consideration paidby directors, management and employees upon purchasing shares is credited to share capital.
A description of the stock-based compensation plans offered by the Corporation is included in note 12.
Revenues Revenues earned from passenger transportation are recorded upon each return flight. Revenues
of tour operators and the related costs are recorded at the time of the departure of the passengers. Commis-sion revenues of travel agencies are recorded at the time of reservation. Amounts received for services notyet rendered are included in current liabilities as “Customer deposits and deferred income”.
Financial instrumentsThe Corporation uses foreign exchange forward contracts to hedge against future currency
exchange rate variations related to long-term debt and lease payments denominated in other currencies, air-craft operating lease payments, receipt of revenue from certain tour operators and disbursements pertainingto certain operating expenses in other currencies. The gains or losses on these contracts resulting from exchangerate variations are recorded in income when the related hedging transactions are realized.
In addition, the Corporation has entered into interest-rate and currency swap agreements relatedto certain operating leases. The amounts charged to income are based on the rates provided in the contracts.
To protect itself against variations in fuel costs, the Corporation has entered into fuel price hedg-ing contracts. The resulting gains or losses are recorded in fuel costs as purchases of fuel are made.
It is the Corporation’s policy not to speculate on financial instruments; thus, these instrumentsare normally maintained until maturity according to the primary objective of hedging risks.
Income taxesThe Corporation provides for income taxes using the liability method. Under this method, future
income tax assets and liabilities are calculated based on differences between the carrying value and tax basesof assets and liabilities and measured using substantively enacted tax rates and laws expected to be in effectwhen the differences reverse. A valuation allowance has been recorded to the extent that it is more likely thannot that future income taxes will not be realized.
Employee future benefitsThe Corporation offers defined benefit plans to certain members of senior management. The cost
of pension benefits earned by employees is determined from actuarial calculations using the projected benefitmethod prorated on services and management’s most likely estimate of expected plan investment perform-ance, salary escalation and the retirement age of employees. Plan obligations are discounted using currentmarket interest rates and included in “Other liabilities.”
2003 Annual Report, Transat A.T. Inc.

52 2003 Annual Report, Transat A.T. Inc.
2 SIGNIFICANT ACCOUNTING POLICIES [Cont’d]
Earnings per shareEarnings per share is calculated based on the weighted average number of common shares out-
standing during the year. The diluted earnings per share is calculated using the treasury stock method andtakes into account all the elements that have a dilutive effect.
3 CHANGES IN ACCOUNTING POLICIES
Foreign currency translationOn November 1, 2002, the Corporation adopted, on a retroactive basis with restatement, the
amended Canadian Institute of Chartered Accountants Handbook [“CICA”], Section 1650, “Foreign CurrencyTranslation”. The standards require that all unrealized translation gains and losses on assets and liabilitiesdenominated in foreign currencies, including gains and losses on long-term monetary assets and liabilities,such as long-term debt and obligations under capital leases, previously deferred and amortized on a straight-line basis over the remaining lives of the related items, be included in income for the year. As a result of theadoption of these amendments on November 1, 2001, deferred foreign exchange losses in the amount of$3,644 [$1,607 as at October 31, 2002] included in other assets, were written off and charged to retainedearnings. An additional effect of the adoption of the amendments was an increase in net income and earn-ings per share of $2,037 and $0.06 respectively for the year ended October 31, 2002. The adoption of theseamendments also resulted in an increase in net income and earnings per share of $3,624 and $0.11 for theyear ended October 31, 2003.
Stock-based compensation and other stock-based paymentsOn November 1, 2002, the Corporation adopted, on a prospective basis, the new accounting
standard, Section 3870 “Stock-Based Compensation and Other Stock-Based Payments”. Under this newstandard, the CICA recommends, but does not require, the use of the fair value-based method to account forthe stock options granted to employees, but permits the disclosure in a note to the financial statements of thepro forma values of net income and earnings per share obtained by calculating the cost of the stock-basedcompensation in accordance with the fair value-based method. The recommendations of the section apply toawards granted on or after the date of adoption. The Corporation has chosen to present the impact of theapplication of the fair value-based method in a note to the consolidated financial statements by disclosing thepro forma net earnings and the pro forma earnings per share as if the Corporation had applied the fair value-based method for awards granted on or after the date of adoption. Consequently, the adoption by theCorporation of this standard did not have any effect on its results, financial position or cash flows.
Disposal of long-lived assets and discontinued operationsOn May 1, 2003, the Corporation adopted the new accounting standard, Section 3475 “Disposal
of Long-Lived Assets and Discontinued Operations.” The new standard applies to disposal activities initiatedby an enterprise’s commitment to a plan on or after the date of adoption. These new recommendations estab-lish standards for the recognition, measurement, presentation and disclosure of the disposal of long-livedassets held for disposal by sale or other than by sale. The section in particular specifies the criteria that mustbe met for a long-lived asset to be classified as held for sale and specifies that such an asset is measured atthe lower of its carrying amount or fair value less cost to sell. The new recommendations also establish stand-ards for the presentation and disclosure of discontinued operations. On October 31, 2003, the Corporationsold one of its subsidiaries. In accordance with the provisions of this new section, the Corporation presentedthe operating results and the cash flows of the subsidiary it sold in note 15 to the consolidated financial state-ments. The adoption of these standards also resulted in a write-off of property, plant and equipment totalling$21,462, as described in note 16.
Impairment of long-lived assetsIn addition, on May 1, 2003, the Corporation early adopted the new standards in the CICA
Handbook Section 3063 “Impairment of Long-Lived Assets.” The section establishes standards for recognition,measurement and disclosure of the impairment of long-lived assets. It requires recognition of an impairmentloss when the carrying value of a long-lived asset is not recoverable and exceeds its fair value. The sectionspecifies that the impairment loss is measured as the amount by which the long-lived asset’s carrying valueexceeds its fair value. The adoption of these standards resulted in an impairment write-down of property, plantand equipment totalling $12,253 as described in note 16.

53
4 CASH AND CASH EQUIVALENTS 2003 2002
$ $
Cash and cash equivalents 242,952 158,823Cash in trust or otherwise reserved 106,173 101,300
349,125 260,123
Cash in trust or otherwise reserved represent funds received from customers for services not yet rendered.
As at October 31, 2003, no cash or term deposits were pledged as collateral security against letters of guarantee issued by financial institutions [$1,627 as at October 31, 2002].
5 DEPOSITS 2003 2002
$ $
Deposits on leased aircraft and engines 11,344 15,725Deposits with suppliers 26,881 35,832
38,225 51,557Less current portion 24,053 33,850
14,172 17,707
6 PROPERTY, PLANT AND EQUIPMENT2003 2002
Accumulated AccumulatedCost amortization Cost Amortization
$ $ $ $
Property under capital leasesAircraft 17,781 14,017 56,249 24,446Aircraft engines 20,358 3,819 26,234 9,334Other property 1,347 677 8,170 4,499
39,486 18,513 90,653 38,279Owned property, plant
and equipmentHangar and administrative
buildings 7,485 2,056 7,682 1,836Aircraft 8,754 7,540 25,444 7,838Improvements to aircraft under
operating leases 12,674 5,291 10,223 3,519Aircraft equipment 29,941 22,245 28,701 19,154Computer equipment
and software 70,581 43,934 78,676 41,569Aircraft engines — — 3,027 327Office furniture
and equipment 21,845 16,611 21,141 13,468Leasehold improvements
and other 17,540 8,807 19,927 9,713Rotable aircraft spare parts 23,784 5,352 23,651 4,106
192,604 111,836 218,472 101,530232,090 130,349 309,125 139,809
Accumulated amortization 130,349 139,809Net book value 101,741 169,316
2003 Annual Report, Transat A.T. Inc.

54 2003 Annual Report, Transat A.T. Inc.
7 OTHER ASSETS2003 2002
$ $
[restated – note 3]
Deferred costs, unamortized balance 6,870 12,602Investments in companies subject to significant
influence and other investments 6,788 8,101Miscellaneous 6,859 7,189
20,517 27,892
8 BANK LOANS
Operating lines of credit totalling C12,094 [$18,465] [C25,800 [$39,783] in 2002] have been author-ized for certain French subsidiaries. These operating lines of credit are renewable annually and were unused asat October 31, 2003 [C12,073 [$18,618] was used as at October 31, 2002]. For the year ended October 31,2003, operating lines of credit bore interest at an average rate of 3.3% [4.1% for the year ended October 31,2002].
9 LONG-TERM DEBT2003 2002
$ $
Term loan in the amount of US$3,532 [US$5,279 in 2002],bearing interest at Libor plus 2.5%, or 3.64% as at October31, 2003 [4.23% as at October 31, 2002], repayable ininstalments of varying amounts, maturing in 2004 and col-lateralized by a movable hypothec on an aircraft 4,661 8,237
Term loan in the amount of US$1,842 [US$2,205 in 2002],bearing interest at 8%, repayable in monthly instalments ofcapital and interest totalling US$44, maturing in June 2004and collateralized by a movable hypothec on rotable air-craft spare parts 2,431 3,441Loans of C1,732 [C2,319 in 2002], bearing interest at ratesranging from 5.4% to 5.9% [5.40% to 6.75% in 2002] and maturing in 2006 2,644 3,576Term loans in the amount of C2,509 [C6,098 in 2002], bear-ing interest at Euribor plus 0.7%, or 2.8% as at October 31,2003 [3.83% as at October 31, 2002], and maturing at vari-ous dates through 2007 3,831 9,415Other, maturing at various dates through 2007 3,464 6,176
17,031 30,845Less current portion 12,220 9,390
4,811 21,455
The Corporation and its subsidiaries Air Transat A.T. Inc. [“Air Transat”] and Transat Tours CanadaInc. [“Transat Tours”] have a revolving line of credit amounting to $55,000 under a banking syndicate agreement.
Under the terms of this agreement, drawings can be made by way of bankers’ acceptances andbank loans, as well as through the issuance of letters of credit denominated in Canadian or US dollars. Theinterest rate is determined based on a grid of rates that vary based on the level of certain financial ratios calculated on a consolidated basis.
As at October 31, 2003, letters of credit had been issued for a total of $20,256, thus reducing bythe same amount the balance available on the revolving term loan [$14,814 as at October 31, 2002].
For the purpose of guarantee agreements related to its operations, the subsidiary, Air Transat,also benefits from a special revolving term loan in the amount of $35,000, subject to the same terms and conditions as the revolving term loan. As at October 31, 2003, letters of guarantee had been issued for a totalof $31,768 under this special revolving term loan [$32,778 as at October 31, 2002].
Under these agreements, the Corporation has granted its lenders most of the assets as collateralon its long-term debt.
Principal instalments payable during the next four years are as follows: 2004 – $12,220; 2005 –$2,893; 2006 – $1,383 and 2007 – $535.

55
1 0 OBLIGATIONS UNDER CAPITAL LEASES2003 2002
$ $
Obligations totalling US$3,204 [US$20,225 in 2002] related to aircraft, maturing at various dates until 2004 4,228 31,558
Obligations totalling US$8,088 [US$8,570 in 2002] related to an aircraft engine, maturing in 2009 10,675 13,371
Obligations totalling US$1,528 [US$2,695 in 2002] related to an aircraft engine, maturing in 2005 2,017 4,205
Other obligations, maturing at various dates until 2005 1,399 2,72318,319 51,857
Less current portion 7,882 14,86710,437 36,990
Obligations under capital leases related to aircraft, aircraft engines and other obligations weredetermined based on interest rates ranging from 3.2% to 9.5% [from 3.8% to 9.5% in 2002].
Minimum lease payments payable under these leases amounting to approximately $20,135, ofwhich $1,816 is interest, are as follows for the next five years: 2004 – $8,405; 2005 – $1,594; 2006 – $1,188;2007 – $1,234 and 2008 – $1,285.
1 1 DEBENTURES
[a] The $10,000 debenture of Transat Tours bears interest at 17.5% and matures on November 1,2005. The debenture is repayable at the option of Transat Tours at a price such that the hold-er earns a compound annual return of 20.5% from its issuance on November 1, 1995, takinginto consideration annual interest already paid and recorded at a rate of 17.5%. The deben-ture, if not redeemed, is convertible into 25% of the common shares of Transat Tours.
The debenture is collateralized by certain intercorporate guarantees and by a movablehypothec on the shares of a number of the Corporation’s subsidiaries and on all of the tan-gible assets of Air Transat and of Transat Tours. Should the Corporation be subject to atakeover bid, the lender has the option to acquire all of the outstanding shares of Transat Toursat a price determined under an agreed formula.
[b] In September 2001, D.M.C. Transat Inc. [“DMC”] issued a debenture in the amount of $2,500bearing interest at a rate of 8.25%. The debenture is repayable in one instalment in September2009 in cash or shares of the Corporation at the Corporation’s option. The debenture is alsorepayable in advance at DMC’s option as of September 2004 in return for a premium where-by the holder will earn a return of 11.25% from its issuance taking into consideration annualinterest already paid and recorded at the rate of 8.25%.
As at October 31, 2003, the liability and equity components of the debenture totalled $750[$819 as at October 31, 2002] and $1,750 [$1,681 as at October 31, 2002] respectively.
[c] On January 10, 2002, the Corporation and Air Transat issued debentures to certain share-holders and management members of the Corporation for an amount of $21,865, bearinginterest at a rate of 6% and maturing in January 2009. The debentures are redeemable inadvance as of January 2005 in return for payment of a penalty equal to three months’ interest.The Corporation and Air Transat must also pay the holders a premium at maturity, uponadvance redemption or at conversion, such that the holders earn a compound annual returnof 15%, taking into consideration interest already paid at a rate of 6%.
In the course of this financing, the Corporation issued 1,421,225 warrants entitling the holdersto subscribe to the same number of common shares of the Corporation at an exercise priceof $6.75 each. These warrants expire on January 10, 2007.
On January 10, 2002, the initial liability component of the debentures totalled $17,743, and anamount of $4,122 was allocated to warrants [note 12]. As at October 31, 2003, the liabilitycomponent of the debentures amounted to $19,231 [$18,407 as at October 31, 2002].
2003 Annual Report, Transat A.T. Inc.

56 2003 Annual Report, Transat A.T. Inc.
1 2 SHARE CAPITAL
AuthorizedAn unlimited number of common shares.
An unlimited number of preferred shares, non-voting, issuable in series, each series bearing thenumber of shares, designation, rights, privileges, restrictions and conditions as determined by the Board ofDirectors.
Issued and outstanding2003 2002
$ $
32,863,553 common shares [32,460,353 in 2002] 111,247 110,200
Due to the Canada Transportation Act, the proportion of the Corporation’s common shares thatcan be held by non-residents is limited to 25%.
Following a transaction carried out in March 1997, a total of 51,671 preferred shares, series 3,became the property of Transat Tours. These shares were excluded from the balance of issued and out-standing shares, and were the only preferred shares, series 3, outstanding. The preferred shares, series 3,were non-voting and were entitled to a dividend equal to any dividend declared on the common shares. Theywere convertible at the rate of one preferred share, series 3, for three common shares and redeemable at theholder’s option at their issue price.
On October 31, 2000, as part of the completion of the acquisition of Regent Holidays Limited,now merged into Transat Tours, 123,800 preferred shares, series 3, were converted into 371,400 commonshares. A total of 103,194 of these common shares became the property of Regent Holidays Limited and wereexcluded from the number of issued and outstanding shares.
On November 8, 2002, the 51,671 preferred shares, series 3, held by Transat Tours were convertedinto 155,013 common shares of the Corporation. Subsequent to the conversion, the number of commonshares held by Transat Tours and excluded from the share capital of the Corporation totalled 258,207. On thesame date, all of the common shares held by Transat Tours were then sold on the market and immediatelyreintegrated into the share capital of the Corporation at their original issue price, namely $303. The transac-tion had no impact on the results of the Corporation.
Subscription rights planAt the annual meeting held on March 27, 2002, the shareholders ratified the renewal, by the
Corporation, of a shareholders’ subscription rights plan [“rights plan”]. The rights plan entitles holders of com-mon shares to acquire, under certain conditions, additional common shares at a price equal to 50% of theirmarket value at the time the rights are exercised. The rights plan is designed to give the Board of Directorstime to consider offers, thus allowing shareholders to receive full and fair value for their shares. The rights planwill terminate at the annual shareholders’ meeting in 2005, unless it is terminated earlier by the Corporation’sBoard of Directors.
Share purchase planA share purchase plan is available to eligible employees and management of the Corporation
and its subsidiaries. Under the plan, as at October 31, 2003, the Corporation was authorized to issue up to717,024 common shares. The plan allows each eligible employee to purchase shares for a subscription limitup to 10% of their annual salary in effect at the time of the subscription. The purchase price of the sharesunder the plan is equal to the weighted average price of the common shares during the five trading days priorto the issue of the shares, less 10%.
During the year, the Corporation issued 144,993 common shares [123,690 in 2002] for a total of$744 [$710 in 2002] under the share purchase plan.
Permanent stock ownership incentive planSubject to participation in the share purchase plan offered to all eligible employees of the Corpo-
ration, the Corporation attributes annually to each eligible senior executive a number of common shares, theaggregate subscription price of which is equal to the maximum percentage of salary contributed, which maynot exceed 10% thereof. Common shares so attributed by the Corporation will vest progressively to the eli-gible senior executive, subject to the senior executive’s retaining, during the vesting period, all the commonshares subscribed for under the Corporation’s share purchase plan.

57
1 2 SHARE CAPITAL [Cont’d]
Stock option plan Options on common shares are granted under a stock option plan for directors, management and
employees. Under the plan, as at October 31, 2003, the Corporation may grant 1,237,232 additional commonshares to eligible persons at a share price equal to the weighted average price of the common shares duringthe five trading days prior to the granting of the options. Options granted prior to 1999 may be exercised during a five-year period after the grant date, whereas those granted as of 1999 may be exercised during a ten-year period but subject to a maximum of one-third during the first two years after the grant date, an addi-tional third in the third year and a final third after the start of the fourth year. The tables below summarize alloutstanding options:
2003 2002
Number Weighted Number Weightedof options average price of options average price
$ $
Beginning of the year 2,120,690 7.91 2,368,050 9.31Granted 629,473 3.84 474,266 6.99Exercised — — (13,104) 6.86Expired (45,000) 12.55 (640,000) 12.32Cancelled (423,497) 7.63 (68,522) 8.70End of the year 2,281,666 6.75 2,120,690 7.91Options exercisable
at the end of the year 1,408,675 7.17 1,258,823 7.59
Outstanding options Exercisable options
Number Number Range of outstanding Weighted Weighted of options Weightedof exercise options as at average average exercisable as at averageprices October 31, 2003 remaining life price October 31, 2003 price$ $ $
3.00 to 4.50 619,473 9.5 years 3.81 189,768 3.814.51 to 6.00 10,000 9.0 years 5.80 — —6.01 to 7.50 863,527 7.0 years 6.84 582,720 6.777.51 to 9.00 397,896 6.5 years 8.05 387,896 8.039.01 to 11.50 390,770 7.4 years 9.90 248,291 9.33
2,281,666 6.75 1,408,675 7.17
During the year ended October 31, 2003, the Corporation granted 629,473 common stockoptions to certain key employees, and to its directors. The average fair value of each option granted was esti-mated on the date of grant using the Black-Scholes option pricing model. The assumptions used and theweighted average fair value of the options on the date of grant for the year ended October 31, 2003 are asfollows:
Risk-free interest rate 4.73%Expected life 6 yearsExpected volatility 55%Dividend yield —Weighted average grant-date fair value $2.09
The following table presents the effect on the financial statements of the Corporation if theawards granted had been recorded using the fair value-based method:
$
Loss from continuing operations (9,147)Adjustment – Stock-based compensation (149)Pro forma loss from continuing operations (9,296)
Pro forma loss per share from continuing operations (0.38)Pro forma diluted loss per share
from continuing operations (0.38)
2003 Annual Report, Transat A.T. Inc.
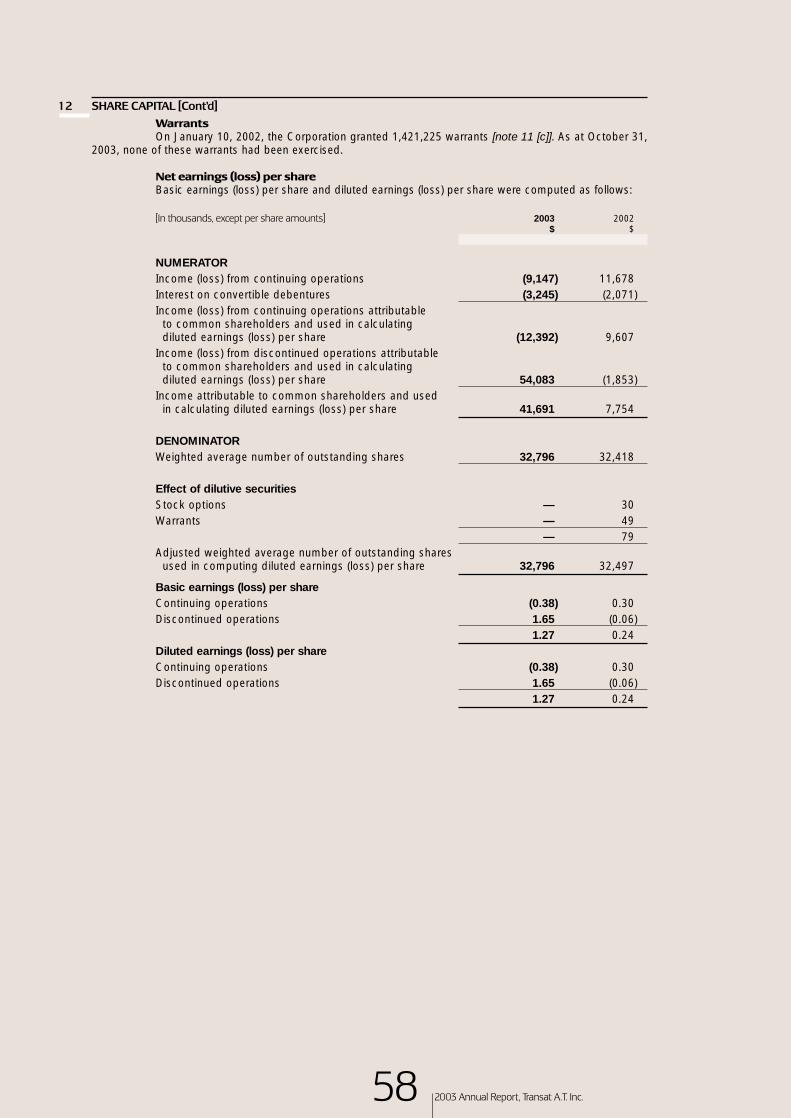
58 2003 Annual Report, Transat A.T. Inc.
1 2 SHARE CAPITAL [Cont’d]
WarrantsOn January 10, 2002, the Corporation granted 1,421,225 warrants [note 11 [c]]. As at October 31,
2003, none of these warrants had been exercised.
Net earnings (loss) per shareBasic earnings (loss) per share and diluted earnings (loss) per share were computed as follows:
[In thousands, except per share amounts] 2003 2002$ $
NUMERATORIncome (loss) from continuing operations (9,147) 11,678Interest on convertible debentures (3,245) (2,071)Income (loss) from continuing operations attributable
to common shareholders and used in calculating diluted earnings (loss) per share (12,392) 9,607
Income (loss) from discontinued operations attributableto common shareholders and used in calculating diluted earnings (loss) per share 54,083 (1,853)
Income attributable to common shareholders and used in calculating diluted earnings (loss) per share 41,691 7,754
DENOMINATORWeighted average number of outstanding shares 32,796 32,418
Effect of dilutive securitiesStock options — 30Warrants — 49
— 79Adjusted weighted average number of outstanding shares
used in computing diluted earnings (loss) per share 32,796 32,497
Basic earnings (loss) per shareContinuing operations (0.38) 0.30Discontinued operations 1.65 (0.06)
1.27 0.24Diluted earnings (loss) per shareContinuing operations (0.38) 0.30Discontinued operations 1.65 (0.06)
1.27 0.24

59
1 2 SHARE CAPITAL [Cont’d]
Convertible debentures and debentures that may be settled in common shares were excludedfrom the computation of diluted earnings (loss) per share from continuing operations for the years endedOctober 31, 2003 and 2002 as a result of their antidilutive effect. The potential effect of these securities onthe denominator is 6,307,387 shares for the year ended October 31, 2003 [4,418,816 for the year endedOctober 31, 2002].
In computing diluted loss per share from continuing operations for the year ended October 31,2003, a total of 2,281,666 common stock options were excluded from the computation as a result of theirantidilutive effect. For the year ended October 31, 2002, a total of 984,512 common stock options wereexcluded from the computation of diluted earnings per share from continuing operations because the exerciseprice on these options exceeded the average price of the Corporation’s shares.
In addition, for the year ended October 31, 2003, the warrants were not taken into consideration inthe computation of the diluted loss from continuing operations as a result of their antidilutive effect. The poten-tial effect of these securities on the denominator is 1,421,225 shares for the year ended October 31, 2003.
1 3 CONVERTIBLE DEBENTURES
On February 19, 2002, the Corporation issued $51,105 of convertible unsecured subordinateddebentures maturing on March 1, 2007. The debentures bear interest at 9%, payable semi-annually in cashor in common shares of the Corporation, at its option. The debentures are convertible into common shares ofthe Corporation, at a conversion price of $8.75 per share, at the holder’s option at any time.
On and after March 1, 2005 and prior to March 1, 2006, the debentures could be redeemed at parby the Corporation provided its common shares are traded at a price of $10.94 or more for 20 consecutivetrading days before the notice of redemption. After March 1, 2006, the debentures could be redeemed at par.The Corporation will have the option to repay the debentures, in whole or in part, in cash or by delivering anumber of common shares obtained by dividing the principal amount of the debentures by 95% of the marketprice of the Corporation’s shares at the redemption date or at maturity.
1 4 AMORTIZATION2003 2002
$ $
[restated – note 3]
Property, plant and equipment 36,654 39,322Other assets 5,484 3,867
42,138 43,189
2003 Annual Report, Transat A.T. Inc.

60 2003 Annual Report, Transat A.T. Inc.
1 5 DISCONTINUED OPERATIONS
On October 31, 2003, the Corporation completed the sale of its online travel agency in France,Caïd S.A. [carrying out business under the name Anyway.com], for a cash consideration of C53,824 [$83,163]resulting in a gain on disposal of C34,356 [$53,101] net of related income taxes and selling expenses totallingC12,151 [$18,775] and C3,991 [$6,166] respectively.
The results from the discontinued operations presented on the statement of income are detailedas follows:
2003 2002$ $
Revenues 12,860 13,190Operating expenses 10,611 15,411
2,249 (2,221)Amortization 946 617Other interest and financial expenses 340 13Interest income (19) —
1,267 630Income before income taxes and gain on disposal 982 (2,851)Income taxes (recovery)
Current 345 —Future (345) (998)
— (998)Income (loss) before gain on disposal 982 (1,853)Gain on disposal, net of related income taxes
of $18,775 53,101 —Income (loss) from discontinued operations 54,083 (1,853)
Net cash flows relating to the discontinued operations presented on the statement of cash flowsis detailed as follows:
2003 2002$ $
Operating activities 9,466 780Investing activities 69,277 (919)Financing activities (885) 573Cash flows relating to discontinued operations 77,858 434
At the time of the disposal of the assets and liabilities related to the discontinued operations, thecarrying amount was detailed as follows:
$
Cash and cash equivalents 6,620Accounts receivable 19,437Property, plant and equipment 2,817Other assets 5,291Total assets 34,165Accounts payable and accrued liabilities 25,876Other liabilities 3,168Total liabilities 29,044Net assets related to discontinued operations 5,121

61
1 6 RESTRUCTURING CHARGE
During the year, the Corporation recorded a restructuring charge totalling $47,972 before incometaxes. This program included a change in the management structure and a reorganization that affected boththe nature and focus of its operations in France and Canada.
The amount recorded includes cash charges amounting to $13,489 and a write-off of property,plant and equipment and other assets totalling $34,483. Cash charges consist mainly of employment termi-nation benefits and contract termination costs.
The write-off of property, plant and equipment and other assets arises primarily from the gradualphase out of the use of the six Lockheed L-1011-500 aircraft of the Corporation through April 30, 2004. Thisamount includes $21,462 in the form of a write-off for the three aircraft that ceased operations in September2003, as well as $12,253 for an impairment write-down corresponding to the excess of the carrying amount,at the time recoverability is assessed, over the fair value of long-lived assets calculated using the estimatedfuture cash flows directly related to the three remaining aircraft to be phased out by April 30, 2004.
The following table highlights the activity and balance of the restructuring provision for the yearended October 31, 2003.
Amounts Cumulative drawdowns Balance as atincurred during October 31,
the year Cash Non-cash 2003$ $ $ $
Employment termination benefits 11,663 6,049 — 5,614Contract termination costs 767 717 — 50Write-off of property, plant and
equipment and other assets 34,483 — 34,483 —Other costs 1,059 619 — 440
47,972 7,385 34,483 6,104
1 7 INCOME TAXES
Income taxes on income (loss) from continuing operations as presented differs from the amountcalculated by applying the statutory income tax rate to income (loss) before income taxes, non-controllinginterest in subsidiaries’ results and income (loss) from discontinued operations.
The reasons for this difference and the effect on income tax expense are as follows:
2003 2002
$ % $ %
Income taxes at the Canadian statutory rate (4,745) 34.1 8,130 37.8
Change in income taxes arising from the following:
Non-deductible items 1,811 (13.0) 2,310 10.7Recognition of previously
unrecorded tax benefits (5,321) 38.2 (1,127) (5.2)Unrecorded tax benefits 957 (6.9) — —Large corporations tax 386 (2.8) 205 1.0Other 1,379 (9.9) 131 0.6
(5,533) 39.7 9,649 44.9
2003 Annual Report, Transat A.T. Inc.

62 2003 Annual Report, Transat A.T. Inc.
1 7 INCOME TAXES [Cont’d]
The tax effects of temporary differences giving rise to future income tax assets and liabilities are as follows:
2003 2002$ $
Future income taxesNet operating loss carry-forwards
and other tax deductions 24,685 39,407Carrying amount of capital assets over tax basis (12,410) (16,898)Other 3,624 2,288Total future income taxes 15,899 24,797Valuation allowance (12,985) (17,127)Net future income tax assets 2,914 7,670
Current future income tax assets 959 1,352Long-term future income tax assets 13,371 18,028Long-term future income tax liabilities (11,416) (11,710)Net future income tax assets 2,914 7,670
Losses carried forward and other temporary differences, which are available to reduce future taxable income of certain subsidiaries, for which no related income tax benefits have been recognizedamounted to C22,829 [$35,157] as at October 31, 2003 [C31,121 [$47,989] as at October 31, 2002]; of theselosses and differences, approximately C20,695 [$31,870] have expiry dates of three to seven years, whereasthe balance has no specific expiry date.
Undistributed earnings of the Corporation’s foreign subsidiaries are considered to be indefinitelyreinvested and, accordingly, no provision for income taxes has been provided thereon. Upon distribution ofthese earnings in the form of dividends or otherwise, the Corporation may be subject to withholding taxes.
1 8 RELATED PARTY TRANSACTIONS AND BALANCES
In the normal course of its operations, the Corporation entered into transactions with relatedcompanies. These transactions are measured at the exchange amount, which is the amount of considerationdetermined and agreed to by the related parties. Significant transactions between related companies are asfollows:
2003 2002$ $
Revenues from companies subject to significant influence 2,157 2,669Operating expenses incurred from companies subject
to significant influence 120,729 85,163
Operating expenses consist primarily in the purchase of airplane seats.The balances receivable from and payable to related companies included in accounts receivable
and accounts payable and accrued liabilities are as follows:2003 2002
$ $
Accounts receivable from companies subjectto significant influence 2,028 4,389
Accounts payable and accrued liabilities due tocompanies subject to significant influence 2,129 1,449
1 9 EMPLOYEE FUTURE BENEFITS
As at October 31, 2003, obligations under accrued pension benefits and the actuarial deficitamounted to $3,360 [$2,147 as at October 31, 2002]. For the year ended October 31, 2003, the net pensionexpense totalled $627 [$476 for the year ended October 31, 2002].

63
20 COMMITMENTS AND CONTINGENCIES
[a] The Corporation’s commitments under operating leases relating to aircraft, land, automotiveequipment, telephone systems, maintenance contracts and office premises amounted to$411,888 broken down as follows: $42,104, US$274,848 and C4,683. In addition, as part ofcertain aircraft financings maturing through 2008, the Corporation guaranteed a portion of theresidual value amounting to US$56,518 [$74,586].
The residual values guaranteed by the Corporation and the annual instalments to be madeunder these leases and related derivative financial instruments during the next five years areas follows:
Residual value Instalment$ $
2004 — 74,1522005 — 72,8232006 — 69,7352007 18,052 60,3492008 56,534 55,014
[b] In 2009, the minority shareholder in DMC may require the Corporation to buy the shares ofDMC which it holds at a price equal to the fair market value. The price paid may be settled, atthe Corporation’s option, in cash or by a share issue.
[c] On January 22, 2001, the Corporation acquired a 50% interest in the common shares ofincoming tour operator Jonview Corporation [“Jonview”]. Under the agreement, the Corpor-ation has a call option and other Jonview shareholders have a put option related to the acqui-sition of the balance of the shares in 2004 at a price to be determined based on the averageearnings realized during two of the three best years prior to the acquisition. The Corporationexpects to exercise its option in 2004.
[d] On March 5, 2001, the subsidiary, Look Voyages S.A., acquired a 40% interest in incomingtour operator Tourgreece S.A. Under the agreement, the Corporation has a call option relatedto the acquisition of the balance of shares in 2004. The Corporation expects to exercise itsoption in 2004 in order to increase its interest in this company.
[e] In the normal course of its operations, the Corporation is exposed to various claims and legalproceedings. These disputes often involve numerous uncertainties and the outcome of theindividual cases is unpredictable. According to management, these claims and proceedingsare adequately provided for or covered by insurance policies and their settlement should nothave a significant negative impact on the Corporation’s financial situation.
21 GUARANTEES
In the normal course of business, the Corporation has entered into agreements that contain fea-tures which meet the definition of a guarantee. These agreements provide for indemnification and guaranteesto counterparties in transactions such as operating leases, irrevocable letters of credit, and security contracts.
These agreements may require the Corporation to compensate the counterparties for costs andlosses incurred as a result of various events including breaches of representations and warranties, loss of ordamages to property, claims that may arise while providing services and environmental liabilities.
Notes 9 ,10, 11, 13 and 20 to the financial statements provide information relating to some of theseagreements. The following constitutes additional disclosure.
Operating leasesThe Corporation’s subsidiaries have general indemnity clauses in many of their airport and other
real estate leases whereby they, as lessee, indemnify the lessor against liabilities related to the use of theleased property. These leases mature at various dates through 2028. The nature of the agreements variesbased on the contracts and therefore prevents the Corporation from estimating the total potential amount its subsidiaries would have to pay to lessors. Historically, the Corporation’s subsidiaries have not made anysignificant payments under such agreements and have liability insurance protecting them for the obligationsundertaken.
2003 Annual Report, Transat A.T. Inc.

64 2003 Annual Report, Transat A.T. Inc.
2 1 GUARANTEES [Cont’d]
Irrevocable letters of creditThe Corporation has entered into irrevocable letters of credit with some of its suppliers. The
Corporation guarantees the payment of certain tourist services such as hotel rooms that it has undertaken topay for whether it sells the services or not. These agreements, which are entered into for significant blocks oftourist services, typically cover a one year period and are renewable. The Corporation has also issued lettersof credit to provincial regulatory agencies in Ontario and British Columbia guaranteeing amounts to theCorporation’s clients for the performance of its obligations. As at October 31, 2003, the amount guaranteedtotalled $22,468. Historically, the Corporation has not made any significant payments under such letters of credit.
Security contractsThe Corporation has entered into security contracts whereby it has guaranteed a prescribed
amount to its clients at the request of regulatory agencies for the performance of the obligations given in mandates by its clients during the term of the licenses granted to the Corporation for its travel agent andwholesaler activities in the province of Québec. These agreements typically cover a one-year period and arerenewable annually. As at October 31, 2003, the amount guaranteed totals $1,420. Historically, the Corporationhas not made any significant payments under such agreements.
As at October 31, 2003, no amounts have been accrued with respect to the above-mentionedagreements.
2 2 FINANCIAL INSTRUMENTS
In the normal course of its operations, the Corporation is exposed to risks related to exchange ratevariations for certain currencies, interest-rate variations and fuel cost variations. The Corporation managesthese risks by entering into various financial instruments. The Corporation’s management is responsible fordetermining the acceptable level of risk and only uses financial instruments to hedge existing commitmentsor obligations and not to realize a profit on trading operations.
Credit risk related to financial instrumentsThe theoretical risk to which the Corporation is exposed in relation to financial instruments is
limited to the replacement cost of contracts at market rates in effect in the event of default by one of the parties. Management is of the opinion that the credit risk related to financial instruments is well controlledbecause the Corporation only enters into agreements with large financial institutions and multinational companies.
Management of fuel price, foreign exchange and interest-rate risksThe Corporation has entered into fuel purchasing contracts to manage fuel price fluctuation risks.
As at October 31, 2003, 45% of the requirements for fiscal 2004 were covered by fuel purchasing contracts[as at October 31, 2002, 42% of the requirements for fiscal 2003 were covered].
The Corporation has also entered into foreign exchange forward contracts for the purchase andsale of foreign currencies, expiring in less than one year, to manage foreign exchange risks. As at October 31,2003, the face value of these contracts to purchase foreign currencies amounted to $267,370. As at October31, 2002, the face value of these contracts to purchase and sell foreign currencies totalled $328,271 and$24,783 respectively.
The Corporation has entered into interest-rate and foreign currency swap agreements related tocertain commitments maturing at various dates until 2008. These swaps modify the foreign currency and interestrate characteristics of these commitments. As at October 31, 2003, these interest-rate and foreign currencyswap agreements each have a face value of $40,358 [$48,444 as at October 31, 2002].
The fair value of financial instruments generally reflects the estimated amounts that the Corpo-ration would receive from settlements of favourable contracts or that it would be required to pay to cancelunfavourable contracts at year-end. These estimated fair values are based on the rates obtained from largefinancial institutions and multinational companies. As at October 31, 2003 and 2002, the fair values in the eventof a settlement were as follows:
2003 2002
Favourable Unfavourable Favourable Unfavourable$ $ $ $
Foreign exchange forward contracts 152 19,113 955 2,389
Fuel purchase contracts 3,145 686 1,126 807Interest-rate swap agreements 13,064 — 15,627 —Foreign currency
swap agreements 10,526 — — 65326,887 19,799 17,708 3,849

65
2 2 FINANCIAL INSTRUMENTS [Cont’d]
Credit, interest-rate and foreign currency risksThe Corporation believes it is not exposed to a significant concentration of credit risk. Cash and
cash equivalents are invested on a diversified basis in corporations benefiting from an excellent credit rating.Accounts receivable generally arise from the sale of vacation packages to individuals through retail travelagencies and the sale of seats to tour operators which are dispersed over a wide geographic area. As atOctober 31, 2003 and 2002, no debtor represented more than 10% of the total accounts receivable.
The Corporation is exposed to interest-rate fluctuations and to risks in the exchange rate fluc-tuations of certain currencies since certain long-term debts and certain leasing contracts bear interest at floating rates and are mainly denominated in US dollars.
Fair value of financial instruments presented on the balance sheetsDue to their short-term nature, the carrying amount of current financial assets and liabilities
reflected on the consolidated balance sheets approximates their fair value.The fair value of long-term debt and obligations under capital leases, including the current por-
tion, is based on the rates in effect for financial instruments with similar terms and maturities. As at October31, 2003 and 2002, the carrying amount and fair value of long-term financial instruments are as follows:
2003 2002
Carrying Fair Carrying Fairvalue value value value
$ $ $ $
Long-term debt 17,031 17,121 30,845 31,021Obligations under capital leases 18,319 18,367 51,857 52,344
The fair value of the liability component of the debentures could not be determined with sufficientreliability due to their specific nature.
2 3 SEGMENT DISCLOSUREThe Corporation has determined that it conducts its activities in a single industry segment,
namely holiday travel. Therefore, the statements of income include all the required information. With respectto geographic areas, the Corporation operates mainly in Canada and in Europe. Geographic intersegmentsales are accounted for at prices that take into account market conditions and other considerations.
FranceCanada and other Total
$ $ $
2003Revenues from third parties 1,525,846 570,803 2,096,649Operating expenses 1,435,190 586,497 2,021,687
90,656 (15,694) 74,962
Amortization 36,514 5,624 42,138Restructuring costs 42,214 5,758 47,972Additions to property, plant and equipment 7,807 4,706 12,513Property, plant and equipment and goodwill 128,816 42,607 171,423
2002Revenues from third parties 1,494,976 578,532 2,073,508Operating expenses 1,416,686 582,674 1,999,360
78,290 (4,142) 74,148
Amortization 38,804 4,385 43,189Additions to property, plant and equipment 18,965 3,461 22,426Property, plant and equipment and goodwill 189,930 49,321 239,251
24 COMPARATIVE FIGURES
Certain comparative figures were reclassified to conform to the presentation adopted in the current year.
2003 Annual Report, Transat A.T. Inc.

66 2003 Annual Report, Transat A.T. Inc.
2003 2002 2001 2000 1999
Consolidated statements of incomeRevenues 2,096,649 2,073,508 2,121,886 1,922,550 1,623,315Operating expenses 2,021,687 1,999,360 2,063,863 1,820,026 1,532,538
74,962 74,148 58,023 102,524 90,777Expenses and other income
Amortization 42,138 43,189 49,659 33,252 32,905Restructuring charge 47,972 — 116,972 — —Interest on long-term debt, obligations under
capital leases and debentures 9,771 12,418 11,310 10,524 9,720Other interest and financial expenses 3,071 4,563 3,762 2,417 2,608Interest income (9,530) (5,628) (10,043) (10,296) (8,584)Foreign exchange (gain) loss on long-term
monetary items (3,873) (984) 2,303 2,021 (2,527)Share of net income of companies
subject to significant influence (673) (919) (939) (1,023) (2,918)88,876 52,639 173,024 36,895 31,204
Income (loss) before the following items (13,914) 21,509 (115,001) 65,629 59,573Income taxes (recovery) (5,533) 9,649 (19,909) 27,522 22,834Non-controlling interest in subsidiaries’ results (766) (182) (117) — —
Income (loss) before goodwill charges (9,147) 11,678 (95,209) 38,107 36,739Goodwill charges — — 4,442 2,862 2,542
Income (loss) from continuing operations for the year (9,147) 11,678 (99,651) 35,245 34,197
Income (loss) from discontinued operations for the year 54,083 (1,853) — — —
Net income (loss) for the year 44,936 9,825 (99,651) 35,245 34,197Basic earnings (loss) per share
Before goodwill charges (0.38) (0.30) (2.95) 1.18 1.09Continuing operations (0.38) 0.30 (3.09) 1.09 1.01Discontinued operations 1.65 (0.06) — — —
1.27 0.24 (3.09) 1.09 1.01Diluted earnings (loss) per share2
Before goodwill charges (0.38) 0.30 (2.95) 1.17 1.08Continuing operations (0.38) 0.30 (3.09) 1.08 1.00Discontinued operations 1.65 (0.06) — — —
1.27 0.24 (3.09) 1.08 1.00Cash flows relating to:
Operating activities (continuing operations) 71,697 183,234 (12,001) 52,585 88,908Investing activities (continuing operations) (4,275) (25,864) (59,441) (88,048) (28,430)Financing activities (continuing operations) (56,278) 17,700 8,660 8,996 (42,330)
Net change in cash and cash equivalents from continuing operations 11,144 175,070 (62,782) (26,467) 18,148
Net change in cash and cash equivalents from discontinued operations 77,858 434 — — —
Net change in cash and cash equivalents 89,002 175,504 (67,782) (26,467) 18,148
Cash and cash equivalents, end of year 349,125 260,123 84,619 147,401 173,868Operating cash flow 52,863 74,015 59,357 75,226 63,391Total assets 714,757 773,468 626,442 681,162 543,784Long-term debt and obligations under
capital leases (including current portion) 35,350 82,702 147,496 144,135 104,343Debentures 29,981 29,226 10,894 10,000 10,000Shareholders’ equity 241,346 193,743 132,223 229,507 202,587Debt ratio1 0.66 0.75 0.78 0.66 0.63Book value per share 7.34 5.97 4.09 7.14 6.14Return on weighted average shareholders’ equity 20.66% 6.03% -55.17% 16.31% 18.02%Shareholding statistics (in thousands)
Common shares outstanding, end of year 32,864 32,460 32,324 32,144 32,968Weighted average number of common shares
outstanding (before dilution) 32,796 32,418 32,248 32,158 33,899Weighted average number of common shares outstanding (after dilution)2 32,796 32,497 32,248 34,353 34,084
1 Represents liabilities over liabilities plus shareholders’ equity.2 See note 12 of the audited consolidated financial statements.
Supplementary financial data
[in thousands of Canadian dollars except per share data]

67 2003 Annual Report, Transat A.T. Inc.
Jean-Marc EustacheChairman of the Board,President and Chief Executive Officer,Transat A.T. Inc.
André Bisson, O.C.Chairman of the Board,CIRANO
Lina De CesareExecutive Vice-President,Tour Operators, Transat A.T. Inc.
Benoît DeschampsCorporate Director and Corporate Finance Advisor
Marcel Gagnon Director, InvestmentsManufacturing SectorCDP Capital, Americas
Jean GuertinCorporate Advisor and Director,Honorary Professor, HEC Montréal
H. Clifford Hatch Jr.President and Chief Executive Officer,Aurdisyl Management Corporation and Cliffco Investments Limited, andCorporate Director
Jacques Simoneau, P. Eng., Ph.D.Senior Vice-President, Industries and Services,Fonds de solidarité FTQ
Helen K. SinclairPresident and Chief Executive Officer,BankWorks Trading Inc.
Philippe SureauExecutive Vice-President,Transat A.T. Inc.
John D. ThompsonDeputy Chairman,Montreal Trust Company of Canada
Peter G. White Co-Chief Operating Officerand Secretary of Hollinger Inc.and Executive Vice-President,Ravelston Corporation and ArgusCorporation Limited
TransatJean-Marc EustachePresident and Chief Executive Officer
Philippe SureauExecutive Vice-President
Lina De CesareExecutive Vice-President, Tour Operators
Jean-Marc BélisleVice-President and Chief Information Officer
Bernard BussièresVice-President,General Counsel and Corporate Secretary
André De MontignyVice-President, Corporate Development
Nelson GentilettiVice-President, Finance and Administration and Chief Financial Officer
Louise PichéCorporate Vice-President, Human Resources
Air TransatAllen B. GrahamPresident and Chief Executive Officer
Air Transat HolidaysDaniel GodboutPresident and Chief Executive Officer
Brok’AirDorian MassieuxDirector, Group Services
CameleonLina De Cesare President
Club Voyages (France)Patricia ChastelGeneral Manager
ConsultourPhilippe SureauPresident
DMC TransatGeorges VacherPresident and Chief Executive Officer
exitnow.caGisèle PoirierGeneral Manager
HandlexLuc TrépanierPresident and Chief Executive Officer
Jonview CanadaDonald ObonsawinPresident
Look VoyagesJean-Marc BattaGeneral Manager
RêvatoursMarianne BabouderPresident
Star AirlinesCédric PastourPresident and Chief Executive Officer
TourgreeceVassilis P. SakellarisPresident
Trafic ToursLina De CesarePresident
Vacances Air Transat (France)Patrice CaradecGeneral Manager
World of Vacations/Nolitour Sam GhorayebPresident and Chief Executive Officer
Board of Directors
Officers

Head office
Transat A.T. Inc.Place du Parc300 Léo-Pariseau Street, Suite 600Montreal, Quebec H2X 4C2Telephone: (514) 987-1660Fax: (514) [email protected]
Information
For additional informationon the Corporation,investors and analysts areinvited to contact, in writing, the Vice-President, Finance and Administration and Chief Financial Officer.
Vous pouvez obtenir un exemplaire de ce rapportannuel en français en écrivant au vice-président, finances et administrationet chef de la direction financière.
Stock Exchange
The common sharesof the Corporation are listedon the Toronto Stock Exchangeunder the ticker symbol TRZ.
Transfer Agent and Registrar
Computershare TrustCompany of Canada1500 University Street, Suite 700Montreal, Quebec H3A 3F8
Auditors
Ernst & Young LLPMontreal, Quebec
Graphic design: Claude Angers
Illustrations: Élise Palardy
Photography and imaging: Yves Demers Paris
The annual meeting
of shareholders
will be held
on March 17, 2004,
10:00 a.m.
at:
Fairmont The Queen Elizabeth
Marquette-Jolliet Room
900 René-Lévesque Blvd. West
Montreal, Quebec
68 2003 Annual Report, Transat A.T. Inc.
Information
for shareholders
and investors

Transat A.T. Inc.
Place du Parc300 Léo-Pariseau Street, Suite 600Montreal, Quebec H2X 4C2Canada