transcriptional regulation of the human alcohol
TRANSCRIPT

TRANSCRIPTIONAL REGULATION OF THE HUMAN
ALCOHOL DEHYDROGENASES AND ALCOHOLISM
Sirisha Pochareddy
Submitted to the faculty of the University Graduate School in partial fulfillment of the requirements
for the degree Doctor of Philosophy
in the Department of Biochemistry and Molecular Biology, Indiana University
September 2010

ii
Accepted by the Faculty of Indiana University, in partial fulfillment of the requirements for the degree of Doctor of Philosophy.
Howard J. Edenberg, Ph.D., Chair
Maureen A. Harrington, Ph.D.
Doctoral Committee
David G. Skalnik, Ph.D.
Ann Roman, Ph.D.
July 30, 2010

iii
This work is dedicated to my parents and my brother for their unwavering support
and unconditional love.

iv
ACKNOWLEDGEMENTS
I would like to sincerely thank my mentor Dr. Howard Edenberg, for his
guidance, support throughout the five years of my research in his lab. It has been
an amazing learning experience working with him and I am confident this training
will help all through my research career.
I would like to thank members of my research committee, Dr. Maureen
Harrington, Dr. David Skalnik and Dr. Ann Roman. I am grateful to them for their
guidance, encouraging comments, time and effort. I greatly appreciate Dr.
Harrington’s questions during the committee meeting that helped me think
broadly about my area of research. I am very thankful to Dr. Skalnik for reading
through my manuscript and giving his valuable comments. My special thanks to
Dr. Ann Roman for staying on my committee even after her retirement.
I am also thankful to Dr. Jeanette McClintick for her patience in answering
my never ending list of questions about the microarray analysis. She also had
been a great support during the tough times in the lab. I would like to thank her
making an effort to remember birthdays of all lab members and baking her
awesome brownies.
I would like to thank other lab members, Ron Jerome, Jun Wang and
Sowmya Jairam. It was a great pleasure to know Ron during the last year of my
stay. He made the toughest years of Ph.D. less stressful and more fun. Jun was
always helpful in the lab. I am also thankful to Sowmya for sharing her ideas with
me and helping me think more about ADH transcriptional regulation. I would also
like to thank Dr. Xiaoling Xuei and Dr. Yunlong Liu for all their help.

v
I would like to thank my best friends, Dr. Sirisha Asuri and Dr. Raji
Muthukrishnan for their beautiful, unconditional friendship. I am also thankful to
my other friends Sulo, Aditi, Heather, and Chandra for all the fun.
Finally, I would like to thank my family members. My mom Prabhavathy
and my dad P.S. Reddy have been there for me always, supporting all my
decisions. They have been with me through the highs and the lows and always
made me believe that everything is going to be fine. My dream of doing research
and getting a Ph.D. would not have been possible without their strong emotional
support. Another pillar of support in my life is my brother Subhash. He is my
guide, teacher, friend, brother and has been a great source of strength in the
most difficult times. Anna, thank you so much for everything. I would also like to
thank my sister-in-law, Jhansi for being a sister I never had and a great friend.
Lastly, I would like to thank cute little ones - my nephew Arjun, my niece Megha,
Nishant, Niha and Charan, for lifting my spirits with their innocent smiles.
vi
ABSTRACT
Sirisha Pochareddy
TRANSCRIPTIONAL REGULATION OF THE HUMAN ALCOHOL
DEHYDROGENASES AND ALCOHOLISM
Alcohol dehydrogenase (ADH) genes encode proteins that metabolize
ethanol to acetaldehyde. Humans have seven ADH genes in a cluster. The
hypothesis of this study was that by controlling the levels of ADH enzymes, cis-
regulatory regions could affect the risk for alcoholism. The goal was thus to
identify distal regulatory regions of ADHs. To achieve this, sequence
conservation across 220 kb of the ADH cluster was examined. An enhancer (4E)
was identified upstream of ADH4. In HepG2 human hepatoma cells, 4E
increased the activity of an ADH4 basal promoter by 50-fold. 4E was cell specific,
as no enhancer activity was detected in a human lung cell line, H1299. The
enhancer activity was located in a 565 bp region (4E3). Four FOXA and one
HNF-1A protein binding sites were shown to be functional in the 4E3 region. To
test if this region could affect the risk for alcoholism, the effect of variations in
4E3 on enhancer activity was tested. Two variations had a significant effect on
enhancer activity, decreasing the activity to 0.6-fold. A third variation had a small
but significant effect. The effect of variations in the ADH1B proximal promoter
was also tested. At SNP rs1229982, the C allele had 30% lower activity than the
A allele.

vii
In addition to studying the regulatory regions of ADH genes, the effects of
alcohol on liver-derived cells (HepG2) were also explored. Liver is the primary
site of alcohol metabolism, and is highly vulnerable to injuries due to chronic
alcohol abuse. To identify the effects of long term ethanol exposure on global
gene expression and alternative splicing, HepG2 cells were cultured in 75 mM
ethanol for nine days. Global gene expression changes and alternative splicing
were measured using Affymetrix GeneChip® Human Exon 1.0 ST Arrays. At the
level of gene expression, genes involved in stress response pathways, metabolic
pathways (including carbohydrate and lipid metabolism) and chromatin regulation
were affected. Alcohol effects were also observed on alternative transcript
isoforms of some genes.
Howard J. Edenberg, Ph.D.
Committee Chair.

viii
TABLE OF CONTENTS
LIST OF TABLES ................................................................................................ xii
LIST OF FIGURES ............................................................................................. xiii
ABBREVIATIONS ............................................................................................... xiv
I. INTRODUCTION ............................................................................................... 1
1. Alcohol dehydrogenases .............................................................................. 1
2. Human ADH cluster ...................................................................................... 5
3. Additional pathways of alcohol metabolism .................................................. 6
4. Alcoholism .................................................................................................... 7
5. ADHs and alcoholism ................................................................................... 9
6. Transcriptional regulation of ADHs ............................................................. 11
7. Identification of cis-regulatory regions ........................................................ 17
8. Transcription factors ................................................................................... 18
8.a. FoxA family ......................................................................................... 19
8.b. HNF-1A ............................................................................................... 20
9. Alcohol and the liver ................................................................................... 21
10. Alternative transcript isoforms and diseases ............................................ 24
11. Global transcriptional profiling .................................................................. 27
12. Research objectives ................................................................................. 32

ix
II. MATERIALS AND METHODS ........................................................................ 34
1. Identification of putative distal regulatory elements .................................... 34
2. Cloning of test fragments ............................................................................ 34
3. Transient transfections and reporter gene assays ...................................... 38
4. Electrophoretic mobility shift assays (EMSA) ............................................. 40
5. Site directed mutagenesis .......................................................................... 42
6. Generation of the 4E haplotypes ................................................................ 42
7. Long-term treatment of HepG2 cells with ethanol....................................... 44
8. RNA extraction, labeling and hybridization ................................................. 44
9. Exon array data analysis ............................................................................ 45
10. Validation of differential gene expression by qRT-PCR ............................ 51
11. Validation of alternative splicing by qRT-PCR .......................................... 52
III. RESULTS ....................................................................................................... 54
1. Identification of an enhancer in the ADH cluster ......................................... 54
2. Characterization of the enhancer element 4E ............................................ 58
2.a. Effect of 4E on heterologous promoters .............................................. 58
2.b. Function of 4E in non-hepatoma cells ................................................. 58
2.c. Localization of sequences required for 4E enhancer activity ............... 59
2.d. Identification of potential protein binding sites in 4E ........................... 61
2.e. Effect of mutations on enhancer activity.............................................. 66

x
3. Effects of regulatory variations on gene expression ................................... 68
3.a. Effects of natural variations on 4E3 enhancer activity ......................... 68
3.b. Effects of polymorphisms on ADH1B promoter activity ....................... 71
4. Effects of alcohol on gene expression ........................................................ 77
4.a. Validation of differential gene expression results by qRT-PCR ......... 106
5. Effects of chronic alcohol exposure on RNA splicing ................................ 108
5.a. Validation of differential alternative splicing ...................................... 127
IV.DISCUSSION ............................................................................................... 130
1. Regulation of ADHs by distal cis-regulatory regions ................................. 130
2. Regulatory variations and effects on function ........................................... 133
3. Effects of alcohol on gene expression ...................................................... 136
3.a. Acute phase response ...................................................................... 137
3.b. Nrf2 oxidative stress response pathway............................................ 139
3.c. Amino acid metabolism ..................................................................... 141
3.d. Carbohydrate metabolism ................................................................. 142
3.e. Lipid metabolism ............................................................................... 143
3.f. Genes involved in chromatin regulation ............................................. 146
3.g. Genes associated with alcoholism .................................................... 147
4. Effects of alcohol on alternative splicing ................................................... 147
5. Future directions ....................................................................................... 150

xi
APPENDIX ....................................................................................................... 153
REFERENCES ................................................................................................. 176
CURRICULUM VITAE

xii
LIST OF TABLES
Table 1. Tissue distribution and substrate specificity of human ADH isozymes. .. 3
Table 2. Primers used to clone test fragments. .................................................. 36
Table 3. Putative distal regulatory elements. ...................................................... 37
Table 4. Oligonucleotides used in EMSA. .......................................................... 41
Table 5. Primers used in site-directed mutagenesis. .......................................... 43
Table 6. Primers used for validation of alternative splicing. ................................ 53
Table 7. Cell specific activity of 4E. .................................................................... 59
Table 8. Allele and genotype frequencies of SNPs in the 4E3 region. ................ 69
Table 9. Allele and genotype frequencies for two SNPs in the ADH1B
proximal promoter region. ................................................................................... 72
Table 10. Tested haplotypes of the ADH1B proximal promoter. ......................... 74
Table 11. Effects of ethanol on gene expression at different false discovery
rates. .................................................................................................................. 79
Table 12. Pathways affected by chronic ethanol exposure. ................................ 84
Table 13. Differentially expressed genes within pathways that were
significantly affected by chronic alcohol exposure. ........................................... 105
Table 14. Effects of chronic ethanol exposure on splicing at different false
discovery rates. ................................................................................................ 108
Table 15. Probe sets probably differentially alternatively spliced in response
to chronic ethanol treatment. ............................................................................ 126

xiii
LIST OF FIGURES
Figure 1. The primary pathway of alcohol metabolism. ........................................ 1
Figure 2. Diagram of the human ADH cluster. ...................................................... 5
Figure 3. Schematic representation of cis-acting elements in the proximal
promoters of ADH genes. ................................................................................... 13
Figure 4. Generation of alternative transcript isoforms. ...................................... 26
Figure 5. Exon array data analysis. .................................................................... 50
Figure 6. Location of the tested putative regulatory regions. .............................. 55
Figure 7. Six putative regulatory regions decrease transcription. ....................... 56
Figure 8. 4E enhances the activity of the ADH4 promoter. ................................. 57
Figure 9. The enhancer function of 4E is located in a 565 bp region. ................. 60
Figure 10. Annotated genomic sequence of the 4E3 region. .............................. 62
Figure 11. FOXA proteins bind to putative sites in 4E3. ..................................... 63
Figure 12. HNF-1A competitor increases FOXA binding. ................................... 65
Figure 13. Effects of site-directed mutations on enhancer function. ................... 67
Figure 14. Effects of polymorphisms on enhancer function. ............................... 70
Figure 15. Variations in the ADH1B proximal promoter region. .......................... 74
Figure 16. Variations in the ADH1B promoter affect activity. .............................. 76
Figure 17. Distribution of fold changes of differentially expressed genes. .......... 79
Figure 18. qRT-PCR validation of differential gene expression. ....................... 107
Figure 19. 5’ and 3’ edge effects in exon array data. ........................................ 111
Figure 20. Examples of different groups of alternatively spliced genes. ........... 114
Figure 21. Detection of alternative isoforms for validation. ............................... 129
xiv
ABBREVIATIONS
µg microgram
µl microliter
µM micromolar
0C degree centigrade
1Basal ADH1B proximal promoter
4Basal ADH4 proximal promoter
ADH alcohol dehydrogenase
ALDH aldehyde dehydrogenase
ANOVA analysis of variance
AP-1 activator protein-1
Arg arginine
bp base pair
C/EBP CCAAT/ enhancer binding protein
cDNA complementary DNA
CDS coding sequence
ChIP chromatin immunoprecipitation
cm centimeter
cRNA complementary RNA
Ct cycle threshold
CTF CCAAT transcription factor
CYP2E1 cytochrome P450 2E1

xv
Cys cysteine
DBP albumin D-site binding protein
DNA deoxyribo nucleic acid
DNase deoxyribonuclease
DSM diagnostic and statistical manual of mental disorders
DTT dithiothreitol
ECM extra cellular matrix
EDTA ethylene diamine tetraacetic acid
EMSA electrophoretic mobility shift assay
EST express sequence tag
FB1 factor binds to the inducer of short transcript of Human Immunodeficiency virus-1
FBS fetal bovine serum
FDR false discovery rate
FoxA forkhead box protein A
GI gastrointestinal
Gln glutamine
GRE glucocorticoid response element
GSH reduced glutathione
GSNO S-nitrosoglutathione
h hour(s)
Hap haplotype
His histidine

xvi
HMGSH S-(hydroxymethyl) glutathione
HNF-1A hepatocyte nuclear factor 1 alpha
ICD international classification of diseases
IgG immunoglobulin G
Ile isoleucine
kb kilo base pair
kDa kilodalton
LCR locus control region
M molar
MEM minimum essential medium
min minute(s)
ml milliliter
mM millimolar
mRNA messenger RNA
NaCl sodium chloride
NAD+ nicotinamide adenine dinucleotide, oxidized
NADH nicotinamide adenine dinucleotide, reduced
ng nanogram
nm nanometer
PBS phosphate buffered saline
PCR polymerase chain reaction
PLIER probe logarithmic intensity error
pmol picomoles

xvii
qRT-PCR quantitative reverse transcription polymerase chain reaction
RIN RNA integrity number
RMA robust multi-array analysis
RNA ribonucleic acid
s second(s)
SNP single nucleotide polymorphism
Sp1 specificity protein 1
SV40Basal SV40 promoter
TBE tris-borate EDTA buffer
TCA tricarboxylic acid
TSS transcription start site
UCSC University of California, Santa Cruz
USF upstream stimulatory factor
Val valine

1
I. INTRODUCTION
1. Alcohol dehydrogenases
Medium-chain alcohol dehydrogenases (ADH) catalyze the reversible
oxidation of ethanol and other alcohols to acetaldehyde (Edenberg and Bosron,
1997; Zakhari, 2006). ADHs are dimeric proteins that utilize NAD+ as the
coenzyme. Each ADH subunit is 40 kDa, binds two zinc ions and has catalytic
and coenzyme binding domains (Hurley et al., 2002).
Figure 1. The primary pathway of alcohol metabolism. ADH, alcohol dehydrogenase; ALDH, aldehyde dehydrogenase
Based on their sequence homology and kinetic properties, ADHs have
been classified into different classes. In vertebrates, eight classes (I to VIII) have
been identified, with no species encoding all eight classes (Duester et al., 1999;
Peralba et al., 1999). Enzymes in classes I to V are present in multiple species
including humans. Class VI is found only in rats and the deer mouse (Hoog and
Brandt, 1995; Zheng et al., 1993). Classes VII and VIII are found in the chicken,
and the amphibians, respectively (Kedishvili et al., 1997; Peralba et al., 1999).
Less than 70% sequence homology has been observed between different
classes, and only proteins within a class form dimers. The class III enzyme is the
only ADH enzyme seen in invertebrates and thus is considered the ancestral
Ethanol Acetaldehyde Acetate NAD+ NADH NAD + NADH
ADH ALDH
2
form that gave rise to other isozymes (Cederlund et al., 1991; Danielsson and
Jornvall, 1992).
In humans there are seven ADH isozymes including three class I proteins.
Class I proteins α, β and γ share greater than 90% similarity and can form homo-
or heterodimers (Edenberg, 2000). The Class II ADH includes the π polypeptide;
the class III includes the χ polypeptide; the Class IV, has the σ polypeptide
isozyme, and no endogenous protein has been reported for class V.

3
Table 1. Tissue distribution and substrate specificity of human ADH isozymes. HMGSH is S-(hydroxymethyl) glutathione and GSNO is S-nitrosoglutathione
1(Smith et al., 1971) 2(Smith et al., 1972) 3(Smith, 1986) 4(Duley et al., 1985) 5(Allali-Hassani et al., 1997) 6(Estonius et al., 1996) 7(Yin et al., 1990) 8(Yokoyama et al., 1995)
9 (Zgombic-Knight et al., 1995) 10(Dong et al., 1996) 11(Yin et al., 1993) 12(Edenberg and Bosron, 1997) 13(Yang et al., 1994) 14(Kaiser et al., 1991) 15(Koivusalo and Uotila, 1991) 16(Staab et al., 2008)
Class Gene Protein Tissue distribution Common substrates
I ADH1A α fetal and adult liver1,2, adult kidney3, adrenal
gland6 ethanol12, retinol13
I ADH1B β
fetal and adult liver1,2, adult kidney1,4, lung1,4 , blood vessels5, adrenal
gland6
ethanol12, retinol13
I ADH1C γ adult liver2, fetal kidney1, adrenal gland6 ethanol12, retinol13
II ADH4 π fetal and adult liver1,6, stomach6, intestine6,
pancreas6 ethanol12, retinol13
III ADH5 χ ubiquitous in adult4,6 and fetus6 HMGSH14,15, GSNO16
IV ADH7 σ adult stomach7,8, upper GI tract10,11, fetal liver6 retinol13, ethanol12
V ADH6 None as mRNA in fetal and adult liver6 ethanol12

4
The seven ADH isozymes have overlapping substrate specificities (Table
1). All isozymes are active with ethanol, albeit with different Vmax and Km values
(Edenberg and Bosron, 1997; Hurley et al., 2002). Class I enzymes have the
lowest Km for ethanol and account for approximately 70% of alcohol metabolism
in the liver (Hurley et al., 2002). Class II π- ADH, which has a Km of 34 mM for
ethanol, contributes to most of the remaining 30% of alcohol metabolism in the
liver (Hurley et al., 2002; Li et al., 1977). Class IV ADH has an intermediate Km
value but the highest Vmax for ethanol (Kedishvili et al., 1995). It contributes
mostly to alcohol metabolism in the stomach, where it is present at maximum
concentration (Yin et al., 1990; Yokoyama et al., 1995). Class III ADH is a
glutathione-dependent formaldehyde dehydrogenase that metabolizes
glutathione adducts such as S-(hydroxymethyl) glutathione (HMGSH) and S-
nitrosoglutathione (GSNO) more efficiently than primary alcohols and aldehydes
(Kaiser et al., 1991; Koivusalo and Uotila, 1991; Staab et al., 2008).
In addition to dietary alcohol, other physiological substrates of ADH
enzymes have been identified. One important substrate is retinol (vitamin A).
Class I, II, and IV enzymes catalyze the oxidation of retinol to retinaldehyde, the
first step in the synthesis of retinoic acid (Yang et al., 1994). Class IV ADH is the
most active form of retinol dehydrogenase (Zgombic-Knight et al., 1995). Gene
deletion studies in mice have shown that the Class IV ADH is protective against
retinol deficiencies in the diet (Deltour et al., 1999; Molotkov et al., 2002). Other
physiological substrates of ADHs include cytotoxic aldehydes generated during
lipid peroxidation (Boleda et al., 1993), ω-hydroxy fatty acids (Boleda et al.,

5
1993), 3β-hydroxy-5β steroids (McEvily et al., 1988), 4-hydroxy-3methoxyphenyl
ethanol (Mardh and Vallee, 1986) and 4-hydroxy-3methoxyphenyl glycol (Mardh
et al., 1986; Mardh et al., 1985).
2. Human ADH cluster
In humans the seven ADH isozymes are encoded by seven genes
ADH1A (encodes α), ADH1B (β), ADH1C (γ), ADH4 (π), ADH5 ( χ), ADH6 (no
protein; only mRNA), ADH7 (σ) (Table 1 ). The seven genes are present as a
cluster spanning approximately 365 kb on chromosome 4q23 (Figure 2); a similar
clustering of ADH genes is also observed in other mammals. In humans, all the
seven genes have nine exons and eight introns (Edenberg, 2000). The direction
of transcription is also the same and is from qter to pter (shown in the reverse
orientation in Figure 2).
Figure 2. Diagram of the human ADH cluster. Seven alcohol dehydrogenase genes are shown in their transcriptional orientation (they are oriented on the chromosome 4q in the opposite direction). Arrows mark the genes and depict the direction of transcription. The genes range in size from 14.5 kb to 23 kb; intergenic distances are given in kb.
6
All ADH genes except ADH7 are expressed at the highest levels in the
liver; ADH7 is highly expressed in the stomach and the upper gastrointestinal
tract (Edenberg, 2000). In other tissues they are expressed to lower levels and
each class has a distinct pattern of expression. ADH5 is ubiquitously expressed
and thus is the only ADH present in the brain. Tissue distribution of ADHs is
summarized in Table 1.
With the exception of ADH1C, all ADHs are detected in fetal liver
(Estonius et al., 1996). Class I ADHs exhibit temporal expression patterns during
development. ADH1A and ADH1B are expressed in early (second trimester) and
late (third trimester) fetal liver, respectively (Smith et al., 1971, 1972). Expression
of ADH1C is observed only after birth (Smith et al., 1972). Once expressed,
ADHs are expressed constitutively in adult organisms.
3. Additional pathways of alcohol metabolism
In humans, alcohol is metabolized predominantly in the liver by ADHs.
Besides ADHs, oxidative metabolism of alcohol is also catalyzed by cytochrome
P450 enzymes including (CYP2E1, CYP1A2 and CYP3A4) and hydrogen
peroxide-dependent catalase (Handler et al., 1986; Handler and Thurman, 1988;
Lieber, 2004; Lieber and DeCarli, 1968; Salmela et al., 1998; Zakhari, 2006).
These three enzyme systems are localized to different sites within a cell; ADHs
are present in the cytosol. CYP2E1 and catalase are present in microsomes and
peroxisomes, respectively (Handler and Thurman, 1988; Lieber, 2004; Zakhari,
2006). The contribution of CYP2E1 to alcohol metabolism is minor because
7
CYP2E1 is induced only at elevated concentrations (Badger et al., 1993; Zakhari,
2006). Catalase also has a small role as it is limited by the availability of
hydrogen peroxide (Lieber, 1984; Zakhari, 2006). Acetaldehyde generated from
alcohol by any of these enzymes is further metabolized to acetate by aldehyde
dehydrogenases (ALDH) (Hurley et al., 2002).
4. Alcoholism
Alcoholism is a complex disease affecting millions in the world, including 4
to 5% of the population in the United States at any given time (Li et al., 2007).
Chronic alcohol abuse is associated with numerous health risks such as liver
cirrhosis, cancer and cardiovascular disease (Cargiulo, 2007; Rehm et al., 2003).
In addition, it has undesirable social consequences: traffic accidents, domestic
violence, sexual assault and child malnutrition; it is the third leading cause of
preventable deaths in the United States (Mokdad et al., 2004).
Diagnostic criteria for alcoholism have been defined in Diagnostic and
Statistical Manual of Mental Disorders (DSM) and International Classification of
diseases (ICD). According to the most recent DSM criteria (DSM-IV), a person is
said to be alcohol dependent if he or she exhibits a maladaptive pattern of
drinking with three or more of the following symptoms occurring at any time in a
period of one year: tolerance, withdrawal, impaired control, neglect of activities,
excessive time spent in alcohol-related activity and/or continued use despite
knowledge of the problem (Grant, 1996; Hasin, 2003).

8
Alcoholism is influenced by both genetic and environmental factors.
Evidence for genetic risk was obtained from family, twin and adoption studies
(Birley et al., 2005; Goodwin et al., 1973; Goodwin et al., 1974; Kendler et al.,
1997; Mayfield et al., 2008; McGue, 1997; McGue, 1999; Nurnberger et al., 2004;
Prescott et al., 1999; Prescott and Kendler, 1999). Monozygotic twins of
alcoholics exhibit greater risk for alcoholism whereas dizygotic twins of alcoholics
are at approximately the same risk as full siblings (Kendler et al., 1997; Prescott
et al., 1999). Children adopted away from alcoholic parents exhibit the same risk
as the children brought up by their biological parents, further supporting the role
of genetics in the risk for alcoholism (Goodwin et al., 1973; Goodwin et al., 1974).
Together these studies suggest that greater than 50% of the risk for the disease
is from genetic factors.
Several studies have been carried out to identify genes associated with
the risk for alcoholism. ADH and ALDH were the first genes to be associated with
alcoholism (Bosron and Li, 1986). Gamma-aminobutyric acid A receptor, alpha 2
(GABRA2) (Edenberg et al., 2004), cholinergic receptor, muscarinic 2 (CHRM2)
(Luo et al., 2005; Wang et al., 2004), cholinergic receptor, nicotinic, alpha 5
(CHRNA5) (Wang et al., 2009), opioid receptor, kappa 1 (OPRK1) (Edenberg et
al., 2008a; Xuei et al., 2007; Zhang et al., 2008a), nuclear factor of kappa light
polypeptide gene enhancer in B-cells 1 (NFKB1) (Edenberg et al., 2008b) are
some of the genes that have been reported recently in genome-wide association
studies.

9
5. ADHs and alcoholism
The effects of ethanol on liver and other organs in the body are dependent
on the concentrations of ethanol (Gronbaek, 2009). The rate at which ethanol is
metabolized influences the concentrations of ethanol and acetaldehyde. Two
important factors that could determine the rate of ethanol metabolism are (1). the
kinetic properties of ADH enzymes, and (2). the levels of ADH enzymes. Several
studies have reported association of variations in the coding and non-coding
variations of ADHs with the risk for alcoholism (Birley et al., 2009; Edenberg and
Foroud, 2006; Edenberg et al., 2006; Reich et al., 1998; Williams et al., 1999).
Functional variations in the class I ADHs have been studied extensively.
There are three known alleles of ADH1B that vary at a single nucleotide position
(Edenberg, 2007; Hurley et al., 2002). These single nucleotide polymorphisms
(SNP) lead to non-synonymous changes in the amino acid sequence. The β1
subunit encoded by ADH1B*1 has arginine (Arg) at positions 48 and 370. In the
β2 subunit encoded by ADH1B*2 subunit Arg at position 48 is changed to
histidine (His) whereas in the β3 subunit encoded by ADH1B*3, Arg at position
370 is changed to cysteine (Cys). These substitutions result in enzymes with
turnover rates 80- to 90-fold greater than ADH1B*1(Hurley et al., 2002). The
protective effect of these variations was studied in the Asian populations where
the ADH1B*2 allele is most commonly seen. In Chinese men living in Taiwan, the
frequency of the ADH2*2 allele was 0.73 in the non-alcoholic population but
reduced to 0.48 in alcoholics suggesting a protective effect (Thomasson et al.,
1994; Thomasson et al., 1991).

10
Two alleles that alter the kinetic properties of the ADH1C enzyme have
also been identified. The two alleles differ in two amino acid positions; the
ADH1C*1 allele has an Arg and isoleucine (Ile) at positions 272 and 350,
respectively. The ADH1C*2 allele instead has glutamine (Gln) and valine (Val) at
the same positions. The protein encoded by ADH1C*1 has 2.2-fold greater
turnover rate than ADH1C*2 and shown to be protective in Asian population
(Hurley et al., 2002).
Besides ADH coding variations, variations in cis-regulatory elements that
affect the levels of ADH enzymes have been associated with alcoholism. A SNP
at position -136 (relative to the +1 translational start site) in the promoter of the
ADH4 gene affects the promoter activity in hepatoma cells, with the A allele
having 2-fold higher activity than the C allele (Edenberg et al., 1999). This SNP
has been associated with alcohol dependence in a Brazilian population
(Guindalini et al., 2005). In the Japanese population, lower blood alcohol levels
were observed in people with this regulatory variation in people with
ALDH2*487Glu/Glu genotype (Kimura et al., 2009).
Regulatory polymorphisms that affect the expression levels were also
identified in a distal regulatory element 3 kb upstream of ADH1C promoter (Chen
et al., 2005). The effect of various haplotypes of this region on basal promoter
activity was studied. The haplotypes carried a combination of three SNPs and
one 66 bp insertion / deletion. Insertion or deletion alone did not have any effect
on the promoter function. However, a significant difference in activity was

11
observed in two haplotypes that differed at all four positions; one haplotype
decreased the promoter activity by 57% whereas another had no effect
Because regulatory polymorphisms may play a critical role in affecting the
genetic risks for alcoholism, a comprehensive knowledge of ADH transcriptional
regulation is necessary.
6. Transcriptional regulation of ADHs
Regulation of transcription is accomplished through the complex
interaction of cis-acting regulatory elements, proteins that bind these elements
and the chromatin structure. Cis-elements that regulate gene expression include
proximal promoters, enhancers, silencers, locus control regions (LCR), and
insulators (Maston et al., 2006; West and Fraser, 2005). Enhancers, silencers
and LCRs can control gene expression in an orientation-independent and
position-independent way, and from locations as remote as 80 kb from the gene
(Bondarenko et al., 2003; Maston et al., 2006). Enhancers bind activator proteins
that activate transcription by recruiting general transcription factors and RNA
polymerase II and/or by recruiting chromatin remodeling complexes that render
the chromatin accessible to general transcription factors and RNA polymerase II.
Silencers function by binding repressor proteins that inhibit assembly of general
transcription factors and thereby repress expression. LCRs are complex
regulatory modules with the ability to regulate transcription of multiple genes in
the locus (Dean, 2006). Insulators are boundary elements that protect a gene
12
from the influence of neighboring cis-regulatory elements like enhancers or
silencers (Bushey et al., 2008).
To understand the regulation of ADH expression the proximal promoter
regions of ADHs have been studied extensively. In addition distant regulatory
enhancer for class I ADH genes has been identified. However, distal regulatory
mechanisms for the other classes of ADH genes have not been addressed yet.
Proximal promoters of the ADH genes have binding sites for multiple
proteins (Figure 3). The transcription factors that are important for expression of
ADHs include CCAAT/enhancer-binding protein (C/EBP) family, Specificity
protein 1 (Sp1), CCAAT transcription factor (CTF), upstream stimulatory factor
(USF), hepatocyte nuclear factor-1 (HNF-1) and Activator protein-1 (AP-1)
(Edenberg, 2000).

13
Figure 3. Schematic representation of cis-acting elements in the proximal promoters of ADH genes. Transcription factors known to bind a given site are shown above the site. Numbering is relative to the +1 transcription start site. Please refer to the text for references.

14
The human class I ADH genes share 80-90% identity in the region
extending 270 bp upstream of the transcription start site (Brown et al., 1996).
Two C/EBP sites flank the TATA box and both sites are bound by proteins
(C/EBPα, C/EBPβ or Albumin D-site binding protein, DBP) in ADH1B and
ADH1C. In ADH1A only the downstream site is bound by these proteins (Brown
et al., 1994, 1996; Carr and Edenberg, 1990; Stewart et al., 1990a; Stewart et al.,
1990b; van Ooij et al., 1992). Binding sites for USF, Sp1, HNF-1 and CTF are
also present in the proximal promoters. Sp1, USF and HNF-1 enhance the
expression, whereas CTF decreases the expression of ADH1B in transient
transfection assays in hepatoma cells (Brown et al., 1996). In addition to these
elements, ADH1B and ADH1C have a glucocorticoid response element (GRE)
and a retinoic acid responsive element (RARE), respectively (Duester et al.,
1991; Winter et al., 1990). The glucocorticoid response element (GRE) in ADH1B
overlaps with the HNF-1 site and can bind purified glucocorticoid receptor (Winter
et al., 1990). Dexamethasone, a synthetic glucocorticoid, can induce two- to four-
fold expression from ADH1B promoters with GRE (Winter et al., 1990). A similar
increase in endogenous expression of ADH1 was observed in H4IIE-C3 rat
hepatoma cells upon treatment with dexamethasone (Dong et al., 1988).
The retinoic acid responsive element (RARE) element in ADH1C is
created by tandem duplication of 29 bp found in all class I ADH promoters. The
duplicated downstream sequence can bind retinoic acid receptor and induce
expression in the presence of retinoic acid (Duester et al., 1991; Harding and
Duester, 1992).
15
ADH4 proximal promoter has nine protein binding sites, of which seven
(sites 1 to 7) are bound by proteins present in liver extract (Li and Edenberg,
1998). Sites 8 and 9 are protected by extracts from kidney and spleen,
respectively. C/EBP proteins bind to sites 2 and 4 and AP-1 binds to sites 1, 2
and also 4. Sites 2 to 7 act as positive regulators in rat hepatoma cells, but with
different strengths. Site 8 acts as a negative element, decreasing the activity of
the basal promoter by 21%.
ADH5 promoter is G-C rich and unlike other ADH genes, lacks a TATA
box. There are ten (A to J) protein binding sites in the proximal 400 bp region
(Hur and Edenberg, 1995). Minimal promoter with sites A through C is functional
in H4IIE-C3 rat hepatoma cells, CV-1 African green monkey kidney cells, and
HeLa cells. Sp1 binds to all three sites and activates expression. Binding of Sp1,
however, is modulated by other members of Sp family and FB-1 transcription
factor. Sp3, Sp4 and FB-1 compete with Sp1 to bind to site C and therefore
decrease the activity of the promoter (Kwon et al., 1999; Lee et al., 2002). Sites
E, G, H and I decrease activity in all cells studied. Sites D and F exhibit cell-
specific activity; site D has a positive effect in H4IIE-C3 cells but no effect in the
other cells. Conversely, site F acts a positive element in CV-1 and HeLa cells but
as a weak negative element in H4IIE-C3 cells (Hur and Edenberg, 1995).
Post-transcriptional regulation, by two upstream AUG codons in the
mRNA, of ADH5 has also been reported. Mutation at one or both of the upstream
AUG codons increased gene expression by two-fold in examined cells (Kwon et
al., 2001).

16
The ADH6 promoter has nine (A to I) protein binding sites within 300 bp of
the transcription start site (Zhi et al., 2000). All sites are bound by liver extract
and act as positive elements in rat hepatoma cells. Sites C, D and E are
recognized by C/EBPα. Two cell-specific elements are present further upstream,
between -1.2 kb and -2.3 kb. Site 1 decreased the activity of the promoter in non-
hepatoma cells while site 2 increased the activity in hepatoma cells.
The ADH7 proximal promoter has four (A to D) protein binding sites, three
of which are bound by proteins in the nuclear extract of different cells tested
(Kotagiri and Edenberg, 1998). AP-1 binds strongly to site A and weakly to site
C. Mutation in site A disrupts AP-1 binding and leads to a decrease in promoter
activity, highlighting the importance of this site. C/EBP binds strongly to site B but
decreases the activity of the promoter as observed in C/EBP overexpression
studies. This effect could be one of the reasons why ADH7 is not expressed in
liver, where C/EBP proteins are present at high levels.
Known cis-regulatory elements in the proximal promoter regions do not
entirely explain the tissue specific expression of ADHs in adults and the temporal
expression of class I ADH genes in the fetus. In mice, 12 kb upstream and 23 kb
downstream regions of ADH1 were inadequate to induce ADH1 expression in
liver (Szalai et al., 2002). However, 110 kb upstream and 104 kb downstream
regions were able to induce expression (Szalai et al., 2002). This indicates the
presence of regulatory regions far from the promoter. In humans an HNF-1
binding site, 51 kb away from the class I ADH cluster, was identified (Su et al.,
2006). This region was shown to regulate tissue specific expression of all the

17
class I genes and when deleted repressed the expression of each of the class I
ADH genes in transgenic mice. The HNF-1 binding site was also shown to
interact with the class I ADH promoters suggesting a DNA looping mechanism of
activation.
7. Identification of cis-regulatory regions
In humans, 95% of the genome is non-coding sequence, and cis-
regulatory regions are only a small part of this. Therefore, identifying cis-
regulatory sequences like enhancers or silencers that can work from hundreds of
kb away is a difficult task. Many approaches have been explored in the literature
(Elnitski et al., 2006). The classical approach to search for regulatory regions of a
gene of interest is to make deletion constructs of proximal regions and test these
in reporter gene assays. However, this approach becomes cumbersome to
identify distal regulatory regions. A more useful technique to identify distal
regulatory regions has been the DNaseI hypersensitivity assay (Gazit and Cedar,
1980). It is based on the principle that the chromatin in the regulatory regions is
more accessible to proteins and as a result, more sensitive to DNaseI, a non-
specific endonuclease. Another technique that has been widely used in recent
years for identifying or characterizing regulatory regions is chromatin
immunoprecipitation (ChIP) (Dedon et al., 1991; Kuo and Allis, 1999). The
function of regulatory regions is mediated via the binding of trans-acting
transcription factors; thus studying DNA-protein interactions in vivo leads to
identification of regulatory regions. Recently high-throughput versions of DNaseI
18
hypersensitive site assays and ChIP assays have been developed and used to
identify regulatory regions on a genome-wide scale (Crawford et al., 2006a; Ren
et al., 2000; Robertson et al., 2007; Sabo et al., 2006; Song and Crawford,
2010). However, these are still not cost-effective approaches for many research
labs.
A computer based approach for identifying regulatory regions in the
genome is comparative genomics (King et al., 2007; Miller et al., 2004).
Comparative genomics involves cross-species sequence comparisons to identify
evolutionarily conserved sequences. The underlying assumption for this strategy
is that if a region is evolutionarily conserved, it implies a functional role
(Hardison, 2000). Or if a region has a critical functional role, like gene regulation,
then it is protected from mutations in the sequence. One of the first cellular
enhancers discovered was identified through sequence conservation (Emorine et
al., 1983). With the availability of genome sequences from increasing number of
organisms, identifying regulatory regions through sequence conservation is a
powerful tool.
8. Transcription factors
Transcriptional regulation is achieved through interaction of cis-regulatory
regions with the trans-acting proteins. There are three kinds of transcription
factors (Martinez, 2002; Tjian, 1996):
1. general transcription factors including RNA polymerase and
transcription factor II family of proteins that are involved in initiation,
19
elongation and termination of transcription (Sikorski and Buratowski, 2009;
Thomas and Chiang, 2006).
2. sequence-specific DNA binding proteins that bind cis-regulatory
regions in the genome and control the expression of the corresponding
genes; activator and repressor proteins fall under this group.
3. transcription cofactors mediate interactions between the basal
transcription factors and sequence specific effectors. These include
mediator complexes and chromatin remodeling complexes (Casamassimi
and Napoli, 2007; Clapier and Cairns, 2009; Thomas and Chiang, 2006).
Activator proteins that are involved in regulatory mechanisms in this study are
discussed below.
8.a. FoxA family
FoxA (previously known as Hepatocyte nuclear factor-3) transcription
factors are a sub-family of forkhead box (Fox) proteins, which contain a 110
amino acid forkhead DNA binding domain (Weigel and Jackle, 1990). There are
three FoxA proteins, FoxA1, FoxA2, and FoxA3, and they share 95% sequence
identity in the forkhead domain. Forkhead domain has a ‘winged helix’ structure
where three helices are arranged in a helix-turn-helix core, and flanked by loops
(Clark et al., 1993). FoxA proteins also have trans-activation and histone
interaction domains at the N and C-termini of the protein, respectively (Pani et
al., 1992; Qian and Costa, 1995). FOXA proteins recognize VAWTRTTKRYTY
20
sequence, where V is A/C/G nucleotide, W is A/T, R is A/G, K is G/T and Y is C/T
(Overdier et al., 1994)
FoxA proteins are highly expressed in the liver and regulate many liver-
specific genes in adult organisms (Friedman and Kaestner, 2006; Schrem et al.,
2002). Albumin (Herbst et al., 1991), aldoalse B (Gregori et al., 1994),
transerythrin (Herbst et al., 1991) are some of the genes that are regulated by
FOXA proteins. FOXA proteins play essential roles during development. They
are expressed sequentially during development; FoxA2 appears by embryonic
day 6.5 (E6.5), followed by FoxA1 and FoxA3 (Sasaki and Hogan, 1993). FoxA2
null mutations are embryonic lethal while FoxA1 and FoxA3 are postnatally lethal
(Lee et al., 2005).
FoxA proteins belong to a class of transcription factors that function as
pioneer factors, proteins that can bind highly compacted chromatin and alter the
chromatin structure and enhance transcription (Zaret et al., 2008). During
development, FoxA proteins have been shown to bind the enhancer of the
albumin gene and open the chromatin (Chaya et al., 2001; Cirillo et al., 2002).
FoxA1 has also been shown to act as pioneer factor in adult tissues (Carroll et
al., 2005; Gao et al., 2003; Zhang et al., 2005).
8.b. HNF-1A
Hepatocyte nuclear factor -1α (HNF-1A) is a liver enriched transcription
factor with POU and homeodomain DNA binding domains (Baumhueter et al.,
1990). It also has three transactivation domains and a myosin-like dimerization

21
domain (Mendel et al., 1991a). It recognizes a consensus sequence
GTTAATNATTAAC and binds to DNA as a dimer (Courtois et al., 1988; Frain et
al., 1989). HNF-1A homodimers are stabilized by the protein dimerization
cofactor of HNF-1 (DCoH). DCoH does not bind DNA nor does it interfere with
the binding of HNF-1A to DNA (Mendel et al., 1991b). Like FoxA proteins, HNF-
1A transcribes many liver specific genes like albumin (Lichtsteiner et al., 1987),
α-antitrypsin (Courtois et al., 1987), α- and β-fibrinogen (Courtois et al., 1987),
and others (Schrem et al., 2002).
9. Alcohol and the liver
In addition to understanding the genetic risk factors of alcoholism, it is also
important to gain knowledge on the pathogenesis of the disease. Alcohol is
chiefly metabolized in hepatocytes, parenchymal cells which form 85% of the
total volume of a healthy liver (Tsukamoto and Lu, 2001). Liver is the most
susceptible organ for alcohol induced injuries. Chronic alcohol abuse leads to
alcoholic liver diseases, ALDs (Fleming and McGee, 1984; MacSween and Burt,
1986; Mann et al., 2003; McCullough and O' Connor, 1998). The most prevalent
ALD is alcoholic steatosis or fatty liver, which is characterized by fat deposition in
the liver and hepatomegaly (MacSween and Burt, 1986). Fatty liver, upon further
exposure to alcohol, develops alcoholic hepatitis, where there is inflammation of
the liver. The most severe form of ALD is cirrhosis in which fibrotic tissue
replaces the normal liver tissues and leads to liver dysfunction. In a small
22
percentage (1- 2%) of people, cirrhosis leads to hepatocellular carcinoma (Seitz
and Stickel, 2006).
Several molecular mechanisms have been implicated in the development
and progression of ALD. Acetaldehyde, the break down product of alcohol, forms
adducts with proteins, and disrupts their function (Niemela, 2001; Niemela et al.,
1998; Worrall et al., 1990). Another key effect of alcohol metabolism is the
altered energy state of the cell. In both ADH and ALDH catalyzed reactions,
NAD+ is reduced to NADH, increasing the NADH/NAD+ ratio in cells
(Cunningham et al., 1986). This change in the redox state leads to inhibition of
activity of many enzymes that are involved in metabolic pathways like
carbohydrate metabolism (Badawy, 1977) . NADH also enters the electron
transport chain and leads to the generation of reactive oxygen species (ROS)
(Albano, 2006; Bailey et al., 1999; Wu and Cederbaum, 2009). ROS cause
damage to mitochondrial membrane and also induce oxidative stress within the
cell (Bailey and Cunningham, 2002; Bailey et al., 1999; Cunningham and Bailey,
2001). Upon chronic alcohol abuse, this oxidative stress overwhelms the cellular
redox system and leads to the depletion of antioxidants such as reduced
glutathione (Bai and Cederbaum, 2006; Garcia-Ruiz et al., 1994; Hirano et al.,
1992). ROS also cause peroxidation of lipids which further increases the
oxidative stress in the cell (Niemela, 2001; Niemela et al., 1998; Worrall et al.,
1990).
Alcohol metabolism affects some of the key enzymes involved in lipid
metabolism. Acetaldehyde decreases the DNA binding ability of the heterodimer
23
of proliferator-activated receptor-α (PPARα) and retinoid X receptor (RXR) (Galli
et al., 2001). PPARα-RXR dimer is involved in the transcription of many fatty acid
oxidation enzymes including carnitine palmitoyl transferase-1 (CPT1A), a rate
limiting enzyme in the pathway (Aoyama et al., 1998; Zammit, 2008).
Another protein that is affected by ethanol is AMPK (AMP- activated
protein kinase). Activation of AMPK leads to fatty acid oxidation and concurrent
inhibition of fatty acid synthesis (Hardie et al., 1998). AMPK mediated regulation
of the fatty acid oxidation is brought about by inhibition of acetyl-CoA carboxylase
(ACC), and activation of malonyl Co-A decarboxylase (MCD). The activity of
these two enzymes leads to a decrease in the concentration of malonyl Co-A and
activation of CPT-1A. Ethanol decreases the activity of AMPK, thus inhibiting
fatty acid oxidation and promoting fatty acid synthesis (You et al., 2004).
Sterol regulatory element-binding proteins (SREBPs) are a family of
transcription factors involved in the transcription of many genes involved in fatty
acid synthesis (Eberle et al., 2004). They play an important role in the
development of alcohol induced fatty liver (You and Crabb, 2004a; You et al.,
2002). Ethanol activates transcription from SREBP regulated promoters and
leads to an increase in the expression of lipogenic enzymes (You et al.,
2002).Thus, the combined effects of ethanol on PPARα and AMPK lead to the
inhibition of fatty acid oxidation, increase in the fatty acid synthesis in the liver
and development of fatty liver (Purohit et al., 2009; You and Crabb, 2004b).
Chronic alcohol abuse damages the lining of the intestine, ultimately
exposing the liver to gut-derived bacterial endotoxins (Bode and Bode, 2005;

24
Keshavarzian et al., 1999). These endotoxins activate the liver macrophages,
Kupffer cells, which release ROS and cause more damage to hepatocytes (Bode
and Bode, 2005; Thurman, 1998). Kupffer cells also produce inflammatory
cytokines such as TNF-α that contribute to liver inflammation. Acetaldehyde
adducts, cell death seen in hepatocytes due to ROS also trigger an immune
response against the alcohol-injured liver.
In addition, ROS and cytokines from hepatocyte and Kupffer cells, activate
the hepatic stellate cells (HSC) (Nieto et al., 2002; Siegmund and Brenner, 2005;
Wheeler et al., 2001). Upon activation HSC proliferate and increase the synthesis
and secretion of extracellular matrix (ECM) proteins, particularly collagen
(Cubero et al., 2009; Rojkind and Martinez-Palomo, 1976; Siegmund and
Brenner, 2005). Accumulation of the ECM proteins alters the morphology of the
liver, leading to the development of fibrotic liver.
10. Alternative transcript isoforms and diseases
One of the post-transcriptional processes that regulate gene function is
splicing. In splicing, introns are removed and the remaining exons are spliced to
form the mature protein coding or functional RNA (Wang et al., 2008). Exons or
introns can be spliced in different arrangements and this process is termed
alternative splicing. Diverse mRNA or proteins known as alternative isoforms can
be generated from same gene by alternative splicing. Alternative splicing
generates another layer of gene regulation and recent estimates suggest that 92-
94% of the human genes are alternatively spliced (Wang et al., 2008). One-third
25
of alternative splicing events are cassette exons (exons that can be included or
excluded in the transcript). Another type of alternative splicing event is where an
alternative donor or acceptor splice site is used, generating a different 5’ and 3’
end of the exon. An intron can also be included during splicing to synthesize an
alternatively spliced form. Alternative isoforms can also be generated by using an
alternative transcription start site, alternative poly (A) site (alternate poly
adenylation site that signals transcription termination) (Chen and Manley, 2009).
Different ways in which alternative isoforms could be generated are shown in
Figure 4. In this dissertation, all events mentioned above, that generate
alternative isoforms will be referred to as alternative splicing events.
26
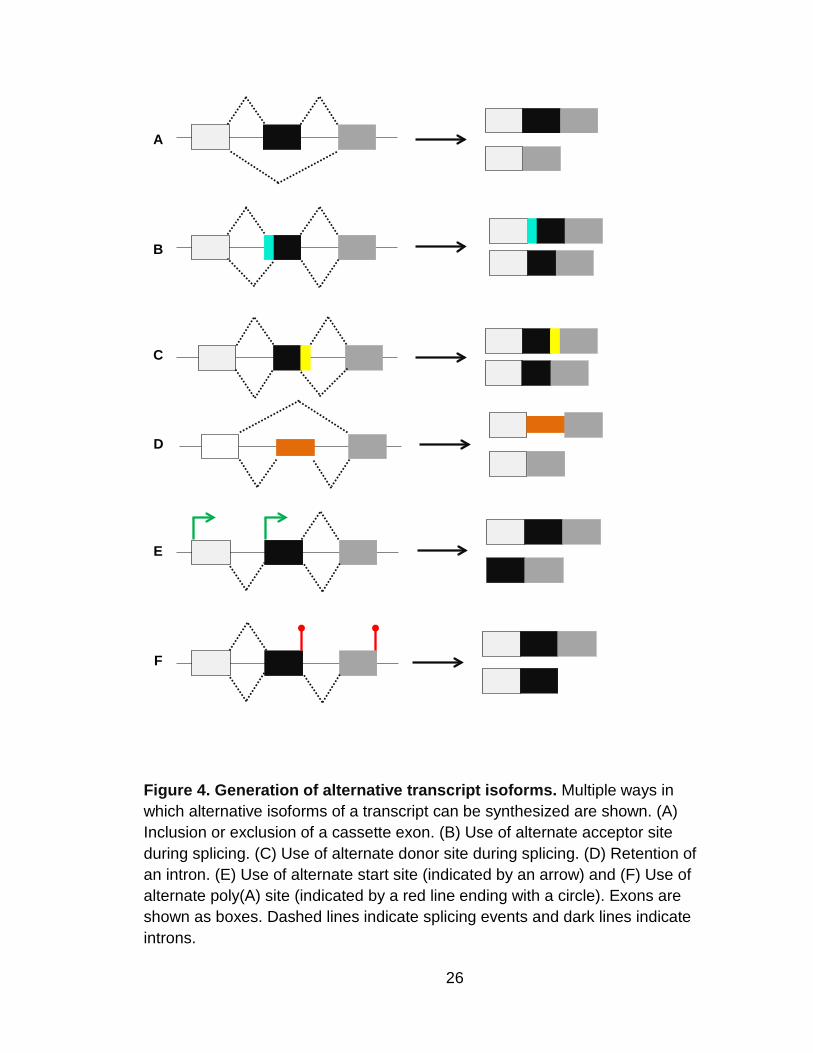
Figure 4. Generation of alternative transcript isoforms. Multiple ways in which alternative isoforms of a transcript can be synthesized are shown. (A) Inclusion or exclusion of a cassette exon. (B) Use of alternate acceptor site during splicing. (C) Use of alternate donor site during splicing. (D) Retention of an intron. (E) Use of alternate start site (indicated by an arrow) and (F) Use of alternate poly(A) site (indicated by a red line ending with a circle). Exons are shown as boxes. Dashed lines indicate splicing events and dark lines indicate introns.
A
B
C
D
E
F

27
Splicing defects can be the primary cause of a disease, as seen in spinal
muscular atrophy (Zhang et al., 2008c), tauopathies (Gallo et al., 2007), atypical
Cystic fibrosis (Buratti et al., 2001), Hutchinson-Gilford progeria syndrome (De
Sandre-Giovannoli and Levy, 2006) and others (Garcia-Blanco et al., 2004;
Orengo and Cooper, 2007). Alternative splicing has also been implicated in
cancer, where key cancer genes like BRCA-1 have been shown to be
alternatively spliced (Hoffman et al., 1998). One of the aims of this study was to
examine the effects of alcohol on alternative splicing to gain insight into the
molecular mechanisms of alcohol induced liver injuries.
11. Global transcriptional profiling
One of the aims of this study was to examine global effects of alcohol on
gene expression and alternative transcript isoforms. The most popular approach
to study these genome-wide changes is to use microarrays. Microarray
technology allows the hybridization, in parallel, of thousands of labeled molecules
in a sample to surface bound nucleic acid probes and the subsequent
quantitation of bound molecules.
Recently Affymetrix GeneChip® Human Exon 1.0 ST Arrays (for simplicity
these will henceforth be referred to as Exon arrays) have been developed. Unlike
the traditional 3’ arrays that have probes targeting only the 3’ end of a transcript
(Affymetrix, 2003), exon arrays have probes against the entire length of the
transcript (Affymetrix, 2005a). Therefore, exon arrays can be used to not only
quantitate gene expression, but also identify alternative isoforms. On average,

28
each exon in a transcript has one probe set and each probe set has four perfect
match probes. In genes with only one exon, such as histones or CEBP family of
transcription factors, more than one probe set is present per exon. There are a
total of 1.4 million probe sets. From highest to lowest levels of confidence of
annotation, probe sets are classified into core, extended or full probe sets
(Affymetrix, 2005a). Core probe sets are supported by the RefSeq and full length
mRNA GenBank records with full coding sequence (CDS) information. Extended
probe sets, on the other hand, come from other cDNA evidence, including other
human mRNA, EST sequences, ENSEMBL gene collections, syntenically
mapped mRNA from mouse, rat and human, mitoMap mitochondrial genes,
microRNA registry genes, vegaGene , and vegaPseudoGene records
(Affymetrix, 2005a). Full probe sets are based on computational gene predictions
like Genescan (Affymetrix, 2005a).
General work flow for exon array analysis includes the following steps:
data normalization, summarization for each probe set, present/absent filtering,
statistical analysis of differential gene expression and alternative splicing and
finally biological significance of the affected genes in the experiment. Quantile
normalization of the data is carried out because signals from different
hybridizations may be at different scales. Data summarization generates a
summary measure for a probe set from the signals of all of the (usually 4) probes
in the set. Robust multi-array analysis (RMA) and the probe logarithmic intensity
error (PLIER) are two of the commonly used approaches for data summary
(Affymetrix, 2005c; Irizarry et al., 2003). Both algorithms use an error model-

29
based approach to summarize signals. RMA assumes that the error is
proportional to the normalized and background-adjusted probe intensity. On the
other hand, PLIER assumes that the error is proportional to the probe intensity
without background correction.
After the probe set summary signals are obtained, it is necessary to
remove signals that are not significantly different from the background. Pre-
analysis filtration of absent probe sets decreases the noise and enhances the
ability to detect real differences (McClintick and Edenberg, 2006). A detection
above background correction was proposed for exon arrays to remove probe
sets with signals near background (Clark et al., 2007). In addition to removing
probe sets based on signal, other filtering steps have also been shown to
decrease the noise and improve detection of alternative splicing events. Filtering
probe sets based on hybridization specificity (bind to unique or more regions), or
by fraction present (a probe set should be present in a pre-defined fraction of
arrays used in the experiment) has been shown to improve the ability to detect
real differences (McClintick and Edenberg, 2006; Mieczkowski et al., 2010; Xing
et al., 2008).
Once probe set signals are obtained, signals from all the present probe
sets in the gene are summarized to estimate the expression level of the gene of
which they are part. Many approaches have been proposed for estimating gene
expression. PLIER can be used to generate gene level estimates in a manner
similar to probe set summarization (Affymetrix, 2005b). A simpler approach is to
use median intensity of all the probe sets in a transcript (Clark et al., 2007). Clark

30
et al. reported that, in their data, median intensity of all core probe sets was a
good estimate of gene expression. Once the probe set and gene signals are
estimated, standard statistical tests like Student t-test can be used to look for
genes or probe sets that have significantly different expression values between
the test conditions. When the p-value is below the pre-defined threshold, for
example, 0.05, the difference is said to be significant. Because of the large
number of tests carried out in microarrays, multiple testing corrections are
applied to the analyses to control the false positive rate. A false discovery rate
(FDR) method of correction for multiple testing was proposed by Benjamini and
Hochberg (1995). FDR estimates the number of false positives that can be
expected at a particular p-value, although it does not identify which results are
false positives. Similar to p-value, a threshold for FDR can be used to identify
significantly affected genes
Analysis of the Exon array data to identify differentially expressed genes
or alternatively spliced exons is challenging because exons and genes are not
independent elements and cannot be treated so for statistical analysis. Therefore
it is difficult to differentiate gene expression and alternative splicing. The
estimation of overall expression of a gene is affected by the number of
alternatively spliced probe sets or exons in the gene. For example, in the
absence of any alternative splicing, comparison of gene expression values in two
conditions should detect differentially expressed genes. However, if an exon is
alternatively spliced, this also influences gene expression estimates and the
gene could be falsely detected as differentially expressed. Equally, the detection

31
of alternative splicing in exons is dependent on the gene expression levels. It is
not possible to use probe set expression values in two conditions to compare and
detect alternative spliced exons, because if a gene is differentially expressed,
then levels of all probes are affected and simply comparing the probe set
expression values could lead to all probe sets detected as differentially spliced.
The goal is to detect differential gene expression as well as alternatively
spliced exons. Two common approaches are used in the literature to detect
alternative splicing. In the splicing index approach, probe set values are
normalized to the gene signals (Clark et al., 2007; Srinivasan et al., 2005).
Dividing probe set values by gene values should account for differential gene
expression. It is, however, dependent on how the gene expression values are
estimated. The second approach to analyze exon array data is two-way ANOVA.
The two-way ANOVA model for alternative splicing includes experimental
conditions and probe sets within the transcript as factors. The interaction
between the probe set and experimental factors (like treatment condition) is used
to identify probe sets that are alternatively spliced in the experimental conditions.
However, both splicing index and two-way ANOVA do not overcome the effect of
alternative splicing on differential gene expression. Also, both assume that all
probe sets across a gene will have a similar response to changes in gene
expression. This has been shown not to be true: one common observation is that
the ends of the transcripts respond differently than the probe sets away from the
ends (Bemmo et al., 2008; Whistler et al., 2010). This leads to an edge bias
32
effect in which many probe sets towards 5’ and 3’ ends are detected falsely as
alternatively spliced (Bemmo et al., 2008; Whistler et al., 2010).
In this dissertation, exon arrays were used to study the effects of alcohol
on gene expression and alternative splicing.
12. Research objectives
There are three main objectives of this research. The first objective was to
investigate the transcriptional regulation of the ADH genes. Understanding the
regulation of ADH genes is important because of the key role they play in alcohol
metabolism and risk for alcoholism. A sequence conservation approach was
taken to identify putative distal regulatory elements in the ADH cluster. These
putative regions were tested for activity in vitro and a strong enhancer was
identified and characterized.
The second objective was to study the effects of variations on the cis-
regulatory regions in the ADH cluster. Many variations in the ADH cluster have
been associated with the risk for alcoholism. Since most do not affect the
structure of the encoded proteins; they could either affect gene regulation or
merely be associated (in linkage disequilibrium) with variants that affect function
in some way. The effect of variations on the activity of two cis-regulatory regions
of ADH cluster was examined in this study. The first region that was examined
was the enhancer identified in this study. Two variations greatly affect activity
and we hypothesize that these could affect the risk for the disease. The second
region that was examined was the ADH1B proximal promoter. There was already

33
evidence of association of two SNPs in this region with alcoholism (Edenberg et
al., 2006). We examined the functional effects of variations in this region and
observed that one variation decreases the activity of the promoter.
The third objective was to understand the effects of chronic alcohol
exposure on global gene expression and alternative splicing in HepG2 human
hepatoma cells. Microarray technology allowed us to explore the effects of
ethanol at a global level and to gain more insight into the alcohol-induced liver
injuries observed in chronic alcoholics. This was the first study to explore the
effects of ethanol on alternative splicing.

34
II. MATERIALS AND METHODS
1. Identification of putative distal regulatory elements
To identify putative distal regulatory regions in the ADH cluster,
comparative genomics approach was taken. University of California, Santa Cruz
(UCSC) genome browser (March 2006, NCBI36/hg18 assembly) 28-Way Cons
Track was used to identify evolutionarily conserved regions (Blanchette et al.,
2004; Chiaromonte et al., 2002; Kent et al., 2003; Siepel et al., 2005). As
sequence conservation was absent or not reported in the non-placental
vertebrates at the time, only the placental mammals for which multiple
alignments were available were used for this study: Rhesus, bushbaby, tree
shrew, rat, mouse, guinea pig, rabbit, shrew, hedgehog, dog, cat, horse, and
cow. If at least 50% sequence conservation was observed, the region was
considered a putative regulatory region.
2. Cloning of test fragments
For testing putative distal regulatory elements, proximal promoters of
ADH4 (4Basal; −41 to −299 bp relative to ADH4 +1 CDS) and ADH1B (1Basal;
−10 to −169 bp relative to ADH1B +1 CDS) were amplified by PCR from human
DNA using R-Taq polymerase (Midsci, St. Louis, MO). SV40 promoter was
amplified from the pGL3 control vector (Promega, Madison, WI).
Oligonucleotides used in PCR are listed in Table 2. All promoters were
subcloned into KpnI and XhoI sites in the pXP2 luciferase reporter plasmid
(Nordeen, 1988). Putative regulatory elements were cloned upstream of the
35
4Basal promoter; the position of each fragment relative to the nearest CDS and
restriction sites are given in Table 3. Subfragments of 4E were cloned into
BamHI and SalI sites of pXP2, upstream of 4Basal.
To test ADH1B proximal promoter haplotypes, the region extending to
1484 bp upstream of ADH1B +1 CDS was PCR amplified using high fidelity
platinum Pfx polymerase (Invitrogen, Carlsbad, CA). Primers used are listed in
Table 2. PCR cycle conditions were as follows: 94 0C/ 5 min, (94 0C/15 s, 62
0C/20 s, 68 0C/ 90 s)x 10 cycles, (94 0C/15 s, 60 0C/20 s, 68 0C/ 90 s)x 30 cycles,
68 0C/ 7 min. DNA from five different individuals was used as a template. All test
fragments were cloned into KpnI and BglII sites in pXP2 luciferase reporter
vector (Nordeen, 1988). Clones were sequenced by ABI BigDye terminator v3.1
cycle sequencing kit and five different haplotypes were obtained (Table 10).

36
Primer Sequence Description HE3475 GTGGTACCGGGCTTTTCTCTATTATTTTA 4Basal _F HE2492 CCCTCGAGAAGCTTCAAACTCCTACCCA 4Basal _R HE3639 GTGGTACCAATCCAGTGGGTGTGGC 1Basal _F HE3640 CCAAGCTTGTCTTCTCTGCCCACCAG 1Basal _R HE3641 GTGGTACCCTGCGATCTGCATCTCAATTA SV40 Basal _F HE3642 CCAAGCTTAGTACCGGAATGCCAAGC SV40 Basal _R HE3481 CGGGATCCCAAGCCAGAATGAAAAGGTAGAC 4E _F HE3482 CCAAGCTTAGCCAGAGCACAAATAATGGAG 4E _R HE3623 CGGGATCCCCAAGCCAGAATGAAAAGGTA 4E1 _F HE3633 GCGTCGACTTGCGATTTCTCTGGGATG 4E1 _R HE3627 CGGGATCCTCAGGTCCATTCTGTGAACG 4E2 _F HE3635 GCGTCGACTGTAGTCTCCCCTCTCTTGCTG 4E2 _R HE3629 CGGGATCCCAGATAACAGCAAGAGAGGGG 4E3 _F HE3636 GCGTCGACCAGCCAGAGCACAAATAATGG 4E3 _R
HE3530 CGGGATCCGCAGTCTCTATGTATTCTCTTGCC 4-5-a_F
HE3531 CCCCGGGGCTCAGTGGGCTTGTAAACG 4-5-a_R HE3477 CGGGATCCTGAGGTGATAGATACCCTATTTA 6-4-a_F HE3478 CCAAGCTTTTTGAGAACTGGGTTAGGTT 6-4-a_R HE3526 CCCAAGCTTTTACAGAAAAGCCAACGCTG 1A-6-a_F HE3527 CCCGGGGTCACCAGAGGGATGTGTTTG 1A-6-a_R HE3524 CGGGATCCCTGTGATTGATTGGGTGTCG 1A-6-b_F HE3525 CCCCGGGGGGGGAGGATTTAGCACCTATT 1A-6-b_R HE3528 CGGGATCCAATAGGTGCTAAATCCTCCCC 1A-6-c_F HE3529 CCCGGGGTCAAGAGATGTCTGGCTGTGAC 1A-6-c_R HE3483 CGGGATCCAACCAATCTGCCCTGTG 1A-6-d_F HE3484 CCAAGCTTGGAAGGAGGGGGTGAGATAG 1A-6-d_R HE3485 CGGGATCCGTTTTCTGAGGCTTCCC 1A-6-e_F HE3486 CCAAGCTTCCCTGATGTGATTATTGTGC 1A-6-e_R
HE3116 GTGGTACCCTGGGGCTATCTTCTTTCCG ADH1B proximal promoter_F
HE3003 CGAGATCTGTCTTCTCTGCCCACCAGC ADH1B proximal promoter_R
Table 2. Primers used to clone test fragments. Forward (F) and reverse (R) primers used for amplification of promoters and test regions are given.

37
Fragment Nearest + 1 CDS Location Restriction
sites 4-5-a ADH5 -24,880 to -23,299 BamHI & Smal 4E ADH4 -14,506 to -13,003 BamHI & HindIII 6-4-a ADH4 -20,549 to -19,471 BamHI & HindIII 1A-6-e ADH6 -32,319 to -31752 BamHI & HindIII 1A-6-d ADH6 -34,944 to -33,238 BamHI & HindIII 1A-6-c ADH6 -46,988 to -45,523 BamHI & Smal 1A-6-b ADH6 -48,607 to -46,968 BamHI & Smal 1A-6-a ADH6 -49,682 to -48,534 HindIII & SmaI 4E1 ADH4 -14,506 to -13,973 BamHI & SalI 4E2 ADH4 -14,057 to -13,539 BamHI & SalI 4E3 ADH4 -13,567 to -13,003 BamHI & SalI
Table 3. Putative distal regulatory elements. The putative distal regulatory fragments that were tested in this study are listed along with the nearest (with respect to the direction of transcription in the cluster) +1 CDS. Location is relative to the nearest +1 CDS based on the human genome NCBI build 36.

38
3. Transient transfections and reporter gene assays
HepG2 human hepatoma cells (HB-8065; ATCC, Manassas, VA) were
cultured in MEM (ATCC) with 10% FBS (Invitrogen, Carlsbad, CA), 4 mM
glutamine (Thermo Scientific Hyclone, Waltham, MA) and 1X Penicillin and
Streptomycin (Thermo Scientific Hyclone) on cell bind surface plates (Corning
Inc, Corning, NY) at 37 0C. For transient transfection assays of putative distal
regulatory elements, 3 x 10⁵ cells were seeded per well in 12-well plates. 24 h
after seeding, cells were transfected in complete media with 500 ng of test DNA,
along with 15 ng of pCMV β-galactosidase plasmid (Clontech, Mountain View,
CA) and 485 ng of pUC19 DNA, using 2 µl of Fugene HD (Roche, Indianapolis,
IN) per 1 µg of DNA. Cells were harvested 30 h after addition of DNA by scraping
into ice-cold 1X PBS, pelleted by centrifugation and suspended in 100 µl of 1X
Reporter lysis buffer (Promega, Madison, WI). Cell extracts were prepared by
repeated cycles of freeze-thawing; 5 µl of the extract was used for each assay.
Luciferase assays were carried out using the Luciferase assay system (Promega,
Madison, WI), with activity measured on a Spectromax LS (Molecular devices,
Sunnyvale, CA). β-galactosidase assays were carried out using the Galacto-Light
System (Tropix, Benford, MA).
For transfection assays with ADH1B proximal promoter haplotypes, 8 x
105 cells were seeded per well in 6-well cell binding surface plates. 24 h after
seeding, cells were transfected in serum free media with 2 µg of test DNA, along
with 140 ng of CMV-galactosidase plasmid (Clontech, Mountain View, CA) and
1.2 µg of pUC19 DNA using 3 µl Fugene HD. Complete medium was added 5 h
39
after addition of DNA and cells were cultured for another 24 h. Cells were
harvested 30 h after addition of DNA, and processed and assayed as described
above. 20 µl and 5 µl of the extract were used for Luciferase and β-galactosidase
assays, respectively; activity was measured on a Lmax Plate Luminometer
(Molecular Devices).
H1299 human lung carcinoma cells (ATCC CRL-5803) were cultured in
high glucose DMEM (Sigma- Aldrich, St. Louis, MO) with 10% FBS, 2 mM
glutamine and 1X Penicillin and Streptomycin on plastic plates (BD Biosciences,
San Jose, CA) at 37 0C. Cells were seeded at 7 x 10⁵ per well in 6-well plates
(BD biosciences, San Jose, CA). 24 h after seeding, cells were transfected in
complete media with 2 µg of test DNA, along with 135 ng of β-galactosidase
plasmid and 1.1 µg of pUC19 DNA using 3 µl of Fugene HD per 1 µg of DNA.
Cells were harvested 30 h after addition of DNA, and processed and assayed as
described above. 15 µl and 2.5 µl of the extract were used for Luciferase and β-
galactosidase assays, respectively; activity was measured on a Monolight 2010
Luminometer (Analytical Luminescence Laboratory, Sparks, MD).
All test constructs were transfected at least in triplicate in each individual
experiment, with experiments repeated at least three times. Promoter activity
was defined as luciferase activity normalized to β-galactosidase activity, to
correct for the transfection efficiency. A t-test assuming unequal variances was
carried out in Microsoft Excel, considering each individual transfection as an
independent data point.
40
4. Electrophoretic mobility shift assays (EMSA)
EMSAs (Sambrook et al., 1989) were carried out with double-strand
oligonucleotides designed to span the putative transcription factor binding sites
(Table 4). Oligonucleotides were synthesized (Integrated DNA Technologies,
Coralville, IA) with a 5′ 6-FAM label on one of the strands, which was annealed to
the complementary unlabeled oligonucleotide. For annealing, the two single-
stranded oligonucleotides were diluted to 5 µM in annealing buffer (10 mM Tris
(pH 8.0), 1 mM EDTA (pH 8.0) and 50 mM NaCl) and mixed in a 1:1 ratio.
Oligonucleotides were heated to 95 0C for 3 min, cooled to 5 0C above their
melting temperature over a period of 5 min, cooled further to 5 0C below melting
temperature over a 1 h period. They were finally allowed to cool to 20 0C over a
period of 3 h.
Nuclear extracts were prepared from HepG2 cells using NE-PER Nuclear
and Cytoplasmic Extraction Reagents (Thermoscientific Pierce, Waltham, MA),
following the manufacturer's protocol. Protein concentrations were measured by
Bio-Rad protein assay (Bio-Rad, Hercules, CA). Protein binding reactions were
carried out with 0.2 or 0. 4 pmol of the annealed oligonucleotides and 10 µg of
the nuclear extracts in 10 mM Tris-HCl (pH 7.5), 60 mM potassium chloride, 2.5
mM magnesium chloride, 1 mM EDTA, 1 mM DTT, 750 ng of poly (dIdC) and 7%
glycerol. Oligonucleotides were incubated with the nuclear extract for 30 min at
25 0C. In competitor assays, unlabeled competitor oligonucleotides in 50-fold
molar excess to the labeled oligonucleotides were added to the reaction before
addition of the probe. For supershift assays, 2 µg of the antibody was added to

41
each reaction. FOXA1 (sc-9186x), FOXA2 (sc-9187x) and IgG (sc-2028)
antibodies were obtained from Santa Cruz Biotechnology (Santa Cruz, CA).
DNA-protein complexes were electrophoresed on 6% polyacrylamide Novex
DNA Retardation Gels (Invitrogen) in 0.5 x TBE running buffer (45 mM Tris-
borate and 1 mM EDTA, pH 8.3) and scanned with fluorescent image analyzer
FLA-5100 (Fujifilm, Valhalla, NY) at 473 nm with the LPB filter.
Oligonucleotide Sequence Description
HE3781 5’6-FAM-TTTCAAGATCAGCAATTT GACAGCAAACATGAACTTTGTA EMSA Oligo 1
HE3782 5’6-FAM-CTGCTTCCCTAACAAAC ACTGAAAAGATCAA EMSA Oligo 2
HE3941 5’6-FAM-TAAGCATGTTGTCTTAT TTGTTAATATGTTACATAATAC EMSA Oligo 3
HE3784 5’6-FAM-TTAGTTTCTTCCCACTA AATAAAAACAAACAGAAGTTTTC EMSA Oligo 4
HE3918 GCCCATTGTTTGTTTTAAGCC FOXA consensus
HE3829 TCCCATACCCCCATTTAAGCC FOXA consensus mutated
HE4017 AAGTTAATGATTAAC HNF-1A consensus
Table 4. Oligonucleotides used in EMSA. Only the sense strand is shown; complementary oligonucleotides were annealed to these and double stranded oligonucleotides were used in EMSA.
42
5. Site directed mutagenesis
Mutants of the potential transcription factor binding sites in fragment 4E3 were
generated by overlap extension PCR (Sambrook et al., 1989). Oligonucleotides
in which the potential transcription factor binding sites were mutated (Table 5)
were synthesized by Integrated DNA Technologies (Coralville, IA). In the first
step of the PCR, two fragments were generated such that they overlap at the
mutated sequence. Products were gel extracted and 75 ng of each product was
used as template in the extension step. Products with overlapping ends were
mixed with R-Taq polymerase and 10 PCR cycles were run without primers.
HE3629 and HE3636 were then added and PCR was continued for another 25
cycles to amplify the full-length fragment. Products of the extension step were
column purified and cloned into BamHI and SalI sites in the pXP2 vector,
upstream of the ADH4 promoter.
6. Generation of the 4E haplotypes
Different haplotypes of the 4E3 region were generated by site-directed
mutagenesis with the Quick change site-directed mutagenesis kit (Stratagene, La
Jolla, CA). Primers were designed with the SNP at the center (Table 5). The
amplified products were digested with DpnI to remove the template plasmid, and
then transformed into DH5α competent cells (Invitrogen). Transformants were
sequenced to confirm the presence of the SNP at the desired site.
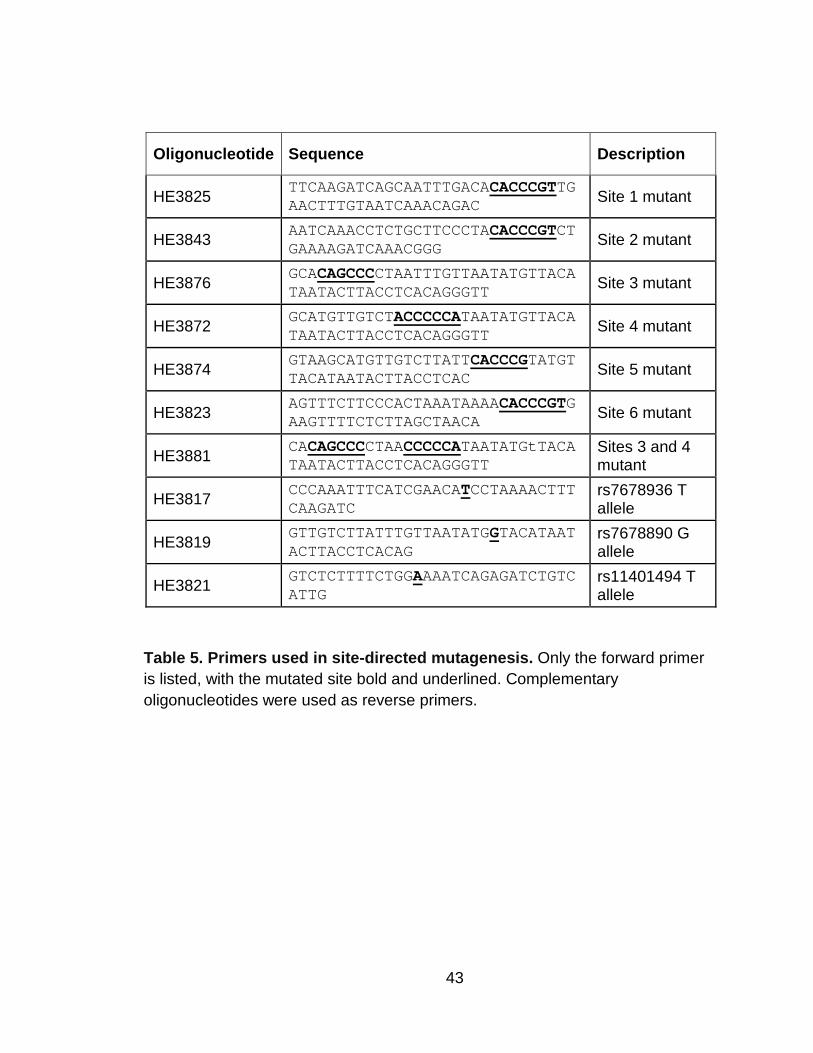
43
Oligonucleotide Sequence Description
HE3825 TTCAAGATCAGCAATTTGACACACCCGTTGAACTTTGTAATCAAACAGAC Site 1 mutant
HE3843 AATCAAACCTCTGCTTCCCTACACCCGTCTGAAAAGATCAAACGGG Site 2 mutant
HE3876 GCACAGCCCCTAATTTGTTAATATGTTACATAATACTTACCTCACAGGGTT Site 3 mutant
HE3872 GCATGTTGTCTACCCCCATAATATGTTACATAATACTTACCTCACAGGGTT Site 4 mutant
HE3874 GTAAGCATGTTGTCTTATTCACCCGTATGTTACATAATACTTACCTCAC Site 5 mutant
HE3823 AGTTTCTTCCCACTAAATAAAACACCCGTGAAGTTTTCTCTTAGCTAACA Site 6 mutant
HE3881 CACAGCCCCTAACCCCCATAATATGtTACATAATACTTACCTCACAGGGTT
Sites 3 and 4 mutant
HE3817 CCCAAATTTCATCGAACATCCTAAAACTTTCAAGATC
rs7678936 T allele
HE3819 GTTGTCTTATTTGTTAATATGGTACATAATACTTACCTCACAG
rs7678890 G allele
HE3821 GTCTCTTTTCTGGAAAATCAGAGATCTGTCATTG
rs11401494 T allele
Table 5. Primers used in site-directed mutagenesis. Only the forward primer is listed, with the mutated site bold and underlined. Complementary oligonucleotides were used as reverse primers.
44
7. Long-term treatment of HepG2 cells with ethanol
Two million HepG2 cells were seeded per 75 cm2 flask (Corning Inc.,
Corning, NY). Six hours after seeding, ethanol was added to a final concentration
of 75 mM to one set of flasks. Every 24 h, media was replaced in both control
and ethanol treatment flasks with fresh media, without or with ethanol,
respectively. Four days after seeding, cells were trypsinized and seeded into new
flasks at two million viable cells per flask, with media changes continuing daily as
before. Five days after the split (a total of 9 days without or with ethanol), cells
were collected by trypsinization. Four independent experiments were carried out.
The numbers of viable cells in the control and ethanol treatment flasks
were measured by trypan blue exclusion. Briefly, 0.1 ml of 0.4% Trypan blue
stain (Sigma T8154) was added to 0.5 ml of trypsinized cells, and allowed to
stand at room temperature for 5 min. Cells that were not stained by the dye were
counted as viable.
8. RNA extraction, labeling and hybridization
Trypsinized cells were pelleted by centrifugation at 2500 rpm for 3 min.
The cell pellet was suspended in 5 ml of Trizol (Invitrogen, Carlsbad, CA) and
total RNA was extracted following the manufacturer’s protocol. RNA was further
purified on RNeasy Mini kit columns (Qiagen, Valencia, CA). The quality of the
RNA was tested on a Bioanalyzer (Agilent Technologies, Palo Alto, CA), with
RNA integration numbers (RIN) from 9.6 to 10. Starting with 1 µg of total RNA,
ribosomal RNA (rRNA) was reduced from the total RNA using RiboMinus
45
Human/Mouse Transcriptome Isolation Kit (Invitrogen, Carlsbad, CA). cDNA was
synthesized with random primers tagged with the T7 promoter. This cDNA was
used as template for cRNA synthesis by T7 RNA polymerase, using the
GeneChip Whole Transcript Sense target labeling assay kit (Affymetrix, Santa
Clara, CA). The sense strand of cDNA was then synthesized from cRNA,
fragmented and terminally labeled with biotin. Fragmented and labeled cDNAs
were subsequently hybridized to GeneChip Human Exon 1.0 ST Arrays
(Affymetrix). Chips were stained, washed and scanned following the standard
Affymetrix protocols. Two technical replicates (processed in separate batches) of
each of the 8 independent samples (4 control, 4 ethanol treated) were used.
9. Exon array data analysis
Affymetrix CEL files were imported into Expression console software
(Affymetrix) and analyzed at the core exon level (HuEx-1_0-st-v2.na28.hg18
annotation) using the PLIER algorithm (Affymetrix, 2005c). For further steps,
control probe sets (e.g. those against intron regions) were excluded. Because
cross-hybridizing probe sets were shown to be a major cause of false predictions
of differential alternative splicing (Xing et al., 2008), only unique probe sets (a
probe set in which all probes perfectly match only one sequence) were included.
Thus 228,871 PLIER probe set signal estimates representing 17,881 genes were
imported into Partek® Genomics Suite software version 6.4 (Partek, St. Charles,
MO), quantile normalized, and log2 transformed. Technical replicates were
normalized and transformed independently.

46
To remove signals that were not significantly different from the
background, “detection above background” (DABG) p-value was calculated.
Exon arrays have 25,000 background probe sets that do not match any
sequence in the genome. Detection above background p-value was calculated by
comparing the signal from each probe to the median intensity of background
probes with the same GC content (Affymetrix, 2005b; Clark et al., 2007). Probe
sets were also filtered based on fraction present (McClintick and Edenberg,
2006). This approach was shown to reduce false positives (McClintick and
Edenberg, 2006) and to improve correlation between fold changes obtained in
array data and quantitative reverse transcription PCR (qRT-PCR) data
(Mieczkowski et al., 2010). In fraction present filtering, a probe set was
considered to be present if it had a detection above background p-value ≤ 0.05 in
all the arrays in at least one of the treatment conditions (ethanol or control, in this
case).
A group of probe sets covering all the known isoforms for a given gene are
referred to as a Transcript cluster; however, for simplicity these will be called
genes. In addition to probe sets, genes were also subjected to present/absent
filtering (McClintick and Edenberg, 2006). A gene was considered to be present if
at least 50% of its probe sets were called present in all the samples in at least
one treatment group (Clark et al., 2007). In the genes that were called present,
only probe sets that were present were analyzed. After filtering steps, 127,805
representing 10,738 genes were included for further analysis.

47
To determine if a gene is differentially expressed or alternatively spliced or
both, two-way analysis of variance (ANOVA) was carried out in Partek ®
Genomics Suite (St. Louis, MO). The ANOVA model included experimental
factors [treatment condition (ethanol vs. control) and batch ID (technical
replicate)] along with the probe sets in each gene. With this model, p-values for
differential expression and alternative splicing were obtained and based on these
p-values, false discovery rate (FDR) (Benjamini and Hochberg, 1995) was
calculated for differential gene expression and alternative splicing.
In this study, a gene was detected as differentially alternatively spliced if
the alternative splicing FDR was ≤ 3%. If a gene meets this cutoff for differential
alternative splicing, it means that one or more of the probe sets are affected by
ethanol differently from other probe sets in the gene. However, this does not
indicate which probe set was affected. Thus, differentially alternatively spliced
genes were visually inspected to determine which probe set was differentially
alternatively spliced. To assist in this closer examination, the effects of ethanol
on each probe set in the gene were studied. One-way ANOVA was carried out to
estimate the fold change and significance of this change (p-value) for each probe
set. Fold change of each probe set was compared to the other probe sets in the
gene to determine if the probe set was responding to alcohol differently from
other probe sets.
Based on visual inspection, genes that were detected as differentially
alternatively spliced (FDR ≤ 3%) were classified into three groups- probably
differentially alternatively spliced, probably not differentially alternatively spliced
48
and uncertain. A gene was called probably differentially alternatively spliced if a
probe set in the gene displayed a fold change significantly different in magnitude
or direction from other probe sets in the gene. For example, C1R gene had a
FDR of 0.3% for differential alternative splicing and thus was inspected for further
analysis. In this gene four probe sets had a fold change in the range of 1.4 to 1.6
while another probe set had a 2.5-fold change. Because of this difference, the
probe set and the gene were considered probably differentially alternative
spliced.
To qualify as differentially alternatively spliced in the presence of ethanol,
at least one exon had to be significantly different from the others (p-value > 0.05
in one-way ANOVA). For example, ACAD11 was identified as differentially
alternatively spliced with FDR of 0.001%. It had 18 probe sets that were included
in the analysis. Most of these probe sets were affected by only a small magnitude
by ethanol. One probe set however, was apparently increased in expression by
3-fold but the change was not significant (p-value for that probe set was 0.1).
Therefore this gene was grouped under probably not differentially alternatively
spliced. A gene was also considered probably not differentially alternatively
spliced if the probe sets towards the 5’ or 3’ end were exhibiting probable edge
effects (refer to Figure 19); these could represent real biological effects but
because they are also artifactually produced (Bemmo et al., 2008; Whistler et al.,
2010) we chose not to further examine them. A gene was classified as uncertain,
if it was difficult to say if the gene had an alternative isoform with ethanol or
which probe set in the gene was alternatively spliced. An example is shown in

49
Figure 20. A gene was also grouped as uncertain if the adjacent probe set in the
same exon did not behave the same way. In the absence of known alternative
events, it was not possible to say if these are alternate donor and acceptor sites
or technical artifacts.
To identify biological pathways or processes affected by ethanol
treatment, differentially expressed genes were analyzed by Ingenuity Pathway
Analysis software (Ingenuity® Systems, www.ingenuity.com). Steps in the exon
data analysis are shown in Figure 5.

50
Figure 5. Exon array data analysis. The workflow of exon array data analysis is shown.
Gene Chip Human Exon 1.0 ST ArraysCEL Files
PLIER exon level signals
Present/ Absent filteringProbe sets and Genes present in all
arrays, at least in one condition
2-way ANOVA
Biological function analysisIngenuity Pathway Analysis
Differentially expressed genes (irrespective of alternative splicing)
Core, main and unique probesetsQuantile normalization, log (2)
transformation
Differentially alternatively spliced genes (irrespective of differential expression)
Visual inspection
1-way ANOVA
51
10. Validation of differential gene expression by qRT-PCR
Quantitative real time RT-PCR assays (Taqman gene expression assays)
were carried out to confirm differential gene expression changes that were
observed in microarray data. The synthesis of the first strand of cDNA was
carried out using Superscript First-Strand Synthesis System (Invitrogen,
Carlsbad, CA) or High-capacity cDNA Reverse Transcription kit (Applied
Biosystem, Foster City, CA) following manufacturer’s directions. For seven genes
(FGG, GCLC, IDH2, TGFBR3, HK2 and CPT1A) 2 µg of total RNA was used as
a template and the first strand of cDNA was synthesized with Superscript First-
Strand Synthesis System. For the remaining genes (HTR3B, SREBF1, BHMT,
CHRNA5, PCK1, TGFB1), the High-capacity cDNA Reverse Transcription kit was
used with 1 µg or 1.5 µg of total RNA. Two independent cDNA synthesis
reactions were carried out on each sample from the four independent
experiments. Aliquots of the cDNA were used in real time PCR reactions with
Taqman Gene expression assays (Applied Biosystems). Real time PCR
reactions were carried out in triplicate on each of the two independently
synthesized cDNAs from each sample. Mitochondrial ribosomal protein L3
(MRPL3) was used as an endogenous control, because our microarray data
demonstrated that MRPL3 had very low variation among samples and between
control and ethanol conditions. Fold change for ethanol over control was
calculated by delta delta Ct method (Livak and Schmittgen, 2001).
52
11. Validation of alternative splicing by qRT-PCR
To identify if there are alternative isoforms of the gene with respect to the
test exon, PCR was carried out with primers flanking the test exon (Table 6). The
High-capacity cDNA Reverse Transcription kit was used with 1.5 µg of total RNA
and random primers (Invitrogen, Carlsbad, CA). For each condition (control or
ethanol) cDNA from each of the four independent experiments was pooled and
PCR was carried out using R-Taq polymerase (Midsci). PCR products were
visualized on a 1.5% agarose gel to determine if the exon was alternatively
spliced.
Quantitative real time RT-PCR assays (SYBR green assays) were carried
out to confirm differential alternative splicing changes that were observed in
microarray data. For BPGM and CD55 1.5 µg of total RNA from each of the four
independent experiments was used as a template and the first strand of cDNA
was synthesized with Superscript First-Strand Synthesis System and oligo d(T)
primers (Promega, Madison, WI). For MBD5 the High-capacity cDNA Reverse
Transcription kit was used with 1.5 µg of total RNA and random primers
(Invitrogen, Carlsbad, CA). Primers used to amplify each gene are listed in Table
6. Real time PCR reactions were carried out in duplicate on cDNA from each of
the four independent experiments. For each experiment sample, the mean of Ct
for control was subtracted from the mean of the Ct for ethanol and fold change
was calculated by 2-(delta Ct).

53
Primer Primer sequence Gene HE3679 ATGGAGTGCTTTATGTCAGTCCCAGTG MBD5 HE3680 ACATCTTCTGCGGTTCTCTGTTTCACA MBD5 HE3687 CCGAGGAAGGGAAGGTGGAGC MBD5 HE3689 CACCCTGTGGGATTTGGTGTACAGTC MBD5 HE3695 GGTATGCGGTGGTGTGATCGTA CD55 HE3697 AACGTGAAACACGTGTGCCCTG CD55 HE3768 TTGACAGGTTTGCTTGGGACGC CD55 HE3769 GACTGCCTTTTTTCTCCTTGCTCTG CD55 HE3694 CACTTCAGGTACTACCCGTCTTCTATCTGG CD55 HE3711 CCAGAGGTGTGGGGTGGAAGT ACSL1 HE3712 GGTGAGTGACCATTGCTCCTTTGG ACSL1 HE3690 TGCTGCTGCTGCTGGTGGC BPGM HE3693 TTCAAATGGGCTAATATTCAAGGACAGC BPGM HE3691 ACTTTCTGTTTACACAAGAGTTGCCTCC BPGM HE3704 GATGGGAATGTGATGCTGCCTTCTAGTA NR2C1 HE3705 CCCAGTGCTGGCAAGTGATGAA NR2C1
Table 6. Primers used for validation of alternative splicing.
54
III. RESULTS
1. Identification of an enhancer in the ADH cluster
A comparative genomics approach was used to identify distal regulatory
elements that affect expression of the ADH genes. Using the UCSC
Conservation track, conservation in the intergenic regions between ADH4 and
ADH5, ADH4 and ADH6, and ADH6 and ADH1A was explored. Conservation in
placental mammals, Rhesus, bushbaby, tree shrew, rat, mouse, guinea pig,
rabbit, shrew, hedgehog, dog, cat, horse, and cow, was studied and regions with
at least 50% conservation were identified as putative cis-regulatory regions. Eight
putative regions were identified and their effect on the activity of the ADH4 Basal
promoter (4Basal) was tested in transient transfection assays in the HepG2
human hepatoma cells. The position of tested fragments in the ADH cluster is
shown in Figure 6.
Six of the eight regions tested decreased the activity of the promoter
(Figure 7), while another had no effect. Among these six negative regulatory
regions, the greatest effect was observed at site 4-5-a which is 23 kb upstream of
ADH5. It decreased the promoter activity to 0.26-fold. The region 6-4-a, 19.5 kb
upstream of the ADH4 also decreased the promoter activity by 70%. A similar
effect was observed with 1A-6-d but other regions (1A-6-a, 1A-6-c , 1A-6-e)
between ADH1A and ADH6 had modest effects.

55
Figure 6. Location of the tested putative regulatory regions. Eight regions that were conserved in the 220 kb of the ADH cluster (Figure 2) studied are shown. The direction of the arrows represents the direction of transcription. Location relative to the nearest +1 CDS (in the direction of transcription) based on the human genome NCBI build 36 is also indicated.
1A-6-a-49 kb
1A-6-b
1A-6-c-46 kb
1A-6-d 1A-6-e
6-4-a 4E
4-5-a
-33 kb -32 kb
-19 kb -13 kb
-23 kb
ADH1A
ADH6
ADH4
ADH5

56
Figure 7. Six putative regulatory regions decrease transcription. Conserved regions were subcloned into pXP2 reporter vector upstream of 4Basal, and transiently transfected into HepG2 cells (n = 12). Transcription was determined as luciferase activity normalized to the internal control β- galactosidase. Fold change was calculated as ratio of the activity of each construct to the activity of 4Basal (set to one and therefore not shown); bars indicate the standard errors of the mean. *p-value ≤ 1 x 10⁻⁵.
0.0
0.2
0.4
0.6
0.8
1.0
1.2
1.4
1A-6-a 1A-6-b 1A-6-c 1A-6-d 1A-6-e 6-4-a 4-5-a
Fold
cha
nge
to 4
Bas
al
Test fragment
***
** *
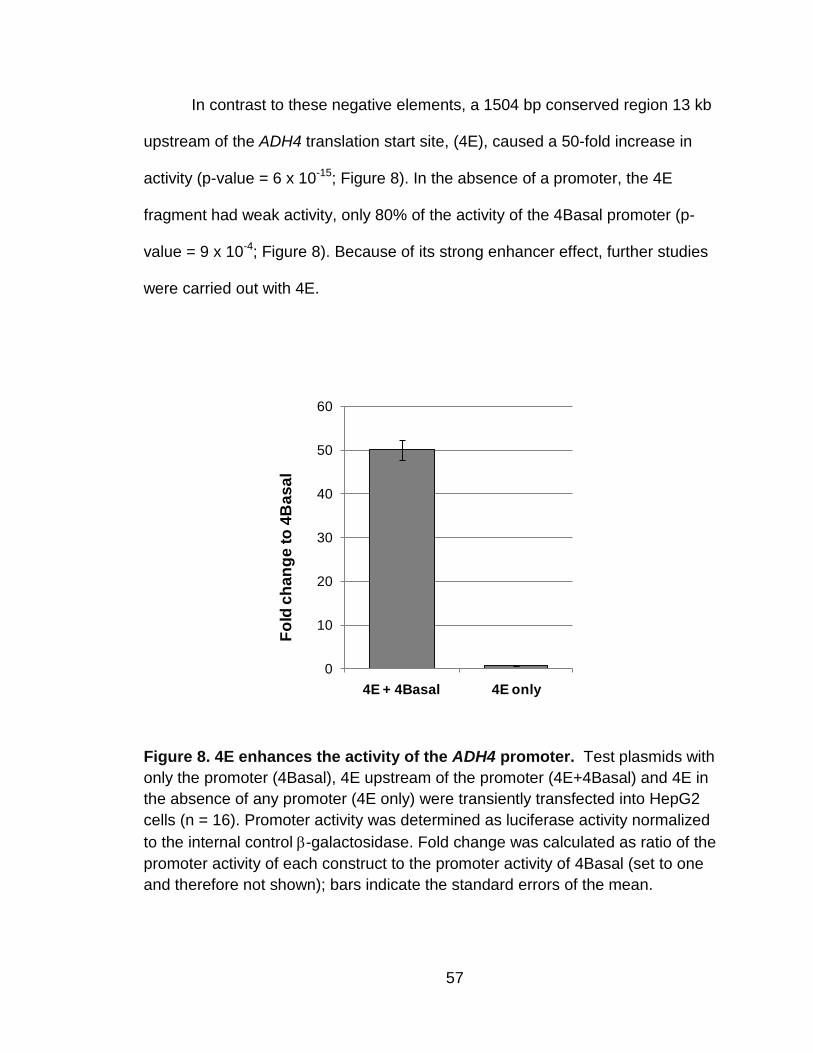
57
In contrast to these negative elements, a 1504 bp conserved region 13 kb
upstream of the ADH4 translation start site, (4E), caused a 50-fold increase in
activity (p-value = 6 x 10-15; Figure 8). In the absence of a promoter, the 4E
fragment had weak activity, only 80% of the activity of the 4Basal promoter (p-
value = 9 x 10⁻⁴; Figure 8). Because of its strong enhancer effect, further studies
were carried out with 4E.
Figure 8. 4E enhances the activity of the ADH4 promoter. Test plasmids with only the promoter (4Basal), 4E upstream of the promoter (4E+4Basal) and 4E in the absence of any promoter (4E only) were transiently transfected into HepG2 cells (n = 16). Promoter activity was determined as luciferase activity normalized to the internal control β-galactosidase. Fold change was calculated as ratio of the promoter activity of each construct to the promoter activity of 4Basal (set to one and therefore not shown); bars indicate the standard errors of the mean.
0
10
20
30
40
50
60
4E + 4Basal 4E only
Fold
cha
nge
to 4
Bas
al
58
2. Characterization of the enhancer element 4E
2.a. Effect of 4E on heterologous promoters
To determine if the enhancer acts specifically on the ADH4 promoter, it
was tested in combination with two heterologous promoters. 4E increased the
activity of another ADH promoter, the ADH1B basal promoter (1Basal), by 180-
fold (p-value = 2 x 10-12) in HepG2 cells. It increased the activity of the SV40
promoter (SV40Basal) by 56-fold (p-value = 8 x 10⁻¹⁰).
2.b. Function of 4E in non-hepatoma cells
Cell specificity of 4E was tested in H1299 cells, a lung carcinoma cell line.
Of the seven ADHs, only ADH1B is known to be expressed in lungs. However,
the transfected minimal promoters of both ADH4 and ADH1B did show activity
above the vector-only background. Therefore, the enhancer activity of 4E was
tested upstream of ADH4, ADH1B and SV40 promoters. No enhancer activity
was detected with any of the three promoters (Table 7). These results suggest
that 4E shows cellular specificity.
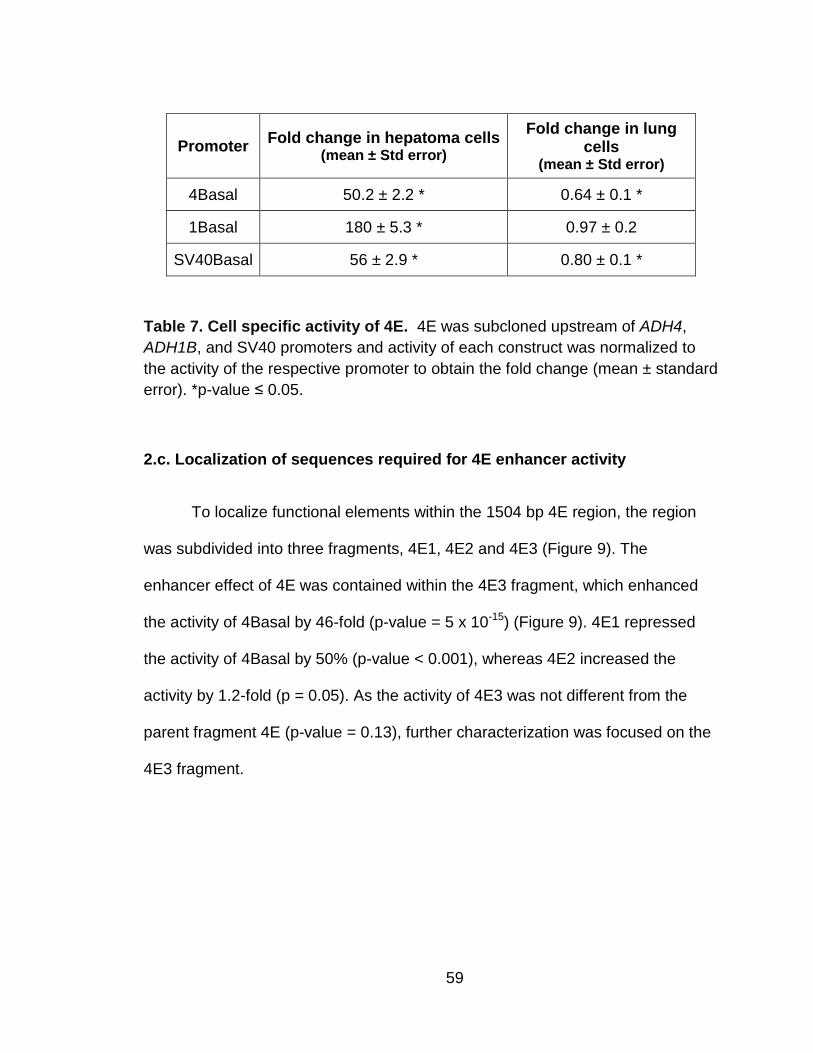
59
Promoter Fold change in hepatoma cells (mean ± Std error)
Fold change in lung cells
(mean ± Std error)
4Basal 50.2 ± 2.2 * 0.64 ± 0.1 *
1Basal 180 ± 5.3 * 0.97 ± 0.2
SV40Basal 56 ± 2.9 * 0.80 ± 0.1 *
Table 7. Cell specific activity of 4E. 4E was subcloned upstream of ADH4, ADH1B, and SV40 promoters and activity of each construct was normalized to the activity of the respective promoter to obtain the fold change (mean ± standard error). *p-value ≤ 0.05.
2.c. Localization of sequences required for 4E enhancer activity
To localize functional elements within the 1504 bp 4E region, the region
was subdivided into three fragments, 4E1, 4E2 and 4E3 (Figure 9). The
enhancer effect of 4E was contained within the 4E3 fragment, which enhanced
the activity of 4Basal by 46-fold (p-value = 5 x 10-15) (Figure 9). 4E1 repressed
the activity of 4Basal by 50% (p-value < 0.001), whereas 4E2 increased the
activity by 1.2-fold (p = 0.05). As the activity of 4E3 was not different from the
parent fragment 4E (p-value = 0.13), further characterization was focused on the
4E3 fragment.

60
Figure 9. The enhancer function of 4E is located in a 565 bp region. (A) Position of 4E relative to flanking genes; the direction of the arrows represents the direction of transcription. This region is enlarged below, along with sub-fragments tested for activity. (B) The effects of subfragments of 4E upon the ADH4 basal promoter were tested in transient transfections in HepG2 cells (n = 16). Fold change was calculated as ratio of the normalized luciferase activity of each construct to that of 4Basal; bars indicate the standard errors of the mean.
ADH4ADH6
-14.5 kb -13.0 kb4E1
4E
4E2
4E3
-13.0 kb-14.5 kb
-13.5 kb-14.0 kb
-13.5 kb-13.9 kb
ADH4 +1 CDS
A
0
10
20
30
40
50
60
4E 4E1 4E2 4E3
Fold
cha
nge
to 4
Bas
al
B
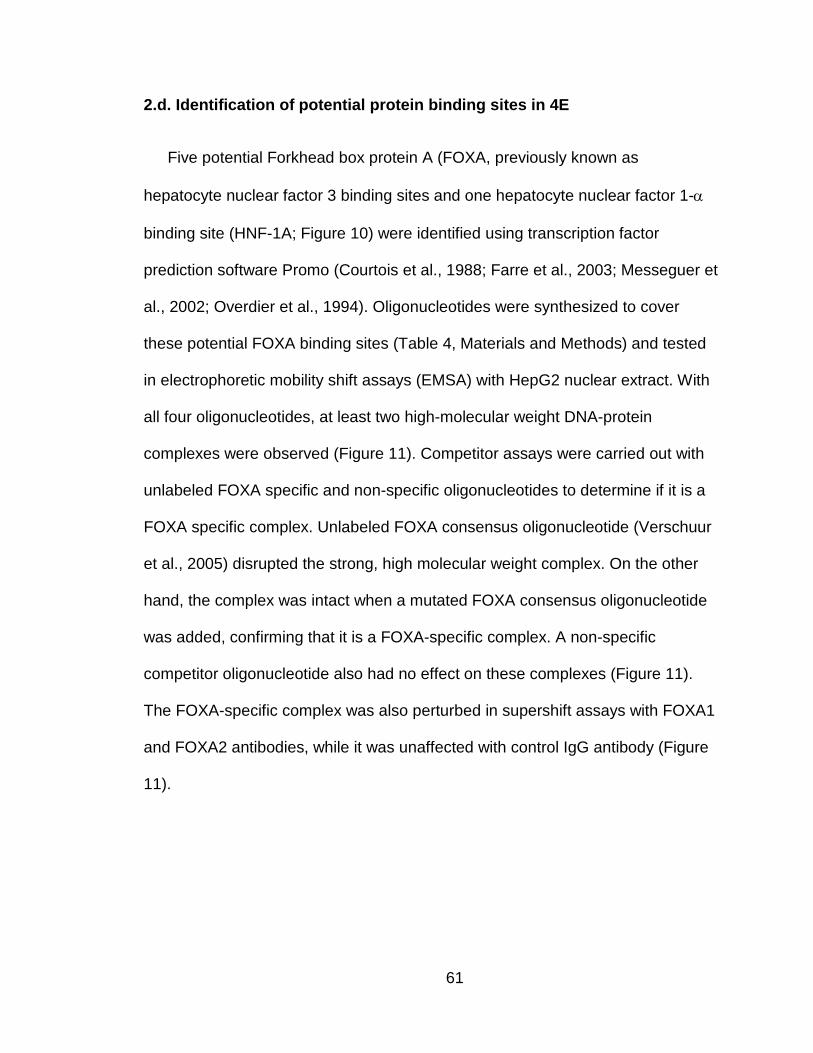
61
2.d. Identification of potential protein binding sites in 4E
Five potential Forkhead box protein A (FOXA, previously known as
hepatocyte nuclear factor 3 binding sites and one hepatocyte nuclear factor 1-α
binding site (HNF-1A; Figure 10) were identified using transcription factor
prediction software Promo (Courtois et al., 1988; Farre et al., 2003; Messeguer et
al., 2002; Overdier et al., 1994). Oligonucleotides were synthesized to cover
these potential FOXA binding sites (Table 4, Materials and Methods) and tested
in electrophoretic mobility shift assays (EMSA) with HepG2 nuclear extract. With
all four oligonucleotides, at least two high-molecular weight DNA-protein
complexes were observed (Figure 11). Competitor assays were carried out with
unlabeled FOXA specific and non-specific oligonucleotides to determine if it is a
FOXA specific complex. Unlabeled FOXA consensus oligonucleotide (Verschuur
et al., 2005) disrupted the strong, high molecular weight complex. On the other
hand, the complex was intact when a mutated FOXA consensus oligonucleotide
was added, confirming that it is a FOXA-specific complex. A non-specific
competitor oligonucleotide also had no effect on these complexes (Figure 11).
The FOXA-specific complex was also perturbed in supershift assays with FOXA1
and FOXA2 antibodies, while it was unaffected with control IgG antibody (Figure
11).
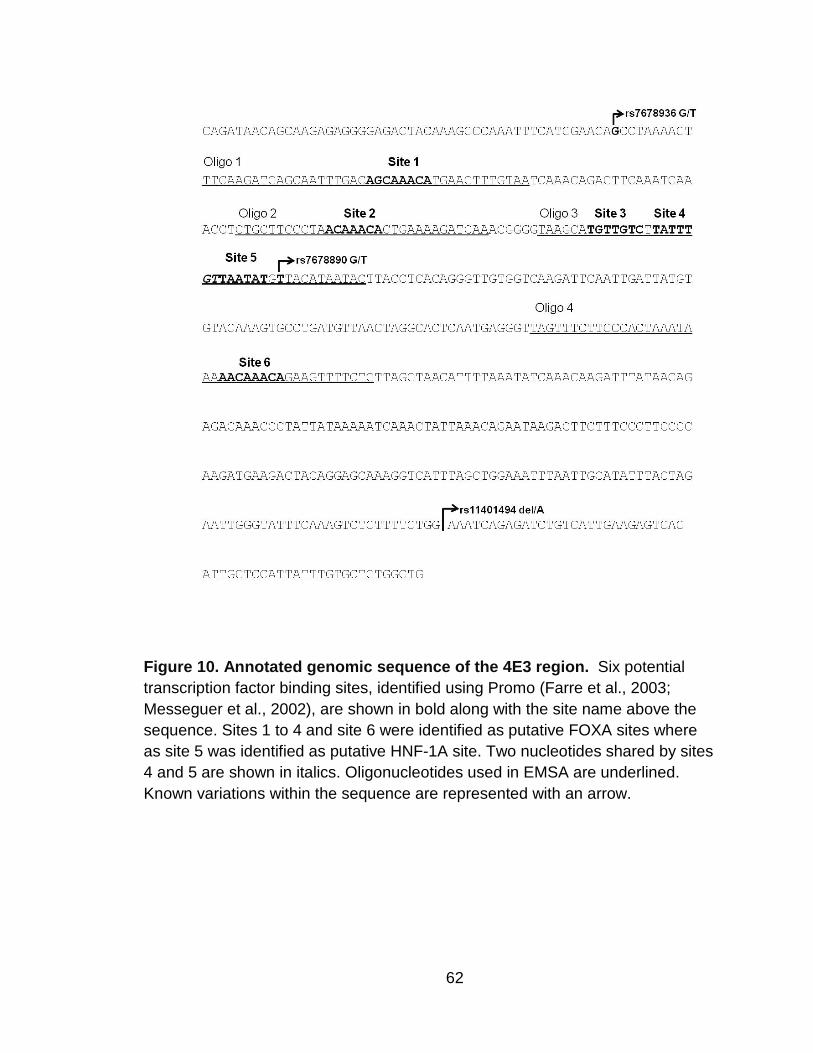
62
Figure 10. Annotated genomic sequence of the 4E3 region. Six potential transcription factor binding sites, identified using Promo (Farre et al., 2003; Messeguer et al., 2002), are shown in bold along with the site name above the sequence. Sites 1 to 4 and site 6 were identified as putative FOXA sites where as site 5 was identified as putative HNF-1A site. Two nucleotides shared by sites 4 and 5 are shown in italics. Oligonucleotides used in EMSA are underlined. Known variations within the sequence are represented with an arrow.
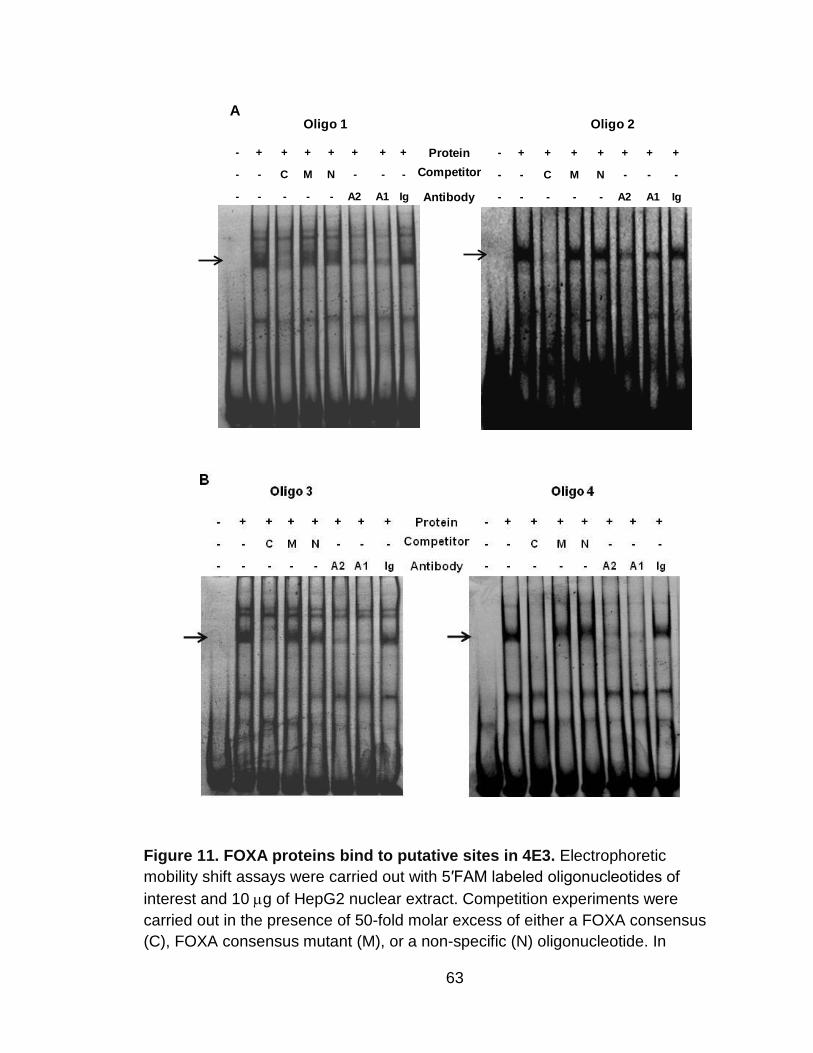
63
Figure 11. FOXA proteins bind to putative sites in 4E3. Electrophoretic mobility shift assays were carried out with 5′FAM labeled oligonucleotides of interest and 10 µg of HepG2 nuclear extract. Competition experiments were carried out in the presence of 50-fold molar excess of either a FOXA consensus (C), FOXA consensus mutant (M), or a non-specific (N) oligonucleotide. In
Oligo 1 Oligo 2
-
-
-
+
-
-
+
C
-
+
-
A2
+
N
-
+
M
-
+
-
Ig
ProteinCompetitor
Antibody
+
-
A1
-
-
-
+
-
-
+
C
-
+
-
A2
+
N
-
+
M
-
+
-
Ig
+
-
A1
A

64
supershift assays, 2 µg of either FOXA2 antibody (A2), FOXA1 antibody (A1) or goat IgG (Ig) antibody was added. (A) Gel shifts with Oligos 1 and 2 that span sites 1 and 2, respectively, are shown. (B) Gel shifts in which Oligo 3 (sites 3, 4, and 5) and Oligo 4 (site 6) were used as probes are shown. FOXA specific bands are indicated by arrows, other bands were non-specific.
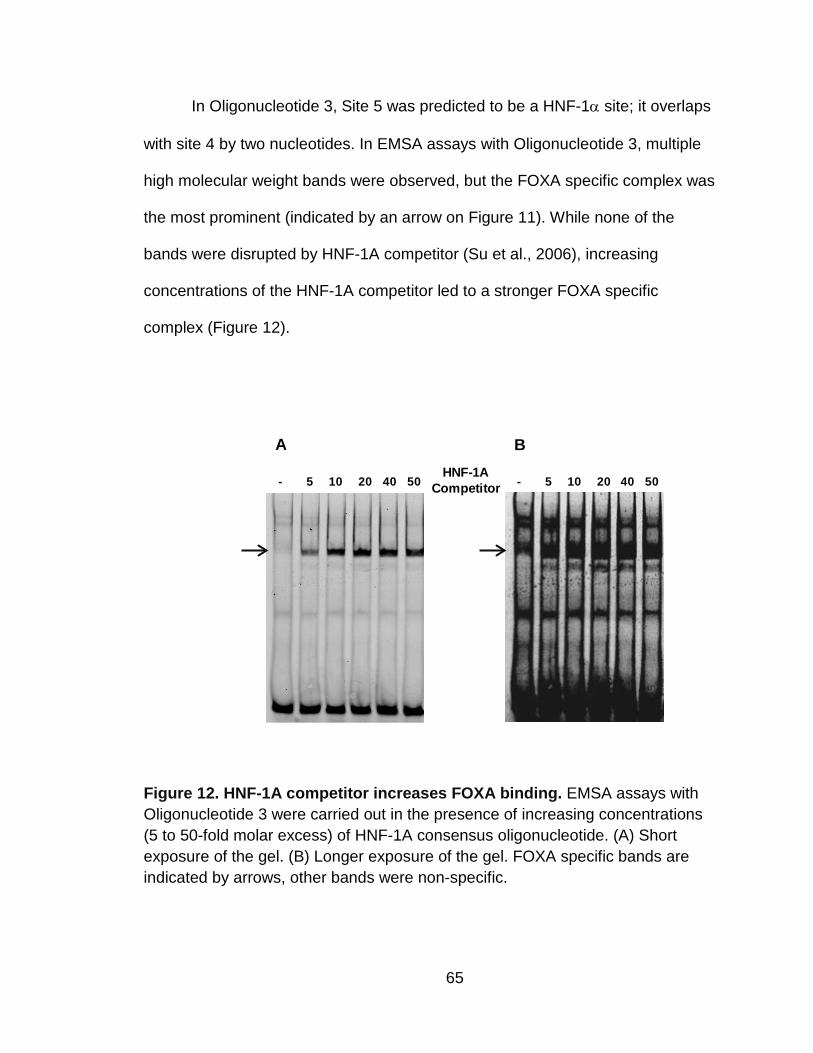
65
In Oligonucleotide 3, Site 5 was predicted to be a HNF-1α site; it overlaps
with site 4 by two nucleotides. In EMSA assays with Oligonucleotide 3, multiple
high molecular weight bands were observed, but the FOXA specific complex was
the most prominent (indicated by an arrow on Figure 11). While none of the
bands were disrupted by HNF-1A competitor (Su et al., 2006), increasing
concentrations of the HNF-1A competitor led to a stronger FOXA specific
complex (Figure 12).
Figure 12. HNF-1A competitor increases FOXA binding. EMSA assays with Oligonucleotide 3 were carried out in the presence of increasing concentrations (5 to 50-fold molar excess) of HNF-1A consensus oligonucleotide. (A) Short exposure of the gel. (B) Longer exposure of the gel. FOXA specific bands are indicated by arrows, other bands were non-specific.
- 5 10 504020 - 5 10 504020HNF-1A
Competitor
A B

66
2.e. Effect of mutations on enhancer activity
To test the functional role of the putative FOXA sites in the 4E3 region,
each of these sites was mutated and tested in transient transfections of HepG2
cells. Mutation of sites 1 and 4 decreased the activity by 60% and 65%,
respectively (Figure 13), whereas mutations at sites 2, 3, and 5 reduced the
activity by at least 40%. Disruption of site 6 did not have a significant effect.
To test the function of these sites in a combinatorial fashion, multiple sites
were mutated. A double mutant of sites 1 and 4 lost most of the activity,
exhibiting only 0.2-fold of the wild type enhancer. The activity was further
decreased to 0.1-fold when multiple sites were mutated in conjunction with site 1
(Figure 13).

67
Figure 13. Effects of site-directed mutations on enhancer function. Potential FOXA and HNF-1α sites were mutated in 4E3 and tested in transient transfections of HepG2 cells (n = 16). Fold change was calculated as ratio of the enhancer activity of each mutated construct to the wild type; bars indicate the standard errors of the mean. (A) Activity of single site mutants. (B) Activity of double or multiple site mutants. *p-value ≤ 1.5 x 10⁻⁷.
0.00.10.20.30.40.50.60.70.80.91.01.1
WT 1 2 3 4 5 6
Fold
cha
nge
to W
ild ty
pe 4
E3
Mutated site
*
**
*
*
A
0.0
0.2
0.4
0.6
0.8
1.0
WT 1 & 4 1, 2, 4 & 6
1, 2, 5 & 6
1, 2, 3 & 6
Fold
cha
nge
to W
ild ty
pe 4
E3
Mutated Site
B
* ** *

68
3. Effects of regulatory variations on gene expression
One of the hypotheses of this study is that variations in the regulatory
regions of the ADH genes could lead to different levels of expression, thereby
affecting the risk for alcoholism. Therefore, the effects of variations in two key
regulatory regions, enhancer 4E3 and ADH1B proximal promoter, in the ADH
cluster were studied.
3.a. Effects of natural variations on 4E3 enhancer activity
There are three known SNPs in the 4E3 enhancer region (NCBI dbSNP
Build 130). The position of each SNP is shown in Figure 10. The genotype and
allele frequencies for rs7678936 and for rs7678890 are shown in Table 8. Data
for rs11401494 are unavailable.
In transient transfections, four different haplotypes of 4E3, cloned
upstream of the ADH4 promoter, were tested. The activities of all haplotypes
were normalized to the activity of the most common haplotype in most
populations: rs7678936 G, rs7678890 T, and rs11401494 del, which is denoted
as haplotype 1. The activity of haplotype 2 (T, T, del) was only 60% that of
haplotype 1. Haplotype 3 (G, G, del) displayed a similar decrease in activity.
Insertion of A at position -13,058 (Haplotype 4: G, T, A) had a very small but
significant effect (0.9-fold change relative to the haplotype 1, p-value = 0.02;
Figure 14).

69
A rs7678936 Allele Genotype
Hapmap Population T G T/T T/G G/G
CEU 0.1 1 0.1 0.9 CHB 1 1 JPT 1 1 YRI 0.3 0.7 0.1 0.4 0.5
ASW 0.3 0.7 0.1 0.4 0.5 CHD 0 1 0 0 1 GIH 0 1 0 0 1 LWK 0.3 0.7 0.1 0.4 0.5 MEX 0 1 0 0.1 0.9 MKK 0.3 0.7 0.1 0.4 0.5 TSI 0.1 0.9 0 0.1 0.9
B
rs7678890 Allele Genotype
Hapmap Population T G T/T T/G G/G
CEU 1 0.1 0.9 0.1 CHB 1 1 JPT 1 1 YRI 0.7 0.3 0.5 0.4 0.1
Table 8. Allele and genotype frequencies of SNPs in the 4E3 region. Allele and genotype frequencies in different populations for the two SNPs in the enhancer region 4E3 were obtained from HapMap (release 27, Phase II and III; hapmap.ncbi.nlm.nih.gov). Data for rs11401494 are not available. (A) Data for rs7678936. (B) Data for rs7678890. Populations are Utah residents with ancestry from northern and western Europe (CEU), Han Chinese in Beijing, China (CHB), Japanese in Tokyo, Japan (JPT), Yoruba in Ibadan, Nigeria (YRI), African ancestry in Southwest USA (ASW), Chinese in Metropolitan Denver, Colorado (CHD), Gujarati Indians in Houston, Texas (GIH), Luhya in Webuye, Kenya (LWK), Mexican ancestry in Los Angeles, California (MEX), Maasai in Kinyawa, Kenya (MIKK), and Toscans in Italy (TSI).
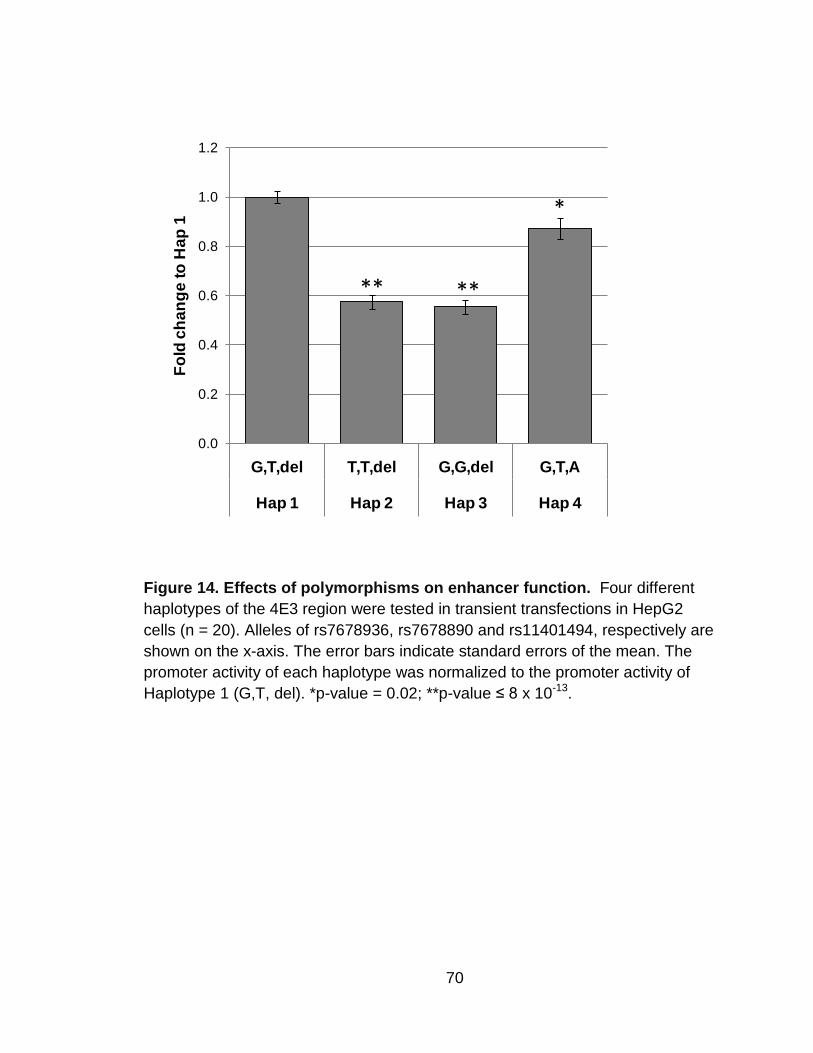
70
Figure 14. Effects of polymorphisms on enhancer function. Four different haplotypes of the 4E3 region were tested in transient transfections in HepG2 cells (n = 20). Alleles of rs7678936, rs7678890 and rs11401494, respectively are shown on the x-axis. The error bars indicate standard errors of the mean. The promoter activity of each haplotype was normalized to the promoter activity of Haplotype 1 (G,T, del). *p-value = 0.02; **p-value ≤ 8 x 10-13.
0.0
0.2
0.4
0.6
0.8
1.0
1.2
G,T,del T,T,del G,G,del G,T,A
Hap 1 Hap 2 Hap 3 Hap 4
Fold
cha
nge
to H
ap 1
** **
*
71
3.b. Effects of polymorphisms on ADH1B promoter activity
In association studies of alcohol dependence (defined as meeting alcohol
dependence criteria by DSM-IIIR (American Psychiatric Association, 1987) plus
Feighner definite alcoholism (Feighner et al., 1972), three SNPs in the ADH1B
region were significantly associated (Edenberg et al., 2006). Two of these
variations (rs1229982 and rs1159918) are located in the proximal promoter
region, while rs1353621 is in the first intron. Allele and genotype frequencies of
rs1229982 and rs1159918 are shown in Table 9.

72
rs1229982 Allele Genotype
Hapmap Population A C A/A C/A C/C
CEU 0.2 0.8 0.0 0.3 0.7 CHB 0.0 1.0 0.0 0.1 0.9 JPT 0.0 1.0 0.0 0.1 0.9 YRI 0.6 0.4 0.3 0.5 0.2
ASW 0.5 0.5 0.2 0.5 0.2 CHD 0.1 0.9 0.0 0.1 0.9 GIH 0.1 0.9 0.0 0.2 0.8 LWK 0.5 0.6 0.2 0.6 0.3 MEX 0.2 0.8 0.0 0.3 0.7 MKK 0.4 0.6 0.2 0.5 0.3 TSI 0.2 0.8 0.1 0.3 0.6
rs1159918 Allele Genotype
Hapmap Population T G T/T T/G G/G
CEU 0.3 0.7 0.1 0.4 0.5 CHB 0.2 0.8 0.0 0.3 0.6 JPT 0.2 0.8 0.0 0.3 0.7 YRI 0.9 0.1 0.8 0.2 0.0
ASW 0.7 0.3 0.5 0.4 0.1 CHD 0.1 0.9 0.0 0.3 0.7 GIH 0.3 0.7 0.1 0.5 0.4 LWK 0.7 0.3 0.5 0.4 0.2 MEX 0.7 0.3 0.5 0.4 0.1 MKK 0.7 0.3 0.5 0.4 0.1 TSI 0.3 0.7 0.1 0.4 0.6
Table 9. Allele and genotype frequencies for two SNPs in the ADH1B proximal promoter region. Allele and genotype frequencies in different populations for the two SNPs that were associated with alcoholism were obtained from HapMap (release 27, Phase II and III; hapmap.ncbi.nlm.nih.gov). Populations are as in Table 8.

73
The effects of rs1229982 and rs1159918 SNPs, along with the other
natural variations in the region of -1484 bp to -10 bp (with respect to the coding
sequence start site were tested). The Single Nucleotide Polymorphism database
(dbSNP; www.ncbi.nlm.nih.gov/projects/SNP/) reports 12 SNPs in this region
(Figure 15). The region was PCR amplified from DNA of various individuals to
generate the natural haplotypes, and cloned into the pXP2 reporter plasmid. Five
different haplotypes, haplotype 1 to haplotype 5 (Table 10), were obtained. The
five haplotypes had the same allele for five SNPs (rs28913901, rs28913903,
rs28913904, rs3076071 and rs28913905) but differed in the remaining seven
positions.

74
Figure 15. Variations in the ADH1B proximal promoter region. Twelve variations in the proximal promoter are shown as vertical lines with the two alleles and the SNP ID (rs number) at the end. Filled circles represent those variations that were tested in the transfection assays. For some variations (shown as open circles), the same allele was present in all the haplotypes tested. Rectangular boxes represent SNPs that were associated with alcoholism in European Americans. Position is relative to the ADH1B + 1 translational start site.
Haplotype 1229982 28913902 6810842 2070897 2070898 1159918 5860575
1 A - A C C T - 3 C T C T T G - 4 C T C C C T - 2 A T C T C G - 5 C T A C C T G
Table 10. Tested haplotypes of the ADH1B proximal promoter. Five haplotypes with seven SNPs that were obtained from cloning the proximal promoter region are shown; they were identical at all other positions. Alleles of the two SNPs that were associated with alcoholism are shown in bold.

75
Five haplotypes were tested in HepG2 cells by transient transfections. The
activity of each was normalized to that of haplotype 1, which had the sequence
closest to the reference sequence in Genbank (accession number
NT_016354.17). A significant (p-value ≤ 5.4 x 10⁻⁷) decrease in the promoter
activity relative to haplotype 1 was observed in haplotypes 3, 4 and 5, whereas
no difference in activity was seen with haplotype 2 (p-value = 0.39; Figure 16).
Analysis of the combination of SNPs in the five haplotypes suggested that SNP
rs1229982 at -1444 position might be responsible for the decrease in the activity.
The promoter with the rs1229982 C allele at this position leads to a 30%
decrease in the promoter activity.

76
Figure 16. Variations in the ADH1B promoter affect activity. Five different haplotypes of the ADH1B proximal promoter region were tested in transient transfections in HepG2 cells (n = 12). The promoter activity of each haplotype was normalized to the promoter activity of Haplotype 1. Alleles of rs1229984, and rs1159918, respectively are shown on the x-axis. The error bars indicate standard errors of the mean. * p-value ≤ 6.6 x 10⁻⁴.
0.0
0.2
0.4
0.6
0.8
1.0
1.2
Hap. 1 Hap. 2 Hap. 3 Hap. 4 Hap. 5
A, T A, G C, G C,T C, T
Fold
cha
nge
to H
ap. 1
* * *
A, T A, G C, G C, T C, T
77
4. Effects of alcohol on gene expression
To determine the effects of long term ethanol exposure on global gene
expression, human hepatoma cells (HepG2) were exposed to 75 mM (0.34%)
ethanol for nine days, with fresh media daily. To investigate the effect of ethanol
on cell growth, the number of viable cells was counted by trypan blue exclusion.
After the initial four day exposure to 75 mM ethanol, there were only 48% as
many viable cells as in the control cultures. Two million viable cells were again
seeded in new flasks and cultured in ethanol for the next five days. There were
again 48% as many viable cells in the ethanol-treated cultures as in the control
cultures. The decrease in viable cell number could be due to a longer lag phase,
or a reduced rate of cell growth, or cell death. However, before trypsinization,
cells appeared to be similar in morphology in both ethanol and control conditions.
We did not observe many floating or dead cells in the presence of ethanol.
Effects of ethanol on gene expression were studied using Affymetrix
GeneChip® Human Exon 1.0 ST Arrays. Among the 17,881 genes represented
by main and unique probe sets, 10,738 genes (60%) were reliably detected in at
least one of the treatment conditions, and only those were used for further
analysis. Genes with just one probe set reliably detected were also excluded
(516 genes). Two-way ANOVA was applied to identify genes that were
differentially expressed. Steps in the data analysis are shown in Materials and
Methods (Figure 5).

78
Of the 10,222 genes that were analyzed many were differentially
expressed (Table 11). Most of the expression differences were modest, with
absolute fold change between 1.1 and 1.3 (Figure 17).
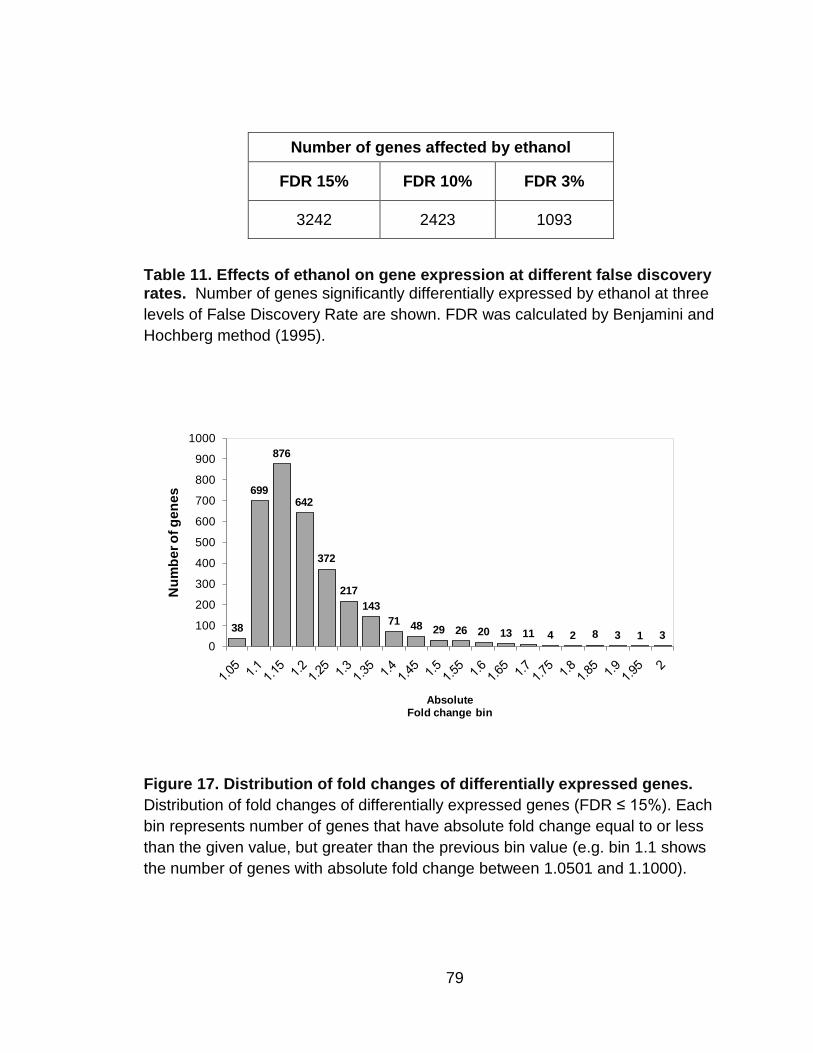
79
Number of genes affected by ethanol
FDR 15% FDR 10% FDR 3%
3242 2423 1093
Table 11. Effects of ethanol on gene expression at different false discovery rates. Number of genes significantly differentially expressed by ethanol at three levels of False Discovery Rate are shown. FDR was calculated by Benjamini and Hochberg method (1995).
Figure 17. Distribution of fold changes of differentially expressed genes. Distribution of fold changes of differentially expressed genes (FDR ≤ 15%). Each bin represents number of genes that have absolute fold change equal to or less than the given value, but greater than the previous bin value (e.g. bin 1.1 shows the number of genes with absolute fold change between 1.0501 and 1.1000).
38
699
876
642
372
217143
71 48 29 26 20 13 11 4 2 8 3 1 30
100
200
300
400
500
600
700
800
900
1000
Num
ber o
f gen
es
Absolute Fold change bin

80
At a stringent false discovery rate (FDR) of 3% a total of 1,093 genes were
differentially expressed due to chronic exposure to ethanol. To assess biological
pathways affected by chronic ethanol treatment, differentially expressed genes
(FDR ≤ 3%) that had a minimum of 10% change in expression level (991 genes)
were analyzed. Once the pathways were identified using this stringent FDR,
genes associated with these pathways were added that were at a relaxed FDR (≤
15%) and with at least 10% fold change. This provided more insight into the
effects of the alcohol on these pathways. Canonical pathways that were
significantly affected by chronic ethanol treatment (p ≤ 0.05) are listed in Table
12.
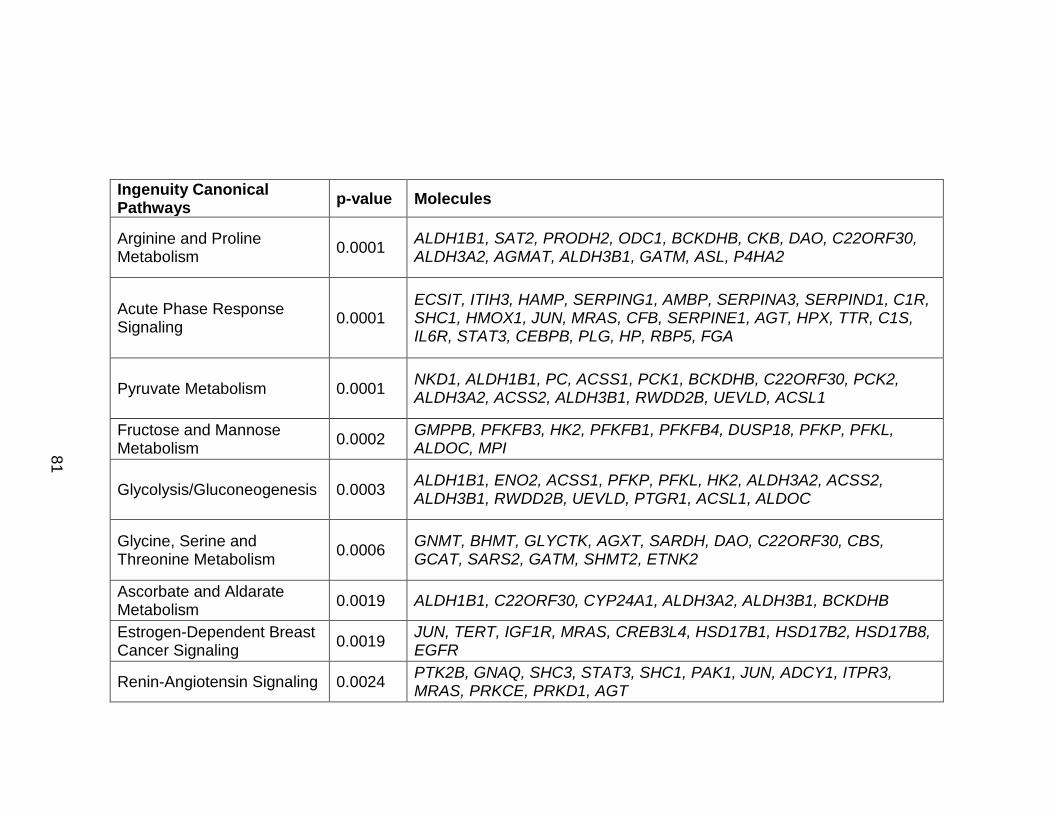
81
Ingenuity Canonical Pathways p-value Molecules
Arginine and Proline Metabolism 0.0001 ALDH1B1, SAT2, PRODH2, ODC1, BCKDHB, CKB, DAO, C22ORF30,
ALDH3A2, AGMAT, ALDH3B1, GATM, ASL, P4HA2
Acute Phase Response Signaling 0.0001
ECSIT, ITIH3, HAMP, SERPING1, AMBP, SERPINA3, SERPIND1, C1R, SHC1, HMOX1, JUN, MRAS, CFB, SERPINE1, AGT, HPX, TTR, C1S, IL6R, STAT3, CEBPB, PLG, HP, RBP5, FGA
Pyruvate Metabolism 0.0001 NKD1, ALDH1B1, PC, ACSS1, PCK1, BCKDHB, C22ORF30, PCK2, ALDH3A2, ACSS2, ALDH3B1, RWDD2B, UEVLD, ACSL1
Fructose and Mannose Metabolism 0.0002 GMPPB, PFKFB3, HK2, PFKFB1, PFKFB4, DUSP18, PFKP, PFKL,
ALDOC, MPI
Glycolysis/Gluconeogenesis 0.0003 ALDH1B1, ENO2, ACSS1, PFKP, PFKL, HK2, ALDH3A2, ACSS2, ALDH3B1, RWDD2B, UEVLD, PTGR1, ACSL1, ALDOC
Glycine, Serine and Threonine Metabolism 0.0006 GNMT, BHMT, GLYCTK, AGXT, SARDH, DAO, C22ORF30, CBS,
GCAT, SARS2, GATM, SHMT2, ETNK2
Ascorbate and Aldarate Metabolism 0.0019 ALDH1B1, C22ORF30, CYP24A1, ALDH3A2, ALDH3B1, BCKDHB
Estrogen-Dependent Breast Cancer Signaling 0.0019 JUN, TERT, IGF1R, MRAS, CREB3L4, HSD17B1, HSD17B2, HSD17B8,
EGFR
Renin-Angiotensin Signaling 0.0024 PTK2B, GNAQ, SHC3, STAT3, SHC1, PAK1, JUN, ADCY1, ITPR3, MRAS, PRKCE, PRKD1, AGT
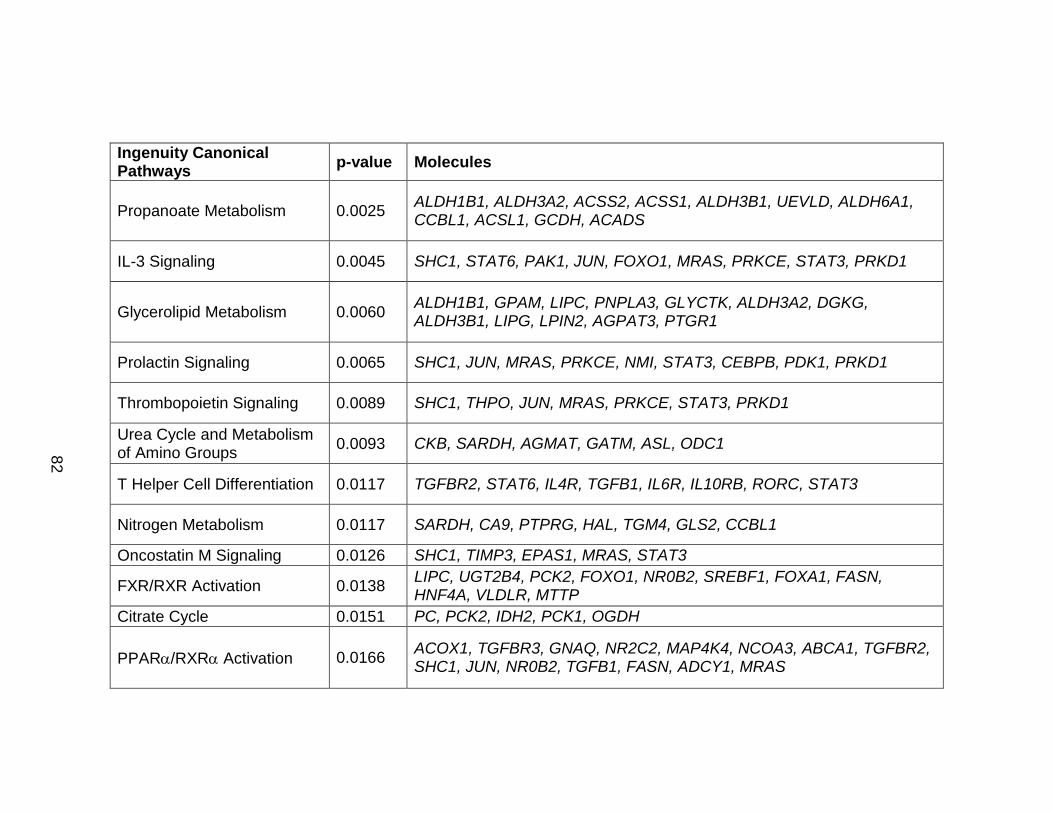
82
Ingenuity Canonical Pathways p-value Molecules
Propanoate Metabolism 0.0025 ALDH1B1, ALDH3A2, ACSS2, ACSS1, ALDH3B1, UEVLD, ALDH6A1, CCBL1, ACSL1, GCDH, ACADS
IL-3 Signaling 0.0045 SHC1, STAT6, PAK1, JUN, FOXO1, MRAS, PRKCE, STAT3, PRKD1
Glycerolipid Metabolism 0.0060 ALDH1B1, GPAM, LIPC, PNPLA3, GLYCTK, ALDH3A2, DGKG, ALDH3B1, LIPG, LPIN2, AGPAT3, PTGR1
Prolactin Signaling 0.0065 SHC1, JUN, MRAS, PRKCE, NMI, STAT3, CEBPB, PDK1, PRKD1
Thrombopoietin Signaling 0.0089 SHC1, THPO, JUN, MRAS, PRKCE, STAT3, PRKD1
Urea Cycle and Metabolism of Amino Groups 0.0093 CKB, SARDH, AGMAT, GATM, ASL, ODC1
T Helper Cell Differentiation 0.0117 TGFBR2, STAT6, IL4R, TGFB1, IL6R, IL10RB, RORC, STAT3
Nitrogen Metabolism 0.0117 SARDH, CA9, PTPRG, HAL, TGM4, GLS2, CCBL1
Oncostatin M Signaling 0.0126 SHC1, TIMP3, EPAS1, MRAS, STAT3
FXR/RXR Activation 0.0138 LIPC, UGT2B4, PCK2, FOXO1, NR0B2, SREBF1, FOXA1, FASN, HNF4A, VLDLR, MTTP
Citrate Cycle 0.0151 PC, PCK2, IDH2, PCK1, OGDH
PPARα/RXRα Activation 0.0166 ACOX1, TGFBR3, GNAQ, NR2C2, MAP4K4, NCOA3, ABCA1, TGFBR2, SHC1, JUN, NR0B2, TGFB1, FASN, ADCY1, MRAS
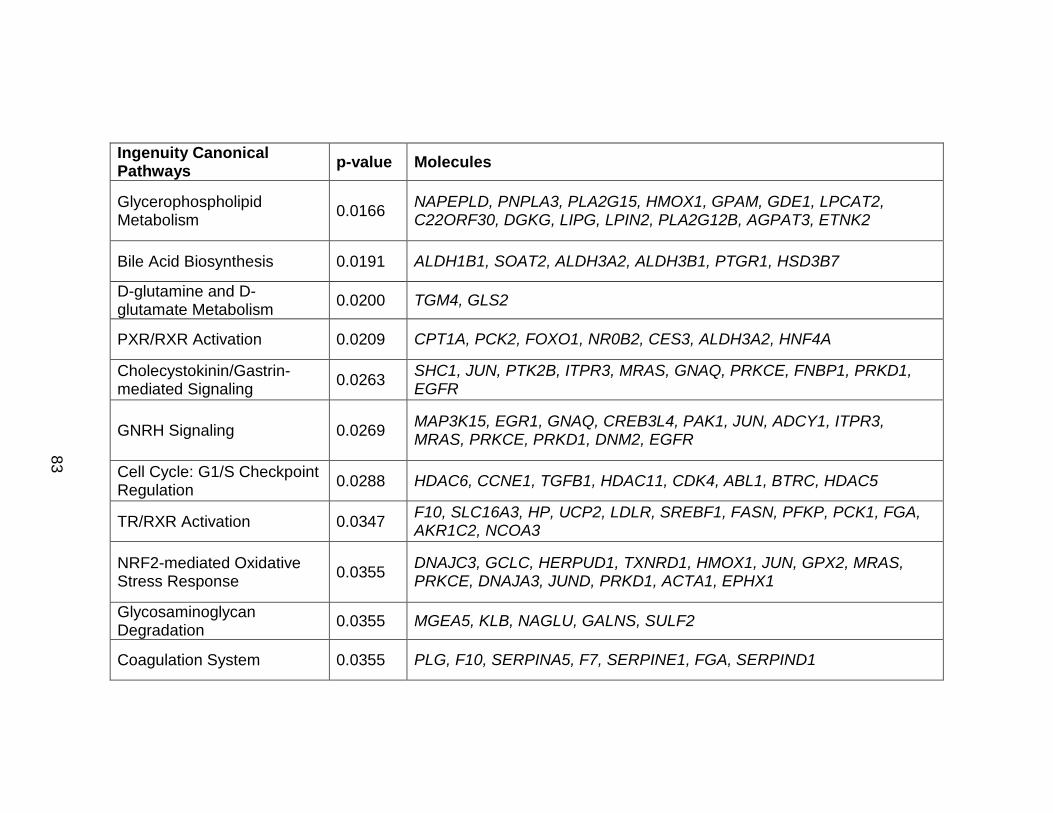
83
Ingenuity Canonical Pathways p-value Molecules
Glycerophospholipid Metabolism 0.0166 NAPEPLD, PNPLA3, PLA2G15, HMOX1, GPAM, GDE1, LPCAT2,
C22ORF30, DGKG, LIPG, LPIN2, PLA2G12B, AGPAT3, ETNK2
Bile Acid Biosynthesis 0.0191 ALDH1B1, SOAT2, ALDH3A2, ALDH3B1, PTGR1, HSD3B7
D-glutamine and D-glutamate Metabolism 0.0200 TGM4, GLS2
PXR/RXR Activation 0.0209 CPT1A, PCK2, FOXO1, NR0B2, CES3, ALDH3A2, HNF4A
Cholecystokinin/Gastrin-mediated Signaling 0.0263 SHC1, JUN, PTK2B, ITPR3, MRAS, GNAQ, PRKCE, FNBP1, PRKD1,
EGFR
GNRH Signaling 0.0269 MAP3K15, EGR1, GNAQ, CREB3L4, PAK1, JUN, ADCY1, ITPR3, MRAS, PRKCE, PRKD1, DNM2, EGFR
Cell Cycle: G1/S Checkpoint Regulation 0.0288 HDAC6, CCNE1, TGFB1, HDAC11, CDK4, ABL1, BTRC, HDAC5
TR/RXR Activation 0.0347 F10, SLC16A3, HP, UCP2, LDLR, SREBF1, FASN, PFKP, PCK1, FGA, AKR1C2, NCOA3
NRF2-mediated Oxidative Stress Response 0.0355 DNAJC3, GCLC, HERPUD1, TXNRD1, HMOX1, JUN, GPX2, MRAS,
PRKCE, DNAJA3, JUND, PRKD1, ACTA1, EPHX1
Glycosaminoglycan Degradation 0.0355 MGEA5, KLB, NAGLU, GALNS, SULF2
Coagulation System 0.0355 PLG, F10, SERPINA5, F7, SERPINE1, FGA, SERPIND1
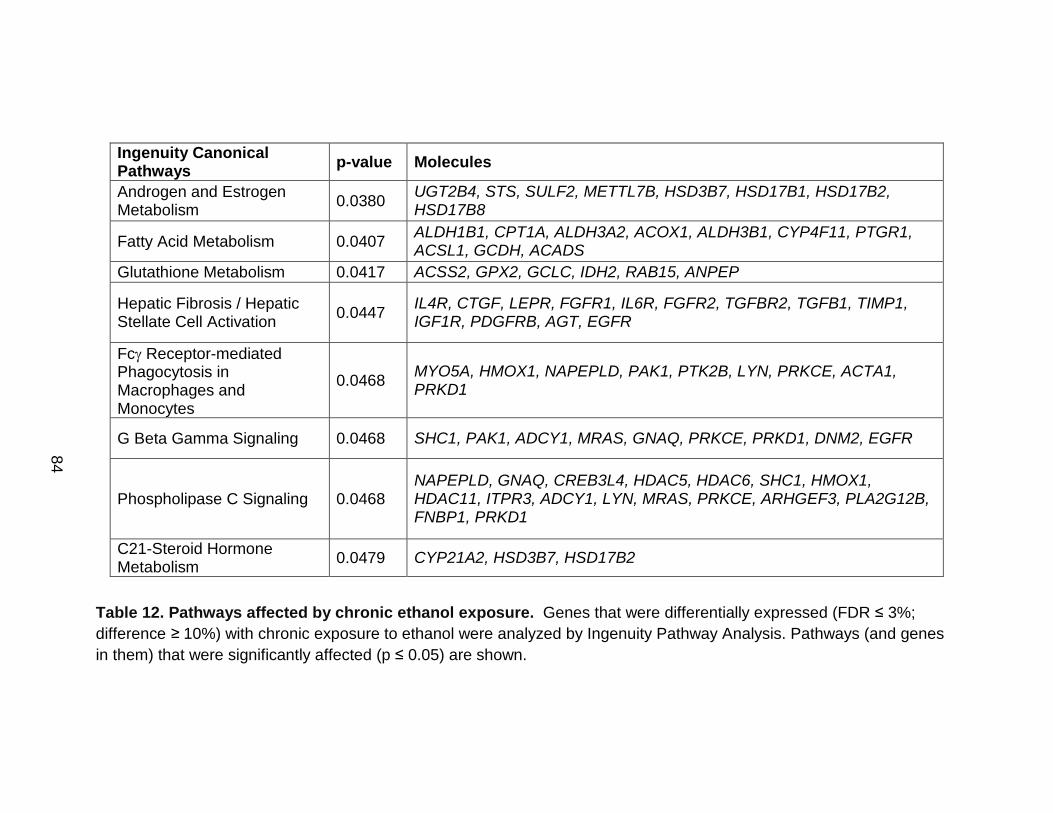
84
Ingenuity Canonical Pathways p-value Molecules
Androgen and Estrogen Metabolism 0.0380 UGT2B4, STS, SULF2, METTL7B, HSD3B7, HSD17B1, HSD17B2,
HSD17B8
Fatty Acid Metabolism 0.0407 ALDH1B1, CPT1A, ALDH3A2, ACOX1, ALDH3B1, CYP4F11, PTGR1, ACSL1, GCDH, ACADS
Glutathione Metabolism 0.0417 ACSS2, GPX2, GCLC, IDH2, RAB15, ANPEP
Hepatic Fibrosis / Hepatic Stellate Cell Activation 0.0447 IL4R, CTGF, LEPR, FGFR1, IL6R, FGFR2, TGFBR2, TGFB1, TIMP1,
IGF1R, PDGFRB, AGT, EGFR
Fcγ Receptor-mediated Phagocytosis in Macrophages and Monocytes
0.0468 MYO5A, HMOX1, NAPEPLD, PAK1, PTK2B, LYN, PRKCE, ACTA1, PRKD1
G Beta Gamma Signaling 0.0468 SHC1, PAK1, ADCY1, MRAS, GNAQ, PRKCE, PRKD1, DNM2, EGFR
Phospholipase C Signaling 0.0468 NAPEPLD, GNAQ, CREB3L4, HDAC5, HDAC6, SHC1, HMOX1, HDAC11, ITPR3, ADCY1, LYN, MRAS, PRKCE, ARHGEF3, PLA2G12B, FNBP1, PRKD1
C21-Steroid Hormone Metabolism 0.0479 CYP21A2, HSD3B7, HSD17B2
Table 12. Pathways affected by chronic ethanol exposure. Genes that were differentially expressed (FDR ≤ 3%; difference ≥ 10%) with chronic exposure to ethanol were analyzed by Ingenuity Pathway Analysis. Pathways (and genes in them) that were significantly affected (p ≤ 0.05) are shown.

85
An overlap between significant pathways was observed. For example,
most of the genes in the Pyruvate metabolism pathways were also present in
Glycolysis/ Gluconeogenesis pathway. Similarly, many signaling molecules like
SHC1, GNAQ, ADCY1 were present in multiple pathways. Due of this overlap
between pathways, we studied pathways with similar functions together.
Therefore, pathways like glycolysis/ gluconeogenesis, citrate cycle, fructose and
mannose metabolism were considered under effects of alcohol on carbohydrate
metabolism. We also focused our analysis on liver associated functions like
acute phase response pathways, or on pathways that are known to play a role in
alcohol induced liver injury like the oxidative stress response.
Alcohol affected many genes in stress response pathways. Acute phase
proteins like fibrinogen (FGA) and hemeoxygenase1 (HMOX1), were changed by
1.2 and 1.3-fold, respectively. Multiple genes associated with the Nrf2-mediated
oxidative stress response were also affected by chronic ethanol treatment. Nrf2-
regulated proteins including glutamate-cysteine ligase, catalytic subunit (GCLC),
glutathione peroxidase 2 (GPX2), thioredoxin reductase (TXNRD1) were
upregulated by at least 20%. Superoxide dismutases were also upregulated, but
modestly (1.13-fold; Table 13).
Several genes involved in hepatic fibrosis were affected by ethanol.
Fibroblast growth factor receptor family members FGFR1 and FGFR2 were
upregulated by 1.49- and 1.53-fold, respectively. Transforming growth factor B
(TGFB1) and its receptor TGFBR2 were increased by 23% and 12%
respectively. Other receptors that were affected include insulin-like growth factor

86
receptor (IGFR1, 1.29-fold), epidermal growth factor receptor (EGFR, 1.12-fold),
platelet derived growth factor beta polypeptide (PDGFRB,-1.3-fold) and
Interleukin-4 receptor (IL-4R, -1.19-fold). Alcohol also had an effect on cell cycle
genes. Cyclin D1 (CCND1), Cyclin E1 (CCNE1) increased in expression. Ethanol
had opposing effects on cyclin dependent kinase 4 and 6 (CDK4 and CDK6);
CDK4 decreased in expression while CDK6 increased in expression.
Chronic ethanol treatment affected genes encoding proteins involved in
cellular metabolism (Table 13). Several genes involved in the metabolism of
amino acids were affected by ethanol. Genes encoding urea cycle enzymes
arginase (ARG2) and arginosuccinate lyase (ASL) were changed by -1.17 and -
1.15-fold. Prolyl 4-hydroxylase, alpha polypeptide II (P4HA2), an enzyme
involved in the formation of 4-hydroxyproline increased in expression whereas
pyrroline-5-carboxylate reductase (PRODH2) decreased in expression. Multiple
genes in the metabolism small amino acids (glycine, serine, threonine) were also
affected. Mitochondrial serine and threonine t-RNA synthetases (SARS2,
TARS2) decreased in expression with ethanol.
The expression of many genes related to carbohydrate metabolism
decreased upon ethanol treatment. Transcript level of phosphofructokinase
(PFKL), which catalyzes the irreversible conversion of fructose-6-phosphate to
fructose-1, 6-bisphosphate in the glycolytic pathway, was decreased by 1.25 fold.
Pyruvate carboxylase (PC) enzyme that plays a crucial role in gluconeogenesis
and lipogenesis was also decreased by 1.22-fold. Enzymes involved in fructose
metabolism were also affected by ethanol. Liver isozyme 6-phosphofructo-2-
87
kinase/fructose-2,6-biphosphatase 1 (PFKFB1) which catalyzes both the
synthesis and degradation of fructose-2,6-biphosphate increased by 1.41-fold
with ethanol.
Glycerolipid metabolism, glycerophospholipid metabolism and fatty acid
metabolism pathways were considered as effects of alcohol on lipid metabolism.
Key fatty acid oxidation enzymes carnitine palmitoyltransferase 1A (CPT1A) and
acyl-Coenzyme A dehydrogenase (ACADS) were decreased by 50% and 24%,
respectively. Most of the enzymes involved in glycerolipid metabolism were
upregulated by ethanol. Mitochondrial glycerol-3-phosphate acyltransferase
(GPAM) and 1-acylglycerol-3-phosphate O-acyltransferase 3 (AGPAT3)
increased in expression by 1.3- and 1.5-fold, respectively. Choline kinase alpha
(CHKA) and ethanolamine kinases (ETNK1, ETNK2) were also upregulated.
Genes regulated by nuclear receptors, including farnesoid X receptor
(FXR) and retinoid X receptor (RXR), were affected by chronic ethanol treatment.
Nuclear receptor subfamily 0, group B, member 2 (NROB2) was downregulated
by 1.3-fold, whereas very low density lipoprotein receptor (VLDLR), and ATP
binding cassette members (ABCB1 and ABCB4) were upregulated by 1.4 and
1.16-fold respectively.
In addition to identifying pathways that were affected by ethanol, changes
in the expression of genes of interest, including those involved in alcohol
metabolism, transcription factors, chromatin regulation or those that have been
associated with the risk for alcoholism, were also examined. Of genes involved in
alcohol metabolism, three aldehyde dehydrogenase genes were affected by
88
ethanol. The expression of ALDH3B1 and ALDH2 was decreased by 1.32-fold
and 1.12-fold, respectively, whereas ALDH1B1 increased by 1.13-fold. Histone
acetyltransferase and deacetylases, MYST4 and HDAC11 were also affected by
ethanol.

89
Transcript cluster ID Gene Gene Description
Gene Fold-Change (E/C)
Differential gene expression FDR
Differential Alternative splicing FDR
Amino acid metabolism 2623441 ACY1 aminoacylase 1 -1.19 0.03 0.07 2397732 AGMAT agmatine ureohydrolase (agmatinase) -1.15 0.00 0.65 2535976 AGXT alanine-glyoxylate aminotransferase -1.19 0.00 0.84 3638607 ANPEP alanyl (membrane) aminopeptidase 1.17 0.01 0.04 3722182 AOC2 amine oxidase, copper containing 2 (retina-specific) 1.27 0.09 0.76 3541383 ARG2 arginase, type II -1.17 0.06 0.87 3005363 ASL argininosuccinate lyase -1.15 0.00 0.38
2914820 BCKDHB branched chain keto acid dehydrogenase E1, beta polypeptide -1.20 0.00 1.00
2817251 BHMT betaine-homocysteine methyltransferase 1.46 0.00 0.98 2817212 BHMT2 betaine-homocysteine methyltransferase 2 1.23 0.00 0.16 3958005 C22orf30 chromosome 22 open reading frame 30 1.19 0.03 0.60 3933923 CBS cystathionine-beta-synthase -1.12 0.00 0.83 3476330 CCDC92 coiled-coil domain containing 92 1.80 0.06 0.72 3580769 CKB creatine kinase, brain -1.42 0.00 0.75 3430868 DAO D-amino-acid oxidase 1.20 0.00 0.81 2864118 DMGDH dimethylglycine dehydrogenase 1.14 0.11 1.00 3845175 GAMT guanidinoacetate N-methyltransferase -1.11 0.06 0.63
3622386 GATM glycine amidinotransferase (L-arginine:glycine amidinotransferase) -1.40 0.00 0.64
3945014 GCAT glycine C-acetyltransferase (2-amino-3-ketobutyrate coenzyme A ligase) -1.40 0.00 0.93
3955185 GGT5 gamma-glutamyltransferase 5 -1.28 0.12 0.92

90
Transcript cluster ID Gene Gene Description
Gene Fold-Change (E/C)
Differential gene expression FDR
Differential Alternative splicing FDR
3903598 GGT7 gamma-glutamyltransferase 7 1.11 0.04 0.22 3457891 GLS2 glutaminase 2 (liver, mitochondrial) -1.14 0.00 0.93 2623611 GLYCTK glycerate kinase -1.23 0.00 0.95 2907513 GNMT glycine N-methyltransferase -1.56 0.00 0.64 3466687 HAL histidine ammonia-lyase -1.57 0.00 0.99 3638760 IDH2 isocitrate dehydrogenase 2 (NADP+), mitochondrial -1.27 0.00 0.68 2720145 LAP3 leucine aminopeptidase 3 1.12 0.13 0.14 3621140 LCMT2 leucine carboxyl methyltransferase 2 1.11 0.11 0.65 2956438 MUT methylmalonyl Coenzyme A mutase -1.22 0.06 0.96 3031711 NOS3 nitric oxide synthase 3 (endothelial cell) -1.17 0.06 0.87 2540157 ODC1 ornithine decarboxylase 1 1.15 0.00 0.63 3158060 OPLAH 5-oxoprolinase (ATP-hydrolysing) -1.14 0.09 0.91 2875193 P4HA2 prolyl 4-hydroxylase, alpha polypeptide II 1.17 0.00 0.25 3860003 PRODH2 proline dehydrogenase (oxidase) 2 -1.23 0.00 0.38 3175971 PSAT1 phosphoserine aminotransferase 1 1.22 0.06 0.27 2626802 PTPRG protein tyrosine phosphatase, receptor type, G 1.20 0.01 0.11 2458607 PYCR2 pyrroline-5-carboxylate reductase family, member 2 -1.15 0.06 0.85 3157647 PYCRL pyrroline-5-carboxylate reductase-like -1.22 0.06 0.74 3228813 SARDH sarcosine dehydrogenase -1.15 0.00 0.82 3861738 SARS2 seryl-tRNA synthetase 2, mitochondrial -1.16 0.00 0.95
3743883 SAT2 spermidine/spermine N1-acetyltransferase family member 2 -1.19 0.01 0.51 3418007 SHMT2 serine hydroxymethyltransferase 2 (mitochondrial) -1.12 0.00 0.95

91
Transcript cluster ID Gene Gene Description
Gene Fold-Change (E/C)
Differential gene expression FDR
Differential Alternative splicing FDR
2786322 SLC7A11 solute carrier family 7, (cationic amino acid transporter, y+ system) member 11 1.54 0.00 0.12
2358320 TARS2 threonyl-tRNA synthetase 2, mitochondrial (putative) -1.12 0.06 0.94 2620348 TGM4 transglutaminase 4 (prostate) 1.47 0.01 0.00 Carbohydrate metabolism 3218077 ALDOB aldolase B, fructose-bisphosphate -1.24 0.04 0.99 3750767 ALDOC aldolase C, fructose-bisphosphate -1.29 0.00 0.91 3458700 B4GALNT1 beta-1,4-N-acetyl-galactosaminyl transferase 1 1.36 0.01 0.11 3957486 DUSP18 dual specificity phosphatase 18 1.33 0.02 0.42 3403015 ENO2 enolase 2 (gamma, neuronal) -1.30 0.00 0.92 2342176 FPGT fucose-1-phosphate guanylyltransferase 1.18 0.13 0.15 3667241 FUK fucokinase -1.19 0.04 0.84 3540552 FUT8 fucosyltransferase 8 (alpha (1,6) fucosyltransferase) 1.43 0.00 0.27 3770923 GALK1 galactokinase 1 -1.16 0.06 0.87 3704513 GALNS galactosamine (N-acetyl)-6-sulfate sulfatase 1.21 0.01 0.00
3784602 GALNT1 UDP-N-acetyl-alpha-D-galactosamine:polypeptide N-acetylgalactosaminyltransferase 1 (GalNAc-T1) 1.31 0.02 0.02
2684187 GBE1 glucan (1,4-alpha-), branching enzyme 1 -1.21 0.02 0.97 3596147 GCNT3 glucosaminyl (N-acetyl) transferase 3, mucin type 1.39 0.00 0.92 3972929 GK glycerol kinase -1.31 0.04 0.35 2674653 GMPPB GDP-mannose pyrophosphorylase B -1.25 0.02 0.98 2691014 GSK3B glycogen synthase kinase 3 beta 1.14 0.13 0.98 3867538 GYS1 glycogen synthase 1 (muscle) -1.16 0.00 0.00 2489545 HK2 hexokinase 2 -1.33 0.00 0.82

92
Transcript cluster ID Gene Gene Description
Gene Fold-Change (E/C)
Differential gene expression FDR
Differential Alternative splicing FDR
3601955 MPI mannose phosphate isomerase -1.26 0.00 0.64
2999948 OGDH oxoglutarate (alpha-ketoglutarate) dehydrogenase (lipoamide) -1.24 0.00 0.67
3378541 PC pyruvate carboxylase -1.22 0.00 0.80 3890640 PCK1 phosphoenolpyruvate carboxykinase 1 (soluble) -1.35 0.00 0.94 3529508 PCK2 phosphoenolpyruvate carboxykinase 2 (mitochondrial) -1.13 0.01 0.19 2515707 PDK1 pyruvate dehydrogenase kinase, isozyme 1 -1.19 0.02 0.10
3667093 PDPR pyruvate dehydrogenase phosphatase regulatory subunit 1.19 0.00 0.75 4009811 PFKFB1 6-phosphofructo-2-kinase/fructose-2,6-biphosphatase 1 1.41 0.01 0.57 2377094 PFKFB2 6-phosphofructo-2-kinase/fructose-2,6-biphosphatase 2 -1.15 0.05 0.56 3233605 PFKFB3 6-phosphofructo-2-kinase/fructose-2,6-biphosphatase 3 -1.29 0.00 0.86 2673312 PFKFB4 6-phosphofructo-2-kinase/fructose-2,6-biphosphatase 4 -1.18 0.00 0.94 3923632 PFKL phosphofructokinase, liver -1.25 0.01 0.27 3232349 PFKP phosphofructokinase, platelet -1.16 0.01 0.88 3928040 RWDD2B RWD domain containing 2B -1.32 0.00 0.99
2798538 SDHA succinate dehydrogenase complex, subunit A, flavoprotein (Fp) -1.10 0.14 0.53
3365487 UEVLD UEV and lactate/malate dehyrogenase domains 1.13 0.02 0.52 Lipid metabolism
3434594 ACADS acyl-Coenzyme A dehydrogenase, C-2 to C-3 short chain -1.24 0.01 0.15 3543673 ACOT2 acyl-CoA thioesterase 2 -1.21 0.04 0.13 3771215 ACOX1 acyl-Coenzyme A oxidase 1, palmitoyl -1.25 0.00 1.00 2796553 ACSL1 acyl-CoA synthetase long-chain family member 1 1.42 0.00 0.00

93
Transcript cluster ID Gene Gene Description
Gene Fold-Change (E/C)
Differential gene expression FDR
Differential Alternative splicing FDR
3901696 ACSS1 acyl-CoA synthetase short-chain family member 1 1.17 0.03 0.00 3883064 ACSS2 acyl-CoA synthetase short-chain family member 2 -1.18 0.00 0.92 3923426 AGPAT3 1-acylglycerol-3-phosphate O-acyltransferase 3 1.49 0.00 0.52 2734047 AGPAT9 1-acylglycerol-3-phosphate O-acyltransferase 9 1.28 0.06 0.94
3274758 AKR1C2
aldo-keto reductase family 1, member C2 (dihydrodiol dehydrogenase 2; bile acid binding protein; 3-alpha hydroxysteroid dehydrogenase, ty 1.25 0.00 0.51
3714068 ALDH3A2 aldehyde dehydrogenase 3 family, member A2 1.19 0.01 0.29 2898499 ALDH5A1 aldehyde dehydrogenase 5 family, member A1 1.14 0.06 0.61 3457794 APOF apolipoprotein F -1.26 0.03 0.66 3379326 CHKA choline kinase alpha 1.13 0.06 0.98 3379644 CPT1A carnitine palmitoyltransferase 1A (liver) -1.51 0.00 0.67 3833992 CYP2S1 cytochrome P450, family 2, subfamily S, polypeptide 1 -1.15 0.11 0.22 3015040 CYP3A43 cytochrome P450, family 3, subfamily A, polypeptide 43 -1.18 0.13 0.95
3853658 CYP4F11 cytochrome P450, family 4, subfamily F, polypeptide 11 1.31 0.00 0.16 3823340 CYP4F12 cytochrome P450, family 4, subfamily F, polypeptide 12 1.18 0.10 0.04 2709235 DGKG diacylglycerol kinase, gamma 90kDa 1.23 0.00 0.33
2708720 EHHADH enoyl-Coenzyme A, hydratase/3-hydroxyacyl Coenzyme A dehydrogenase -1.22 0.03 0.97
2781813 ELOVL6 ELOVL family member 6, elongation of long chain fatty acids (FEN1/Elo2, SUR4/Elo3-like, yeast) 1.12 0.09 0.71
3408018 ETNK1 ethanolamine kinase 1 1.11 0.11 0.38 2451870 ETNK2 ethanolamine kinase 2 1.31 0.00 0.00 2334740 FAAH fatty acid amide hydrolase -1.17 0.06 0.86

94
Transcript cluster ID Gene Gene Description
Gene Fold-Change (E/C)
Differential gene expression FDR
Differential Alternative splicing FDR
3774635 FASN fatty acid synthase -1.10 0.03 0.01 3821995 GCDH glutaryl-Coenzyme A dehydrogenase -1.23 0.01 0.65 3683276 GDE1 glycerophosphodiester phosphodiesterase 1 1.34 0.00 0.56
3729014 GDPD1 glycerophosphodiester phosphodiesterase domain containing 1 1.40 0.08 0.99
3306984 GPAM glycerol-3-phosphate acyltransferase, mitochondrial 1.31 0.01 0.05
2945518 GPLD1 glycosylphosphatidylinositol specific phospholipase D1 1.19 0.03 0.01 3821015 LDLR low density lipoprotein receptor -1.20 0.00 0.57 3299585 LIPA lipase A, lysosomal acid, cholesterol esterase 1.23 0.04 0.87 3595691 LIPC lipase, hepatic 1.16 0.03 0.67 3787855 LIPG lipase, endothelial 1.53 0.00 0.01 2708855 LIPH lipase, member H 2.26 0.00 0.09 3661718 LPCAT2 lysophosphatidylcholine acyltransferase 2 1.64 0.02 0.77 2469910 LPIN1 lipin 1 1.13 0.03 0.35 3796335 LPIN2 lipin 2 -1.13 0.01 0.85 2737257 MTTP microsomal triglyceride transfer protein 1.23 0.02 0.78 3962219 NAGA N-acetylgalactosaminidase, alpha- 1.12 0.06 0.66 3065480 NAPEPLD N-acyl phosphatidylethanolamine phospholipase D 1.32 0.02 0.33 3294142 PLA2G12B phospholipase A2, group XIIB 1.28 0.00 0.71 3666124 PLA2G15 phospholipase A2, group XV 1.11 0.02 0.83 3947952 PNPLA3 patatin-like phospholipase domain containing 3 1.18 0.02 0.10
3434142 PRKAB1 protein kinase, AMP-activated, beta 1 non-catalytic subunit 1.12 0.07 0.90
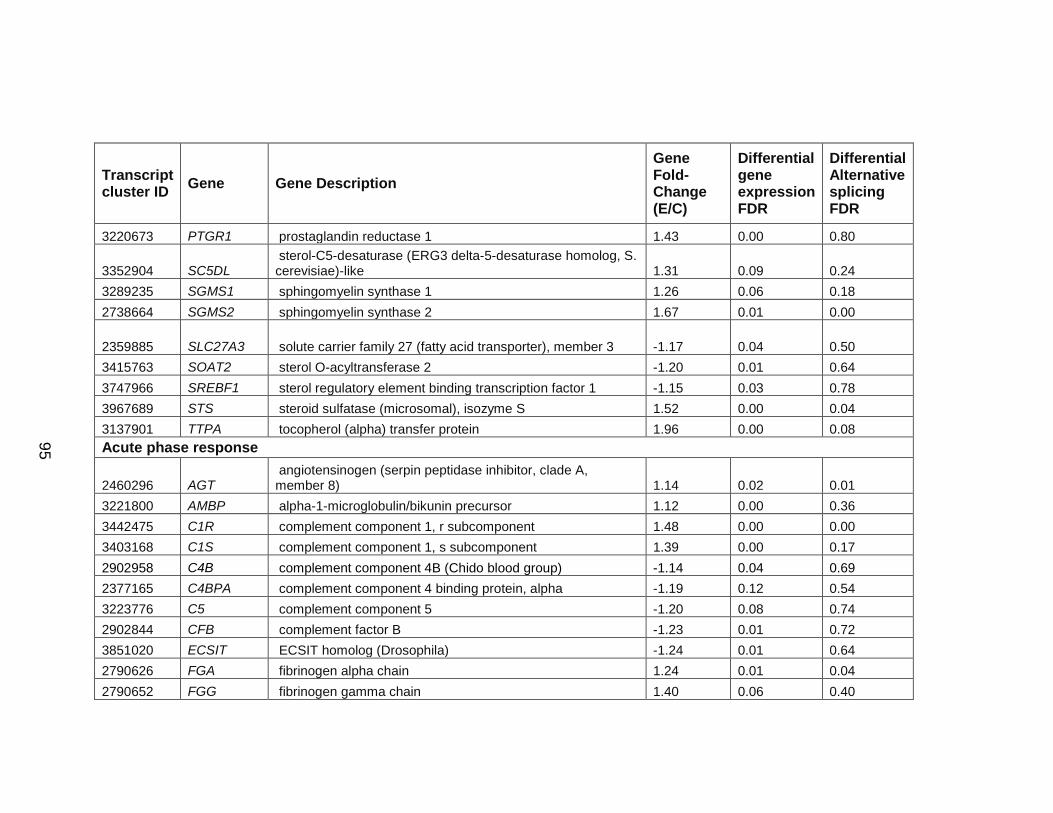
95
Transcript cluster ID Gene Gene Description
Gene Fold-Change (E/C)
Differential gene expression FDR
Differential Alternative splicing FDR
3220673 PTGR1 prostaglandin reductase 1 1.43 0.00 0.80
3352904 SC5DL sterol-C5-desaturase (ERG3 delta-5-desaturase homolog, S. cerevisiae)-like 1.31 0.09 0.24
3289235 SGMS1 sphingomyelin synthase 1 1.26 0.06 0.18 2738664 SGMS2 sphingomyelin synthase 2 1.67 0.01 0.00
2359885 SLC27A3 solute carrier family 27 (fatty acid transporter), member 3 -1.17 0.04 0.50 3415763 SOAT2 sterol O-acyltransferase 2 -1.20 0.01 0.64 3747966 SREBF1 sterol regulatory element binding transcription factor 1 -1.15 0.03 0.78 3967689 STS steroid sulfatase (microsomal), isozyme S 1.52 0.00 0.04 3137901 TTPA tocopherol (alpha) transfer protein 1.96 0.00 0.08 Acute phase response
2460296 AGT angiotensinogen (serpin peptidase inhibitor, clade A, member 8) 1.14 0.02 0.01
3221800 AMBP alpha-1-microglobulin/bikunin precursor 1.12 0.00 0.36 3442475 C1R complement component 1, r subcomponent 1.48 0.00 0.00 3403168 C1S complement component 1, s subcomponent 1.39 0.00 0.17 2902958 C4B complement component 4B (Chido blood group) -1.14 0.04 0.69 2377165 C4BPA complement component 4 binding protein, alpha -1.19 0.12 0.54 3223776 C5 complement component 5 -1.20 0.08 0.74 2902844 CFB complement factor B -1.23 0.01 0.72 3851020 ECSIT ECSIT homolog (Drosophila) -1.24 0.01 0.64 2790626 FGA fibrinogen alpha chain 1.24 0.01 0.04 2790652 FGG fibrinogen gamma chain 1.40 0.06 0.40

96
Transcript cluster ID Gene Gene Description
Gene Fold-Change (E/C)
Differential gene expression FDR
Differential Alternative splicing FDR
3838094 FTL ferritin, light polypeptide 1.29 0.11 0.63 3830306 HAMP hepcidin antimicrobial peptide -1.41 0.01 0.99 3667858 HP haptoglobin -1.28 0.02 0.82 3360874 HPX hemopexin -1.35 0.01 0.92 3000503 IGFBP1 insulin-like growth factor binding protein 1 -1.19 0.03 0.25
3996551 IKBKG inhibitor of kappa light polypeptide gene enhancer in B-cells, kinase gamma 1.22 0.04 0.10
2496962 IL1R1 interleukin 1 receptor, type I 1.19 0.12 0.82 2657831 IL1RAP interleukin 1 receptor accessory protein -1.14 0.08 0.94 2360257 IL6R interleukin 6 receptor -1.19 0.01 0.86
2857416 IL6ST interleukin 6 signal transducer (gp130, oncostatin M receptor) 1.20 0.13 0.25
4027009 IRAK1 interleukin-1 receptor-associated kinase 1 -1.12 0.04 0.71 2624178 ITIH3 inter-alpha (globulin) inhibitor H3 -1.42 0.00 0.84 3160895 JAK2 Janus kinase 2 (a protein tyrosine kinase) 1.43 0.04 0.86 3733065 MAP2K6 mitogen-activated protein kinase kinase 6 1.29 0.08 0.57 2904946 MAPK13 mitogen-activated protein kinase 13 -1.15 0.08 0.92
3832760 NFKBIB nuclear factor of kappa light polypeptide gene enhancer in B-cells inhibitor, beta -1.11 0.10 0.80
2934682 PLG plasminogen 1.46 0.01 0.11 3442579 RBP5 retinol binding protein 5, cellular -1.24 0.02 0.64
2892341 RIPK1 receptor (TNFRSF)-interacting serine-threonine kinase 1 1.18 0.13 0.51
3549757 SERPINA3 serpin peptidase inhibitor, clade A (alpha-1 antiproteinase, antitrypsin), member 3 1.23 0.00 0.41

97
Transcript cluster ID Gene Gene Description
Gene Fold-Change (E/C)
Differential gene expression FDR
Differential Alternative splicing FDR
2444529 SERPINC1 serpin peptidase inhibitor, clade C (antithrombin), member 1 1.23 0.06 0.91
3937743 SERPIND1 serpin peptidase inhibitor, clade D (heparin cofactor), member 1 1.10 0.01 0.66
3016148 SERPINE1 serpin peptidase inhibitor, clade E (nexin, plasminogen activator inhibitor type 1), member 1 -1.30 0.00 0.23
3331355 SERPING1 serpin peptidase inhibitor, clade G (C1 inhibitor), member 1 1.41 0.01 0.03
3757840 STAT3 signal transducer and activator of transcription 3 (acute-phase response factor) 1.10 0.01 0.32
3783565 TTR transthyretin 1.12 0.01 0.82 Oxidative stress response 3646164 DNAJA3 DnaJ (Hsp40) homolog, subfamily A, member 3 -1.11 0.01 0.62 2656569 DNAJB11 DnaJ (Hsp40) homolog, subfamily B, member 11 1.18 0.12 0.94 2343289 DNAJB4 DnaJ (Hsp40) homolog, subfamily B, member 4 1.25 0.13 0.66 3018866 DNAJB9 DnaJ (Hsp40) homolog, subfamily B, member 9 1.27 0.06 0.25 3487432 DNAJC15 DnaJ (Hsp40) homolog, subfamily C, member 15 1.17 0.12 0.11 3497270 DNAJC3 DnaJ (Hsp40) homolog, subfamily C, member 3 1.38 0.01 0.95 2340350 DNAJC6 DnaJ (Hsp40) homolog, subfamily C, member 6 1.14 0.06 0.87 2382970 EPHX1 epoxide hydrolase 1, microsomal (xenobiotic) 1.29 0.00 0.33 2957700 GCLC glutamate-cysteine ligase, catalytic subunit 1.21 0.03 0.70 3568603 GPX2 glutathione peroxidase 2 (gastrointestinal) 1.24 0.00 0.26 2957462 GSTA4 glutathione S-transferase alpha 4 1.19 0.11 0.60
3662387 HERPUD1 homocysteine-inducible, endoplasmic reticulum stress-inducible, ubiquitin-like domain member 1 1.14 0.02 0.03
3944129 HMOX1 heme oxygenase (decycling) 1 1.34 0.00 0.83

98
Transcript cluster ID Gene Gene Description
Gene Fold-Change (E/C)
Differential gene expression FDR
Differential Alternative splicing FDR
3696666 NQO1 NAD(P)H dehydrogenase, quinone 1 1.10 0.07 0.17 3917851 SOD1 superoxide dismutase 1, soluble 1.13 0.13 0.27 3429460 TXNRD1 thioredoxin reductase 1 1.22 0.01 0.59 3952880 TXNRD2 thioredoxin reductase 2 -1.19 0.00 0.77 Hepatic fibrosis or hepatic stellate activation 2863964 ARSB arylsulfatase B 1.14 0.09 0.44 2351063 CSF1 colony stimulating factor 1 (macrophage) 1.10 0.11 0.26 2974330 CTGF connective tissue growth factor -1.22 0.02 0.15
3002640 EGFR epidermal growth factor receptor (erythroblastic leukemia viral (v-erb-b) oncogene homolog, avian) 1.12 0.02 0.17
3229338 FCN1 ficolin (collagen/fibrinogen domain containing) 1 -1.20 0.04 0.79 3132016 FGFR1 fibroblast growth factor receptor 1 1.49 0.00 0.05 3310041 FGFR2 fibroblast growth factor receptor 2 1.53 0.00 0.00 3704513 GALNS galactosamine (N-acetyl)-6-sulfate sulfatase 1.21 0.01 0.00 2835792 GM2A GM2 ganglioside activator 1.10 0.09 0.10 2675120 HYAL3 hyaluronoglucosaminidase 3 1.13 0.08 0.12 4025339 IDS iduronate 2-sulfatase 1.26 0.03 0.01 3918574 IFNAR1 interferon (alpha, beta and omega) receptor 1 1.25 0.08 0.02 3918447 IFNAR2 interferon (alpha, beta and omega) receptor 2 1.32 0.05 0.35 3610804 IGF1R insulin-like growth factor 1 receptor 1.13 0.01 0.89 3654175 IL4R interleukin 4 receptor -1.19 0.00 0.99 2724308 KLB klotho beta 1.20 0.01 0.50 2340433 LEPR leptin receptor 1.40 0.03 0.00 3304012 MGEA5 meningioma expressed antigen 5 (hyaluronidase) 1.23 0.02 0.21

99
Transcript cluster ID Gene Gene Description
Gene Fold-Change (E/C)
Differential gene expression FDR
Differential Alternative splicing FDR
3388830 MMP3 matrix metallopeptidase 3 (stromelysin 1, progelatinase) -1.30 0.11 0.96 3962219 NAGA N-acetylgalactosaminidase, alpha- 1.12 0.06 0.66 3721795 NAGLU N-acetylglucosaminidase, alpha- -1.12 0.01 0.65 2791197 PDGFC platelet derived growth factor C 1.18 0.11 0.63
2881239 PDGFRB platelet-derived growth factor receptor, beta polypeptide -1.31 0.00 0.99 3087703 PDGFRL platelet-derived growth factor receptor-like 1.15 0.11 0.62 3773340 SGSH N-sulfoglucosamine sulfohydrolase -1.10 0.05 0.73 3908358 SULF2 sulfatase 2 1.51 0.00 0.01 3863021 TGFB1 transforming growth factor, beta 1 1.23 0.00 0.28 2615360 TGFBR2 transforming growth factor, beta receptor II (70/80kDa) 1.12 0.02 0.97 2422722 TGFBR3 transforming growth factor, beta receptor III 1.31 0.00 0.80 3976341 TIMP1 TIMP metallopeptidase inhibitor 1 1.24 0.01 0.18 3772661 TIMP2 TIMP metallopeptidase inhibitor 2 1.28 0.05 0.30 3943504 TIMP3 TIMP metallopeptidase inhibitor 3 1.25 0.00 0.14 Cell cycle or Apoptosis 3191724 ABL1 c-abl oncogene 1, receptor tyrosine kinase 1.12 0.00 0.59 3838067 BAX BCL2-associated X protein -1.13 0.15 0.17 3261165 BTRC beta-transducin repeat containing 1.12 0.01 0.44 3338192 CCND1 cyclin D1 1.12 0.06 0.21 3828112 CCNE1 cyclin E1 1.31 0.02 0.06 3145107 CCNE2 cyclin E2 1.28 0.08 0.50 3551303 CCNK cyclin K 1.24 0.07 0.68 3458783 CDK4 cyclin-dependent kinase 4 -1.14 0.03 0.49

100
Transcript cluster ID Gene Gene Description
Gene Fold-Change (E/C)
Differential gene expression FDR
Differential Alternative splicing FDR
3061319 CDK6 cyclin-dependent kinase 6 1.15 0.14 0.13 2905169 CDKN1A cyclin-dependent kinase inhibitor 1A (p21, Cip1) 1.10 0.07 0.37 3042001 CYCS cytochrome c, somatic -1.26 0.09 1.00 2897576 E2F3 E2F transcription factor 3 1.19 0.07 0.23 3257098 FAS Fas (TNF receptor superfamily, member 6) 1.36 0.03 0.19 3421300 MDM2 Mdm2 p53 binding protein homolog (mouse) 1.19 0.06 0.09 Nuclear receptor transcribed genes 3218528 ABCA1 ATP-binding cassette, sub-family A (ABC1), member 1 1.21 0.00 0.04
3060182 ABCB1 ATP-binding cassette, sub-family B (MDR/TAP), member 1 1.17 0.14 1.00 3060117 ABCB4 ATP-binding cassette, sub-family B (MDR/TAP), member 4 1.17 0.08 0.06
3475879 ABCB9 ATP-binding cassette, sub-family B (MDR/TAP), member 9 1.16 0.11 0.08 3665029 CES3 carboxylesterase 3 -1.17 0.02 0.56
3910429 CYP24A1 cytochrome P450, family 24, subfamily A, polypeptide 1 -1.30 0.00 0.60 3502437 F10 coagulation factor X -1.20 0.02 0.64 2473149 NCOA1 nuclear receptor coactivator 1 1.12 0.11 0.72 3887635 NCOA3 nuclear receptor coactivator 3 1.24 0.00 0.06 2402883 NR0B2 nuclear receptor subfamily 0, group B, member 2 -1.29 0.01 0.89 2659393 OSTalpha organic solute transporter alpha -1.32 0.00 0.45
3738629 SLC16A3 solute carrier family 16, member 3 (monocarboxylic acid transporter 4) -1.30 0.00 0.22
2907887 SLC22A7 solute carrier family 22 (organic anion transporter), member 7 1.14 0.10 0.38

101
Transcript cluster ID Gene Gene Description
Gene Fold-Change (E/C)
Differential gene expression FDR
Differential Alternative splicing FDR
3866785 SULT2A1 sulfotransferase family, cytosolic, 2A, dehydroepiandrosterone (DHEA)-preferring, member 1 -1.17 0.10 0.87
3381817 UCP2 uncoupling protein 2 (mitochondrial, proton carrier) -1.34 0.00 0.97 2772341 UGT2B4 UDP glucuronosyltransferase 2 family, polypeptide B4 2.17 0.00 0.84 3160175 VLDLR very low density lipoprotein receptor 1.41 0.01 0.28 Signaling molecules 3000342 ADCY1 adenylate cyclase 1 (brain) 1.27 0.00 0.00 2677723 ARHGEF3 Rho guanine nucleotide exchange factor (GEF) 3 1.25 0.00 0.01 2359993 CREB3L4 cAMP responsive element binding protein 3-like 4 -1.16 0.00 0.79 2480383 EPAS1 endothelial PAS domain protein 1 -1.13 0.01 0.59
3210808 GNAQ guanine nucleotide binding protein (G protein), q polypeptide 1.17 0.03 0.59 2903782 ITPR3 inositol 1,4,5-triphosphate receptor, type 3 -1.18 0.01 0.89 4001785 MAP3K15 mitogen-activated protein kinase kinase kinase 15 1.21 0.02 0.16
2496727 MAP4K4 mitogen-activated protein kinase kinase kinase kinase 4 1.14 0.03 0.55 2644565 MRAS muscle RAS oncogene homolog 1.20 0.02 0.46 2580955 NMI N-myc (and STAT) interactor 1.63 0.00 0.02 3382861 PAK1 p21 protein (Cdc42/Rac)-activated kinase 1 1.63 0.00 0.00 3559192 PRKD1 protein kinase D1 1.46 0.00 0.00 3091301 PTK2B PTK2B protein tyrosine kinase 2 beta -1.13 0.03 0.29 3568616 RAB15 RAB15, member RAS onocogene family 1.47 0.00 0.17
2436985 SHC1 SHC (Src homology 2 domain containing) transforming protein 1 1.15 0.02 0.01

102
Transcript cluster ID Gene Gene Description
Gene Fold-Change (E/C)
Differential gene expression FDR
Differential Alternative splicing FDR
Alcohol metabolism 3169331 ALDH1B1 aldehyde dehydrogenase 1 family, member B1 1.13 0.01 0.11 3432090 ALDH2 aldehyde dehydrogenase 2 family (mitochondrial) -1.12 0.06 0.71 3337329 ALDH3B1 aldehyde dehydrogenase 3 family, member B1 -1.32 0.00 0.80 3571727 ALDH6A1 aldehyde dehydrogenase 6 family, member A1 -1.60 0.00 0.65 2975257 ALDH8A1 aldehyde dehydrogenase 8 family, member A1 -1.22 0.09 0.69 Transcription factors
3945914 ATF4 activating transcription factor 4 (tax-responsive enhancer element B67) -1.11 0.06 0.21
3858993 CEBPA CCAAT/enhancer binding protein (C/EBP), alpha -1.14 0.02 0.94 3888613 CEBPB CCAAT/enhancer binding protein (C/EBP), beta 1.12 0.02 0.89 3134013 CEBPD CCAAT/enhancer binding protein (C/EBP), delta -1.16 0.10 0.99 3836266 FOSB FBJ murine osteosarcoma viral oncogene homolog B -1.26 0.14 0.85 3561703 FOXA1 forkhead box A1 -1.15 0.01 0.16 3510858 FOXO1 forkhead box O1 -1.12 0.01 0.63 2891556 FOXQ1 forkhead box Q1 -1.20 0.05 0.57
3539070 HIF1A hypoxia inducible factor 1, alpha subunit (basic helix-loop-helix transcription factor) 1.13 0.13 0.72
3754797 HNF1B HNF1 homeobox B -1.14 0.04 1.00 3886453 HNF4A hepatocyte nuclear factor 4, alpha 1.12 0.01 0.01 2516967 HOXD1 homeobox D1 -1.33 0.00 0.41
2907730 SRF serum response factor (c-fos serum response element-binding transcription factor) -1.11 0.04 0.76
3458337 STAT6 signal transducer and activator of transcription 6, interleukin-4 induced -1.20 0.00 0.68

103
Transcript cluster ID Gene Gene Description
Gene Fold-Change (E/C)
Differential gene expression FDR
Differential Alternative splicing FDR
Chromatin regulation 2544662 DNMT3A DNA (cytosine-5-)-methyltransferase 3 alpha -1.11 0.03 0.01 3882012 DNMT3B DNA (cytosine-5-)-methyltransferase 3 beta 1.25 0.00 0.01 3945006 H1F0 H1 histone family, member 0 -1.15 0.05 0.82 3048869 H2AFV H2A histone family, member V -1.13 0.11 0.50 2611504 HDAC11 histone deacetylase 11 -1.32 0.01 0.66 3758845 HDAC5 histone deacetylase 5 -1.12 0.02 0.89 3976848 HDAC6 histone deacetylase 6 -1.16 0.01 0.94 2947073 HIST1H1B histone cluster 1, H1b 1.18 0.00 0.76 2946353 HIST1H1D histone cluster 1, H1d 1.31 0.05 0.78 2900074 HIST1H2BN histone cluster 1, H2bn 1.13 0.11 0.04 2946324 HIST1H3D histone cluster 1, H3d 1.11 0.07 0.06 2899233 HIST1H3E histone cluster 1, H3e 1.14 0.12 0.12 2946383 HIST1H4H histone cluster 1, H4h 1.31 0.01 0.01 2509740 MBD5 methyl-CpG binding domain protein 5 1.43 0.00 0.00 3656855 MYST1 MYST histone acetyltransferase 1 -1.15 0.02 0.02
3252382 MYST4 MYST histone acetyltransferase (monocytic leukemia) 4 1.19 0.11 0.68 Genes associated with alcoholism
3521174 ABCC4 ATP-binding cassette, sub-family C (CFTR/MRP), member 4 1.14 0.01 0.75 3606304 AKAP13 A kinase (PRKA) anchor protein 13 1.22 0.01 0.47 3927226 APP amyloid beta (A4) precursor protein 1.13 0.00 0.15

104
Transcript cluster ID Gene Gene Description
Gene Fold-Change (E/C)
Differential gene expression FDR
Differential Alternative splicing FDR
3673684 CDT1 chromatin licensing and DNA replication factor 1 -1.22 0.00 0.05 3603436 CHRNA5 cholinergic receptor, nicotinic, alpha 5 1.36 0.02 0.06
2772968 COX18 COX18 cytochrome c oxidase assembly homolog (S. cerevisiae) -1.23 0.01 0.77
3720228 CRKRS Cdc2-related kinase, arginine/serine-rich 1.19 0.02 0.29 3652424 EEF2K eukaryotic elongation factor-2 kinase 1.11 0.01 0.90 3260383 ENTPD7 ectonucleoside triphosphate diphosphohydrolase 7 1.12 0.01 0.04 2948587 FLOT1 flotillin 1 -1.15 0.01 1.00 3199511 FREM1 FRAS1 related extracellular matrix 1 1.82 0.00 0.07 2469825 GREB1 GREB1 protein 1.24 0.01 0.00 3636391 HOMER2 homer homolog 2 (Drosophila) 1.27 0.01 0.27 3349660 HTR3B 5-hydroxytryptamine (serotonin) receptor 3B 2.13 0.00 0.27 3779362 IMPA2 inositol(myo)-1(or 4)-monophosphatase 2 -1.24 0.01 0.68 3817733 JMJD2B jumonji domain containing 2B -1.17 0.00 0.77 3517793 KLF12 Kruppel-like factor 12 1.30 0.00 0.18 2667809 OSBPL10 oxysterol binding protein-like 10 1.17 0.01 0.31 2698996 PCOLCE2 procollagen C-endopeptidase enhancer 2 1.88 0.00 0.01 3358361 PDDC1 Parkinson disease 7 domain containing 1 -1.16 0.02 0.41 2361401 PMF1 polyamine-modulated factor 1 -1.19 0.02 0.75 2480168 PRKCE protein kinase C, epsilon 1.20 0.00 0.00
3213847 SHC3 SHC (Src homology 2 domain containing) transforming protein 3 1.31 0.02 0.64
2902884 SKIV2L superkiller viralicidic activity 2-like (S. cerevisiae) -1.16 0.02 0.88

105
Transcript cluster ID Gene Gene Description
Gene Fold-Change (E/C)
Differential gene expression FDR
Differential Alternative splicing FDR
3369366 SLC1A2 solute carrier family 1 (glial high affinity glutamate transporter), member 2 1.17 0.01 0.53
2610544 SLC6A11 solute carrier family 6 (neurotransmitter transporter, GABA), member 11 1.23 0.01 0.79
3751794 SLC6A4 solute carrier family 6 (neurotransmitter transporter, serotonin), member 4 1.20 0.00 0.01
3318666 SMPD1 sphingomyelin phosphodiesterase 1, acid lysosomal 1.18 0.03 0.90 2378662 TRAF5 TNF receptor-associated factor 5 1.84 0.00 0.04 3316375 TSPAN4 tetraspanin 4 -1.20 0.00 0.92 3896976 TXNDC13 thioredoxin domain containing 13 1.23 0.00 0.00 3815328 WDR18 WD repeat domain 18 -1.19 0.01 0.87 3989089 ZBTB33 zinc finger and BTB domain containing 33 1.27 0.01 0.15 3971923 ZFX zinc finger protein, X-linked 1.16 0.00 0.80 3078478 ZNF786 zinc finger protein 786 1.20 0.03 0.67
Table 13. Differentially expressed genes within pathways that were significantly affected by chronic alcohol exposure. Pathways significantly affected by ethanol were identified by Ingenuity Pathway analysis (Table 12). Pathways (and genes in them) with related functions were grouped into broader categories. For example, Glycolysis/ Gluconeogenesis and Citrate cycle are grouped under carbohydrate metabolism. Fold change (E/C) is ethanol/ control. Differentially expressed genes (FDR ≤ 15% and difference ≥ 10%) within the key pathways discussed in the text are shown. Other genes are listed in Appendix.

106
4.a. Validation of differential gene expression results by qRT-PCR
Quantitative real time RT-PCR assays (Taqman gene expression assays)
were carried out to confirm differential gene expression changes that were
observed in microarray data. Genes were selected from the key pathways that
were affected by chronic ethanol treatment. Even small expression changes in
the array data were confirmed by these assays. For example SREBF1 decreased
in expression by 15% in the array data and was confirmed to be decreased by
19% in qRT-PCR (Figure 18). A total of thirteen genes out of fourteen genes
testes were confirmed with fold changes very similar to that observed in the array
data (Figure 18).

107
Figure 18. qRT-PCR validation of differential gene expression. Genes from key pathways affected by chronic alcohol exposure were validated by qRT-PCR. Fold change is the ratio of expression under ethanol treatment over control treatment. For all genes p-value ≤ 5 x 10⁻⁶. For comparison, fold changes observed in array data are shown.
0.0
0.5
1.0
1.5
2.0
2.5
Rat
io (E
than
ol/ C
ontr
ol)
Gene
qRT- PCR
Array

108
5. Effects of chronic alcohol exposure on RNA splicing
Effects of ethanol on splicing were explored using Affymetrix GeneChip®
Human Exon 1.0 ST Arrays. Two-way ANOVA generated p-values (and FDRs
calculated using this p-value) were used to identify genes that were differentially
alternatively spliced due to chronic ethanol exposure. Some of these genes were
also differentially expressed. Of the 10,222 genes that were analyzed many
genes were differentially alternatively spliced after treatment with ethanol (Table
14).
Number of genes
FDR 15% FDR 10% FDR 3% Total Alternatively spliced1 1323 948 458
Alternatively spliced only2 687 559 323
Differentially expressed and Alternatively spliced3
636 389 135
Table 14. Effects of chronic ethanol exposure on splicing at different false discovery rates. 1Irrespective of the differential expression FDR. 2Alternative splicing without differential expression at that FDR. 3Both alternative splicing and differential expression. FDR was calculated by the method of Benjamini and Hochberg (1995).

109
Due to the complexity of identifying true alterative splicing events
(discussed in Introduction), FDR ≤ 3% was used for detecting genes that were
differentially alternatively spliced upon chronic ethanol treatment. A total of 458
(4.5%) of the detected genes were differentially alternatively spliced at an FDR ≤
3%. To detect true events, the effects of alcohol on each probe set was
visualized in the context of the gene using a custom track in the UCSC genome
browser (Kent et al., 2002). Multiple factors were considered during this
inspection. How is the expression of each probe set affected by ethanol? If a
probe set changes in expression with ethanol, is this effect different from how the
other probe sets in the gene are affected? To aid in this analysis, a one-way
ANOVA was carried out on probe sets. The fold change obtained for each probe
set along with the p-value (which indicates if the effect is significant) from one-
way ANOVA were used to identify probe sets that were probably alternatively
spliced in a gene. The analysis was restricted to genes with a minimum of three
present probe sets.
In many genes, probe sets at the 5’ end of the transcript were either called
absent or exhibited a decrease in expression with ethanol treatment (Figure 19).
A pattern was also noticed at the 3’ end of the transcripts, with an increase in the
expression in the presence of ethanol. Examples of these edge effects are
shown in Figure 19. In most cases it was difficult to distinguish between edge
effects and true alternate promoter and alternate poly(A) events and we therefore
focused on other alternate events such as putative cassette exons. However, in
some cases multiple probe sets indicated the presence of an alternate promoter

110
(for example, in MBD5, KANK1). We considered these alternate promoters to be
probably differential alternative events.

111
Figure 19. 5’ and 3’ edge effects in exon array data. Both UCSC genes and Refseq tracks are shown. In these tracks exons are represented as boxes, and intervening introns as lines. Arrows on introns show the direction of transcription. The alternative splicing events track, which displays all known alternative splicing events, is also shown. Probe set FC E/C is a custom track that displays fold change, ethanol/ control, for each probe set from the data in this study. (A) An example of 5’ edge effect; affected probe set indicated by an arrow (B) An example of 3’ effect, indicated by an arrow. 5’ edge effect is also observed in this gene.
A
B

112
A total of 458 genes that were alternatively spliced were visually inspected
and grouped into three categories (described in detail in Materials and Methods,
section 9) 1. Probably differentially alternatively spliced, if a probe set has a
significant fold change between ethanol and control, and behaves differently from
the remaining probe sets in the gene; 2. Probably not differentially alternatively
spliced if there was no indication of differential alternative splicing or if only edge
effects were observed; 3. Uncertain if the changes appear to be probably
differentially alternatively spliced but it is difficult to conclude if the alternative
event is real. An example of each category is shown in Figure 20. 142 genes
(31%) appeared to be probably alternatively spliced while 199 (43%) genes were
probably not alternatively spliced. The remaining genes were grouped into the
uncertain category. In genes that were detected as probably alternatively spliced
probe sets that are probably differentially spliced are listed in Table 15.

113
A
B

114
Figure 20. Examples of different groups of alternatively spliced genes. USCS genome browser images with exon array custom track are shown. (A) An example of a gene that was grouped as probably differentially alternatively spliced is shown. One half of the probe sets have lower fold change than the other half, suggesting expression of a shorter form of the transcript with ethanol. (B) Gene classified as Uncertain. Among the probe sets that were significantly affected, some (indicated by blue arrows) had a smaller fold change while others (indicated by black arrows) had a much higher fold change; some remained unaffected. Thus it was difficult to say if the gene was alternatively spliced or not. (C) Gene that was classified as probably not differentially alternatively spliced by looking at the expression of probe sets in the gene. Only three probe sets were significantly affected by ethanol but were similar in expression to each other.
C

115
From the 142 genes that appeared probably differentially alternative
spliced, 317 probe sets were matched to known alternative splicing or promoter
or termination events from the data available in the UCSC genome browser. Of
these only 39 probe sets appeared to be affected by ethanol. 26 of these probe
sets were cassette exons.
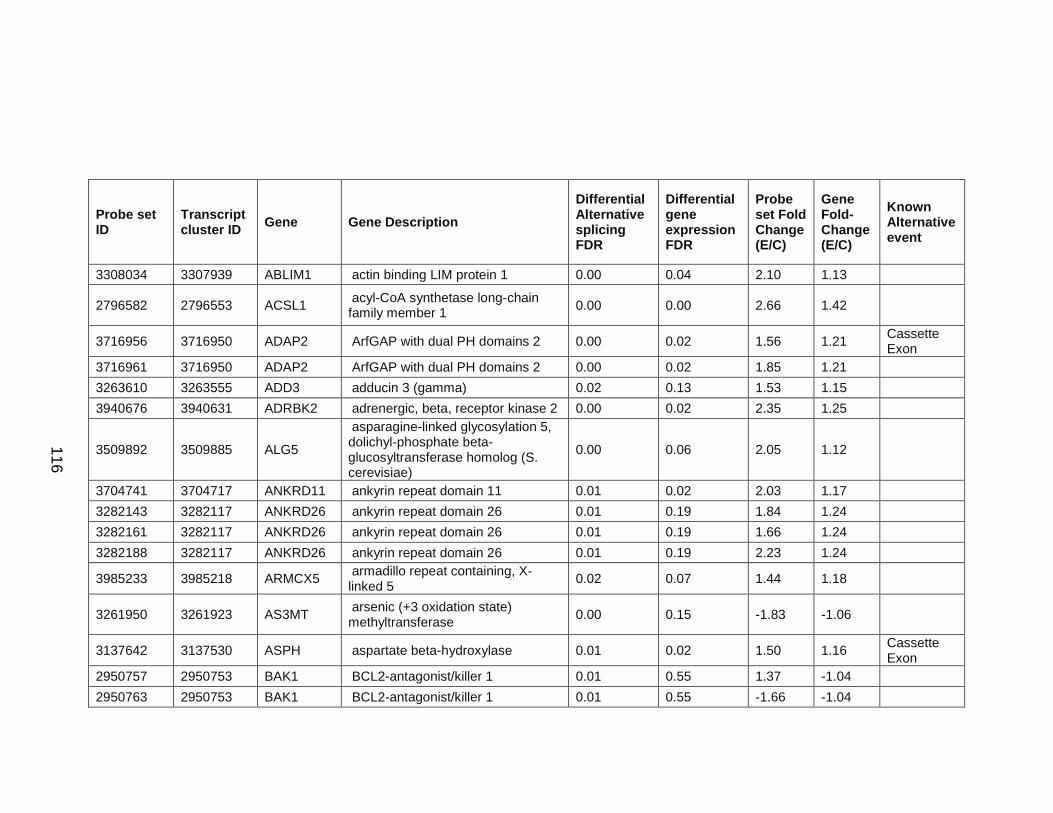
116
Probe set ID
Transcript cluster ID Gene Gene Description
Differential Alternative splicing FDR
Differential gene expression FDR
Probe set Fold Change (E/C)
Gene Fold-Change (E/C)
Known Alternative event
3308034 3307939 ABLIM1 actin binding LIM protein 1 0.00 0.04 2.10 1.13
2796582 2796553 ACSL1 acyl-CoA synthetase long-chain family member 1 0.00 0.00 2.66 1.42
3716956 3716950 ADAP2 ArfGAP with dual PH domains 2 0.00 0.02 1.56 1.21 Cassette Exon
3716961 3716950 ADAP2 ArfGAP with dual PH domains 2 0.00 0.02 1.85 1.21 3263610 3263555 ADD3 adducin 3 (gamma) 0.02 0.13 1.53 1.15 3940676 3940631 ADRBK2 adrenergic, beta, receptor kinase 2 0.00 0.02 2.35 1.25
3509892 3509885 ALG5
asparagine-linked glycosylation 5, dolichyl-phosphate beta-glucosyltransferase homolog (S. cerevisiae)
0.00 0.06 2.05 1.12
3704741 3704717 ANKRD11 ankyrin repeat domain 11 0.01 0.02 2.03 1.17 3282143 3282117 ANKRD26 ankyrin repeat domain 26 0.01 0.19 1.84 1.24 3282161 3282117 ANKRD26 ankyrin repeat domain 26 0.01 0.19 1.66 1.24 3282188 3282117 ANKRD26 ankyrin repeat domain 26 0.01 0.19 2.23 1.24
3985233 3985218 ARMCX5 armadillo repeat containing, X-linked 5 0.02 0.07 1.44 1.18
3261950 3261923 AS3MT arsenic (+3 oxidation state) methyltransferase 0.00 0.15 -1.83 -1.06
3137642 3137530 ASPH aspartate beta-hydroxylase 0.01 0.02 1.50 1.16 Cassette Exon
2950757 2950753 BAK1 BCL2-antagonist/killer 1 0.01 0.55 1.37 -1.04 2950763 2950753 BAK1 BCL2-antagonist/killer 1 0.01 0.55 -1.66 -1.04

117
Probe set ID
Transcript cluster ID Gene Gene Description
Differential Alternative splicing FDR
Differential gene expression FDR
Probe set Fold Change (E/C)
Gene Fold-Change (E/C)
Known Alternative event
2996330 2996321 BBS9 Bardet-Biedl syndrome 9 0.00 0.05 2.09 1.39 2996339 2996321 BBS9 Bardet-Biedl syndrome 9 0.00 0.05 2.26 1.39
3025504 3025500 BPGM 2,3-bisphosphoglycerate mutase 0.00 0.53 -1.69 1.06 Cassette Exon
3732463 3732448 BPTF bromodomain PHD finger transcription factor 0.00 0.11 2.33 1.21 Cassette
Exon
3393845 3393834 C11orf60 chromosome 11 open reading frame 60 0.02 0.01 1.93 1.42
3393857 3393834 C11orf60 chromosome 11 open reading frame 60 0.02 0.01 2.16 1.42
3471832 3471819 C12orf30 chromosome 12 open reading frame 30 0.00 0.47 2.00 1.05
3588702 3588658 C15orf41 chromosome 15 open reading frame 41 0.00 0.01 1.79 1.15
3442492 3442475 C1R complement component 1, r subcomponent 0.00 0.00 1.91 1.48
3442494 3442475 C1R complement component 1, r subcomponent 0.00 0.00 2.53 1.48
2377258 2377229 CD55 CD55 molecule, decay accelerating factor for complement (Cromer blood group)
0.02 0.07 -1.38 1.17 Cassette Exon
3964164 3964154 CERK ceramide kinase 0.01 0.05 1.50 1.09
2685924 2685908 CLDND1 claudin domain containing 1 0.00 0.10 2.04 1.15 Cassette Exon
3261992 3261971 CNNM2 cyclin M2 0.00 0.06 -1.08 1.13 3452866 3452865 COL2A1 collagen, type II, alpha 1 0.00 0.02 1.83 1.25 3452867 3452865 COL2A1 collagen, type II, alpha 1 0.00 0.02 2.52 1.25 3924402 3924372 COL6A1 collagen, type VI, alpha 1 0.00 0.23 1.55 1.12

118
Probe set ID
Transcript cluster ID Gene Gene Description
Differential Alternative splicing FDR
Differential gene expression FDR
Probe set Fold Change (E/C)
Gene Fold-Change (E/C)
Known Alternative event
3855119 3855104 CRLF1 cytokine receptor-like factor 1 0.00 0.02 -1.26 1.14 3284910 3284882 CUL2 cullin 2 0.02 0.14 2.74 1.20
2837366 2837266 CYFIP2 cytoplasmic FMR1 interacting protein 2 0.00 0.04 1.73 1.13
2903043 2903034 CYP21A2 cytochrome P450, family 21, subfamily A, polypeptide 2 0.00 0.02 2.35 1.19
3526553 3526544 DCUN1D2 DCN1, defective in cullin neddylation 1, domain containing 2 (S. cerevisiae)
0.00 0.01 2.00 1.20 Cassette Exon
2429199 2429147 DENND2C DENN/MADD domain containing 2C 0.02 0.25 2.06 1.21 Alt Three
Prime
3449809 3449760 DENND5B DENN/MADD domain containing 5B 0.01 0.15 1.71 1.11 Alt Five
Prime 3438704 3438617 EP400 E1A binding protein p400 0.00 0.14 2.72 1.07
3883731 3883690 EPB41L1 erythrocyte membrane protein band 4.1-like 1 0.00 0.01 -1.15 1.20 Cassette
Exon
3260855 3260829 FAM178A family with sequence similarity 178, member A 0.00 0.08 1.77 1.24
3260884 3260829 FAM178A family with sequence similarity 178, member A 0.00 0.08 1.71 1.24
3260885 3260829 FAM178A family with sequence similarity 178, member A 0.00 0.08 1.75 1.24
3884894 3884892 FAM83D family with sequence similarity 83, member D 0.00 0.45 -1.34 -1.02
3536809 3536786 FBXO34 F-box protein 34 0.01 0.13 1.26 1.12 3310204 3310041 FGFR2 fibroblast growth factor receptor 2 0.00 0.00 2.75 1.53

119
Probe set ID
Transcript cluster ID Gene Gene Description
Differential Alternative splicing FDR
Differential gene expression FDR
Probe set Fold Change (E/C)
Gene Fold-Change (E/C)
Known Alternative event
2678828 2678714 FHIT fragile histidine triad gene 0.01 0.07 -1.37 1.12
3355064 3355056 FOXRED1 FAD-dependent oxidoreductase domain containing 1 0.00 0.05 1.47 -1.11 Bleeding
Exon
3183263 3183238 FSD1L fibronectin type III and SPRY domain containing 1-like 0.01 0.18 2.13 1.15
2836609 2836518 GALNT10
UDP-N-acetyl-alpha-D-galactosamine:polypeptide N-acetylgalactosaminyltransferase 10 (GalNAc-T10)
0.00 0.05 1.72 1.12
3468153 3468103 GNPTAB N-acetylglucosamine-1-phosphate transferase, alpha and beta subunits
0.00 0.01 2.10 1.29
3438161 3438061 GPR133 G protein-coupled receptor 133 0.01 0.34 -1.44 1.04 Cassette Exon
3334428 3334415 GPR137 G protein-coupled receptor 137 0.01 0.19 1.52 1.10
3050476 3050462 GRB10 growth factor receptor-bound protein 10 0.03 0.19 1.38 1.05
2469862 2469825 GREB1 GREB1 protein 0.00 0.01 1.90 1.24
3267040 3267036 GRK5 G protein-coupled receptor kinase 5 0.01 0.05 2.07 1.17
2927734 2927722 HEBP2 heme binding protein 2 0.03 0.83 -1.28 -1.01
3258934 3258910 HELLS helicase, lymphoid-specific 0.03 0.31 1.67 1.12 Cassette Exon
2610128 2610094 IL17RC interleukin 17 receptor C 0.02 0.63 -1.42 -1.03 2610086 2610056 IL17RE interleukin 17 receptor E 0.00 0.60 -1.74 1.04

120
Probe set ID
Transcript cluster ID Gene Gene Description
Differential Alternative splicing FDR
Differential gene expression FDR
Probe set Fold Change (E/C)
Gene Fold-Change (E/C)
Known Alternative event
3272344 3272205 INPP5A inositol polyphosphate-5-phosphatase, 40kDa 0.02 0.40 -1.51 -1.03 Bleeding
Exon
3339471 3339423 INPPL1 inositol polyphosphate phosphatase-like 1 0.00 0.07 1.36 1.05
3159484 3159483 KANK1 KN motif and ankyrin repeat domains 1 0.00 0.02 -1.19 1.08 Alt
Promoter
3159513 3159483 KANK1 KN motif and ankyrin repeat domains 1 0.00 0.02 3.21 1.08 Cassette
Exon
3159526 3159483 KANK1 KN motif and ankyrin repeat domains 1 0.00 0.02 1.91 1.08
3687311 3687308 KCTD13 potassium channel tetramerisation domain containing 13 0.01 0.09 1.69 1.09
3117386 3117384 KHDRBS3 KH domain containing, RNA binding, signal transduction associated 3
0.00 0.05 -1.44 1.18
2764216 2764192 KIAA0746 KIAA0746 protein 0.01 0.00 2.45 1.56
3239168 3238962 KIAA1217 KIAA1217 0.00 0.01 1.77 1.25 Cassette Exon
3239170 3238962 KIAA1217 KIAA1217 0.00 0.01 1.71 1.25 Cassette Exon
3737294 3737274 KIAA1618 KIAA1618 0.00 0.03 2.47 1.07 3886104 3886072 L3MBTL l(3)mbt-like (Drosophila) 0.01 0.04 2.11 1.18 2674065 2674047 LAMB2 laminin, beta 2 (laminin S) 0.01 0.15 -1.51 -1.09 3402854 3402836 LEPREL2 leprecan-like 2 0.00 0.27 1.75 1.06
2352526 2352501 LRIG2 leucine-rich repeats and immunoglobulin-like domains 2 0.01 0.55 1.69 1.04
3600255 3600212 LRRC49 leucine rich repeat containing 49 0.01 0.21 -1.75 1.28

121
Probe set ID
Transcript cluster ID Gene Gene Description
Differential Alternative splicing FDR
Differential gene expression FDR
Probe set Fold Change (E/C)
Gene Fold-Change (E/C)
Known Alternative event
2814812 2814756 MAP1B microtubule-associated protein 1B 0.00 0.01 1.58 1.24 3723725 3723687 MAPT microtubule-associated protein tau 0.01 0.00 2.39 1.47
3807768 3807753 MBD1 methyl-CpG binding domain protein 1 0.01 0.14 1.42 1.06 Cassette
Exon
3807800 3807753 MBD1 methyl-CpG binding domain protein 1 0.01 0.14 1.41 1.06
2509748 2509740 MBD5 methyl-CpG binding domain protein 5 0.00 0.00 1.20 1.43 Alt
Promoter
2509755 2509740 MBD5 methyl-CpG binding domain protein 5 0.00 0.00 2.12 1.43 Alt
Promoter
3611221 3611126 MEF2A myocyte enhancer factor 2A 0.02 0.11 2.06 1.15 Cassette Exon
3834786 3834778 MEGF8 multiple EGF-like-domains 8 0.00 0.12 2.21 1.09 3945116 3945084 MICALL1 MICAL-like 1 0.01 0.47 2.54 1.05
3453679 3453592 MLL2 myeloid/lymphoid or mixed-lineage leukemia 2 0.03 0.04 1.46 1.09
3939483 3939470 MMP11 matrix metallopeptidase 11 (stromelysin 3) 0.02 0.61 1.48 1.05
4027609 4027585 MPP1 membrane protein, palmitoylated 1, 55kDa 0.02 0.01 1.51 1.15 Cassette
Exon 2692888 2692883 MUC13 mucin 13, cell surface associated 0.00 0.00 1.03 2.99 3431233 3431220 MVK mevalonate kinase 0.02 0.35 1.68 1.04 3341235 3341221 MYO7A myosin VIIA 0.00 0.25 1.48 1.04 3722722 3722700 NAGS N-acetylglutamate synthase 0.01 0.16 -1.65 -1.15 3485325 3485292 NBEA neurobeachin 0.00 0.01 2.46 1.47 3485354 3485292 NBEA neurobeachin 0.00 0.01 3.20 1.47

122
Probe set ID
Transcript cluster ID Gene Gene Description
Differential Alternative splicing FDR
Differential gene expression FDR
Probe set Fold Change (E/C)
Gene Fold-Change (E/C)
Known Alternative event
3776154 3776139 NDC80 NDC80 homolog, kinetochore complex component (S. cerevisiae) 0.02 0.11 2.07 1.20
3468771 3468743 NT5DC3 5'-nucleotidase domain containing 3 0.00 0.01 1.94 1.25
3382895 3382861 PAK1 p21 protein (Cdc42/Rac)-activated kinase 1 0.00 0.00 1.18 1.63
3175284 3175274 PCSK5 proprotein convertase subtilisin/kexin type 5 0.00 0.00 2.01 1.35
3407496 3407453 PDE3A phosphodiesterase 3A, cGMP-inhibited 0.02 0.32 2.12 1.10
3755379 3755359 PIP4K2B phosphatidylinositol-5-phosphate 4-kinase, type II, beta 0.03 0.16 1.44 1.06
2977650 2977621 PLAGL1 pleiomorphic adenoma gene-like 1 0.01 0.00 2.33 1.44 Cassette Exon
2640646 2640579 PLXNA1 plexin A1 0.00 0.40 -1.30 1.04 3426598 3426502 PLXNC1 plexin C1 0.00 0.00 1.92 1.34 2694842 2694817 PLXND1 plexin D1 0.03 0.73 1.31 -1.01
3878439 3878429 POLR3F polymerase (RNA) III (DNA directed) polypeptide F, 39 kDa 0.00 0.12 2.03 1.17
3976654 3976639 PORCN porcupine homolog (Drosophila) 0.03 0.78 1.64 -1.02
2948431 2948425 PPP1R10 protein phosphatase 1, regulatory (inhibitor) subunit 10 0.02 0.00 -1.00 1.24
2948433 2948425 PPP1R10 protein phosphatase 1, regulatory (inhibitor) subunit 10 0.02 0.00 -1.00 1.24
3134053 3134034 PRKDC protein kinase, DNA-activated, catalytic polypeptide 0.01 0.57 1.21 1.04
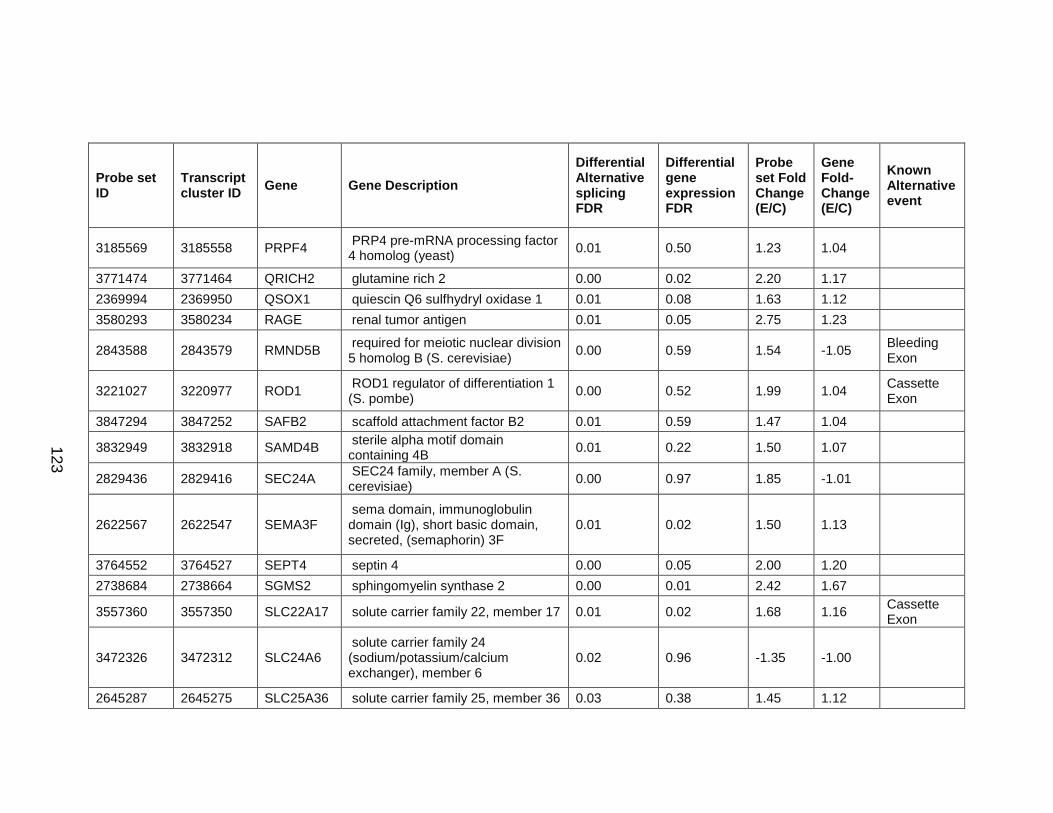
123
Probe set ID
Transcript cluster ID Gene Gene Description
Differential Alternative splicing FDR
Differential gene expression FDR
Probe set Fold Change (E/C)
Gene Fold-Change (E/C)
Known Alternative event
3185569 3185558 PRPF4 PRP4 pre-mRNA processing factor 4 homolog (yeast) 0.01 0.50 1.23 1.04
3771474 3771464 QRICH2 glutamine rich 2 0.00 0.02 2.20 1.17 2369994 2369950 QSOX1 quiescin Q6 sulfhydryl oxidase 1 0.01 0.08 1.63 1.12 3580293 3580234 RAGE renal tumor antigen 0.01 0.05 2.75 1.23
2843588 2843579 RMND5B required for meiotic nuclear division 5 homolog B (S. cerevisiae) 0.00 0.59 1.54 -1.05 Bleeding
Exon
3221027 3220977 ROD1 ROD1 regulator of differentiation 1 (S. pombe) 0.00 0.52 1.99 1.04 Cassette
Exon
3847294 3847252 SAFB2 scaffold attachment factor B2 0.01 0.59 1.47 1.04
3832949 3832918 SAMD4B sterile alpha motif domain containing 4B 0.01 0.22 1.50 1.07
2829436 2829416 SEC24A SEC24 family, member A (S. cerevisiae) 0.00 0.97 1.85 -1.01
2622567 2622547 SEMA3F sema domain, immunoglobulin domain (Ig), short basic domain, secreted, (semaphorin) 3F
0.01 0.02 1.50 1.13
3764552 3764527 SEPT4 septin 4 0.00 0.05 2.00 1.20 2738684 2738664 SGMS2 sphingomyelin synthase 2 0.00 0.01 2.42 1.67
3557360 3557350 SLC22A17 solute carrier family 22, member 17 0.01 0.02 1.68 1.16 Cassette Exon
3472326 3472312 SLC24A6 solute carrier family 24 (sodium/potassium/calcium exchanger), member 6
0.02 0.96 -1.35 -1.00
2645287 2645275 SLC25A36 solute carrier family 25, member 36 0.03 0.38 1.45 1.12
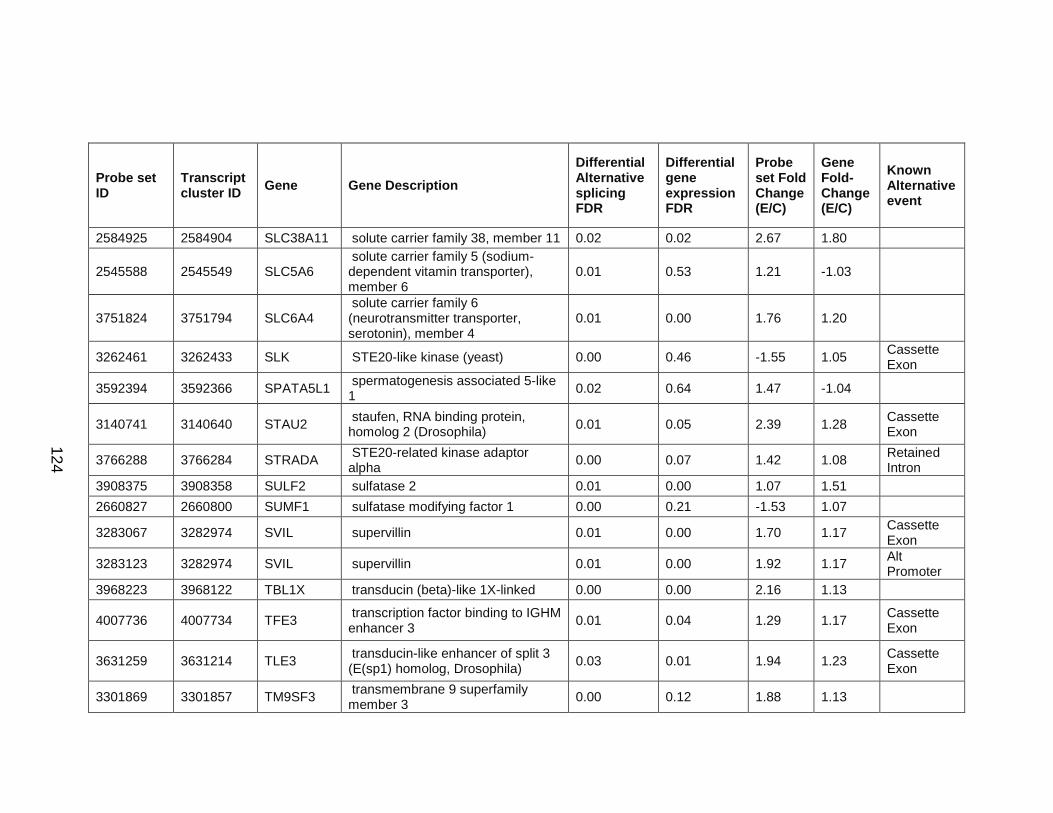
124
Probe set ID
Transcript cluster ID Gene Gene Description
Differential Alternative splicing FDR
Differential gene expression FDR
Probe set Fold Change (E/C)
Gene Fold-Change (E/C)
Known Alternative event
2584925 2584904 SLC38A11 solute carrier family 38, member 11 0.02 0.02 2.67 1.80
2545588 2545549 SLC5A6 solute carrier family 5 (sodium-dependent vitamin transporter), member 6
0.01 0.53 1.21 -1.03
3751824 3751794 SLC6A4 solute carrier family 6 (neurotransmitter transporter, serotonin), member 4
0.01 0.00 1.76 1.20
3262461 3262433 SLK STE20-like kinase (yeast) 0.00 0.46 -1.55 1.05 Cassette Exon
3592394 3592366 SPATA5L1 spermatogenesis associated 5-like 1 0.02 0.64 1.47 -1.04
3140741 3140640 STAU2 staufen, RNA binding protein, homolog 2 (Drosophila) 0.01 0.05 2.39 1.28 Cassette
Exon
3766288 3766284 STRADA STE20-related kinase adaptor alpha 0.00 0.07 1.42 1.08 Retained
Intron 3908375 3908358 SULF2 sulfatase 2 0.01 0.00 1.07 1.51 2660827 2660800 SUMF1 sulfatase modifying factor 1 0.00 0.21 -1.53 1.07
3283067 3282974 SVIL supervillin 0.01 0.00 1.70 1.17 Cassette Exon
3283123 3282974 SVIL supervillin 0.01 0.00 1.92 1.17 Alt Promoter
3968223 3968122 TBL1X transducin (beta)-like 1X-linked 0.00 0.00 2.16 1.13
4007736 4007734 TFE3 transcription factor binding to IGHM enhancer 3 0.01 0.04 1.29 1.17 Cassette
Exon
3631259 3631214 TLE3 transducin-like enhancer of split 3 (E(sp1) homolog, Drosophila) 0.03 0.01 1.94 1.23 Cassette
Exon
3301869 3301857 TM9SF3 transmembrane 9 superfamily member 3 0.00 0.12 1.88 1.13
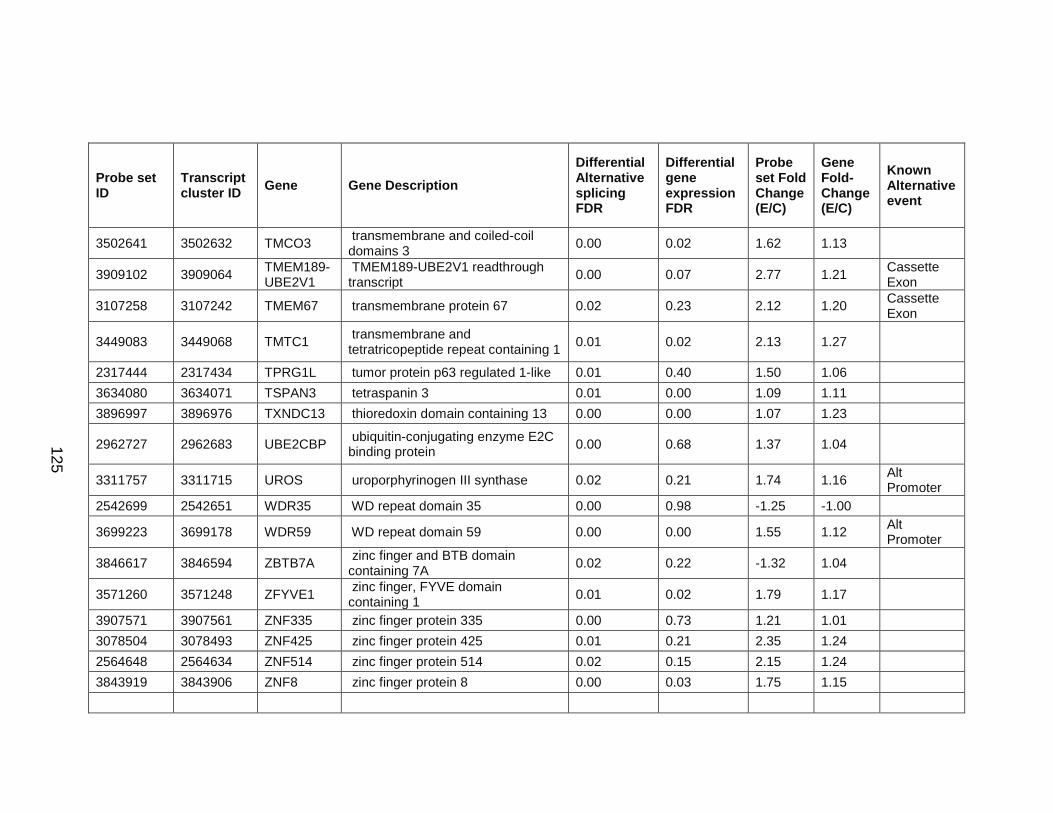
125
Probe set ID
Transcript cluster ID Gene Gene Description
Differential Alternative splicing FDR
Differential gene expression FDR
Probe set Fold Change (E/C)
Gene Fold-Change (E/C)
Known Alternative event
3502641 3502632 TMCO3 transmembrane and coiled-coil domains 3 0.00 0.02 1.62 1.13
3909102 3909064 TMEM189-UBE2V1
TMEM189-UBE2V1 readthrough transcript 0.00 0.07 2.77 1.21 Cassette
Exon
3107258 3107242 TMEM67 transmembrane protein 67 0.02 0.23 2.12 1.20 Cassette Exon
3449083 3449068 TMTC1 transmembrane and tetratricopeptide repeat containing 1 0.01 0.02 2.13 1.27
2317444 2317434 TPRG1L tumor protein p63 regulated 1-like 0.01 0.40 1.50 1.06 3634080 3634071 TSPAN3 tetraspanin 3 0.01 0.00 1.09 1.11 3896997 3896976 TXNDC13 thioredoxin domain containing 13 0.00 0.00 1.07 1.23
2962727 2962683 UBE2CBP ubiquitin-conjugating enzyme E2C binding protein 0.00 0.68 1.37 1.04
3311757 3311715 UROS uroporphyrinogen III synthase 0.02 0.21 1.74 1.16 Alt Promoter
2542699 2542651 WDR35 WD repeat domain 35 0.00 0.98 -1.25 -1.00
3699223 3699178 WDR59 WD repeat domain 59 0.00 0.00 1.55 1.12 Alt Promoter
3846617 3846594 ZBTB7A zinc finger and BTB domain containing 7A 0.02 0.22 -1.32 1.04
3571260 3571248 ZFYVE1 zinc finger, FYVE domain containing 1 0.01 0.02 1.79 1.17
3907571 3907561 ZNF335 zinc finger protein 335 0.00 0.73 1.21 1.01 3078504 3078493 ZNF425 zinc finger protein 425 0.01 0.21 2.35 1.24 2564648 2564634 ZNF514 zinc finger protein 514 0.02 0.15 2.15 1.24 3843919 3843906 ZNF8 zinc finger protein 8 0.00 0.03 1.75 1.15

126
Probe set ID
Transcript cluster ID Gene Gene Description
Differential Alternative splicing FDR
Differential gene expression FDR
Probe set Fold Change (E/C)
Gene Fold-Change (E/C)
Known Alternative event
3621172 3621160 ZSCAN29 zinc finger and SCAN domain containing 29 0.02 0.09 -1.27 1.13 Alt Five
Prime
Table 15. Probe sets probably differentially alternatively spliced in response to chronic ethanol treatment. Probe sets that are probably alternatively spliced in response to chronic ethanol treatment are shown. Fold change (E/C) is ethanol/ control. Probe set fold change refers to the change in the expression of the indicated (Probe set ID) probe set with ethanol. Gene fold change refers to the difference in the expression of the gene, taking into consideration all the probe sets in the given transcript cluster (Transcript cluster ID).
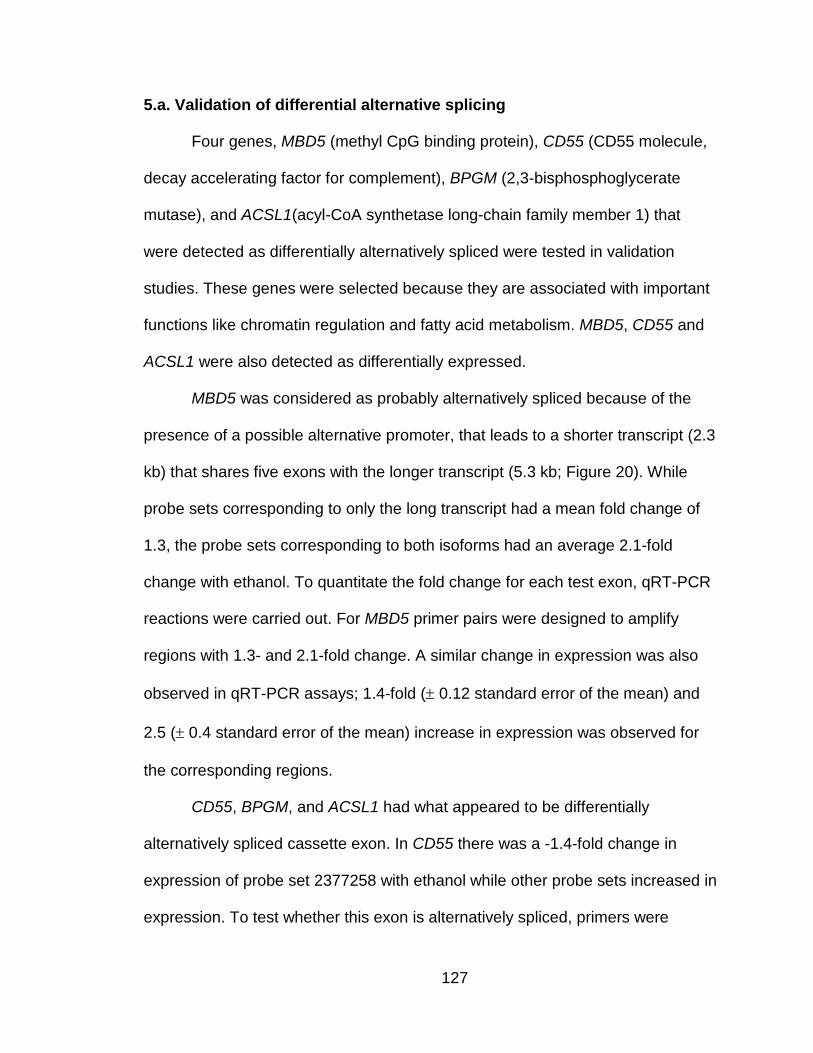
127
5.a. Validation of differential alternative splicing
Four genes, MBD5 (methyl CpG binding protein), CD55 (CD55 molecule,
decay accelerating factor for complement), BPGM (2,3-bisphosphoglycerate
mutase), and ACSL1(acyl-CoA synthetase long-chain family member 1) that
were detected as differentially alternatively spliced were tested in validation
studies. These genes were selected because they are associated with important
functions like chromatin regulation and fatty acid metabolism. MBD5, CD55 and
ACSL1 were also detected as differentially expressed.
MBD5 was considered as probably alternatively spliced because of the
presence of a possible alternative promoter, that leads to a shorter transcript (2.3
kb) that shares five exons with the longer transcript (5.3 kb; Figure 20). While
probe sets corresponding to only the long transcript had a mean fold change of
1.3, the probe sets corresponding to both isoforms had an average 2.1-fold
change with ethanol. To quantitate the fold change for each test exon, qRT-PCR
reactions were carried out. For MBD5 primer pairs were designed to amplify
regions with 1.3- and 2.1-fold change. A similar change in expression was also
observed in qRT-PCR assays; 1.4-fold (± 0.12 standard error of the mean) and
2.5 (± 0.4 standard error of the mean) increase in expression was observed for
the corresponding regions.
CD55, BPGM, and ACSL1 had what appeared to be differentially
alternatively spliced cassette exon. In CD55 there was a -1.4-fold change in
expression of probe set 2377258 with ethanol while other probe sets increased in
expression. To test whether this exon is alternatively spliced, primers were
128
designed to flank the exon and two products of 383 bp or 266 bp were expected.
Two transcript isoforms were detected for CD55 (Figure 21). In qRT-PCR
assays, a 0.7 ± 0.1, fold decrease in the expression of test exon with ethanol was
observed. To determine if this decrease in expression is specific to this exon,
another exon which did not appear to be alternatively spliced was also tested. A
similar change in expression (0.7 ± 0.2) was observed for this exon also,
indicating that CD55 does not undergo a true differential alternative splicing
event.
In BPGM one probe set (3025504) displayed a significant -1.7-fold
decrease in expression while others did not have any significant change. The test
exon was 320 bp long and thus products of 384 bp or 67 bp were expected if the
exon was included or excluded from the transcript. In PCR multiple bands were
seen, including bands that appeared to be of the expected size (Figure 21).
In ACSL1 one probe set (2796582) increased in expression by 2.6-fold
while others were increased on average 1.4 fold. To detect if isoforms of the
gene with and without the cassette exon exist, primers were designed to amplify
across the putative cassette exon, yielding either 232 bp or 181 bp products.
Only one isoform was detected for ACSL1 and therefore it was not considered
further (Figure 21).

129
Figure 21. Detection of alternative isoforms for validation. PCR was carried out with primers flanking the test exon to determine if the exon is alternatively spliced. cDNA from control (C) and ethanol (E) samples was used as the template. Size of the DNA ladder is indicated on the left. For BPGM, two bands that appeared to be of the expected size are indicated by an asterix.
75 bp
200 bp
300 bp400 bp
EC EC EC
*
*
CD55 ACSL1 BPGM

130
IV.DISCUSSION
1. Regulation of ADHs by distal cis-regulatory regions
Cis-regulatory regions play a critical role in the regulation of the gene
expression. Because polymorphisms in regulatory sequences may affect the
genetic risks for alcoholism, understanding the regulation of ADH expression is
important. The known cis-regulatory elements in the ADH cluster do not
completely account for expression levels of all ADH genes in the liver. We sought
to identify distal regulatory regions in the ADH cluster. Sequence conservation
implies an important functional role. Therefore, to discover putative distal
regulatory regions, sequence conservation in the non-coding regions of the ADH
cluster extending from the 3’ end of ADH1A to the transcriptional start site of
ADH5 was studied. We chose to restrict our search to the intergenic regions,
although regulatory regions could also be present in the intron sequences.
Eight conserved regions were identified and tested in the context of the
ADH4 basal promoter in human hepatoma cells (HepG2). Most were negative
regulatory regions that decreased the activity of the promoter by at least 40%
(Figure 7). The greatest effect was observed with 4E, a 1504 bp region 13 kb
upstream of the ADH4 translational start site. 4E increased the activity of its
cognate ADH4 promoter 50-fold in HepG2 cells (Figure 8). In preliminary studies,
this enhancer activity was observed to be distance and orientation dependent
(data not shown). 4E also enhanced the activity of the ADH1B promoter by 180-
fold. In HepG2 cells the ADH1B proximal promoter has weaker activity than
ADH4 promoter. This probably explains the larger increase in activity observed
131
with the ADH1B promoter. 4E also enhanced the activity of another strong
promoter, SV40 early promoter, 56-fold.
The 4E enhancer was not functional in a non-hepatic cell line, H1299 lung
carcinoma cells, suggesting that it has cell-type specificity (Table 7). By deletion
analysis, it was observed that the enhancer activity was present in a 565 bp
region, 4E3 (Figure 9). Six putative transcription factor binding sites were
identified in 4E3 by sequence homology, and their roles were tested by
electrophoretic mobility shift assays (EMSA) and site directed mutagenesis. Sites
1, 2, 3, 4, and 6 were confirmed to be FOXA binding sites by EMSA with
competitor oligonucleotides and by supershift assays (Figure 11). Oligo 3, which
spans sites 3, 4, and 5, produced multiple high molecular weight bands, but the
FOXA specific complex was the most prominent (Figure 12). Site 5, which
overlaps with the site 4 by two nucleotides, was predicted to be a HNF-1A site.
While none of the bands were disrupted by HNF-1A competitor, a stronger FOXA
specific complex was detected. It is possible that HNF-1A binds weakly to site 5
and this binding interferes with the binding of the FOXA to the overlapping site 4.
Site-directed mutagenesis studies showed the greatest effect on enhancer
function when either site 1 or site 4 was mutated, with activity decreasing to 40%
of the wild type (Figure 13). Mutating multiple sites affected activity more
dramatically. All combinations of multiple mutants tested displayed approximately
a multiplicative reduction in activity compared to the respective single mutants,
suggesting that each site is acting independently (Figure 13). When sites 1, 2, 4
and 6 were mutated, activity decreased to 10% of the wild type. In a genome-

132
wide mapping of DNase I hypersensitive sites in HepG2 cells (Crawford et al.,
2006b) , a hypersensitive peak was detected across the region of transcription
factor binding sites that we characterized in 4E3 (UCSC Open chromatin track,
March 2006, NCBI36/hg 18 assembly). This indicates that the site identified here
is accessible to transcription factors in vivo.
FOXA and HNF-1A proteins are liver-enriched factors that regulate many
liver-specific genes. Thus, it is not surprising that they are utilized to enhance the
expression of ADH genes that are expressed at highest levels in the liver. FOXA
proteins can function as pioneer factors and bind to highly compacted chromatin,
alter the chromatin structure and enhance transcription. Evidence of such
regulation was observed in the expression of the albumin gene during
development (Cirillo and Zaret, 1999). This could be a possible mechanism by
which FOXA activates ADH4 expression from the 4E3 enhancer.
Among the other seven putative distal regulatory regions that were tested,
six regions repressed the activity of the 4Basal promoter. Highest repression was
observed with the region between ADH4 and ADH5, with the promoter activity
decreasing by 76% (Figure 7). A similar decrease in activity was observed with
fragment 6-4-a, the region immediately upstream (relative to the translational
start site of ADH4) of 4E. Fragments 1A-6-c and 1A-6-a also decreased the
activity while1A-6-b did not have any significant effect. 1A-6-a, 1A-6-b and 1A-6-c
were overlapping fragments that span 4.1 kb on genomic sequence. It is possible
that fragmenting this 4.1 kb region decreased the functional effect of the region.

133
A more comprehensive analysis with more overlap between fragments is
necessary to understand the role of this region.
It is noteworthy that a strong enhancer is flanked by negative regulatory
regions. Because 4E3 functions on heterologous promoters in vitro, including the
ADH1B and SV40 promoters, it is conceivable that in the absence of intervening
boundary elements this enhancer could act on the ADH6 promoter 60 kb away or
other ADH promoters in the cluster. One possible function of the negative
regulatory regions maybe to modulate the function of the 4E3 enhancer. Another
possibility is that these regions play an important role in other tissues. A more
detailed study is necessary to understand the role of these regions in the
regulation of ADH expression. In summary, multiple distal cis-regulatory regions
in the ADH cluster that could regulate the expression of ADH genes were
identified.
2. Regulatory variations and effects on function
Several variations in genes encoding alcohol dehydrogenases have been
associated with the risk for alcoholism (Birley et al., 2009; Edenberg and Foroud,
2006; Edenberg et al., 2006; Reich et al., 1998; Williams et al., 1999). Although
the most widely-studied ADH variations affect the sequence of the encoded
enzymes, one (rs1800759) is known to affect regulation of gene expression
(Edenberg et al., 1999). The expression level of ADH enzymes could affect the
flux through the alcohol metabolic pathway and thereby influence the effects of

134
alcohol and the risk for alcoholism. As part of this dissertation, haplotypes of two
cis-regulatory regions in ADH cluster were tested.
Because of its enhancer function, variations in the 4E3 region could
greatly affect the expression levels of ADH4. There are three SNPs in this region,
rs7678936 (G/T), rs7678890 (T/G) and rs11401494 (del/T). Three haplotypes
were tested. Haplotype 2 (T, T, del) and haplotype 3 (G, G, del) were less active
(0.6-fold) than Haplotype1 (G, T, del), so it was not possible to attribute the effect
to a single SNP. rs11401494 had a small effect on the function of the enhancer.
The three SNPs are not present in any of the transcription factor binding sites
identified in this study, however, rs7678936 is adjacent to a putative FOXA site
and rs7678890 is adjacent to site 5 (HNF-1A).
It would be of interest to determine whether these variations will contribute
to differential susceptibility to alcoholism. From allele frequencies, rs7678936
(G/T) and rs7678890 (T /G) appear to be in linkage disequilibrium, meaning the
rs7678936 G allele travels with the rs7678890 T allele. The GT haplotype is at a
fifty percent frequency in African populations (YRI, LWK, MIKK) whereas it
appears to have reached higher frequencies in European (CEU) and have
become fixed in Asian populations (CHB, JPT) or populations with Asian
ancestry (CHD, GIH). Therefore, the role of these variations in the risk for
alcoholism will be more important in populations of African descent.
The effect of variations was also investigated in the ADH1B proximal
promoter region because there is evidence of association of two SNPs
(rs1229982 and rs1159918) in this region with the risk for alcoholism in a
135
European-American population (Edenberg et al., 2006). We tested five
haplotypes and observed that the presence of the C allele of rs1229982 reduced
the activity of the promoter by 30%. Although the magnitude of the effect is small,
it could be of significance considering alcoholism is a complex disease in which
multiple genes contribute to the disease. This functional effect supports our
hypothesis that variations in the regulatory polymorphisms could be associated
with the disease and vice versa. The frequency of the rs1229982 C/C genotype
is high in some populations such as CHB, JPT. It would be of interest to study
the effect of this SNP on the risk for alcoholism in these populations.
In this study, we did not detect a functional effect for rs1159918 and other
SNPs that were tested in this region. One possible explanation for the absence of
functional effect even though it was associated with alcoholism is that it is in
linkage disequilibrium (LD) with another SNP that is associated with the risk for
alcoholism. From the available HapMap LD data in the ADH cluster, only
rs6810842 (r2 = 0.949) is in LD with rs1159918 in the CEU population. This SNP
was, however, tested in this study and was not observed to have any functional
effect, hinting at a possibility of another SNP associated with alcoholism.
In view of the effect of variations on the enhancer activity and also on the
promoter activity that was observed in this study, it is important to consider the
presence of variations in a test region when studying cis-regulatory regions.
Testing a haplotype which has much lower activity could mislead one to ignore
the function of the region. The small magnitude of effect that was observed with
the negative regulatory regions in this study could be one such example. Thus, it

136
is necessary to study other haplotypes in test regions to completely appreciate
the function of these regions.
In summary, results from this study support our hypothesis that variations
could have a functional effect on the expression levels of ADH, and that these
could be associated with alcoholism.
3. Effects of alcohol on gene expression
The effects of extended alcohol exposure on global gene expression in a
human hepatoma cell line, HepG2 were studied. HepG2 cells do not express
class I ADH genes but express ADH4 at moderate levels (Tian and Edenberg,
2005). They also do not express cytochrome P450 2E1 (CYP2E1). Thus, this
model system helped to identify the direct effects of alcohol and also effects due
to limited metabolism of alcohol. An advantage was to identify effects of alcohol
directly on human hepatocyte-like cells in the absence of potential signaling from
neighboring cells, such as hepatic stellate cells and Kupffer cells which are
known to play a role in alcohol induced liver injury (Siegmund and Brenner, 2005;
Thurman, 1998; Wheeler et al., 2001).
HepG2 cells were cultured in the presence of 75 mM ethanol for 9 days.
The legal limit of 0.08% blood alcohol level corresponds to 17.4 mM ethanol.
Alcoholic beverages range from approximately 4.5% ethanol (900 mM) for beer
to 12% ethanol (2 M) for wine to 41.1% ethanol in spirits (7M). Because 80% of
alcohol is absorbed in the small intestine and most of alcohol is carried to the
liver via portal vein, liver is exposed to high concentrations of alcohol (Swift,

137
2003). Prolonged exposure of HepG2 cells to ethanol led to a decrease in the
number of viable cells relative to untreated cells. This decrease in cell number
could be due to a prolonged lag phase, or slow cell growth or due to cell death.
Ethanol has been shown to have apoptotic effects in HepG2 cells and
hepatocytes (Higuchi et al., 1996; Neuman et al., 1993; Neuman et al., 1999).
However, we did not observe visible differences in morphology between cells in
ethanol and control conditions, and also did not notice non-adherent (dead) cells
in the presence of ethanol.
Significant differences in gene expression between control and ethanol
treated cells were observed. Many of these were small changes (10 to 30%).
Statistical power obtained from eight arrays used for each condition along with
multiple probe sets that target each gene, allowed us to detect these small
changes. We were able to validate changes as small as 15% in qRT-PCR
studies
Chronic ethanol treatment of HepG2 cells had an effect on the expression
of genes in key metabolic pathways and stress response pathways. Some of the
pathways that may be key to understanding different aspects of alcohol induced
liver disease are discussed below. Effects of alcohol on genes involved in
chromatin regulation and genes associated with alcoholism are also discussed.
3.a. Acute phase response
Liver responds to infection, inflammation, injury to tissue, or malignancy,
with the acute phase response. Acute phase response is characterized by
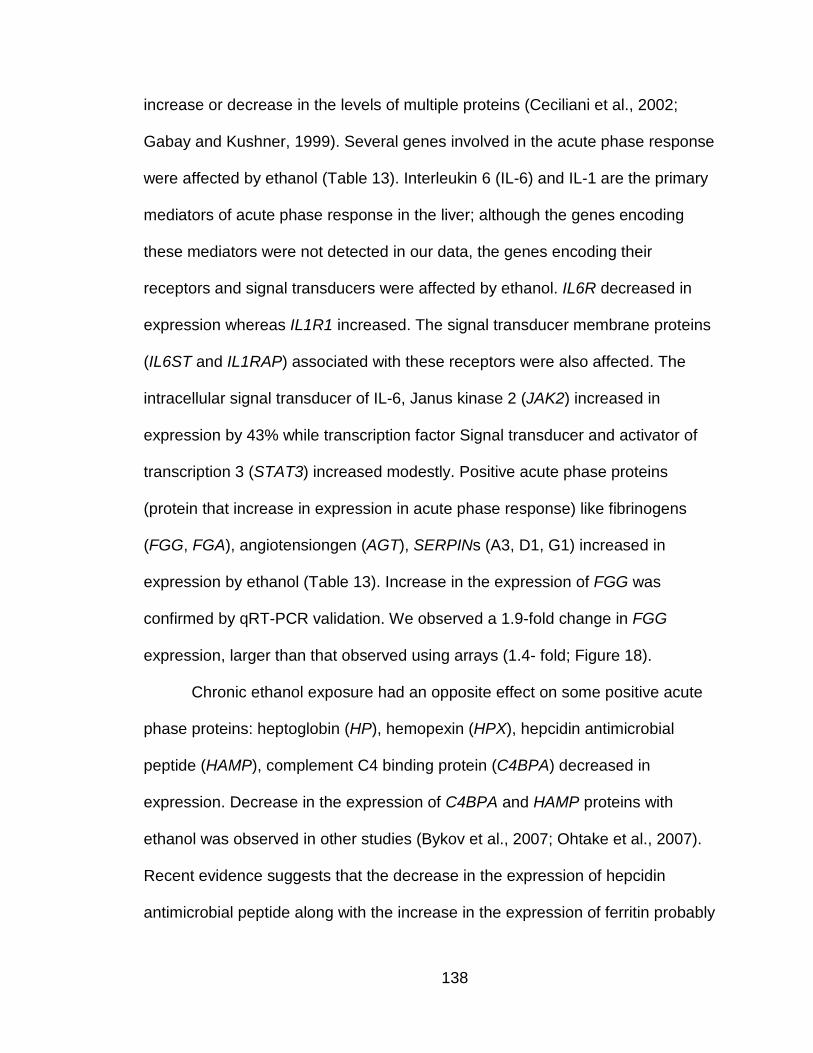
138
increase or decrease in the levels of multiple proteins (Ceciliani et al., 2002;
Gabay and Kushner, 1999). Several genes involved in the acute phase response
were affected by ethanol (Table 13). Interleukin 6 (IL-6) and IL-1 are the primary
mediators of acute phase response in the liver; although the genes encoding
these mediators were not detected in our data, the genes encoding their
receptors and signal transducers were affected by ethanol. IL6R decreased in
expression whereas IL1R1 increased. The signal transducer membrane proteins
(IL6ST and IL1RAP) associated with these receptors were also affected. The
intracellular signal transducer of IL-6, Janus kinase 2 (JAK2) increased in
expression by 43% while transcription factor Signal transducer and activator of
transcription 3 (STAT3) increased modestly. Positive acute phase proteins
(protein that increase in expression in acute phase response) like fibrinogens
(FGG, FGA), angiotensiongen (AGT), SERPINs (A3, D1, G1) increased in
expression by ethanol (Table 13). Increase in the expression of FGG was
confirmed by qRT-PCR validation. We observed a 1.9-fold change in FGG
expression, larger than that observed using arrays (1.4- fold; Figure 18).
Chronic ethanol exposure had an opposite effect on some positive acute
phase proteins: heptoglobin (HP), hemopexin (HPX), hepcidin antimicrobial
peptide (HAMP), complement C4 binding protein (C4BPA) decreased in
expression. Decrease in the expression of C4BPA and HAMP proteins with
ethanol was observed in other studies (Bykov et al., 2007; Ohtake et al., 2007).
Recent evidence suggests that the decrease in the expression of hepcidin
antimicrobial peptide along with the increase in the expression of ferritin probably

139
leads to the iron overload (Chick et al., 1987; Ohtake et al., 2007). In our chronic
alcohol exposure model HAMP and ferritin light chain (FTL) were changed by -
1.41- and 1.29-fold, respectively (Table 13). Similar observations were made in
the serum levels of ferritin and hepcidin antimicrobial peptide in alcoholics (Chick
et al., 1987; Ohtake et al., 2007). Reactive oxygen species, possibly from
parenchymal and non-parenchymal cells, have been implicated in the
downregulation of hepcidin expression (Harrison-Findik et al., 2006). In a mouse
model this effect was shown to be independent of Kupffer cells (Harrison-Findik
et al., 2009). Similar findings in our model system indicate that oxidative stress
generated in hepatocytes could be sufficient to change the expression of
hepcidin. Therefore, these results indicate that chronic alcohol exposure
modulates the receptivity of hepatocytes to the acute phase response, and also
the expression of acute phase reactant proteins.
3.b. Nrf2 oxidative stress response pathway
Alcohol metabolism generates reactive oxygen species and creates a
state of oxidative stress in hepatocytes (Albano, 2006; Bailey et al., 1999; Wu
and Cederbaum, 2009). In response to oxidative stress, the transcription factor
Nuclear factor-eythroid 2-related factor 2 (Nrf2) regulates expression of multiple
genes involved in antioxidant defenses (Itoh et al., 1997; McMahon et al., 2001).
Increase in the levels of Nrf2 transcript and protein were observed in animal
livers and HepG2 cells expressing CYP2E1 and exposed to alcohol (Gong and
Cederbaum, 2006). Deletion of Nrf2 in mice was shown to aggravate alcohol

140
induced liver damage (Lamle et al., 2008). In our data we did not observe an
increase in the expression of Nrf2. However, many Nrf2 transcribed genes were
differentially expressed. This could be due to the activation of Nrf2 instead of an
increase in the levels of expression. Under non stress conditions, kelchlike ECH-
associated protein 1 (Keap1) sequesters Nrf2 and targets it for ubiquitination.
When there is oxidative stress, Keap1 dissociates from Nf2, leading to a
functional Nrf2 (Itoh et al., 1999; Itoh et al., 2003).
One of the Nrf2 transcribed genes that was affected by chronic alcohol
exposure is the catalytic subunit (GCLC) of the glutamate cysteine ligase (GCL).
This enzyme carries out the rate-limiting step of glutathione (GSH) synthesis (Lu,
1999). With chronic ethanol exposure there was a 20% increase in the
expression of the enzyme. This increase in expression was also confirmed by
qRT-PCR (Figure 18). In addition to GCL activity, the synthesis of GSH is also
regulated by the availability of cysteine (Lu, 1999). SLC7A11, one of the subunits
of amino acid transport system χc- involved in the uptake of cystine (Bannai,
1986), was differentially expressed (1.54-fold). Although it is not an Nrf2
transcribed gene, the increase in SLC7A11 could be an additional response of
the cell to maintain the cellular GSH levels.
Ethanol also affected other Nrf2 transcribed antioxidant enzymes:
glutathione s-transferase alpha 4 (GSTA4), glutathione peroxidase 2 (GPX2),
superoxide dismutase 1 (SOD1), thioredoxin reductase 2 (TXNRD2) increased in
expression. Multiple genes belonging to the DNAJ/Hsp40 family of chaperone
proteins were upregulated with ethanol. DNAJ members stimulate the ATP
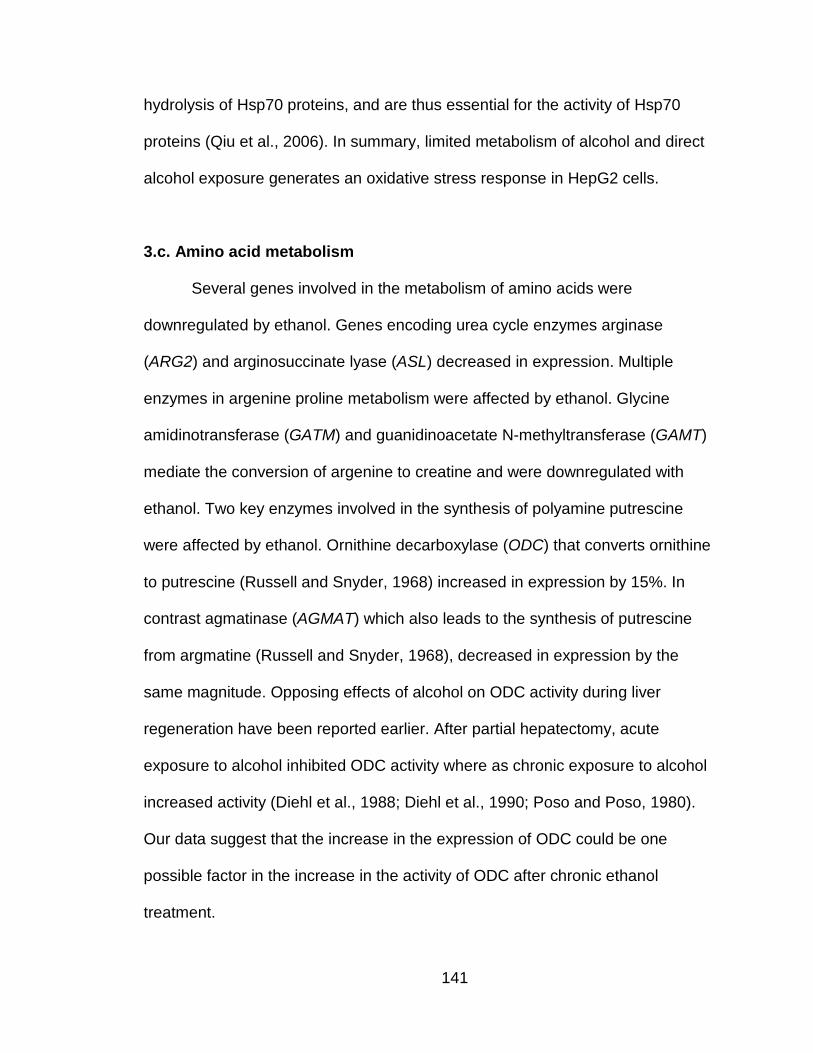
141
hydrolysis of Hsp70 proteins, and are thus essential for the activity of Hsp70
proteins (Qiu et al., 2006). In summary, limited metabolism of alcohol and direct
alcohol exposure generates an oxidative stress response in HepG2 cells.
3.c. Amino acid metabolism
Several genes involved in the metabolism of amino acids were
downregulated by ethanol. Genes encoding urea cycle enzymes arginase
(ARG2) and arginosuccinate lyase (ASL) decreased in expression. Multiple
enzymes in argenine proline metabolism were affected by ethanol. Glycine
amidinotransferase (GATM) and guanidinoacetate N-methyltransferase (GAMT)
mediate the conversion of argenine to creatine and were downregulated with
ethanol. Two key enzymes involved in the synthesis of polyamine putrescine
were affected by ethanol. Ornithine decarboxylase (ODC) that converts ornithine
to putrescine (Russell and Snyder, 1968) increased in expression by 15%. In
contrast agmatinase (AGMAT) which also leads to the synthesis of putrescine
from argmatine (Russell and Snyder, 1968), decreased in expression by the
same magnitude. Opposing effects of alcohol on ODC activity during liver
regeneration have been reported earlier. After partial hepatectomy, acute
exposure to alcohol inhibited ODC activity where as chronic exposure to alcohol
increased activity (Diehl et al., 1988; Diehl et al., 1990; Poso and Poso, 1980).
Our data suggest that the increase in the expression of ODC could be one
possible factor in the increase in the activity of ODC after chronic ethanol
treatment.

142
Two enzymes involved in methionine metabolism were also affected by
ethanol. An increase in expression was observed for Betaine-homocysteine
methyltransferases (BHMT, BHMT2) which carry out the folate independent
conversion of homocysteine to methionine (Finkelstein and Martin, 1984). For
BHMT the array data was validated by qRT-PCR. Another pathway of
homocysteine catabolism is transsulfuration of homocysteine to cystathione and
is catalyzed by cystathionine β-synthase (CBS) (Finkelstein and Mudd, 1967). In
our data CBS was downregulated by a modest 12%. This increase in the
expression of BHMTs and decrease in CBS expression could be an adaptive
response to maintain the levels of essential amino acid methionine in the cells. In
addition to being a part of proteins, methionine also acts as a precursor to methyl
group donor, S-adenosyl methionine (SAM). SAM acts as a methyl-group donor
for methyltransferase-catalyzed reactions.
3.d. Carbohydrate metabolism
Effects of alcohol on the activity of enzymes involved in carbohydrate
metabolism have been recognized for many years. Alcohol alters NADH/NAD+
ratio and this affects the activity of many enzymes in glycolysis, citrate cycle. In
our data we saw a decrease in the expression of many genes involved in
carbohydrate metabolism (Badawy, 1977). Two key regulatory proteins in the
glycolytic pathway, hexokinase (HK2) and phosphofructokinase (PFKL) were
decreased in expression due to ethanol treatment. The ethanol induced change
in HK2 expression was validated by qRT-PCR (Figure 18). TCA cycle enzyme,
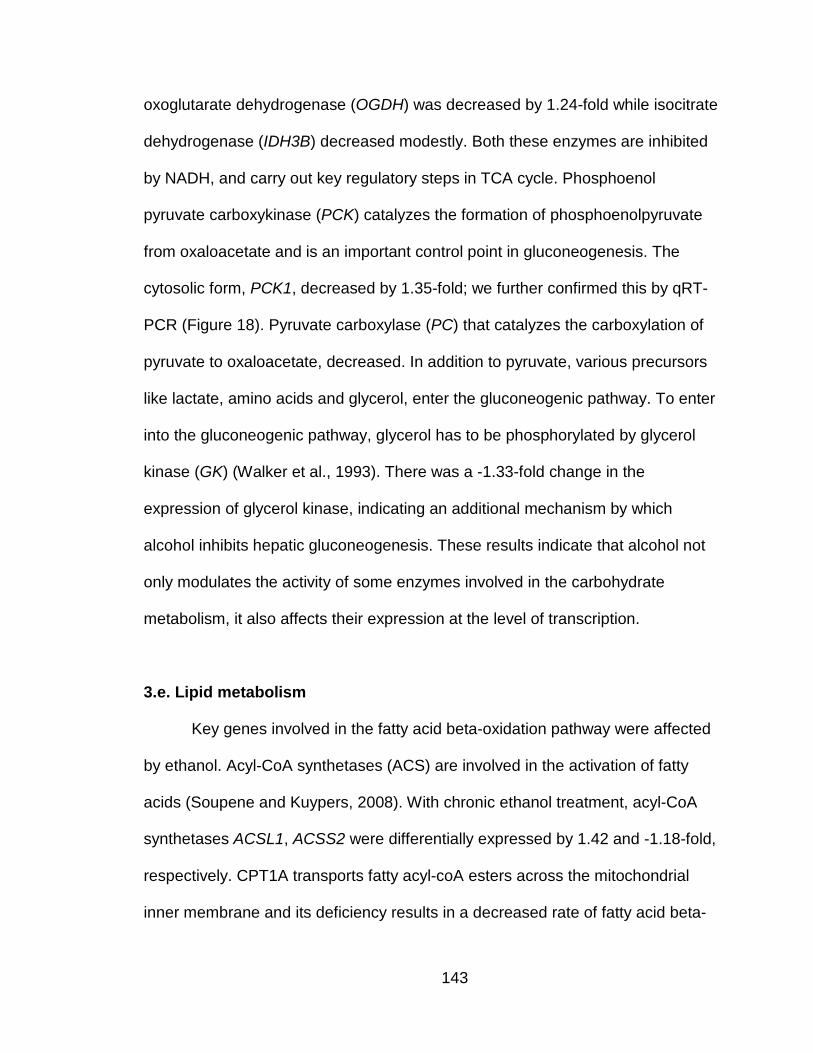
143
oxoglutarate dehydrogenase (OGDH) was decreased by 1.24-fold while isocitrate
dehydrogenase (IDH3B) decreased modestly. Both these enzymes are inhibited
by NADH, and carry out key regulatory steps in TCA cycle. Phosphoenol
pyruvate carboxykinase (PCK) catalyzes the formation of phosphoenolpyruvate
from oxaloacetate and is an important control point in gluconeogenesis. The
cytosolic form, PCK1, decreased by 1.35-fold; we further confirmed this by qRT-
PCR (Figure 18). Pyruvate carboxylase (PC) that catalyzes the carboxylation of
pyruvate to oxaloacetate, decreased. In addition to pyruvate, various precursors
like lactate, amino acids and glycerol, enter the gluconeogenic pathway. To enter
into the gluconeogenic pathway, glycerol has to be phosphorylated by glycerol
kinase (GK) (Walker et al., 1993). There was a -1.33-fold change in the
expression of glycerol kinase, indicating an additional mechanism by which
alcohol inhibits hepatic gluconeogenesis. These results indicate that alcohol not
only modulates the activity of some enzymes involved in the carbohydrate
metabolism, it also affects their expression at the level of transcription.
3.e. Lipid metabolism
Key genes involved in the fatty acid beta-oxidation pathway were affected
by ethanol. Acyl-CoA synthetases (ACS) are involved in the activation of fatty
acids (Soupene and Kuypers, 2008). With chronic ethanol treatment, acyl-CoA
synthetases ACSL1, ACSS2 were differentially expressed by 1.42 and -1.18-fold,
respectively. CPT1A transports fatty acyl-coA esters across the mitochondrial
inner membrane and its deficiency results in a decreased rate of fatty acid beta-
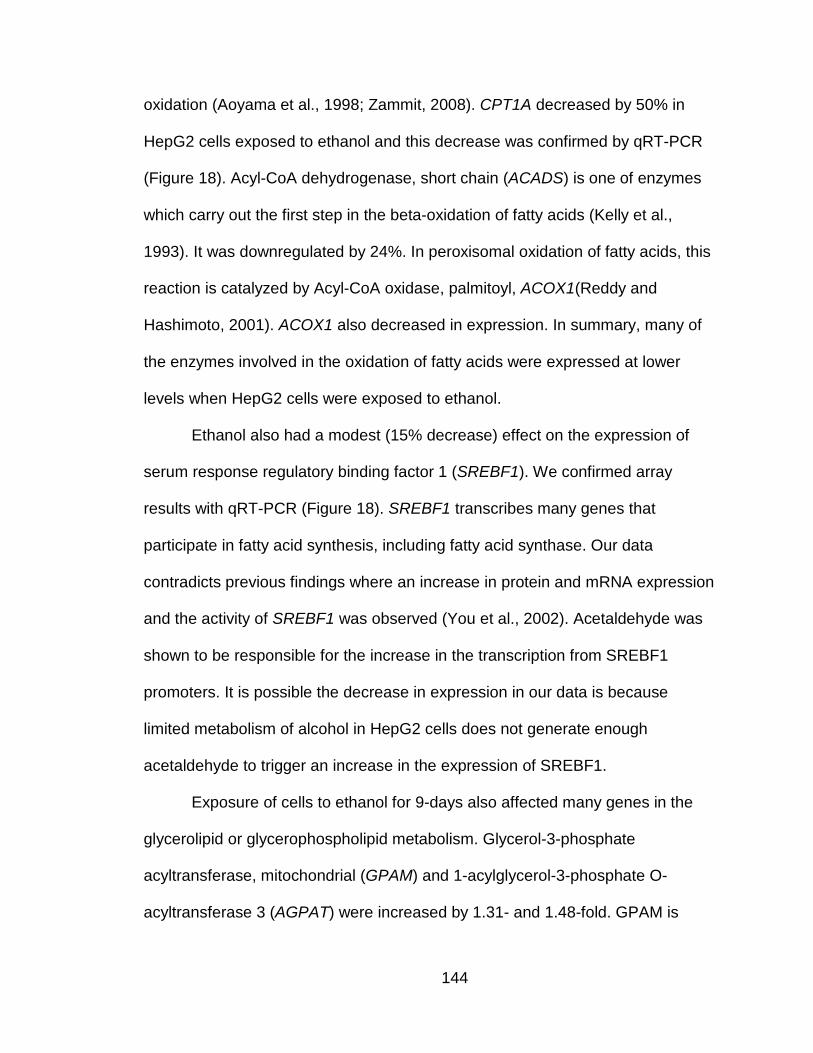
144
oxidation (Aoyama et al., 1998; Zammit, 2008). CPT1A decreased by 50% in
HepG2 cells exposed to ethanol and this decrease was confirmed by qRT-PCR
(Figure 18). Acyl-CoA dehydrogenase, short chain (ACADS) is one of enzymes
which carry out the first step in the beta-oxidation of fatty acids (Kelly et al.,
1993). It was downregulated by 24%. In peroxisomal oxidation of fatty acids, this
reaction is catalyzed by Acyl-CoA oxidase, palmitoyl, ACOX1(Reddy and
Hashimoto, 2001). ACOX1 also decreased in expression. In summary, many of
the enzymes involved in the oxidation of fatty acids were expressed at lower
levels when HepG2 cells were exposed to ethanol.
Ethanol also had a modest (15% decrease) effect on the expression of
serum response regulatory binding factor 1 (SREBF1). We confirmed array
results with qRT-PCR (Figure 18). SREBF1 transcribes many genes that
participate in fatty acid synthesis, including fatty acid synthase. Our data
contradicts previous findings where an increase in protein and mRNA expression
and the activity of SREBF1 was observed (You et al., 2002). Acetaldehyde was
shown to be responsible for the increase in the transcription from SREBF1
promoters. It is possible the decrease in expression in our data is because
limited metabolism of alcohol in HepG2 cells does not generate enough
acetaldehyde to trigger an increase in the expression of SREBF1.
Exposure of cells to ethanol for 9-days also affected many genes in the
glycerolipid or glycerophospholipid metabolism. Glycerol-3-phosphate
acyltransferase, mitochondrial (GPAM) and 1-acylglycerol-3-phosphate O-
acyltransferase 3 (AGPAT) were increased by 1.31- and 1.48-fold. GPAM is
145
involved in the first step of de novo synthesis of triglycerides and
glycerophospholipids (Dircks and Sul, 1997). Overexpression of this protein in
mice was shown to increase serum and liver triglycerides, while decreasing fatty
acid β-oxidation and steatosis (Linden et al., 2006). AGPAT3 belongs to the
family of lysophosphotaide acyl transferases that are involved in acylation of
glycerol-3-phosphate to 1-acyl glycerol-3-phsphate. AGPAT3 is localized to the
golgi membrane and over expression of this protein inhibits the formation of Golgi
membrane tubules and protein trafficking (Schmidt and Brown, 2009).
Lipins are 1, 2-diacylglycerol-3-phosphate (phosphatidate) phosphatases.
Lipin 1 (LPIN1) increased in expression whereas LIPN2 decreased with ethanol.
Both are expressed in the liver (Donkor et al., 2007). In addition to phosphatase
activity, LIPN1 also has transcriptional coactivator activity (Finck et al., 2006). It
associates with PPARα and PPARγ coactivator-1α and modulates the
expression of many enzymes involved in fatty acid oxidation and synthesis.
In summary, genes encoding multiple enzymes involved in fatty acid
metabolism and triglyceride synthesis were affected upon chronic alcohol
exposure. These effects could partly explain the development of alcohol induced
fatty liver. Action of ethanol on LIPN1 could be a new mechanism by which
alcohol affects fatty acid metabolism in the liver. By affecting proteins like
AGPAT3 which regulates golgi membrane, alcohol could lead to more cellular
damage.

146
3.f. Genes involved in chromatin regulation
Recent studies indicate that ethanol affects epigenetic modifications of
histones and DNA (Bonsch et al., 2006; Bonsch et al., 2004; Lee and Shukla,
2007; Park et al., 2005; Shukla and Aroor, 2006). In HepG2 cells cultured in
ethanol for 9 days, a 1.25-fold increase in the expression of DNMT3B, one of the
de novo DNA methyl transferases, was observed. A similar increase (1.31-fold)
of DNMT3B expression was observed in validation assays. In addition to
DNMT3, methyl-CpG binding domain protein 5 (MBD5) expression was also
increased by 43%. The MBD family of proteins binds to methylated CpG regions
in the DNA leading to transcriptional repression.
Effects of alcohol on DNA methylation are controversial. A 40% decrease
in global DNA methylation was reported in the livers of rats fed ethanol for 9-
weeks (Lu et al., 2000). In chronic alcoholics, however, a hypermethylation of
DNA in peripheral blood cells with a decrease in the expression of DNMT3B was
reported (Bonsch et al., 2006; Bonsch et al., 2004). In our experiment with
HepG2 cells, global DNA methylation levels were not measured.
Genes encoding histone deacetylases and histone acetylases were
affected by ethanol exposure. HDAC5, HDAC6 and HDAC11 decreased in
expression. Histone acetylase MYST4 increased in expression by 20% where as
MYST1 decreased modestly (11%). HDAC5 (Zhang et al., 2002) and HDAC11
(Villagra et al., 2009) proteins are involved in the regulation of transcription, while
HDAC6 is a cytoplasmic protein associated with microtubules (Zhang et al.,
2008b).

147
In a study that examined the acute effects of alcohol on histone
modifications in isolated rat hepatocytes and rat liver, ethanol was shown to
increase the acetylation of histone 3 (H3), lysine 9 (K9) acetylation (Park et al.,
2005). As acetylation of histones is regulated by histone acetylases and
deacetylases, it is possible that this effect is brought about by modulating the
expression of histone deacetylases and acetylases as was observed in our data.
3.g. Genes associated with alcoholism
Alcoholism is a genetic disorder and multiple genes have been associated
with this disease. Forty four genes that were differentially expressed in our data
have been previously associated with alcoholism in humans (Bierut et al., 2010;
Edenberg and Foroud, 2006; Hill et al., 2004; Kalsi et al., 2009). Some of these
genes, including Insulin-like growth factor 1 receptor (IGF1R), Cholinergic
receptor, nicotinic, alpha 5 (CHRNA5), 5-hydroxytryptamine (serotonin) receptor
3B (HTR3B) play a role in alcohol induced liver injury in the liver, or act as
receptors in the brain. We confirmed the effect on expression of HTR3B by qRT-
PCR (Figure 18). Knowledge that ethanol affects the transcription of the genes
associated with the disease provides mechanistic insight into why these genes
are associated with the disease.
4. Effects of alcohol on alternative splicing
Recently it has been predicted that 92 to 94% of genes in the human
genome encode alternative isoforms (Wang et al., 2008) and there is increasing
148
evidence that alternative isoforms could lead to disease (Garcia-Blanco et al.,
2004; Orengo and Cooper, 2007). For the first time, the effects of chronic ethanol
exposure on alternative isoforms were explored in this study using Affymetrix
human Exon arrays. Due to the inherent difficulties associated with exon array
data analysis, a stringent FDR was used. Resulting genes were also visually
inspected to identify true alternative splicing events. Only 31% of the genes that
passed a 3% FDR filter were probably alternatively spliced. One of the main
causes for many probably not alternatively spliced are the 5’ and 3’ edge effects
that were observed in most of the genes. There was a decrease in the
expression of 5’ probe set with ethanol whereas there was an increase in the
expression of 3’ probe set. Bemmo et al. (2008) reported that probe sets at the 5’
and 3’ ends of the transcript behave differently and termed this “edge bias.” They
attributed the 5’ effects to high GC content at the 5’ end of the transcript and the
3’ effects could be due to the random amplification protocol. Whistler et al. (2010)
reported that approximately 75% of false positives are due to this edge bias
effect (Whistler et al., 2010). Other reasons for false positives include saturated
or non-responsive probe sets (Bemmo et al., 2008; Whistler et al., 2010).
In validation studies, four genes were tested. Three of the tested events
appeared to be cassette exons, whereas one was an alternative promoter. Of the
three cassette exons, only two (BPGM and CD55) were confirmed to be
alternatively spliced. For BPGM the decrease in the expression of the test exon
was confirmed by qRT-PCR assays. For CD55, although a decrease in the
expression of the test exon was observed, a similar decrease in the remaining

149
part of the transcript was also observed. This observation suggests that this is
not a true ethanol affected differential alternative splicing. However, the fraction
of the transcript with the test exon in the RNA was very small (as indicated by the
density of the band in Figure 21). It is possible that the assays carried out are not
sensitive to detect a 40% fold change at low concentrations of the transcript.
Another gene that was validated for differential alternative splicing was
MBD5. In MBD5, probe sets in one half of the transcripts were increased in
expression by 1.3-fold and probe sets in the second half of the transcript were
increased approximately by 2-fold. Although no alternative isoforms are reported
in the Refseq database, a shorter isoform is reported in the UCSC gene track.
The expression of shorter isoform (2.5 kb) was increased by 2.1-fold upon
ethanol treatment. This was validated by qRT-PCR assay. Not much is known
about the function of this protein. A haploinsufficiency in this gene was reported
to be the cause of a 2q23.1 microdeletion syndrome that leads to intellectual
disabilities, seizures and speech impairment (Williams et al., 2010). Interestingly,
the short isoform lacks the 70 amino acid methyl binding domain that is present
in all MBD proteins. So, further studies are required to understand the function of
short form of the transcript.
BPGM encoded 2,3-Bisphophoglycero mutase enzyme catalyzes both the
synthesis and degradation of 2,3-diphosphoglycerate (2,3-DPG), which
modulates the affinity of hemoglobin to oxygen (Joulin et al., 1988). The function
of the alternative forms of this protein is not known. BPGM is mainly expressed in
150
erythrocytes. It will be interesting to study if chronic alcohol exposure has the
same effect on BPGM alternative splicing in erythrocytes.
In summary, identification of differential alternative splicing due to alcohol
exposure is very complicated. It requires a great deal of manual analysis of the
data and validation studies to identify true differential alternative isoforms.
5. Future directions
As part of this dissertation multiple cis-regulatory regions in the 360 kb
ADH cluster have been identified. In this study 4E3, a strong distal enhancer of
ADH4 was identified. All experiments were carried out by transient transfections
in human hepatocyte-like cells. Transient transfection assays cannot duplicate
the full regulatory complexity present in vivo, including additional cis-regulatory
regions and the complexity of chromatin structure. Future studies could study this
region in an animal model. A transgenic mouse model of human ADH4 can be
generated by integrating a bacterial artificial chromosome (BAC) carrying human
ADH4 along with its neighboring non-coding sequences into mouse genome. The
animal model can be used to answer many questions regarding the function of
4E3. The magnitude of enhancer activity of 4E3 along with its contribution to
tissue specificity in all tissues can be determined. The mechanism of activation
can also be examined. If FOXA mediated physical interaction of the promoter
and enhancer and DNA looping occurs, it can be identified using chromosome
conformation capture technique (3C) (Dekker et al., 2002). 3C technique involves
formaldehyde crosslinking of interacting chromatin regions, restriction digestion,

151
intermolecular ligation and subsequent PCR. If FOXA proteins function as
pioneer factors at 4E3 enhancer in the embryonic stage, chromatin
immunoprecipitation technique can be used to investigate chromatin profile
before and after activation.
The most interesting question that arises with genes that are present in a
cluster in genome is whether they are regulated by a locus control region (LCR).
By definition, LCRs are regulatory regions that regulate the expression of multiple
genes in a cluster. It will be interesting to study the role of 4E3 on regulation of
other ADH genes in the cluster. This also can be studied in an animal model if
other ADH genes are included in the BAC.
The function of negative regulatory regions identified in this study in cells
other than hepatic cells has not been explored. It is possible that these could play
a greater functional role in non-liver tissues. Tissue specificity of these regions
can be studied in non-hepatic cells or in an animal model.
Variations play an important role in the risk for alcoholism. Two variations
in the 4E3 enhancer were observed to affect the enhancer activity. These could
play a significant role in alcoholism. Therefore, association studies have to be
carried out to determine their affect on the risk for alcoholism.
In our study of the effects of chronic ethanol treatment of HepG2 cells, we
observed many hallmark effects of alcohol on gene expression along with some
new effects. Because these cells are acting as a good model system for alcohol
effects, it is possible to further explore other effects of alcohol. Effects of alcohol
on global methylation can be studied using chromatin immunoprecipitation with

152
anti-methyl cytosine antibody combined with high throughput techniques like
sequencing or microarrays. Effects of alcohol on histone modifications can also
be studied in a similar approach.
To identify effects of alcohol on alternative isoforms an alternative
approach like RNA-sequencing (RNA-seq) can be employed. RNA-seq data
allow detection of alternative isoforms using the reads at the splicing junctions.
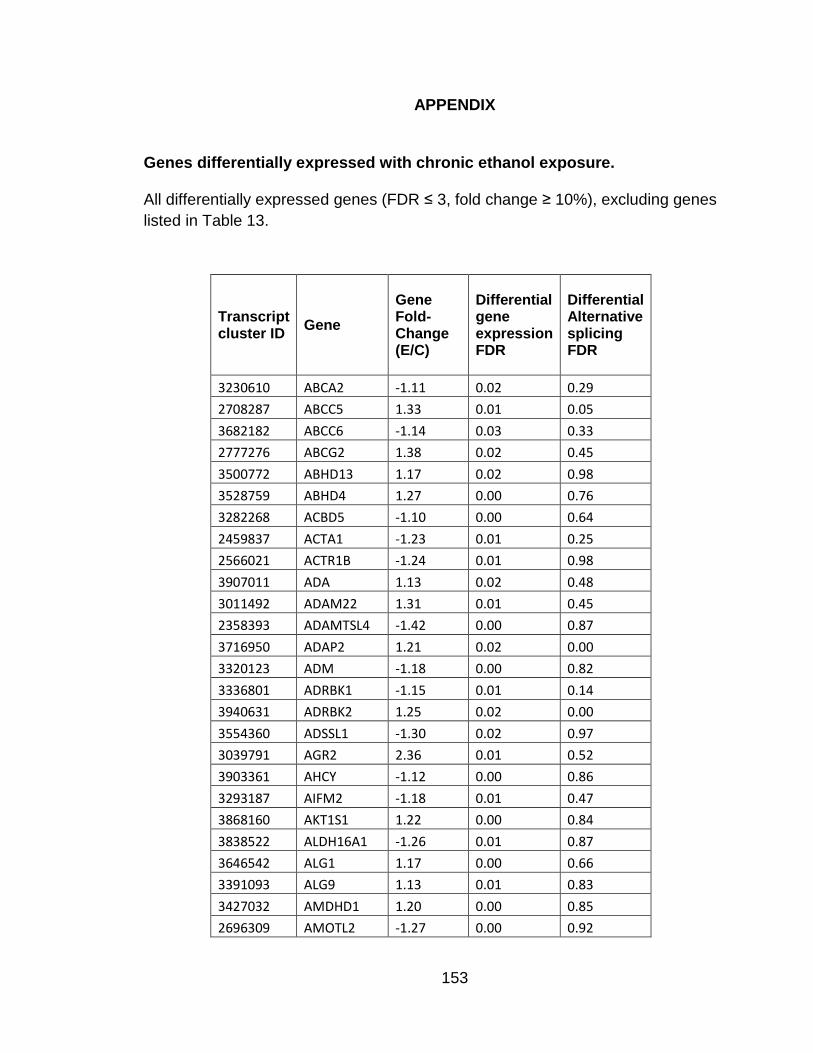
153
APPENDIX
Genes differentially expressed with chronic ethanol exposure.
All differentially expressed genes (FDR ≤ 3, fold change ≥ 10%), excluding genes listed in Table 13.
Transcript cluster ID Gene
Gene Fold-Change (E/C)
Differential gene expression FDR
Differential Alternative splicing FDR
3230610 ABCA2 -1.11 0.02 0.29 2708287 ABCC5 1.33 0.01 0.05 3682182 ABCC6 -1.14 0.03 0.33 2777276 ABCG2 1.38 0.02 0.45 3500772 ABHD13 1.17 0.02 0.98 3528759 ABHD4 1.27 0.00 0.76 3282268 ACBD5 -1.10 0.00 0.64 2459837 ACTA1 -1.23 0.01 0.25 2566021 ACTR1B -1.24 0.01 0.98 3907011 ADA 1.13 0.02 0.48 3011492 ADAM22 1.31 0.01 0.45 2358393 ADAMTSL4 -1.42 0.00 0.87 3716950 ADAP2 1.21 0.02 0.00 3320123 ADM -1.18 0.00 0.82 3336801 ADRBK1 -1.15 0.01 0.14 3940631 ADRBK2 1.25 0.02 0.00 3554360 ADSSL1 -1.30 0.02 0.97 3039791 AGR2 2.36 0.01 0.52 3903361 AHCY -1.12 0.00 0.86 3293187 AIFM2 -1.18 0.01 0.47 3868160 AKT1S1 1.22 0.00 0.84 3838522 ALDH16A1 -1.26 0.01 0.87 3646542 ALG1 1.17 0.00 0.66 3391093 ALG9 1.13 0.01 0.83 3427032 AMDHD1 1.20 0.00 0.85 2696309 AMOTL2 -1.27 0.00 0.92

154
Transcript cluster ID Gene
Gene Fold-Change (E/C)
Differential gene expression FDR
Differential Alternative splicing FDR
2445982 ANGPTL1 1.58 0.02 0.93 3299970 ANKRD1 -1.58 0.00 0.41 3704717 ANKRD11 1.17 0.02 0.01 2754673 ANKRD37 -1.27 0.01 0.98 3651672 ANKS4B -1.22 0.01 0.92 2487082 ANTXR1 1.35 0.00 0.00 2487412 ANXA4 -1.35 0.01 0.39 3295032 AP3M1 1.12 0.01 0.09 3015241 AP4M1 -1.24 0.01 0.44 2766893 APBB2 1.15 0.01 0.33 2622196 APEH -1.20 0.03 0.62 3356115 APLP2 1.10 0.02 0.07 3945572 APOBEC3C -1.31 0.01 0.85 3945614 APOBEC3F -1.32 0.00 0.85 3469319 APPL2 1.15 0.01 0.10 3203569 AQP3 -1.30 0.02 0.56 3022409 ARF5 -1.15 0.03 0.96 3371928 ARFGAP2 -1.11 0.02 0.21 2746693 ARHGAP10 1.50 0.01 0.13 3289189 ASAH2 1.68 0.00 0.04 3743371 ASGR1 -1.17 0.01 0.13 3137530 ASPH 1.16 0.02 0.01 2315951 ATAD3A -1.20 0.02 0.91 2726072 ATP10D 1.54 0.01 0.34 3464983 ATP2B1 1.16 0.02 0.07 3863087 ATP5SL -1.12 0.02 0.71 3974556 ATP6AP2 1.16 0.02 0.25 3514736 ATP7B 1.12 0.01 0.06 3834046 AXL -1.18 0.00 0.13 2669930 AXUD1 -1.16 0.02 0.75 3908963 B4GALT5 1.11 0.02 0.07 3803120 B4GALT6 1.42 0.01 0.11 3240452 BAMBI 1.28 0.01 0.02 3910360 BCAS1 1.29 0.00 0.34 3447694 BCAT1 1.13 0.03 0.11

155
Transcript cluster ID Gene
Gene Fold-Change (E/C)
Differential gene expression FDR
Differential Alternative splicing FDR
3656829 BCKDK -1.23 0.01 0.88 2713382 BDH1 -1.25 0.02 0.93 2608725 BHLHE40 -1.37 0.00 0.99 3346548 BIRC3 1.67 0.03 0.43 3882190 BPIL1 1.14 0.01 0.94 2903343 BRD2 1.10 0.01 0.22 3436544 BRI3BP 1.16 0.02 0.59 2375664 BTG2 1.18 0.02 0.04 2899340 BTN2A2 1.26 0.02 0.97 2899413 BTN3A3 1.25 0.01 0.85 3286776 C10orf10 -1.30 0.00 0.47 3252690 C10orf11 1.25 0.02 0.19 3308378 C10orf82 1.20 0.01 0.45 3334847 C11orf2 -1.27 0.01 0.99 3393834 C11orf60 1.42 0.01 0.02 3396144 C11orf61 1.23 0.02 0.13 3332938 C11orf79 1.13 0.02 0.42 3474787 C12orf27 1.27 0.02 0.53 3410384 C12orf35 1.39 0.02 0.71 3472000 C12orf51 1.19 0.03 0.39 3572461 C14orf1 1.16 0.01 0.31 3578069 C14orf139 1.40 0.01 0.21 3573933 C14orf145 1.53 0.03 0.07 3573994 C14orf145 1.28 0.01 0.66 3578089 C14orf49 1.17 0.00 0.46 3588658 C15orf41 1.15 0.01 0.00 3652271 C16orf52 1.18 0.01 0.19 3688424 C16orf58 -1.17 0.00 0.60 3678542 C16orf89 1.33 0.02 0.26 3744324 C17orf68 -1.15 0.02 0.47 3864597 C19orf61 1.21 0.01 0.99 3820310 C19orf66 -1.17 0.01 0.47 2437273 C1orf2 1.15 0.02 0.01 2361697 C1orf66 -1.22 0.01 0.38 2359736 C1orf77 -1.11 0.02 0.99
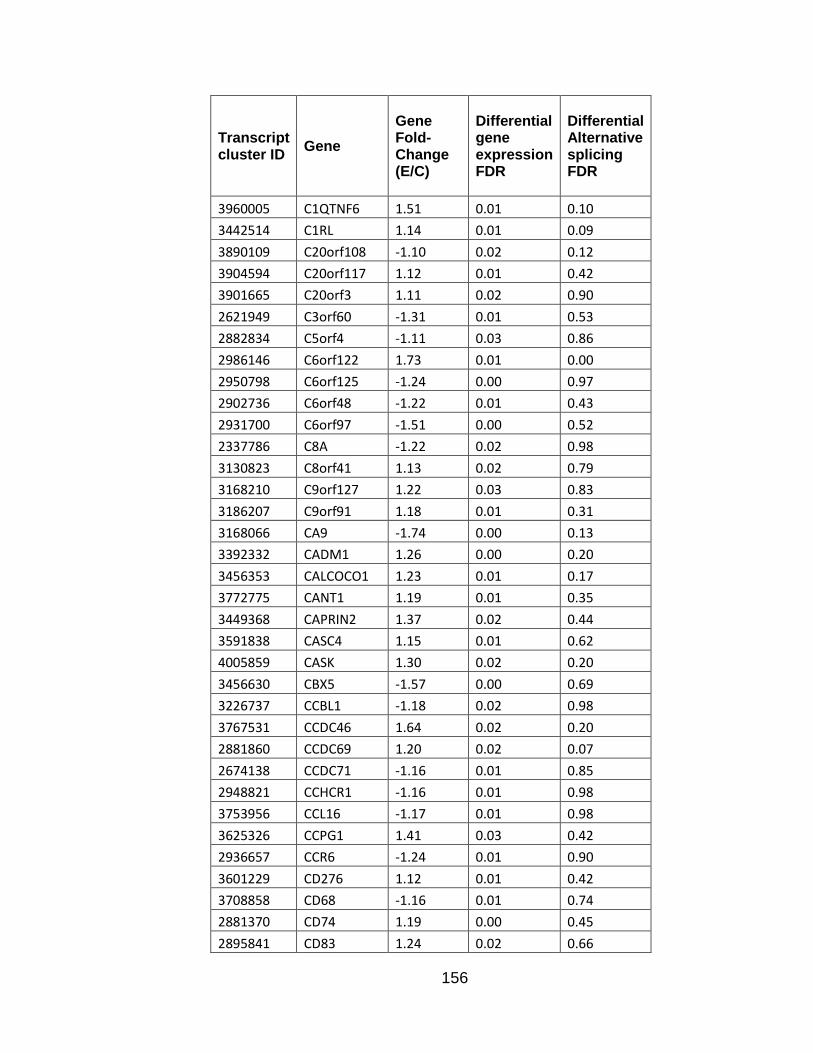
156
Transcript cluster ID Gene
Gene Fold-Change (E/C)
Differential gene expression FDR
Differential Alternative splicing FDR
3960005 C1QTNF6 1.51 0.01 0.10 3442514 C1RL 1.14 0.01 0.09 3890109 C20orf108 -1.10 0.02 0.12 3904594 C20orf117 1.12 0.01 0.42 3901665 C20orf3 1.11 0.02 0.90 2621949 C3orf60 -1.31 0.01 0.53 2882834 C5orf4 -1.11 0.03 0.86 2986146 C6orf122 1.73 0.01 0.00 2950798 C6orf125 -1.24 0.00 0.97 2902736 C6orf48 -1.22 0.01 0.43 2931700 C6orf97 -1.51 0.00 0.52 2337786 C8A -1.22 0.02 0.98 3130823 C8orf41 1.13 0.02 0.79 3168210 C9orf127 1.22 0.03 0.83 3186207 C9orf91 1.18 0.01 0.31 3168066 CA9 -1.74 0.00 0.13 3392332 CADM1 1.26 0.00 0.20 3456353 CALCOCO1 1.23 0.01 0.17 3772775 CANT1 1.19 0.01 0.35 3449368 CAPRIN2 1.37 0.02 0.44 3591838 CASC4 1.15 0.01 0.62 4005859 CASK 1.30 0.02 0.20 3456630 CBX5 -1.57 0.00 0.69 3226737 CCBL1 -1.18 0.02 0.98 3767531 CCDC46 1.64 0.02 0.20 2881860 CCDC69 1.20 0.02 0.07 2674138 CCDC71 -1.16 0.01 0.85 2948821 CCHCR1 -1.16 0.01 0.98 3753956 CCL16 -1.17 0.01 0.98 3625326 CCPG1 1.41 0.03 0.42 2936657 CCR6 -1.24 0.01 0.90 3601229 CD276 1.12 0.01 0.42 3708858 CD68 -1.16 0.01 0.74 2881370 CD74 1.19 0.00 0.45 2895841 CD83 1.24 0.02 0.66
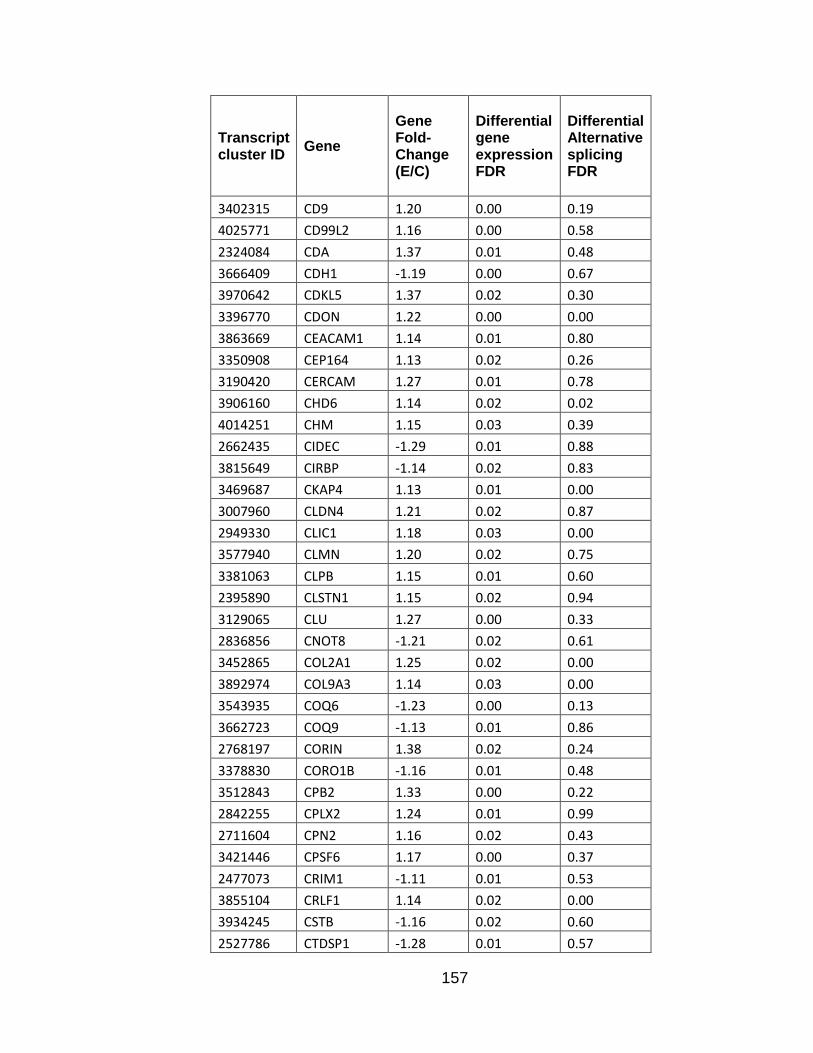
157
Transcript cluster ID Gene
Gene Fold-Change (E/C)
Differential gene expression FDR
Differential Alternative splicing FDR
3402315 CD9 1.20 0.00 0.19 4025771 CD99L2 1.16 0.00 0.58 2324084 CDA 1.37 0.01 0.48 3666409 CDH1 -1.19 0.00 0.67 3970642 CDKL5 1.37 0.02 0.30 3396770 CDON 1.22 0.00 0.00 3863669 CEACAM1 1.14 0.01 0.80 3350908 CEP164 1.13 0.02 0.26 3190420 CERCAM 1.27 0.01 0.78 3906160 CHD6 1.14 0.02 0.02 4014251 CHM 1.15 0.03 0.39 2662435 CIDEC -1.29 0.01 0.88 3815649 CIRBP -1.14 0.02 0.83 3469687 CKAP4 1.13 0.01 0.00 3007960 CLDN4 1.21 0.02 0.87 2949330 CLIC1 1.18 0.03 0.00 3577940 CLMN 1.20 0.02 0.75 3381063 CLPB 1.15 0.01 0.60 2395890 CLSTN1 1.15 0.02 0.94 3129065 CLU 1.27 0.00 0.33 2836856 CNOT8 -1.21 0.02 0.61 3452865 COL2A1 1.25 0.02 0.00 3892974 COL9A3 1.14 0.03 0.00 3543935 COQ6 -1.23 0.00 0.13 3662723 COQ9 -1.13 0.01 0.86 2768197 CORIN 1.38 0.02 0.24 3378830 CORO1B -1.16 0.01 0.48 3512843 CPB2 1.33 0.00 0.22 2842255 CPLX2 1.24 0.01 0.99 2711604 CPN2 1.16 0.02 0.43 3421446 CPSF6 1.17 0.00 0.37 2477073 CRIM1 -1.11 0.01 0.53 3855104 CRLF1 1.14 0.02 0.00 3934245 CSTB -1.16 0.02 0.60 2527786 CTDSP1 -1.28 0.01 0.57
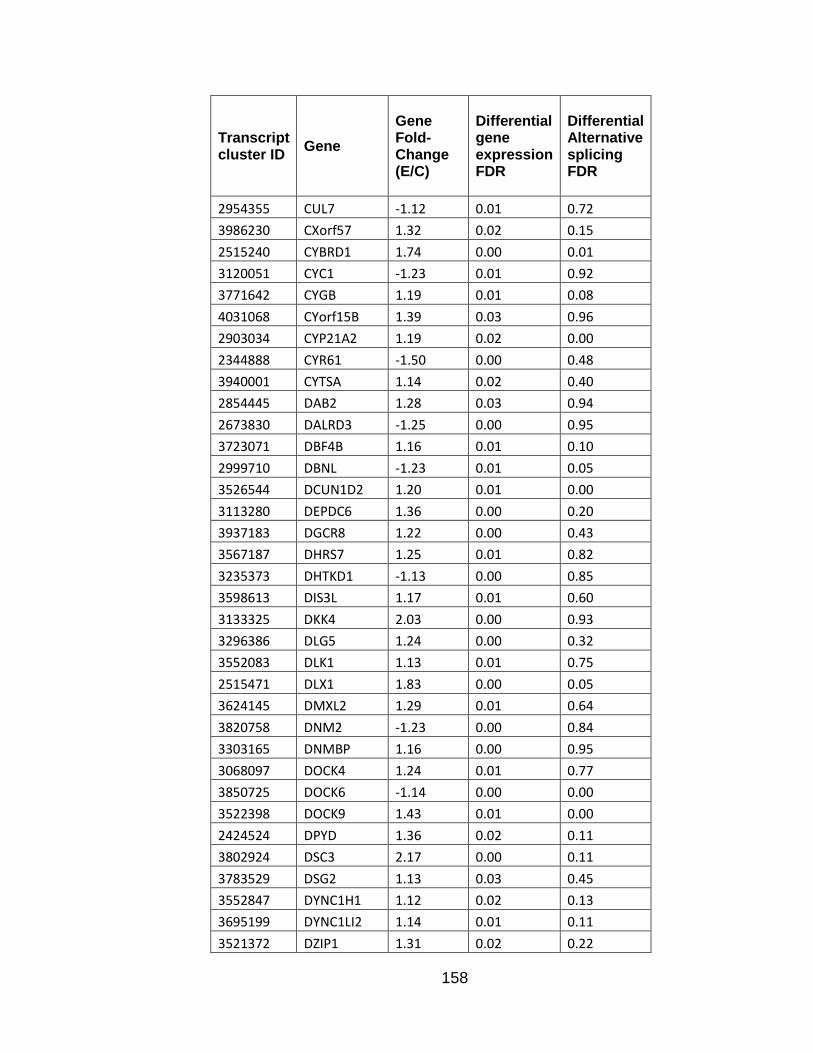
158
Transcript cluster ID Gene
Gene Fold-Change (E/C)
Differential gene expression FDR
Differential Alternative splicing FDR
2954355 CUL7 -1.12 0.01 0.72 3986230 CXorf57 1.32 0.02 0.15 2515240 CYBRD1 1.74 0.00 0.01 3120051 CYC1 -1.23 0.01 0.92 3771642 CYGB 1.19 0.01 0.08 4031068 CYorf15B 1.39 0.03 0.96 2903034 CYP21A2 1.19 0.02 0.00 2344888 CYR61 -1.50 0.00 0.48 3940001 CYTSA 1.14 0.02 0.40 2854445 DAB2 1.28 0.03 0.94 2673830 DALRD3 -1.25 0.00 0.95 3723071 DBF4B 1.16 0.01 0.10 2999710 DBNL -1.23 0.01 0.05 3526544 DCUN1D2 1.20 0.01 0.00 3113280 DEPDC6 1.36 0.00 0.20 3937183 DGCR8 1.22 0.00 0.43 3567187 DHRS7 1.25 0.01 0.82 3235373 DHTKD1 -1.13 0.00 0.85 3598613 DIS3L 1.17 0.01 0.60 3133325 DKK4 2.03 0.00 0.93 3296386 DLG5 1.24 0.00 0.32 3552083 DLK1 1.13 0.01 0.75 2515471 DLX1 1.83 0.00 0.05 3624145 DMXL2 1.29 0.01 0.64 3820758 DNM2 -1.23 0.00 0.84 3303165 DNMBP 1.16 0.00 0.95 3068097 DOCK4 1.24 0.01 0.77 3850725 DOCK6 -1.14 0.00 0.00 3522398 DOCK9 1.43 0.01 0.00 2424524 DPYD 1.36 0.02 0.11 3802924 DSC3 2.17 0.00 0.11 3783529 DSG2 1.13 0.03 0.45 3552847 DYNC1H1 1.12 0.02 0.13 3695199 DYNC1LI2 1.14 0.01 0.11 3521372 DZIP1 1.31 0.02 0.22

159
Transcript cluster ID Gene
Gene Fold-Change (E/C)
Differential gene expression FDR
Differential Alternative splicing FDR
3463112 E2F7 1.27 0.01 0.09 2612371 EAF1 -1.11 0.02 0.42 3980380 EDA 1.24 0.02 0.52 2830861 EGR1 -1.20 0.02 0.09 4021433 ELF4 1.17 0.02 0.07 3679959 EMP2 1.17 0.01 0.79 3345427 ENDOD1 1.32 0.02 0.21 3150579 ENPP2 2.41 0.00 0.01 3883690 EPB41L1 1.20 0.01 0.00 3713794 EPN2 1.11 0.03 0.14 3015778 EPO -1.33 0.01 0.31 3400413 ERC1 1.20 0.00 0.98 3648995 ERCC4 1.13 0.01 0.01 2462329 ERO1LB 1.49 0.01 0.00 3445768 ERP27 1.55 0.01 0.42 2395177 ERRFI1 -1.18 0.00 0.90 3921068 ETS2 -1.15 0.00 0.53 3541937 EXDL2 1.18 0.02 0.84 3566304 EXOC5 1.14 0.00 0.86 3328389 EXT2 1.24 0.00 0.00 3502411 F7 -1.17 0.02 0.68 3979101 FAAH2 1.27 0.02 0.14 3226253 FAM102A 1.30 0.00 0.06 3278813 FAM107B -1.18 0.02 0.89 3471538 FAM109A -1.16 0.01 0.30 2523354 FAM117B 1.26 0.02 0.01 3355021 FAM118B 1.20 0.01 0.44 3225952 FAM129B -1.14 0.01 1.00 2777487 FAM13A1 -1.52 0.00 0.96 2867145 FAM172A 1.30 0.01 0.36 3798778 FAM38B 1.31 0.03 0.54 3798829 FAM38B2 1.17 0.01 0.20 2658785 FAM43A -1.20 0.03 0.79 2634058 FAM55C 1.32 0.01 0.17 3803290 FAM59A 1.24 0.01 0.43
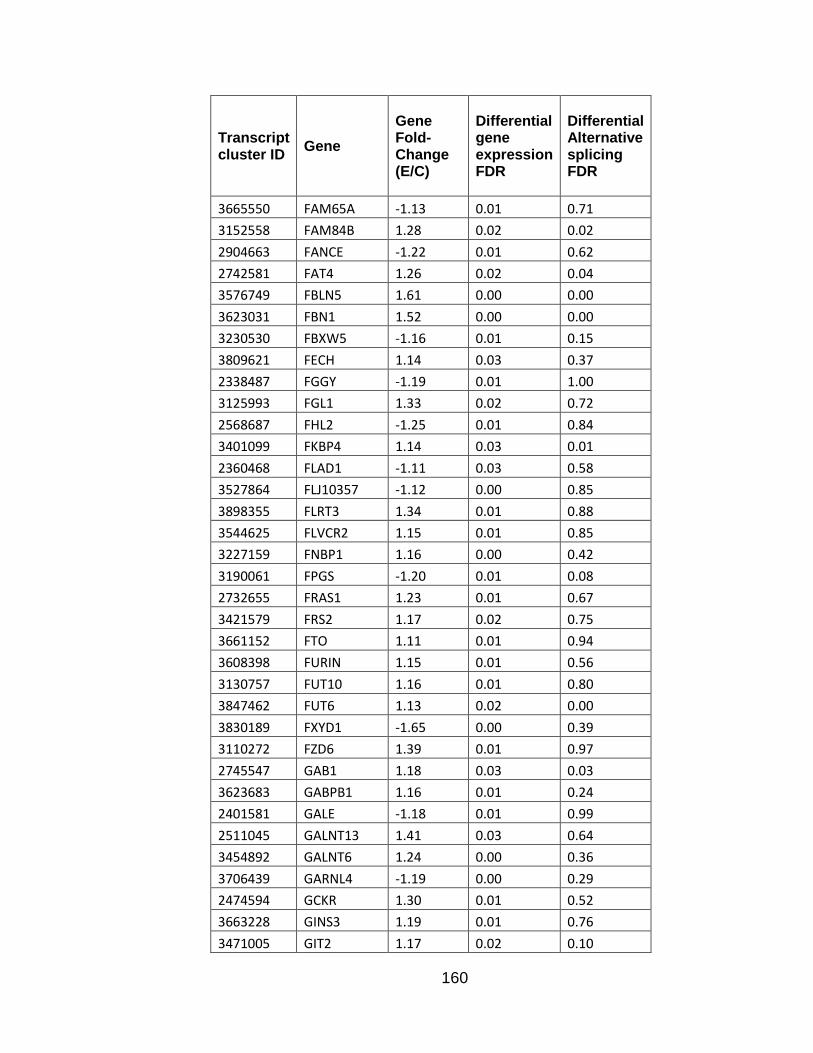
160
Transcript cluster ID Gene
Gene Fold-Change (E/C)
Differential gene expression FDR
Differential Alternative splicing FDR
3665550 FAM65A -1.13 0.01 0.71 3152558 FAM84B 1.28 0.02 0.02 2904663 FANCE -1.22 0.01 0.62 2742581 FAT4 1.26 0.02 0.04 3576749 FBLN5 1.61 0.00 0.00 3623031 FBN1 1.52 0.00 0.00 3230530 FBXW5 -1.16 0.01 0.15 3809621 FECH 1.14 0.03 0.37 2338487 FGGY -1.19 0.01 1.00 3125993 FGL1 1.33 0.02 0.72 2568687 FHL2 -1.25 0.01 0.84 3401099 FKBP4 1.14 0.03 0.01 2360468 FLAD1 -1.11 0.03 0.58 3527864 FLJ10357 -1.12 0.00 0.85 3898355 FLRT3 1.34 0.01 0.88 3544625 FLVCR2 1.15 0.01 0.85 3227159 FNBP1 1.16 0.00 0.42 3190061 FPGS -1.20 0.01 0.08 2732655 FRAS1 1.23 0.01 0.67 3421579 FRS2 1.17 0.02 0.75 3661152 FTO 1.11 0.01 0.94 3608398 FURIN 1.15 0.01 0.56 3130757 FUT10 1.16 0.01 0.80 3847462 FUT6 1.13 0.02 0.00 3830189 FXYD1 -1.65 0.00 0.39 3110272 FZD6 1.39 0.01 0.97 2745547 GAB1 1.18 0.03 0.03 3623683 GABPB1 1.16 0.01 0.24 2401581 GALE -1.18 0.01 0.99 2511045 GALNT13 1.41 0.03 0.64 3454892 GALNT6 1.24 0.00 0.36 3706439 GARNL4 -1.19 0.00 0.29 2474594 GCKR 1.30 0.01 0.52 3663228 GINS3 1.19 0.01 0.76 3471005 GIT2 1.17 0.02 0.10

161
Transcript cluster ID Gene
Gene Fold-Change (E/C)
Differential gene expression FDR
Differential Alternative splicing FDR
3759335 GJC1 1.59 0.00 0.12 2989537 GLCCI1 1.58 0.02 0.83 3422855 GLIPR1 1.81 0.00 0.14 3451246 GLT8D3 1.24 0.02 0.32 3468103 GNPTAB 1.29 0.01 0.00 3191338 GPR107 1.23 0.00 0.22 3475782 GPR109A -1.60 0.02 0.99 3475794 GPR109B -1.56 0.00 0.94 2386747 GPR137B 1.35 0.03 0.04 3662851 GPR97 -1.22 0.01 0.33 3683377 GPRC5B 1.61 0.00 0.00 3830002 GRAMD1A -1.17 0.02 0.95 2584712 GRB14 1.48 0.01 0.87 2469157 GRHL1 -1.18 0.03 0.92 3755903 GSDMB 1.32 0.03 0.19 3574074 GTF2A1 1.15 0.03 0.13 3192525 GTF3C4 1.11 0.03 0.37 2954771 GTPBP2 -1.12 0.02 0.53 3257750 HECTD2 1.43 0.02 0.13 3396249 HEPACAM 1.44 0.00 0.43 3354380 HEPN1 1.41 0.02 0.74 2735459 HERC3 -1.24 0.01 0.96 3096575 HGSNAT 1.31 0.03 0.19 3260666 HIF1AN 1.15 0.02 0.46 3325907 HIPK3 1.16 0.03 0.99 2948926 HLA-B 1.30 0.01 0.09 3881282 HM13 1.16 0.01 0.00 3351841 HMBS -1.12 0.03 0.20 3815493 HMHA1 -1.38 0.01 0.16 3557268 HOMEZ 1.18 0.00 0.48 3851720 HOOK2 -1.15 0.02 0.15 3667890 HPR -1.33 0.00 0.48 3711262 HS3ST3B1 1.11 0.02 0.06 3721815 HSD17B1 -1.15 0.02 0.07 3671076 HSD17B2 -1.22 0.01 1.00

162
Transcript cluster ID Gene
Gene Fold-Change (E/C)
Differential gene expression FDR
Differential Alternative splicing FDR
2903488 HSD17B8 -1.21 0.02 0.58 3656737 HSD3B7 -1.18 0.03 0.84 3934187 HSF2BP 1.34 0.00 0.06 3308397 HSPA12A 1.30 0.00 0.00 3925439 HSPA13 1.22 0.03 0.09 3394123 HYOU1 1.11 0.00 0.64 3766621 ICAM2 1.18 0.03 0.04 2957499 ICK 1.21 0.01 0.68 2948630 IER3 -1.31 0.01 0.90 2403261 IFI6 1.35 0.01 0.00 3257246 IFIT1 1.80 0.02 0.11 3629610 IGDCC3 1.24 0.00 0.40 3359134 IGF2 1.14 0.02 0.49 3918535 IL10RB 1.26 0.02 0.42 3339261 IL18BP 1.18 0.02 0.13 2359817 INTS3 1.21 0.01 0.19 3430776 ISCU 1.15 0.01 0.41 2438482 ISG20L2 1.21 0.01 0.41 3573123 ISM2 -1.23 0.00 0.55 3656223 ITGAL -1.33 0.00 0.79 3276337 ITIH5 1.59 0.00 0.00 3488985 ITM2B 1.21 0.01 0.66 3577160 ITPK1 -1.20 0.01 0.75 3897505 JAG1 -1.27 0.00 0.99 3357237 JAM3 1.22 0.02 0.13 2333429 JMJD2A 1.13 0.02 0.43 2459296 JMJD4 -1.18 0.01 0.97 2415084 JUN -1.14 0.01 0.11 3854877 JUND -1.24 0.01 0.87 3470793 KCTD10 1.20 0.03 0.72 3867092 KDELR1 1.10 0.02 0.97 3572041 KIAA0317 1.19 0.02 0.13 3905073 KIAA0406 1.14 0.01 0.36 2764192 KIAA0746 1.56 0.00 0.01 3203990 KIAA1161 1.23 0.02 0.87

163
Transcript cluster ID Gene
Gene Fold-Change (E/C)
Differential gene expression FDR
Differential Alternative splicing FDR
3604147 KIAA1199 1.14 0.00 0.15 3238962 KIAA1217 1.25 0.01 0.00 3655628 KIF22 -1.12 0.03 0.39 3464747 KITLG 1.66 0.01 0.96 2724308 KLB 1.20 0.01 0.50 3147508 KLF10 1.35 0.00 0.04 2469213 KLF11 1.25 0.01 0.55 3803418 KLHL14 1.35 0.01 0.03 3757108 KRT19 -1.18 0.01 0.45 2925510 L3MBTL3 1.66 0.00 0.05 2371065 LAMC1 1.22 0.00 0.20 3631498 LARP6 1.33 0.01 0.43 2828796 LEAP2 -1.29 0.03 0.67 3841474 LENG8 1.14 0.00 0.49 3577078 LGMN 1.16 0.01 0.99 3866898 LIG1 -1.13 0.02 0.90 3463727 LIN7A -1.34 0.01 0.59 3965936 LMF2 -1.14 0.03 0.19 3416996 LOC440104 1.20 0.02 0.06 3651509 LOC81691 -1.40 0.01 0.51 3847356 LONP1 -1.20 0.00 0.72 2393711 LRRC47 -1.13 0.02 0.16 3016791 LRWD1 -1.13 0.03 0.60 3529877 LTB4R2 1.33 0.01 0.01 3402444 LTBR 1.14 0.01 0.28 3098977 LYN 1.25 0.03 0.38 2866590 LYSMD3 1.21 0.01 0.86 3362826 LYVE1 1.60 0.02 0.78 4013359 MAGT1 1.14 0.01 0.85 3633347 MAN2C1 -1.18 0.01 0.42 3444906 MANSC1 1.57 0.00 0.56 2814756 MAP1B 1.24 0.01 0.00 4002081 MAP7D2 1.23 0.00 0.48 3723687 MAPT 1.47 0.00 0.01 3286921 MARCH8 1.16 0.01 0.60

164
Transcript cluster ID Gene
Gene Fold-Change (E/C)
Differential gene expression FDR
Differential Alternative splicing FDR
3702293 MBTPS1 1.12 0.00 0.05 3394264 MCAM 1.27 0.01 0.13 3502259 MCF2L 1.11 0.01 0.00 3329343 MDK 1.23 0.01 0.90 3844822 MED16 -1.21 0.01 0.48 3223551 MEGF9 1.20 0.02 0.14 3618333 MEIS2 1.25 0.00 0.29 2909263 MEP1A 2.07 0.00 0.21 3604236 MESDC1 1.14 0.01 0.97 3796244 METTL4 1.25 0.01 0.09 3416895 METTL7B 1.21 0.00 0.16 3638204 MFGE8 1.60 0.00 0.00 3304012 MGEA5 1.23 0.02 0.21 3320717 MICAL2 1.14 0.01 0.44 3256560 MINPP1 1.18 0.01 0.88 3845647 MKNK2 -1.14 0.00 0.86 3434525 MLEC 1.19 0.02 0.01 3699080 MLKL 1.25 0.01 0.89 3528864 MMP14 1.19 0.02 0.34 3845681 MOBKL2A -1.24 0.01 0.18 3064501 MOGAT3 -1.42 0.00 0.79 3708874 MPDU1 -1.23 0.00 1.00 4027585 MPP1 1.15 0.01 0.02 2365958 MPZL1 1.18 0.00 0.71 3738205 MRPL12 -1.14 0.02 0.82 3675101 MRPL28 -1.14 0.01 0.99 3771120 MRPL38 -1.12 0.02 0.99 2902633 MSH5 -1.24 0.02 0.65 3942179 MTMR3 1.16 0.00 0.20 3697183 MTSS1L 1.11 0.03 0.13 2692883 MUC13 2.99 0.00 0.00 2896484 MYLIP -1.23 0.01 0.84 2692447 MYLK 1.11 0.01 0.91 3458248 MYO1A 1.19 0.01 0.20 3752709 MYO1D 1.18 0.02 0.58

165
Transcript cluster ID Gene
Gene Fold-Change (E/C)
Differential gene expression FDR
Differential Alternative splicing FDR
3624607 MYO5A 1.69 0.00 0.00 3417809 NAB2 -1.22 0.01 0.93 3229628 NACC2 -1.13 0.02 0.54 3721795 NAGLU -1.12 0.01 0.65 3181460 NANS 1.17 0.02 0.65 3675369 NARFL -1.13 0.02 0.80 2559619 NAT8 1.48 0.02 0.65 3770390 NAT9 -1.26 0.00 0.75 3485292 NBEA 1.47 0.01 0.00 3649811 NDE1 -1.15 0.01 0.95 3154317 NDRG1 -1.15 0.01 0.50 3555736 NDRG2 -1.14 0.01 0.26 2379068 NENF 1.19 0.02 0.06 3601051 NEO1 1.36 0.00 0.33 3690154 NETO2 1.33 0.00 0.97 3340410 NEU3 1.12 0.02 0.34 3942062 NF2 1.17 0.00 0.56 2603987 NGEF -1.18 0.03 0.98 3564071 NIN 1.37 0.01 0.04 3956909 NIPSNAP1 -1.24 0.00 0.63 3182984 NIPSNAP3B 1.32 0.02 0.66 3660075 NKD1 1.13 0.01 0.67 3708553 NLGN2 1.21 0.01 0.31 4030371 NLGN4Y 1.46 0.02 0.67 3203582 NOL6 -1.11 0.03 0.61 2431112 NOTCH2 1.22 0.01 0.56 3146012 NPAL2 1.54 0.02 0.48 3891048 NPEPL1 1.13 0.01 0.04 3774029 NPLOC4 1.12 0.01 0.61 2738378 NPNT 1.37 0.00 0.65 3632492 NPTN 1.23 0.02 0.99 2612175 NR2C2 1.13 0.02 0.44 3225096 NR6A1 1.15 0.00 0.57 3770588 NT5C -1.21 0.01 0.79 3304624 NT5C2 1.25 0.01 0.84

166
Transcript cluster ID Gene
Gene Fold-Change (E/C)
Differential gene expression FDR
Differential Alternative splicing FDR
3468743 NT5DC3 1.25 0.01 0.00 2915828 NT5E 1.53 0.01 0.80 3681674 NTAN1 1.10 0.02 0.41 3322251 NUCB2 1.37 0.02 0.58 3751463 NUFIP2 1.15 0.02 1.00 3376155 NXF1 1.19 0.00 0.21 3432438 OAS1 1.19 0.01 0.66 2912980 OGFRL1 1.81 0.02 0.31 2609904 OGG1 -1.24 0.01 0.68 3981120 OGT 1.15 0.03 0.61 3319119 OLFML1 2.14 0.00 0.36 3942531 OSBP2 1.37 0.02 0.44 3549517 OTUB2 1.28 0.01 0.33 3335952 PACS1 1.15 0.00 0.65 3815116 PALM 1.21 0.02 0.08 3457696 PAN2 -1.12 0.03 0.16 2392528 PANK4 -1.11 0.03 0.77 2910218 PAQR8 -1.12 0.03 0.14 2699059 PAQR9 1.33 0.02 0.79 2708229 PARL -1.19 0.01 0.68 2639054 PARP14 1.26 0.03 0.84 3629567 PARP16 1.24 0.03 0.32 3368054 PAX6 1.20 0.03 0.40 3887165 PCIF1 -1.13 0.02 0.74 3175274 PCSK5 1.35 0.00 0.00 3727712 PCTP 1.26 0.01 0.82 2487696 PCYOX1 1.24 0.01 0.66 3262198 PDCD11 1.10 0.02 0.69 2589017 PDE11A 1.41 0.01 0.68 3089535 PDLIM2 -1.20 0.01 0.17 3766796 PECAM1 1.47 0.01 0.00 2318656 PER3 -1.12 0.01 0.10 3957445 PES1 -1.12 0.01 0.64 3753690 PEX12 1.21 0.02 0.98 2390518 PGBD2 1.17 0.01 0.66

167
Transcript cluster ID Gene
Gene Fold-Change (E/C)
Differential gene expression FDR
Differential Alternative splicing FDR
2953751 PGC -1.43 0.00 0.63 4001556 PHKA2 -1.23 0.00 0.38 3259978 PI4K2A 1.14 0.03 0.05 3301914 PIK3AP1 1.24 0.00 0.18 2905404 PIM1 -1.32 0.01 0.97 3173673 PIP5K1B 1.23 0.02 0.15 3732230 PITPNC1 1.44 0.01 0.10 3822723 PKN1 -1.13 0.01 0.98 3190683 PKN3 -1.16 0.01 0.90 3922975 PKNOX1 1.19 0.01 0.04 2977621 PLAGL1 1.44 0.00 0.01 3828067 PLEKHF1 1.17 0.01 0.73 2479433 PLEKHH2 1.46 0.02 0.01 3845782 PLEKHJ1 -1.27 0.01 0.52 3759849 PLEKHM1 1.21 0.00 0.50 2453370 PLXNA2 1.23 0.00 0.00 3426502 PLXNC1 1.34 0.00 0.00 3746574 PMP22 1.51 0.00 0.61 3073013 PODXL 1.16 0.01 0.02 3881786 POFUT1 1.20 0.02 0.91 3572982 POMT2 1.17 0.01 0.32 3820342 PPAN -1.14 0.01 0.55 2948425 PPP1R10 1.24 0.00 0.02 3838004 PPP1R15A -1.31 0.00 0.98 2518488 PPP1R1C 1.20 0.02 0.01 3272761 PRAP1 1.24 0.02 0.89 3838809 PRMT1 -1.13 0.02 0.26 3874751 PRNP 1.19 0.00 0.93 3973692 PRRG1 1.21 0.03 0.11 3717737 PSMD11 1.11 0.02 0.85 2353717 PTGFRN 1.12 0.02 0.00 3402736 PTMS 1.32 0.01 0.50 3871192 PTPRH -1.15 0.00 0.99 3329983 PTPRJ 1.25 0.01 0.04 3081862 PTPRN2 1.23 0.00 0.00
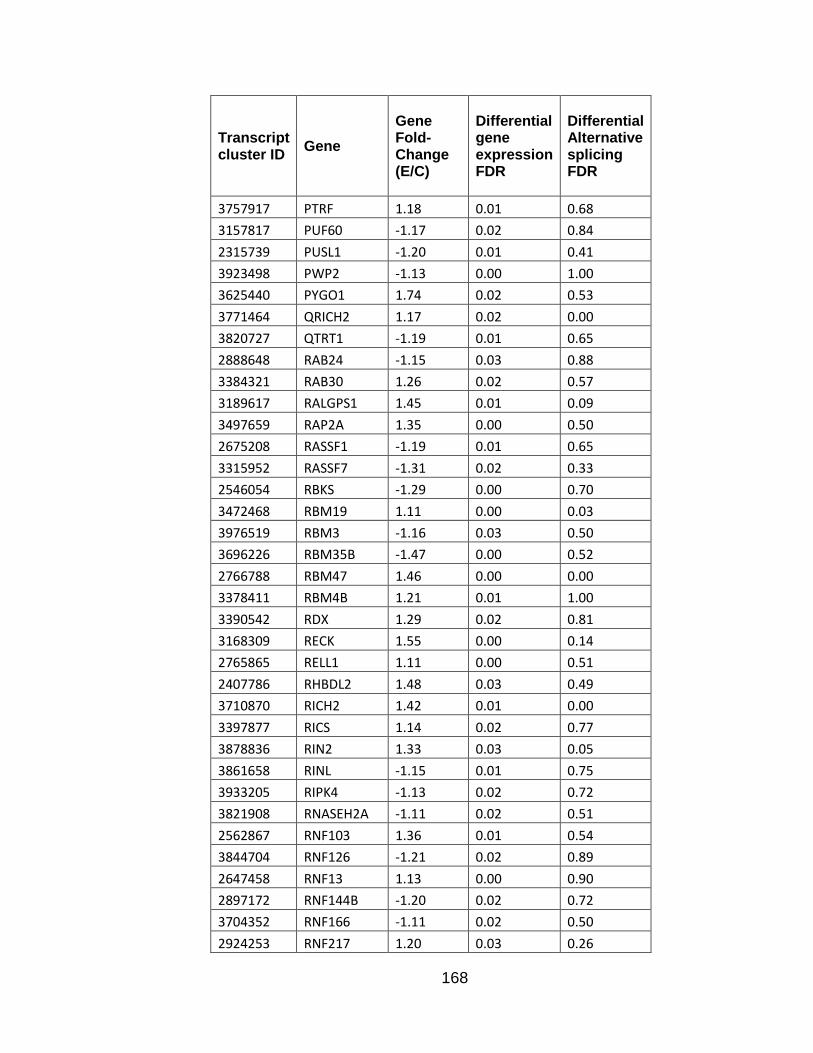
168
Transcript cluster ID Gene
Gene Fold-Change (E/C)
Differential gene expression FDR
Differential Alternative splicing FDR
3757917 PTRF 1.18 0.01 0.68 3157817 PUF60 -1.17 0.02 0.84 2315739 PUSL1 -1.20 0.01 0.41 3923498 PWP2 -1.13 0.00 1.00 3625440 PYGO1 1.74 0.02 0.53 3771464 QRICH2 1.17 0.02 0.00 3820727 QTRT1 -1.19 0.01 0.65 2888648 RAB24 -1.15 0.03 0.88 3384321 RAB30 1.26 0.02 0.57 3189617 RALGPS1 1.45 0.01 0.09 3497659 RAP2A 1.35 0.00 0.50 2675208 RASSF1 -1.19 0.01 0.65 3315952 RASSF7 -1.31 0.02 0.33 2546054 RBKS -1.29 0.00 0.70 3472468 RBM19 1.11 0.00 0.03 3976519 RBM3 -1.16 0.03 0.50 3696226 RBM35B -1.47 0.00 0.52 2766788 RBM47 1.46 0.00 0.00 3378411 RBM4B 1.21 0.01 1.00 3390542 RDX 1.29 0.02 0.81 3168309 RECK 1.55 0.00 0.14 2765865 RELL1 1.11 0.00 0.51 2407786 RHBDL2 1.48 0.03 0.49 3710870 RICH2 1.42 0.01 0.00 3397877 RICS 1.14 0.02 0.77 3878836 RIN2 1.33 0.03 0.05 3861658 RINL -1.15 0.01 0.75 3933205 RIPK4 -1.13 0.02 0.72 3821908 RNASEH2A -1.11 0.02 0.51 2562867 RNF103 1.36 0.01 0.54 3844704 RNF126 -1.21 0.02 0.89 2647458 RNF13 1.13 0.00 0.90 2897172 RNF144B -1.20 0.02 0.72 3704352 RNF166 -1.11 0.02 0.50 2924253 RNF217 1.20 0.03 0.26

169
Transcript cluster ID Gene
Gene Fold-Change (E/C)
Differential gene expression FDR
Differential Alternative splicing FDR
2333907 RNF220 -1.15 0.01 1.00 2339872 ROR1 1.55 0.00 0.10 2435261 RORC -1.17 0.01 0.53
3230440 RP11-216L13.5 -1.57 0.00 0.58
2321466 RP1-21O18.1 -1.13 0.01 0.88
3978819 RRAGB 1.37 0.02 0.78 2964231 RRAGD 2.15 0.00 0.01 2675763 RRP9 -1.20 0.01 0.41 3691326 SALL1 1.34 0.00 0.02 3556454 SALL2 -1.19 0.02 0.49 3909777 SALL4 1.62 0.01 0.07 3252534 SAMD8 1.14 0.01 0.52 3904691 SAMHD1 1.40 0.01 0.48 2594089 SATB2 1.27 0.00 0.33 3844978 SBNO2 -1.19 0.02 0.94 3602004 SCAMP5 1.16 0.01 0.36 3605780 SCAND2 1.27 0.01 0.12 3091475 SCARA3 1.41 0.00 0.28 2898934 SCGN 1.38 0.01 0.98 3414969 SCN8A 1.31 0.01 0.29 3441885 SCNN1A 1.19 0.02 0.91 3728037 SCPEP1 1.29 0.00 0.27 2592532 SDPR -1.40 0.00 0.72 3790479 SEC11C 1.30 0.03 0.18 3942350 SEC14L2 1.32 0.00 0.05 3574207 SEL1L 1.16 0.02 0.82 2622547 SEMA3F 1.13 0.02 0.01 2872047 SEMA6A 1.52 0.00 0.45 2328273 SERINC2 -1.33 0.00 0.93 3549708 SERPINA4 1.18 0.01 0.83 3549740 SERPINA5 1.30 0.00 0.46 3387259 SESN3 3.26 0.00 0.62 3687277 SEZ6L2 1.13 0.03 0.19
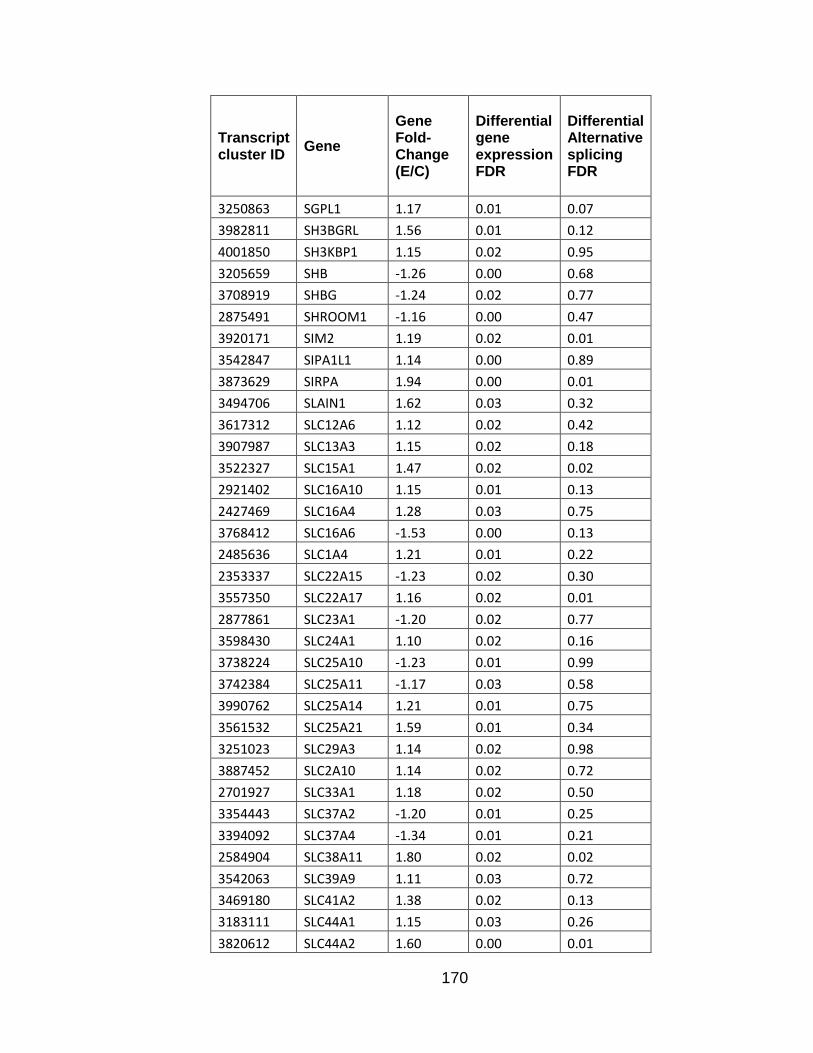
170
Transcript cluster ID Gene
Gene Fold-Change (E/C)
Differential gene expression FDR
Differential Alternative splicing FDR
3250863 SGPL1 1.17 0.01 0.07 3982811 SH3BGRL 1.56 0.01 0.12 4001850 SH3KBP1 1.15 0.02 0.95 3205659 SHB -1.26 0.00 0.68 3708919 SHBG -1.24 0.02 0.77 2875491 SHROOM1 -1.16 0.00 0.47 3920171 SIM2 1.19 0.02 0.01 3542847 SIPA1L1 1.14 0.00 0.89 3873629 SIRPA 1.94 0.00 0.01 3494706 SLAIN1 1.62 0.03 0.32 3617312 SLC12A6 1.12 0.02 0.42 3907987 SLC13A3 1.15 0.02 0.18 3522327 SLC15A1 1.47 0.02 0.02 2921402 SLC16A10 1.15 0.01 0.13 2427469 SLC16A4 1.28 0.03 0.75 3768412 SLC16A6 -1.53 0.00 0.13 2485636 SLC1A4 1.21 0.01 0.22 2353337 SLC22A15 -1.23 0.02 0.30 3557350 SLC22A17 1.16 0.02 0.01 2877861 SLC23A1 -1.20 0.02 0.77 3598430 SLC24A1 1.10 0.02 0.16 3738224 SLC25A10 -1.23 0.01 0.99 3742384 SLC25A11 -1.17 0.03 0.58 3990762 SLC25A14 1.21 0.01 0.75 3561532 SLC25A21 1.59 0.01 0.34 3251023 SLC29A3 1.14 0.02 0.98 3887452 SLC2A10 1.14 0.02 0.72 2701927 SLC33A1 1.18 0.02 0.50 3354443 SLC37A2 -1.20 0.01 0.25 3394092 SLC37A4 -1.34 0.01 0.21 2584904 SLC38A11 1.80 0.02 0.02 3542063 SLC39A9 1.11 0.03 0.72 3469180 SLC41A2 1.38 0.02 0.13 3183111 SLC44A1 1.15 0.03 0.26 3820612 SLC44A2 1.60 0.00 0.01

171
Transcript cluster ID Gene
Gene Fold-Change (E/C)
Differential gene expression FDR
Differential Alternative splicing FDR
3895330 SLC4A11 -1.14 0.01 0.97 3988165 SLC6A14 2.07 0.01 0.69 3087659 SLC7A2 -1.19 0.02 0.39 3684100 SLC7A5P1 -1.27 0.01 0.40 3340449 SLCO2B1 -1.18 0.02 0.94 3892812 SLCO4A1 -1.12 0.00 0.08 3945877 SMCR7L 1.14 0.02 0.04 3713195 SMCR8 1.22 0.02 0.17 3740838 SMG6 1.11 0.02 0.65 3134511 SNAI2 1.59 0.00 0.14 2824089 SNORA13 -1.19 0.01 0.98 3833757 SNRPA -1.11 0.02 0.98 3899346 SNX5 -1.11 0.01 0.41 3035702 SNX8 -1.15 0.01 0.59 2920085 SOBP 1.31 0.00 0.08 3352948 SORL1 -1.16 0.00 0.98 3733590 SOX9 1.16 0.00 0.85 3883441 SPAG4 -1.32 0.00 0.92 2882098 SPARC 1.84 0.00 0.02 2411575 SPATA6 1.33 0.03 0.64 3413950 SPATS2 1.22 0.01 0.83 3293840 SPOCK2 1.51 0.00 0.00 3455973 SPRYD3 -1.10 0.02 0.78 3876990 SPTLC3 1.29 0.01 0.01 3984468 SRPX2 1.22 0.01 0.04 3894322 SRXN1 1.15 0.02 0.73 3470597 SSH1 1.20 0.02 0.20 3154398 ST3GAL1 -1.13 0.02 0.82 3846709 STAP2 -1.16 0.01 0.43 3381317 STARD10 1.19 0.01 0.60 3980078 STARD8 1.39 0.00 0.00 2999485 STK17A -1.24 0.01 0.75 2951916 STK38 1.26 0.02 0.87 3189932 STXBP1 1.34 0.02 0.03 3558418 STXBP6 1.18 0.01 0.05
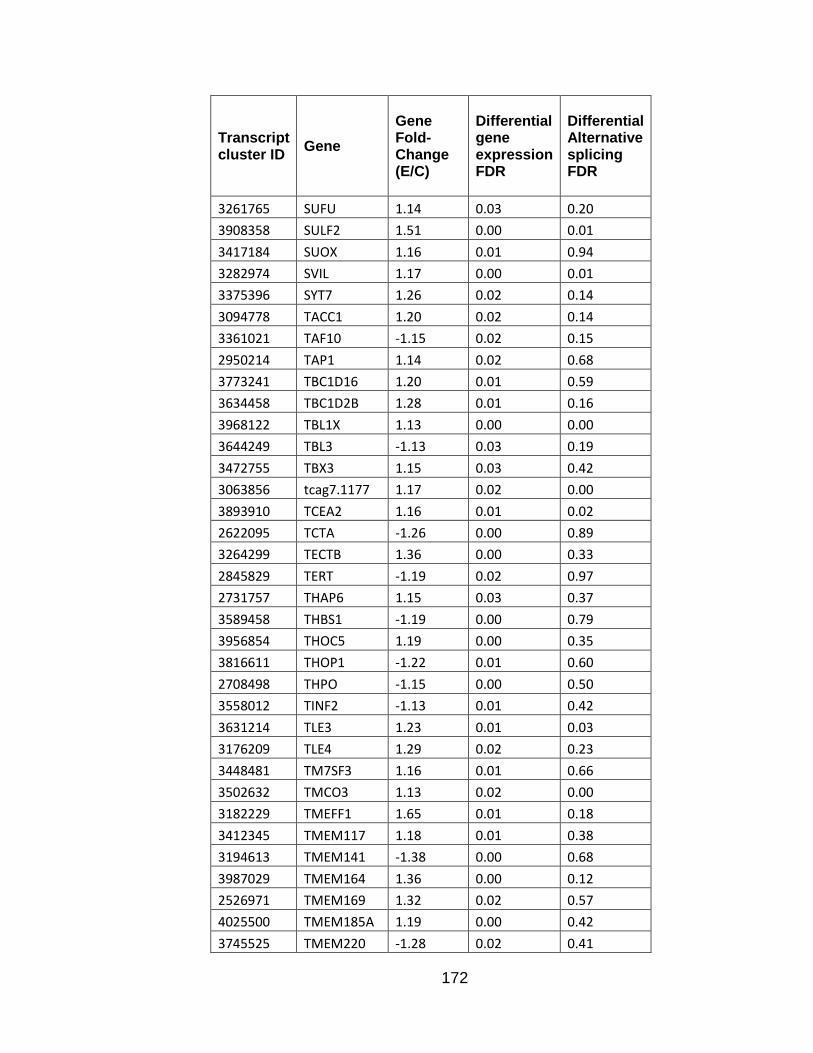
172
Transcript cluster ID Gene
Gene Fold-Change (E/C)
Differential gene expression FDR
Differential Alternative splicing FDR
3261765 SUFU 1.14 0.03 0.20 3908358 SULF2 1.51 0.00 0.01 3417184 SUOX 1.16 0.01 0.94 3282974 SVIL 1.17 0.00 0.01 3375396 SYT7 1.26 0.02 0.14 3094778 TACC1 1.20 0.02 0.14 3361021 TAF10 -1.15 0.02 0.15 2950214 TAP1 1.14 0.02 0.68 3773241 TBC1D16 1.20 0.01 0.59 3634458 TBC1D2B 1.28 0.01 0.16 3968122 TBL1X 1.13 0.00 0.00 3644249 TBL3 -1.13 0.03 0.19 3472755 TBX3 1.15 0.03 0.42 3063856 tcag7.1177 1.17 0.02 0.00 3893910 TCEA2 1.16 0.01 0.02 2622095 TCTA -1.26 0.00 0.89 3264299 TECTB 1.36 0.00 0.33 2845829 TERT -1.19 0.02 0.97 2731757 THAP6 1.15 0.03 0.37 3589458 THBS1 -1.19 0.00 0.79 3956854 THOC5 1.19 0.00 0.35 3816611 THOP1 -1.22 0.01 0.60 2708498 THPO -1.15 0.00 0.50 3558012 TINF2 -1.13 0.01 0.42 3631214 TLE3 1.23 0.01 0.03 3176209 TLE4 1.29 0.02 0.23 3448481 TM7SF3 1.16 0.01 0.66 3502632 TMCO3 1.13 0.02 0.00 3182229 TMEFF1 1.65 0.01 0.18 3412345 TMEM117 1.18 0.01 0.38 3194613 TMEM141 -1.38 0.00 0.68 3987029 TMEM164 1.36 0.00 0.12 2526971 TMEM169 1.32 0.02 0.57 4025500 TMEM185A 1.19 0.00 0.42 3745525 TMEM220 -1.28 0.02 0.41

173
Transcript cluster ID Gene
Gene Fold-Change (E/C)
Differential gene expression FDR
Differential Alternative splicing FDR
3675116 TMEM8 -1.16 0.02 0.81 3449068 TMTC1 1.27 0.02 0.01 3425134 TMTC3 1.29 0.02 0.04 3645555 TNFRSF12A -1.28 0.02 0.80 3481410 TNFRSF19 1.13 0.02 0.13 2956052 TNFRSF21 1.15 0.01 0.03 2444283 TNFSF4 -1.36 0.03 0.77 2599153 TNS1 -1.35 0.00 1.00 3748026 TOM1L2 1.15 0.02 0.07 3954331 TOP3B 1.14 0.01 0.76 3191147 TOR1B 1.12 0.01 0.27 3145149 TP53INP1 1.32 0.00 0.95 3597338 TPM1 1.12 0.02 0.04 3644541 TRAF7 -1.14 0.02 0.42 3677752 TRAP1 -1.13 0.02 0.90 3819104 TRAPPC5 1.18 0.01 0.64 2748061 TRIM2 1.56 0.01 0.57 3763656 TRIM25 1.14 0.00 0.66 3978579 TRO 1.28 0.01 0.21 2991150 TSPAN13 1.18 0.01 0.01 3634071 TSPAN3 1.11 0.00 0.01 3418492 TSPAN31 -1.11 0.02 0.94 3978169 TSPYL2 1.25 0.03 0.21 3891342 TUBB1 -1.27 0.00 0.65 3959593 TXN2 1.17 0.02 0.10 3217736 TXNDC4 1.21 0.01 0.51 2356115 TXNIP 1.26 0.01 0.95 3195139 UAP1L1 -1.30 0.01 0.93 2947877 UBD 1.50 0.01 0.24 3431143 UBE3B 1.13 0.00 0.38 2319560 UBE4B 1.14 0.00 0.08 3758967 UBTF 1.11 0.02 0.46 3486025 UFM1 1.14 0.00 0.19 3438527 ULK1 1.13 0.02 0.01 3770979 UNC13D -1.17 0.02 0.99
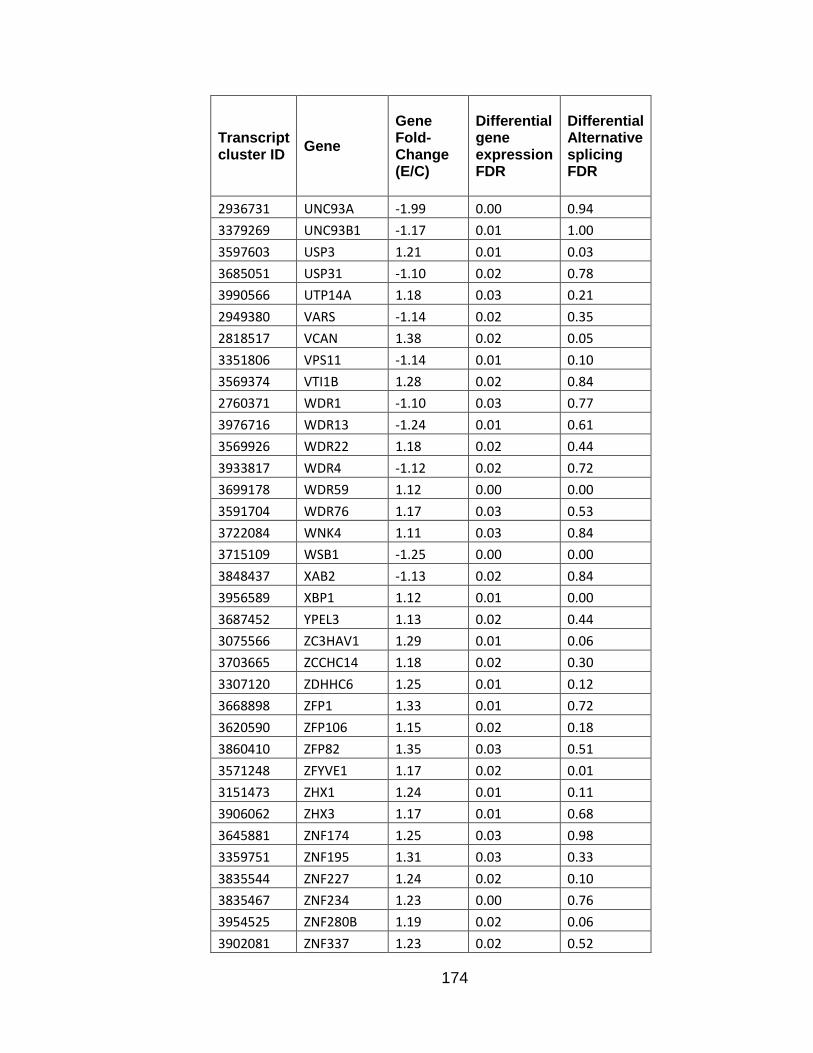
174
Transcript cluster ID Gene
Gene Fold-Change (E/C)
Differential gene expression FDR
Differential Alternative splicing FDR
2936731 UNC93A -1.99 0.00 0.94 3379269 UNC93B1 -1.17 0.01 1.00 3597603 USP3 1.21 0.01 0.03 3685051 USP31 -1.10 0.02 0.78 3990566 UTP14A 1.18 0.03 0.21 2949380 VARS -1.14 0.02 0.35 2818517 VCAN 1.38 0.02 0.05 3351806 VPS11 -1.14 0.01 0.10 3569374 VTI1B 1.28 0.02 0.84 2760371 WDR1 -1.10 0.03 0.77 3976716 WDR13 -1.24 0.01 0.61 3569926 WDR22 1.18 0.02 0.44 3933817 WDR4 -1.12 0.02 0.72 3699178 WDR59 1.12 0.00 0.00 3591704 WDR76 1.17 0.03 0.53 3722084 WNK4 1.11 0.03 0.84 3715109 WSB1 -1.25 0.00 0.00 3848437 XAB2 -1.13 0.02 0.84 3956589 XBP1 1.12 0.01 0.00 3687452 YPEL3 1.13 0.02 0.44 3075566 ZC3HAV1 1.29 0.01 0.06 3703665 ZCCHC14 1.18 0.02 0.30 3307120 ZDHHC6 1.25 0.01 0.12 3668898 ZFP1 1.33 0.01 0.72 3620590 ZFP106 1.15 0.02 0.18 3860410 ZFP82 1.35 0.03 0.51 3571248 ZFYVE1 1.17 0.02 0.01 3151473 ZHX1 1.24 0.01 0.11 3906062 ZHX3 1.17 0.01 0.68 3645881 ZNF174 1.25 0.03 0.98 3359751 ZNF195 1.31 0.03 0.33 3835544 ZNF227 1.24 0.02 0.10 3835467 ZNF234 1.23 0.00 0.76 3954525 ZNF280B 1.19 0.02 0.06 3902081 ZNF337 1.23 0.02 0.52

175
Transcript cluster ID Gene
Gene Fold-Change (E/C)
Differential gene expression FDR
Differential Alternative splicing FDR
3129304 ZNF395 -1.13 0.01 0.39 3831698 ZNF420 1.23 0.01 0.01 3821410 ZNF440 1.38 0.02 0.32 3184896 ZNF483 1.89 0.02 0.40 3826601 ZNF493 1.31 0.00 0.17 3819968 ZNF559 1.16 0.00 0.33 3842301 ZNF581 -1.18 0.01 0.43 3856075 ZNF682 1.41 0.02 0.90 3840372 ZNF701 1.24 0.02 0.73 3851374 ZNF709 1.44 0.02 0.46 4023006 ZNF75D 1.40 0.02 0.46 2904528 ZNF76 -1.23 0.02 0.77 3908831 ZNFX1 1.17 0.02 0.68 3029129 ZYX -1.21 0.00 0.62 3741875 ZZEF1 1.14 0.01 0.02

176
REFERENCES
Affymetrix (2003). Design and Performance of the GeneChip® Human Genome U133 Plus 2.0 and Human Genome U133A 2.0 Arrays. (Affymetrix Inc.). Affymetrix (2005a). Exon Probe set Annotations and Transcript Cluster Groupings version 1. (Affymetrix Inc.). Affymetrix (2005b). Gene Signal Estimates from Exon Arrays. (Affymetrix Inc.). Affymetrix (2005c). Guide to Probe Logarithmic Intensity Error (PLIER) Estimation. (Affymetrix Inc.). Albano, E. (2006). Alcohol, oxidative stress and free radical damage. Proc Nutr Soc 65, 278-290. Allali-Hassani, A., Martinez, S.E., Peralba, J.M., Vaglenova, J., Vidal, F., Richart, C., Farres, J., and Pares, X. (1997). Alcohol dehydrogenase of human and rat blood vessels. Role in ethanol metabolism. FEBS letters 405, 26-30. American Psychiatric Association (1987). Diagnostic and Statistical Manual of Mental Disorders, 3rd revised edn (American Psychiatric Association Press, Washington, DC.). Aoyama, T., Peters, J.M., Iritani, N., Nakajima, T., Furihata, K., Hashimoto, T., and Gonzalez, F.J. (1998). Altered constitutive expression of fatty acid-metabolizing enzymes in mice lacking the peroxisome proliferator-activated receptor alpha (PPARalpha). J Biol Chem 273, 5678-5684. Badawy, A.A.B. (1977). A Review of the Effects of Alcohol on Carbohydrate Metabolism. Alcohol Alcohol 12, 120-136. Badger, T.M., Huang, J., Ronis, M., and Lumpkin, C.K. (1993). Induction of cytochrome P450 2E1 during chronic ethanol exposure occurs via transcription of the CYP 2E1 gene when blood alcohol concentrations are high. Biochem Biophys Res Commun 190, 780-785. Bai, J., and Cederbaum, A.I. (2006). Overexpression of CYP2E1 in mitochondria sensitizes HepG2 cells to the toxicity caused by depletion of glutathione. J Biol Chem 281, 5128-5136. Bailey, S.M., and Cunningham, C.C. (2002). Contribution of mitochondria to oxidative stress associated with alcoholic liver disease. Free Radic Biol Med 32, 11-16. Bailey, S.M., Pietsch, E.C., and Cunningham, C.C. (1999). Ethanol stimulates the production of reactive oxygen species at mitochondrial complexes I and III. Free Radic Biol Med 27, 891-900. Bannai, S. (1986). Exchange of cystine and glutamate across plasma membrane of human fibroblasts. J Biol Chem 261, 2256-2263.
177
Baumhueter, S., Mendel, D.B., Conley, P.B., Kuo, C.J., Turk, C., Graves, M.K., Edwards, C.A., Courtois, G., and Crabtree, G.R. (1990). HNF-1 shares three sequence motifs with the POU domain proteins and is identical to LF-B1 and APF. Genes Dev 4, 372-379. Bemmo, A., Benovoy, D., Kwan, T., Gaffney, D.J., Jensen, R.V., and Majewski, J. (2008). Gene expression and isoform variation analysis using Affymetrix Exon Arrays. BMC Genomics 9, 529. Benjamini, Y., and Hochberg, Y. (1995). Controlling the False Discovery Rate: A Practical and Powerful Approach to Multiple Testing. Journal of the Royal Statistical Society Series B (Methodological) 57, 289-300. Bierut, L.J., Agrawal, A., Bucholz, K.K., Doheny, K.F., Laurie, C., Pugh, E., Fisher, S., Fox, L., Howells, W., Bertelsen, S., et al. (2010). A genome-wide association study of alcohol dependence. Proc Natl Acad Sci U S A 107, 5082-5087. Birley, A.J., James, M.R., Dickson, P.A., Montgomery, G.W., Heath, A.C., Martin, N.G., and Whitfield, J.B. (2009). ADH single nucleotide polymorphism associations with alcohol metabolism in vivo. Human Molecular Genetics 18, 1533-1542. Birley, A.J., Whitfield, J.B., Neale, M.C., Duffy, D.L., Heath, A.C., Boomsma, D.I., and Martin, N.G. (2005). Genetic time-series analysis identifies a major QTL for in vivo alcohol metabolism not predicted by in vitro studies of structural protein polymorphism at the ADH1B or ADH1C loci. Behav Genet 35, 509-524. Blanchette, M., Kent, W.J., Riemer, C., Elnitski, L., Smit, A.F., Roskin, K.M., Baertsch, R., Rosenbloom, K., Clawson, H., Green, E.D., et al. (2004). Aligning multiple genomic sequences with the threaded blockset aligner. Genome research 14, 708-715. Bode, C., and Bode, J.C. (2005). Activation of the innate immune system and alcoholic liver disease: effects of ethanol per se or enhanced intestinal translocation of bacterial toxins induced by ethanol? Alcohol Clin Exp Res 29, 166S-171S. Boleda, M.D., Saubi, N., Farres, J., and Pares, X. (1993). Physiological substrates for rat alcohol dehydrogenase classes: aldehydes of lipid peroxidation, omega-hydroxyfatty acids, and retinoids. Arch Biochem Biophys 307, 85-90. Bondarenko, V.A., Liu, Y.V., Jiang, Y.I., and Studitsky, V.M. (2003). Communication over a large distance: enhancers and insulators. Biochemistry and cell biology = Biochimie et biologie cellulaire 81, 241-251. Bonsch, D., Lenz, B., Fiszer, R., Frieling, H., Kornhuber, J., and Bleich, S. (2006). Lowered DNA methyltransferase (DNMT-3b) mRNA expression is associated with genomic DNA hypermethylation in patients with chronic alcoholism. J Neural Transm 113, 1299-1304.

178
Bonsch, D., Lenz, B., Reulbach, U., Kornhuber, J., and Bleich, S. (2004). Homocysteine associated genomic DNA hypermethylation in patients with chronic alcoholism. J Neural Transm 111, 1611-1616. Bosron, W.F., and Li, T.K. (1986). Genetic polymorphism of human liver alcohol and aldehyde dehydrogenases, and their relationship to alcohol metabolism and alcoholism. Hepatology 6, 502-510. Brown, C.J., Zhang, L., and Edenberg, H.J. (1994). Tissue-specific differences in the expression of the human ADH2 alcohol dehydrogenase gene and in binding of factors to cis-acting elements in its promoter. DNA and cell biology 13, 235-247. Brown, C.J., Zhang, L., and Edenberg, H.J. (1996). Gene expression in a young multigene family: tissue-specific differences in the expression of the human alcohol dehydrogenase genes ADH1, ADH2, and ADH3. DNA and cell biology 15, 187-196. Buratti, E., Dork, T., Zuccato, E., Pagani, F., Romano, M., and Baralle, F.E. (2001). Nuclear factor TDP-43 and SR proteins promote in vitro and in vivo CFTR exon 9 skipping. EMBO J 20, 1774-1784. Bushey, A.M., Dorman, E.R., and Corces, V.G. (2008). Chromatin insulators: regulatory mechanisms and epigenetic inheritance. Mol Cell 32, 1-9. Bykov, I., Junnikkala, S., Pekna, M., Lindros, K.O., and Meri, S. (2007). Effect of chronic ethanol consumption on the expression of complement components and acute-phase proteins in liver. Clin Immunol 124, 213-220. Cargiulo, T. (2007). Understanding the health impact of alcohol dependence. Am J Health Syst Pharm 64, S5-11. Carr, L.G., and Edenberg, H.J. (1990). cis-acting sequences involved in protein binding and in vitro transcription of the human alcohol dehydrogenase gene ADH2. J Biol Chem 265, 1658-1664. Carroll, J.S., Liu, X.S., Brodsky, A.S., Li, W., Meyer, C.A., Szary, A.J., Eeckhoute, J., Shao, W., Hestermann, E.V., Geistlinger, T.R., et al. (2005). Chromosome-wide mapping of estrogen receptor binding reveals long-range regulation requiring the forkhead protein FoxA1. Cell 122, 33-43. Casamassimi, A., and Napoli, C. (2007). Mediator complexes and eukaryotic transcription regulation: an overview. Biochimie 89, 1439-1446. Ceciliani, F., Giordano, A., and Spagnolo, V. (2002). The systemic reaction during inflammation: the acute-phase proteins. Protein Pept Lett 9, 211-223. Cederlund, E., Peralba, J.M., Pares, X., and Jornvall, H. (1991). Amphibian alcohol dehydrogenase, the major frog liver enzyme. Relationships to other forms and assessment of an early gene duplication separating vertebrate class I and class III alcohol dehydrogenases. Biochemistry 30, 2811-2816.

179
Chaya, D., Hayamizu, T., Bustin, M., and Zaret, K.S. (2001). Transcription factor FoxA (HNF3) on a nucleosome at an enhancer complex in liver chromatin. The Journal of biological chemistry 276, 44385-44389. Chen, H.J., Tian, H., and Edenberg, H.J. (2005). Natural haplotypes in the regulatory sequences affect human alcohol dehydrogenase 1C (ADH1C) gene expression. Hum Mutat 25, 150-155. Chen, M., and Manley, J.L. (2009). Mechanisms of alternative splicing regulation: insights from molecular and genomics approaches. Nat Rev Mol Cell Biol 10, 741-754. Chiaromonte, F., Yap, V.B., and Miller, W. (2002). Scoring pairwise genomic sequence alignments. Pac Symp Biocomput, 115-126. Chick, J., Pikkarainen, J., and Plant, M. (1987). Serum ferritin as a marker of alcohol consumption in working men. Alcohol Alcohol 22, 75-77. Cirillo, L.A., Lin, F.R., Cuesta, I., Friedman, D., Jarnik, M., and Zaret, K.S. (2002). Opening of compacted chromatin by early developmental transcription factors HNF3 (FoxA) and GATA-4. Molecular Cell 9, 279-289. Cirillo, L.A., and Zaret, K.S. (1999). An early developmental transcription factor complex that is more stable on nucleosome core particles than on free DNA. Mol Cell 4, 961-969. Clapier, C.R., and Cairns, B.R. (2009). The biology of chromatin remodeling complexes. Annu Rev Biochem 78, 273-304. Clark, K.L., Halay, E.D., Lai, E., and Burley, S.K. (1993). Co-crystal structure of the HNF-3/fork head DNA-recognition motif resembles histone H5. Nature 364, 412-420. Clark, T.A., Schweitzer, A.C., Chen, T.X., Staples, M.K., Lu, G., Wang, H., Williams, A., and Blume, J.E. (2007). Discovery of tissue-specific exons using comprehensive human exon microarrays. Genome Biol 8, R64. Courtois, G., Baumhueter, S., and Crabtree, G.R. (1988). Purified hepatocyte nuclear factor 1 interacts with a family of hepatocyte-specific promoters. Proc Natl Acad Sci U S A 85, 7937-7941. Courtois, G., Morgan, J.G., Campbell, L.A., Fourel, G., and Crabtree, G.R. (1987). Interaction of a liver-specific nuclear factor with the fibrinogen and alpha 1-antitrypsin promoters. Science 238, 688-692. Crawford, G.E., Davis, S., Scacheri, P.C., Renaud, G., Halawi, M.J., Erdos, M.R., Green, R., Meltzer, P.S., Wolfsberg, T.G., and Collins, F.S. (2006a). DNase-chip: a high-resolution method to identify DNase I hypersensitive sites using tiled microarrays. Nature methods 3, 503-509. Crawford, G.E., Holt, I.E., Whittle, J., Webb, B.D., Tai, D., Davis, S., Margulies, E.H., Chen, Y., Bernat, J.A., Ginsburg, D., et al. (2006b). Genome-wide mapping of DNase hypersensitive sites using massively parallel signature sequencing (MPSS). Genome research 16, 123-131.
180
Cubero, F.J., Urtasun, R., and Nieto, N. (2009). Alcohol and liver fibrosis. Semin Liver Dis 29, 211-221. Cunningham, C.C., and Bailey, S.M. (2001). Ethanol consumption and liver mitochondria function. Biol Signals Recept 10, 271-282. Cunningham, C.C., Malloy, C.R., and Radda, G.K. (1986). Effect of fasting and acute ethanol administration on the energy state of in vivo liver as measured by 31P-NMR spectroscopy. Biochim Biophys Acta 885, 12-22. Danielsson, O., and Jornvall, H. (1992). "Enzymogenesis": classical liver alcohol dehydrogenase origin from the glutathione-dependent formaldehyde dehydrogenase line. Proc Natl Acad Sci U S A 89, 9247-9251. De Sandre-Giovannoli, A., and Levy, N. (2006). Altered splicing in prelamin A-associated premature aging phenotypes. Prog Mol Subcell Biol 44, 199-232. Dean, A. (2006). On a chromosome far, far away: LCRs and gene expression. Trends Genet 22, 38-45. Dedon, P.C., Soults, J.A., Allis, C.D., and Gorovsky, M.A. (1991). A simplified formaldehyde fixation and immunoprecipitation technique for studying protein-DNA interactions. Anal Biochem 197, 83-90. Dekker, J., Rippe, K., Dekker, M., and Kleckner, N. (2002). Capturing chromosome conformation. Science 295, 1306-1311. Deltour, L., Foglio, M.H., and Duester, G. (1999). Metabolic deficiencies in alcohol dehydrogenase Adh1, Adh3, and Adh4 null mutant mice. Overlapping roles of Adh1 and Adh4 in ethanol clearance and metabolism of retinol to retinoic acid. J Biol Chem 274, 16796-16801. Diehl, A.M., Chacon, M., and Wagner, P. (1988). The effect of chronic ethanol feeding on ornithine decarboxylase activity and liver regeneration. Hepatology 8, 237-242. Diehl, A.M., Wells, M., Brown, N.D., Thorgeirsson, S.S., and Steer, C.J. (1990). Effect of ethanol on polyamine synthesis during liver regeneration in rats. J Clin Invest 85, 385-390. Dircks, L.K., and Sul, H.S. (1997). Mammalian mitochondrial glycerol-3-phosphate acyltransferase. Biochim Biophys Acta 1348, 17-26. Dong, Y., Poellinger, L., Okret, S., Hoog, J.O., von Bahr-Lindstrom, H., Jornvall, H., and Gustafsson, J.A. (1988). Regulation of gene expression of class I alcohol dehydrogenase by glucocorticoids. Proc Natl Acad Sci U S A 85, 767-771. Dong, Y.J., Peng, T.K., and Yin, S.J. (1996). Expression and activities of class IV alcohol dehydrogenase and class III aldehyde dehydrogenase in human mouth. Alcohol 13, 257-262. Donkor, J., Sariahmetoglu, M., Dewald, J., Brindley, D.N., and Reue, K. (2007). Three mammalian lipins act as phosphatidate phosphatases with distinct tissue expression patterns. J Biol Chem 282, 3450-3457.
181
Duester, G., Farres, J., Felder, M.R., Holmes, R.S., Hoog, J.O., Pares, X., Plapp, B.V., Yin, S.J., and Jornvall, H. (1999). Recommended nomenclature for the vertebrate alcohol dehydrogenase gene family. Biochem Pharmacol 58, 389-395. Duester, G., Shean, M.L., McBride, M.S., and Stewart, M.J. (1991). Retinoic acid response element in the human alcohol dehydrogenase gene ADH3: implications for regulation of retinoic acid synthesis. Mol Cell Biol 11, 1638-1646. Duley, J.A., Harris, O., and Holmes, R.S. (1985). Analysis of human alcohol- and aldehyde-metabolizing isozymes by electrophoresis and isoelectric focusing. Alcohol Clin Exp Res 9, 263-271. Eberle, D., Hegarty, B., Bossard, P., Ferre, P., and Foufelle, F. (2004). SREBP transcription factors: master regulators of lipid homeostasis. Biochimie 86, 839-848. Edenberg, H.J. (2000). Regulation of the mammalian alcohol dehydrogenase genes. Progress in Nucleic Acid Research and Molecular Biology 64, 295-341. Edenberg, H.J. (2007). The genetics of alcohol metabolism: role of alcohol dehydrogenase and aldehyde dehydrogenase variants. Alcohol Res Health 30, 5-13. Edenberg, H.J., and Bosron, W.F., eds. (1997). Alcohol dehydrogenases, F.P. Guengerich ed edn. Edenberg, H.J., Dick, D.M., Xuei, X., Tian, H., Almasy, L., Bauer, L.O., Crowe, R.R., Goate, A., Hesselbrock, V., Jones, K., et al. (2004). Variations in GABRA2, encoding the alpha 2 subunit of the GABA(A) receptor, are associated with alcohol dependence and with brain oscillations. Am J Hum Genet 74, 705-714. Edenberg, H.J., and Foroud, T. (2006). The genetics of alcoholism: identifying specific genes through family studies. Addict Biol 11, 386-396. Edenberg, H.J., Jerome, R.E., and Li, M. (1999). Polymorphism of the human alcohol dehydrogenase 4 (ADH4) promoter affects gene expression. Pharmacogenetics 9, 25-30. Edenberg, H.J., Wang, J., Tian, H., Pochareddy, S., Xuei, X., Wetherill, L., Goate, A., Hinrichs, T., Kuperman, S., Nurnberger, J.I., Jr., et al. (2008a). A regulatory variation in OPRK1, the gene encoding the kappa-opioid receptor, is associated with alcohol dependence. Hum Mol Genet 17, 1783-1789. Edenberg, H.J., Xuei, X., Chen, H.J., Tian, H., Wetherill, L.F., Dick, D.M., Almasy, L., Bierut, L., Bucholz, K.K., Goate, A., et al. (2006). Association of alcohol dehydrogenase genes with alcohol dependence: a comprehensive analysis. Human Molecular Genetics 15, 1539-1549. Edenberg, H.J., Xuei, X., Wetherill, L.F., Bierut, L., Bucholz, K., Dick, D.M., Hesselbrock, V., Kuperman, S., Porjesz, B., Schuckit, M.A., et al. (2008b). Association of NFKB1, which encodes a subunit of the transcription factor NF-kappaB, with alcohol dependence. Hum Mol Genet 17, 963-970.
182
Elnitski, L., Jin, V.X., Farnham, P.J., and Jones, S.J. (2006). Locating mammalian transcription factor binding sites: a survey of computational and experimental techniques. Genome research 16, 1455-1464. Emorine, L., Kuehl, M., Weir, L., Leder, P., and Max, E.E. (1983). A conserved sequence in the immunoglobulin J kappa-C kappa intron: possible enhancer element. Nature 304, 447-449. Estonius, M., Svensson, S., and Hoog, J.O. (1996). Alcohol dehydrogenase in human tissues: localisation of transcripts coding for five classes of the enzyme. FEBS letters 397, 338-342. Farre, D., Roset, R., Huerta, M., Adsuara, J.E., Rosello, L., Alba, M.M., and Messeguer, X. (2003). Identification of patterns in biological sequences at the ALGGEN server: PROMO and MALGEN. Nucleic Acids Res 31, 3651-3653. Feighner, J.P., Robins, E., Guze, S.B., Woodruff, R.A., Jr., Winokur, G., and Munoz, R. (1972). Diagnostic criteria for use in psychiatric research. Arch Gen Psychiatry 26, 57-63. Finck, B.N., Gropler, M.C., Chen, Z., Leone, T.C., Croce, M.A., Harris, T.E., Lawrence, J.C., Jr., and Kelly, D.P. (2006). Lipin 1 is an inducible amplifier of the hepatic PGC-1alpha/PPARalpha regulatory pathway. Cell Metab 4, 199-210. Finkelstein, J.D., and Martin, J.J. (1984). Methionine metabolism in mammals. Distribution of homocysteine between competing pathways. J Biol Chem 259, 9508-9513. Finkelstein, J.D., and Mudd, S.H. (1967). Trans-sulfuration in mammals. The methionine-sparing effect of cystine. J Biol Chem 242, 873-880. Fleming, K.A., and McGee, J.O. (1984). Alcohol induced liver disease. J Clin Pathol 37, 721-733. Frain, M., Swart, G., Monaci, P., Nicosia, A., Stampfli, S., Frank, R., and Cortese, R. (1989). The liver-specific transcription factor LF-B1 contains a highly diverged homeobox DNA binding domain. Cell 59, 145-157. Friedman, J.R., and Kaestner, K.H. (2006). The Foxa family of transcription factors in development and metabolism. Cell Mol Life Sci 63, 2317-2328. Gabay, C., and Kushner, I. (1999). Acute-phase proteins and other systemic responses to inflammation. N Engl J Med 340, 448-454. Galli, A., Pinaire, J., Fischer, M., Dorris, R., and Crabb, D.W. (2001). The transcriptional and DNA binding activity of peroxisome proliferator-activated receptor alpha is inhibited by ethanol metabolism. A novel mechanism for the development of ethanol-induced fatty liver. J Biol Chem 276, 68-75. Gallo, J.M., Noble, W., and Martin, T.R. (2007). RNA and protein-dependent mechanisms in tauopathies: consequences for therapeutic strategies. Cell Mol Life Sci 64, 1701-1714.
183
Gao, N., Zhang, J., Rao, M.A., Case, T.C., Mirosevich, J., Wang, Y., Jin, R., Gupta, A., Rennie, P.S., and Matusik, R.J. (2003). The role of hepatocyte nuclear factor-3 alpha (Forkhead Box A1) and androgen receptor in transcriptional regulation of prostatic genes. Molecular Endocrinology 17, 1484-1507. Garcia-Blanco, M.A., Baraniak, A.P., and Lasda, E.L. (2004). Alternative splicing in disease and therapy. Nat Biotechnol 22, 535-546. Garcia-Ruiz, C., Morales, A., Ballesta, A., Rodes, J., Kaplowitz, N., and Fernandez-Checa, J.C. (1994). Effect of chronic ethanol feeding on glutathione and functional integrity of mitochondria in periportal and perivenous rat hepatocytes. J Clin Invest 94, 193-201. Gazit, B., and Cedar, H. (1980). Nuclease sensitivity of active chromatin. Nucleic Acids Res 8, 5143-5155. Gong, P., and Cederbaum, A.I. (2006). Nrf2 is increased by CYP2E1 in rodent liver and HepG2 cells and protects against oxidative stress caused by CYP2E1. Hepatology 43, 144-153. Goodwin, D.W., Schulsinger, F., Hermansen, L., Guze, S.B., and Winokur, G. (1973). Alcohol problems in adoptees raised apart from alcoholic biological parents. Arch Gen Psychiatry 28, 238-243. Goodwin, D.W., Schulsinger, F., Moller, N., Hermansen, L., Winokur, G., and Guze, S.B. (1974). Drinking problems in adopted and nonadopted sons of alcoholics. Arch Gen Psychiatry 31, 164-169. Grant, B.F. (1996). DSM-IV, DSM-III-R, and ICD-10 alcohol and drug abuse/harmful use and dependence, United States, 1992: a nosological comparison. Alcohol Clin Exp Res 20, 1481-1488. Gregori, C., Kahn, A., and Pichard, A.L. (1994). Activity of the rat liver-specific aldolase B promoter is restrained by HNF3. Nucleic Acids Res 22, 1242-1246. Gronbaek, M. (2009). The positive and negative health effects of alcohol- and the public health implications. J Intern Med 265, 407-420. Guindalini, C., Scivoletto, S., Ferreira, R.G., Breen, G., Zilberman, M., Peluso, M.A., and Zatz, M. (2005). Association of genetic variants in alcohol dehydrogenase 4 with alcohol dependence in Brazilian patients. Am J Psychiatry 162, 1005-1007. Handler, J.A., Bradford, B.U., Glassman, E., Ladine, J.K., and Thurman, R.G. (1986). Catalase-dependent ethanol metabolism in vivo in deermice lacking alcohol dehydrogenase. Biochem Pharmacol 35, 4487-4492. Handler, J.A., and Thurman, R.G. (1988). Catalase-dependent ethanol oxidation in perfused rat liver. Requirement for fatty-acid-stimulated H2O2 production by peroxisomes. Eur J Biochem 176, 477-484. Hardie, D.G., Carling, D., and Carlson, M. (1998). The AMP-activated/SNF1 protein kinase subfamily: metabolic sensors of the eukaryotic cell? Annu Rev Biochem 67, 821-855.

184
Harding, P.P., and Duester, G. (1992). Retinoic acid activation and thyroid hormone repression of the human alcohol dehydrogenase gene ADH3. J Biol Chem 267, 14145-14150. Hardison, R.C. (2000). Conserved noncoding sequences are reliable guides to regulatory elements. Trends Genet 16, 369-372. Harrison-Findik, D.D., Klein, E., Evans, J., and Gollan, J. (2009). Regulation of liver hepcidin expression by alcohol in vivo does not involve Kupffer cell activation or TNF-alpha signaling. Am J Physiol Gastrointest Liver Physiol 296, G112-118. Harrison-Findik, D.D., Schafer, D., Klein, E., Timchenko, N.A., Kulaksiz, H., Clemens, D., Fein, E., Andriopoulos, B., Pantopoulos, K., and Gollan, J. (2006). Alcohol metabolism-mediated oxidative stress down-regulates hepcidin transcription and leads to increased duodenal iron transporter expression. J Biol Chem 281, 22974-22982. Hasin, D. (2003). Classification of Alcohol use diorders. Epidemiology in Alcohol Research 27, 5-17. Herbst, R.S., Nielsch, U., Sladek, F., Lai, E., Babiss, L.E., and Darnell, J.E., Jr. (1991). Differential regulation of hepatocyte-enriched transcription factors explains changes in albumin and transthyretin gene expression among hepatoma cells. New Biol 3, 289-296. Higuchi, H., Kurose, I., Kato, S., Miura, S., and Ishii, H. (1996). Ethanol-induced apoptosis and oxidative stress in hepatocytes. Alcohol Clin Exp Res 20, 340A-346A. Hill, S.Y., Shen, S., Zezza, N., Hoffman, E.K., Perlin, M., and Allan, W. (2004). A genome wide search for alcoholism susceptibility genes. Am J Med Genet B Neuropsychiatr Genet 128B, 102-113. Hirano, T., Kaplowitz, N., Tsukamoto, H., Kamimura, S., and Fernandez-Checa, J.C. (1992). Hepatic mitochondrial glutathione depletion and progression of experimental alcoholic liver disease in rats. Hepatology 16, 1423-1427. Hoffman, J.D., Hallam, S.E., Venne, V.L., Lyon, E., and Ward, K. (1998). Implications of a novel cryptic splice site in the BRCA1 gene. Am J Med Genet 80, 140-144. Hoog, J.O., and Brandt, M. (1995). Mammalian class VI alcohol dehydrogenase. Novel types of the rodent enzymes. Adv Exp Med Biol 372, 355-364. Hur, M.W., and Edenberg, H.J. (1995). Cell-specific function of cis-acting elements in the regulation of human alcohol dehydrogenase 5 gene expression and effect of the 5'-nontranslated region. J Biol Chem 270, 9002-9009. Hurley, T.D., Edenberg, H.J., and Li, T.-K. (2002). Pharmacogenomics of Alcoholism. In Pharmacogenomics: The Search for Individualized Therapies, M.-L.W. Julio Licinio, ed. (Culinary and Hospitality Industry Publications Services), pp. 417-441.

185
Irizarry, R.A., Hobbs, B., Collin, F., Beazer-Barclay, Y.D., Antonellis, K.J., Scherf, U., and Speed, T.P. (2003). Exploration, normalization, and summaries of high density oligonucleotide array probe level data. Biostatistics 4, 249-264. Itoh, K., Chiba, T., Takahashi, S., Ishii, T., Igarashi, K., Katoh, Y., Oyake, T., Hayashi, N., Satoh, K., Hatayama, I., et al. (1997). An Nrf2/small Maf heterodimer mediates the induction of phase II detoxifying enzyme genes through antioxidant response elements. Biochem Biophys Res Commun 236, 313-322. Itoh, K., Wakabayashi, N., Katoh, Y., Ishii, T., Igarashi, K., Engel, J.D., and Yamamoto, M. (1999). Keap1 represses nuclear activation of antioxidant responsive elements by Nrf2 through binding to the amino-terminal Neh2 domain. Genes Dev 13, 76-86. Itoh, K., Wakabayashi, N., Katoh, Y., Ishii, T., O'Connor, T., and Yamamoto, M. (2003). Keap1 regulates both cytoplasmic-nuclear shuttling and degradation of Nrf2 in response to electrophiles. Genes Cells 8, 379-391. Joulin, V., Garel, M.C., Le Boulch, P., Valentin, C., Rosa, R., Rosa, J., and Cohen-Solal, M. (1988). Isolation and characterization of the human 2,3-bisphosphoglycerate mutase gene. J Biol Chem 263, 15785-15790. Kaiser, R., Holmquist, B., Vallee, B.L., and Jornvall, H. (1991). Human class III alcohol dehydrogenase/glutathione-dependent formaldehyde dehydrogenase. J Protein Chem 10, 69-73. Kalsi, G., Prescott, C.A., Kendler, K.S., and Riley, B.P. (2009). Unraveling the molecular mechanisms of alcohol dependence. Trends Genet 25, 49-55. Kedishvili, N.Y., Bosron, W.F., Stone, C.L., Hurley, T.D., Peggs, C.F., Thomasson, H.R., Popov, K.M., Carr, L.G., Edenberg, H.J., and Li, T.K. (1995). Expression and kinetic characterization of recombinant human stomach alcohol dehydrogenase. Active-site amino acid sequence explains substrate specificity compared with liver isozymes. J Biol Chem 270, 3625-3630. Kedishvili, N.Y., Gough, W.H., Chernoff, E.A., Hurley, T.D., Stone, C.L., Bowman, K.D., Popov, K.M., Bosron, W.F., and Li, T.K. (1997). cDNA sequence and catalytic properties of a chick embryo alcohol dehydrogenase that oxidizes retinol and 3beta,5alpha-hydroxysteroids. J Biol Chem 272, 7494-7500. Kelly, C.L., Hinsdale, M.E., and Wood, P.A. (1993). Cloning and Characterization of the Mouse Short-Chain Acyl-CoA Dehydrogenase cDNA. Genomics 18, 137-140. Kendler, K.S., Prescott, C.A., Neale, M.C., and Pedersen, N.L. (1997). Temperance board registration for alcohol abuse in a national sample of Swedish male twins, born 1902 to 1949. Arch Gen Psychiatry 54, 178-184. Kent, W.J., Baertsch, R., Hinrichs, A., Miller, W., and Haussler, D. (2003). Evolution's cauldron: duplication, deletion, and rearrangement in the mouse and human genomes. Proc Natl Acad Sci U S A 100, 11484-11489.

186
Kent, W.J., Sugnet, C.W., Furey, T.S., Roskin, K.M., Pringle, T.H., Zahler, A.M., and Haussler, D. (2002). The human genome browser at UCSC. Genome research 12, 996-1006. Keshavarzian, A., Holmes, E.W., Patel, M., Iber, F., Fields, J.Z., and Pethkar, S. (1999). Leaky gut in alcoholic cirrhosis: a possible mechanism for alcohol-induced liver damage. American Journal of Gastroenterology 94, 200-207. Kimura, Y., Nishimura, F.T., Abe, S., Fukunaga, T., Tanii, H., and Saijoh, K. (2009). Polymorphisms in the promoter region of the human class II alcohol dehydrogenase (ADH4) gene affect both transcriptional activity and ethanol metabolism in Japanese subjects. J Toxicol Sci 34, 89-97. King, D.C., Taylor, J., Zhang, Y., Cheng, Y., Lawson, H.A., Martin, J., Chiaromonte, F., Miller, W., and Hardison, R.C. (2007). Finding cis-regulatory elements using comparative genomics: some lessons from ENCODE data. Genome research 17, 775-786. Koivusalo, M., and Uotila, L. (1991). Glutathione-dependent formaldehyde dehydrogenase (EC 1.2.1.1): evidence for the identity with class III alcohol dehydrogenase. Adv Exp Med Biol 284, 305-313. Kotagiri, S., and Edenberg, H.J. (1998). Regulation of human alcohol dehydrogenase gene ADH7: importance of an AP-1 site. DNA and cell biology 17, 583-590. Kuo, M.H., and Allis, C.D. (1999). In vivo cross-linking and immunoprecipitation for studying dynamic Protein:DNA associations in a chromatin environment. Methods 19, 425-433. Kwon, H.S., Kim, M.S., Edenberg, H.J., and Hur, M.W. (1999). Sp3 and Sp4 can repress transcription by competing with Sp1 for the core cis-elements on the human ADH5/FDH minimal promoter. J Biol Chem 274, 20-28. Kwon, H.S., Lee, D.K., Lee, J.J., Edenberg, H.J., Ahn, Y.H., and Hur, M.W. (2001). Posttranscriptional regulation of human ADH5/FDH and Myf6 gene expression by upstream AUG codons. Arch Biochem Biophys 386, 163-171. Lamle, J., Marhenke, S., Borlak, J., von Wasielewski, R., Eriksson, C.J., Geffers, R., Manns, M.P., Yamamoto, M., and Vogel, A. (2008). Nuclear factor-eythroid 2-related factor 2 prevents alcohol-induced fulminant liver injury. Gastroenterology 134, 1159-1168. Lee, C.S., Friedman, J.R., Fulmer, J.T., and Kaestner, K.H. (2005). The initiation of liver development is dependent on Foxa transcription factors. Nature 435, 944-947. Lee, D.K., Suh, D., Edenberg, H.J., and Hur, M.W. (2002). POZ domain transcription factor, FBI-1, represses transcription of ADH5/FDH by interacting with the zinc finger and interfering with DNA binding activity of Sp1. J Biol Chem 277, 26761-26768.

187
Lee, Y.J., and Shukla, S.D. (2007). Histone H3 phosphorylation at serine 10 and serine 28 is mediated by p38 MAPK in rat hepatocytes exposed to ethanol and acetaldehyde. Eur J Pharmacol 573, 29-38. Li, M., and Edenberg, H.J. (1998). Function of cis-acting elements in human alcohol dehydrogenase 4 (ADH4) promoter and role of C/EBP proteins in gene expression. DNA and cell biology 17, 387-397. Li, T.K., Bosron, W.F., Dafeldecker, W.P., Lange, L.G., and Vallee, B.L. (1977). Isolation of pi-alcohol dehydrogenase of human liver: is it a determinant of alcoholism? Proceedings of the National Academy of Sciences of the United States of America 74, 4378-4381. Li, T.K., Hewitt, B.G., and Grant, B.F. (2007). The Alcohol Dependence Syndrome, 30 years later: a commentary. the 2006 H. David Archibald lecture. Addiction 102, 1522-1530. Lichtsteiner, S., Wuarin, J., and Schibler, U. (1987). The interplay of DNA-binding proteins on the promoter of the mouse albumin gene. Cell 51, 963-973. Lieber, C.S. (1984). Metabolism and metabolic effects of alcohol. Med Clin North Am 68, 3-31. Lieber, C.S. (2004). The discovery of the microsomal ethanol oxidizing system and its physiologic and pathologic role. Drug Metab Rev 36, 511-529. Lieber, C.S., and DeCarli, L.M. (1968). Ethanol oxidation by hepatic microsomes: adaptive increase after ethanol feeding. Science 162, 917-918. Linden, D., William-Olsson, L., Ahnmark, A., Ekroos, K., Hallberg, C., Sjogren, H.P., Becker, B., Svensson, L., Clapham, J.C., Oscarsson, J., et al. (2006). Liver-directed overexpression of mitochondrial glycerol-3-phosphate acyltransferase results in hepatic steatosis, increased triacylglycerol secretion and reduced fatty acid oxidation. FASEB J 20, 434-443. Livak, K.J., and Schmittgen, T.D. (2001). Analysis of relative gene expression data using real-time quantitative PCR and the 2(-Delta Delta C(T)) Method. Methods 25, 402-408. Lu, S.C. (1999). Regulation of hepatic glutathione synthesis: current concepts and controversies. FASEB J 13, 1169-1183. Lu, S.C., Huang, Z.Z., Yang, H., Mato, J.M., Avila, M.A., and Tsukamoto, H. (2000). Changes in methionine adenosyltransferase and S-adenosylmethionine homeostasis in alcoholic rat liver. Am J Physiol Gastrointest Liver Physiol 279, G178-185. Luo, X., Kranzler, H.R., Zuo, L., Wang, S., Blumberg, H.P., and Gelernter, J. (2005). CHRM2 gene predisposes to alcohol dependence, drug dependence and affective disorders: results from an extended case-control structured association study. Hum Mol Genet 14, 2421-2434. MacSween, R.N., and Burt, A.D. (1986). Histologic spectrum of alcoholic liver disease. Semin Liver Dis 6, 221-232.

188
Mann, R.E., Smart, R.G., and Govoni, R. (2003). The Epidemiology of Alcoholic Liver Disease. Alcohol Res Health 23, 209-219. Mardh, G., Dingley, A.L., Auld, D.S., and Vallee, B.L. (1986). Human class II (pi) alcohol dehydrogenase has a redox-specific function in norepinephrine metabolism. Proc Natl Acad Sci U S A 83, 8908-8912. Mardh, G., Luehr, C.A., and Vallee, B.L. (1985). Human class I alcohol dehydrogenases catalyze the oxidation of glycols in the metabolism of norepinephrine. Proc Natl Acad Sci U S A 82, 4979-4982. Mardh, G., and Vallee, B.L. (1986). Human class I alcohol dehydrogenases catalyze the interconversion of alcohols and aldehydes in the metabolism of dopamine. Biochemistry 25, 7279-7282. Martinez, E. (2002). Multi-protein complexes in eukaryotic gene transcription. Plant Mol Biol 50, 925-947. Maston, G.A., Evans, S.K., and Green, M.R. (2006). Transcriptional Regulatory Elements in the Human Genome. Annu Rev Genomics Hum Genet 7, 29-59. Mayfield, R.D., Harris, R.A., and Schuckit, M.A. (2008). Genetic factors influencing alcohol dependence. Br J Pharmacol 154, 275-287. McClintick, J.N., and Edenberg, H.J. (2006). Effects of filtering by Present call on analysis of microarray experiments. BMC Bioinformatics 7, 49. McCullough, A.J., and O' Connor, J.F.B. (1998). Alcoholic liver disease: proposed recommendations for the American College of Gastroenterology. Am J Gastroenterol 93, 2022-2036. McEvily, A.J., Holmquist, B., Auld, D.S., and Vallee, B.L. (1988). 3 beta-Hydroxy-5 beta-steroid dehydrogenase activity of human liver alcohol dehydrogenase is specific to gamma-subunits. Biochemistry 27, 4284-4288. McGue, M. (1997). A behavioral-genetic perspective on children of alcoholics. Alcohol Health Res World 21, 210-217. McGue, M. (1999). The Behavioral Genetics of Alcoholism. Current Directions in Psychological Science 8, 109-115. McMahon, M., Itoh, K., Yamamoto, M., Chanas, S.A., Henderson, C.J., McLellan, L.I., Wolf, C.R., Cavin, C., and Hayes, J.D. (2001). The Cap'n'Collar basic leucine zipper transcription factor Nrf2 (NF-E2 p45-related factor 2) controls both constitutive and inducible expression of intestinal detoxification and glutathione biosynthetic enzymes. Cancer Res 61, 3299-3307. Mendel, D.B., Hansen, L.P., Graves, M.K., Conley, P.B., and Crabtree, G.R. (1991a). HNF-1 alpha and HNF-1 beta (vHNF-1) share dimerization and homeo domains, but not activation domains, and form heterodimers in vitro. Genes Dev 5, 1042-1056.
189
Mendel, D.B., Khavari, P.A., Conley, P.B., Graves, M.K., Hansen, L.P., Admon, A., and Crabtree, G.R. (1991b). Characterization of a cofactor that regulates dimerization of a mammalian homeodomain protein. Science 254, 1762-1767. Messeguer, X., Escudero, R., Farre, D., Nunez, O., Martinez, J., and Alba, M.M. (2002). PROMO: detection of known transcription regulatory elements using species-tailored searches. Bioinformatics 18, 333-334. Mieczkowski, J., Tyburczy, M.E., Dabrowski, M., and Pokarowski, P. (2010). Probe set filtering increases correlation between Affymetrix GeneChip and qRT-PCR expression measurements. BMC Bioinformatics 11, 104. Miller, W., Makova, K.D., Nekrutenko, A., and Hardison, R.C. (2004). Comparative genomics. Annu Rev Genomics Hum Genet 5, 15-56. Mokdad, A.H., Marks, J.S., Stroup, D.F., and Gerberding, J.L. (2004). Actual causes of death in the United States, 2000. JAMA 291, 1238-1245. Molotkov, A., Deltour, L., Foglio, M.H., Cuenca, A.E., and Duester, G. (2002). Distinct retinoid metabolic functions for alcohol dehydrogenase genes Adh1 and Adh4 in protection against vitamin A toxicity or deficiency revealed in double null mutant mice. J Biol Chem 277, 13804-13811. Neuman, M.G., Koren, G., and Tiribelli, C. (1993). In vitro assessment of the ethanol-induced hepatotoxicity on HepG2 cell line. Biochem Biophys Res Commun 197, 932-941. Neuman, M.G., Shear, N.H., Cameron, R.G., Katz, G., and Tiribelli, C. (1999). Ethanol-induced apoptosis in vitro. Clin Biochem 32, 547-555. Niemela, O. (2001). Distribution of ethanol-induced protein adducts in vivo: relationship to tissue injury. Free Radic Biol Med 31, 1533-1538. Niemela, O., Parkkila, S., Pasanen, M., Iimuro, Y., Bradford, B., and Thurman, R.G. (1998). Early alcoholic liver injury: formation of protein adducts with acetaldehyde and lipid peroxidation products, and expression of CYP2E1 and CYP3A. Alcohol Clin Exp Res 22, 2118-2124. Nieto, N., Friedman, S.L., and Cederbaum, A.I. (2002). Cytochrome P450 2E1-derived reactive oxygen species mediate paracrine stimulation of collagen I protein synthesis by hepatic stellate cells. J Biol Chem 277, 9853-9864. Nordeen, S.K. (1988). Luciferase reporter gene vectors for analysis of promoters and enhancers. Biotechniques 6, 454-458. Nurnberger, J.I., Jr., Wiegand, R., Bucholz, K., O'Connor, S., Meyer, E.T., Reich, T., Rice, J., Schuckit, M., King, L., Petti, T., et al. (2004). A family study of alcohol dependence: coaggregation of multiple disorders in relatives of alcohol-dependent probands. Arch Gen Psychiatry 61, 1246-1256. Ohtake, T., Saito, H., Hosoki, Y., Inoue, M., Miyoshi, S., Suzuki, Y., Fujimoto, Y., and Kohgo, Y. (2007). Hepcidin is down-regulated in alcohol loading. Alcohol Clin Exp Res 31, S2-8.

190
Orengo, J.P., and Cooper, T.A. (2007). Alternative splicing in disease. Adv Exp Med Biol 623, 212-223. Overdier, D.G., Porcella, A., and Costa, R.H. (1994). The DNA-binding specificity of the hepatocyte nuclear factor 3/forkhead domain is influenced by amino-acid residues adjacent to the recognition helix. Mol Cell Biol 14, 2755-2766. Pani, L., Overdier, D.G., Porcella, A., Qian, X., Lai, E., and Costa, R.H. (1992). Hepatocyte nuclear factor 3 beta contains two transcriptional activation domains, one of which is novel and conserved with the Drosophila fork head protein. Mol Cell Biol 12, 3723-3732. Park, P.H., Lim, R.W., and Shukla, S.D. (2005). Involvement of histone acetyltransferase (HAT) in ethanol-induced acetylation of histone H3 in hepatocytes: potential mechanism for gene expression. Am J Physiol Gastrointest Liver Physiol 289, G1124-1136. Peralba, J.M., Cederlund, E., Crosas, B., Moreno, A., Julia, P., Martinez, S.E., Persson, B., Farr s, J., Pares, X., and Jornvall, H. (1999). Structural and enzymatic properties of a gastric NADP(H)- dependent and retinal-active alcohol dehydrogenase. J Biol Chem 274, 26021-26026. Poso, H., and Poso, A.R. (1980). Stabilization of tyrosine aminotransferase and ornithine decarboxylase in regenerating rat liver by ethanol treatment. FEBS letters 113, 211-214. Prescott, C.A., Aggen, S.H., and Kendler, K.S. (1999). Sex differences in the sources of genetic liability to alcohol abuse and dependence in a population-based sample of U.S. twins. Alcohol Clin Exp Res 23, 1136-1144. Prescott, C.A., and Kendler, K.S. (1999). Genetic and environmental contributions to alcohol abuse and dependence in a population-based sample of male twins. Am J Psychiatry 156, 34-40. Purohit, V., Gao, B., and Song, B.J. (2009). Molecular mechanisms of alcoholic fatty liver. Alcohol Clin Exp Res 33, 191-205. Qian, X., and Costa, R.H. (1995). Analysis of hepatocyte nuclear factor-3 beta protein domains required for transcriptional activation and nuclear targeting. Nucleic Acids Res 23, 1184-1191. Qiu, X.B., Shao, Y.M., Miao, S., and Wang, L. (2006). The diversity of the DnaJ/Hsp40 family, the crucial partners for Hsp70 chaperones. Cell Mol Life Sci 63, 2560-2570. Reddy, J.K., and Hashimoto, T. (2001). Peroxisomal beta-oxidation and peroxisome proliferator-activated receptor alpha: an adaptive metabolic system. Annu Rev Nutr 21, 193-230. Rehm, J., Gmel, G., Sempos, C.T., and Trevisan, M. (2003). Alcohol-Related Morbidity and Mortality. Epidemiology in Alcohol Research 27, 39-51. Reich, T., Edenberg, H.J., Goate, A., Williams, J.T., Rice, J.P., Van Eerdewegh, P., Foroud, T., Hesselbrock, V., Schuckit, M.A., Bucholz, K., et al. (1998).
191
Genome-wide search for genes affecting the risk for alcohol dependence. American Journal of Medical Genetics 81, 207-215. Ren, B., Robert, F., Wyrick, J.J., Aparicio, O., Jennings, E.G., Simon, I., Zeitlinger, J., Schreiber, J., Hannett, N., Kanin, E., et al. (2000). Genome-wide location and function of DNA binding proteins. Science 290, 2306-2309. Robertson, G., Hirst, M., Bainbridge, M., Bilenky, M., Zhao, Y., Zeng, T., Euskirchen, G., Bernier, B., Varhol, R., Delaney, A., et al. (2007). Genome-wide profiles of STAT1 DNA association using chromatin immunoprecipitation and massively parallel sequencing. Nature methods 4, 651-657. Rojkind, M., and Martinez-Palomo, A. (1976). Increase in type I and type III collagens in human alcoholic liver cirrhosis. Proc Natl Acad Sci U S A 73, 539-543. Russell, D., and Snyder, S.H. (1968). Amine synthesis in rapidly growing tissues: ornithine decarboxylase activity in regenerating rat liver, chick embryo, and various tumors. Proc Natl Acad Sci U S A 60, 1420-1427. Sabo, P.J., Kuehn, M.S., Thurman, R., Johnson, B.E., Johnson, E.M., Cao, H., Yu, M., Rosenzweig, E., Goldy, J., Haydock, A., et al. (2006). Genome-scale mapping of DNase I sensitivity in vivo using tiling DNA microarrays. Nature methods 3, 511-518. Salmela, K.S., Kessova, I.G., Tsyrlov, I.B., and Lieber, C.S. (1998). Respective roles of human cytochrome P-4502E1, 1A2, and 3A4 in the hepatic microsomal ethanol oxidizing system. Alcohol Clin Exp Res 22, 2125-2132. Sambrook, T., Fritsch, E., F, and Maniatis, T. (1989). Molecular cloning: A laboratory manual, Second edn (Cold Spring Harbor Laboratory Press, New York, NY.). Sasaki, H., and Hogan, B.L. (1993). Differential expression of multiple fork head related genes during gastrulation and axial pattern formation in the mouse embryo. Development 118, 47-59. Schmidt, J.A., and Brown, W.J. (2009). Lysophosphatidic acid acyltransferase 3 regulates Golgi complex structure and function. J Cell Biol 186, 211-218. Schrem, H., Klempnauer, J., and Borlak, J. (2002). Liver-enriched transcription factors in liver function and development. Part I: the hepatocyte nuclear factor network and liver-specific gene expression. Pharmacol Rev 54, 129-158. Seitz, H.K., and Stickel, F. (2006). Risk factors and mechanisms of hepatocarcinogenesis with special emphasis on alcohol and oxidative stress. Biol Chem 387, 349-360. Shukla, S.D., and Aroor, A.R. (2006). Epigenetic effects of ethanol on liver and gastrointestinal injury. World J Gastroenterol 12, 5265-5271. Siegmund, S.V., and Brenner, D.A. (2005). Molecular pathogenesis of alcohol-induced hepatic fibrosis. Alcohol Clin Exp Res 29, 102S-109S.
192
Siepel, A., Bejerano, G., Pedersen, J.S., Hinrichs, A.S., Hou, M., Rosenbloom, K., Clawson, H., Spieth, J., Hillier, L.W., Richards, S., et al. (2005). Evolutionarily conserved elements in vertebrate, insect, worm, and yeast genomes. Genome research 15, 1034-1050. Sikorski, T.W., and Buratowski, S. (2009). The basal initiation machinery: beyond the general transcription factors. Curr Opin Cell Biol 21, 344-351. Smith, M. (1986). Genetics of human alcohol and aldehyde dehydrogenases. Advances in human genetics 15, 249-290. Smith, M., Hopkinson, D.A., and Harris, H. (1971). Developmental changes and polymorphism in human alcohol dehydrogenase. Annals of human genetics 34, 251-271. Smith, M., Hopkinson, D.A., and Harris, H. (1972). Alcohol dehydrogenase isozymes in adult human stomach and liver: evidence for activity of the ADH 3 locus. Annals of human genetics 35, 243-253. Song, L., and Crawford, G.E. (2010). DNase-seq: a high-resolution technique for mapping active gene regulatory elements across the genome from mammalian cells. Cold Spring Harb Protoc 2010, pdb prot5384. Soupene, E., and Kuypers, F.A. (2008). Mammalian long-chain acyl-CoA synthetases. Exp Biol Med (Maywood) 233, 507-521. Srinivasan, K., Shiue, L., Hayes, J.D., Centers, R., Fitzwater, S., Loewen, R., Edmondson, L.R., Bryant, J., Smith, M., Rommelfanger, C., et al. (2005). Detection and measurement of alternative splicing using splicing-sensitive microarrays. Methods 37, 345-359. Staab, C.A., Alander, J., Brandt, M., Lengqvist, J., Morgenstern, R., Grafstrom, R.C., and Hoog, J.O. (2008). Reduction of S-nitrosoglutathione by alcohol dehydrogenase 3 is facilitated by substrate alcohols via direct cofactor recycling and leads to GSH-controlled formation of glutathione transferase inhibitors. Biochem J 413, 493-504. Stewart, M.J., McBride, M.S., Winter, L.A., and Duester, G. (1990a). Promoters for the human alcohol dehydrogenase genes ADH1, ADH2, and ADH3: interaction of CCAAT/enhancer-binding protein with elements flanking the ADH2 TATA box. Gene 90, 271-279. Stewart, M.J., Shean, M.L., and Duester, G. (1990b). trans activation of human alcohol dehydrogenase gene expression in hepatoma cells by C/EBP molecules bound in a novel arrangement just 5' and 3' to the TATA box. Mol Cell Biol 10, 5007-5010. Su, J.S., Tsai, T.F., Chang, H.M., Chao, K.M., Su, T.S., and Tsai, S.F. (2006). Distant HNF1 site as a master control for the human class I alcohol dehydrogenase gene expression. The Journal of biological chemistry 281, 19809-19821.

193
Swift, R. (2003). Direct measurement of alcohol and its metabolites. Addiction 98 Suppl 2, 73-80. Szalai, G., Xie, D., Wassenich, M., Veres, M., Ceci, J.D., Dewey, M.J., Molotkov, A., Duester, G., and Felder, M.R. (2002). Distal and proximal cis-linked sequences are needed for the total expression phenotype of the mouse alcohol dehydrogenase 1 (Adh1) gene. Gene 291, 259-270. Thomas, M.C., and Chiang, C.M. (2006). The general transcription machinery and general cofactors. Crit Rev Biochem Mol Biol 41, 105-178. Thomasson, H.R., Crabb, D.W., Edenberg, H.J., Li, T.K., Hwu, H.G., Chen, C.C., Yeh, E.K., and Yin, S.J. (1994). Low frequency of the ADH2*2 allele among Atayal natives of Taiwan with alcohol use disorders. Alcohol Clin Exp Res 18, 640-643. Thomasson, H.R., Edenberg, H.J., Crabb, D.W., Mai, X.L., Jerome, R.E., Li, T.K., Wang, S.P., Lin, Y.T., Lu, R.B., and Yin, S.J. (1991). Alcohol and aldehyde dehydrogenase genotypes and alcoholism in Chinese men. Am J Hum Genet 48, 677-681. Thurman, R.G. (1998). II. Alcoholic liver injury involves activation of Kupffer cells by endotoxin. Am J Physiol 275, G605-611. Tian, H., and Edenberg, H.J. (2005). RSA Abstracts. Alcoholism: Clinical and Experimental Research 29, 6A-172A. Tjian, R. (1996). The biochemistry of transcription in eukaryotes: a paradigm for multisubunit regulatory complexes. Philos Trans R Soc Lond B Biol Sci 351, 491-499. Tsukamoto, H., and Lu, S.C. (2001). Current concepts in the pathogenesis of alcoholic liver injury. FASEB J 15, 1335-1349. van Ooij, C., Snyder, R.C., Paeper, B.W., and Duester, G. (1992). Temporal expression of the human alcohol dehydrogenase gene family during liver development correlates with differential promoter activation by hepatocyte nuclear factor 1, CCAAT/enhancer-binding protein alpha, liver activator protein, and D-element-binding protein. Mol Cell Biol 12, 3023-3031. Verschuur, M., de Jong, M., Felida, L., de Maat, M.P., and Vos, H.L. (2005). A hepatocyte nuclear factor-3 site in the fibrinogen beta promoter is important for interleukin 6-induced expression, and its activity is influenced by the adjacent -148C/T polymorphism. J Biol Chem 280, 16763-16771. Villagra, A., Cheng, F., Wang, H.W., Suarez, I., Glozak, M., Maurin, M., Nguyen, D., Wright, K.L., Atadja, P.W., Bhalla, K., et al. (2009). The histone deacetylase HDAC11 regulates the expression of interleukin 10 and immune tolerance. Nat Immunol 10, 92-100. Walker, A.P., Muscatelli, F., and Monaco, A.P. (1993). Isolation of the human Xp21 glycerol kinase gene by positional cloning. Hum Mol Genet 2, 107-114.

194
Wang, E.T., Sandberg, R., Luo, S., Khrebtukova, I., Zhang, L., Mayr, C., Kingsmore, S.F., Schroth, G.P., and Burge, C.B. (2008). Alternative isoform regulation in human tissue transcriptomes. Nature 456, 470-476. Wang, J.C., Grucza, R., Cruchaga, C., Hinrichs, A.L., Bertelsen, S., Budde, J.P., Fox, L., Goldstein, E., Reyes, O., Saccone, N., et al. (2009). Genetic variation in the CHRNA5 gene affects mRNA levels and is associated with risk for alcohol dependence. Mol Psychiatry 14, 501-510. Wang, J.C., Hinrichs, A.L., Stock, H., Budde, J., Allen, R., Bertelsen, S., Kwon, J.M., Wu, W., Dick, D.M., Rice, J., et al. (2004). Evidence of common and specific genetic effects: association of the muscarinic acetylcholine receptor M2 (CHRM2) gene with alcohol dependence and major depressive syndrome. Hum Mol Genet 13, 1903-1911. Weigel, D., and Jackle, H. (1990). The fork head domain: a novel DNA binding motif of eukaryotic transcription factors? Cell 63, 455-456. West, A.G., and Fraser, P. (2005). Remote control of gene transcription. Hum Mol Genet 14 Spec No 1, R101-111. Wheeler, M.D., Kono, H., Yin, M., Nakagami, M., Uesugi, T., Arteel, G.E., Gabele, E., Rusyn, I., Yamashina, S., Froh, M., et al. (2001). The role of Kupffer cell oxidant production in early ethanol-induced liver disease. Free Radic Biol Med 31, 1544-1549. Whistler, T., Chiang, C.F., Lin, J.M., Lonergan, W., and Reeves, W.C. (2010). The comparison of different pre- and post-analysis filters for determination of exon-level alternative splicing events using affymetrix arrays. J Biomol Tech 21, 44-53. Williams, J.T., Begleiter, H., Porjesz, B., Edenberg, H.J., Foroud, T., Reich, T., Goate, A., Van Eerdewegh, P., Almasy, L., and Blangero, J. (1999). Joint multipoint linkage analysis of multivariate qualitative and quantitative traits. II. Alcoholism and event-related potentials. Am J Hum Genet 65, 1148-1160. Williams, S.R., Mullegama, S.V., Rosenfeld, J.A., Dagli, A.I., Hatchwell, E., Allen, W.P., Williams, C.A., and Elsea, S.H. (2010). Haploinsufficiency of MBD5 associated with a syndrome involving microcephaly, intellectual disabilities, severe speech impairment, and seizures. Eur J Hum Genet 18, 436-441. Winter, L.A., Stewart, M.J., Shean, M.L., Dong, Y., Poellinger, L., Okret, S., Gustafsson, J.A., and Duester, G. (1990). A hormone response element upstream from the human alcohol dehydrogenase gene ADH2 consists of three tandem glucocorticoid receptor binding sites. Gene 91, 233-240. Worrall, S., de Jersey, J., Shanley, B.C., and Wilce, P.A. (1990). Detection of acetaldehyde-modified proteins in the livers of ethanol-fed rats. Biochem Soc Trans 18, 678-679. Wu, D., and Cederbaum, A.I. (2009). Oxidative stress and alcoholic liver disease. Semin Liver Dis 29, 141-154.
195
Xing, Y., Stoilov, P., Kapur, K., Han, A., Jiang, H., Shen, S., Black, D.L., and Wong, W.H. (2008). MADS: a new and improved method for analysis of differential alternative splicing by exon-tiling microarrays. RNA 14, 1470-1479. Xuei, X., Flury-Wetherill, L., Bierut, L., Dick, D., Nurnberger, J., Jr., Foroud, T., and Edenberg, H.J. (2007). The opioid system in alcohol and drug dependence: family-based association study. Am J Med Genet B Neuropsychiatr Genet 144B, 877-884. Yang, Z.N., Davis, G.J., Hurley, T.D., Stone, C.L., Li, T.K., and Bosron, W.F. (1994). Catalytic efficiency of human alcohol dehydrogenases for retinol oxidation and retinal reduction. Alcohol Clin Exp Res 18, 587-591. Yin, S.J., Chou, F.J., Chao, S.F., Tsai, S.F., Liao, C.S., Wang, S.L., Wu, C.W., and Lee, S.C. (1993). Alcohol and aldehyde dehydrogenases in human esophagus: comparison with the stomach enzyme activities. Alcohol Clin Exp Res 17, 376-381. Yin, S.J., Wang, M.F., Liao, C.S., Chen, C.M., and Wu, C.W. (1990). Identification of a human stomach alcohol dehydrogenase with distinctive kinetic properties. Biochem Int 22, 829-835. Yokoyama, H., Baraona, E., and Lieber, C.S. (1995). Upstream structure of human ADH7 gene and the organ distribution of its expression. Biochem Biophys Res Commun 216, 216-222. You, M., and Crabb, D.W. (2004a). Molecular mechanisms of alcoholic fatty liver: role of sterol regulatory element-binding proteins. Alcohol 34, 39-43. You, M., and Crabb, D.W. (2004b). Recent advances in alcoholic liver disease II. Minireview: molecular mechanisms of alcoholic fatty liver. Am J Physiol Gastrointest Liver Physiol 287, G1-6. You, M., Fischer, M., Deeg, M.A., and Crabb, D.W. (2002). Ethanol induces fatty acid synthesis pathways by activation of sterol regulatory element-binding protein (SREBP). J Biol Chem 277, 29342-29347. You, M., Matsumoto, M., Pacold, C.M., Cho, W.K., and Crabb, D.W. (2004). The role of AMP-activated protein kinase in the action of ethanol in the liver. Gastroenterology 127, 1798-1808. Zakhari, S. (2006). Overview: How Is Alcohol Metabolized by the Body? Alcohol Res Health 29, 245-254. Zammit, V.A. (2008). Carnitine palmitoyltransferase 1: central to cell function. IUBMB Life 60, 347-354. Zaret, K.S., Watts, J., Xu, J., Wandzioch, E., Smale, S.T., and Sekiya, T. (2008). Pioneer factors, genetic competence, and inductive signaling: programming liver and pancreas progenitors from the endoderm. Cold Spring Harb Symp Quant Biol 73, 119-126.

196
Zgombic-Knight, M., Foglio, M.H., and Duester, G. (1995). Genomic structure and expression of the ADH7 gene encoding human class IV alcohol dehydrogenase, the form most efficient for retinol metabolism in vitro. J Biol Chem 270, 4305-4311. Zhang, C.L., McKinsey, T.A., Chang, S., Antos, C.L., Hill, J.A., and Olson, E.N. (2002). Class II histone deacetylases act as signal-responsive repressors of cardiac hypertrophy. Cell 110, 479-488. Zhang, H., Kranzler, H.R., Yang, B.Z., Luo, X., and Gelernter, J. (2008a). The OPRD1 and OPRK1 loci in alcohol or drug dependence: OPRD1 variation modulates substance dependence risk. Mol Psychiatry 13, 531-543. Zhang, L., Rubins, N.E., Ahima, R.S., Greenbaum, L.E., and Kaestner, K.H. (2005). Foxa2 integrates the transcriptional response of the hepatocyte to fasting. Cell Metab 2, 141-148. Zhang, Y., Kwon, S., Yamaguchi, T., Cubizolles, F., Rousseaux, S., Kneissel, M., Cao, C., Li, N., Cheng, H.L., Chua, K., et al. (2008b). Mice lacking histone deacetylase 6 have hyperacetylated tubulin but are viable and develop normally. Mol Cell Biol 28, 1688-1701. Zhang, Z., Lotti, F., Dittmar, K., Younis, I., Wan, L., Kasim, M., and Dreyfuss, G. (2008c). SMN deficiency causes tissue-specific perturbations in the repertoire of snRNAs and widespread defects in splicing. Cell 133, 585-600. Zheng, Y.W., Bey, M., Liu, H., and Felder, M.R. (1993). Molecular basis of the alcohol dehydrogenase-negative deer mouse. Evidence for deletion of the gene for class I enzyme and identification of a possible new enzyme class. J Biol Chem 268, 24933-24939. Zhi, X., Chan, E.M., and Edenberg, H.J. (2000). Tissue-specific regulatory elements in the human alcohol dehydrogenase 6 gene. DNA and cell biology 19, 487-497.

CURRICULUM VITAE
EDUCATION Ph.D. in Biochemistry and Molecular Biology
2005 - 2010
Indiana University, Indianapolis, USA
Master of Professional Studies in Biochemistry and Molecular Biology
2001 - 2005
University of Maine, USA
Master of Science in Microbial Gene Technology
1999 - 2001
Madurai Kamaraj University, India
Bachelor of Science in Microbiology
1996 - 1999
Madras University, India
EXPERIENCE
Research, Indianapolis
o Identified and characterized an enhancer element upstream of alcohol dehydrogenase 4 (ADH4) gene.
o Studied the effects of single nucleotide polymorphisms in the regulatory regions of alcohol dehydrogenase genes, ADH4 and ADH1B.
o Analyzed the effects of long term ethanol treatment on global gene expression and alternative splicing in human hepatoma cell line by microarray analysis.
Research, Maine
o Identified two partial Phosphoribulokinase gene fragments in the sea slug DNA, providing evidence of horizontal gene transfer from the alga, Vaucheria litorea to the mollusk, Elysia chlorotica.
o Studied the stability of plastid proteins in the alga and the sea slug. o
Teaching, Maine
o Taught undergraduate lab courses in Introductory Biochemistry, Fundamental Chemistry and Microbiology.
o Set up labs for multiple lab courses including Advanced Biochemistry, Introductory Biochemistry, Fundamental Chemistry, and Introductory Microbiology.
o Evaluated lab reports and examinations for each course.
Research, Madurai
o Cloned yieL gene from Escherichia coli K-12 MG1655 and characterized the function of its gene product as endo-b-1,4-xylanase.
PUBLICATIONS
o Pochareddy, S. and Edenberg, H.J. Identification of FOXA dependent enhancer of human Alcohol dehydrogenase 4 (ADH4). Gene (2010) 460: 1-7
o Pochareddy, S. and Edenberg, H.J. Effects of long-term ethanol treatment on global gene expression in HepG2 cells (in preparation).
o Rumpho, M.E., Pochareddy, S., Worful, J.M., Summer, E.J., Bhattacharya, D., Pelletreau, K.N., Tyler, M.S., Lee, J., Manhart, J.R., and Soule, K.M. Molecular characterization of the calvincycle enzyme phosphoribulokinase in the Stramenopile alga Vaucheria litorea and the plastid hosting. Molecular Plant (2009) 2 : 1-13
o Edenberg, H.J., Wang, J., Tian, H., Pochareddy, S., Xuei, X., Wetherill, L., Goate, A., Hinrichs, T., Kuperman, S., Nurnberger, J.I., Schuckit, M., Tischfield, J.A., Foroud, T. A regulatory polymorphism in OPRK1, the gene encoding the kappa-opioid receptor, is associated with alcohol dependence. Human Molecular Genetics (2008) 17:1783-1789.
CONFERENCE ABSTRACTS
o Pochareddy, S. and Edenberg, H.J. Variations in an enhancer of the human Alcohol dehydrogenase 4 (ADH4) gene affect expression. Accepted for 33rd
Annual Research Society of Alcoholism scientific meeting, San Antonio, June 2010.
o Pochareddy, S. and Edenberg, H.J. Identification and characterization of an enhancer in the ADH cluster. Mechanisms of Eukaryotic transcription, Cold Spring Harbor, 2009.
o Dastoor, F., Pochareddy, S., and Rumpho, M.E. Phosphoribulokinase in Elysia chlorotica. 4th International Symbiosis Congress, Halifax, 2003.