transcriptome landscape of double negative t cells by
TRANSCRIPT

Journal of Autoimmunity 121 (2021) 102653
Available online 19 May 20210896-8411/© 2021 The Authors. Published by Elsevier Ltd. This is an open access article under the CC BY-NC-ND license(http://creativecommons.org/licenses/by-nc-nd/4.0/).
Transcriptome landscape of double negative T cells by single-cell RNA sequencing
Lu Yang a,b,c,1, Yanbing Zhu c,d,e,1, Dan Tian c,d,e,1, Song Wang c,d,e,1, Jincheng Guo f, Guangyong Sun c,d,e, Hua Jin c,d,e, Chunpan Zhang c,d,e, Wen Shi c,d,e, M. Eric Gershwin g,****, Zhongtao Zhang a,b,***, Yi Zhao f,**, Dong Zhang a,b,c,d,e,*
a General Surgery Department, Beijing Friendship Hospital, Capital Medical University, Beijing, 100050, China b National Clinical Research Center for Digestive Diseases, Beijing, 100050, China c Beijing Key Laboratory of Tolerance Induction and Organ Protection in Transplantation, Beijing, 100050, China d Immunology Research Center for Oral and Systemic Health, Beijing Friendship Hospital, Capital Medical University, China e Beijing Clinical Research Institute, Beijing, 100050, China f Key Laboratory of Intelligent Information Processing, Advanced Computer Research Center, Institute of Computing Technology, Chinese Academy of Sciences, Beijing, 100190, China g Division of Rheumatology, Allergy, and Clinical Immunology, University of California Davis, Davis, CA, USA
A R T I C L E I N F O
Keywords: Double negative T cell Single-cell RNA sequencing Unconventional T cells Inflammation Regulatory T cells Innate immunity
A B S T R A C T
CD4 and CD8 coreceptor double negative TCRαβ+ T (DNT) cells are increasingly being recognized for their critical and diverse roles in the immune system. However, their molecular and functional signatures remain poorly understood and controversial. Moreover, the majority of studies are descriptive because of the relative low frequency of cells and non-standardized definition of this lineage. In this study, we performed single-cell RNA sequencing on 28,835 single immune cells isolated from mixed splenocytes of male C57BL/6 mice using strict fluorescence-activated cell sorting. The data was replicated in a subsequent study. Our analysis revealed five transcriptionally distinct naïve DNT cell clusters, which expressed unique sets of genes and primarily per-formed T helper, cytotoxic and innate immune functions. Anti-CD3/CD28 activation enhanced their T helper and cytotoxic functions. Moreover, in comparison with CD4+, CD8+ T cells and NK cells, Ikzf2 was highly expressed by both naïve and activated cytotoxic DNT cells. In conclusion, we provide a map of the heterogeneity in naïve and active DNT cells, addresses the controversy about DNT cells, and provides potential transcription signatures of DNT cells. The landscape approach herein will eventually become more feasible through newer high throughput methods and will enable clustering data to be fed into a systems analysis approach. Thus the approach should become the “backdrop” of similar studies in the myriad murine models of autoimmunity, potentially highlighting the importance of DNT cells and other minor lineage of cells in immune homeostasis. The clear characterization of functional DNT subsets into helper DNT, cytotoxic DNT and innate DNT will help to better understand the intrinsic roles of different functional DNT subsets in the development and progression of autoimmune diseases and transplant rejection, and thereby may facilitate diagnosis and therapy.
Abbreviations: αGalCer, α-Galactosylceramide; aDNT, activated double-negative T cell; CD4, CD4+ T cell; CD8, CD8+ T cell; DNT, double-negative T cell; DGE, digital gene expression; DEG, differentially expressed genes; FACS, fluorescence activated cell sorting; GO, gene ontology; HEGs, highly expressed genes; LPC, lysophospholipid; MAIT, mucosal-associated invariant T cell; nDNT, naïve double-negative T cell; NK, natural killer cell; NKT, natural killer T cell; qRT-PCR, quantitative reverse transcriptase PCR; scRNA-seq, single-cell RNA sequencing; Treg, regulatory T cell; UMAP, uniform manifold approximation and projection.
* Corresponding authors. No. 95 Yong-an Road, Xi-cheng District, Beijing, 100050, PR China ** Corresponding author. *** Corresponding author. General Surgery Department, Beijing Friendship Hospital, Capital Medical University, Beijing, 100050, China **** Corresponding author.
E-mail addresses: [email protected] (M.E. Gershwin), [email protected] (Z. Zhang), [email protected] (Y. Zhao), [email protected] (D. Zhang). 1 Lu Yang, Yanbing Zhu, Dan Tian and Song Wang contributed equally to this work.
Contents lists available at ScienceDirect
Journal of Autoimmunity
journal homepage: www.elsevier.com/locate/jautimm
https://doi.org/10.1016/j.jaut.2021.102653 Received 14 April 2021; Received in revised form 30 April 2021; Accepted 3 May 2021

Journal of Autoimmunity 121 (2021) 102653
2
1. Introduction
Double-negative T (DNT) cells are a unique subset of TCRαβ+ T lymphocytes that do not express CD4, CD8 or natural killer (NK) cell markers. Although DNT cells only account for 1%–3% of total T lym-phocytes in the peripheral blood and lymph organs of humans and mice; an increasing number of studies have suggested that this unique T cell population plays critical and diverse roles in the immune system.
Most studies suggest that DNT cells are essential for maintaining immune system homeostasis with antigen specificity [1–3]. DNT cells highly express perforin, granzyme B and FasL and exhibit strong sup-pressive activity toward CD4+ and CD8+ T cells [4–8], as well as B cells [9,10], dendritic cells [11], and NK cells [12], which are capable of suppressing the immune response and providing significant protection against allograft rejection, graft-versus-host disease (GVHD), and auto-immune diseases [5,7,13–16]. For example, young NOD mice that display a high proportion of splenic DNT cells are potentially resistant to diabetes, and the proportion of DNT cells is significantly reduced in diabetes-prone mice in comparison to that in diabetes-resistant mice [16]. DNT cells also provide significant protection against Concanavalin A induced immune-mediated liver injury in mice [17]. In humans, DNT cells suppress Ag-specific T cells, and individuals who carry more than 1% DNT cells do not develop graft-versus-host disease (GVHD) [15].
Interestingly, some reports suggest that DNT cells are involved in systemic inflammation and tissue damage under autoimmune or in-flammatory conditions. In patients with systemic lupus erythematosus (SLE) [18–22] or primary Sjogren’s syndrome (pSS) [23,24], DNT cells that expand in peripheral blood and inflamed tissues are the major producers of the proinflammatory cytokine IL-17 and believed to be pathogenic. However, due to the lack of a specific positive marker, in these studies, DNT cells were often defined as CD4− CD8− TCRβ+ cells and thus may have been contaminated with IL-17-producing CD4− CD8−
NKT cells. Thus, whether DNT cells are the true producers of IL-17 and are responsible for pathogenesis in these autoimmune diseases remain controversial.
Recent studies have suggested that DNT cells contribute to immune surveillance against pathogens. It has been reported that DNT cells rather than CD4+ T cells are the major early responding T cell subset in lungs, such cells protect mice from infection with a live vaccine strain of Francisella tularensis [25]. Infection with Leishmania major leads to the activation and proliferation of DNT cells in infected mice. DNT cells upregulate genes associated with innate immune responses, including C3, Mac-1 (also known as CD11b and encoded by Itgam), myeloperox-idase (encoded by Mpo), and lysozyme (Lyz2), produce IFN-γ and TNF-α, and contribute to optimal primary and secondary protection against Leishmania major infection [26]. Moreover, influenza A virus infection induces DNT cells accumulating in the lungs of mice. These DNT cells are preactivated resident memory-like T cells in the lung parenchyma and serve as an integral component of the mucosal immune response against the influenza virus [27].
Overall, current research strongly supports the notion that DNT cells are comprised of a rare but heterogeneous T lymphocyte subset. Recognizing the molecular diversity and defining possible individual functional subsets of DNT cells will bring us closer to better under-standing the role of DNT cells under physiological and pathological conditions. In the study herein we took advantage of our ability to apply high throughput brute force analysis of the transcriptome of murine DNT cells.
2. Materials and methods
2.1. Mice splenic T cell enrichment
Eight-week-old C57BL/6 mice were purchased from Vital River Laboratory (Beijing, China). The mice were maintained in a pathogen- free, temperature-controlled environment with a 12-h light/dark
cycle. The animal studies were performed in compliance with the ethical guidelines for animal studies and approved by the Institutional Animal Care and Ethics Committee of Beijing Friendship Hospital. Six spleens from C57BL/6 male mice were dissociated by gentle mashing with a syringe plunger and filtered through a 70 μm mesh (BD biosciences, USA). After centrifugation for 5 min at 400×g, red blood cells were lysed using RBC Lysis Solution (Qiagen, Germany). Then enriched spleen T cells were obtained from splenocytes by T cell enrichment columns (R&D Systems, USA). Two biological replicates were performed with similar procedures. First biological replicate includes TCRαβ+ T, CD4+
T, CD8+ T, nDNT and aDNT cells. And the second biological replicate includes nDNT and aDNT cells.
2.2. Flow cytometry
Lysophosphatidylcholine (LPC) and alpha-galactosylceramide (αGal) were incubated with DimerX I Recombinant Soluble Dimeric Mouse CD1d (BD Biosciences, USA) and Mouse CD1d Tetramer PE (MBL, Japan), respectively, to produce lipid-CD1d complexes at 4 ◦C over-night. Splenic T cells were stained with LPC-CD1d dimer and αGal-CD1d tetramer at 4 ◦C for 1 h, followed by incubation with secondary rat anti- mouse IgG1 (BD Biosciences) at 4 ◦C for 1 h. At the last step, the cells were stained with other cell surface markers. All fluorescence reagents used in this study are listed in Table S1. We sorted individual TCRαβ+ T (CD3+NK1.1− TCRβ+), CD4+ T (CD3+NK1.1− TCRβ+CD4+CD8− ), CD8+
T (CD3+NK1.1− TCRβ+CD4− CD8+) and naïve DNT (nDNT, CD3+NK1.1− TCRβ+CD4− CD8− αGalCer-CD1d− LPC-CD1d− ) cells using fluorescence activated cell sorting (FACS) on Aria II Flow Cytometer (BD Biosciences), and all flow cytometry data were analyzed by FlowJo (Treestar, USA). In the flow cytometry verification step, we used cells from 5 spleens to obtain five biological replicates.
2.3. DNT cell stimulation in vitro
Briefly, 96-well plates were coated with anti-CD3 antibodies (5 μg/ ml, Biolegend, USA) at 37 ◦C for 2 h. Sorted nDNT cells were stimulated for 3 days at 37 ◦C in the presence of anti-CD28 antibodies (3 μg/ml, Biolegend) and mouse IL-2 (20 ng/ml, Peprotech, USA). Activated DNT (aDNT) cells were collected for scRNA-seq and qPCR.
2.4. Single-cell RNA sequencing
Sorted single-cell suspensions were processed with 10x Genomics and performed by ANNOROAD Gene Technology company. cDNA li-braries were obtained using Chromium Single Cell 3’ Library & Gel Bead Kit v2 or v3 (Table S2) and sequenced on a HiSeq X Ten platform.
2.5. Processing data from scRNA-seq with 10x genomics
We used Cell Ranger Single Cell Software Suite v.2.1.0 or v.3.1.0 (htt p://support.10xgenomics.com/) developed by 10 × Genomics to pro-cess the raw FASTQ files according to the sample preparation kit version (Table S2), namely sample de-multiplexing, barcode processing and single-cell 3’ gene counting, generate the digital gene expression (DGE) matrices. The references we used were mm10 genome and transcriptome.
2.6. Quality control of scRNA-seq samples
We imported the pre-processed DGE matrices of each sample into R (version 4.0.2) using Seurat package (version 3.2.2) [28,29]. Then, we removed the “low-quality” cells with percentage of mitochondrial genes more than 10 and number of detected genes lower than 500. Finally, we refined our analysis by applying a strategy of gene expression thresholds as:
L. Yang et al.

Journal of Autoimmunity 121 (2021) 102653
3
a. TCRαβ+ T cells: positive gene expression of Cd3d, Cd3e or Cd3g. b. CD4+ T cells: positive gene expression of Cd3d, Cd3e or Cd3g. Null
gene expression of Cd8a, Cd8b1 and Klrb1c. c. CD8+ T cells: positive gene expression of Cd3d, Cd3e or Cd3g. Null
gene expression of Cd4 and Klrb1c. d. Naïve DNT and activated DNT cells: positive gene expression of
Cd3d, Cd3e or Cd3g. Null gene expression of Cd4, Cd8b1 and Klrb1c. e. NK cells: Null gene expression of Cd3d, Cd3e and Cd3g.
2.7. Batch correcting of scRNA-seq data by harmony
We used “Harmony” to correct the batch effects across different datasets and different versions of library preparation kits (Table S2). In detail, after merging the count data of all samples, we first normalized them by regressing out the percentage of mitochondrial genes using SCTransform [30] and returned the corrected counts of all features and pearson residuals of 3000 highly variable features. After running the principal component analysis (PCA) using pearson residuals, we ran ‘RunHarmony’ [31] (harmony version 1.0) to remove the batch effects by correcting the PCA embeddings. Then, the first 30 dimensions of corrected PCA embeddings were reduced by Uniform Manifold Approximation and Projection (UMAP).
2.8. Batch correcting of scRNA-seq data by integration analysis
As the biological replicates of nDNT and aDNT cells were performed by different versions of 10x Genomics kits (Table S2), we followed Seurat integration analysis workflow [32] to correct the batch effects from different technologies. In detail, we normalized count data of each replicate sample by regressing out the percentage of mitochondrial genes using SCTransform and returned the corrected counts of all fea-tures and pearson residuals of 3000 highly variable features. After selecting features for downstream integration, we ran “PrepSCTInte-gration” on pearson residuals returned by “SCTransform”. Then after running PCA with selected features for each sample, we identified an-chors using reciprocal PCA based on the reference of replicate performed by Version 2 10x Genomics Kit. Using the identified anchors, the pearson residuals of each biological replicate were integrated. Then we ran PCA using integrated pearson residuals and obtained the PCA embeddings of two biological replicates. The first 30 dimensions of PCA embeddings were reduced by UMAP.
2.9. Comparative analysis of activated vs naïve DNT cells
The comparative analysis [28] https://satijalab.org/seura t/v3.2/immune_alignment.html of activated vs naïve DNT cells also followed the integrated analysis workflow, with small difference where reciprocal PCA was based on the reference of nDNT_rep1. In this way, we obtained the corresponding relationship between nDNT subgroups and aDNT subgroups.
2.10. Cell clustering of scRNA-seq data
We ran “FindNeighbors” to construct a shared nearest neighbor (SNN) graph using the first 30 dimensions of PCA embeddings. Then the Louvain algorithm was used to find cluster with the resolution set as 0.05 in integrated analysis of biological replicates and 0.01 in compar-ative analysis of nDNT vs aDNT cells.
2.11. Differential expression analysis of scRNA-seq data
According to the official manual, as differential expression analysis using pearson residuals is currently not supported by Seurat V3 https://satijalab.org/seurat/v3.2/sctransform_vignette.html, we can use the corrected log-normalized counts for differential expression and integration. However, to be the most optimal, the normalized count data
was calculated by the global-scaling normalization method “LogNorm-alize” and used to identify the DNT cell highly expressed genes (HEGs).
To identify the HEGs of DNT vs other cell types, such as the HEGs of nDNT vs CD4+ T cells, we used ‘FindMarkers’ function to find the HEGs of nDNT_rep1 vs CD4+ T cells (called HEGs1, Wilcoxon Rank Sum test, Bonferroni correction, p_val_adj < 0.05 and avg_logFC > 0.25), also the HEGs of nDNT_rep2 vs CD4+ T cells (called HEGs2, Wilcoxon Rank Sum test, Bonferroni correction, p_val_adj < 0.05 and avg_logFC > 0.25). Then we intersected the HEGs1 and HEGs2 to find genes that have higher expression levels in both nDNT_rep1 and nDNT_rep2 than CD4+ T cells. We used this approach because the nDNT_rep1, nDNT_rep2 and CD4+ T samples were performed by different version (nDNT_rep1 and CD4+ T from V2, nDNT_rep2 from V3) of Chromium Single Cell 3′ Li-brary & Gel Bead Kits (Table S2), where the V3 kit has much higher sensitivity than V2 kit. Intersecting the HEGs can reduce the false pos-itive HEGs resulting from different versions of preparation kits. We applied the same workflow to find the HEGs of nDNT vs CD8+ T, the HEGs of nDNT vs NK. Then we intersected the HEGs to find the genes that have higher expression levels in nDNT v.s. CD4, CD8 and NK cells. Similarly, we obtained the HEGs of aDNT v.s. CD4, CD8 and NK cells.
To identify the HEGs across the subgroups of individual cell type, such as HEGs across nDNT subgroups, we used the FindConserved-Markers function to find the HEGs (max_pval < 0.05, minimump_p_val < 0.05 and avg_logFC > 0.25) across different subgroups to reduce the false positive HEGs resulting from different versions of preparation kits. Similarly, we obtained the aDNT subgroup HEGs in this way. If the cell number of a subgroup is lower than 100, we only retained the HEGs expressed in more than 50% of subgroup cells and avg_logFC higher than 1.
To identify the subgroup HEGs which have higher expression levels than CD4+ T, CD8+ T and NK cells, such as the HEGs of nDNT0 vs CD4+
T, CD8+ T and NK cells, we followed the workflow that finding HEGs of nDNT0_rep1 vs CD4+ T cells (called HEGs1, p_val_adj < 0.05 and avg_logFC > 0.25), HEGs of nDNT0_rep2 vs CD4+ T cells (called HEGs2, p_val_adj < 0.05 and avg_logFC > 0.25) first, then intersecting HEGs1 and HEGs2, and finally obtaining the HEGs of nDNT0 vs CD4+ T cells. Then, we intersected the HEGs of nDNT0 vs CD4+ T cells, HEGs of nDNT0 vs CD8+ T cells, HEGs of nDNT0 vs NK cells. In this way, we obtained the HEGs of nDNT subgroups vs CD4+ T, CD8+ T and NK cells, also the HEGs of aDNT vs CD4+ T, CD8+ T and NK cells.
To identify the conserved markers of activated vs naïve DNT sub-groups, we ran FindConservedMarkers function to find the subgroup conserved markers between nDNT and aDNT cells according to the corresponding relationship defined by comparative analysis of activated vs naïve DNT cells.
To identify the up- or down-regulated DEGs during the activation of nDNT, for example, as we have identified nDNT0, nDNT2 and nDNT3 corresponding to aDNT0, and they were identified as cluster 0 (namely DNT0). We used FindMarkers function with the parameters of ident.1 =aDNT_rep1, ident.2 = nDNT_rep1, subset.ident = 0, group.by = “orig. ident”, to find the DEGs (called DEGs1, Wilcoxon Rank Sum test, Bon-ferroni correction, p_val_adj < 0.05) up- or down-regulated in DNT0 between nDNT_rep1 and aDNT_rep1. Similarly, we obtained the DEGs (called DEGs2, Wilcoxon Rank Sum test, Bonferroni correction, p_val_adj < 0.05) up- or down-regulated in DNT0 between nDNT_rep2 and aDNT_rep2. Then, we intersect DEGs1 with DEGs2, and finally get the up- or down-regulated markers in DNT0.
2.12. Doublets analysis of scRNA-seq data
To remove the possible doublets in nDNT4 cells, we used both DoubletDecon (version 1.1.6) [33,34] and DoubletFinder (version 2.0.3) [35]. To be more specific, after clustering scRNA-seq data, we use the DoubletDecon functions Improved_Seurat_Pre_Process and Main_-Doublet_Decon to get the object containing doublets information. Then the object processed by DoubletDecon was subjected to DoubletFinder
L. Yang et al.

Journal of Autoimmunity 121 (2021) 102653
4
function “doubletFinder_v3”. We assume the doublet formation rate in our dataset is 10%. Then we apply the “doubletFinder_v3” function to the object again, using the Seurat metadata column name for previously generated pANN results, and the adjusted total number of doublet pre-dictions produced.
2.13. Gene ontology (GO) and pathway enrichment analysis
GO (including BP, CC and MF), KEGG, REACTOME (Pathways and Reactions) and WikiPathways enrichment was performed by ClueGO (version 2.5.7) [36] plug-in of Cytoscape software [37] using the DEGs identified. The parameters of ClueGO are set as: Use GO Term Fusion, Demonstrate only Pathways with pV ≤ 0.05.
2.14. Graphs plotting
Most graphs were plotted by ggplot2 package (version 3.3.2) and venn plots were plotted by eulerr package (version 6.1.0, https://cran. r-project.org/package=eulerr).
2.15. qPCR verification
Total RNA was isolated from cells using a RNeasy® Plus Micro Kit (QIAGEN) and reverse transcribed into cDNA using a SuperScript III RT kit (Invitrogen, CA, USA). Real-time PCR was performed by the ABI 7500 sequence detection system (Applied Biosystems, CA, USA). Amplicon expression in each sample was normalized to GAPDH expression, and gene expression was subsequently quantified using the 2− ΔΔCt method. The genes and primer sequences are shown in Table S3. In this qPCR verification step, we used approximately twenty mice spleens to isolate T cell populations and DNT clusters for feature gene verification.
2.16. Codes availability
All the codes used for processing data and graphs were in the sup-plementary data.
2.17. Data availability
The data reported in this work have been uploaded in the Gene Expression Omnibus (GEO) database under accession number GSE129030.
3. Results
3.1. Single-cell transcriptome analysis of DNT cells
To investigate the single-cell transcriptome profile of DNT cells, we sequenced 28,835 single cells (including TCRαβ+ T, CD4+ T, CD8+ T, nDNT and aDNT cells), using the 10x Genomics Chromium system, a high-throughput and parallel droplet-based single-cell RNA-seq plat-form (The illustration of isolating each cell type and the typical gating strategy of FACS were shown in Figs. 1a and S1a. With the same gating strategy, the specificity of CD1d tetramer reagents was tested by staining the relevant cells, Fig. S1b), and analyzed 4273 previously published mouse splenic natural killer (NK) cells dataset (three biological repli-cates) [38] to identify the characteristics of nDNT and aDNT cells in the context of other TCRαβ+ T (CD4+ and CD8+ T) and NK cells. After quality control (Figs. S2a-c and Table S2), we applied a strategy of gene expression threshold to different type of cells to further refine our analysis (Table S2 and Figs. S2d-j) and obtained 29,949 cells in total.
After “Harmony” [31] corrected the batch effects across different datasets, the uniform manifold approximation and projection (UMAP) [39] analysis clearly segregated CD4+ T, CD8+ T, nDNT, aDNT, and NK cells (Fig. 1b). CD4+ and CD8+ T cells occupied the mutually exclusive
area of TCRαβ+ T cells (Figs. S3a-c). The two biological replicates of nDNT and aDNT cells, and the three replicates of NK cells overlapped with each other respectively (Figs. S3d-j). These results suggest that the experiment and analysis in this study are biological replicable.
Consistent with previous studies, CD62 ligand (encoded by Sell), a marker of naïve T cells [40], was highly expressed in TCRαβ+ T, CD4+ T, CD8+ T and nDNT cells (Fig. S4a). Ncr1 [38] was specifically highly expressed only in NK cells (Fig. S4b). The marker gene expression pat-terns also demonstrate the experimental reliability.
3.2. nDNT versus CD4+ T, CD8+ T, and NK cells
To determine the expression characteristics of total nDNT cells, we first compared nDNT with CD4+ T, CD8+ T and NK cells. nDNT cells expressed 143, 150 and 163 genes which have significantly higher expression levels than CD4+ T, CD8+ T and NK cells, respectively (Fig. 1c top-left panel and Table S4). We classified the 110 genes, which have higher expression levels in nDNT cells than those in CD4+ and CD8+ T cells, into three categories: cell membrane molecules, tran-scription factors and secreted proteins (Fig. 1c top-left panel and 1d). Gene ontology (GO) and pathway enrichment analysis showed that genes, which have higher expression levels in nDNT cells than those in CD4+ and CD8+ T cells, were enriched in natural killer cell mediated cytotoxicity, IL-17 signaling pathway and transcription factor AP-1 complex (Fig. 1e).
We then validated the mRNA expression levels of 11 markers, such as Ikzf2 and Ly6c2, in nDNT, CD4+ T and CD8+ T cells, using quantitative reverse transcriptase PCR (qRT-PCR) (Fig. S5a), and all the qPCR results coincided with the scRNA-seq results (Fig. S5b).
Among the 110 genes with significantly higher expression levels in nDNT v.s. CD4+ T and CD8+ T cells, only five genes (Ikzf2, Ly6c2, Cd160, Cxcr3 and Snhg9) had significantly higher expression levels in nDNT than those in NK cells (Fig. 1c top-left panel, 1d, and S4c-g, and Table S4 and S5). In these 5 genes, only the avg_logFC (nDNT vs CD4+ T, CD8+ T and NK cells respectively) of Ikzf2 and the avg_logFC (nDNT vs CD4+ T cells) of Ly6c2 were higher than 1 (Fig. S4 and Table S4). Then we further verified the expression levels of IKZF2 and Ly-6C in nDNT, CD4+
T, CD8+ T and NK cells by flow cytometry (Fig. S5c). As the proteins encoded by Ly6c1 and Ly6c2 share 95% of amino acid sequence, the commercial flow cytometry Ly-6C antibody detected the mixture of proteins encoded by both Ly6c1 and Ly6c2. As shown in Fig. S5c, although Ly-6C detected the mixture of proteins encoded by both Ly6c1 and Ly6c2, the percentage of Ly-6C+ cells in nDNT cells was still significantly higher than that in CD4+ T cells, and the percentage of IKZF2+ cells in nDNT cells was markedly higher than that in CD4+ T, CD8+ T and NK cells (Fig. S5c), which coincided with the mRNA expression (Fig. S5d). The mRNA expression levels of Ly6c1 and Ly6c2 in scRNA-seq showed that Ly6c1 expression was lower than Ly6c2 in nDNT cells (Fig. S5e). Therefore, we suggest that Ikzf2 and Ly6c2 are of great significance for DNT cells in naïve mice.
To determine the expression characteristics of nDNT cells that also conserved after activation, we then compared aDNT cells with CD4+ T, CD8+ T and NK cells. 533, 592 and 475 genes have higher expression levels in aDNT cells than those in CD4+ T, CD8+ T and NK cells, respectively (Fig. 1c top-right panel and Table S5). 486 genes expressed by aDNT cells were significantly higher than that expressed by both CD4+ and CD8+ T cells (Fig. 1c top-right panel). Among them, 36 genes were found highly expressed by both nDNT and aDNT cells compared with CD4+ and CD8+ T cells (Fig. 1c bottom-left panel and 1d). These 36 genes included 9 cell surface molecules such as Cd160, Cd44, Fcer1g, Il2rb and Klra7 (also known as Ly49G), 5 secreted protein genes such as Ctla2a, Ifng, and Xcl1, 6 transcriptional factors such as Ikzf2, Jund, Pim1 and Sub1, and 16 other genes (Fig. 1d). Among the 36 genes with significantly higher expression levels in both nDNT and aDNT cells, only the transcriptional factor Ikzf2 had a higher expression level than that in NK cells (Fig. 1c bottom-right and 1d). Although the mRNA expression
L. Yang et al.

Journal of Autoimmunity 121 (2021) 102653
5
(caption on next page)
L. Yang et al.

Journal of Autoimmunity 121 (2021) 102653
6
level of Ikzf2 was downregulated in aDNT cells (Fig. S5d), the IKZF2+
cells in aDNT cells was still higher than that in CD4+ T, CD8+ T and NK cells (Fig. S5c). Overall, these results indicated that IKZF2 is a distin-guished transcriptional factor of DNT cells.
3.3. Transcriptomic signatures of nDNT subgroups
To assess the heterogeneity of nDNT cells, we first corrected the batch effects by Seurat integration analysis [28], then projected all 9503 nDNT cells, two biological replicates, on UMAP plots and finally identified five subgroups (Fig. 2a). Cells of five subgroups in two bio-logical replicates had the same UMAP distributions (Fig. S6). We observed 657 highly expressed genes (HEGs) across each subgroup (Fig. 2b and Table S6). In addition, among those 657 HEGs, 286 HEGs also had higher expression levels in nDNT cells than in CD4+ T, CD8+ T and NK cells (Fig. S7 and Table S7). Then, we classified the 10-top fold-change HEGs of each subgroup into four categories: cell mem-brane markers, secreted protein genes, transcription factors and the remaining genes, and showed which of HEGs also had higher expression levels in nDNT than those in CD4+ T, CD8+ T and NK cells (Fig. 2c).
Cluster 0 (nDNT0) accounted for the majority (78.0%, 7413 cells) of nDNT cells, and had 72 HEGs (Fig. 2b and Table S6), which include cell surface molecules: Cd2, Cd7, Ly6c2, Cd160, cytokine receptor (Ifngr1 and Il2rb), killer cell lectin-like receptor (Klrd1 and Klra7); secreted protein genes: chemokine ligand (Ccl5 and Xcl1) and Ctsw; and tran-scription factors: Ikzf2 (Fig. 2c and Table S6). Bcl2, which blocks the apoptotic death of lymphocytes [41], was also highly expressed in nDNT0 cells. GO and pathway analysis showed that nDNT0 subgroup HEGs are involved in ribosome, and natural killer cell mediated cyto-toxicity (Fig. S8 and Table S6 and S8). Studies have suggested that CD94 (encoded by Klrd1) is a negative regulator of NK cells. The CD94-NKG2A (encoded by Klrc1) heterodimer or Ly49G2 (encoded by Klra7) [42], binds with nonclassical MHC class I molecules on target cells and stops NK cells from killing target cells [43–45]. The results indicate that nDNT0 cells mainly functions as resting nDNT cells: keeping themselves alive, synthetic proteins, preparing for activation and migration but not killing target cells.
Cluster 1 (nDNT1) accounted for 12.4% (1180 cells) of nDNT and had 209 HEGs (Fig. 2b). The ten top fold-change HEGs of nDNT1 cells include cell membrane markers: receptors (Ccr2, Cxcr6 and Il7r), T cell costimulator Icos and transmembrane protein (Tmem176a and Tmem176b); secreted protein markers: proteinase inhibitor Serpinb1a; and transcriptional factors: AP-1 complex members (Fos, Fosb, Jun and Junb), DNA-binding inhibitor Id2, transcriptional activator or repressor Maf, and nuclear hormone receptor (Nr1d1, Rora and Rorc) (Fig. 2c and Table S6). GO and pathway enrichment analysis showed that HEGs of nDNT1 cells were significantly enriched in T cell activation and Th1, Th2 and Th17 differentiation (Fig. S8 and Table S6 and S8). Considering the transcriptional factor RORγt (encoded by Rorc) is also expressed by mucosal-associated invariant T cells (MAIT), we used Vβ6 and Vβ8, the limited array of TCR β-chains expressed in mouse MAIT cells [46,47], to assess the possible CD4− CD8− MAIT contamination in nDNT1 cells. As shown in Fig. S9, nDNT1 cells contained about 2.9% Vβ6+ and 15.9% Vβ8+ cells in average, which indicated the nDNT1 cells contained a small number of CD4− CD8− MAIT cells. Overall, the HEGs and enrich-ment results suggest that nDNT1 cells mainly act as T helper cells, although contain some MAIT cells.
Cluster 2 (nDNT2) accounted for 7.5% (712 cells) of nDNT cells and had 196 HEGs (Fig. 2b), such as cell membrane marker Slamf6 and Slamf7, secreted protein marker Cst7 and Anxa5, and transcription fac-tors Eomes and Nr4a2 (Fig. 2c and Table S6). GO and pathway enrich-ment analysis showed that nDNT2 HEGs were significantly involved in T cell differentiation and immunoregulatory interactions between a lymphoid and a non-lymphoid cell (Fig. S8 and Table S6 and S8). The transcription factor eomesodermin (encoded by Eomes), which induces T cells to express cytokines [48], was highly expressed in nDNT2 cells. In addition, Eomes-regulated interferon-γ (encoded by Ifng) and granzyme B (encoded by Gzmb) were not highly expressed in nDNT2 but in nDNT3 cells (Fig. 2c and Table S6). As CRACC (encoded by Slamf7) inhibits cytotoxicity of natural killer cells in the absence of EAT-2 (encoded by Sh2d1b1, which was almost not expressed in nDNT2) [49]. Therefore, we suggest that nDNT2 cells act as intermediate nDNT cells, already expressing some signs of activation but still unable to kill target cells.
Cluster 3 (nDNT3) accounted for 1.1% (108 cells) of nDNT cells and had 134 HEGs (Fig. 2b), such as cell membrane marker Klrc1, Klre1, Klrk1 and Nkg7, secreted protein Ccl4, Ccl5, Gzmb, Gzmk and Ifng, and transcriptional factor Hmgb2, Sub1 and Zeb2 (Fig. 2c and Table S6). nDNT3 HEGs were not only enriched in T cell activation and differen-tiation, but also enriched in natural killer cell mediated cytotoxicity (Fig. S8 and Table S6 and S8), which indicate the cytotoxic function of nDNT3 cells.
As cluster 4 (nDNT4) only accounted for only 0.9% (90 cells) of nDNT cells, we applied a stringent screening criterion to identify HEGs and found 46 HEGs (Fig. 2b): such as cell membrane marker Cd74 and H2-Aa, secreted protein genes Lyz2, and transcriptional factor Spi1 (Fig. 2c and Table S6). GO and pathway enrichment analysis showed that nDNT4 HEGs were involved in antigen processing and presentation of exogenous peptide antigen via MHC class II and phagosome (Fig. S8 and Table S6 and S8), which are a key parts of the innate immune response [50]. The HEGs and enrichment analysis indicate that nDNT4 cells mainly function as innate immune cells.
MHC class II molecules, which are expressed mainly by antigen presentation cells, has not been seen expressing in murine T cells. After removing all the doublets that can detected by both DoubletDecon and DoubletFinder, we found that nDNT4 cells still highly expressed MHC class II antigen presentation related genes, such as Cd74, H2-Ab1 and H2-Eb1, and transcriptional factor Spi1 which is expressed in various hematopoietic lineage (Figs. S10a-d).
To validate the function of each nDNT subgroup, we isolated these 5 sub-groups of nDNT by FACS using four cell surface markers from nDNT subgroup HEGs, namely Cxcr6 (encoding CXCR6), Slamf7 (encoding CD319), Klrc1 (encoding NKG2A) and Cd74 (encoding CD74). No more than 5% of the cells overlapped (top right part of each panel in Fig. 3a). Consistent with nDNT0, N0 in flow cytometry (CD74− CD319-CXCR6-NKG2A- nDNT) also dominated in nDNT (Fig. 3b–c). The proportions of N1 (CD74− CD319− CXCR6+NKG2A− nDNT), N2 (CD74− CD319+CXCR6− NKG2A− nDNT), N3 (CD74− CD319− CXCR6− NKG2A+
nDNT) and N4 (CD74+CD319− CXCR6− NKG2A− nDNT) in flow cytometry agreed with those of corresponding nDNT1, nDNT2, nDNT3 and nDNT4 (Fig. 3b–c). The marker genes specifically highly expressed by nDNT0 - nDNT4 were confirmed by qRT-PCR in sorted N0, N1, N2, N3 and N4 of nDNT cells, respectively (Fig. 3d). As Fig. 3d shows, nDNT0 cells functioned as resting cells and highly expressed Klrd1, the negative regulator of natural killer cells [51]; nDNT1 cells functioned as helper cells and highly expressed Rora, which syner-gizes the Rorc to regulate the Th17 lineage [52]; nDNT2 cells functioned as
Fig. 1. Single-cell transcriptome analysis of murine DNT cells, a Schema of experimental procedures. b Uniform manifold approximation and projection (UMAP) graph of 29,949 cells from six cell types: TCRαβ+ T, CD4+ T, CD8+ T, nDNT, aDNT and NK cells. c Venn plot in top-left panel shows the number of genes that have significantly higher expression levels in nDNT cells than in CD4+ T, CD8+ T or NK cells, respectively. Venn plot in top-right panel shows the number of genes that have significantly higher expression levels in aDNT cells than in CD4+ T, CD8+ T or NK cells, respectively. Venn plot in bottom-left panel shows the number of genes that have higher expression levels in nDNT or aDNT cells than in conventional T cells (CD4+ and CD8+ T cells), respectively. Venn plot in bottom-right panel shows the number of genes that have higher expression levels in nDNT or aDNT cells than in other cells (CD4+ T, CD8+ T and NK cells), respectively. d Heatmap shows the relative expression levels of the 110 HEGs, which have higher expression levels in nDNT cells than in conventional T cells (CD4+ and CD8+ T cells) (p_val_adj < 0.05 and avg_logFC > 0.25). e Dot plot shows the GO and pathway enrichment of 110 HEGs of nDNT vs CD4+ and CD8+ T cells.
L. Yang et al.

Journal of Autoimmunity 121 (2021) 102653
7
intermediate cells and highly expressed Eomes, which induces T cells to express cytokines [48]; nDNT3 cells functioned as the cytotoxic cells and highly expressed Gzmb, which can be secreted by NK and CTL cells to kill cells [53]. Besides that, the flow cytometry results also verified the functions of nDNT
subgroups: nDNT1 cells highly expressed IL17A indicating its proinflammatory function, and nDNT3 cells highly expressed GZMB indicating its cytotoxic func-tion (Fig. 3e), which agreed with the scRNA-seq results (Fig. 3f). We also found that IKZF2 was highly expressed in nDNT0 and nDNT3 (Fig. 3e–f), which
Fig. 2. Naïve DNT have five subgroups. a UMAP plot of 9503 nDNT cells that were segregated into five clusters. b Heatmap of 657 nDNT-subgroup HEGs that clearly clustered each nDNT subgroup (max_pval < 0.05 and minimump_p_val < 0.05). c Dot plots demonstrate the relative gene expression and expressed percentage of nDNT-subgroup HEGs. The HEGs were 10 top-fold-change genes of each subgroup, and represented four categories: cell membrane marker, secreted protein, transcriptional factor, and remaining genes. The color of the dots shows the relative expression levels of genes, and the size of the dots shows the percentage of expressed cells.
L. Yang et al.

Journal of Autoimmunity 121 (2021) 102653
8
(caption on next page)
L. Yang et al.
Journal of Autoimmunity 121 (2021) 102653
9
indicates that IKZF2 is an important transcription factor for cytotoxic nDNT subgroups. With a little mRNA expression of Ly6c1 (Fig. 3g), Ly-6C was highly expressed in nDNT0 and nDNT2 and low expressed in proinflammatory nDNT1 cells (Fig. 3e–f), which indicates that Ly6c2 may be one of the key genes for nDNT cells excluding the proinflammatory cells.
To sum up, we identified five nDNT subgroups including resting DNT (nDNT0), helper DNT (nDNT1), intermediate DNT (nDNT2), cytotoxic DNT (nDNT3), and innate DNT (nDNT4). And in the physiology naïve condition, there have been a few DNT cells functions as proin-flammatory or cytotoxic cells.
3.4. Transcriptomic signatures of aDNT subgroups
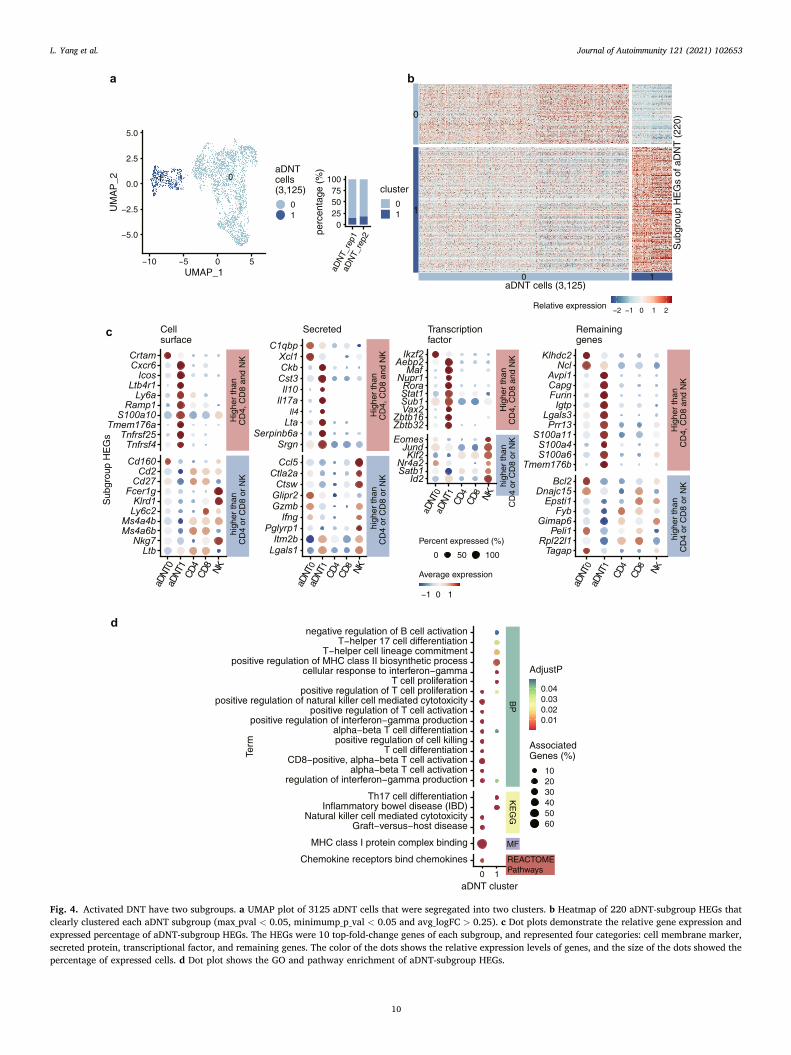
To determine the heterogeneity of activated DNT (aDNT) cells, we first corrected the batch effects by Seurat integration analysis [28], then projected 3125 aDNT cells (two biological replicates) on UMAP and finally identified two aDNT subgroups (Figs. 4a and S11a). We found 220 aDNT subgroup HEGs (Fig. 4b and Table S9), and 51.4% (113 genes) aDNT subgroup HEGs also had higher expression levels than CD4+ T, CD8+ T and NK cells (Fig. S12 and Table S10).
As the biggest cluster (2618 cells, 83.8% of aDNT cells) (Fig. 4b and Table S9), aDNT0 cells specifically expressed cell membrane genes such as Cd160, Klrd1 and Ly6c2, secreted protein genes such as Ccl5, Ifng and Gzmb, and transcriptional factors such as Eomes, Nr4a1, Nr4a2 and Ikzf2 (Fig. 4c and Table S9). The aDNT0 HEGs were mainly enriched in pos-itive regulation of cell killing and interferon-gamma production (Fig. 4d and Table S11), which indicates the cytotoxic function of aDNT0 cells through Gzmb and Ifng.
aDNT1 cells account for 16.2% (507 cells) of aDNT and express 148 HEGs (Fig. 4b and Table S9), including cell membrane genes such as Cxcr6 and Icos, secreted protein genes such as Il17a, Il4, Lta and Ser-pinb6a, and transcriptional factors such as Id2, Rora, Zbtb16 and Zbtb32 (Fig. 4c and Table S9). The aDNT1 HEGs were mainly enriched in T cell proliferation and Th17 cell differentiation (Fig. 4d and Table S9), which indicates the proinflammatory function of aDNT1 cells through IL17A.
To further validate the function of aDNT0 and aDNT1 cells, we used anti-CXCR6 antibody to distinguish aDNT subgroups and analyzed GZMB and IL17A expressions in CXCR6+ and CXCR6- cells by flow cytometry (Fig. S11b). We observed that only the CXCR6+ cells (aDNT1 subgroup) secreted IL17A (about 14%) (Fig. S11b), which corresponded with the mRNA result (Figs. S11g) and verified the proinflammatory function of aDNT1 cells. Besides that, about 55% of CXCR6- cells (aDNT0) were GZMB+, which indicates the cytotoxic function of aDNT0 cells (Fig. S11b). However, as the Cxcr6 still had some mRNA expression in aDNT0 cells (Fig. S11c), and not all the aDNT1 cells expressed Cxcr6, which led that the sorted aDNT subgroups were not mutually exclusive and the percentage of GZMB+ cells in CXCR6+ (aDNT1) cells was also high (Fig. S11b), better cell surface marker antibodies to distinguish aDNT0 and aDNT 1 are needed. As Ikzf2 and Ly6c2 were also identified as aDNT0 HEGs (Figs. S11d, f), we also verified the expression levels of IKZF2 and Ly-6C by flow cytometry. Corresponding to the mRNA results (Figs. S11d-f), the percentages of IKZF2+ and Ly-6C+ cells in CXCR6-
(aDNT0) cells are slightly higher than in CXCR6+ (aDNT1) cells (Fig. S11b). Despite the differences between protein and mRNA expression levels of Ikzf2 and Ly6c2, the results can still indicate that Ikzf2 and Ly6c2 are conservatively expressed by cytotoxic DNT cells.
In conclusion, aDNT cells are comprised of two subgroups: the cytotoxic aDNT0 in majority, and the proinflammatory aDNT1 in minor.
3.5. Conserved signatures between naïve and activated DNT
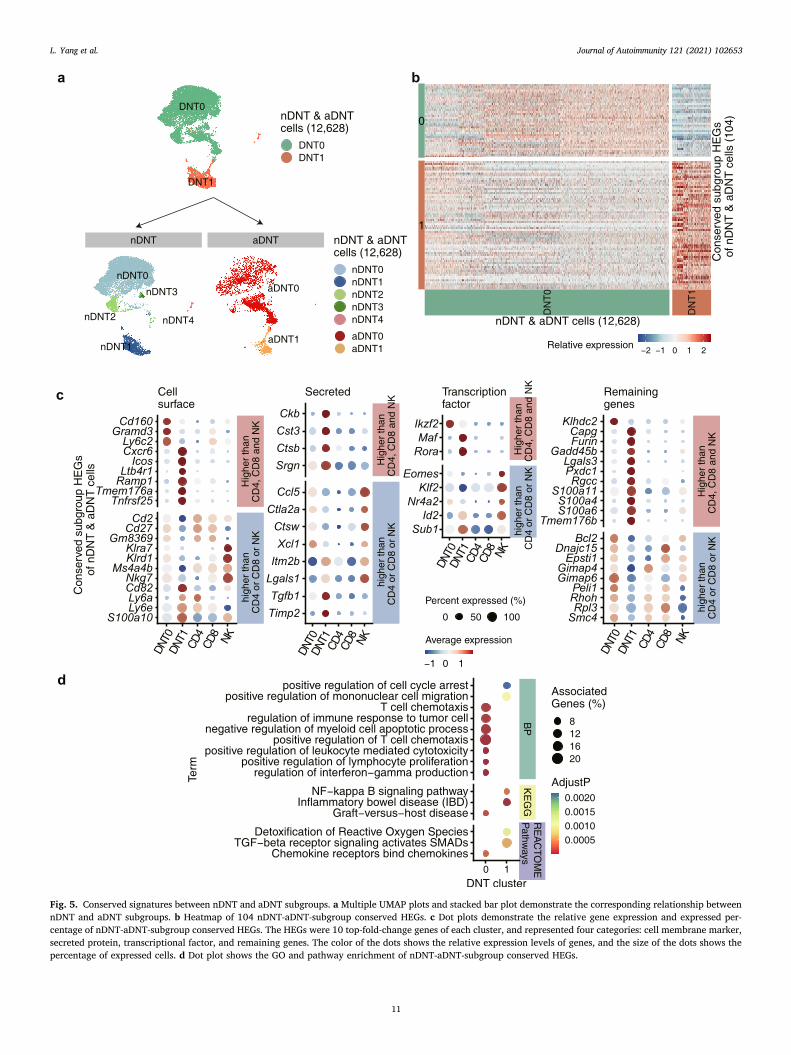
To determine the correspondence between nDNT and aDNT cells, we applied the Seurat comparative analysis on DNT replications, obtained two clusters which we named as DNT0 and DNT1 (Fig. 5a top panel). We then projected the cell identities of nDNT and aDNT subgroups into the UMAP plot of all DNT cells (Fig. 5a top panel) and obtained the UMAP plot with the clustering information from five nDNT and two aDNT subgroups (Fig. 5a bottom panel). The projection results indicated that nDNT0, nDNT2, nDNT3 cells correspond with aDNT0 cells, and nDNT1 cells correspond with aDNT1 cells.
Then we identified 104 activation conserved subgroup HEGs (Fig. 5b and Table S12) and 41.3% (43 genes) activation conserved subgroup HEGs had higher expression level than CD4+ T, CD8+ T and NK cells (Fig. S13 and Table S13).
As the biggest cluster 10,899 cells (86.3%) (Fig. 5b and Table S12), DNT0 cells conservatively and specifically express 38 genes (Fig. 5c and Table S12), including cell membrane genes: Cd160, Klrd1, Ly6c2, Ms4a4b and Nkg7, secreted protein genes: Ccl5 and Xcl1, and tran-scriptional factors: Klf2 and Ikzf2. GO and pathway enrichment analysis (Fig. 5d and Table S14) showed that DNT0 activation conserved sub-group HEGs were enriched in positive regulation of leukocyte mediated cytotoxicity and regulation of interferon-gamma production, which suggests that DNT0 cells were conserved in mediating cytotoxic.
DNT1 accounted for 13.7% (1729 cells) (Fig. 5b and Table S12) of DNT cells and had 66 activation conserved subgroup markers (Fig. 5c and Table S12), including cell membrane genes: Cxcr6 and Icos, secreted protein genes: Ctsb and Srgn, and transcriptional factors: Id2, Rora, Sub1 and Maf. DNT1 activation conserved subgroup markers were enriched in inflammatory bowel disease (IBD) and NF-kappa B signaling pathway. Cxcr6, as a chemokine receptor, is reported to recruit the proin-flammatory IL-17A producing T cells into atherosclerotic aortas [54]. These data indicated the proinflammatory function of DNT1 cells.
Overall, the conserved signatures between nDNT and aDNT sub-groups demonstrate that, DNT0 is conserved in mediating cytotoxicity and DNT1 is conserved in proinflammatory function.
3.6. Transcriptome changes during activation of nDNT
To investigate the transcriptome changes during activation, we compared nDNT with aDNT subgroups, and identified 570 upregulated genes (Fig. 6a top-left venn plot and Table S15) and 235 downregulated genes (Fig. 6b).
During activation, the expression levels of 234 genes increased in both DNT0 and DNT1 subgroups (Fig. 6a top-left venn plot), including cell membrane genes such as Il2ra, Ly6a and Tnfrsf9; secreted protein genes such as Ccl3, Ccl4 and Gzmb, and transcriptional factors such as Irf4 and Irf8 (Fig. 6c). GO and pathway enrichment analysis of those 570 genes showed that, both DNT0 and DNT1 upregulated genes were mainly enriched in oxidative phosphorylation and ribosome, the genes only upregulated in DNT0 cells were mainly enriched in DNA replication and RNA binding, and the genes only upregulated in DNT1 cells were mainly enriched in IBD and regulation of lymphocyte apoptotic process
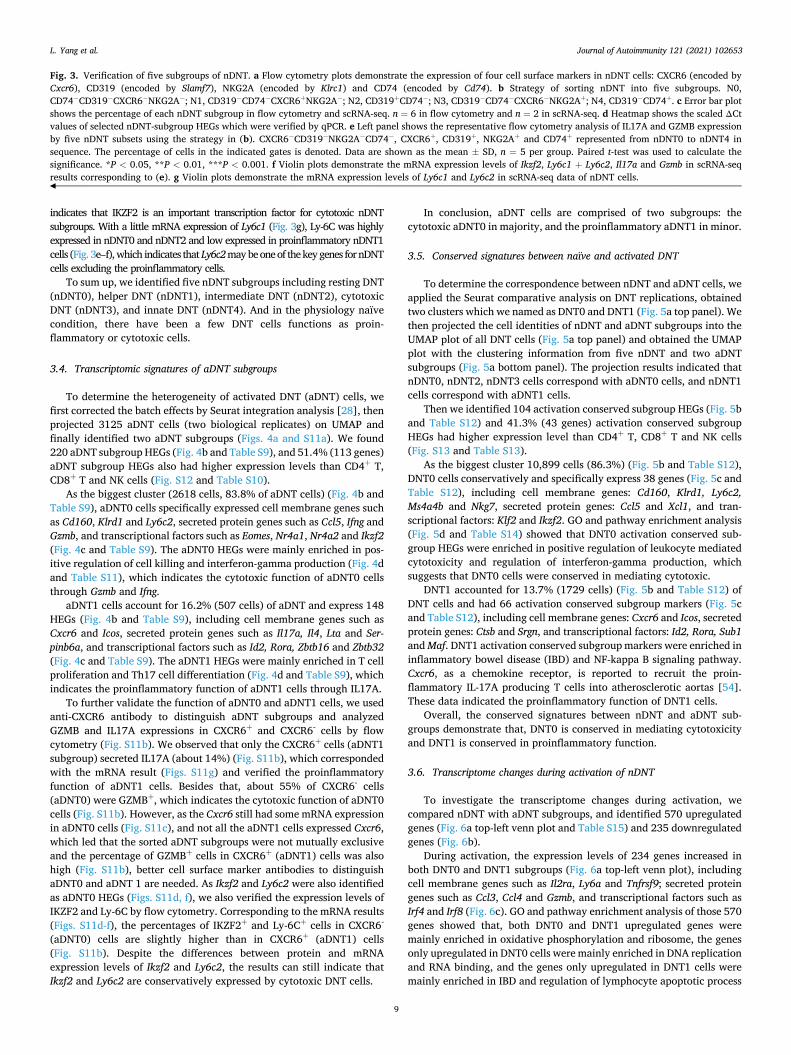
Fig. 3. Verification of five subgroups of nDNT. a Flow cytometry plots demonstrate the expression of four cell surface markers in nDNT cells: CXCR6 (encoded by Cxcr6), CD319 (encoded by Slamf7), NKG2A (encoded by Klrc1) and CD74 (encoded by Cd74). b Strategy of sorting nDNT into five subgroups. N0, CD74− CD319− CXCR6− NKG2A− ; N1, CD319− CD74− CXCR6+NKG2A− ; N2, CD319+CD74− ; N3, CD319− CD74− CXCR6− NKG2A+; N4, CD319− CD74+. c Error bar plot shows the percentage of each nDNT subgroup in flow cytometry and scRNA-seq. n = 6 in flow cytometry and n = 2 in scRNA-seq. d Heatmap shows the scaled ΔCt values of selected nDNT-subgroup HEGs which were verified by qPCR. e Left panel shows the representative flow cytometry analysis of IL17A and GZMB expression by five nDNT subsets using the strategy in (b). CXCR6− CD319− NKG2A− CD74− , CXCR6+, CD319+, NKG2A+ and CD74+ represented from nDNT0 to nDNT4 in sequence. The percentage of cells in the indicated gates is denoted. Data are shown as the mean ± SD, n = 5 per group. Paired t-test was used to calculate the significance. *P < 0.05, **P < 0.01, ***P < 0.001. f Violin plots demonstrate the mRNA expression levels of Ikzf2, Ly6c1 + Ly6c2, Il17a and Gzmb in scRNA-seq results corresponding to (e). g Violin plots demonstrate the mRNA expression levels of Ly6c1 and Ly6c2 in scRNA-seq data of nDNT cells.
L. Yang et al.
Journal of Autoimmunity 121 (2021) 102653
10
Fig. 4. Activated DNT have two subgroups. a UMAP plot of 3125 aDNT cells that were segregated into two clusters. b Heatmap of 220 aDNT-subgroup HEGs that clearly clustered each aDNT subgroup (max_pval < 0.05, minimump_p_val < 0.05 and avg_logFC > 0.25). c Dot plots demonstrate the relative gene expression and expressed percentage of aDNT-subgroup HEGs. The HEGs were 10 top-fold-change genes of each subgroup, and represented four categories: cell membrane marker, secreted protein, transcriptional factor, and remaining genes. The color of the dots shows the relative expression levels of genes, and the size of the dots showed the percentage of expressed cells. d Dot plot shows the GO and pathway enrichment of aDNT-subgroup HEGs.
L. Yang et al.
Journal of Autoimmunity 121 (2021) 102653
11
Fig. 5. Conserved signatures between nDNT and aDNT subgroups. a Multiple UMAP plots and stacked bar plot demonstrate the corresponding relationship between nDNT and aDNT subgroups. b Heatmap of 104 nDNT-aDNT-subgroup conserved HEGs. c Dot plots demonstrate the relative gene expression and expressed per-centage of nDNT-aDNT-subgroup conserved HEGs. The HEGs were 10 top-fold-change genes of each cluster, and represented four categories: cell membrane marker, secreted protein, transcriptional factor, and remaining genes. The color of the dots shows the relative expression levels of genes, and the size of the dots shows the percentage of expressed cells. d Dot plot shows the GO and pathway enrichment of nDNT-aDNT-subgroup conserved HEGs.
L. Yang et al.

Journal of Autoimmunity 121 (2021) 102653
12
Fig. 6. Transcriptome changes during activation of nDNT cells. a The scatter plot shows the up- or down-regulated genes after activation of nDNT subgroups. The venn plots in top-right and bottom-left correspond to the scatter plots, which shows the overlapping of each type of up- or down-regulated DEGs. b Dot plots demonstrate the relative gene expression and expressed percentage of DNT-subgroup upregulated genes. The genes were 10 top-fold-change genes of each cluster and represented three categories: cell membrane marker, secreted protein, and transcriptional factor genes. The color of the dots shows the relative expression levels of genes, and the size of the dots shows the percentage of expressed cells.
L. Yang et al.

Journal of Autoimmunity 121 (2021) 102653
13
(Fig. S14 and Table S16). The enrichment results indicate that during activation both DNT0 and DNT1 cells increase oxidative phosphoryla-tion, the DNT0 cells specifically increase their DNA replication, while the DNT1 cells specifically increase their proinflammatory function.
During activation, the expression levels 81 genes decrease in both DNT0 and DNT1 subgroups (Fig. 6a bottom-right venn plot). GO and pathway enrichment analysis of the 235 downregulated genes shows that, the genes decreased in both DNT0 and DNT1 subgroups were mainly enriched in Toll-like receptor and TNF signaling pathways, the genes decreased only in DNT0 subgroup were mainly enriched in T cell differentiation and T cell receptor signaling pathway, while the genes decreased only in DNT1 subgroup were mainly enriched in regulation of interferon-gamma production (Fig. S14 and Table S16). The enrichment results indicate that during activation both DNT0 and DNT1 cells decrease their TNF signaling, DNT0 cells specifically decrease their T cell differentiation, while DNT1 cells mainly decrease their regulation of IFN-γ production.
4. Discussion
To date, controversies remain on the function of DNT cells, which have been found pro-inflammatory and immunoregulatory in different disease models and patients, although they might be due to the inclusion of CD4 and CD8 double negative γδ T cells, NKT cells or MAIT in some studies. Thus, the molecular and functional signatures of DNT cells, a lineage of T lymphocytes, are still poorly understood, which has signi-ficantly hampered the progress in understanding the functions of DNT cells and their possible contributions to pathological and physical conditions.
In this study, demonstrated that nDNT cells, a type of TCRαβ+ T lymphocytes were heterogeneous and clustered into five subgroups: resting DNT (nDNT0), helper DNT (nDNT1), intermediate DNT (nDNT2), cytotoxic DNT (nDNT3), and innate DNT (nDNT4). The expression level of Sell in nDNT0 and nDNT2 cells was higher than that in nDNT1, nDNT3 and nDNT4 cells, which indicates that nDNT0 and nDNT2 cells are in a relatively naïve state, whereas nDNT1, nDNT3 and nDNT4 cells are in a partially active state. nDNT0 and nDNT2, these two subgroups, mainly maintained the cell number, participated in immune surveillance, and prepared for activation. nDNT1 cells functioned like T helper cells, which could secret cytokines, such as IL-17. nDNT3 mirrored the cytotoxic function of CD8+ T cells, and nDNT4 functioned as innate immune cells. Therefore, nDNT cells play critical roles in the immune system, and the functions of five nDNT subgroups span a wide spectrum from innate to adaptive immune responses.
Some studies have reported that DNT cells participate in systemic inflammation and tissue damage under autoimmune or inflammatory conditions. The authors believe that IL-17-producing DNT cells are pathogenic in systemic lupus erythematosus (SLE) [18–20] and primary Sjogren’s syndrome (pSS) [23]. Although the DNT cells in these studies might be contaminated with IL-17-producing CD4− CD8− NKT cells, according to our study, nDNT1 cells, which mirror the CD4+ T helpers, specifically highly express Il17a. In addition, the expression level of Il17a dramatically increases in aDNT1 cells, suggesting that in SLE or pSS patients, compared with other DNT subgroups, nDNT1 cells could be selectively activated and accumulated, which might contribute to dis-ease development.
Many studies support the notion that DNT cells are essential for maintaining immune system homeostasis [55,56]. These DNT cells highly express cytotoxic genes, like CD8+ T cells and NK cells. In our study, nDNT3 cells shared many HEGs with aDNT0 cells, and the expression levels of cytotoxic genes, such as Gzmb, increased in aDNT0 cells. Therefore, high expression of Fasl, Gzmb, Ifng, Klrd1, Klrc1 and Klrk1 in nDNT or aDNT subgroups might serve regulatory purposes in DNT cells.
Based on these findings, we suggest that in autoimmune diseases, helper DNT could produce proinflammatory cytokine IL-17 and might
contribute to the development and progression of autoimmune diseases. On the contrary, cytotoxic DNT might exert regulatory function to control excessive inflammation and re-balance the immune system in autoimmune diseases.
IL-7 is reported to diminish the suppressive activity of DNT cells toward allogeneic CD4+ effector T cells [57]. Based on our findings, nDNT1 cells specifically highly expressed Il7r, which indicated that IL-7 stimulation could selectively amplify the function of T helpers instead of cytotoxic T cells and dampen the suppressive function of DNT cells. Furthermore, some groups used the expanded DNT cells from healthy donors as novel immunotherapy agents to treat acute myeloid leukemia [58], and these therapies depended on the high expression level of NKG2D (encoded by KLRK1) and DNAM-1 (encoded by CD226). In our study, nDNT3 cells specifically highly expressed Klrk1 (encoding NKG2D), which suggests that nDNT3 cells instead of total DNT cells have the potential to be used to treat related diseases. Therefore, to prevent the possible induction of autoimmunity by IL-17, eliminating nDNT1 and aDNT1 cells before cell therapy is recommended.
Studies have also suggested that DNT cells contribute to immune surveillance against pathogens, including Francisella tularensis [25], Leishmania major [26] and influenza virus [27]. nDNT4 cells specifically highly expressed phagosome related genes [50], which indicates that nDNT4 cells are important for innate immunity and immune surveil-lance against pathogens. In our current study, we used anti-CD3/CD28-antibodies to stimulate nDNT cells and obtained mainly two subgroups of aDNT cells. We could not enrich for the activated phagocytic DNT population in this experiment. We inferred that anti-CD3/CD28 stimulation may not favor expansion of innate-like nDNT4 cells; therefore, further understanding of the functionality of these different naïve DNT subgroups and the stimulated plasticity is required.
Currently, there are no known phenotypic markers or transcription signatures, which readily allow us to better discriminate and understand the DNT cells. In this study, we found both Ly6c2 and Ikzf2 were highly expressed by nDNT cells. After activation, in aDNT cells, especially the cytotoxic DNT subgroup, Ikzf2 had significantly higher mRNA expres-sion levels, which suggests that Ikzf2 can be a phenotypic transcription factor of both naïve and activated cytotoxic regulatory DNT cells. The transcription factor IKZF2 is expressed by T cells undergoing central and peripheral tolerance [59]. Beyond its role in regulating IL-2 production in regulatory T (Treg) cells, studies have revealed that IKZF2 is also required for the stability of a suppressive phenotype in Foxp3+ Treg populations [60]. As a unique immune-regulatory T cell population, what is the intrinsic role of Ikzf2 in the development and function of DNT cells needs further study. Although the mRNA expression level of Ly6c2 was downregulated in aDNT cells and became lower than that in CD4+
T, CD8+ T and NK cells, Ly6c2 was still conservatively expressed in both cytotoxic naïve and activated DNT subsets, which indicates that Ly6c2 is an important gene for naïve and activated DNT cells, especially the cytotoxic DNT subsets. Ly-6C is reported to recruit macrophages in murine liver fibrosis [61]. Thus, we need further studies about the function of Ly6c2 in cytotoxic DNT cells.
There are limitations in current study. First, The DNT cells we studied were defined as CD3+NK1.1− TCRβ+CD4− CD8− αGalCer- CD1d− LPC-CD1d− , where the γδT cells had been removed. αGalCer- CD1d− excluded the type I NKT cells, LPC-CD1d− excluded the majority of type II NKT cells [62], and NK1.1- excluded the majority of non-CD1d restricted NKT cells. Although we have excluded almost all the NKT cells, the DNT cells might still contain some unknown NKT cells. Second, based on the expression of the co-receptors CD4 and CD8, mouse MAIT cells are categorized into four subsets (CD4+CD8− , CD4− CD8− , CD8α+CD8β− and CD8α+CD8β+) [47,63]. When sorting DNT cells, we had removed the CD4+ and CD8+ MAIT cells (about 62% of total MAIT cells [64]). However, the DNT cells we studied still contained a small number of CD4− CD8− MAIT cells, which might contaminate the anal-ysis. Further studies on the DNT1 cells after the removal of CD4− CD8−
L. Yang et al.

Journal of Autoimmunity 121 (2021) 102653
14
MAIT cells are needed. Third, limited by the extremely low DNT cell number in naïve mice, the functional assays of DNT cells in this study were absent. Further studies using different mouse disease models, can give us a better understanding of DNT subgroups and their possible contributions to pathological and physical conditions.
In summary, after removing CD4 and CD8 double negative γδ T cells, NKT cells and majority MAIT, using single-cell RNA-seq, we revealed subgroups of naïve and active DNT in mice, which express unique sets of genes and have distinctive functions. This study has several major findings. First, we delineated the heterogeneity of nDNT and aDNT cells in mice, defined five nDNT subgroups (resting nDNT, helper nDNT, in-termediate nDNT, cytotoxic nDNT and innate nDNT) and two aDNT subgroups (cytotoxic aDNT and proinflammatory aDNT), and provided unique transcriptional and spatial signatures which give us insights into their possible functions. Second, Ikzf2 is an important transcriptional factor for both naive and activated cytotoxic DNT cells, compared with CD4+ T, CD8+ T and NK cells. Finally, we provided the transcriptome changes during activation of nDNT to aDNT subgroups.
The clear characterization of functional DNT subsets into helper DNT, cytotoxic DNT and innate DNT will help to better understand the intrinsic roles of different functional DNT subsets in the development and progression of autoimmune diseases and transplant rejection, and thereby may facilitate diagnosis and therapy. The analysis herein should become the “backdrop” of similar studies in the murine models of autoimmunity, potentially highlighting the importance of DNT cells in immune surveillance, defense, and homeostasis.
Declarations
Ethics approval and consent to participate. All mice were maintained in a pathogen-free, temperature-controlled environment at the Beijing Friendship Hospital, and mouse handling conformed to the re-quirements of the Institutional Animal Care and Use Guidelines of Capital Medical University.
Consent for publication
Not applicable.
Availability of data and materials
The data reported in this work have been uploaded in the Gene Expression Omnibus (GEO) database under accession number GSE129030. https://www.ncbi.nlm.nih.gov/geo/query/acc.cgi? acc=GSE129030
Funding
Grants from the National Natural Science Foundation of China (No. 81570510, 81870399 and 82001694) supported this work.
Authors’ contributions
All listed authors participated meaningfully in the study and that they have seen and approved the submission of this manuscript. L.Y., Y. Z., D.T. and S.W. participated in performing the research, analyzing the data, and initiating the original draft of the article. J.G., H.J., C.Z., W.S., and G.S. participated in performing the research. D.Z., Y.Z. and Z.Z. established the hypotheses, supervised the studies, analyzed the data, and co-wrote the manuscript. MEG participated in the hypothesis and in the review and editing of the manuscript.
Declaration of competing interest
All authors declare no conflict of interest.
Appendix A. Supplementary data
Supplementary data to this article can be found online at https://doi. org/10.1016/j.jaut.2021.102653.
References
[1] P. Achita, D. Dervovic, D. Ly, J.B. Lee, T. Haug, B. Joe, et al., Infusion of ex-vivo expanded human TCR-alphabeta(+) double-negative regulatory T cells delays onset of xenogeneic graft-versus-host disease, Clin. Exp. Immunol. 193 (2018) 386–399.
[2] F.R. D’Alessio, J.T. Kurzhagen, H. Rabb, Reparative T lymphocytes in organ injury, J. Clin. Invest. 129 (2019) 2608–2618.
[3] D. Tian, L. Yang, S. Wang, Y. Zhu, W. Shi, C. Zhang, et al., Double negative T cells mediate Lag3-dependent antigen-specific protection in allergic asthma, Nat. Commun. 10 (2019) 4246.
[4] K. Fischer, S. Voelkl, J. Heymann, G.K. Przybylski, K. Mondal, M. Laumer, et al., Isolation and characterization of human antigen-specific TCR alpha beta+ CD4(-) CD8- double-negative regulatory T cells, Blood 105 (2005) 2828–2835.
[5] D. Zhang, W. Yang, N. Degauque, Y. Tian, A. Mikita, X.X. Zheng, New differentiation pathway for double-negative regulatory T cells that regulates the magnitude of immune responses, Blood 109 (2007) 4071–4079.
[6] W. Chen, J. Diao, S.M. Stepkowski, L. Zhang, Both infiltrating regulatory T cells and insufficient antigen presentation are involved in long-term cardiac xenograft survival, J. Immunol. 179 (2007) 1542–1548.
[7] D. Zhang, W. Zhang, T.W. Ng, Y. Wang, Q. Liu, V. Gorantla, et al., Adoptive cell therapy using antigen-specific CD4(-)CD8(-)T regulatory cells to prevent autoimmune diabetes and promote islet allograft survival in NOD mice, Diabetologia 54 (2011) 2082–2092.
[8] M.E. Maccari, S. Fuchs, P. Kury, G. Andrieux, S. Volkl, B. Bengsch, et al., A distinct CD38+CD45RA+ population of CD4+, CD8+, and double-negative T cells is controlled by FAS, J. Exp. Med. (2021) 218.
[9] Z.X. Zhang, Y. Ma, H. Wang, J. Arp, J. Jiang, X. Huang, et al., Double-negative T cells, activated by xenoantigen, lyse autologous B and T cells using a perforin/ granzyme-dependent, Fas-Fas ligand-independent pathway, J. Immunol. 177 (2006) 6920–6929.
[10] W. Li, Y. Tian, Z. Li, J. Gao, W. Shi, J. Zhu, et al., Ex vivo converted double negative T cells suppress activated B cells, Int. Immunopharm. 20 (2014) 164–169.
[11] J.F. Gao, M.S.F. McIntyre, S.C. Juvet, J. Diao, X.J. Li, R.B. Vanama, et al., Regulation of antigen-expressing dendritic cells by double negative regulatory T cells, Eur. J. Immunol. 41 (2011) 2699–2708.
[12] Y. Su, X. Huang, S. Wang, W.P. Min, Z. Yin, A.M. Jevnikar, et al., Double negative Treg cells promote nonmyeloablative bone marrow chimerism by inducing T-cell clonal deletion and suppressing NK cell function, Eur. J. Immunol. 42 (2012) 1216–1225.
[13] Z.X. Zhang, L. Yang, K.J. Young, B. DuTemple, L. Zhang, Identification of a previously unknown antigen-specific regulatory T cell and its mechanism of suppression, Nat. Med. 6 (2000) 782–789.
[14] K.J. Young, B. DuTemple, M.J. Phillips, L. Zhang, Inhibition of graft-versus-host disease by double-negative regulatory T cells, J. Immunol. 171 (2003) 134–141.
[15] A.J. Ligocki, J.Y. Niederkorn, Advances on non-CD4 + Foxp3+ T regulatory cells: CD8+, type 1, and double negative T regulatory cells in organ transplantation, Transplantation 99 (2015) 1553–1559.
[16] V.R. Chowdhary, A. Krogman, A.Y. Tilahun, M.P. Alexander, C.S. David, G. Rajagopalan, Concomitant disruption of CD4 and CD8 genes facilitates the development of double negative alphabeta TCR(+) peripheral T cells that respond robustly to staphylococcal superantigen, J. Immunol. 198 (2017) 4413–4424.
[17] X. Zhao, G. Sun, X. Sun, D. Tian, K. Liu, T. Liu, et al., A novel differentiation pathway from CD4(+) T cells to CD4(-) T cells for maintaining immune system homeostasis, Cell Death Dis. 7 (2016), e2193.
[18] J.C. Crispin, M. Oukka, G. Bayliss, R.A. Cohen, C.A. Van Beek, I.E. Stillman, et al., Expanded double negative T cells in patients with systemic lupus erythematosus produce IL-17 and infiltrate the kidneys, J. Immunol. 181 (2008) 8761–8766.
[19] J.C. Crispin, G.C. Tsokos, Human TCR-alpha beta+ CD4- CD8- T cells can derive from CD8+ T cells and display an inflammatory effector phenotype, J. Immunol. 183 (2009) 4675–4681.
[20] A. Doreau, A. Belot, J. Bastid, B. Riche, M.C. Trescol-Biemont, B. Ranchin, et al., Interleukin 17 acts in synergy with B cell-activating factor to influence B cell biology and the pathophysiology of systemic lupus erythematosus, Nat. Immunol. 10 (2009) 778–785.
[21] H. Li, I.E. Adamopoulos, V.R. Moulton, I.E. Stillman, Z. Herbert, J.J. Moon, et al., Systemic lupus erythematosus favors the generation of IL-17 producing double negative T cells, Nat. Commun. 11 (2020) 2859.
[22] C. Rafael-Vidal, N. Perez, I. Altabas, S. Garcia, J.M. Pego-Reigosa, Blocking IL-17: a promising strategy in the treatment of systemic rheumatic diseases, Int. J. Mol. Sci. (2020) 21.
[23] A. Alunno, F. Carubbi, O. Bistoni, S. Caterbi, E. Bartoloni, B. Bigerna, et al., CD4(-) CD8(-) T-cells in primary Sjogren’s syndrome: association with the extent of glandular involvement, J. Autoimmun. 51 (2014) 38–43.
[24] A. Alunno, O. Bistoni, E. Bartoloni, S. Caterbi, B. Bigerna, A. Tabarrini, et al., IL-17- producing CD4-CD8- T cells are expanded in the peripheral blood, infiltrate salivary glands and are resistant to corticosteroids in patients with primary Sjogren’s syndrome, Ann. Rheum. Dis. 72 (2013) 286–292.
L. Yang et al.

Journal of Autoimmunity 121 (2021) 102653
15
[25] S.C. Cowley, A.I. Meierovics, J.A. Frelinger, Y. Iwakura, K.L. Elkins, Lung CD4- CD8- double-negative T cells are prominent producers of IL-17A and IFN-gamma during primary respiratory murine infection with Francisella tularensis live vaccine strain, J. Immunol. 184 (2010) 5791–5801.
[26] Z. Mou, D. Liu, I. Okwor, P. Jia, K. Orihara, J.E. Uzonna, MHC class II restricted innate-like double negative T cells contribute to optimal primary and secondary immunity to Leishmania major, PLoS Pathog. 10 (2014), e1004396.
[27] K. Neyt, C.H. GeurtsvanKessel, B.N. Lambrecht, Double-negative T resident memory cells of the lung react to influenza virus infection via CD11c(hi) dendritic cells, Mucosal Immunol. 9 (2016) 999–1014.
[28] A. Butler, P. Hoffman, P. Smibert, E. Papalexi, R. Satija, Integrating single-cell transcriptomic data across different conditions, technologies, and species, Nat. Biotechnol. 36 (2018) 411–420.
[29] R. Satija, J.A. Farrell, D. Gennert, A.F. Schier, A. Regev, Spatial reconstruction of single-cell gene expression data, Nat. Biotechnol. 33 (2015) 495–502.
[30] C. Hafemeister, R. Satija, Normalization and variance stabilization of single-cell RNA-seq data using regularized negative binomial regression, Genome Biol. 20 (2019) 296.
[31] I. Korsunsky, N. Millard, J. Fan, K. Slowikowski, F. Zhang, K. Wei, et al., Fast, sensitive and accurate integration of single-cell data with Harmony, Nat. Methods 16 (2019) 1289–1296.
[32] T. Stuart, A. Butler, P. Hoffman, C. Hafemeister, E. Papalexi, W.M. Mauck 3rd, et al., Comprehensive integration of single-cell data, Cell 177 (2019) 1888–1902 e21.
[33] E.A.K. DePasquale, D.J. Schnell, P.J. Van Camp, I. Valiente-Alandi, B.C. Blaxall, H. L. Grimes, et al., DoubletDecon: deconvoluting doublets from single-cell RNA- sequencing data, Cell Rep. 29 (2019) 1718–17127 e8.
[34] E.A.K. DePasquale, D. Schnell, K. Chetal, N. Salomonis, Protocol for identification and removal of doublets with DoubletDecon, STAR Protoc 1 (2020) 100085.
[35] C.S. McGinnis, L.M. Murrow, Z. J. Gartner DoubletFinder, Doublet detection in single-cell RNA sequencing data using artificial nearest neighbors, Cell Syst 8 (2019) 329–337 e4.
[36] G. Bindea, B. Mlecnik, H. Hackl, P. Charoentong, M. Tosolini, A. Kirilovsky, et al., ClueGO: a Cytoscape plug-in to decipher functionally grouped gene ontology and pathway annotation networks, Bioinformatics 25 (2009) 1091–1093.
[37] P. Shannon, A. Markiel, O. Ozier, N.S. Baliga, J.T. Wang, D. Ramage, et al., Cytoscape: a software environment for integrated models of biomolecular interaction networks, Genome Res. 13 (2003) 2498–2504.
[38] A. Crinier, P. Milpied, B. Escaliere, C. Piperoglou, J. Galluso, A. Balsamo, et al., High-dimensional single-cell analysis identifies organ-specific signatures and conserved NK cell subsets in humans and mice, Immunity 49 (2018) 971–986 e5.
[39] E. Becht, L. McInnes, J. Healy, C.A. Dutertre, I.W.H. Kwok, L.G. Ng, et al., Dimensionality reduction for visualizing single-cell data using UMAP, Nat. Biotechnol. 37 (1) (2018) 38–44, https://doi.org/10.1038/nbt.4314.
[40] M.L. Arbones, D.C. Ord, K. Ley, H. Ratech, C. Maynard-Curry, G. Otten, et al., Lymphocyte homing and leukocyte rolling and migration are impaired in L- selectin-deficient mice, Immunity 1 (1994) 247–260.
[41] W.A. Siddiqui, A. Ahad, H. Ahsan, The mystery of BCL2 family: bcl-2 proteins and apoptosis: an update, Arch. Toxicol. 89 (2015) 289–317.
[42] B.J. Ma, C.M. Craveiro Salvado, K.P. Kane, The activating Ly49W and inhibitory Ly49G NK cell receptors display similar affinities for identical MHC class I ligands, Immunogenetics 66 (2014) 467–477.
[43] P. Hoglund, P. Brodin, Current perspectives of natural killer cell education by MHC class I molecules, Nat. Rev. Immunol. 10 (2010) 724–734.
[44] V.M. Braud, D.S. Allan, C.A. O’Callaghan, K. Soderstrom, A. D’Andrea, G.S. Ogg, et al., HLA-E binds to natural killer cell receptors CD94/NKG2A, B and C, Nature 391 (1998) 795–799.
[45] R.E. Vance, J.R. Kraft, J.D. Altman, P.E. Jensen, D.H. Raulet, Mouse CD94/NKG2A is a natural killer cell receptor for the nonclassical major histocompatibility complex (MHC) class I molecule Qa-1(b), J. Exp. Med. 188 (1998) 1841–1848.
[46] F. Legoux, D. Bellet, C. Daviaud, Y. El Morr, A. Darbois, K. Niort, et al., Microbial metabolites control the thymic development of mucosal-associated invariant T cells, Science 366 (2019) 494–499.
[47] A. Rahimpour, H.F. Koay, A. Enders, R. Clanchy, S.B. Eckle, B. Meehan, et al., Identification of phenotypically and functionally heterogeneous mouse mucosal- associated invariant T cells using MR1 tetramers, J. Exp. Med. 212 (2015) 1095–1108.
[48] E.L. Pearce, A.C. Mullen, G.A. Martins, C.M. Krawczyk, A.S. Hutchins, V.P. Zediak, et al., Control of effector CD8+ T cell function by the transcription factor Eomesodermin, Science 302 (2003) 1041–1043.
[49] M.E. Cruz-Munoz, Z. Dong, X. Shi, S. Zhang, A. Veillette, Influence of CRACC, a SLAM family receptor coupled to the adaptor EAT-2, on natural killer cell function, Nat. Immunol. 10 (2009) 297–305.
[50] L.M. Stuart, R.A. Ezekowitz, Phagocytosis and comparative innate immunity: learning on the fly, Nat. Rev. Immunol. 8 (2008) 131–141.
[51] J.C. Ryan, C. Naper, S. Hayashi, M.R. Daws, Physiologic functions of activating natural killer (NK) complex-encoded receptors on NK cells, Immunol. Rev. 181 (2001) 126–137.
[52] A. Lluis, N. Ballenberger, S. Illi, M. Schieck, M. Kabesch, T. Illig, et al., Regulation of TH17 markers early in life through maternal farm exposure, J. Allergy Clin. Immunol. 133 (2014) 864–871.
[53] I. Voskoboinik, J.C. Whisstock, J.A. Trapani, Perforin and granzymes: function, dysfunction and human pathology, Nat. Rev. Immunol. 15 (2015) 388–400.
[54] M.J. Butcher, C.I. Wu, T. Waseem, E.V. Galkina, CXCR6 regulates the recruitment of pro-inflammatory IL-17A-producing T cells into atherosclerotic aortas, Int. Immunol. 28 (2016) 255–261.
[55] E.E. Hillhouse, J.S. Delisle, S. Lesage, Immunoregulatory CD4(-)CD8(-) T cells as a potential therapeutic tool for transplantation, autoimmunity, and cancer, Front. Immunol. 4 (2013) 6.
[56] S.C. Juvet, L. Zhang, Double negative regulatory T cells in transplantation and autoimmunity: recent progress and future directions, J. Mol. Cell Biol. 4 (2012) 48–58.
[57] A. Allgauer, E. Schreiner, F. Ferrazzi, A.B. Ekici, A. Gerbitz, A. Mackensen, et al., IL-7 abrogates the immunosuppressive function of human double-negative T cells by activating akt/mTOR signaling, J. Immunol. 195 (2015) 3139–3148.
[58] J. Lee, M.D. Minden, W.C. Chen, E. Streck, B. Chen, H. Kang, et al., Allogeneic human double negative T cells as a novel immunotherapy for acute myeloid leukemia and its underlying mechanisms, Clin. Canc. Res. : Off. J. Am.Assoc. Canc. Res. 24 (2018) 370–382.
[59] E.M. Ross, D. Bourges, T.V. Hogan, P.A. Gleeson, I.R. van Driel, Helios defines T cells being driven to tolerance in the periphery and thymus, Eur. J. Immunol. 44 (2014) 2048–2058.
[60] M.D. Powell, K.A. Read, B.K. Sreekumar, K.J. Oestreich, Ikaros zinc finger transcription factors: regulators of cytokine signaling pathways and CD4(+) T helper cell differentiation, Front. Immunol. 10 (2019) 1299.
[61] P. Ramachandran, A. Pellicoro, M.A. Vernon, L. Boulter, R.L. Aucott, A. Ali, et al., Differential Ly-6C expression identifies the recruited macrophage phenotype, which orchestrates the regression of murine liver fibrosis, Proc. Natl. Acad. Sci. U. S. A. 109 (2012) E3186–E3195.
[62] D.H. Chang, H. Deng, P. Matthews, J. Krasovsky, G. Ragupathi, R. Spisek, et al., Inflammation-associated lysophospholipids as ligands for CD1d-restricted T cells in human cancer, Blood 112 (2008) 1308–1316.
[63] D.I. Godfrey, H.F. Koay, J. McCluskey, N.A. Gherardin, The biology and functional importance of MAIT cells, Nat. Immunol. 20 (2019) 1110–1128.
[64] H.F. Koay, N.A. Gherardin, A. Enders, L. Loh, L.K. Mackay, C.F. Almeida, et al., A three-stage intrathymic development pathway for the mucosal-associated invariant T cell lineage, Nat. Immunol. 17 (2016) 1300–1311.
L. Yang et al.